

Colorimetric Films Based on Polyvinyl Alcohol and Anthocyanins Extracted from Purple Tomato to Monitor the Freshness of Shrimp


Abstract
1. Introduction
2. Materials and Methods
2.1. Materials
2.2. Preparation of PVA/PTA Films
2.3. Characterization of PTA or PVA/PTA Films
2.3.1. Color and UV-Vis Spectra of PTA
2.3.2. pH-Response of PVA/PTA Films
2.3.3. Thickness of PVA/PTA Films
2.3.4. Fourier Transform Infrared (FTIR) Spectroscopy of PVA/PTA Films
2.3.5. Mechanical Properties of PVA/PTA Films
2.3.6. Moisture Content of PVA/PTA Films
2.3.7. Water Vapor Permeability of PVA/PTA Films
2.3.8. Antioxidant Activity of PVA/PTA Films
2.4. Monitoring Freshness of Shrimp
2.4.1. Packaging
2.4.2. Microbial Colony Measurement
2.4.3. pH and Total Volatile Basic Nitrogen (TVB-N) Measurement
2.5. Statistical Analysis
3. Results and Discussion
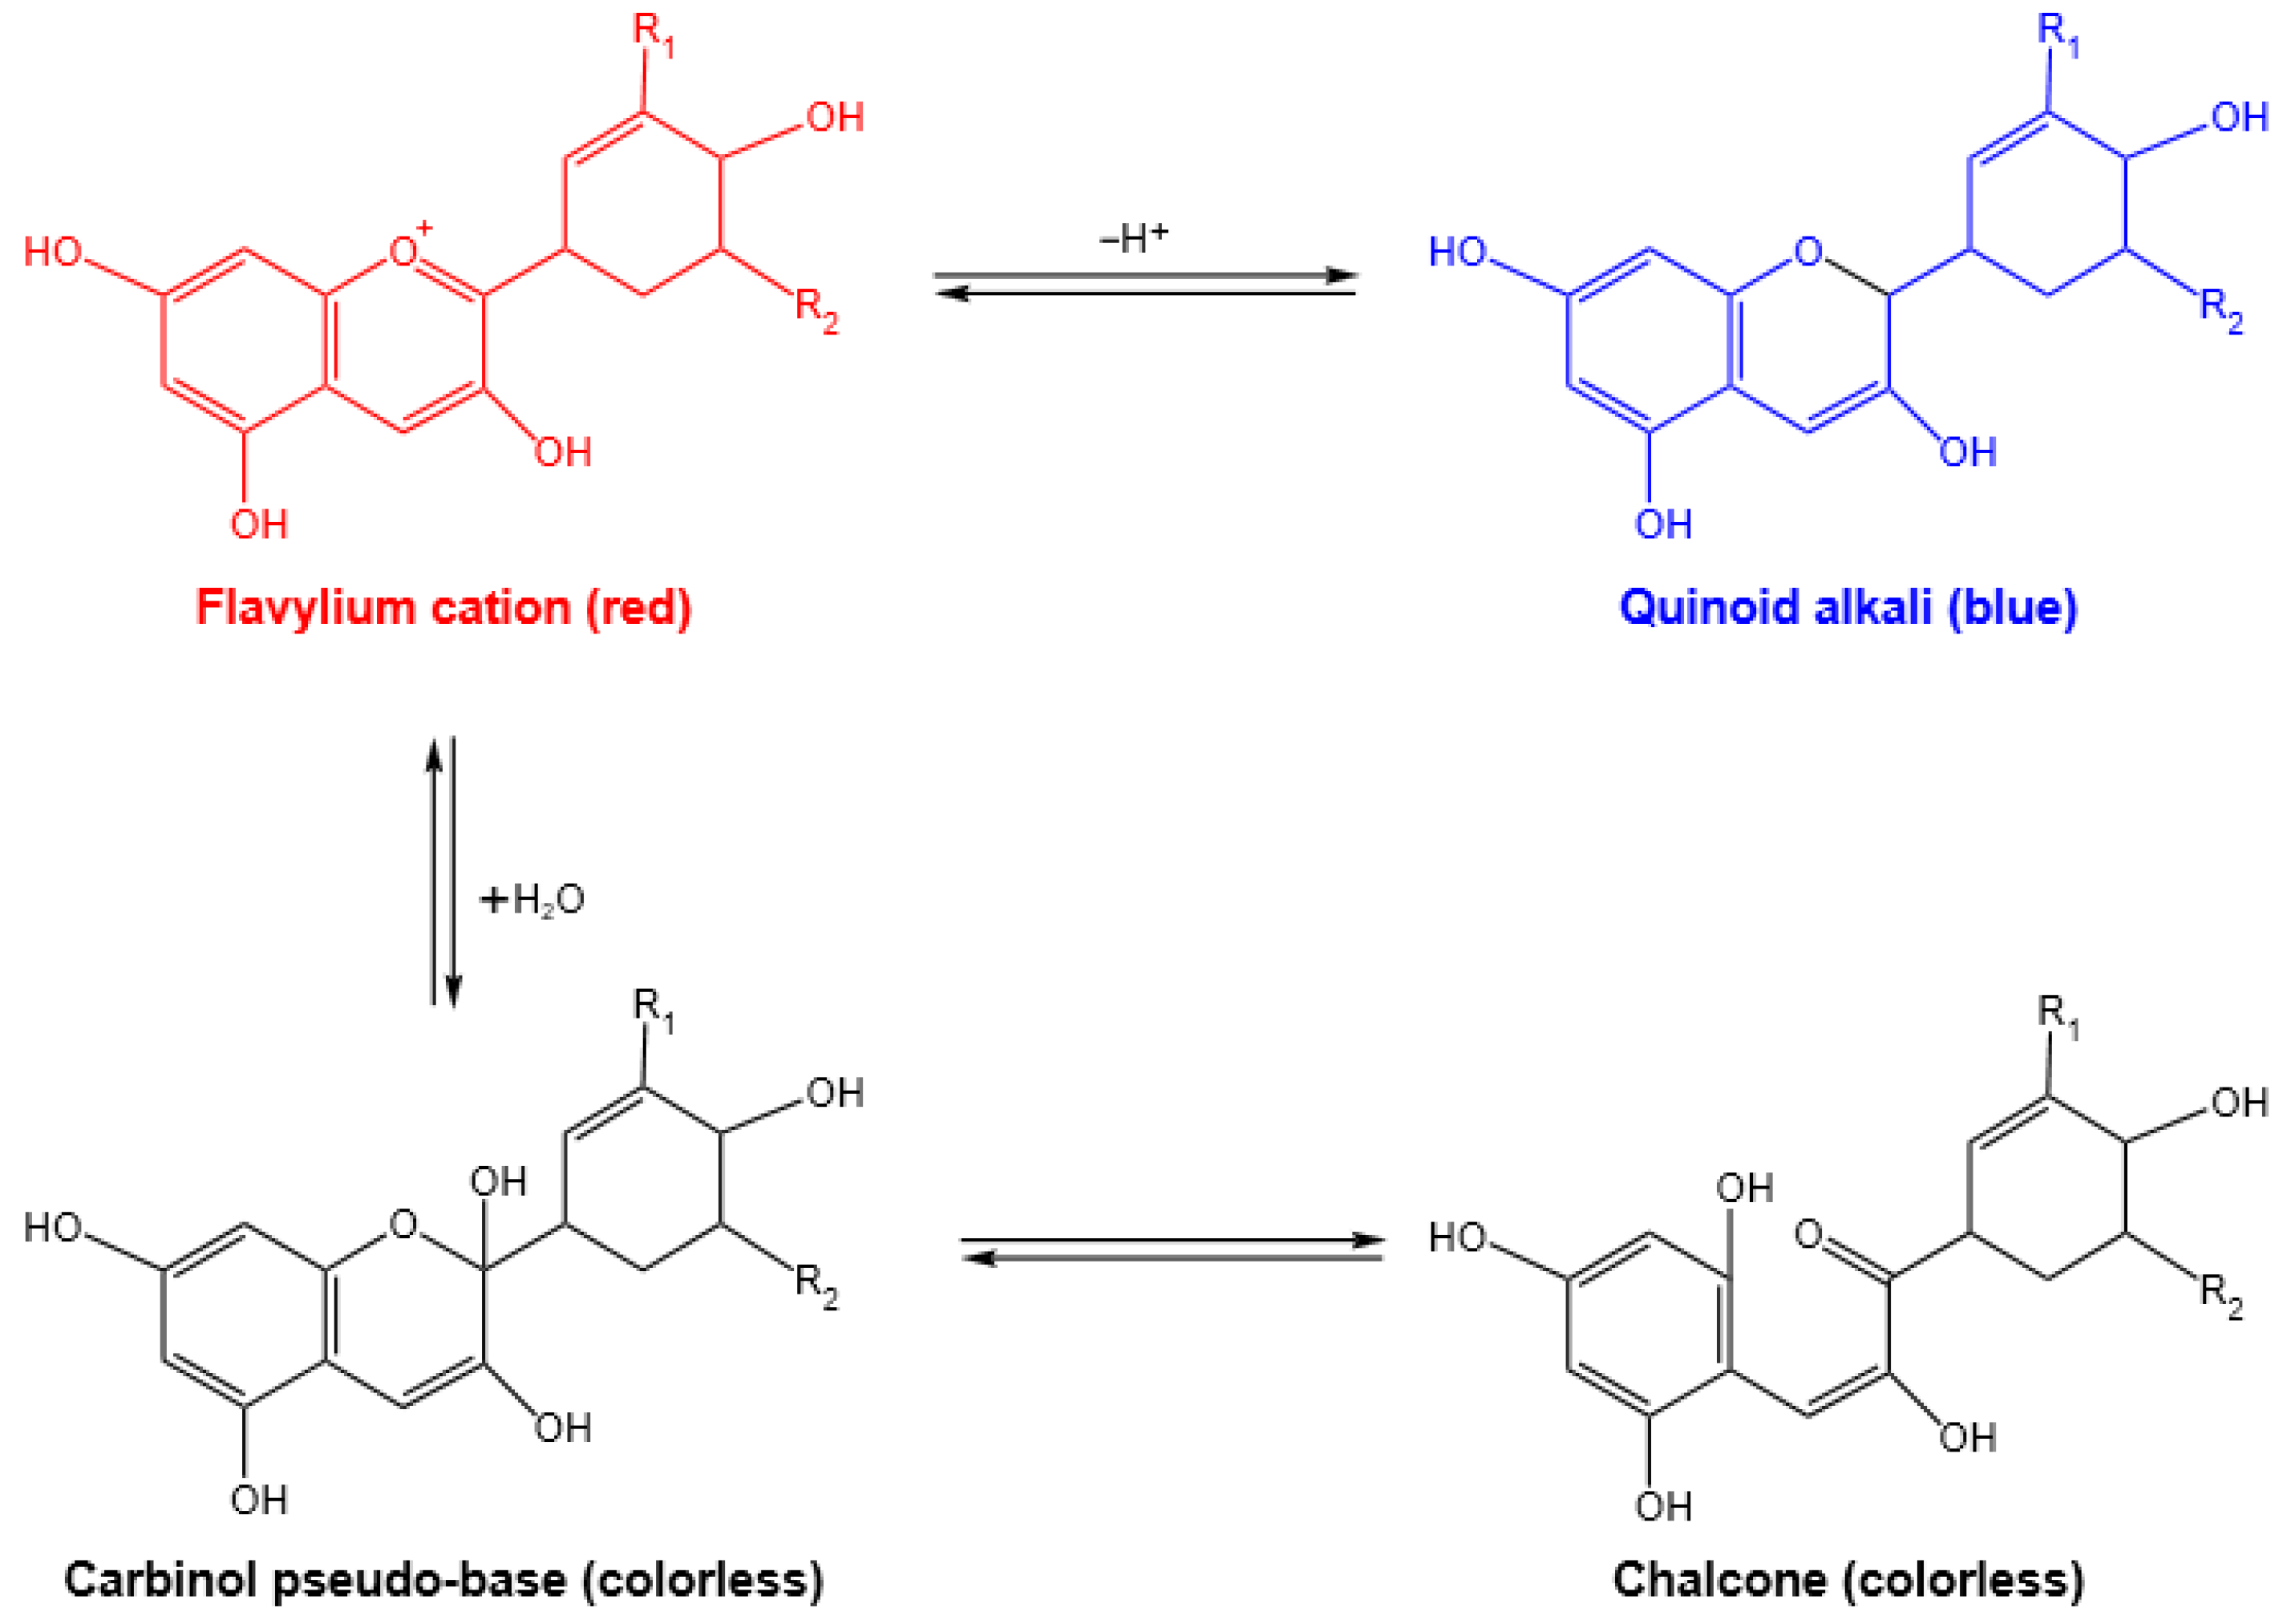
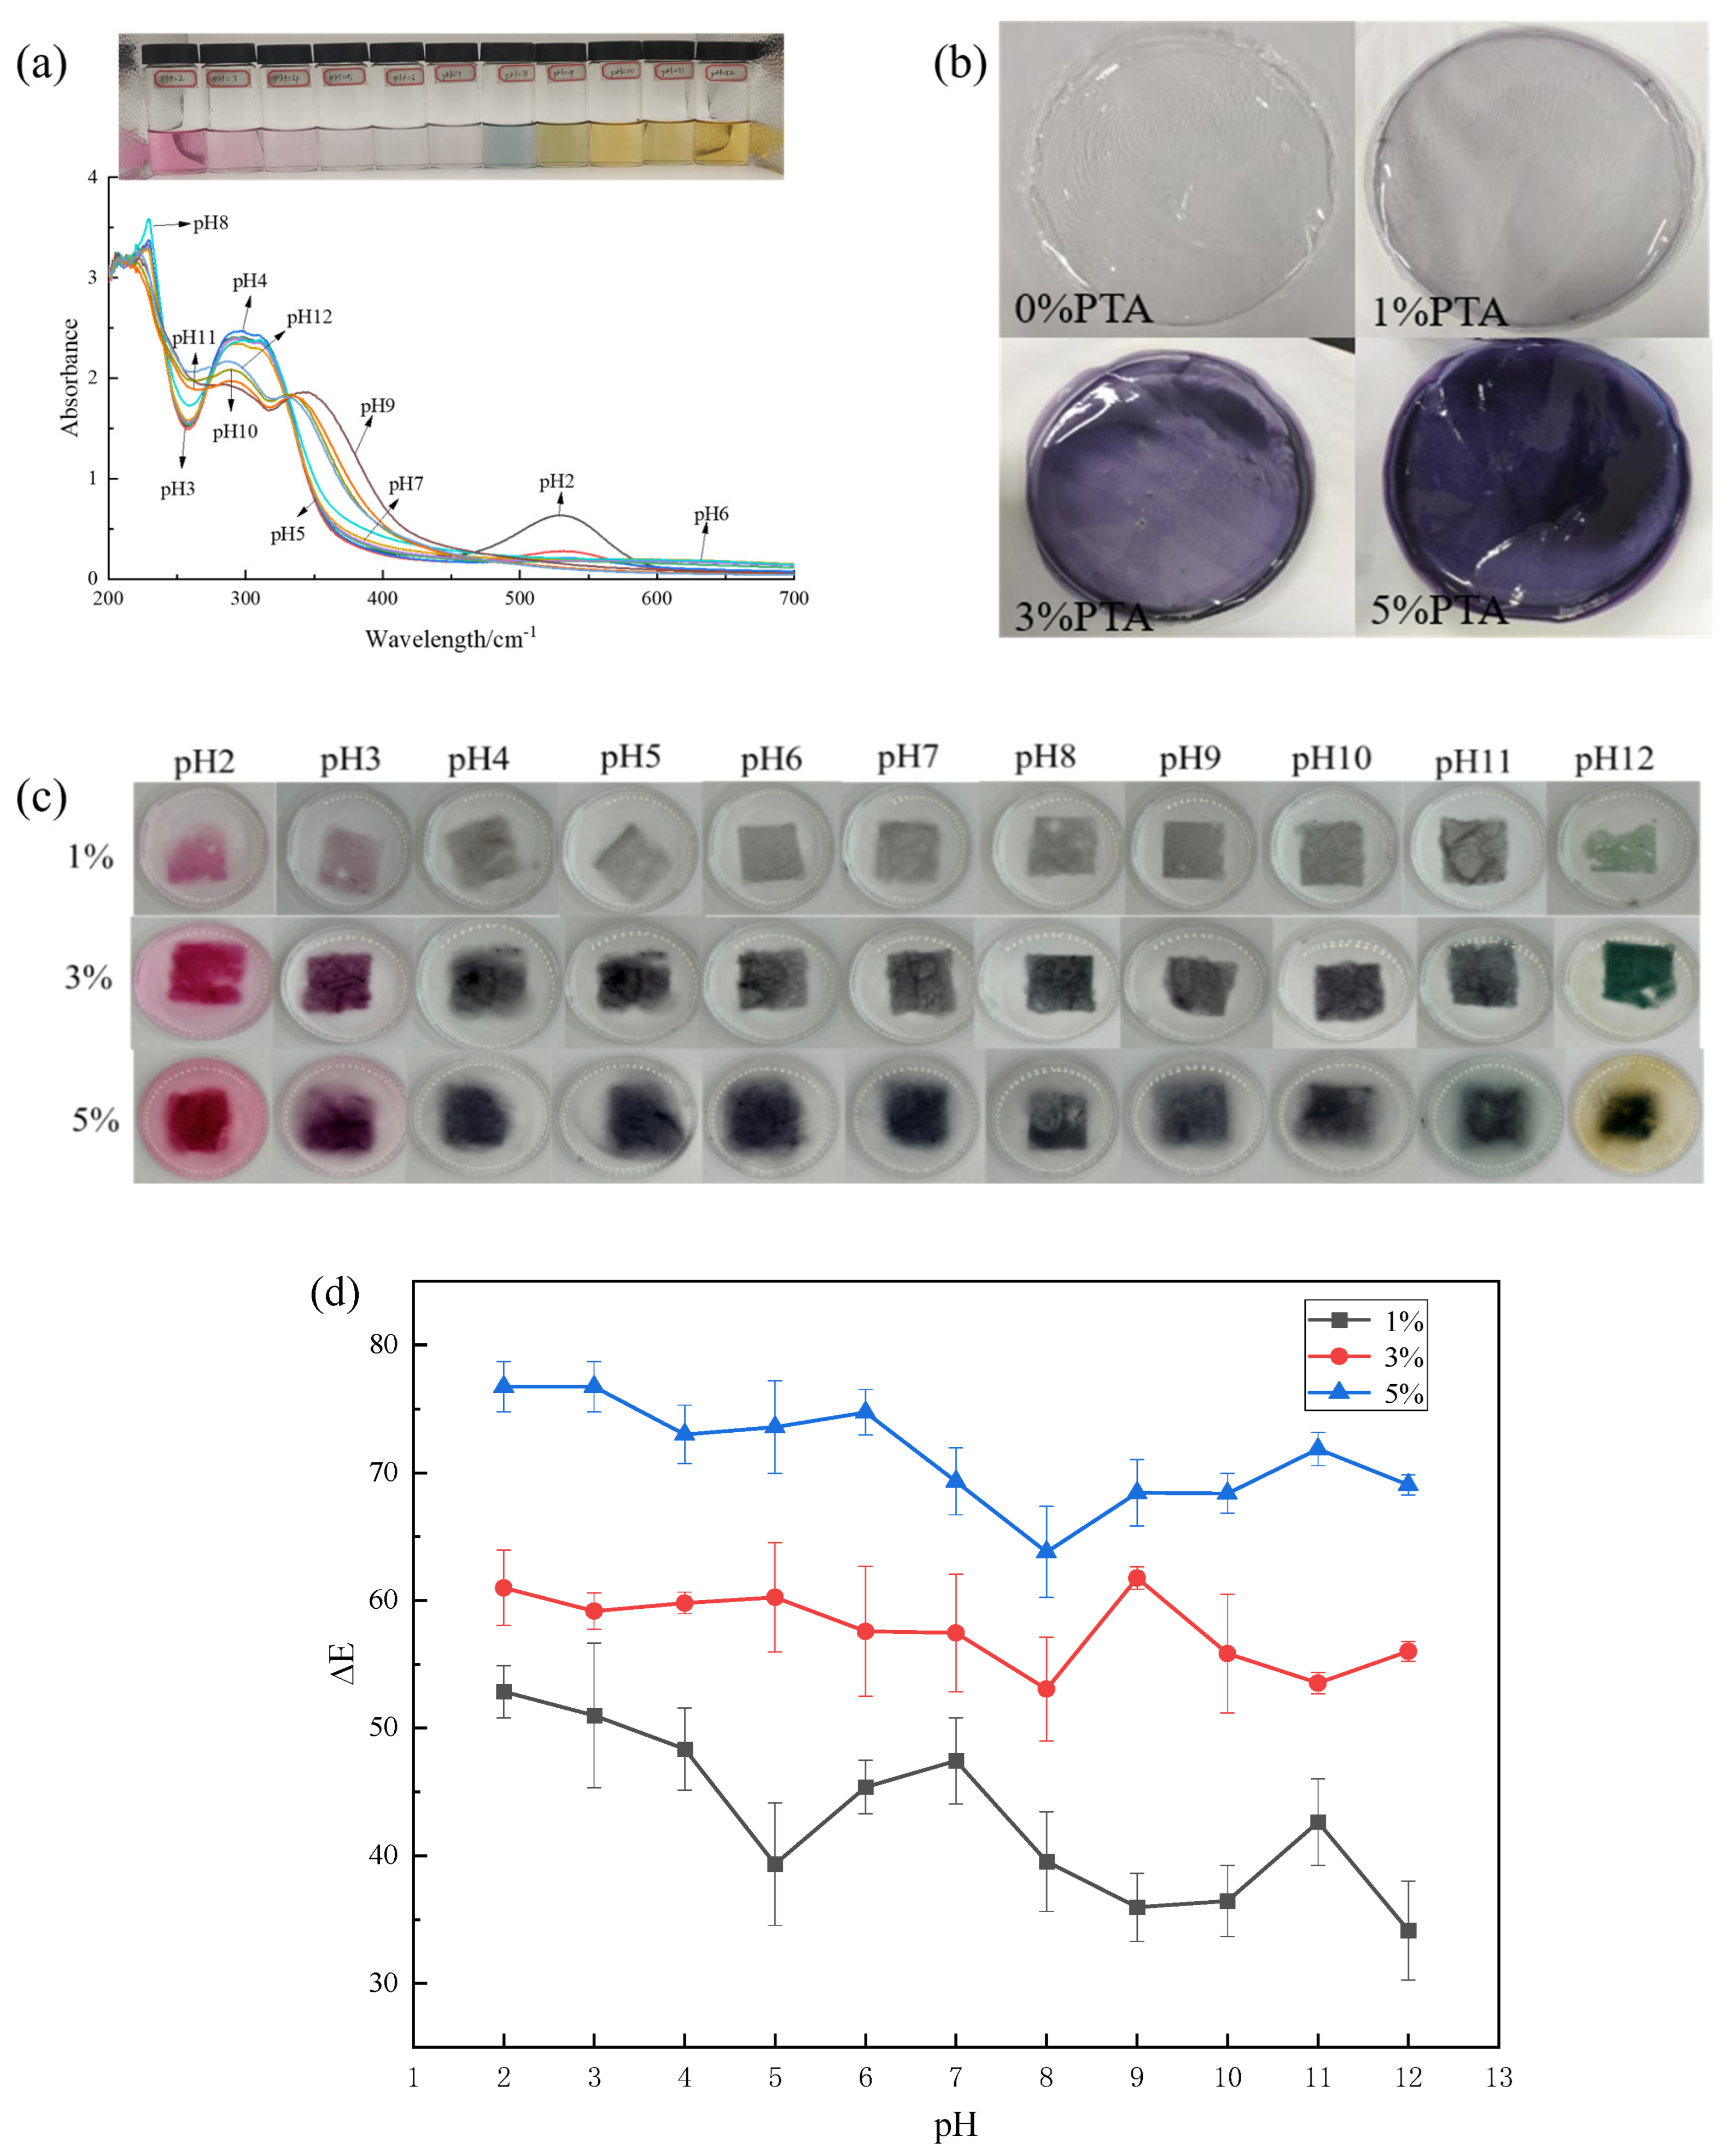
3.1. Color and UV-Vis Spectra of PTA
3.2. Original Films
3.3. pH-Response of Films
3.4. Mechanical Properties of Films
3.5. Film Thickness, Moisture Content and Water Vapor Permeability of Films
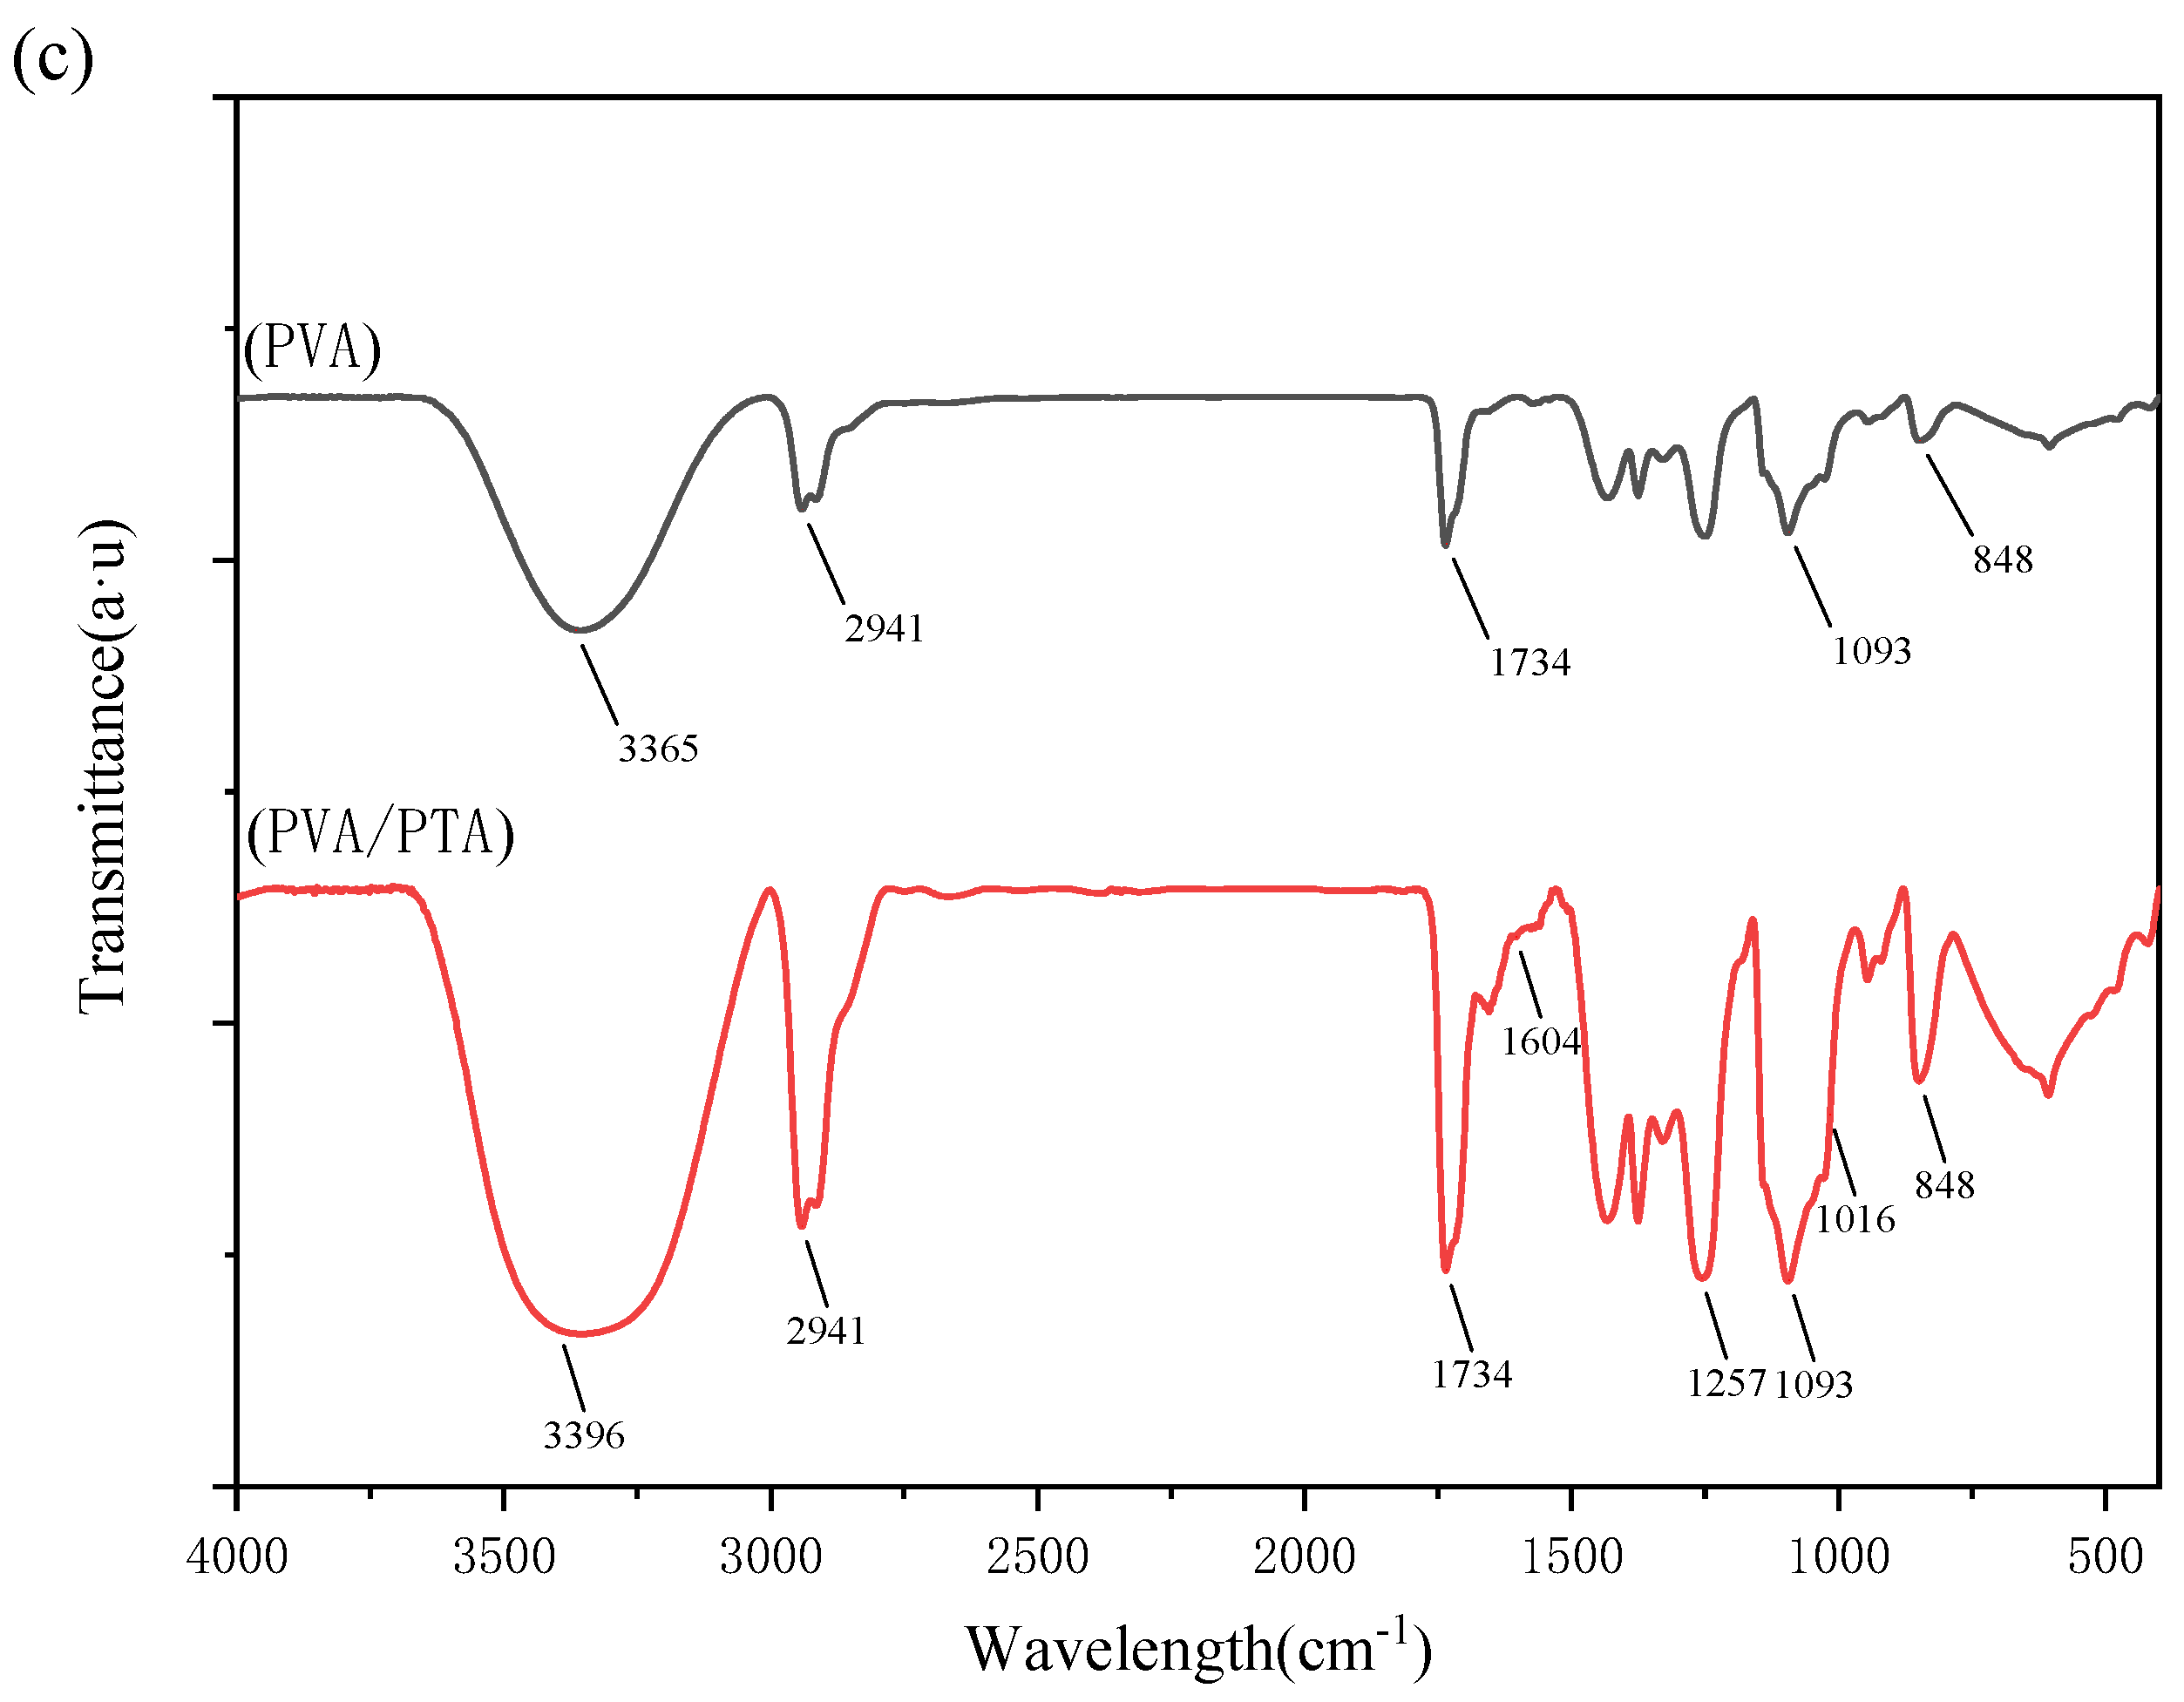
3.6. FTIR Analysis of Films
3.7. Antioxidant Activity of Films
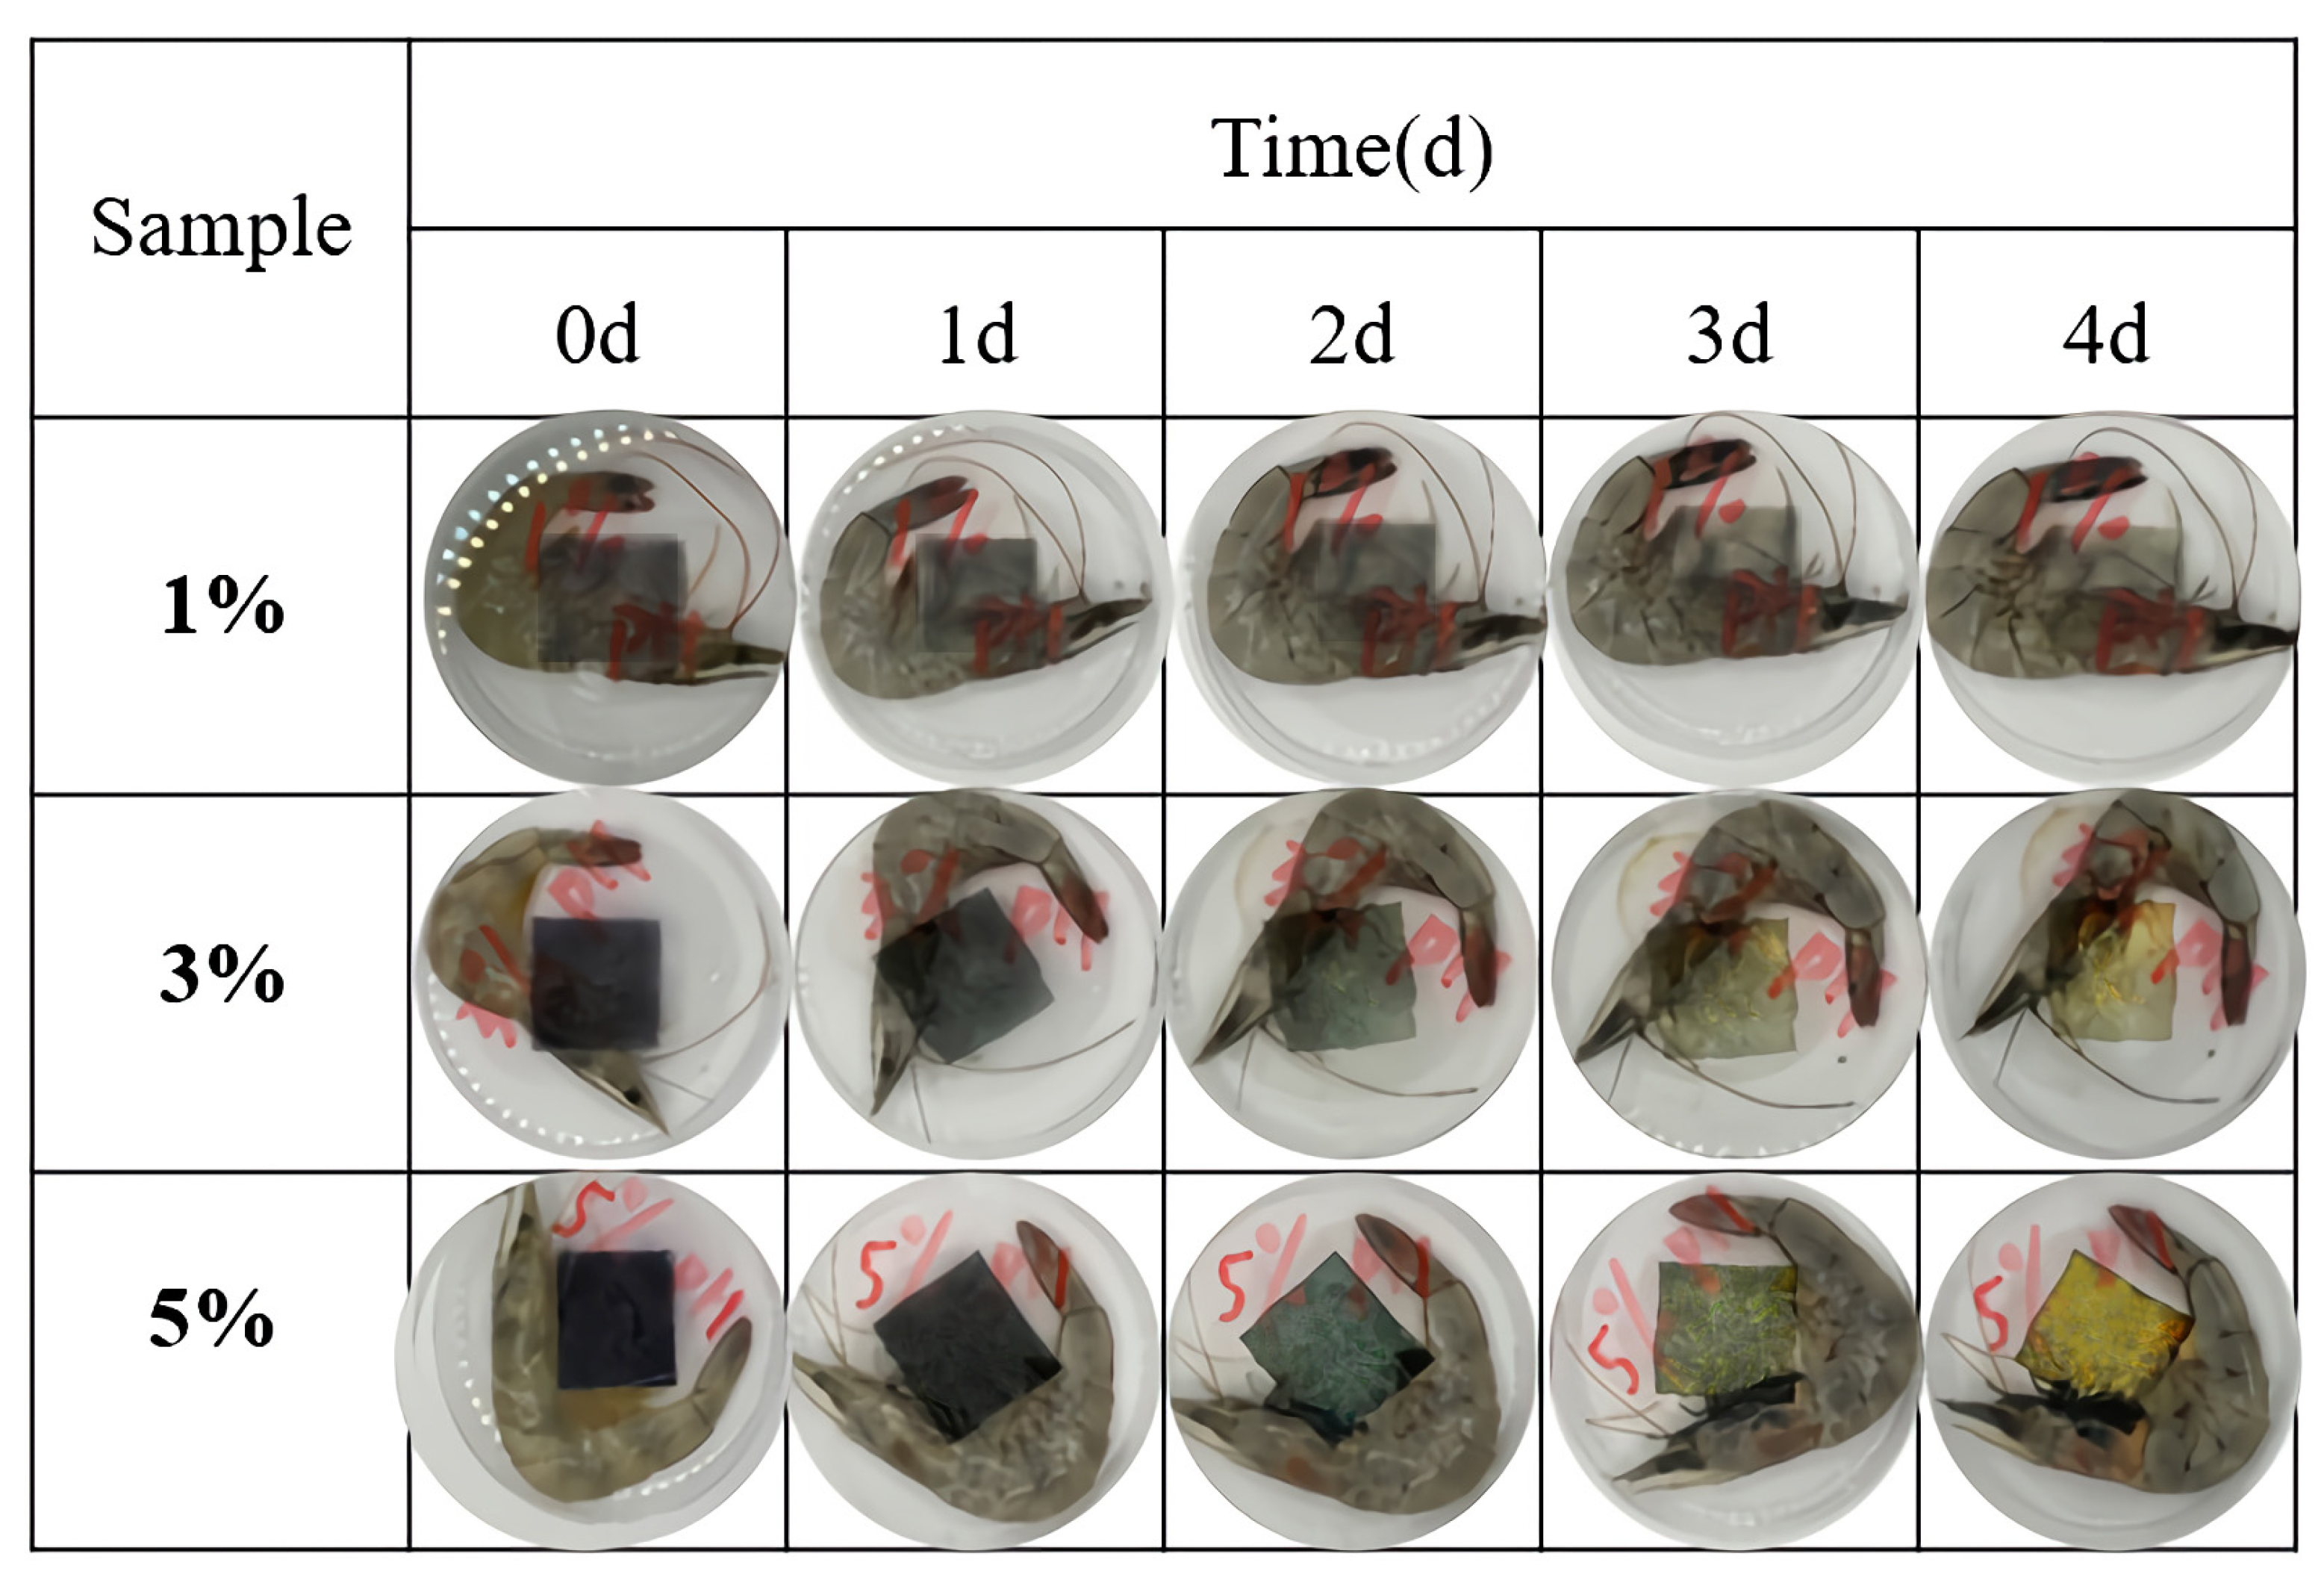
3.8. Application of PVA/PTA Films for Monitoring Shrimp Freshness
4. Conclusions
Author Contributions
Funding
Institutional Review Board Statement
Data Availability Statement
Conflicts of Interest
References
- Xiaowei, H.; Liuzi, D.; Zhihua, L.; Jin, X.; Jiyong, S.; Xiaodong, Z.; Junjun, Z.; Ning, Z.; Holmes, M.; Xiaobo, Z. Fabrication and characterization of colorimetric indicator for Salmon freshness monitoring using agar/polyvinyl alcohol gel and anthocyanin from different plant sources. Int. J. Biol. Macromol. 2023, 239, 124198. [Google Scholar] [CrossRef]
- Han, T.; Xia, C.; Huang, Y.; Sun, C.; Liu, D.; Xu, W.; Wang, D. An electrospun sensing label based on poly (vinyl alcohol)-Ag-grape seed anthocyanidin nanofibers for smart, real-time meat freshness monitoring. Sens. Actuators B Chem. 2023, 376, 132975. [Google Scholar] [CrossRef]
- Wanniarachchi, P.C.; Kumarasinghe, K.U.; Jayathilake, C. Recent advancements in chemosensors for the detection of food spoilage. Food Chem. 2024, 436, 137733. [Google Scholar] [CrossRef]
- Kim, D.; Lee, S.; Lee, K.; Baek, S.; Seo, J. Development of a pH indicator composed of high moisture-absorbing materials for real-time monitoring of chicken breast freshness. Food Sci. Biotechnol. 2017, 26, 37–42. [Google Scholar] [CrossRef]
- Bonilla, J.; Fortunati, E.; Atarés, L.; Chiralt, A.; Kenny, J.M. Physical, structural and antimicrobial properties of poly vinyl alcohol-chitosan biodegradable films. Food Hydrocoll. 2014, 35, 463–470. [Google Scholar] [CrossRef]
- Ge, C.; Lansing, B.; Lewis, C.L. Thermoplastic starch and poly(vinyl alcohol) blends centered barrier film for food packaging applications. Food Packag. Shelf Life 2021, 27, 100610. [Google Scholar] [CrossRef]
- Göksen, G.; Fabra, M.J.; Pérez-Cataluña, A.; Ekiz, H.I.; Sanchez, G.; López-Rubio, A. Biodegradable active food packaging structures based on hybrid cross-linked electrospun polyvinyl alcohol fibers containing essential oils and their application in the preservation of chicken breast fillets. Food Packag. Shelf Life 2021, 27, 100613. [Google Scholar] [CrossRef]
- Hoseyni, S.Z.; Jafari, S.M.; Shahiri Tabarestani, H.; Ghorbani, M.; Assadpour, E.; Sabaghi, M. Release of catechin from Azivash gum-polyvinyl alcohol electrospun nanofibers in simulated food and digestion media. Food Hydrocoll. 2021, 112, 106366. [Google Scholar] [CrossRef]
- Vafa, E.; Bazargan-Lari, R.; Bahrololoom, M.E. Electrophoretic deposition of polyvinyl alcohol/natural chitosan/bioactive glass composite coatings on 316L stainless steel for biomedical application. Prog. Org. Coat. 2021, 151, 106059. [Google Scholar] [CrossRef]
- Das, J.; Mishra, H.N. A comprehensive review of the spoilage of shrimp and advances in various indicators/sensors for shrimp spoilage monitoring. Food Res. Int. 2023, 173, 113270. [Google Scholar] [CrossRef] [PubMed]
- Cavalcanti, R.N.; Santos, D.T.; Meireles, M.A.A. Non-thermal stabilization mechanisms of anthocyanins in model and food systems—An overview. Food Res. Int. 2011, 44, 499–509. [Google Scholar] [CrossRef]
- Yana, L.; Zhiwei, C.; Yunuo, Z.; Jingxi, W. Application of biodegradable colorimetric films based on purple tomatoes anthocyanins loaded chitosan and polyvinyl alcohol in pork meat. Food Sci. Technol. Int. 2023, 10820132231193616. [Google Scholar] [CrossRef]
- Li, Y.; Wu, K.; Wang, B.; Li, X. Colorimetric indicator based on purple tomato anthocyanins and chitosan for application in intelligent packaging. Int. J. Biol. Macromol. 2021, 174, 370–376. [Google Scholar] [CrossRef] [PubMed]
- Zhang, K.; Huang, T.S.; Yan, H.; Hu, X.Z.; Ren, T. Novel pH-sensitive films based on starch/polyvinyl alcohol and food anthocyanins as a visual indicator of shrimp deterioration. Int. J. Biol. Macromol. 2020, 145, 768–776. [Google Scholar] [CrossRef]
- Sani, M.A.; Tavassoli, M.; Hamishehkar, H.; McClements, D.J. Carbohydrate-based films containing pH-sensitive red barberry anthocyanins: Application as biodegradable smart food packaging materials. Carbohydr. Polym. 2021, 255, 117488. [Google Scholar] [CrossRef]
- Li, Y.; Li, Z.; Wang, Y.; Sun, L.; Pei, H. Anthocyanins/chitosan films doped by nano zinc oxide for active and intelligent packaging: Comparison of anthocyanins source from purple tomato or black wolfberry. Front. Chem. Sci. Eng. 2023, 17, 704–715. [Google Scholar] [CrossRef]
- Choi, I.; Lee, J.Y.; Lacroix, M.; Han, J. Intelligent pH indicator film composed of agar/potato starch and anthocyanin extracts from purple sweet potato. Food Chem. 2017, 218, 122–128. [Google Scholar] [CrossRef]
- Liu, J.; Wang, H.; Guo, M.; Li, L.L.; Chen, M.M.; Jiang, S.W.; Li, X.; Jiang, S. Extract from Lycium ruthenicum Murr. Incorporating κ-carrageenan colorimetric film with a wide pH–sensing range for food freshness monitoring. Food Hydrocoll. 2019, 94, 1–10. [Google Scholar] [CrossRef]
- Merz, B.; Capello, C.; Leandro, G.C.; Moritz, D.E.; Monteiro, A.R.; Valencia, G.A. A novel colorimetric indicator film based on chitosan, polyvinyl alcohol and anthocyanins from jambolan (Syzygium cumini) fruit for monitoring shrimp freshness. Int. J. Biol. Macromol. 2020, 153, 625–632. [Google Scholar] [CrossRef]
- Kimbuathong, N.; Leelaphiwat, P.; Harnkarnsujarit, N. Inhibition of melanosis and microbial growth in Pacific white shrimp (Litopenaeus vannamei) using high CO2 modified atmosphere packaging. Food Chem. 2020, 312, 126114. [Google Scholar] [CrossRef] [PubMed]
- Mohammadalinejhad, S.; Almasi, H.; Moradi, M. Immobilization of Echium amoenum anthocyanins into bacterial cellulose film: A novel colorimetric pH indicator for freshness/spoilage monitoring of shrimp. Food Control 2020, 113, 107169. [Google Scholar] [CrossRef]
- Rawdkuen, S.; Faseha, A.; Benjakul, S.; Kaewprachu, P. Application of anthocyanin as a color indicator in gelatin films. Food Biosci. 2020, 36, 100603. [Google Scholar] [CrossRef]
- Halász, K.; Csóka, L. Black chokeberry (Aronia melanocarpa) pomace extract immobilized in chitosan for colorimetric pH indicator film application. Food Packag. Shelf Life 2018, 16, 185–193. [Google Scholar] [CrossRef]
- Qin, Y.; Liu, Y.; Yuan, L.; Yong, H.M.; Liu, J. Preparation and characterization of antioxidant, antimicrobial and pH-sensitive films based on chitosan, silver nanoparticles and purple corn extract. Food Hydrocoll. 2019, 96, 102–111. [Google Scholar] [CrossRef]
- Yoshida, C.M.P.; Maciel, V.B.V.; Mendonça, M.E.D.; Franco, T.T. Chitosan biobased and intelligent films: Monitoring pH variations. LWT 2014, 55, 83–89. [Google Scholar] [CrossRef]
- Aksakal, B.; Yargı, Ö.; Şahinturk, U. Uniaxial tensile and structural properties of poly (vinyl alcohol) films: The influence of heating and film thickness. J. Appl. Polym. Sci. 2017, 134, 23. [Google Scholar] [CrossRef]
- Liu, D.; Cui, Z.; Shang, M.; Zhong, Y. A colorimetric film based on polyvinyl alcohol/sodium carboxymethyl cellulose incorporated with red cabbage anthocyanin for monitoring pork freshness. Food Packag. Shelf Life 2021, 28, 100641. [Google Scholar] [CrossRef]
- Zhang, Y.; Han, J.H. Plasticization of pea starch films with monosaccharides and polyols. J. Food Sci. 2006, 7, 253–261. [Google Scholar] [CrossRef]
- Zhai, X.; Shi, J.; Zou, X.; Wang, S.; Jiang, C.; Zhang, J.; Huang, X.W.; Zhang, W.; Holmes, M. Novel colorimetric films based on starch/polyvinyl alcohol incorporated with roselle anthocyanins for fish freshness monitoring. Food Hydrocoll. 2017, 69, 308–317. [Google Scholar] [CrossRef]
- Huang, J.; Chen, M.; Zhou, Y.; Li, Y.; Hu, Y. Functional characteristics improvement by structural modification of hydroxypropyl methylcellulose modified polyvinyl alcohol films incorporating roselle anthocyanins for shrimp freshness monitoring. Int. J. Biol. Macromol. 2020, 162, 1250–1261. [Google Scholar] [CrossRef]
- Mansur, H.S.; Oréfice, R.L.; Mansur, A.A.P. Characterization of poly(vinyl alcohol)/poly(ethylene glycol) hydrogels and PVA-derived hybrids by small-angle X-ray scattering and FTIR spectroscopy. Polymer 2004, 45, 7193–7202. [Google Scholar] [CrossRef]
- Koosha, M.; Hamedi, S. Intelligent Chitosan/PVA nanocomposite films containing black carrot anthocyanin and bentonite nanoclays with improved mechanical, thermal and antibacterial properties. Prog. Org. Coat. 2019, 127, 338–347. [Google Scholar] [CrossRef]
- Pourjavaher, S.; Almasi, H.; Meshkini, S.; Pirsa, S.; Parandi, E. Development of a colorimetric pH indicator based on bacterial cellulose nanofibers and red cabbage (Brassica oleraceae) extract. Carbohydr. Polym. 2017, 156, 193–201. [Google Scholar] [CrossRef] [PubMed]
- Zhang, J.; Zou, X.; Zhai, X.; Jiang, C.; Holmes, M. Preparation of an intelligent pH film based on biodegradable polymers and roselle anthocyanins for monitoring pork freshness. Food Chem. 2019, 272, 306–312. [Google Scholar] [CrossRef]
- Piñeros-Hernandez, D.; Medina-Jaramillo, C.; López-Córdoba, A.; Goyanes, S. Edible cassava starch films carrying rosemary antioxidant extracts for potential use as active food packaging. Food Hydrocoll. 2017, 63, 488–495. [Google Scholar] [CrossRef]
- Alizadeh-Sani, M.; Tavassoli, M.; McClements, D.J.; Hamishehkar, H. Multifunctional halochromic packaging materials: Saffron petal anthocyanin loaded-chitosan nanofiber/methyl cellulose matrices. Food Hydrocoll. 2021, 111, 106237. [Google Scholar] [CrossRef]


| PTA (%) | L* | a* | b* | ΔE* |
|---|---|---|---|---|
| 0% | 85.16 ± 0.15 a | 3.26 ± 0.05 c | −8.8 ± 0.25 a | 14.32 ± 0.21 d |
| 1% | 57.16 ± 3.64 b | 6.32 ± 0.79 a | −9.76 ± 0.43 a | 37.21 ± 0.36 c |
| 3% | 45.68 ± 3.41 c | 5.22 ± 0.25 b | −12.68 ± 1.06 b | 48.67 ± 3.01 b |
| 5% | 27.06 ± 1.01 d | 4.84 ± 0.59 b | −11.7 ± 1.72 b | 65.94 ± 0.42 a |
| PTA (%) | Thickness (μm) | MC (%) | WVP (10−8 g Per m. s. Pa) |
|---|---|---|---|
| 0% | 57.86 ± 2.4 c | 6.82 ± 0.26 a | 2.08 ± 0.33 b |
| 1% | 62.2 ± 8.14 b,c | 6.58 ± 0.16 a | 1.72 ± 0.23 b |
| 3% | 73.48 ± 9.98 b | 6.22 ± 0.59 a | 1.24 ± 0.02 c |
| 5% | 88.22 ± 8.41 a | 6.40 ± 0.37 a | 2.7 ± 0.05 a |
| Time (d) | pH | TVB-N Content (mg Per 100 g) | TPC (log CFU Per g) | ΔE |
|---|---|---|---|---|
| 0 | 7.1 ± 0.2 | 7.2 ± 0.3 | 5.261 ± 0.2 | 65.9 ± 0.4 |
| 1 | 7.4 ± 0.1 | 19.3 ± 0.1 | 5.378 ± 0.1 | 58.78 ± 0.2 |
| 2 | 7.8 ± 0.1 | 28.6 ± 0.1 | 5.457 ± 0.1 | 44.18 ± 0.2 |
| 3 | 8.0 ± 0.1 | 38.0 ± 0.2 | 5.659 ± 0.1 | 35.89 ± 0.2 |
| 4 | 8.4 ± 0.1 | 50.0 ± 0.1 | 6.767 ± 0.2 | 30.12 ± 0.1 |
Disclaimer/Publisher’s Note: The statements, opinions and data contained in all publications are solely those of the individual author(s) and contributor(s) and not of MDPI and/or the editor(s). MDPI and/or the editor(s) disclaim responsibility for any injury to people or property resulting from any ideas, methods, instructions or products referred to in the content. |
© 2024 by the authors. Licensee MDPI, Basel, Switzerland. This article is an open access article distributed under the terms and conditions of the Creative Commons Attribution (CC BY) license (https://creativecommons.org/licenses/by/4.0/).
Share and Cite
Qi, Y.; Li, Y. Colorimetric Films Based on Polyvinyl Alcohol and Anthocyanins Extracted from Purple Tomato to Monitor the Freshness of Shrimp. Polymers 2024, 16, 495. https://doi.org/10.3390/polym16040495
Qi Y, Li Y. Colorimetric Films Based on Polyvinyl Alcohol and Anthocyanins Extracted from Purple Tomato to Monitor the Freshness of Shrimp. Polymers. 2024; 16(4):495. https://doi.org/10.3390/polym16040495
Chicago/Turabian StyleQi, Yangyang, and Yana Li. 2024. "Colorimetric Films Based on Polyvinyl Alcohol and Anthocyanins Extracted from Purple Tomato to Monitor the Freshness of Shrimp" Polymers 16, no. 4: 495. https://doi.org/10.3390/polym16040495
APA StyleQi, Y., & Li, Y. (2024). Colorimetric Films Based on Polyvinyl Alcohol and Anthocyanins Extracted from Purple Tomato to Monitor the Freshness of Shrimp. Polymers, 16(4), 495. https://doi.org/10.3390/polym16040495