
Testing of Polymer Composites for Manufacturing of Sprayer Nozzles

 ,
,  , ,
, ,
Abstract
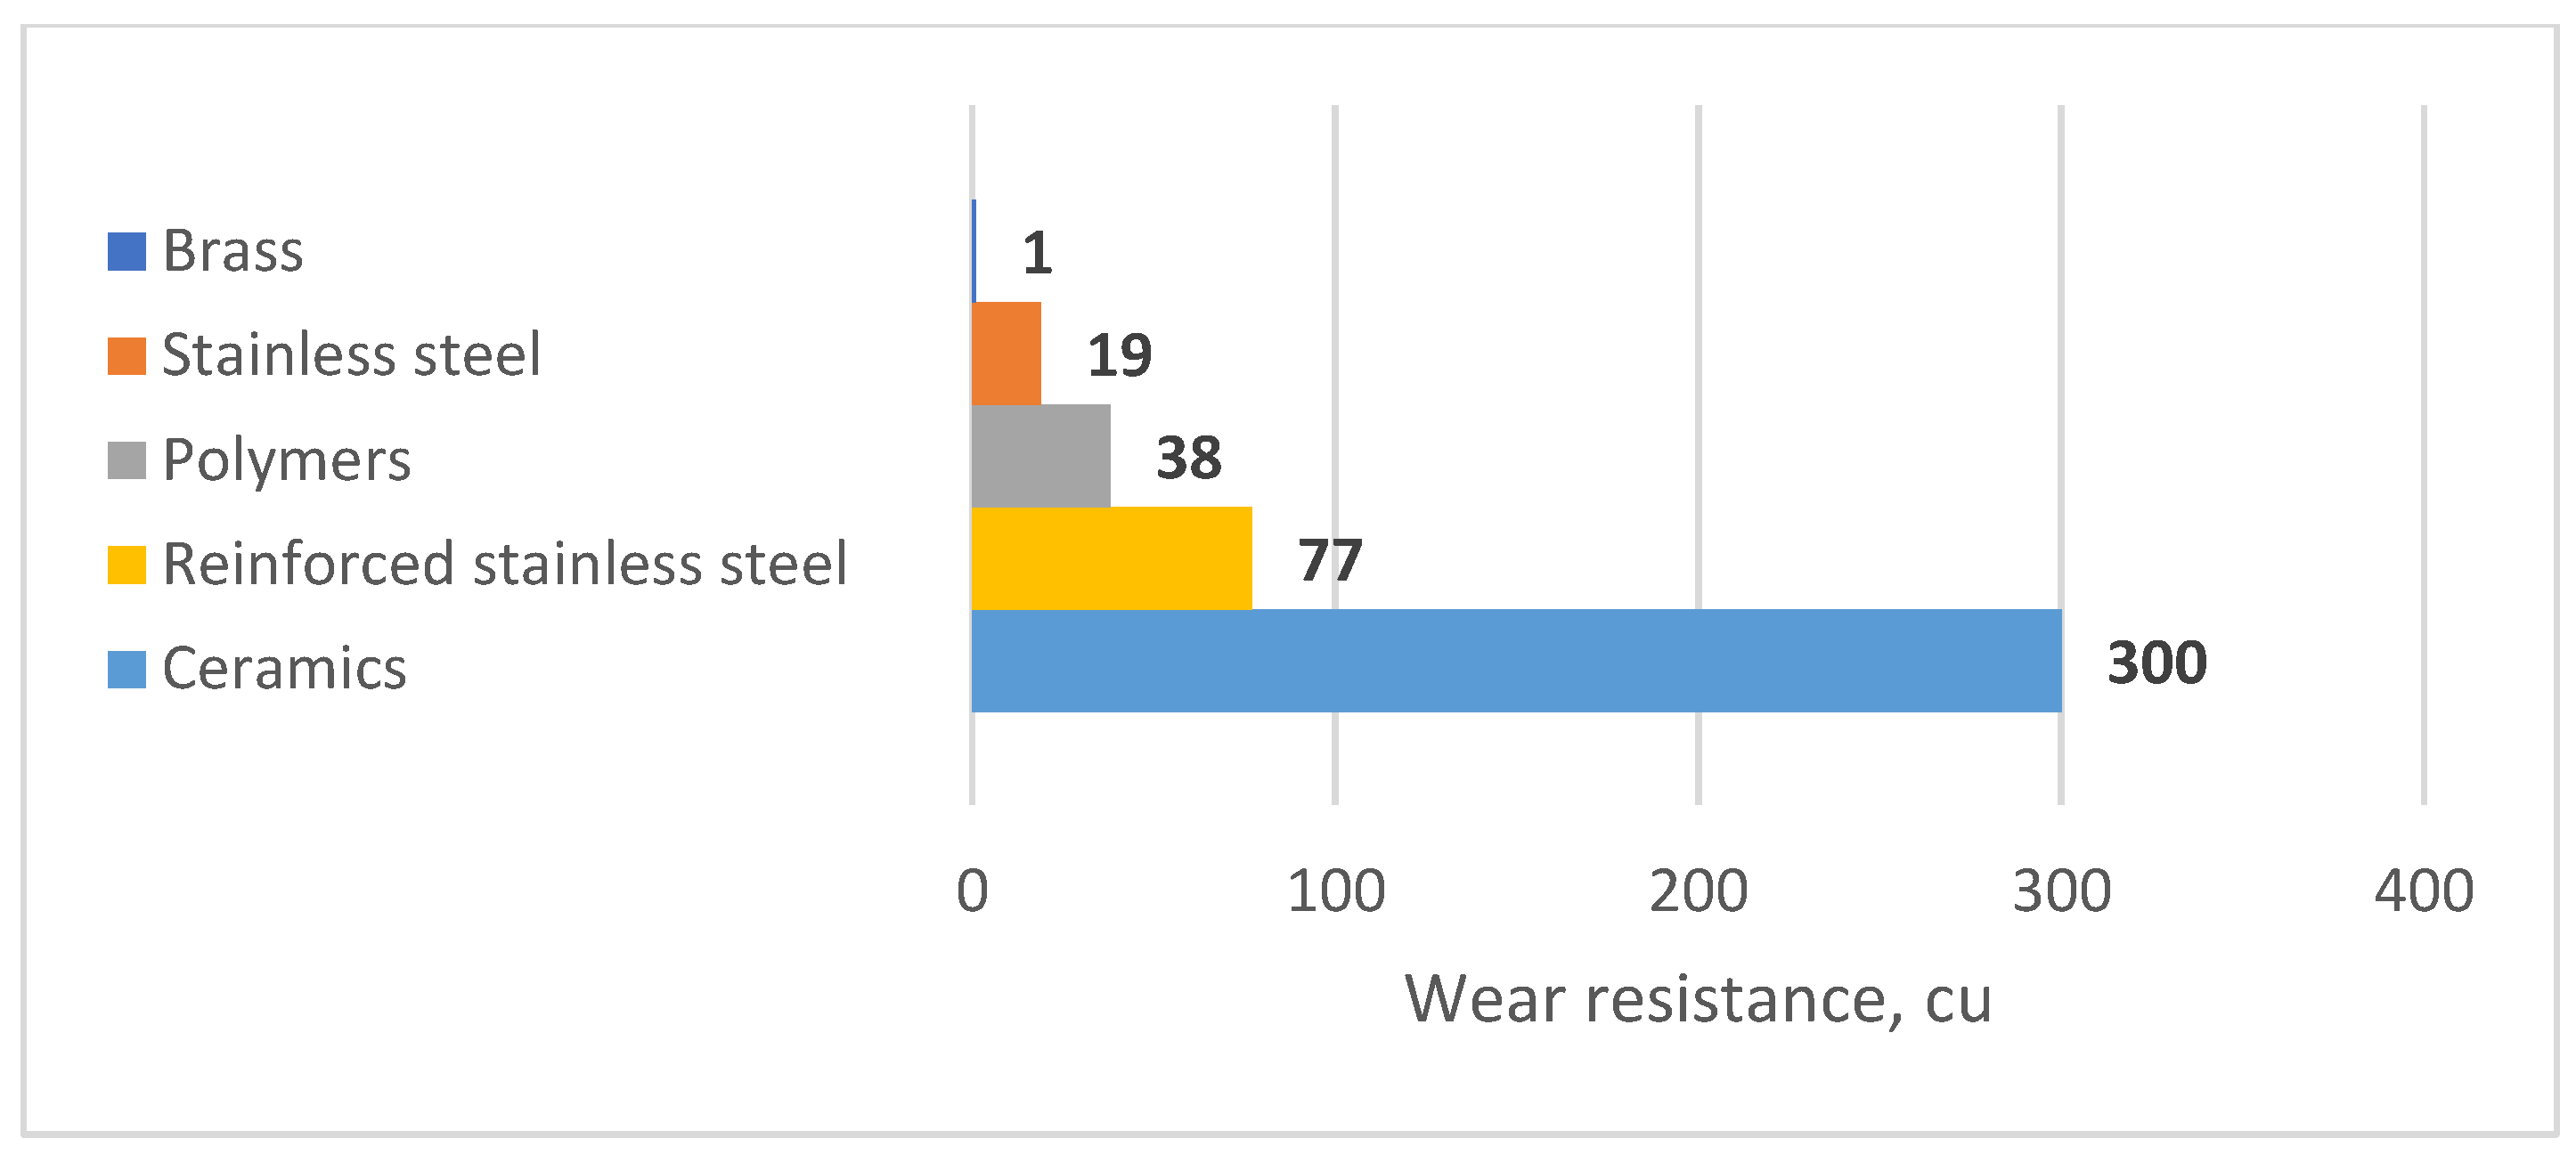
1. Introduction
2. Materials and Methods
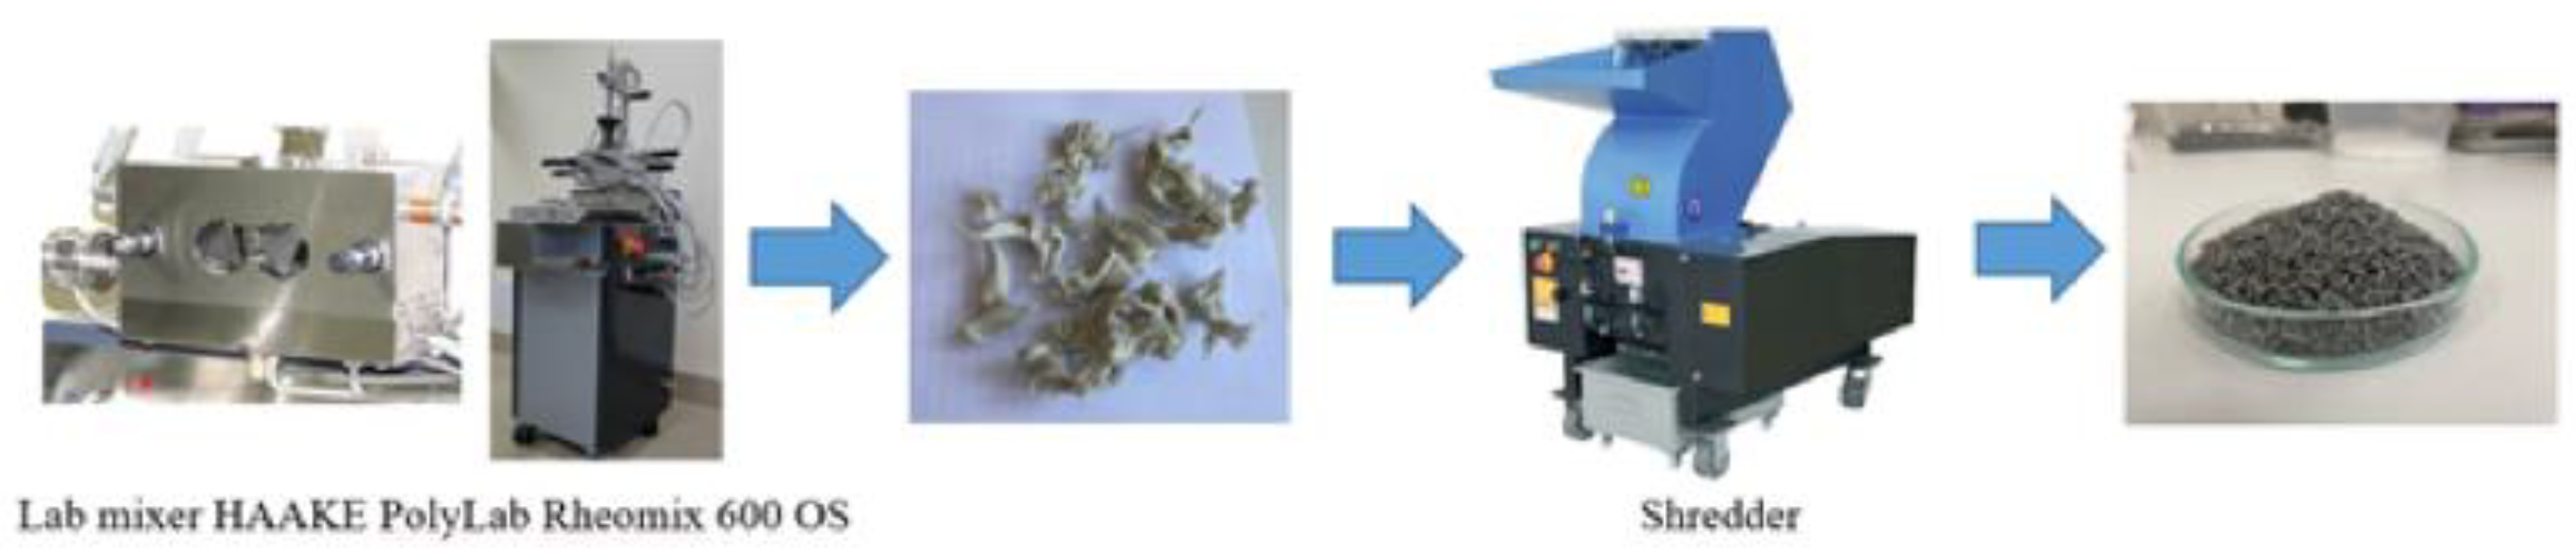
2.1. Compositions and Manufacture of Test Samples
2.2. Parameters for Mechanical Strength Test
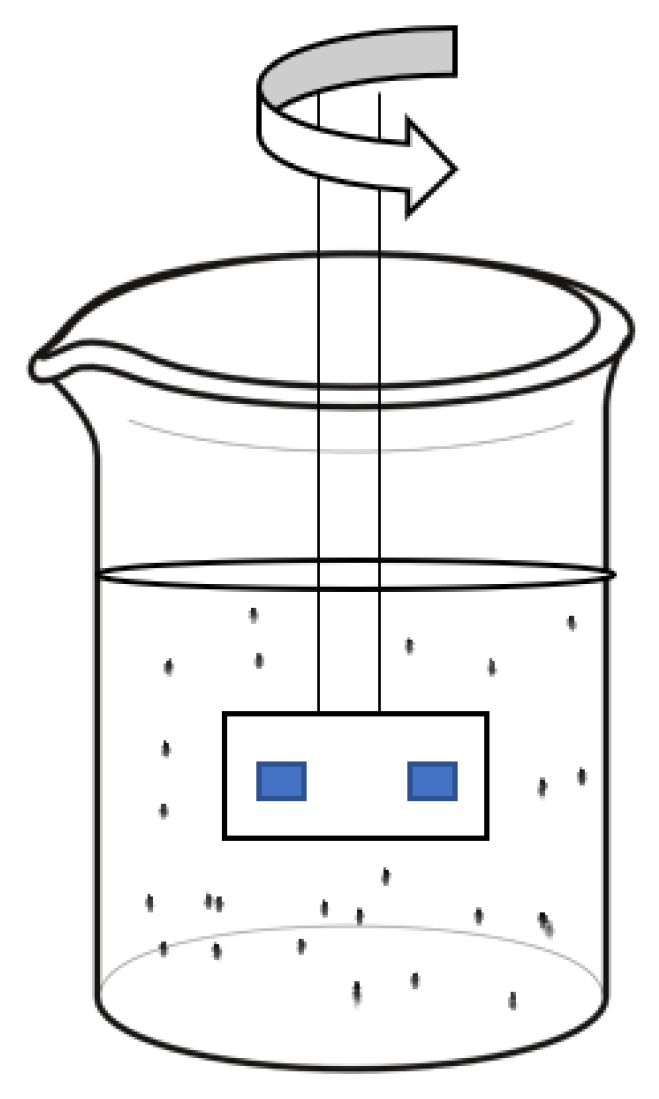
2.3. Test of Resistance to Chemicals
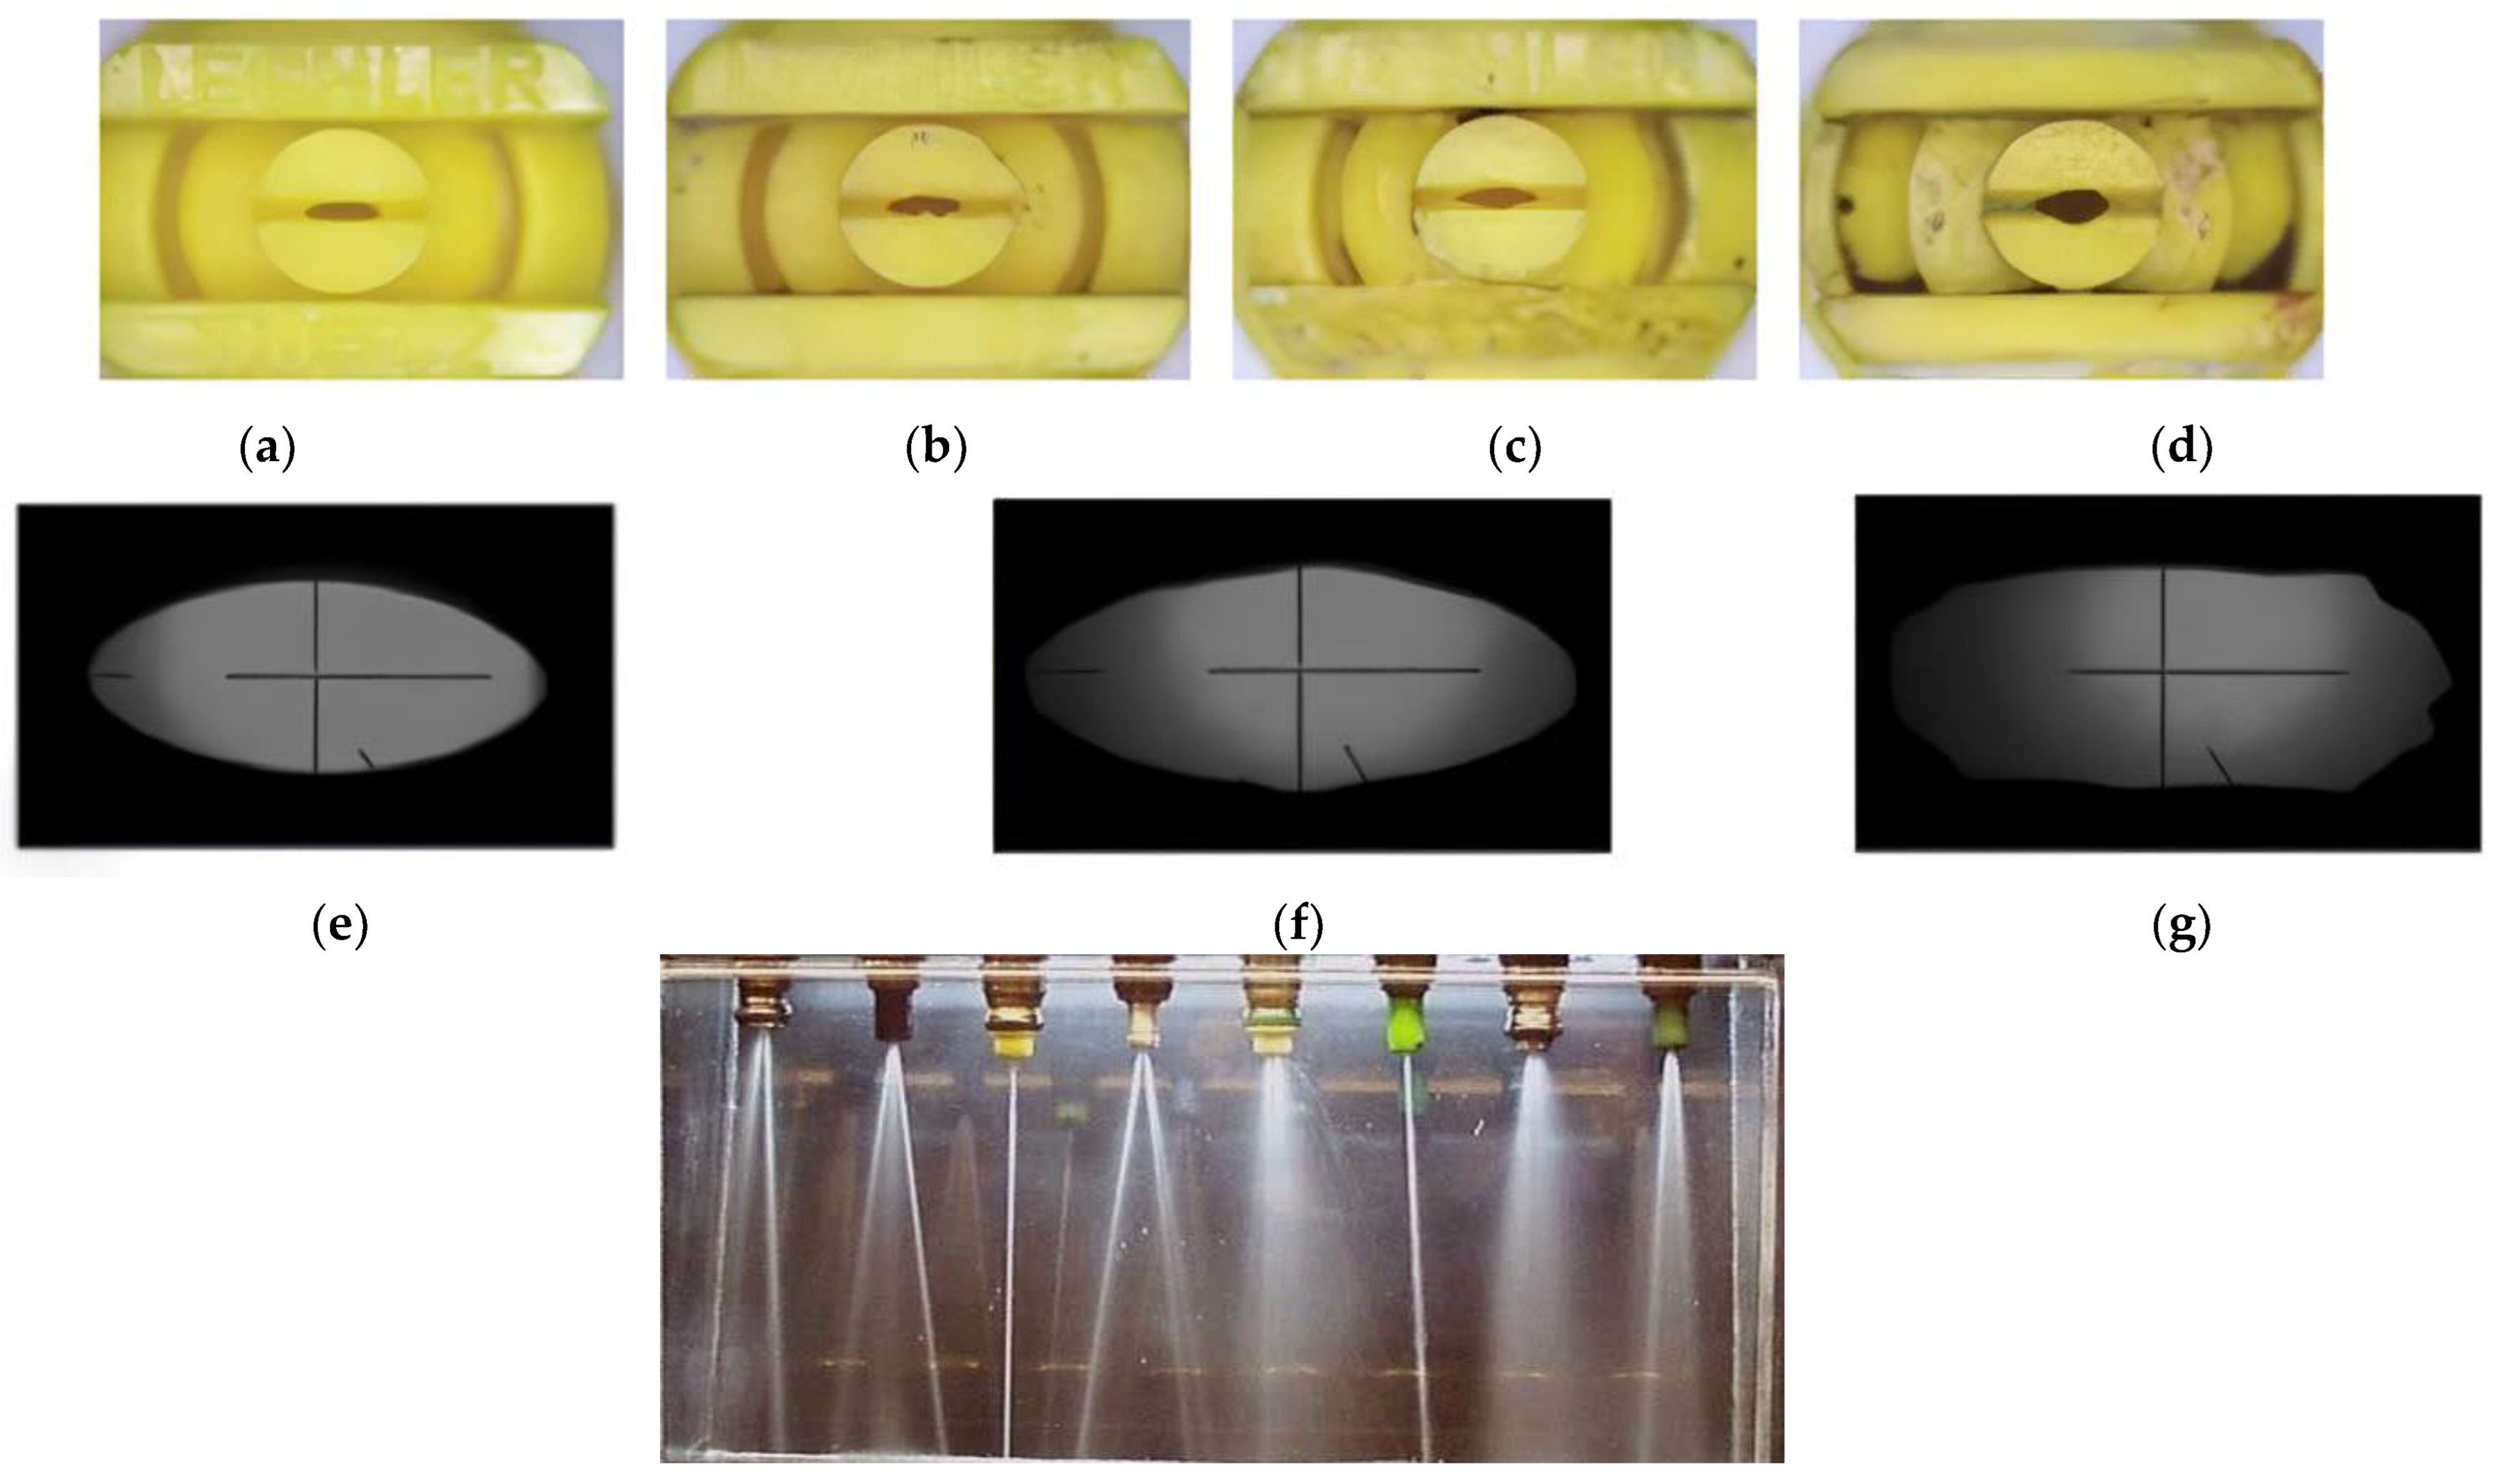
2.4. Hydro-Abrasion Experiment
2.5. Optical Microscopy
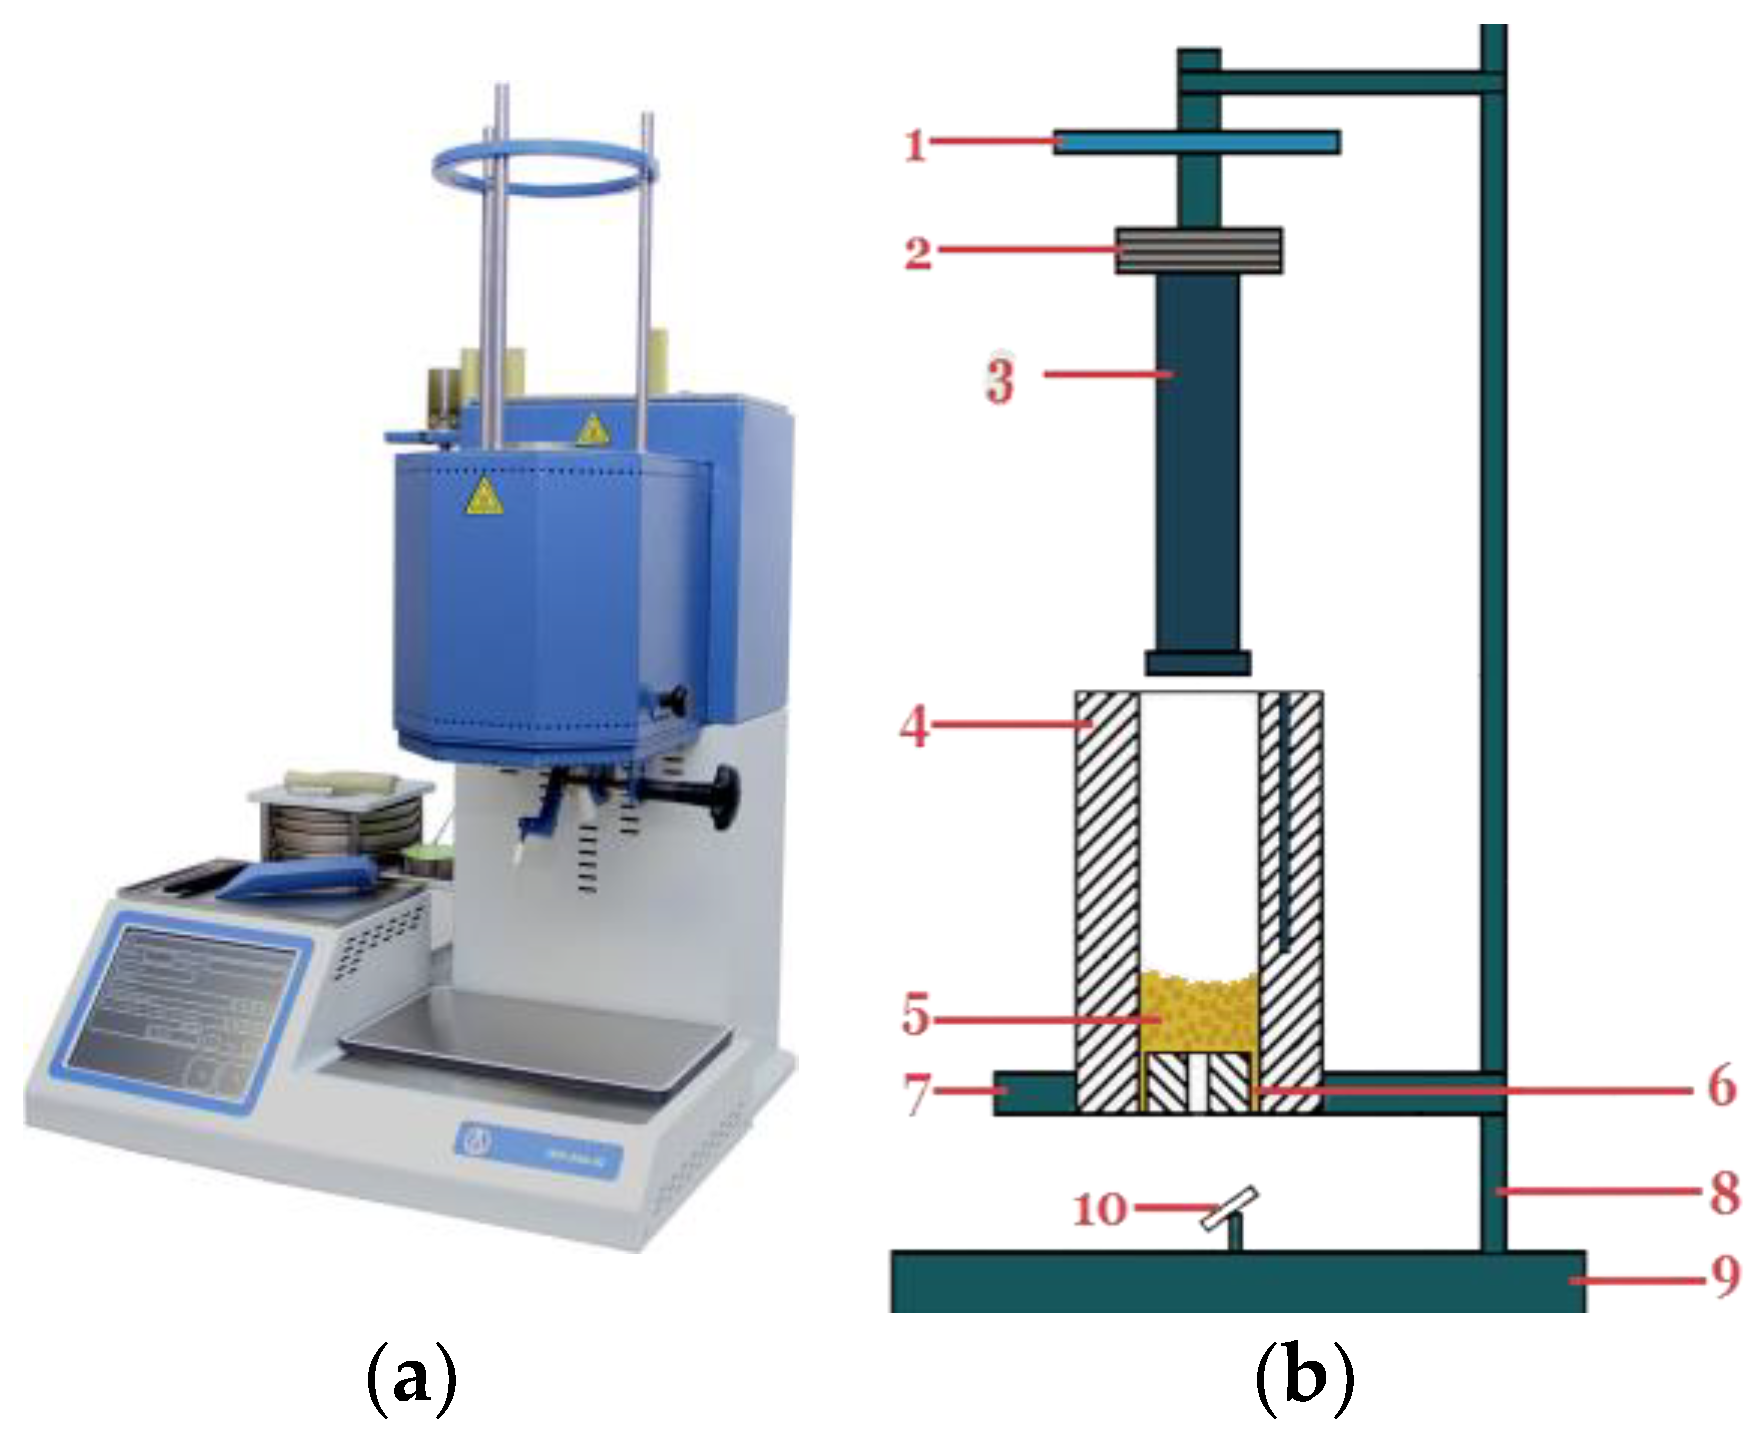
2.6. Planned Three-Factor Experiment to Determine the Viscosity of the Composite
3. Results and Discussion
3.1. Results of the Mechanical Strength Tests
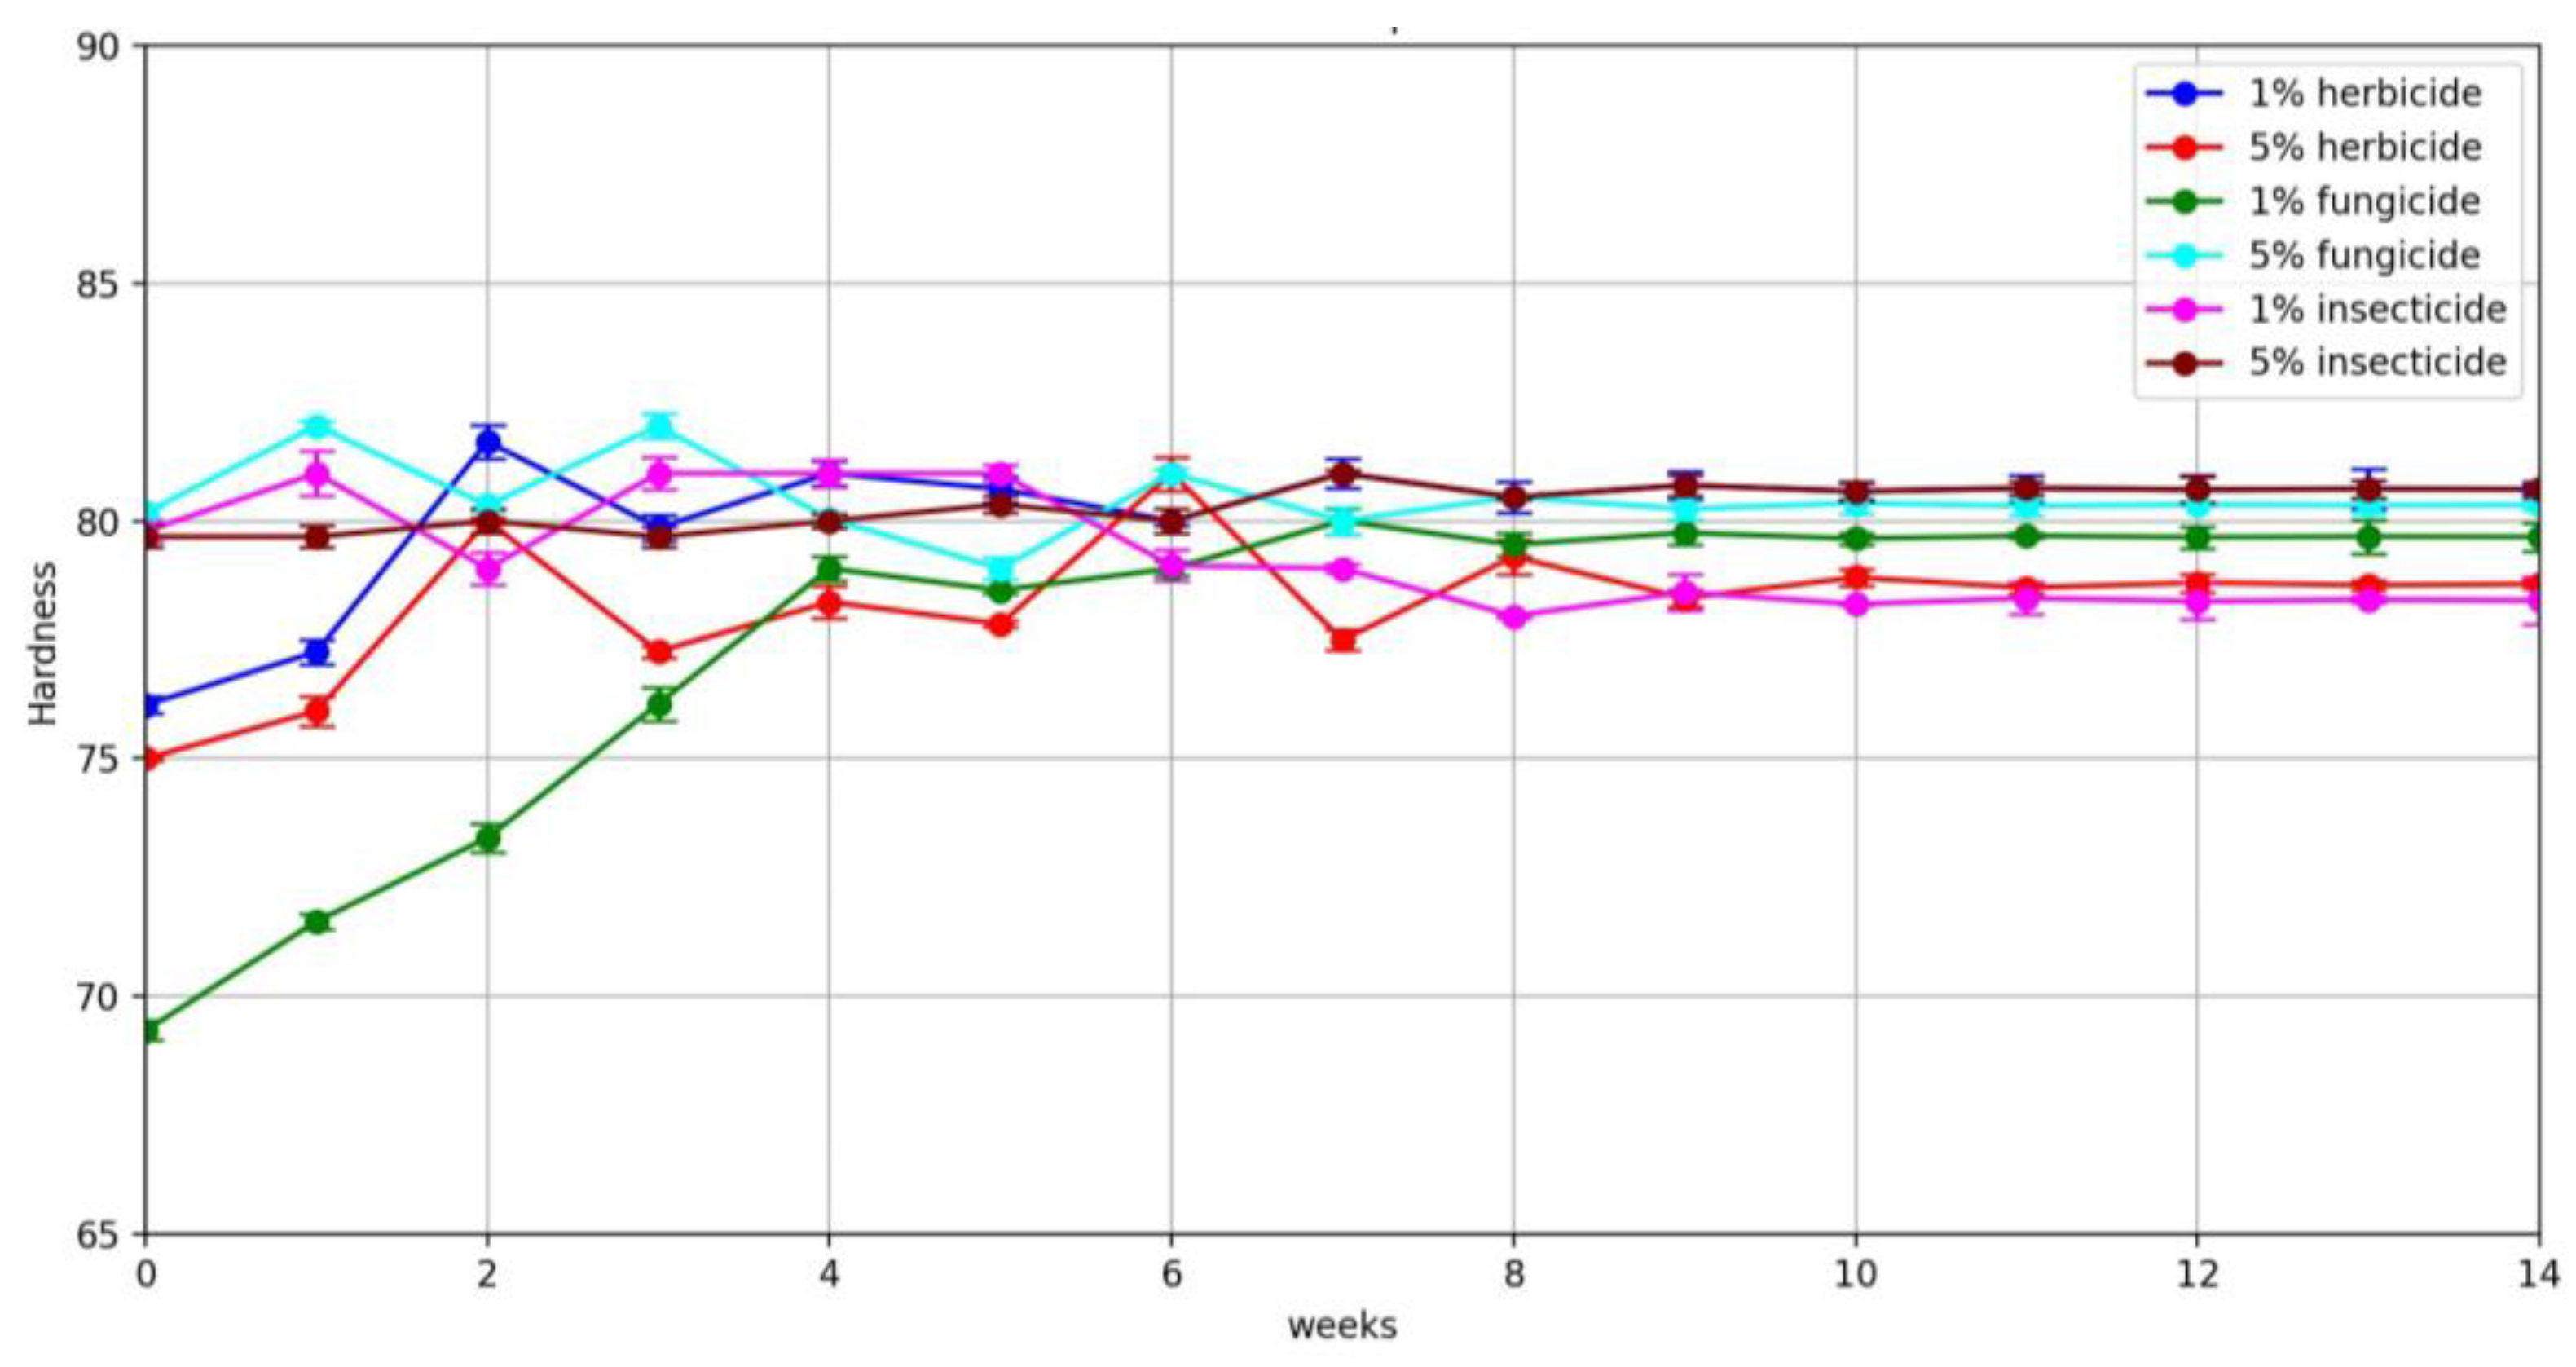
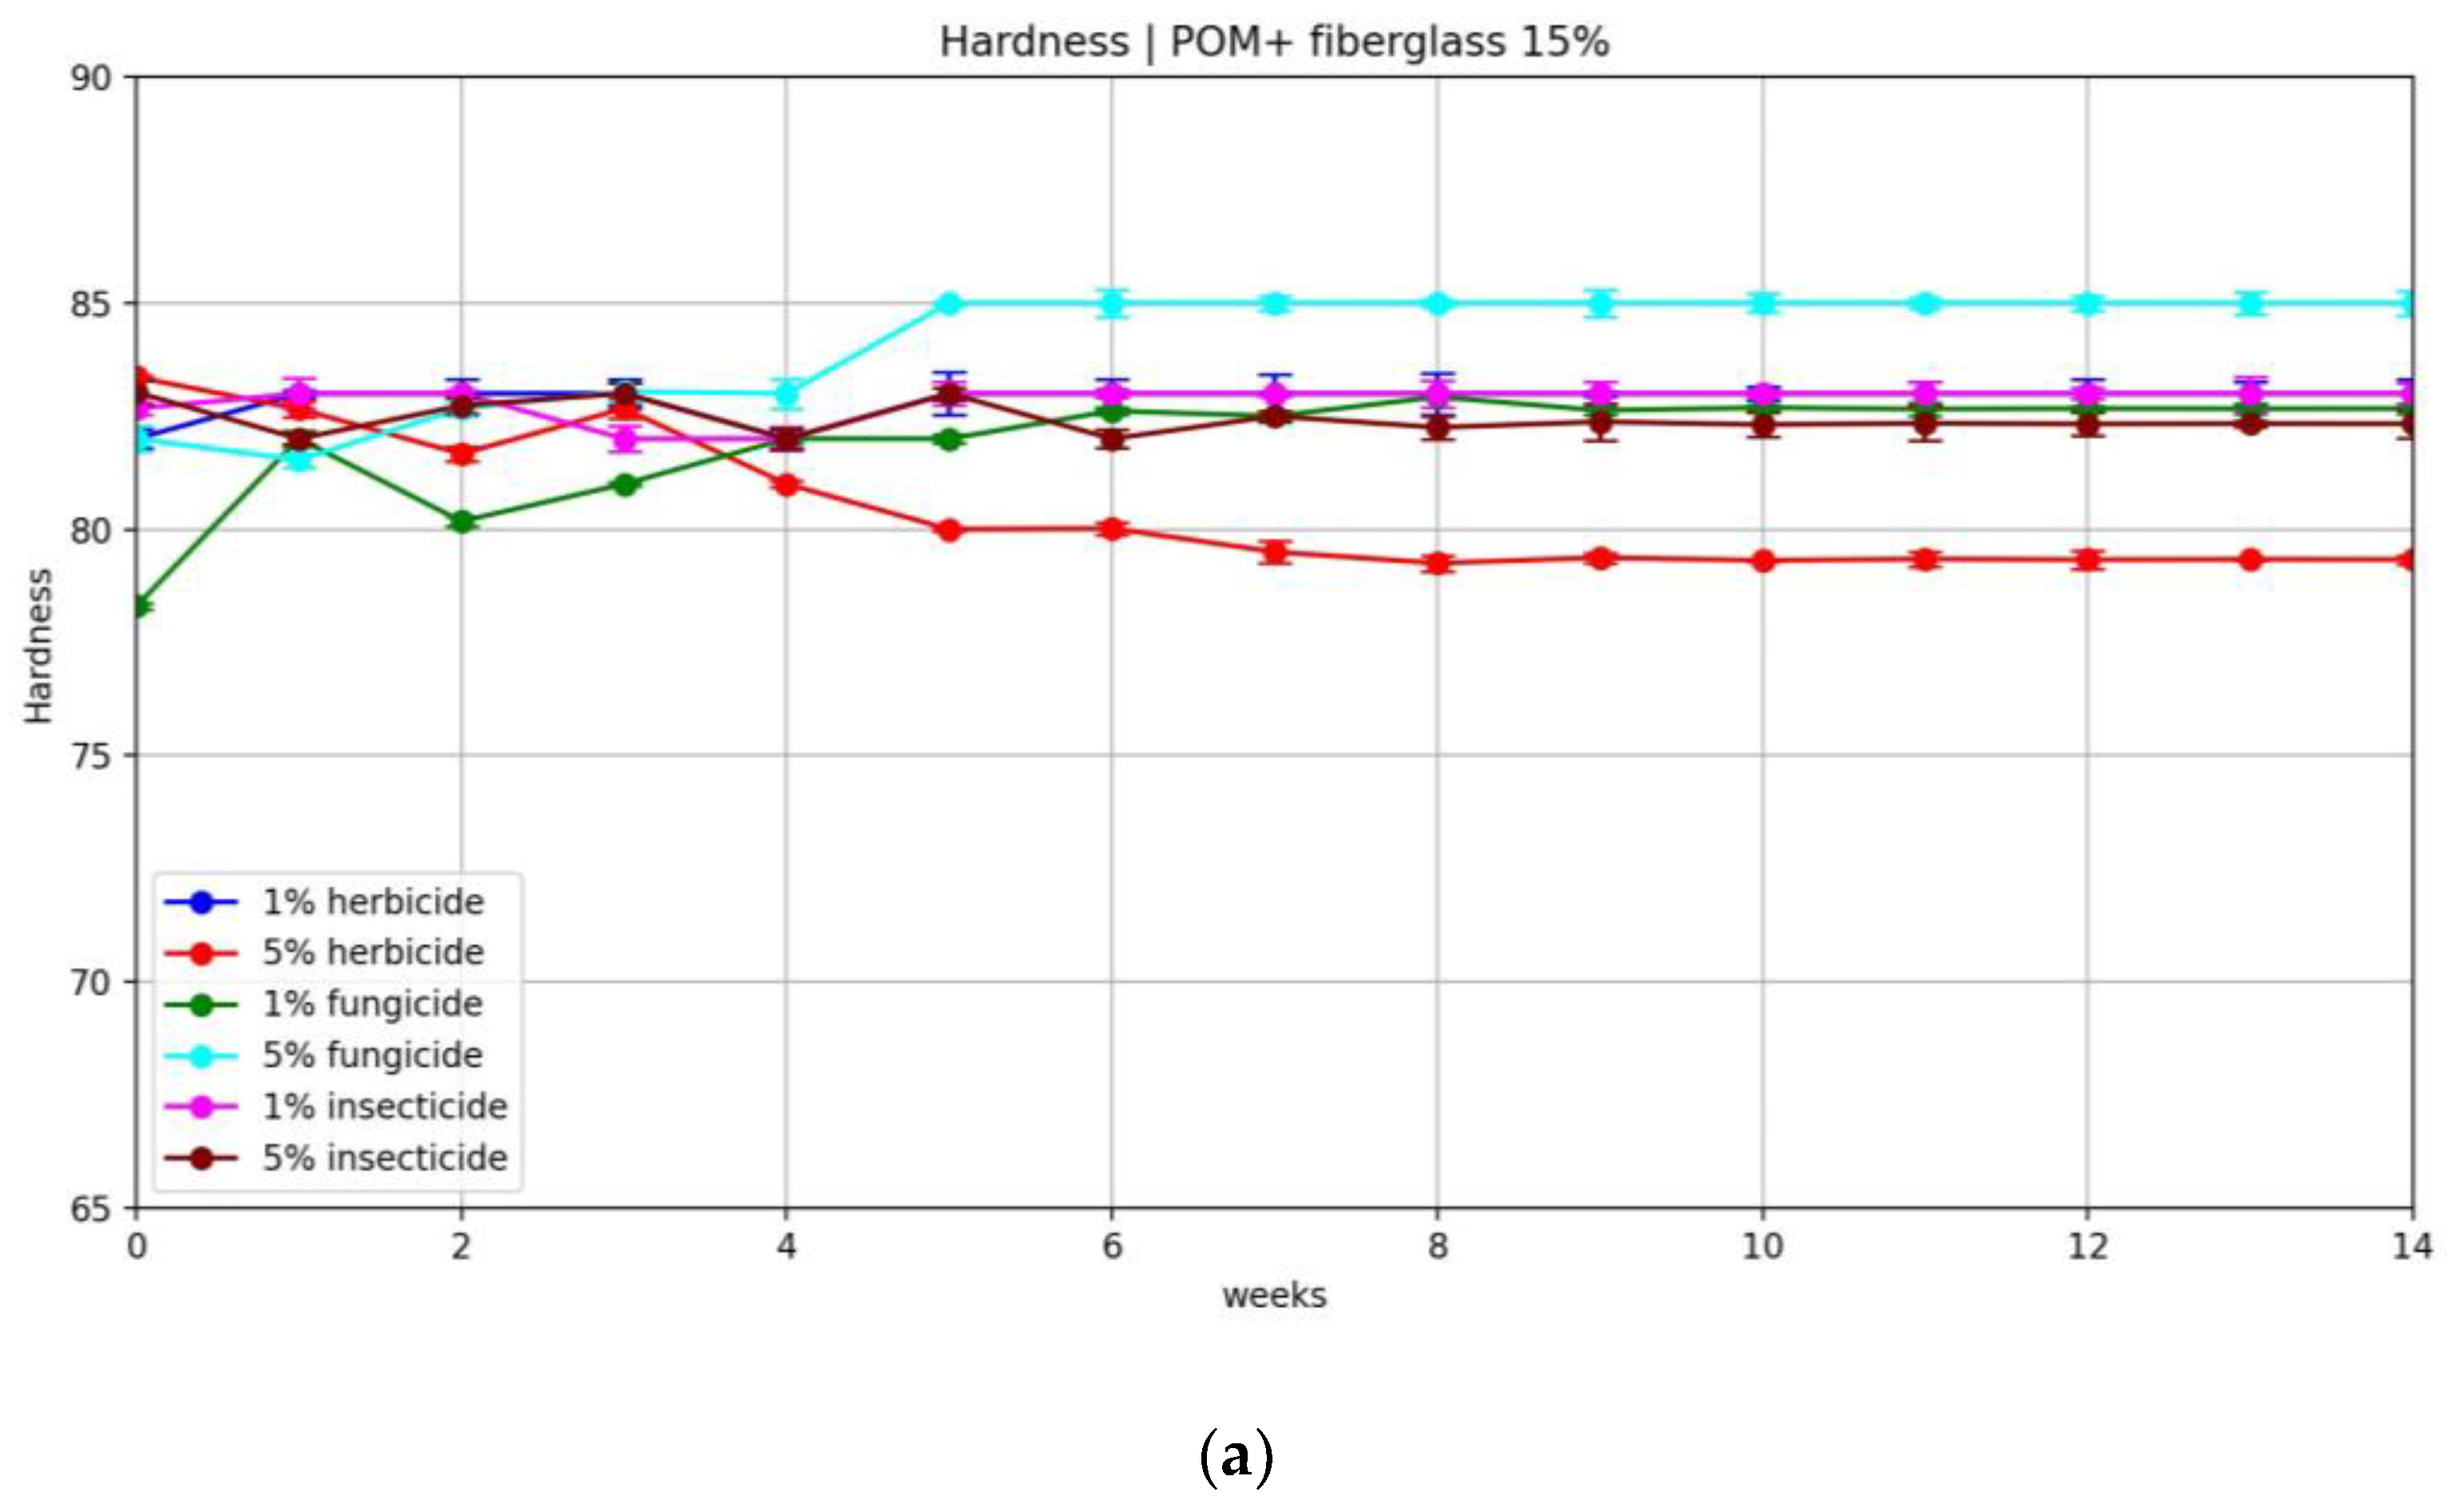
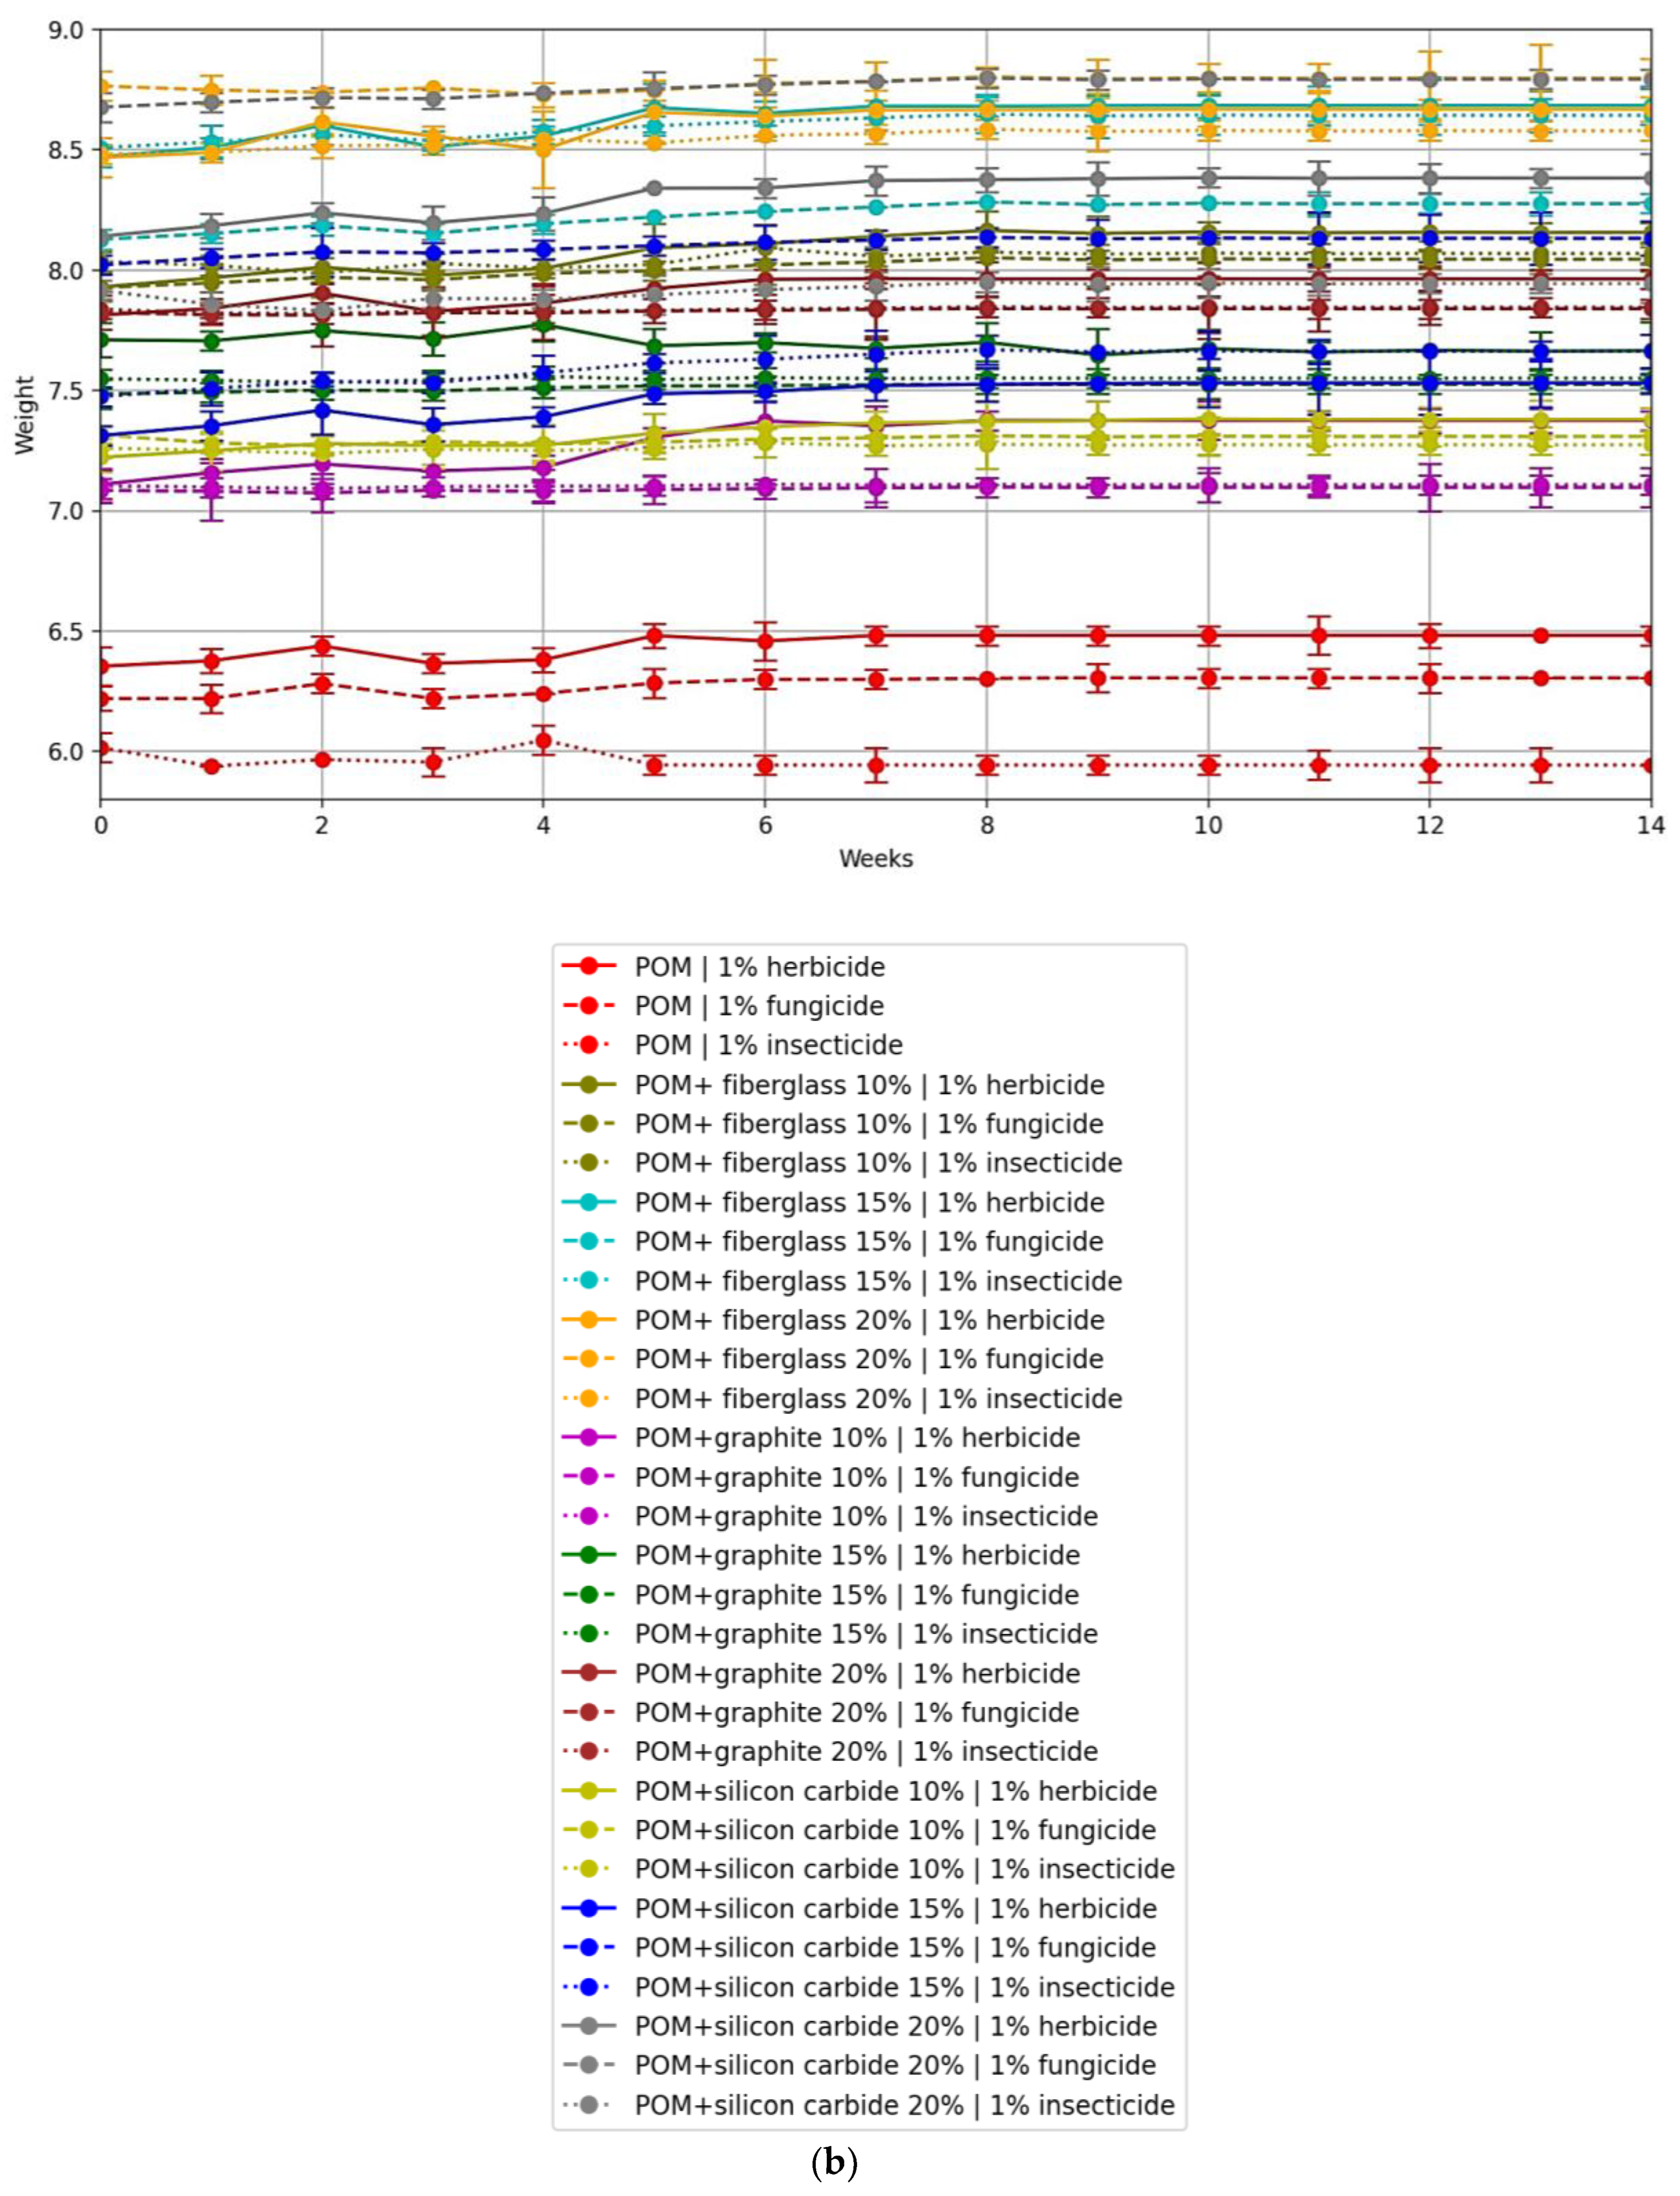
3.2. Chemical Resistance Test Results
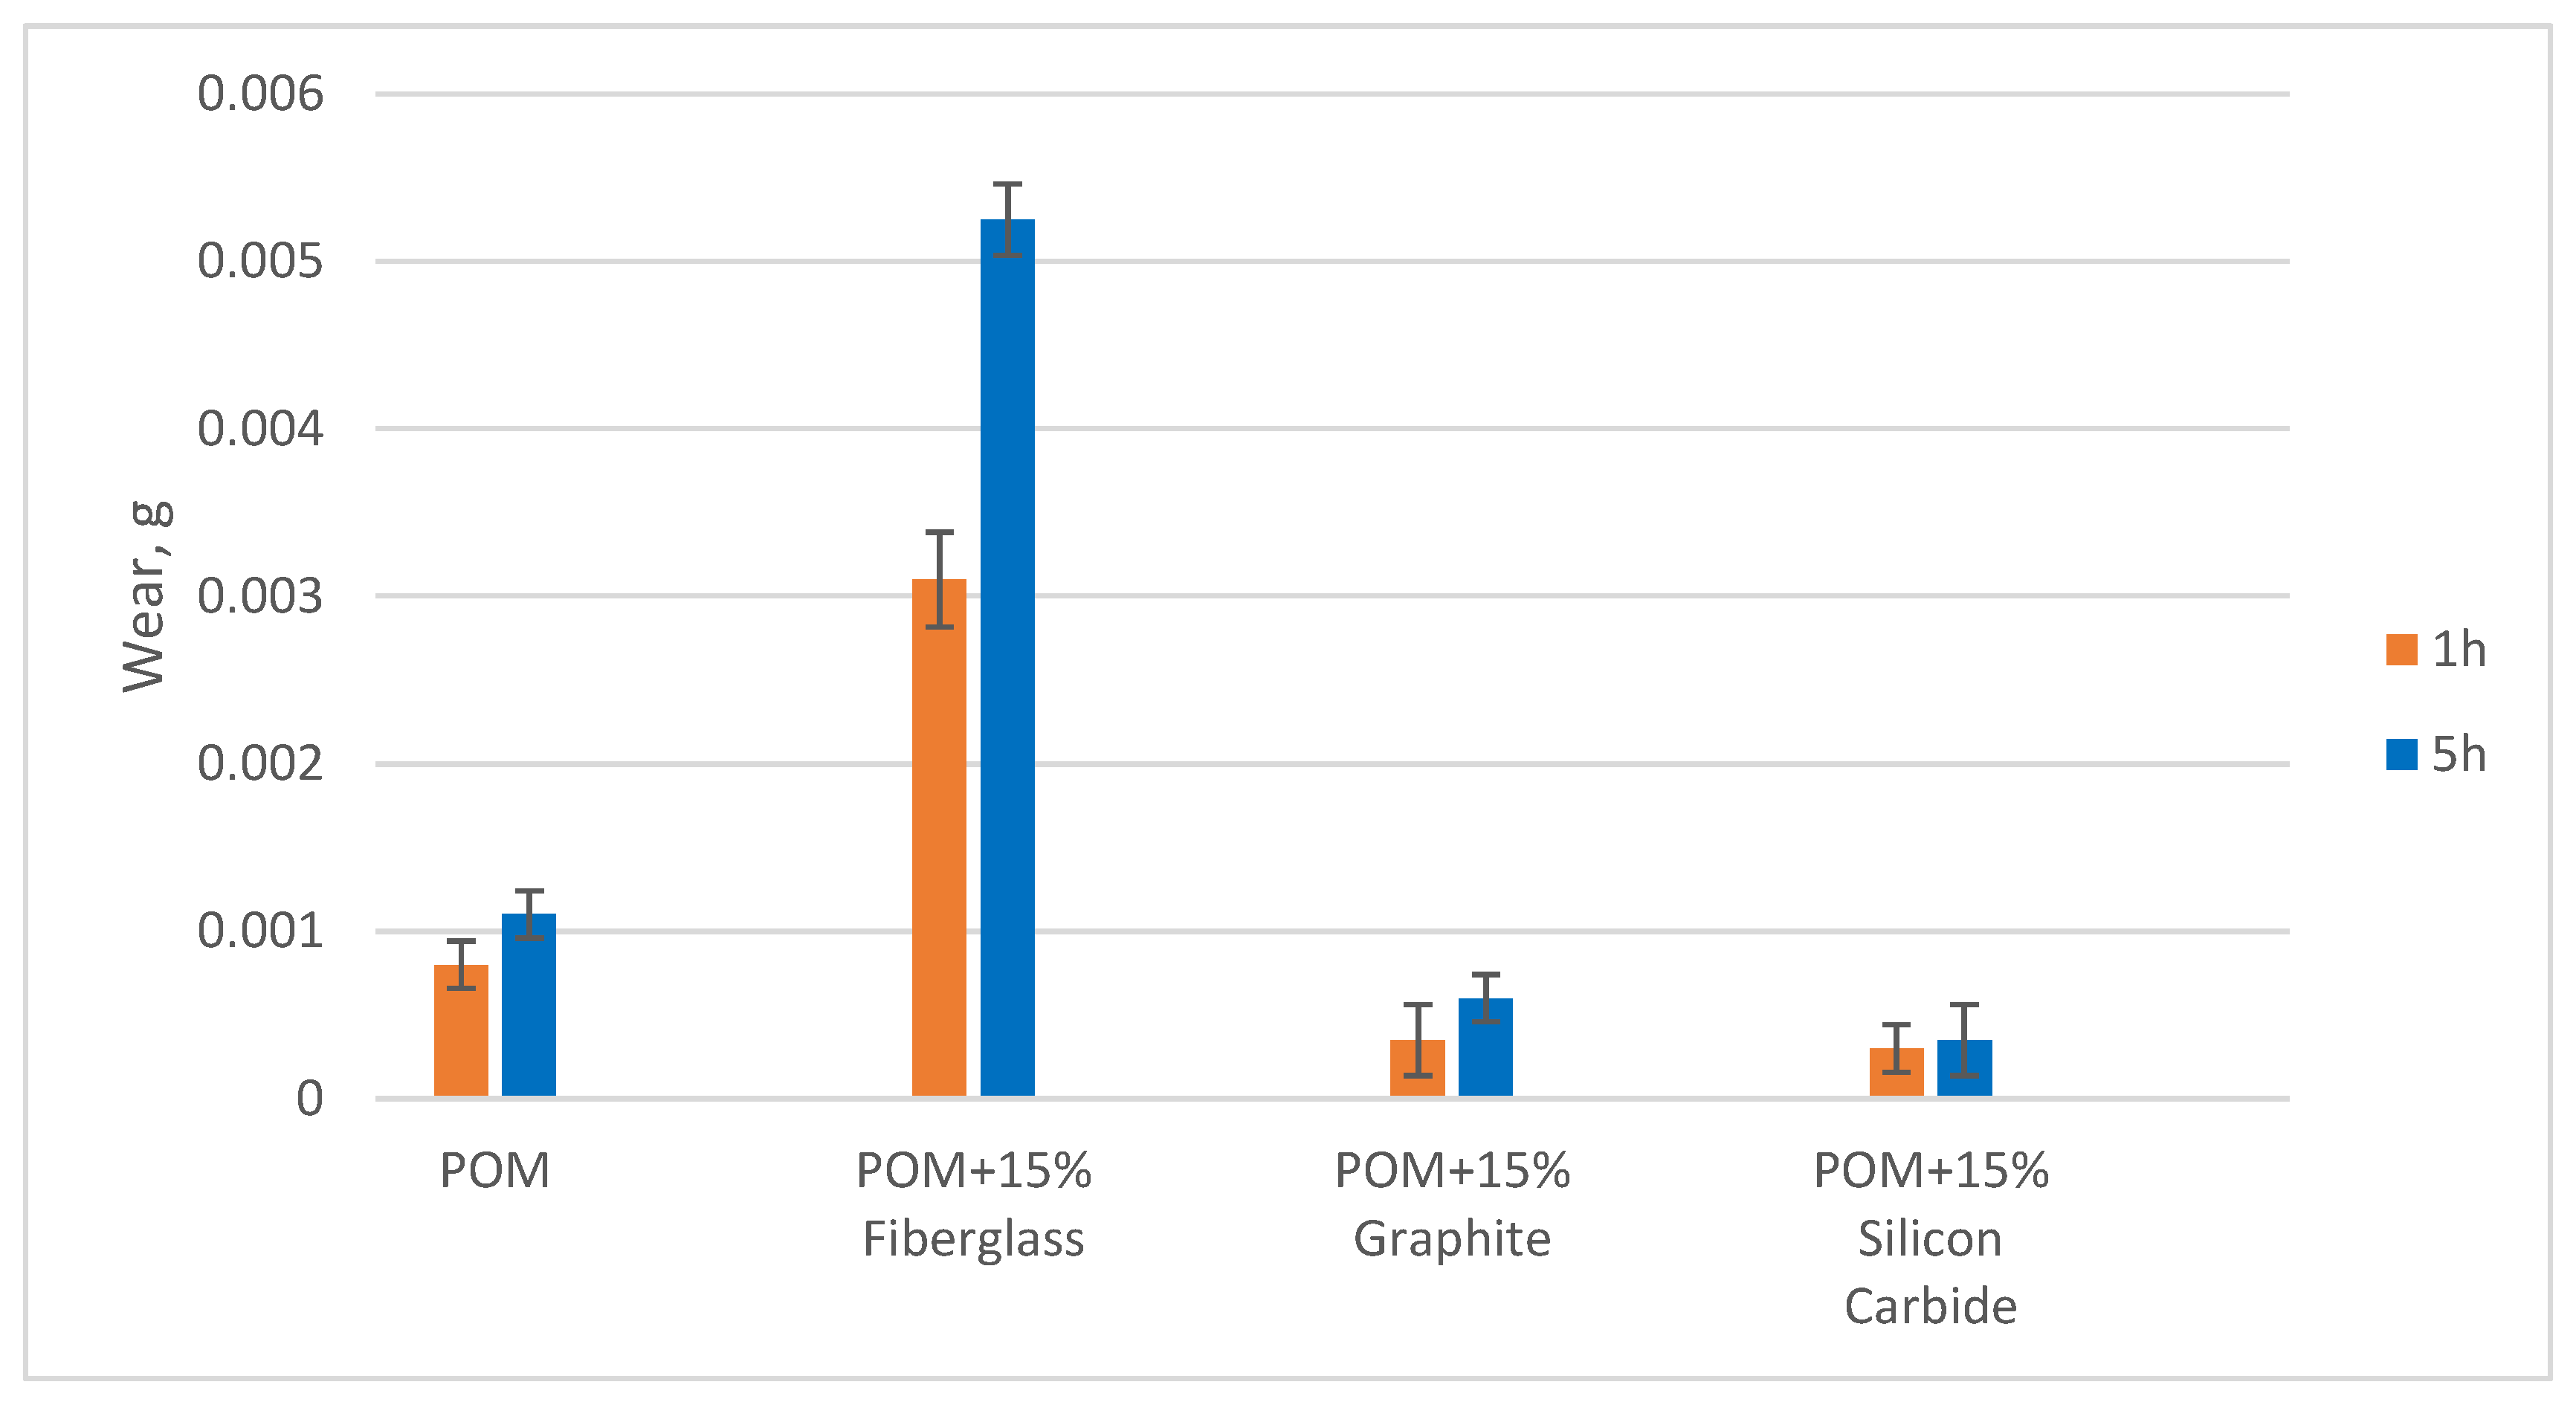
3.3. Hydroabrasion Test Results
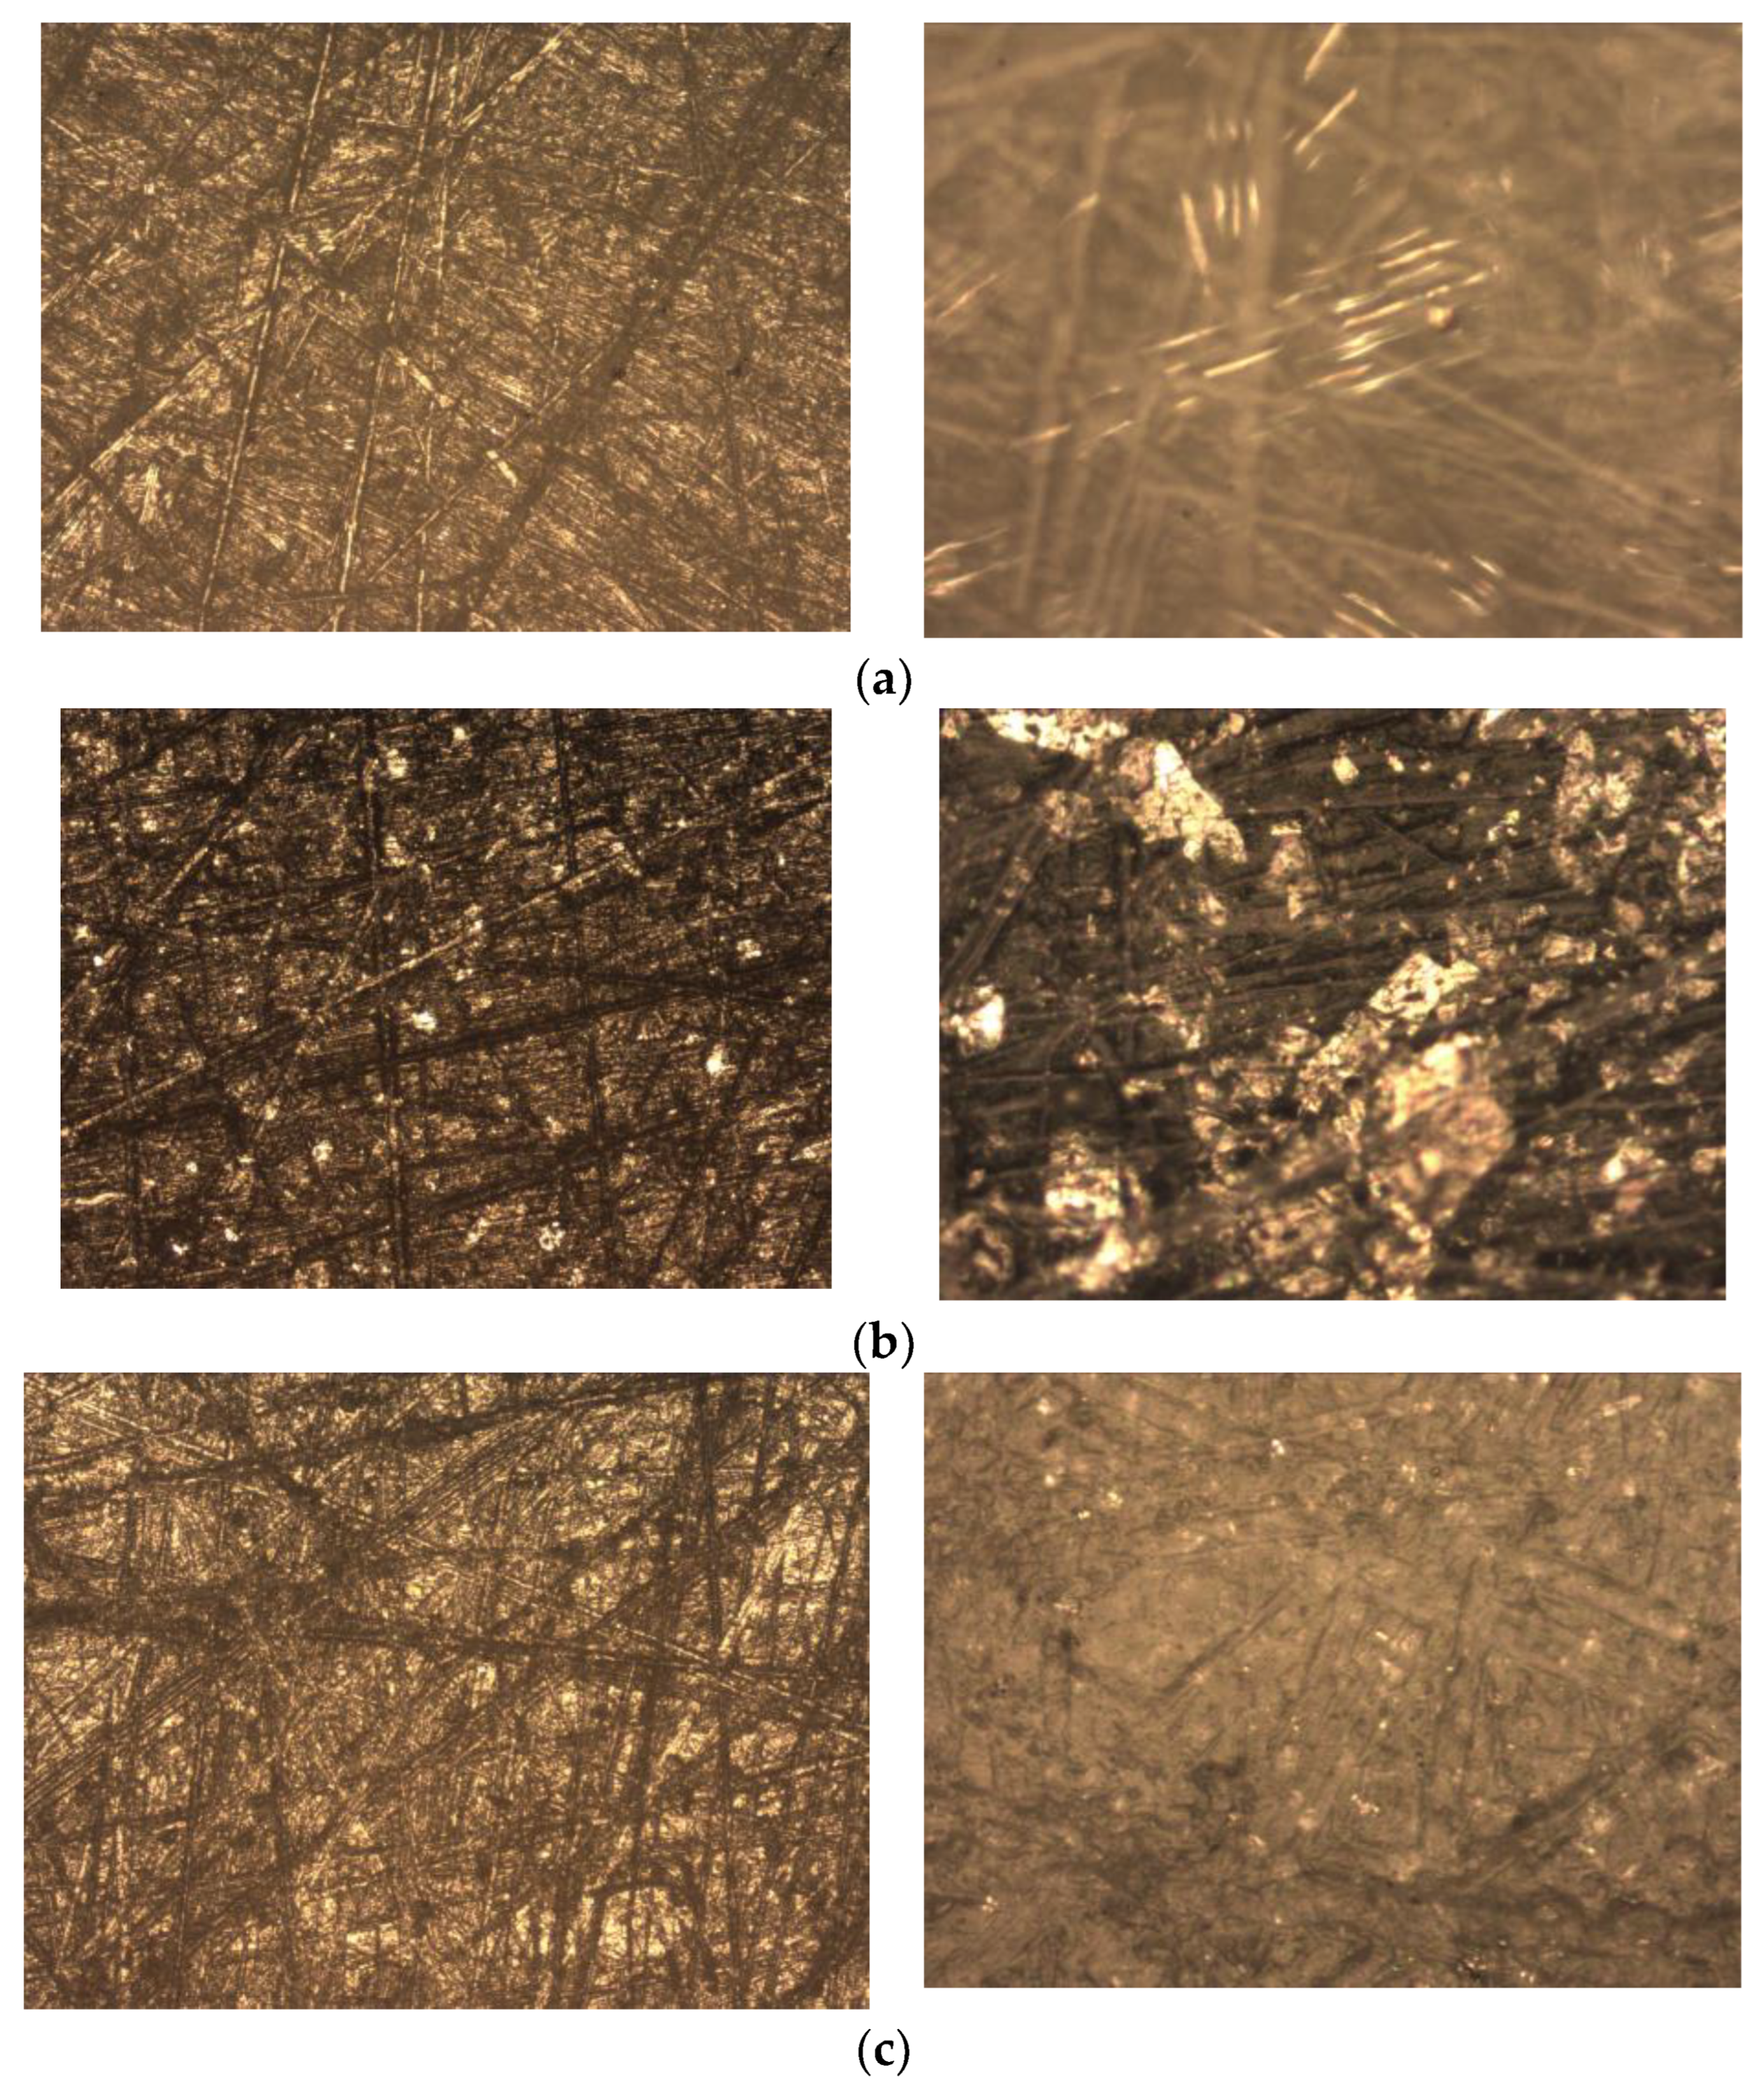
3.4. Results of Microscopy
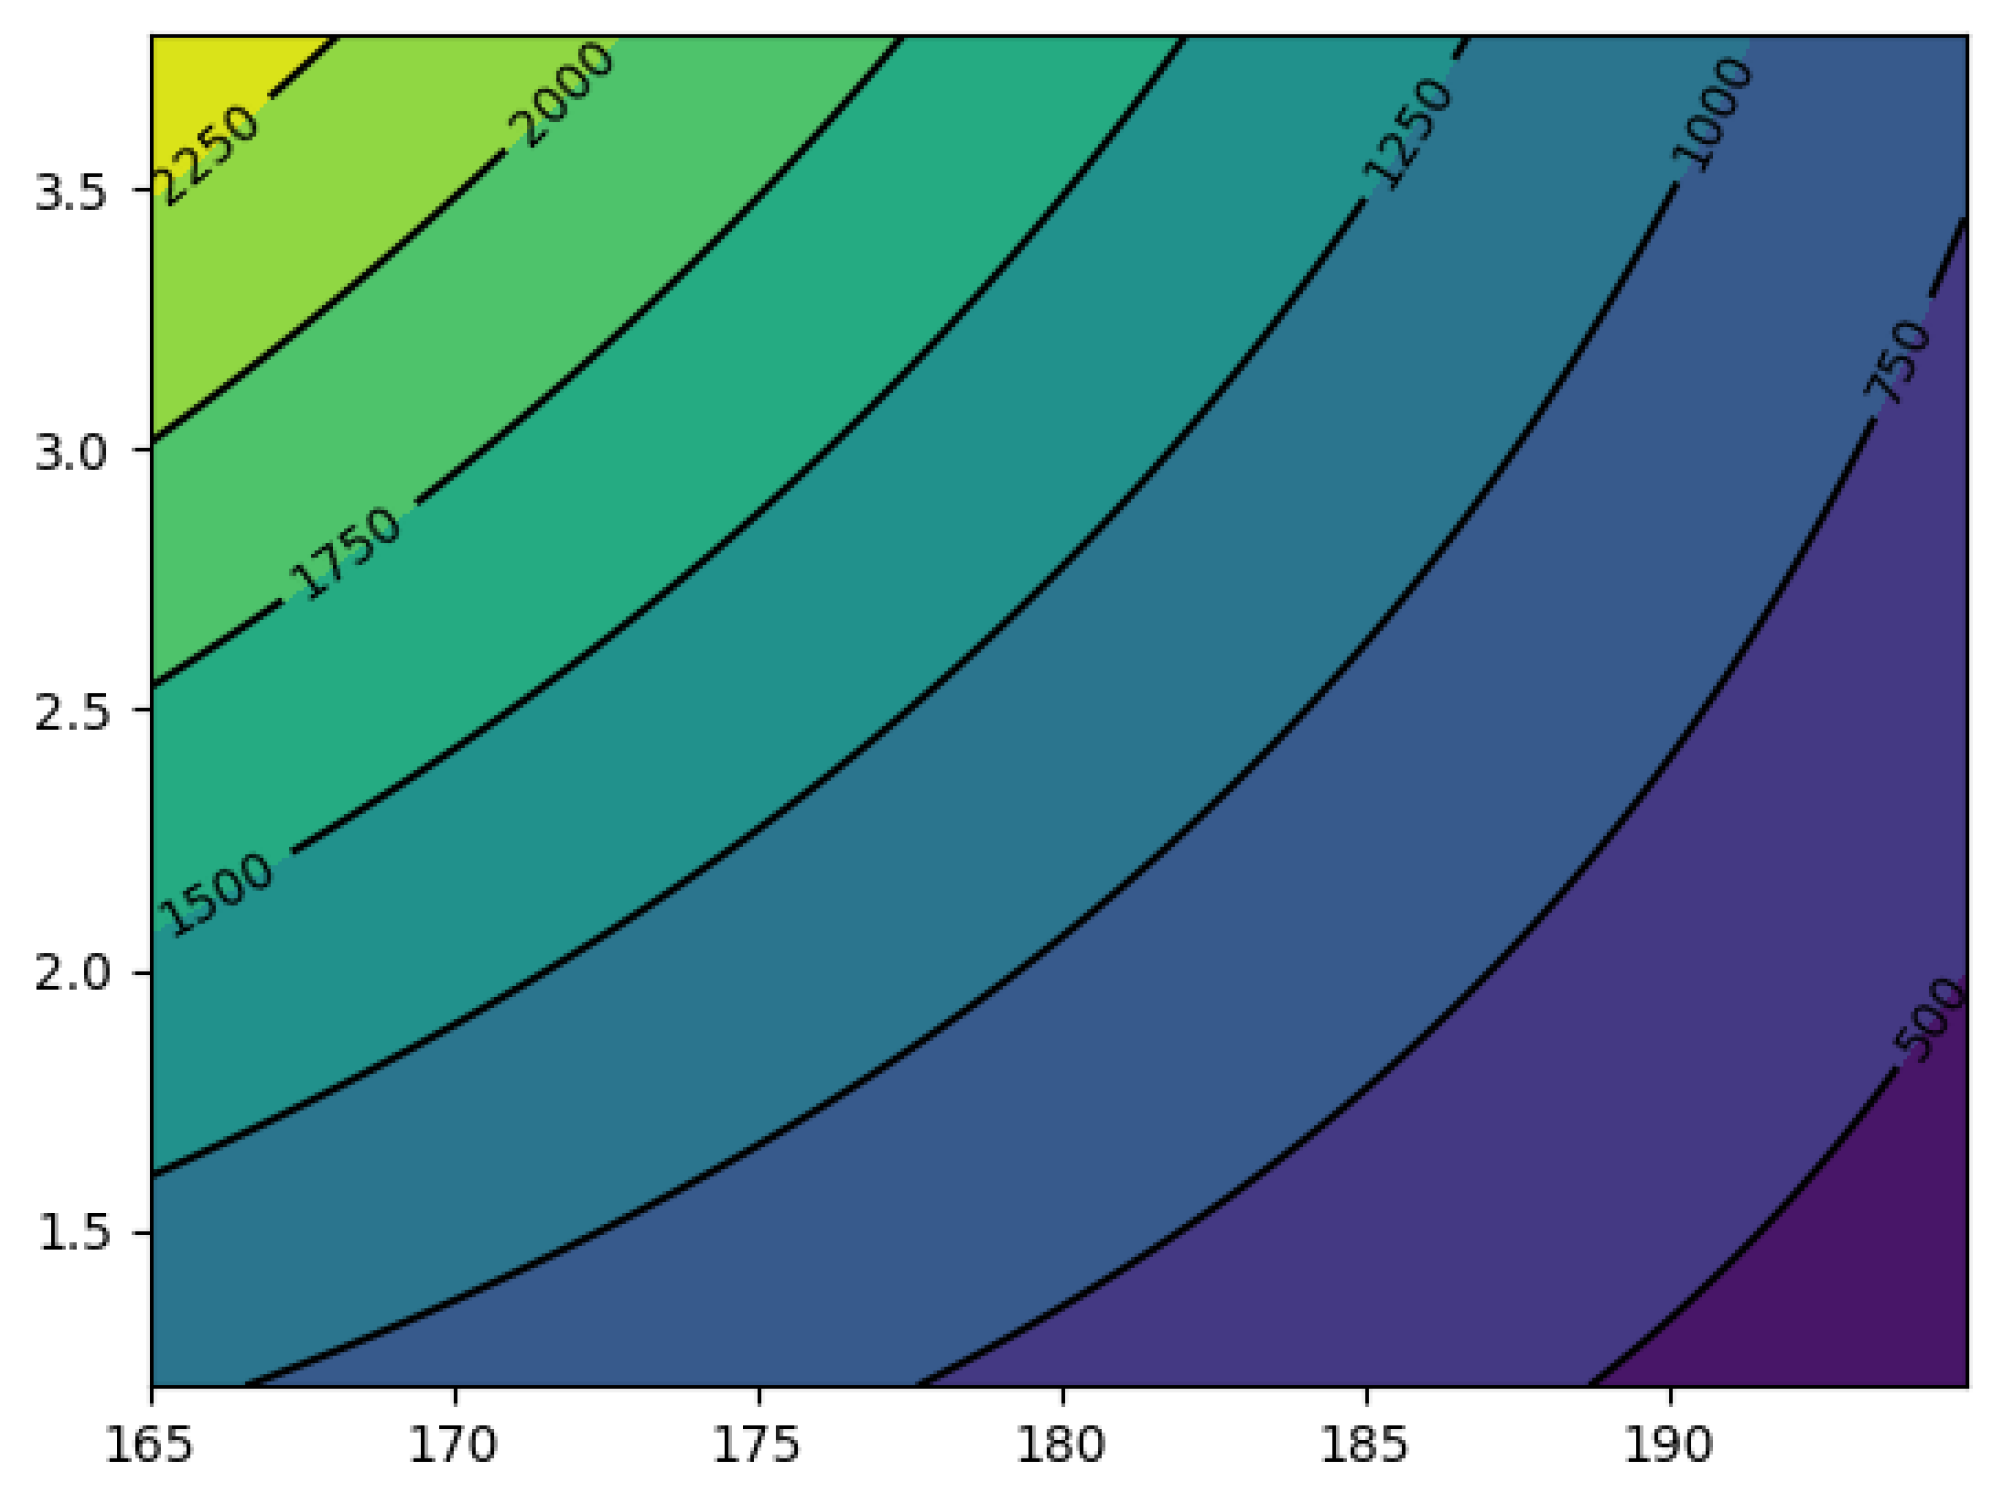
3.5. Test Results of a Full-Factor Planned Experiment
4. Conclusions
Author Contributions
Funding
Institutional Review Board Statement
Data Availability Statement
Conflicts of Interest
References
- Bargir, N.S.; Vadagaonkar, A.S.; Kamble, K.M.; Patil, A.R.; Metkari, V. Automatic Pesticide Spraying Machine. Int. J. Adv. Sci. Res. Eng. Trends 2021, 6, 78–81. [Google Scholar]
- Petukhova, M.S. Innovative development of the Russian grain sector. Russ. J. Econ. 2022, 8, 49–59. [Google Scholar] [CrossRef]
- Dorokhov, A.S.; Starostin, I.A.; Eshchin, A.V. Prospects for the development of methods and technical means of protection of agricultural plants. Agroengineering 2021, 1, 26–35. [Google Scholar] [CrossRef]
- Singh, A.K.; Bhatt, Y.C. Wear on circular orifice plate of hollow-cone type agrochemical spray nozzles. Agric. Eng. Int. CIGR J. 2018, 20, 78–84. [Google Scholar]
- Belov, S.V.; Danyleiko, Y.K.; Glinushkin, A.P.; Kalinitchenko, V.P.; Egorov, A.V.; Sidorov, V.A.; Konchekov, E.M.; Gudkov, S.V.; Dorokhov, A.S.; Lobachevsky, Y.P.; et al. An Activated Potassium Phosphate Fertilizer Solution for Stimulating the Growth of Agricultural Plants. Front. Phys. 2020, 8, 618320. [Google Scholar] [CrossRef]
- Ali, S.; Ullah, M.I.; Sajjad, A.; Shakeel, Q.; Hussain, A. Environmental and Health Effects of Pesticide Residues. Sustain. Agric. Rev. 48 Pestic. Occur. Anal. Remediat. 2021, 2, 311–336. [Google Scholar]
- Hazra, D.K.; Purkait, A. Role of pesticide formulations for sustainable crop protection and environment management: A review. J. Pharmacogn. Phytochem. 2019, 8, 686–693. [Google Scholar]
- Dorokhov, A.S.; Starostin, I.A.; Yeshchin, A.V.; Kurbanov, R.K. Technical means for chemical protection of plants: Status and prospects for development. Agroengineering 2022, 24, 12–18. [Google Scholar] [CrossRef]
- Tudi, M.; Wang, L.; Lyu, J.; Lyu, J.; Sadler, R.; Connell, D.; Chu, C.; Phung, D.T. Agriculture development, pesticide application and its impact on the environment. Int. J. Environ. Res. Public Health 2021, 18, 1112. [Google Scholar] [CrossRef]
- Butler, C.E.; Webb, D.A.; Western, N.M. The effect of different spray liquids on the foliar retention of agricultural sprays by wheat plants in a canopy. Pest Manag. Sci. 2004, 60, 786–794. [Google Scholar] [CrossRef]
- Chen, S.; Lan, Y.; Zhou, Z. Research advances of the drift reducing technologies in application of agricultural aviation spraying. Int. J. Agric. Biol. Eng. 2021, 5, 1–10. [Google Scholar] [CrossRef]
- Liliane, T.N.; Charles, M.S. Factors affecting yield of crops. In Agronomy-Climate Change & Food Security; IntechOpen: London, UK, 2020; p. 9. [Google Scholar]
- Lake, J.R. The effect of drop size and velocity on the performance of agricultural sprays. Pestic. Sci. 1977, 8, 515–520. [Google Scholar] [CrossRef]
- Vulshinskaya, I.; Glytyan, K.; Stepanchenko, V.; Ugryumov, E. Methods for improving the wear resistance of machine parts operating under conditions of abrasive wear. Sci. Herit. 2021, 66, 39–41. [Google Scholar]
- McCoy, M.; Moyer, M.; Hoheisel, G.A. Common Interchangeable Nozzles for Perennial Crop Canopy Sprayers; Washington State University Extension: Moses Lake, WA, USA, 2020. [Google Scholar]
- Leonov, O.A.; Temasova, G.N.; Malykha, E.F. Methodology for assessing external losses of repair enterprises of the agro-industrial complex when implementing a quality management system. J. Phys. Conf. Ser. 2020, 1679, 52059. [Google Scholar] [CrossRef]
- Babii, A. Study of the efficiency of working mixture application in chemical crop protection. Ternopil Natl. Tech. Univ. 2020, 98, 99–109. [Google Scholar] [CrossRef]
- Chethan, C.R.; Singh, P.K.; Dubey, R.P.; Subhash, C.; Dibakar, G. Herbicide application methologies: Influence of nozzle selection? Droplet size and spray drift on effective spraying—A review. Innov. Farming 2019, 4, 45–53. [Google Scholar]
- Rittner, T.; Țenu, I.; Marian, O. Researches on the reliability of spraying machines in vineyards and orchards. Acta Univ. Sapientiae Agric. Environ. 2018, 10, 105–112. [Google Scholar] [CrossRef]
- Wang, L.; Zhang, N.; Slocombe, J.W.; Thierstein, G.E.; Kuhlman, D.K. Experimental Analysis of Spray Distribution Pattern Uniformity for Agricultural Nozzles. Appl. Eng. Agric. 1995, 11, 51–55. [Google Scholar] [CrossRef]
- Hall, F.R.; Chapple, A.C.; Downer, R.A.; Kirchner, L.M.; Thacker, J.R.M. Pesticide application as affected by spray modifiers. Pestic. Sci. 1993, 38, 123–133. [Google Scholar] [CrossRef]
- Sviridov, A.S.; Kataev, Y.V.; Zagoruiko, M.G. Analysis of sprayer types of agricultural sprayers. Agrar. Sci. J. 2021, 6, 96–100. [Google Scholar] [CrossRef]
- Mahmud, M.S.A.; Abidin, M.S.Z.; Emmanuel, A.A.; Hasan, H.S.A. Robotics and automation in agriculture: Present and future applications. Appl. Model. Simul. 2020, 4, 130–140. [Google Scholar]
- Luftl, S.; Richaud, E. Chemical resistance of polyoxymethylene. In Handbook on Polyoxymethylenes: Structure, Properties, Applications and Their Nanocomposites; Wiley and Sons: Hoboken, NJ, USA, 2014; pp. 277–299. [Google Scholar]
- Starzhinsky, V.E.; Shilko, S.V.; Shalobaev, E.V. Technology of production of gears from thermoplastic polymeric materials (review). Polym. Mater. Technol. 2018, 4, 6–31. [Google Scholar]
- Borisov, G.A.; Kolodyazhnaya, I.N. Promising polymer-based structural materials for agricultural machinery applications. Bull. P.A. Kostychev Ryazan State Agrotechnological Univ. 2010, 4, 66–68. [Google Scholar]
- Kolodyazhnaya, I.N.; Borisov, A.G. Increasing the durability of the potato digger support roller by reconstructing the bearing unit. Proc. GOSNITI 2011, 108, 115–117. [Google Scholar]
- Yu, G.; Liu, H.; Mao, K.; Zhu, C.; Lu, Z. Examination on the wear process of polyformaldehyde gears under dry and lubricated conditions. Friction 2021, 9, 538–550. [Google Scholar] [CrossRef]
- He, J.; Wang, Q.; Yao, B.; Ho, J. Mechanical properties of high strength POM-FRCC and its performance under elevated temperatures. Constr. Build. Mater. 2021, 290, 123177. [Google Scholar] [CrossRef]
- Hsissou, R.; Seghiri, R.; Benzekri, Z.; Hilali, M.; Rafik, M.; Elharfi, A. Polymer composite materials: A comprehensive review. Compos. Struct. 2021, 262, 113640. [Google Scholar] [CrossRef]
- Rueda, M.M.; Auscher, M.C.; Fulchiron, R.; Périé, T.; Martin, G.; Sonntag, P.; Cassagnau, P. Rheology and applications of highly filled polymers: A review of current understanding. Prog. Polym. Sci. 2017, 66, 22–53. [Google Scholar] [CrossRef]
- Mostovoy, A.; Bekeshev, A.; Tastanova, L.; Akhmetova, M.; Bredihin, P.; Kadykova, Y. The effect of dispersed filler on mechanical and physicochemical properties of polymer composites. Polym. Polym. Compos. 2021, 29, 583–590. [Google Scholar] [CrossRef]
- Harito, C.; Bavykin, D.V.; Yuliarto, B.; Dipojono, H.K.; Walsh, F.C. Polymer nanocomposites having a high filler content: Synthesis, structures, properties, and applications. Nanoscale 2019, 11, 4653–4682. [Google Scholar] [CrossRef] [PubMed]
- Katsa, G.S. Fillers for Polymer Composite Materials: Reference Manual; Himiya: Moscow, Russia, 1981; p. 736. [Google Scholar]
- Agrawal, A.; Chandraker, S.; Sharma, A. Physical, mechanical and sliding wear behavior of solid glass microsphere filled epoxy composites. Mater. Today Proc. 2020, 29, 420–426. [Google Scholar] [CrossRef]
- Starshova, Y.V.; Panfilov, D.A. Application of microspheres for regulation of properties of polymer composite materials. Plast. Masses 2023, 1, 37–40. [Google Scholar] [CrossRef]
- Kolosova, A.S.; Sokolskaya, M.K.; Vitkalova, I.A.; Torlova, A.S.; Pikalov, E.S. Modern polymer composites and their applications. Int. J. Appl. Fundam. Res. 2018, 5, 245–256. [Google Scholar]
- Gordienko, V.P.; Kovaleva, G.N. Mechanochemical effects on structure and wear resistance of thermoplastic systems: Polyethylene-carbides. Plast. Masses 2014, 1, 40–43. [Google Scholar]
- Sharma, M.; Sharma, R.; Sharma, S.C. A review on fibres and fillers on improving the mechanical behaviour of fibre reinforced polymer composites. Mater. Today Proc. 2021, 46, 6482–6489. [Google Scholar] [CrossRef]
- Galkina, E.A. Influence of storage conditions of fibre fillers on the quality of products from polymer composite materials. Repair. Restor. Mod. 2021, 2, 41–44. [Google Scholar]
- Rumyantsev, A.N.; Filippov, V.N. Polymer composites and their application in practice. Bull. Pskov State Univ. Ser. Nat. Phys. Math. Sci. 2019, 14, 116–121. [Google Scholar]
- Khristoforov, A.I.; Khokhlova, A.V. Antifriction fillers for polymers. Modern scientific researches. In Proceedings of the Collection of Scientific Papers on the Materials of VIII International Scientific-Practical Conference, Anapa, Russia, 17 May 2019; pp. 36–39. [Google Scholar]
- Panin, S.V.; Kornienko, L.A.; Xuan, T.N.; Poltaranin, M.A.; Ivanova, L.R.; Shilko, S.V. Wear resistance of composites based on supermolecular polyethylene reinforced with graphite of different nature. Izv. Vyss. Uchebnykh Uchebnykh Obraz. Ser. Chem. Chem. Technol. 2015, 58, 81–86. [Google Scholar]
- Gordienko, V.P.; Salnikov, V.G.; Podlesnyi, R.V.; Kaspersky, A.V. Hardness and wear resistance of some polyolefins with molybdenum disulphide additives. Plast. Masses 2009, 10, 13–15. [Google Scholar]
- Salem, A.; Guezmil, M.; Bensalah, W.; Mezlini, S. Tribological behavior of molybdenum disulphide particles-high density polyethylene composite. Mater. Res. Express 2019, 6, 075402. [Google Scholar] [CrossRef]
- ISO 20753/2008; Plastics—Test Specimens. ISO: Geneva, Switzerland, 2008.
- Borisevich, V.D.; Shemyakinsky, V.D. Hydroabrasive wear of various coatings. SPbPU Science Week. In Proceedings of the Scientific Conference with International Participation, St Petersburg, Russia, 18–23 November 2019; 2020, pp. 206–208. [Google Scholar]
- Bansal, A.; Singla, J.; Pandey, S.; Raj, P. Design and development of high-velocity submerged water jet cavitation erosion test rig. In Manufacturing Engineering: Select Proceedings of CPIE 2019; Springer: Berlin/Heidelberg, Germany, 2020; pp. 85–93. [Google Scholar]
- Perec, A. Research into the disintegration of abrasive materials in the abrasive water jet machining process. Materials 2021, 14, 3940. [Google Scholar] [CrossRef] [PubMed]
- Kukovinets, A.V. A complete factorial experiment to study a fragmented method for object boundary detection on a digital image. Colloq.—J. 2020, 1, 7–10. [Google Scholar]
- Momzyakov, A.A.; Deberdeev, T.R.; Deberdeev, R.Y. A full factorial experiment of calcium stearate mechanosynthesis on modified screw equipment. Butl. Rep. 2019, 58, 127–132. [Google Scholar]
- Gerasimova, T.S. Comparative analysis of methods of planning experiments. In the World of Scientific Discoveries. In Proceedings of the III International Student Scientific Conference, Ulyanovsk, Russia, 22–23 May 2019; pp. 196–200. [Google Scholar]
- Slavkina, V.; Goncharova, Y.; Sviridov, A. Influence of the type quantity of fillers on the abrasive wear of composite materials. AIP Conf. Proc. 2023, 2697, 040006. [Google Scholar]


| Characteristic | Filler Type | ||||||||
|---|---|---|---|---|---|---|---|---|---|
| Fibreglass | Silicon Carbide | Graphite | |||||||
| Volume filling percentage, % | 10 | 15 | 20 | 10 | 15 | 20 | 10 | 15 | 20 |
| Particle size | l = 0.2 mm | d = 5–10 μm | d = 1.5 mm | ||||||
| Size | Value, mm |
|---|---|
| Total length | 73 |
| Thickness working part | 2 |
| Length of the narrow part with parallel sides (working part) | 35 ± 1 |
| Large radius of curvature | 25 ± 1 |
| Small radius of curvature | 14.0 ± 0.5 |
| Head width | 12 ± 1 |
| Width of the narrow (working) part | 4.0 ± 0.4 |
| The Preparation | Consumption Rate | Volume of Water Used | The Amount of Preparation Needed | |
|---|---|---|---|---|
| Standard Concentration | Increased Concentration | |||
| Herbicide “Lazurite” | 0.5–1 kg/ha | 400 mL | 1 g | 5 g |
| Fungicide “Rakurs” | 0.2 L/ha | 500 mL | 0.5 mL | 2.5 mL |
| Insecticide Borei Neo | 0.1–0.2 L/ha | 500 mL | 0.5 mL | 2.5 mL |
| Sample Material | Sample Number | Weight of the Samples before the Test, g | Weight of the Samples after the Test, g | |
|---|---|---|---|---|
| 1 h | 5 h | |||
| POM | 1 | 0.2598 | 0.2591 | 0.2566 |
| 2 | 0.2647 | 0.2638 | 0.2601 | |
| POM + 15% Fiberglass | 1 | 0.3174 | 0.3145 | 0.3123 |
| 2 | 0.3221 | 0.3188 | 0.3167 | |
| POM + 15% Graphite | 1 | 0.3044 | 0.3042 | 0.3040 |
| 2 | 0.3043 | 0.3040 | 0.3036 | |
| POM + 15% Silicon Carbide | 1 | 0.3000 | 0.3001 | 0.2955 |
| 2 | 0.3045 | 0.3041 | 0.3040 | |
| Number of Experience | Experimental Data | ||||||
|---|---|---|---|---|---|---|---|
| x1 | x2 | x3 | y1 | y2 | y3 | yk | |
| 1 | 165.00 | 3.80 | 10.00 | 2401.57 | 2477.56 | 2455.86 | 2445.00 |
| 2 | 195.00 | 1.20 | 10.00 | 410.30 | 428.00 | 403.21 | 431.84 |
| 3 | 165.00 | 1.20 | 20.00 | 1064.27 | 1131.56 | 1121.48 | 1105.77 |
| 4 | 195.00 | 3.80 | 20.00 | 925.88 | 880.12 | 891.57 | 899.19 |
| 5 | 165.00 | 1.20 | 10.00 | 952.73 | 983.21 | 962.90 | 966.28 |
| 6 | 195.00 | 3.80 | 10.00 | 695.77 | 718.95 | 718.95 | 711.22 |
| 7 | 165.00 | 3.80 | 20.00 | 2510.08 | 2336.34 | 2336.34 | 2394.25 |
| 8 | 195.00 | 1.20 | 20.00 | 445.66 | 459.76 | 459.76 | 455.06 |
| Name | Value |
|---|---|
| Total dispersion | 82,426.22 |
| Maximum dispersion, Dk, max | 68,365.15 |
| Calculated Cochran criterion, GP | 0.8294102 |
| Tabular Cochran criterion, GT | 0.5157 |
| Homogeneity of dispersions | heterogeneous |
| 1638.774 | |
| 10,303.28 | |
| Fisher’s R-criterion Fp | 0.1591 |
| Fisher’s table criterion FT | ) |
| Adequacy of the mathematic model | The model is adequate (Fp < 1) |
Disclaimer/Publisher’s Note: The statements, opinions and data contained in all publications are solely those of the individual author(s) and contributor(s) and not of MDPI and/or the editor(s). MDPI and/or the editor(s) disclaim responsibility for any injury to people or property resulting from any ideas, methods, instructions or products referred to in the content. |
© 2024 by the authors. Licensee MDPI, Basel, Switzerland. This article is an open access article distributed under the terms and conditions of the Creative Commons Attribution (CC BY) license (https://creativecommons.org/licenses/by/4.0/).
Share and Cite
Slavkina, V.E.; Mirzaev, M.A.; Kuzmin, A.M.; Kutyrev, A.I.; Tuzhilin, S.P.; Denisov, V.A.; Kataev, Y.V. Testing of Polymer Composites for Manufacturing of Sprayer Nozzles. Polymers 2024, 16, 496. https://doi.org/10.3390/polym16040496
Slavkina VE, Mirzaev MA, Kuzmin AM, Kutyrev AI, Tuzhilin SP, Denisov VA, Kataev YV. Testing of Polymer Composites for Manufacturing of Sprayer Nozzles. Polymers. 2024; 16(4):496. https://doi.org/10.3390/polym16040496
Chicago/Turabian StyleSlavkina, Victoria E., Maksim A. Mirzaev, Anton M. Kuzmin, Alexey I. Kutyrev, Sergey P. Tuzhilin, Vyacheslav A. Denisov, and Yuriy V. Kataev. 2024. "Testing of Polymer Composites for Manufacturing of Sprayer Nozzles" Polymers 16, no. 4: 496. https://doi.org/10.3390/polym16040496
APA StyleSlavkina, V. E., Mirzaev, M. A., Kuzmin, A. M., Kutyrev, A. I., Tuzhilin, S. P., Denisov, V. A., & Kataev, Y. V. (2024). Testing of Polymer Composites for Manufacturing of Sprayer Nozzles. Polymers, 16(4), 496. https://doi.org/10.3390/polym16040496