
Designing Microparticles of Luteolin and Naringenin in Different Carriers via Supercritical Antisolvent Process


Abstract
1. Introduction
2. Materials and Methods
2.1. Materials
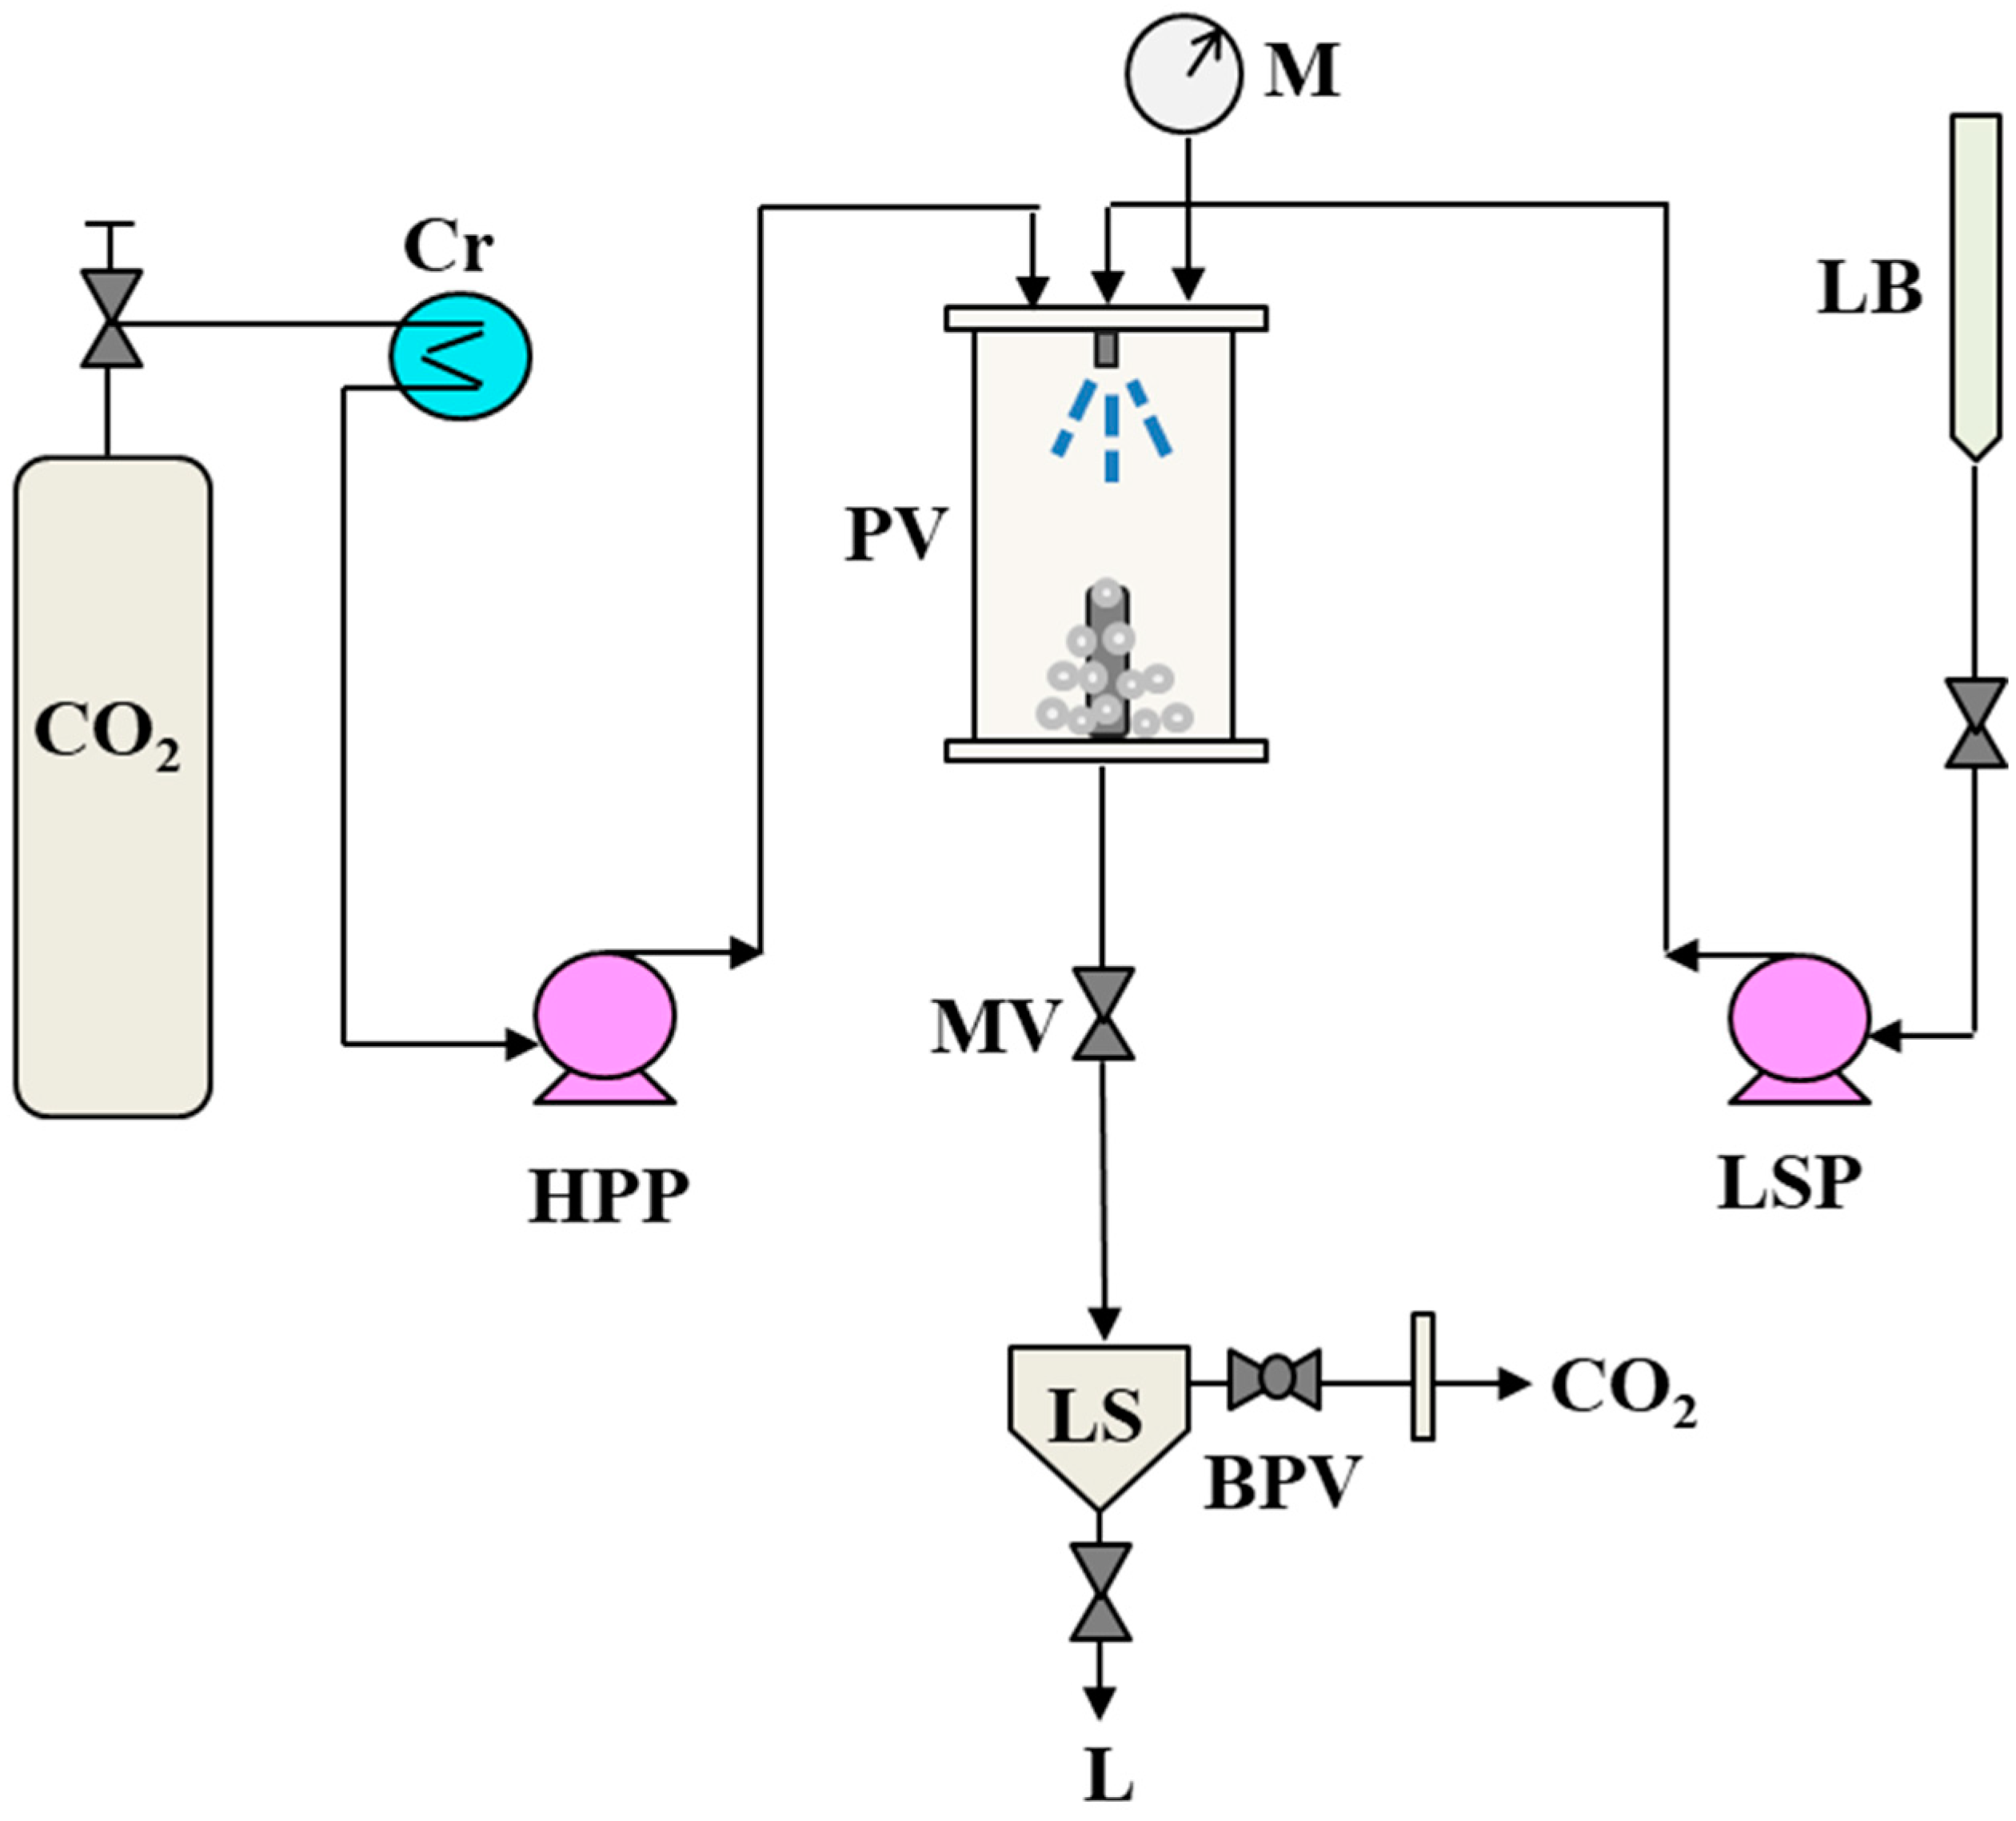
2.2. SAS Plant and Experimental Procedure
2.3. Analyses
2.3.1. Morphology of Powders and PSDs
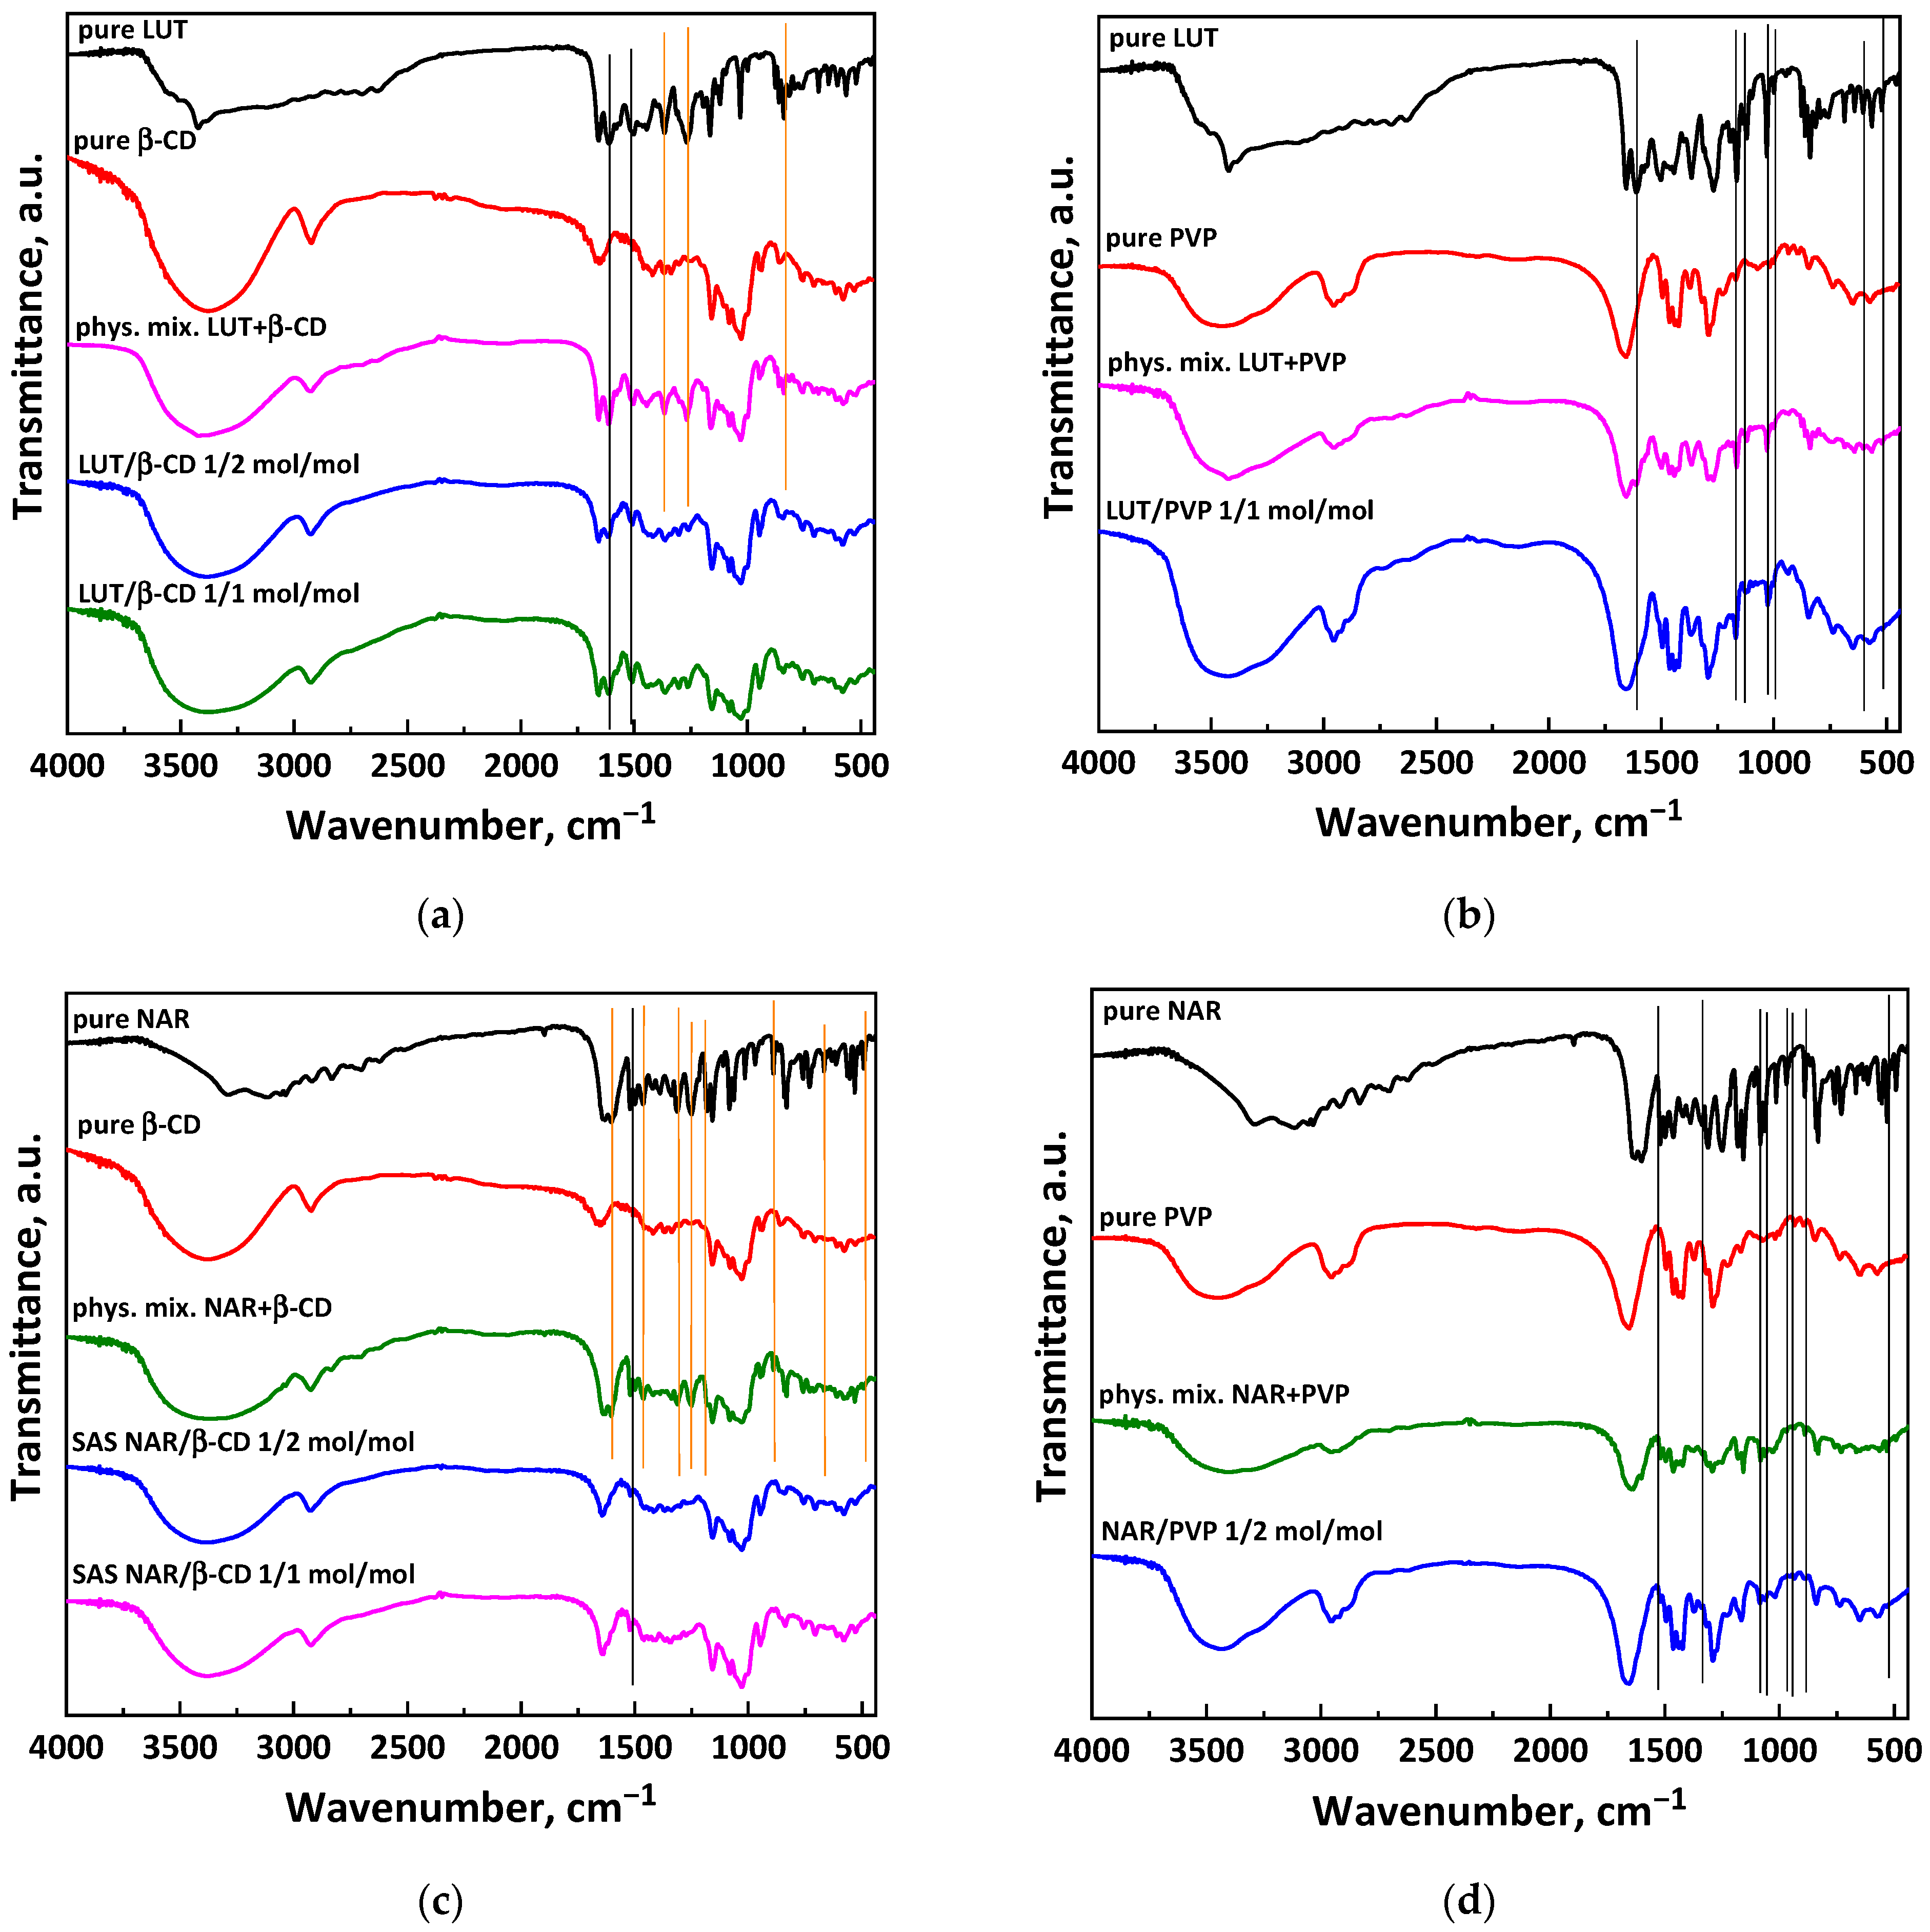
2.3.2. Infrared Spectroscopy
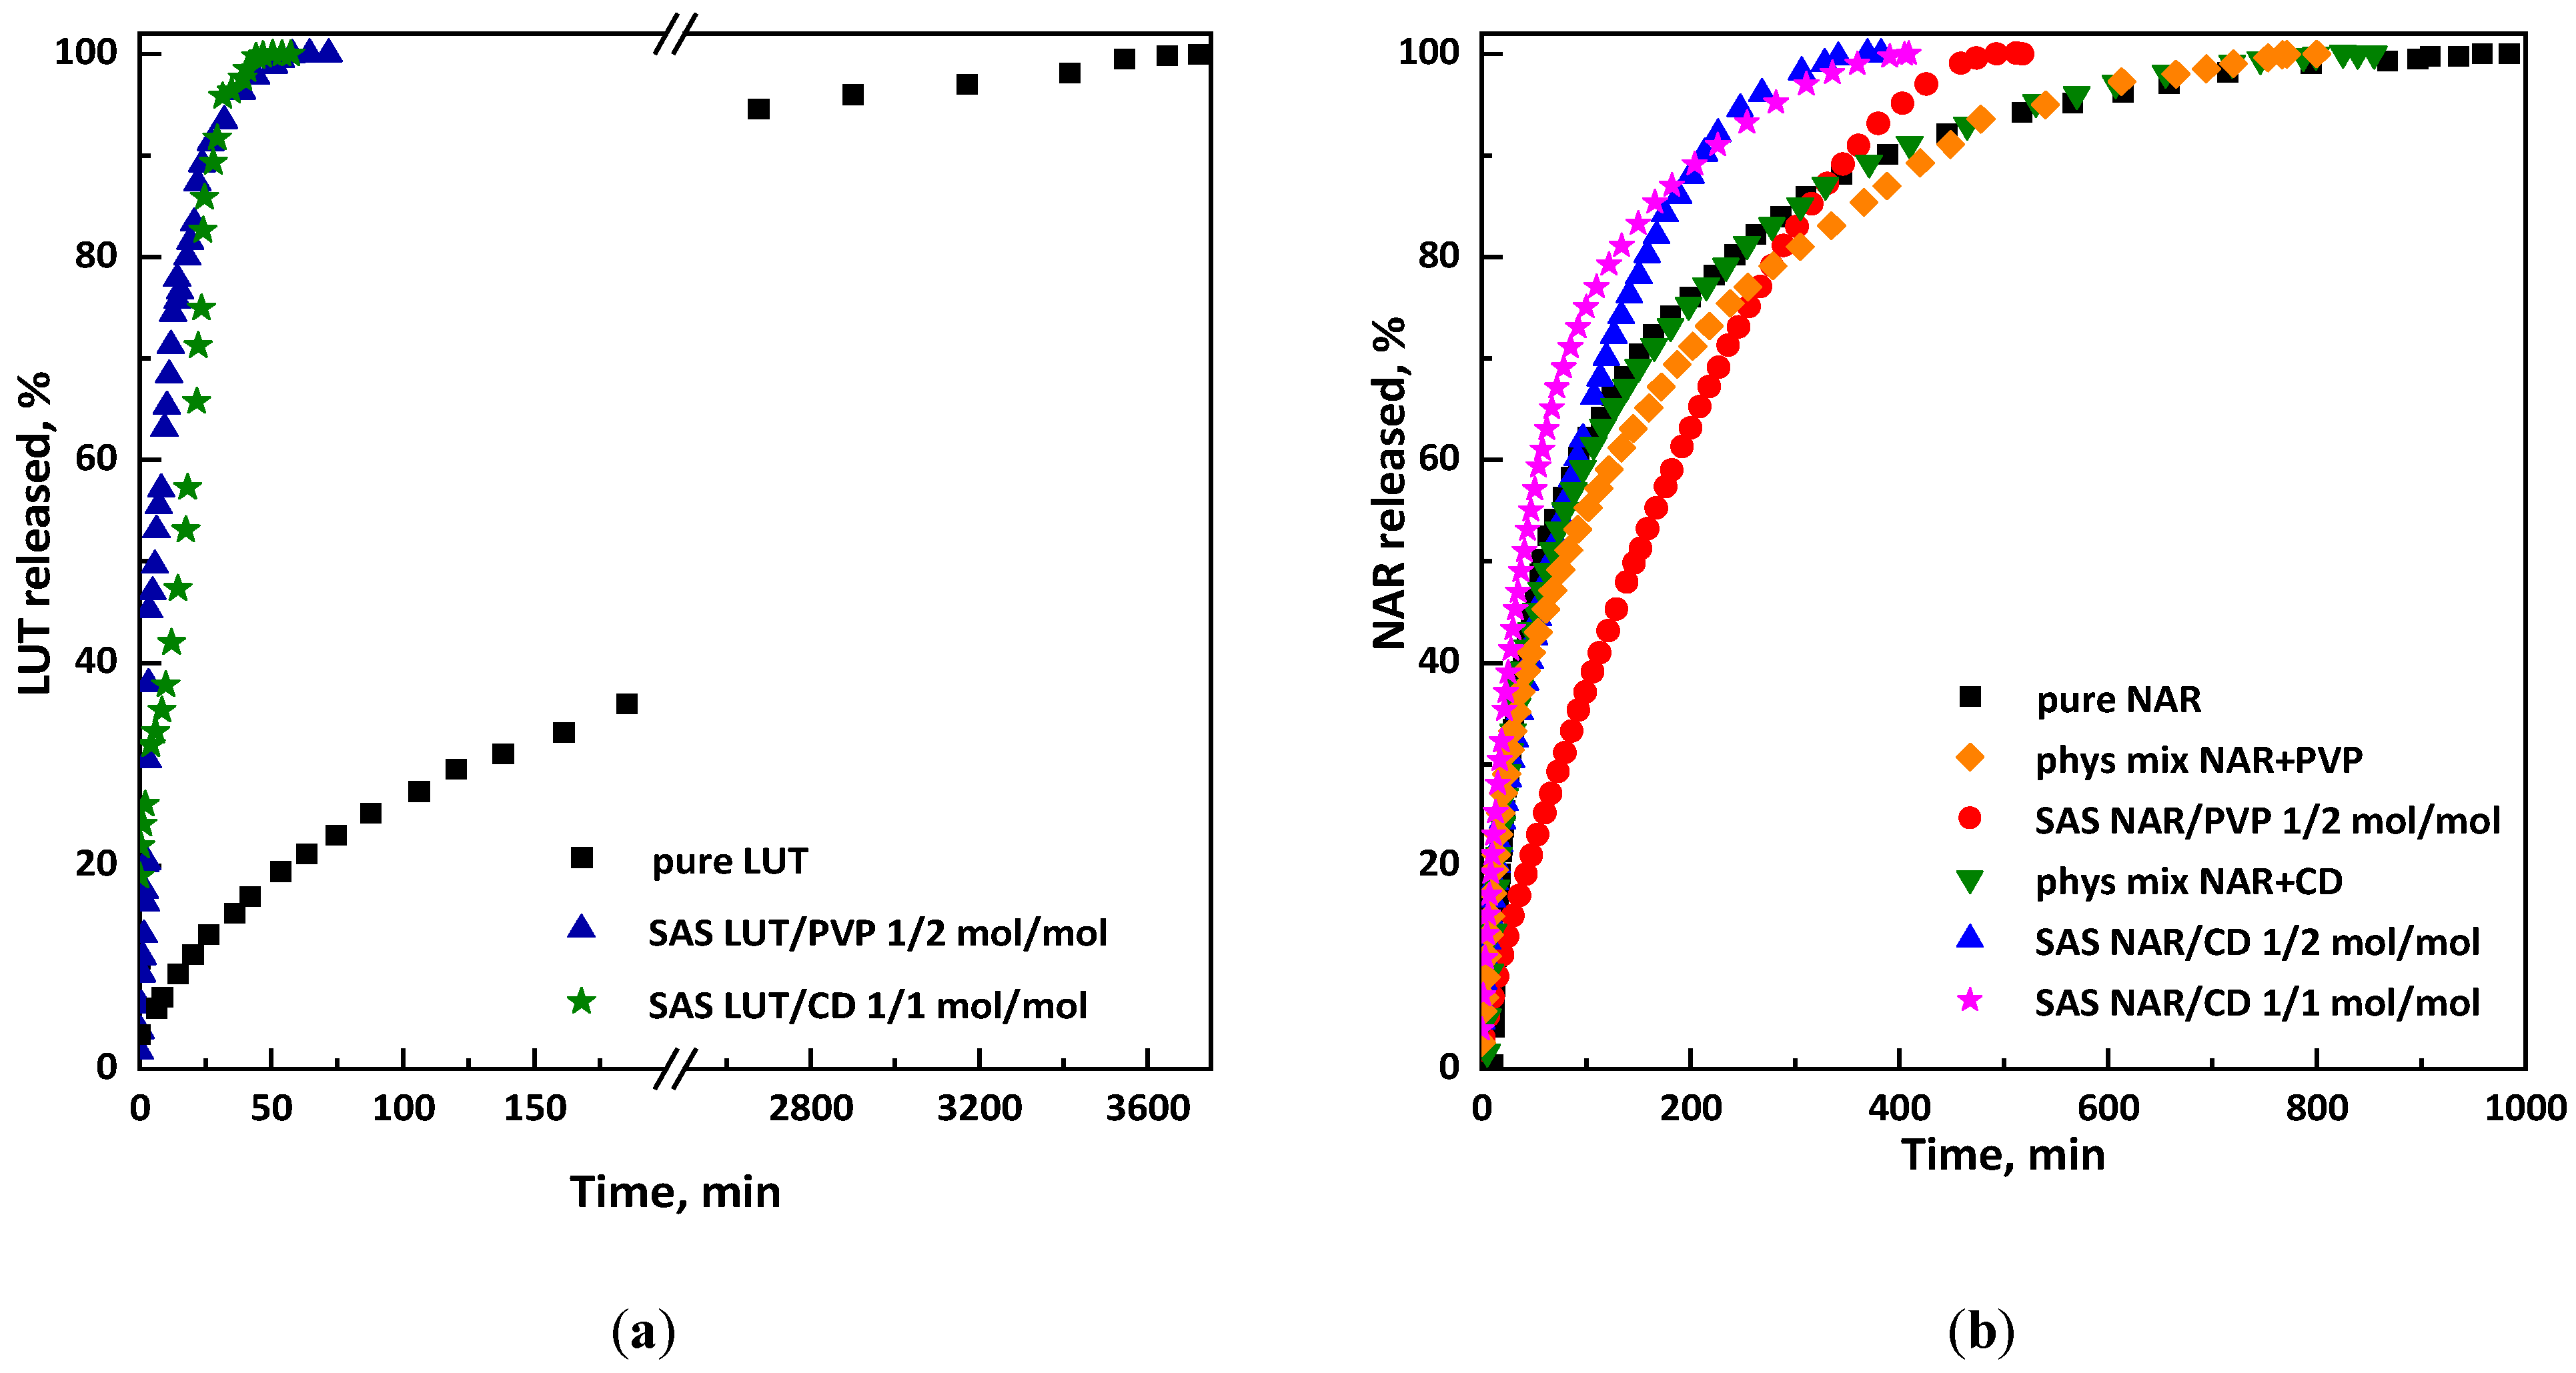
2.3.3. Dissolution Tests and Entrapment Efficiency
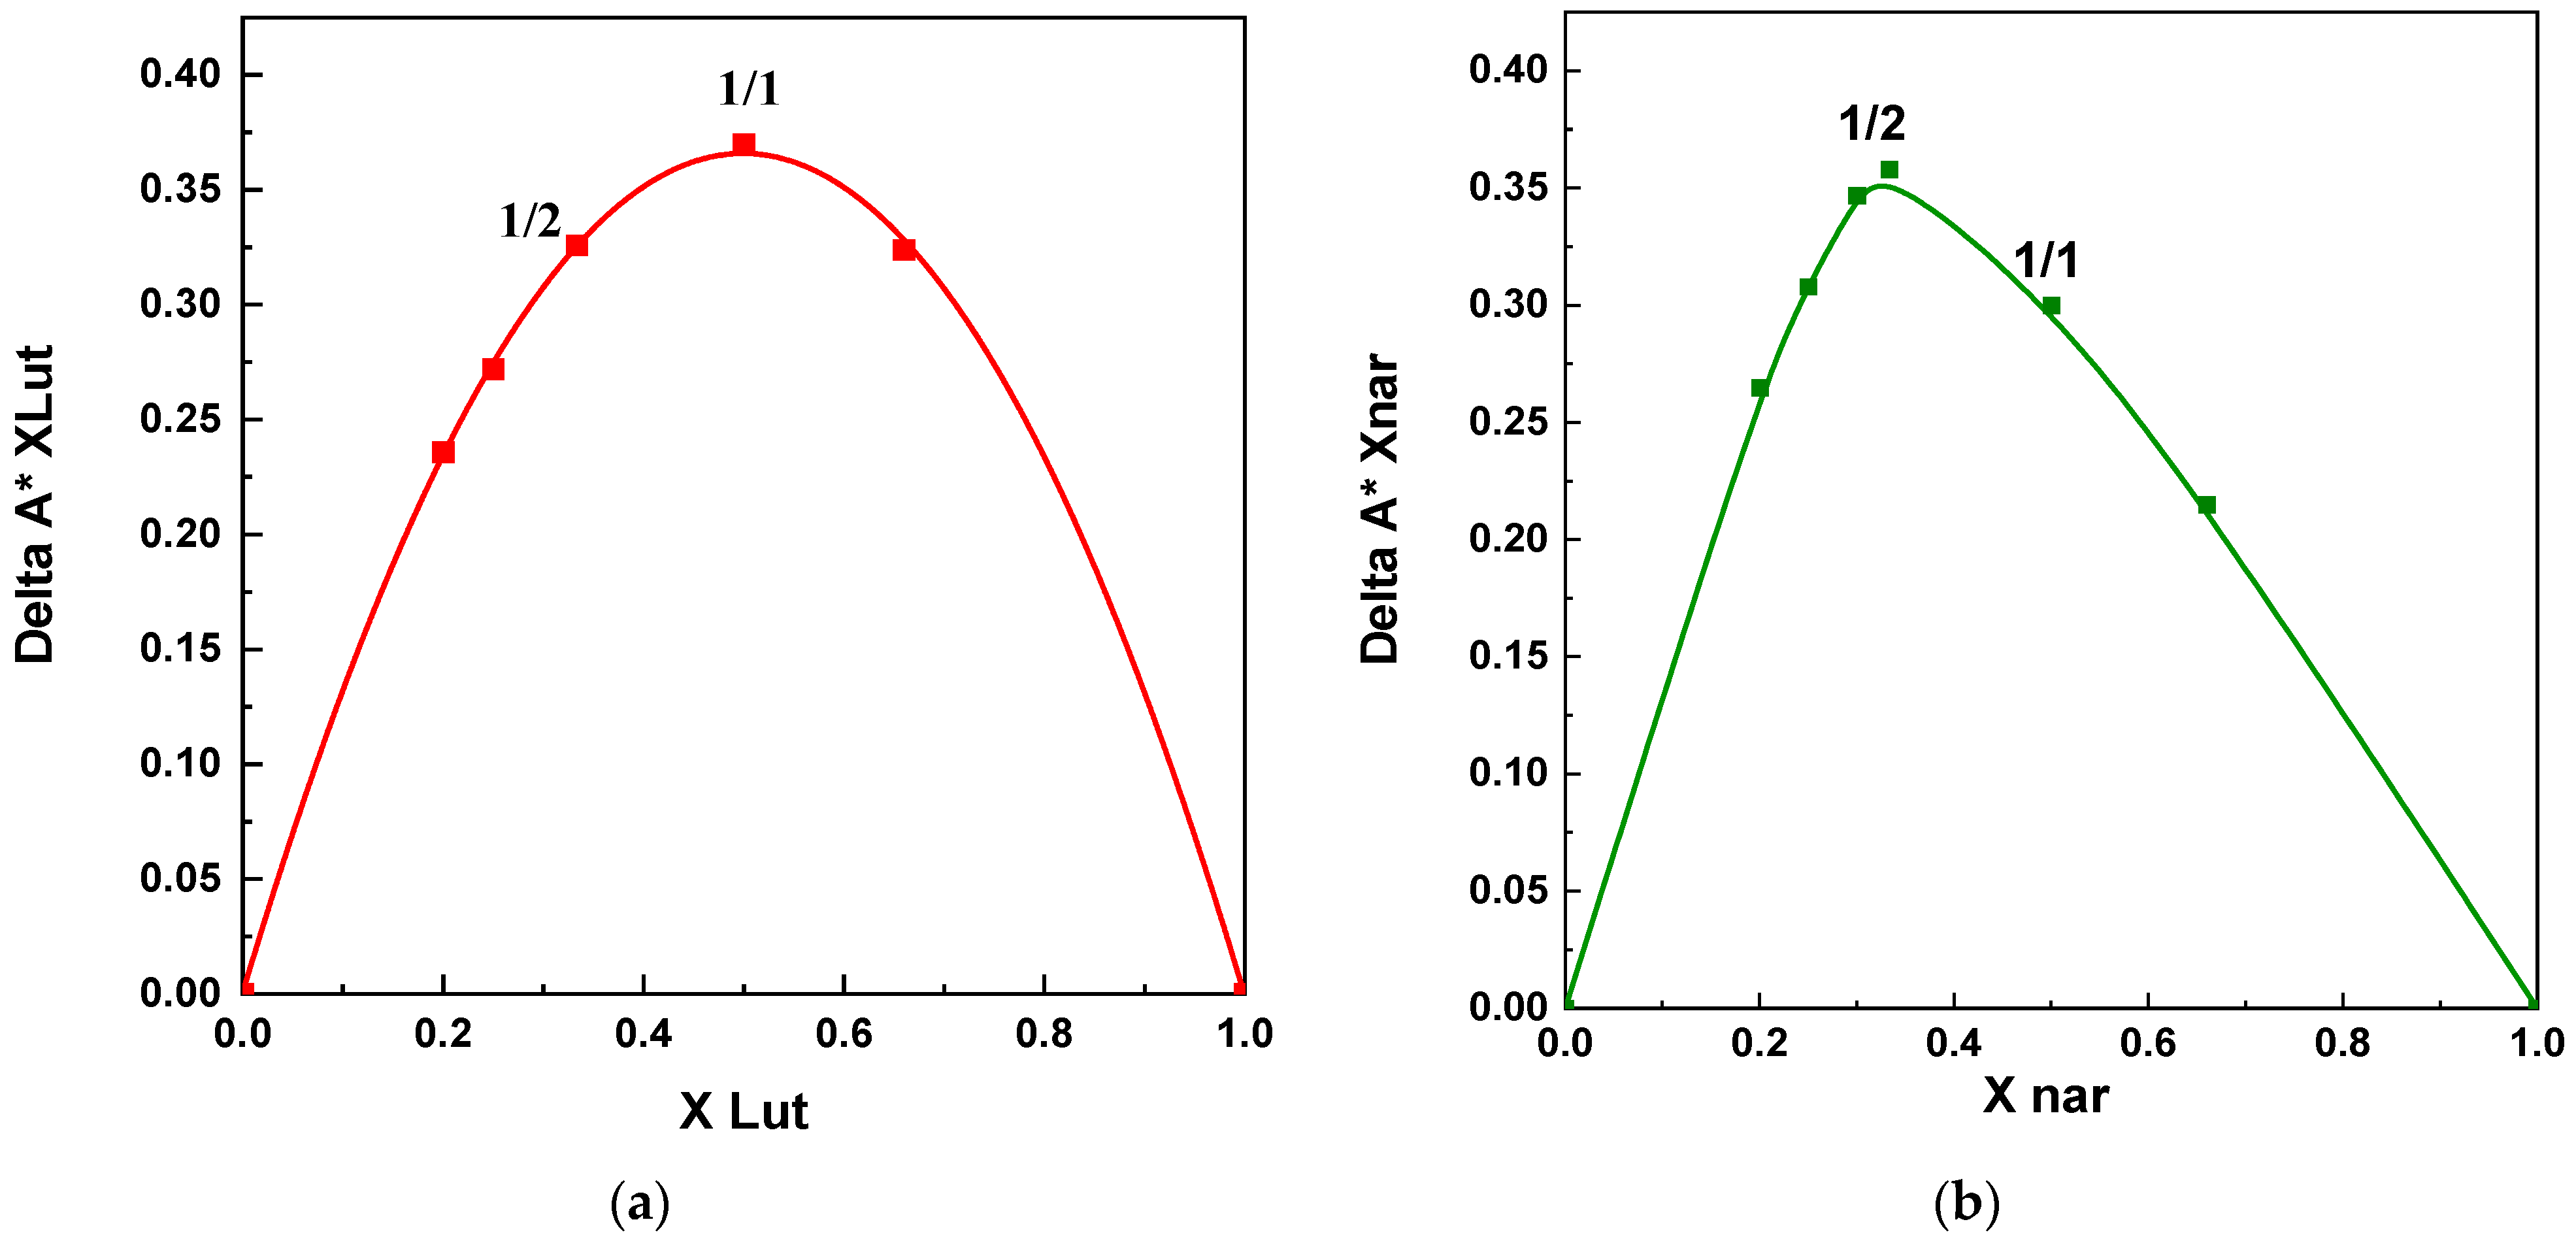
2.3.4. Job’s Method
3. Results and Discussion
3.1. Tests on Luteolin
3.1.1. Tests with β-Cyclodextrin
3.1.2. Tests with PVP
3.2. Tests on Naringenin
3.2.1. Tests with β-Cyclodextrin
3.2.2. Tests with PVP
3.3. Characterization
4. Conclusions
Author Contributions
Funding
Institutional Review Board Statement
Data Availability Statement
Conflicts of Interest
References
- Chandra, S.R.; Diwan, A.D.; Panche, A.N. Flavonoids: An overview. J. Nutr. Sci. 2016, 5, e47. [Google Scholar] [CrossRef]
- Shen, N.; Wang, T.; Gan, Q.; Liu, S.; Wang, L.; Jin, B. Plant flavonoids: Classification, distribution, biosynthesis, and antioxidant activity. Food Chem. 2022, 383, 132531. [Google Scholar] [CrossRef]
- Seleem, D.; Pardi, V.; Murata, R.M. Review of flavonoids: A diverse group of natural compounds with anti-Candida albicans activity in vitro. Arch. Oral Biol. 2017, 76, 76–83. [Google Scholar] [CrossRef] [PubMed]
- Ross, J.A.; Kasum, C.M. Dietary flavonoids: Bioavailability, Metabolic Effects, and Safety. Annu. Rev. Nutr. 2002, 22, 19–34. [Google Scholar] [CrossRef]
- Neuhouser, M.L. Review: Dietary Flavonoids and Cancer Risk: Evidence From Human Population Studies. Nutr. Cancer 2004, 50, 1–7. [Google Scholar] [CrossRef] [PubMed]
- Micek, A.; Godos, J.; Del Rio, D.; Galvano, F.; Grosso, G. Dietary Flavonoids and Cardiovascular Disease: A Comprehensive Dose–Response Meta-Analysis. Mol. Nutr. Food Res. 2021, 65, 2001019. [Google Scholar] [CrossRef]
- Andrew, R.; Izzo, A.A. Principles of pharmacological research of nutraceuticals. Br. J. Pharmacol. 2017, 174, 1177–1194. [Google Scholar] [CrossRef]
- Zobeiri, M.; Belwal, T.; Parvizi, F.; Naseri, R.; Farzaei, H.M.; Nabavi, F.S.; Sureda, A.; Nabavi, M.S. Naringenin and its Nano-formulations for Fatty Liver: Cellular Modes of Action and Clinical Perspective. Curr. Pharm. Biotechnol. 2018, 19, 196–205. [Google Scholar] [CrossRef]
- Lin, Y.; Shi, R.; Wang, X.; Shen, H.-M. Luteolin, a Flavonoid with Potential for Cancer Prevention and Therapy. Curr. Cancer Drug Targets 2008, 8, 634–646. [Google Scholar] [CrossRef]
- Shimoi, K.; Okada, H.; Furugori, M.; Goda, T.; Takase, S.; Suzuki, M.; Hara, Y.; Yamamoto, H.; Kinae, N. Intestinal absorption of luteolin and luteolin 7-O-β-glucoside in rats and humans. FEBS Lett. 1998, 438, 220–224. [Google Scholar] [CrossRef]
- Samejima, K.; Kanazawa, K.; Ashida, H.; Danno, G.-I. Luteolin: A Strong Antimutagen against Dietary Carcinogen, Trp-P-2, in Peppermint, Sage, and Thyme. J. Agric. Food Chem. 1995, 43, 410–414. [Google Scholar] [CrossRef]
- Imran, M.; Rauf, A.; Abu-Izneid, T.; Nadeem, M.; Shariati, M.A.; Khan, I.A.; Imran, A.; Orhan, I.E.; Rizwan, M.; Atif, M. Luteolin, a flavonoid, as an anticancer agent: A review. Biomed. Pharmacother. 2019, 112, 108612. [Google Scholar] [CrossRef]
- Seelinger, G.; Merfort, I.; Schempp, C.M. Anti-Oxidant, Anti-Inflammatory and Anti-Allergic Activities of Luteolin. Planta Med. 2008, 74, 1667–1677. [Google Scholar] [CrossRef]
- Felgines, C.; Texier, O.; Morand, C.; Manach, C.; Scalbert, A.; Régerat, F.; Rémésy, C. Bioavailability of the flavanone naringenin and its glycosides in rats. Am. J. Physiol.-Gastrointest. Liver Physiol. 2000, 279, G1148–G1154. [Google Scholar] [CrossRef]
- Mir, I.A.; Tiku, A.B. Chemopreventive and therapeutic potential of “naringenin,” a flavanone present in citrus fruits. Nutr. Cancer 2015, 67, 27–42. [Google Scholar] [CrossRef]
- Cho, K.W.; Kim, Y.O.; Andrade, J.E.; Burgess, J.R.; Kim, Y.-C. Dietary naringenin increases hepatic peroxisome proliferators–activated receptor α protein expression and decreases plasma triglyceride and adiposity in rats. Eur. J. Nutr. 2011, 50, 81–88. [Google Scholar] [CrossRef]
- Rajadurai, M.; Prince, P.S.M. Preventive effect of naringin on lipid peroxides and antioxidants in isoproterenol-induced cardiotoxicity in Wistar rats: Biochemical and histopathological evidences. Toxicology 2006, 228, 259–268. [Google Scholar] [CrossRef]
- Dizaj, S.M.; Vazifehasl, Z.; Salatin, S.; Adibkia, K.; Javadzadeh, Y. Nanosizing of drugs: Effect on dissolution rate. Res. Pharm. Sci. 2015, 10, 95–108. [Google Scholar]
- Huang, M.; Su, E.; Zheng, F.; Tan, C. Encapsulation of flavonoids in liposomal delivery systems: The case of quercetin, kaempferol and luteolin. Food Funct. 2017, 8, 3198–3208. [Google Scholar] [CrossRef] [PubMed]
- Reverchon, E.; Schiavo Rappo, E.; Cardea, S. Flexible supercritical CO2-assisted process for poly(methyl methacrylate) structure formation. Polym. Eng. Sci. 2006, 46, 188–197. [Google Scholar] [CrossRef]
- Ongkasin, K.; Masmoudi, Y.; Tassaing, T.; Le-Bourdon, G.; Badens, E. Supercritical loading of gatifloxacin into hydrophobic foldable intraocular lenses–Process control and optimization by following in situ CO2 sorption and polymer swelling. Int. J. Pharm. 2020, 581, 119247–119256. [Google Scholar] [CrossRef] [PubMed]
- Cardea, S.; Sessa, M.; Reverchon, E. Supercritical phase inversion to form drug-loaded poly(vinylidene fluoride-co-hexafluoropropylene) membranes. Ind. Eng. Chem. Res. 2010, 49, 2783–2789. [Google Scholar] [CrossRef]
- Tabernero, A.; González-Garcinuño, Á.; Cardea, S.; Martín del Valle, E. Supercritical carbon dioxide and biomedicine: Opening the doors towards biocompatibility. Chem. Eng. J. 2022, 444, 136615. [Google Scholar] [CrossRef]
- Sacco, O.; Franco, P.; De Marco, I.; Vaiano, V.; Callone, E.; Ceccato, R.; Parrino, F. Photocatalytic activity of Eu-doped ZnO prepared by supercritical antisolvent precipitation route: When defects become virtues. J. Mater. Sci. Technol. 2022, 112, 49–58. [Google Scholar] [CrossRef]
- Mottola, S.; Mancuso, A.; Sacco, O.; De Marco, I.; Vaiano, V. Photocatalytic performance assessment of Fe-N co-doped TiO2/β-cyclodextrin hybrid systems prepared by supercritical antisolvent micronization for organic dyes removal. J. Supercrit. Fluids 2023, 201, 106005. [Google Scholar] [CrossRef]
- Montes, A.; Merino, E.; Valor, D.; Guamán-Balcázar, M.C.; Pereyra, C.; Martínez de la Ossa, E.J. From olive leaves to spherical nanoparticles by one-step RESS process precipitation. Eur. Food Res. Technol. 2023, 249, 429–440. [Google Scholar] [CrossRef]
- Remiro, P.D.F.R.; Rosa, P.D.T.V.E.; Moraes, Â.M. Effect of process variables on imiquimod micronization using a supercritical antisolvent (SAS) precipitation technique. J. Supercrit. Fluids 2022, 181, 105500–105508. [Google Scholar] [CrossRef]
- Mottola, S.; De Marco, I. Production of inclusion complexes containing corticosteroids by SAA process. J. Supercrit. Fluids 2024, 204, 106115–106126. [Google Scholar] [CrossRef]
- Franco, P.; De Marco, I. Supercritical Antisolvent Process for Pharmaceutical Applications: A Review. Processes 2020, 8, 938. [Google Scholar] [CrossRef]
- Chen, L.F.; Xu, P.Y.; Fu, C.P.; Kankala, R.K.; Chen, A.Z.; Wang, S.B. Fabrication of supercritical antisolvent (SAS) process-assisted fisetin-encapsulated poly (vinyl pyrrolidone) (PVP) nanocomposites for improved anticancer therapy. Nanomaterials 2020, 10, 322. [Google Scholar] [CrossRef]
- Franco, P.; De Marco, I. Preparation of non-steroidal anti-inflammatory drug/β-cyclodextrin inclusion complexes by supercritical antisolvent process. J. CO2 Util. 2021, 44, 101397–101408. [Google Scholar] [CrossRef]
- Mottola, S.; De Marco, I. Supercritical Antisolvent Precipitation of Corticosteroids/β-Cyclodextrin Inclusion Complexes. Polymers 2024, 16, 29. [Google Scholar] [CrossRef]
- Rosas, M.D.; Piqueras, C.M.; Piva, G.K.; Ramírez-Rigo, M.V.; Filho, L.C.; Bucalá, V. Simultaneous formation of inclusion complex and microparticles containing Albendazole and β-Cyclodextrin by supercritical antisolvent co-precipitation. J. CO2 Util. 2021, 47, 101505. [Google Scholar] [CrossRef]
- Khudaida, S.H.; Yang, C.Y.; Luo, R.H.; Su, C.S. Design amorphous solid dispersion microparticle of aripiprazole in polyvinylpyrrolidone using the supercritical antisolvent process. J. Taiwan Inst. Chem. Eng. 2024, 165, 105765. [Google Scholar] [CrossRef]
- Zhang, Z.; Hao, G.; Sun, X.; Wang, F.; Zhang, D.; Hu, D. PVP/aprepitant microcapsules produced by supercritical antisolvent process. Sci. Rep. 2024, 14, 10679. [Google Scholar] [CrossRef]
- Hasan Khudaida, S.; Dai, Z.-Z.; Ciou, J.-M.; Su, C.-S. Designing amorphous solid nanoparticle dispersion of sulfadiazine in polyvinylpyrrolidone using supercritical CO2 as the antisolvent. Adv. Powder Technol. 2024, 35, 104592. [Google Scholar] [CrossRef]
- Sun, J.; Hong, H.; Zhu, N.; Han, L.; Suo, Q. Response surface methodology to optimize the preparation of tosufloxacin tosylate/hydroxypropyl-β-cyclodextrin inclusion complex by supercritical antisolvent process. J. Mol. Struct. 2019, 1198, 126939. [Google Scholar] [CrossRef]
- Ozkan, G.; Franco, P.; Capanoglu, E.; De Marco, I. PVP/flavonoid coprecipitation by supercritical antisolvent process. Chem. Eng. Process. 2019, 146, 107689. [Google Scholar] [CrossRef]
- Huang, Y.; Zu, Y.; Zhao, X.; Wu, M.; Feng, Z.; Deng, Y.; Zu, C.; Wang, L. Preparation of inclusion complex of apigenin-hydroxypropyl-β-cyclodextrin by using supercritical antisolvent process for dissolution and bioavailability enhancement. Int. J. Pharm. 2016, 511, 921–930. [Google Scholar] [CrossRef] [PubMed]
- Wang, C.; Yan, T.; Yan, T.; Wang, Z. Fabrication of hesperetin/hydroxypropyl-β-cyclodextrin complex nanoparticles for enhancement of bioactivity using supercritical antisolvent technology. J. Mol. Struct. 2023, 1279, 134947. [Google Scholar] [CrossRef]
- Palazzo, I.; Campardelli, R.; Scognamiglio, M.; Reverchon, E. Zein/luteolin microparticles formation using a supercritical fluids assisted technique. Powder Technol. 2019, 356, 899–908. [Google Scholar] [CrossRef]
- Miao, H.; Chen, Z.; Xu, W.; Wang, W.; Song, Y.; Wang, Z. Preparation and characterization of naringenin microparticles via a supercritical anti-Solvent process. J. Supercrit. Fluids 2018, 131, 19–25. [Google Scholar] [CrossRef]
- Job, P.M.J. Formation and stability of inorganic complexes in solution. Ann. Chim. 1928, 9, 113–203. [Google Scholar]
- Devasari, N.; Dora, C.P.; Singh, C.; Paidi, S.R.; Kumar, V.; Sobhia, M.E.; Suresh, S. Inclusion complex of erlotinib with sulfobutyl ether-β-cyclodextrin: Preparation, characterization, in silico, in vitro and in vivo evaluation. Carbohydr. Polym. 2015, 134, 547–556. [Google Scholar] [CrossRef] [PubMed]
- Franco, P.; Reverchon, E.; De Marco, I. PVP/ketoprofen coprecipitation using supercritical antisolvent process. Powder Technol. 2018, 340, 1–7. [Google Scholar] [CrossRef]
- Di Capua, A.; Adami, R.; Izzo, L.; Reverchon, E. Luteolin/dextran-FITC fluorescent microspheres produced by supercritical assisted atomization. J. Supercrit. Fluids 2017, 130, 97–104. [Google Scholar] [CrossRef]
- Campardelli, R.; Reverchon, E.; De Marco, I. Dependence of SAS particle morphologies on the ternary phase equilibria. J. Supercrit. Fluids 2017, 130, 273–281. [Google Scholar] [CrossRef]
- Mohan, P.R.K.; Sreelakshmi, G.; Muraleedharan, C.V.; Joseph, R. Water soluble complexes of curcumin with cyclodextrins: Characterization by FT-Raman spectroscopy. Vib. Spectrosc. 2012, 62, 77–84. [Google Scholar] [CrossRef]
- Wang, Q.; Zhao, L.; Zhao, H.; Liu, X.; Gao, L.; Cheng, N.; Cao, W. Complexation of luteolin with lead (II): Spectroscopy characterization and theoretical researches. J. Inorg. Biochem. 2019, 193, 25–30. [Google Scholar] [CrossRef]
- Unsalan, O.; Erdogdu, Y.; Gulluoglu, M.T. FT-Raman and FT-IR spectral and quantum chemical studies on some flavonoid derivatives: Baicalein and Naringenin. J. Raman Spectrosc. 2009, 40, 562–570. [Google Scholar] [CrossRef]
- Semalty, A.; Semalty, M.; Singh, D.; Rawat, M.S.M. Preparation and characterization of phospholipid complexes of naringenin for effective drug delivery. J. Incl. Phenom. Macrocycl. Chem. 2010, 67, 253–260. [Google Scholar] [CrossRef]
- Ficarra, R.; Tommasini, S.; Raneri, D.; Calabrò, M.L.; Di Bella, M.R.; Rustichelli, C.; Gamberini, M.C.; Ficarra, P. Study of flavonoids/β-cyclodextrins inclusion complexes by NMR, FT-IR, DSC, X-ray investigation. J. Pharm. Biomed. Anal. 2002, 29, 1005–1014. [Google Scholar] [CrossRef]


| # | API | Carrier | API/Carrier (mol/mol) | P (MPa) | Ctot (mg/mL) | Morphology | m.d. ± s.d. (μm) | EE% | Figure |
|---|---|---|---|---|---|---|---|---|---|
| 1 | LUT | - | - | 9 | 20 | - | - | - | |
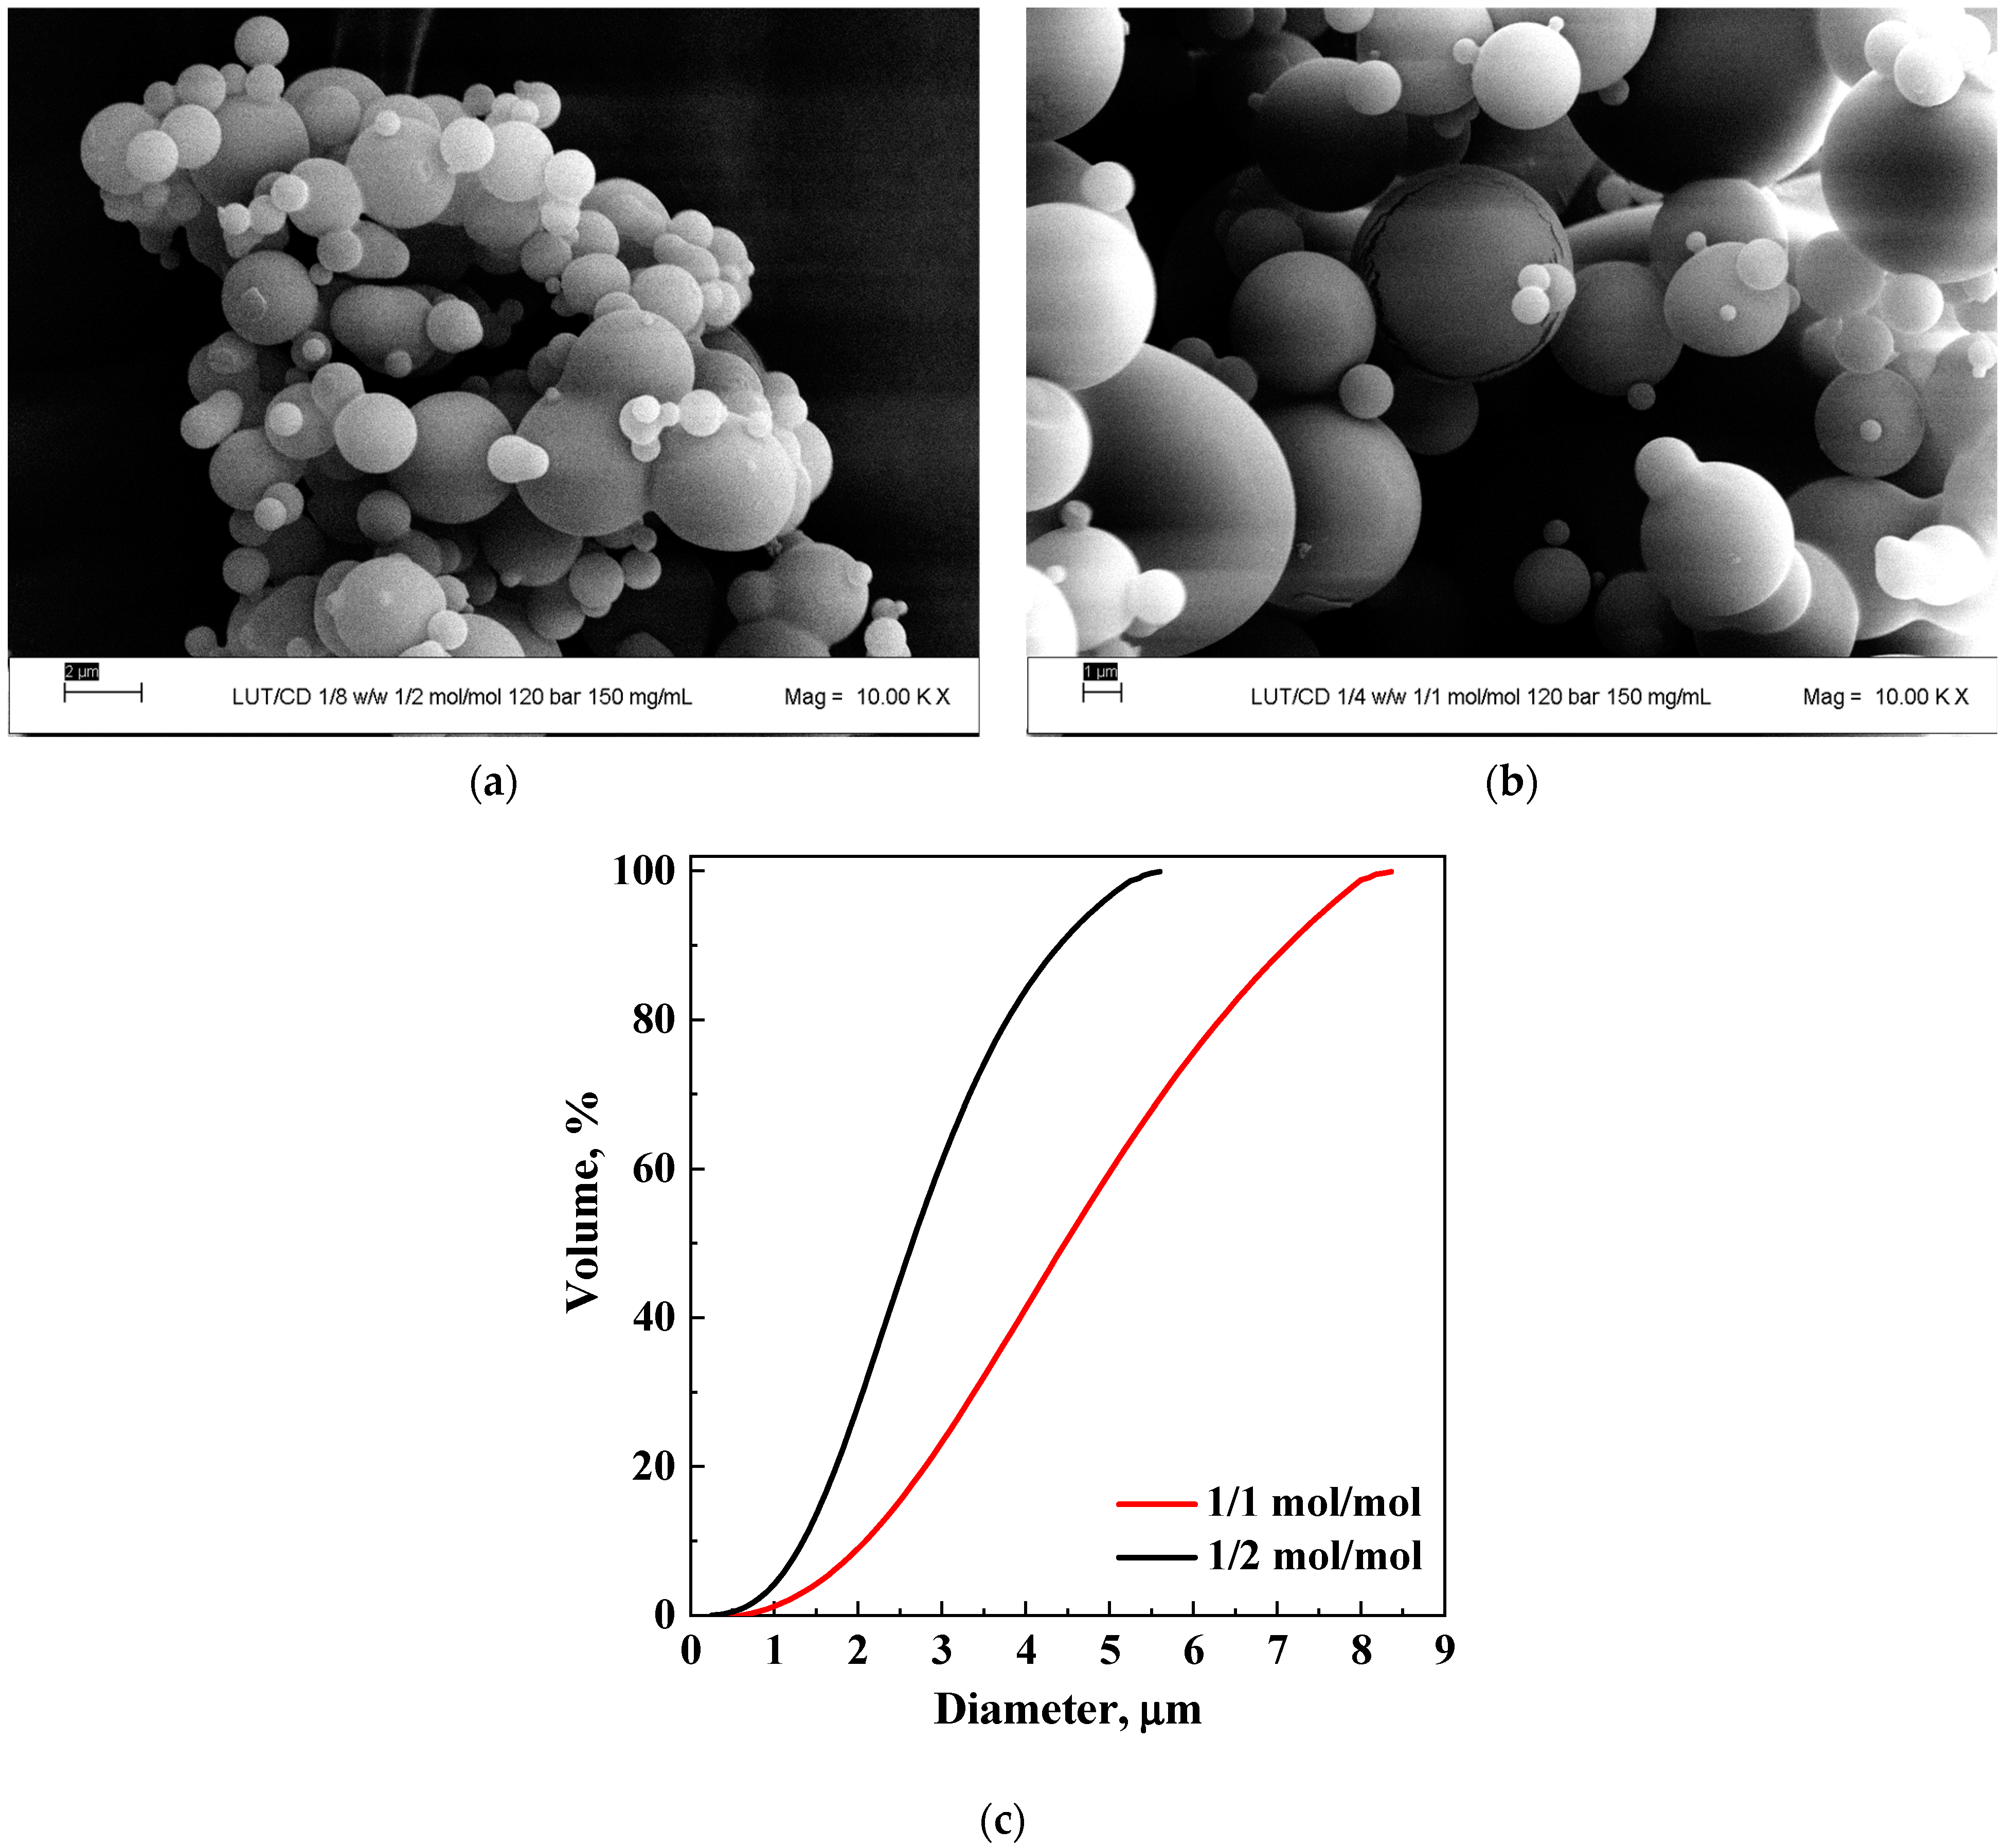
| 2 | β-CD | 1/2 | 9 | 150 | MP | 7.2 ± 2.3 | 100 | 2a | |
| 3 | 9 | 200 | Liq | - | - | ||||
| 4 | 12 | 150 | MP | 2.7 ± 0.9 | 100 | 2b,3a | |||
| 5 | 1/1 | 12 | 150 | MP | 4.5 ± 1.4 | 100 | 3b | ||
| 6 | PVP | 1/2 | 12 | 20 | MP | 2.2 ± 0.7 | 100 | 4a | |
| 7 | 1/1 | 12 | 20 | C | - | - | 4c | ||
| 8 | NAR | - | - | 9 | 20 | - | - | - | |
| 9 | β-CD | 1/2 | 9 | 200 | MP | 2.9 ± 0.9 | 100 | 5a | |
| 10 | 12 | 200 | MP + NP | - | - | 5b | |||
| 11 | 1/1 | 9 | 200 | MP | 5.5 ± 1.9 | 100 | 5c | ||
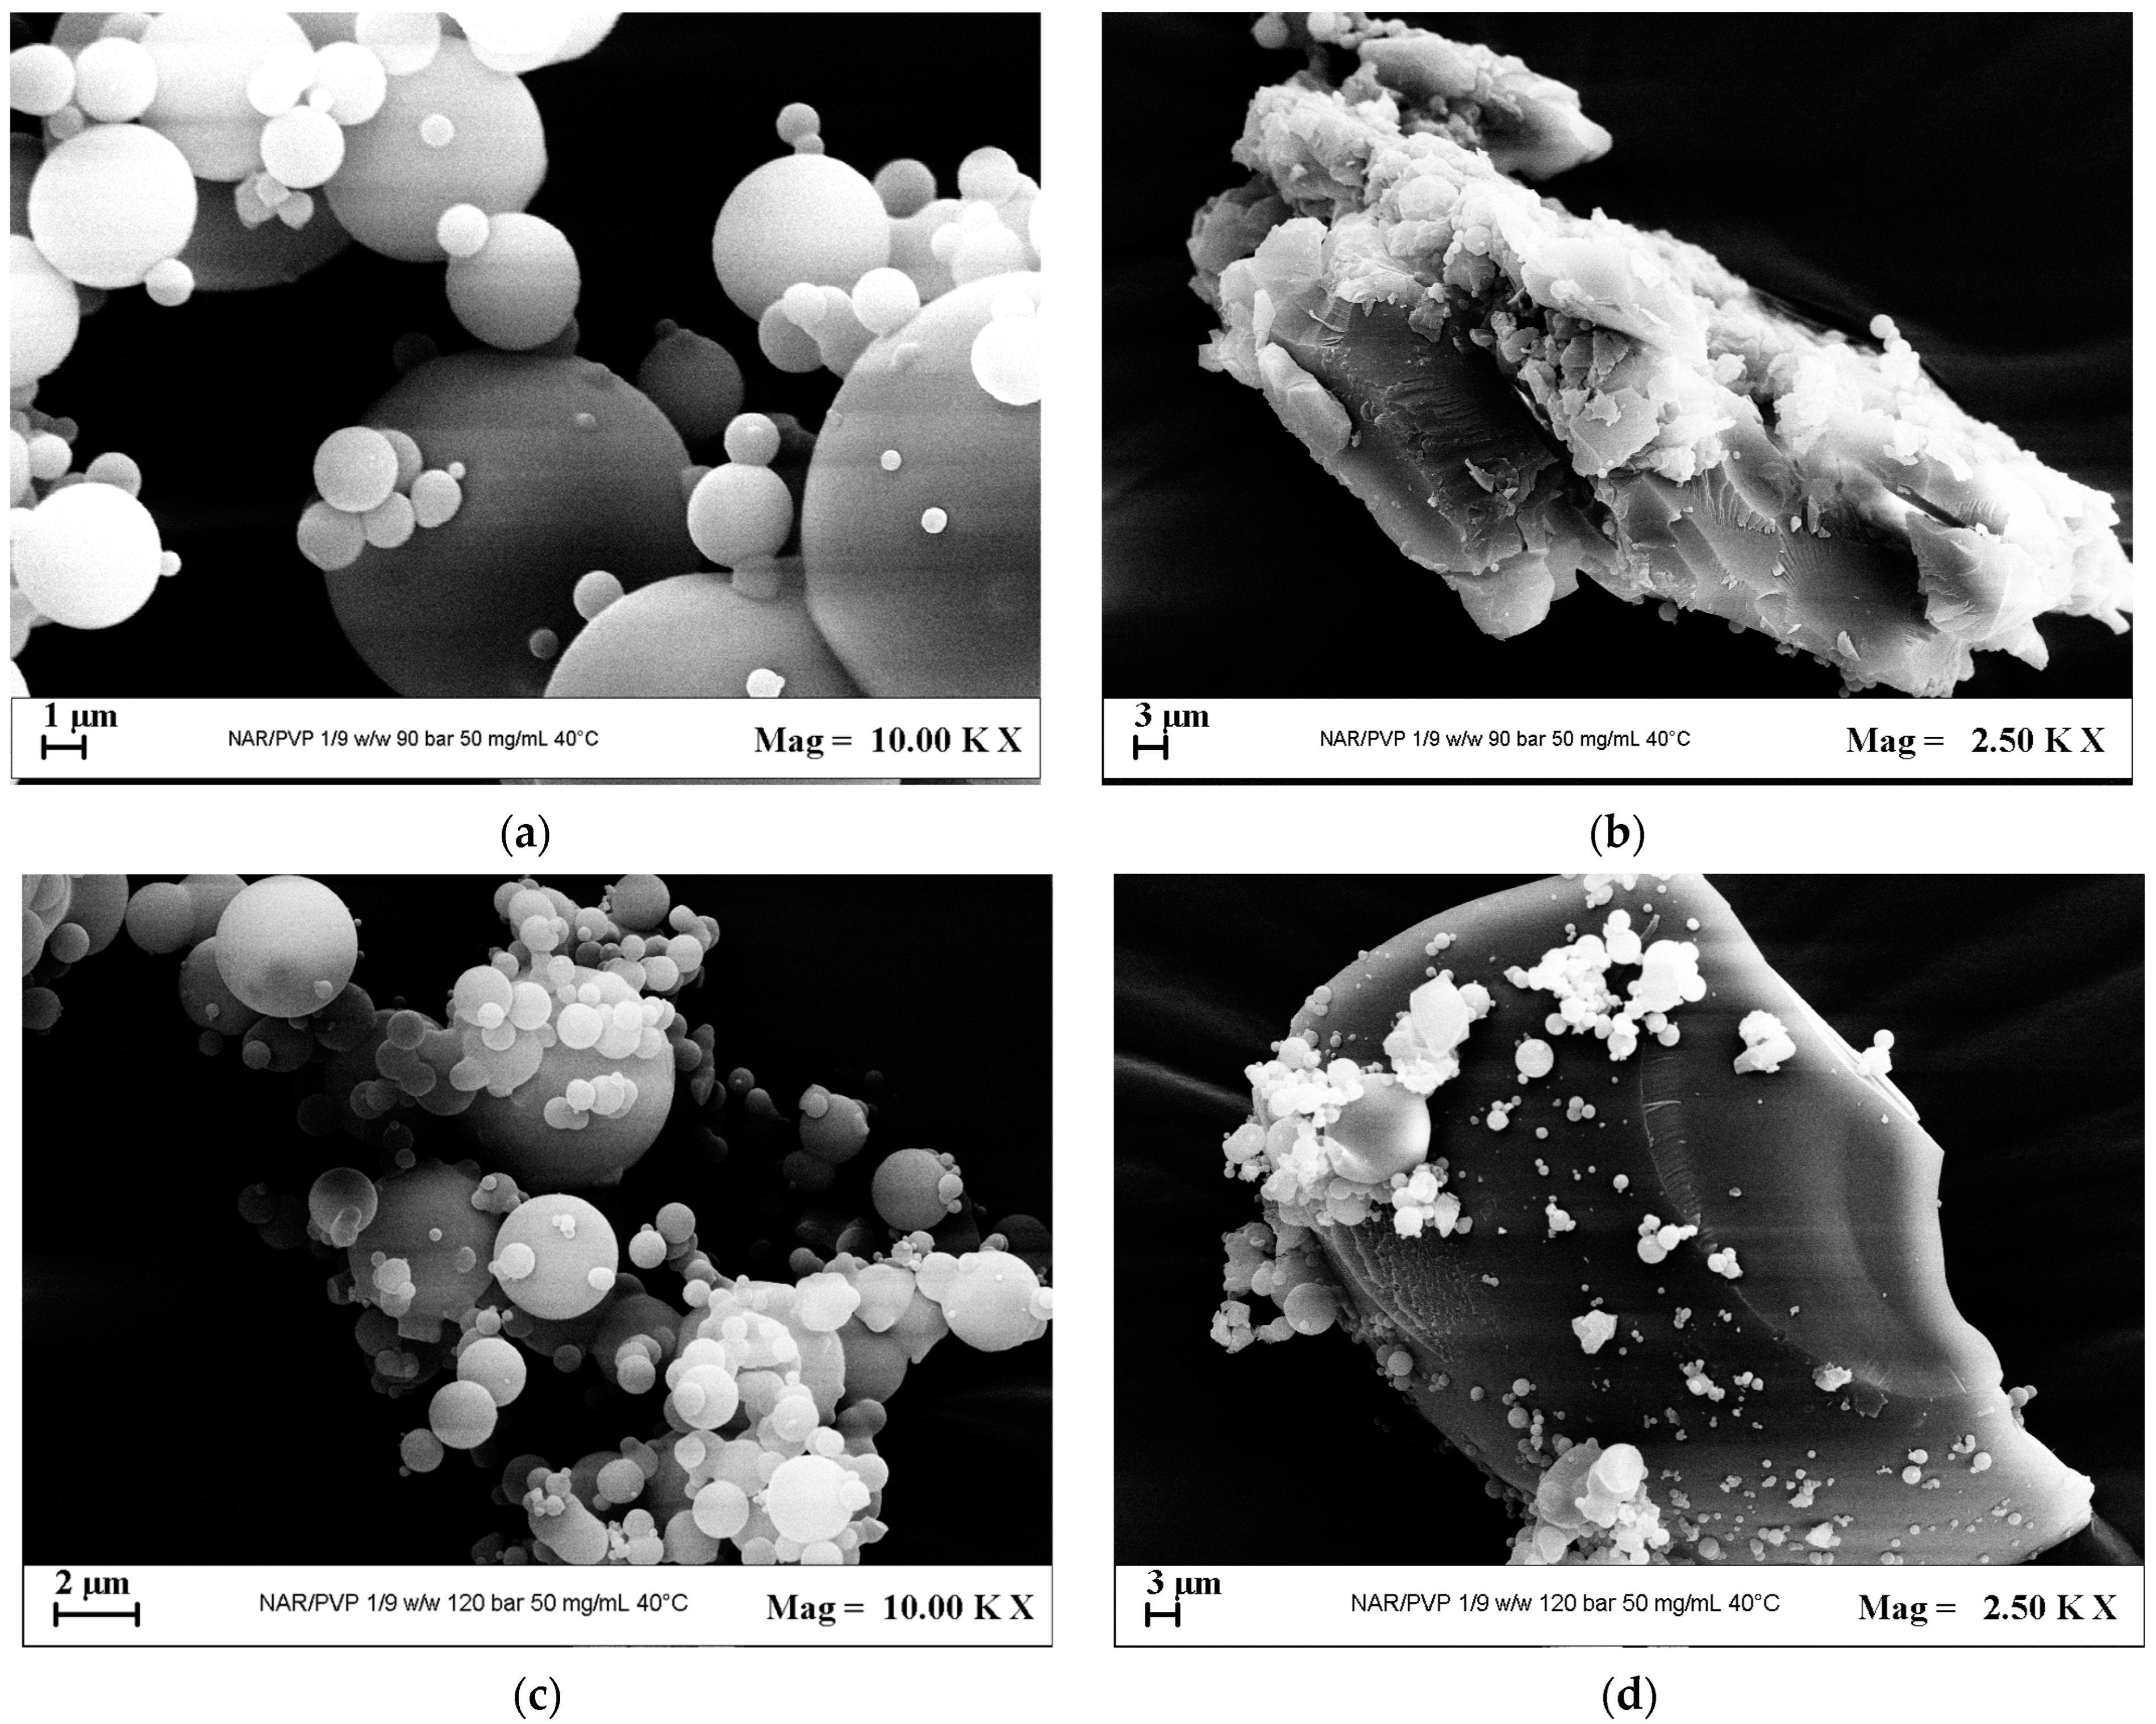
| 12 | PVP | 1/2 | 9 | 50 | MP + C | 3.0 ± 0.9 | - | 6a,6b | |
| 13 | 12 | 50 | MP + C | 1.3 ± 0.5 | - | 6c,6d |
Disclaimer/Publisher’s Note: The statements, opinions and data contained in all publications are solely those of the individual author(s) and contributor(s) and not of MDPI and/or the editor(s). MDPI and/or the editor(s) disclaim responsibility for any injury to people or property resulting from any ideas, methods, instructions or products referred to in the content. |
© 2024 by the authors. Licensee MDPI, Basel, Switzerland. This article is an open access article distributed under the terms and conditions of the Creative Commons Attribution (CC BY) license (https://creativecommons.org/licenses/by/4.0/).
Share and Cite
Mottola, S.; De Marco, I. Designing Microparticles of Luteolin and Naringenin in Different Carriers via Supercritical Antisolvent Process. Polymers 2024, 16, 3600. https://doi.org/10.3390/polym16243600
Mottola S, De Marco I. Designing Microparticles of Luteolin and Naringenin in Different Carriers via Supercritical Antisolvent Process. Polymers. 2024; 16(24):3600. https://doi.org/10.3390/polym16243600
Chicago/Turabian StyleMottola, Stefania, and Iolanda De Marco. 2024. "Designing Microparticles of Luteolin and Naringenin in Different Carriers via Supercritical Antisolvent Process" Polymers 16, no. 24: 3600. https://doi.org/10.3390/polym16243600
APA StyleMottola, S., & De Marco, I. (2024). Designing Microparticles of Luteolin and Naringenin in Different Carriers via Supercritical Antisolvent Process. Polymers, 16(24), 3600. https://doi.org/10.3390/polym16243600