1. Introduction
Polyetheretherketone (PEEK) is a high-performance high-temperature semi-crystalline polymer with improved physical and mechanical properties, chemical resistance, as well as bioinertness [
1]. Respectively, a significant number of researchers have been investigating the features of PEEK [
2,
3]. However, its high cost greatly narrows the range of applications, primarily towards high-tech industries and medicine.
In the manufacturing of machine parts and friction units, PEEK is typically loaded with fillers [
4,
5], among which the most widely used are chopped carbon fibers (CCFs) and glass fibers (GFs) at contents of about 30 wt.% [
6,
7]. Antifriction composites, fabricated by injection molding, contain smaller amounts of reinforcing fibers but they are additionally filled with polytetrafluoroethylene (PTFE) and/or graphite, for instance, for improving their functional characteristics. For such cases, the term ‘high-pressure velocity’ (HPV) composites has been proposed [
8].
Recently, 3D printing methods have become widespread for manufacturing numerous products from PEEK-based composites [
9], in particular with the use of fused deposition modeling (FDM)/fused filament fabrication (FFF). Typically, neat PEEK is used as a filament matrix with the content of other fillers (like CFs, GFs, AFs, PTFE, graphite, etc.) less than ≤10 wt.%, since melt flow index (MFIs) is sharply reduced at greater concentrations of CCFs or GFs, preventing the formation of dense and uniform structures of additively manufactured products. An alternative approach involves the use of both granular feedstocks and 3D printing heads with microextruders [
10], but few research results have been published so far on 3D printing with such high-viscosity thermoplastics [
11,
12,
13,
14].
For 3D printing, including with thermoplastic composites, it is necessary to simultaneously optimize a set of technological (input/control) parameters that ensure the high quality of additively manufactured (AM) products. The latter means the maximum precision of shapes, the minimum number of discontinuities, the uniformity of both macro- and microstructure, etc. Their quality is controlled by output (mechanical and structural) parameters. Thus, the 3D printing process can be represented as a black box, and a given set of some functional (output) parameters is achieved by varying the input ones. According to the formulation, such a problem can be solved via the design of experiments [
15]. As compared to the other methods: (i) Box Behnken design [
16]; (ii) Rotatable Central composite design of experiments (Box-Wilson Central Composite Designs) [
17]; (iii) D-optimal design [
18]; (iv) Doehlert design [
19]; (v) Response surface method (RSM) [
20] the Taguchi method [
21] is widely applied due to a possibility of multiple reductions in the number of required results in contrast to full-scale experiments [
22].
Another effective approach for solving such problems is the use of artificial neural networks (ANNs) [
23]. However, their learning requires large training samples, limiting the possibilities of computer simulation of the 3D printing processes [
24]. Therefore, it is important to implement methods that enable increasing the sample sizes artificially (non-experimentally) [
25]. Enlarging the sample size based on experimental data was carried out by preliminary analysis of the 3D printing process and synthesis of additional preliminary knowledge for the limit values of the process parameters.
Despite numerous reported results and some achieved successes in this field of science, the challenge of 3D printing with high-viscosity thermoplastic composites remains relevant. The reasons are both specifics of AM and complex dependences of the structure formation on a set of input (technological) parameters. This issue requires in-depth research in both materials science and machine learning when ANNs are implemented to solve the problem of approximating a vector quantity in the space of multiple parameters.
The aim of this study was to optimize a set of input parameters (the V3D travel speed, the Text extruder temperature, and the ν extrusion rate by varying rotation speeds of the microextruder screw) for 3D printing with the high-viscosity PEEK/30GF composite from a commercially available granulate. For this purpose, ANNs were implemented for computer simulation of full-scale experiments.
As a null hypothesis for AM of high-quality products from the PEEK/30GF composite, it was assumed that it is necessary to ensure the maximum material feeding into the printing zone by reducing the V3D travel speed of the moving extruder head by increasing both the Text extruder temperature and the ν extrusion rate.
The selection of glass fibers as filler material was motivated by their: (i) availability as a commercial grade feedstock; (ii) lower price; (iii) ease of processing; (iv) large interphase adhesion, and (v) possibility of substantially improving mechanical properties of PEEK-based composites. Their input in increasing mechanical properties of PEEK-based composites is a little bit lower in contrast with carbon fibers; however, in terms of affecting 3D printability, they are quite comparable.
The article is structured as follows.
Section 2 describes materials and research methods, including the design of the experiment using the Taguchi method.
Section 3 presents the results of assessing the mechanical properties and analyzing the structures of the composite, including scanning electron microscopy (SEM) and IR spectroscopy.
Section 4 is devoted to the optimization of the 3D printing parameters via computer simulation using ANNs. In
Section 5, the obtained results are discussed and some prospects are justified for this scientific direction.
2. Materials and Methods
Initially, rectangular shape samples (templates) were fabricated by the FDM method using the ‘PEEK KETASPIRE KT-880 GF30 BG20’ granulate with a length of 3 mm and a diameter of 2 mm (SOLVAY, Shanghai, China) that included 30 wt.% GFs. In this way, an ‘ArmPrint-2’ laboratory 3D printer was deployed (Tomsk Polytechnic University, Tomsk, Russia). It was controlled by the ‘LINUX CNC’ OS operating system and equipped with a single-screw microextruder with a nozzle diameter of 0.5 mm. The ν extrusion rates (amounts of the fed material) were changed by varying rotation speeds of the microextruder screw. The temperature of the heated bed of the 3D printer was 180 C. The 3D printer did not include any thermal chamber, so the air convection of the manufactured samples and their cooling conditions were not instrumentally controlled. However, the temperature conditions were identical in all cases.
Digital model files were created using the ‘Repetir-Host V2.1.3’ software package (Hot-World GmbH & Co. KG Knickelsdorf 4247877, Willich, Germany) and the ‘Slic3r’ slicer (licensed under the GNU Aero General Public License, version 3). The software parameters were preset as the following:
The layer height was 0.2 mm;
The first layer height was 0.3 mm;
The perimeter was 2 lines;
The top solid layer was 0 and the bottom one was 0;
The infill was 80%;
The rectilinear and speed were the same, but the first layer was 50 %; the extrusion width infill was 100%.
For uniaxial static tensile testing, the type 5 dog-bone specimens were cut out according to ISO 527-2:2012 [
26]. Their surfaces were processed with sandpapers (grit 240) and conditioned at room temperature for more than 24 h. The tests were carried out using a ‘Gotech Al-7000M’ electromechanical machine at a cross-head speed of 1 mm/min.
The structures of the samples were analyzed with a ‘LEO EVO 50’ SEM (Carl Zeiss, Oberkochen, Germany) at an accelerating voltage of 20 kV. Initially, the notched samples were cooled in liquid nitrogen at −197 °C for one hour and mechanically fractured then. In a vacuum, copper films ~10 nm thick were deposited on the fracture surfaces using a ‘JEOL JEE-420’ vacuum evaporator (JEOL USA, Inc., Peabody, MA, USA). The requirements for the thickness of the conductive films were justified by the need to preserve the morphology of the original fracture surfaces. Then, the filler distributions and the supermolecular structures of the samples were investigated.
The chemical structures of the samples were analyzed by IR spectrometry. IR spectra were recorded using both ‘NICOLET 5700’ (Thermo Fisher Scientific, Waltham, MA, USA) and ‘FT-801’ (SIMEX, Novosibirsk, Russia) Fourier-transform IR spectrometers in the diffuse reflectance range of 600–4000 cm−1 with a diamond (Single Reflection Diamond ATR).
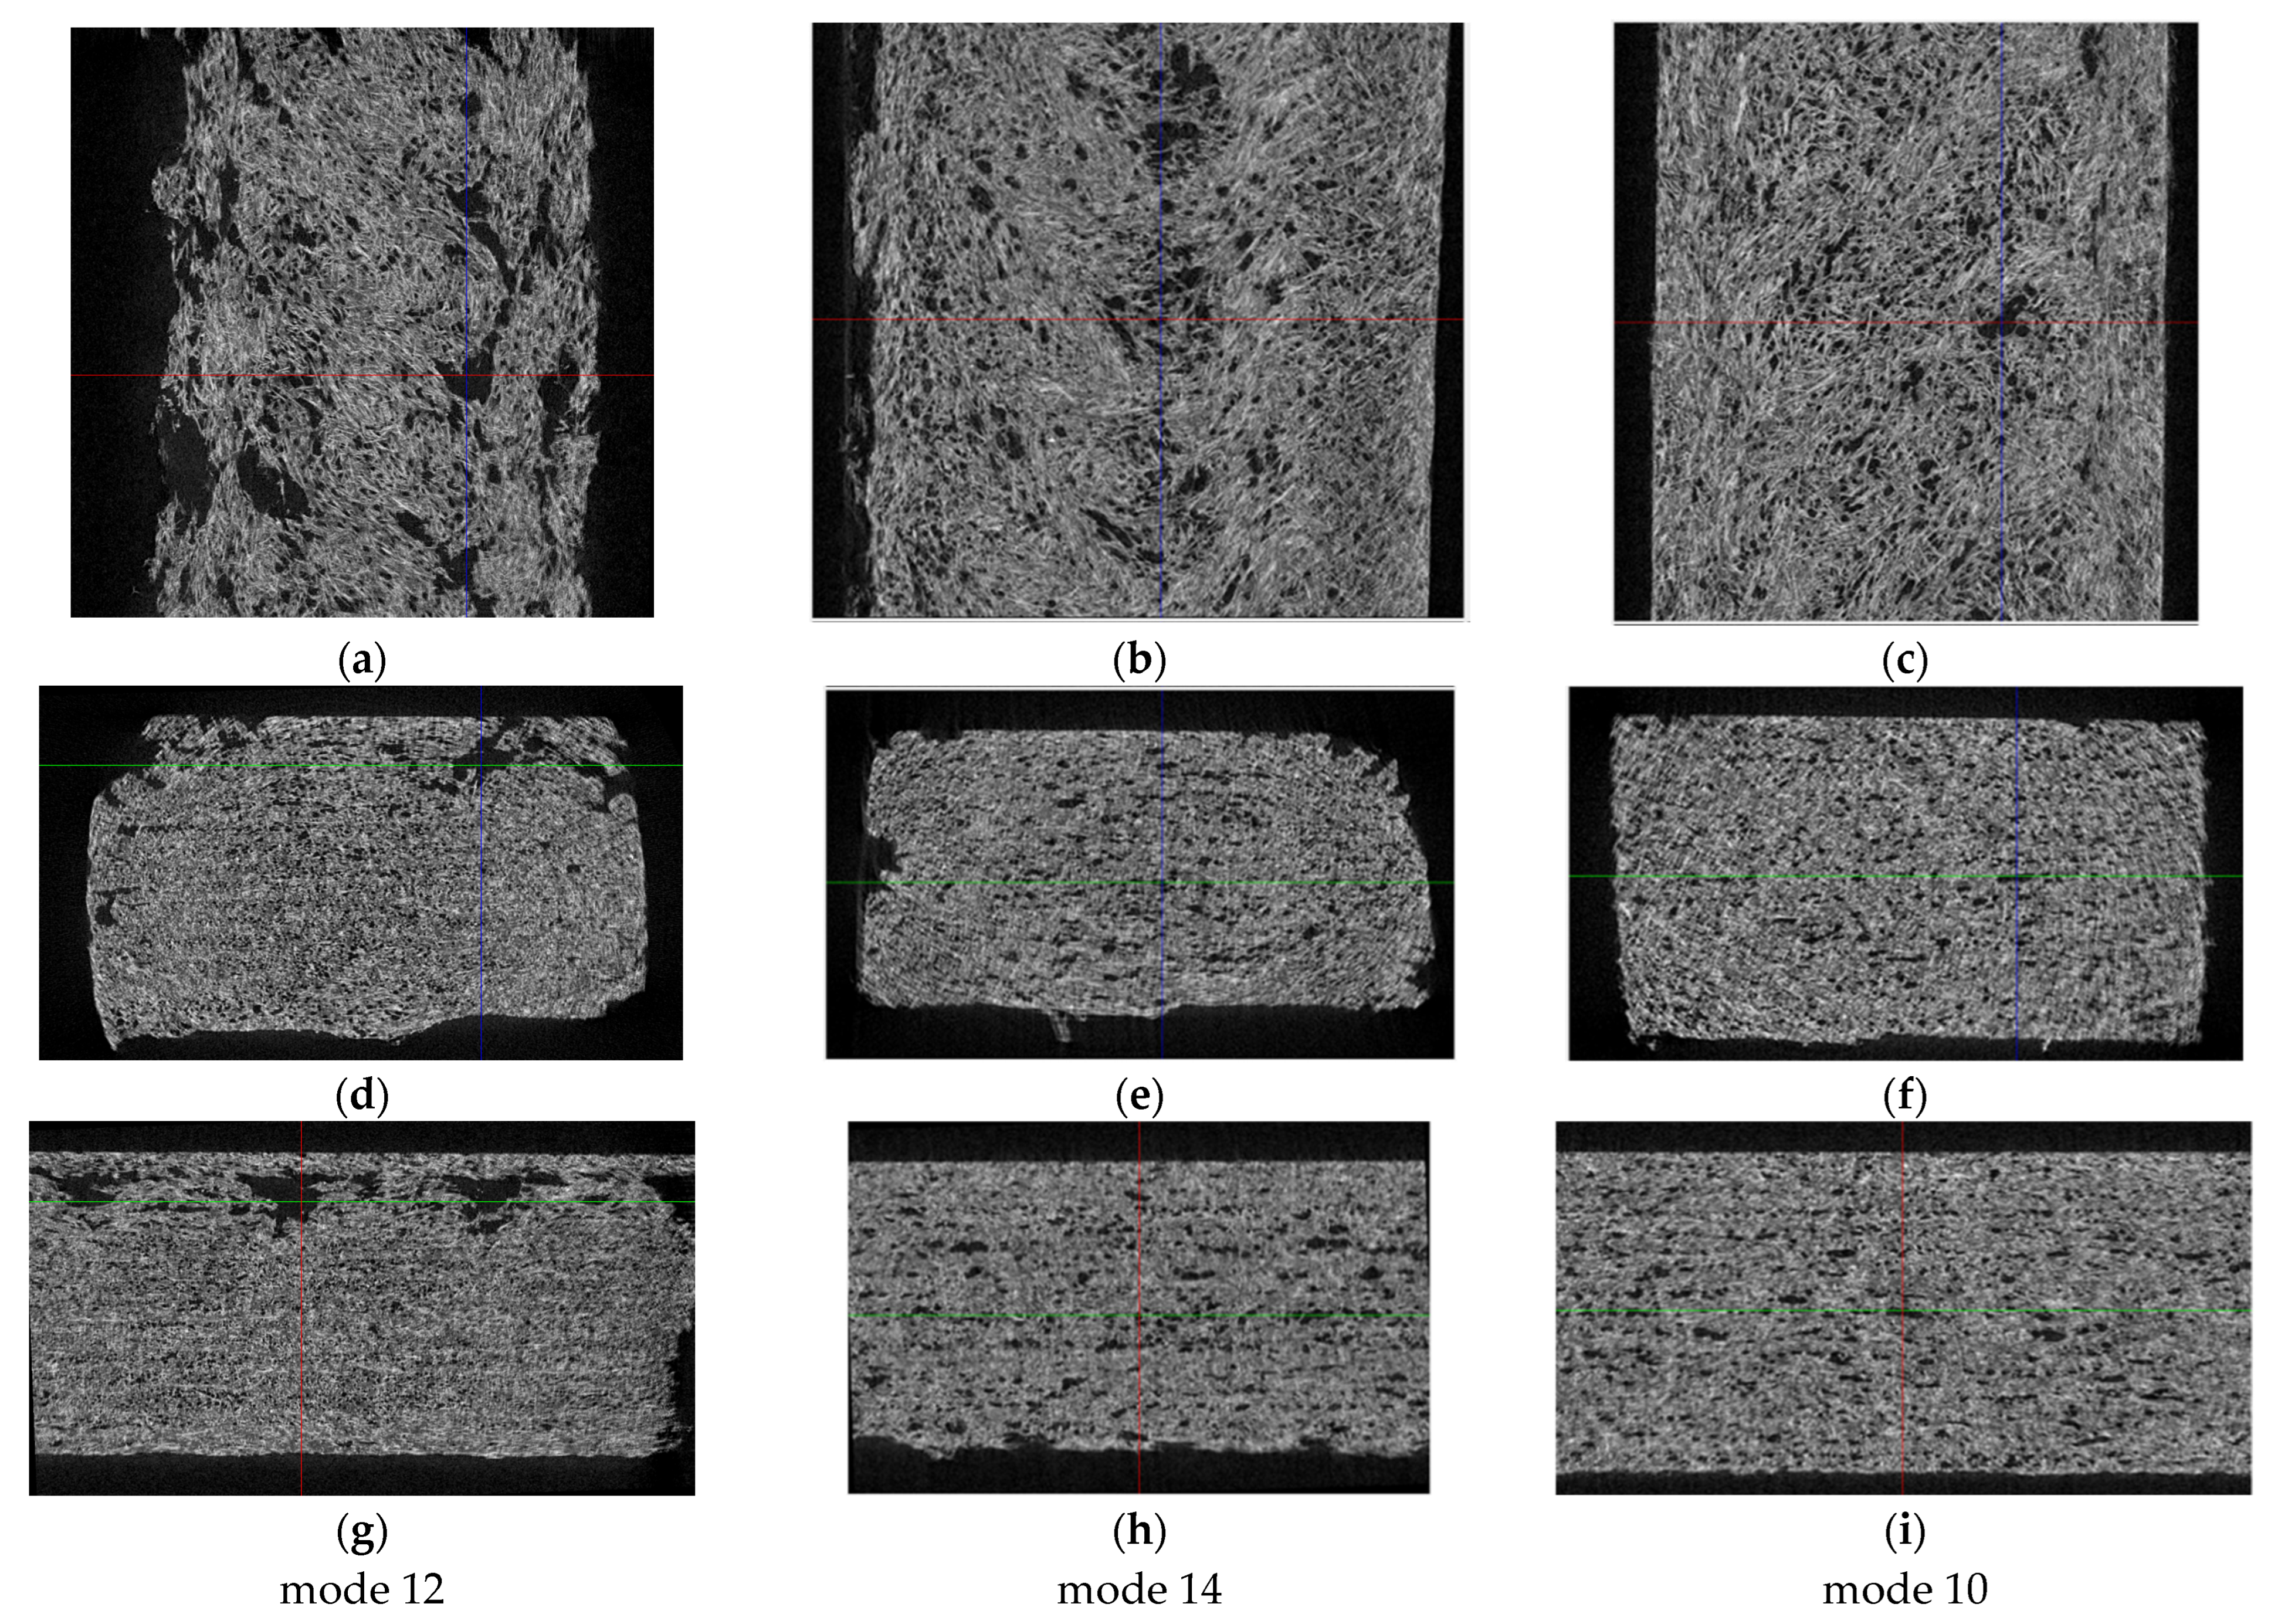
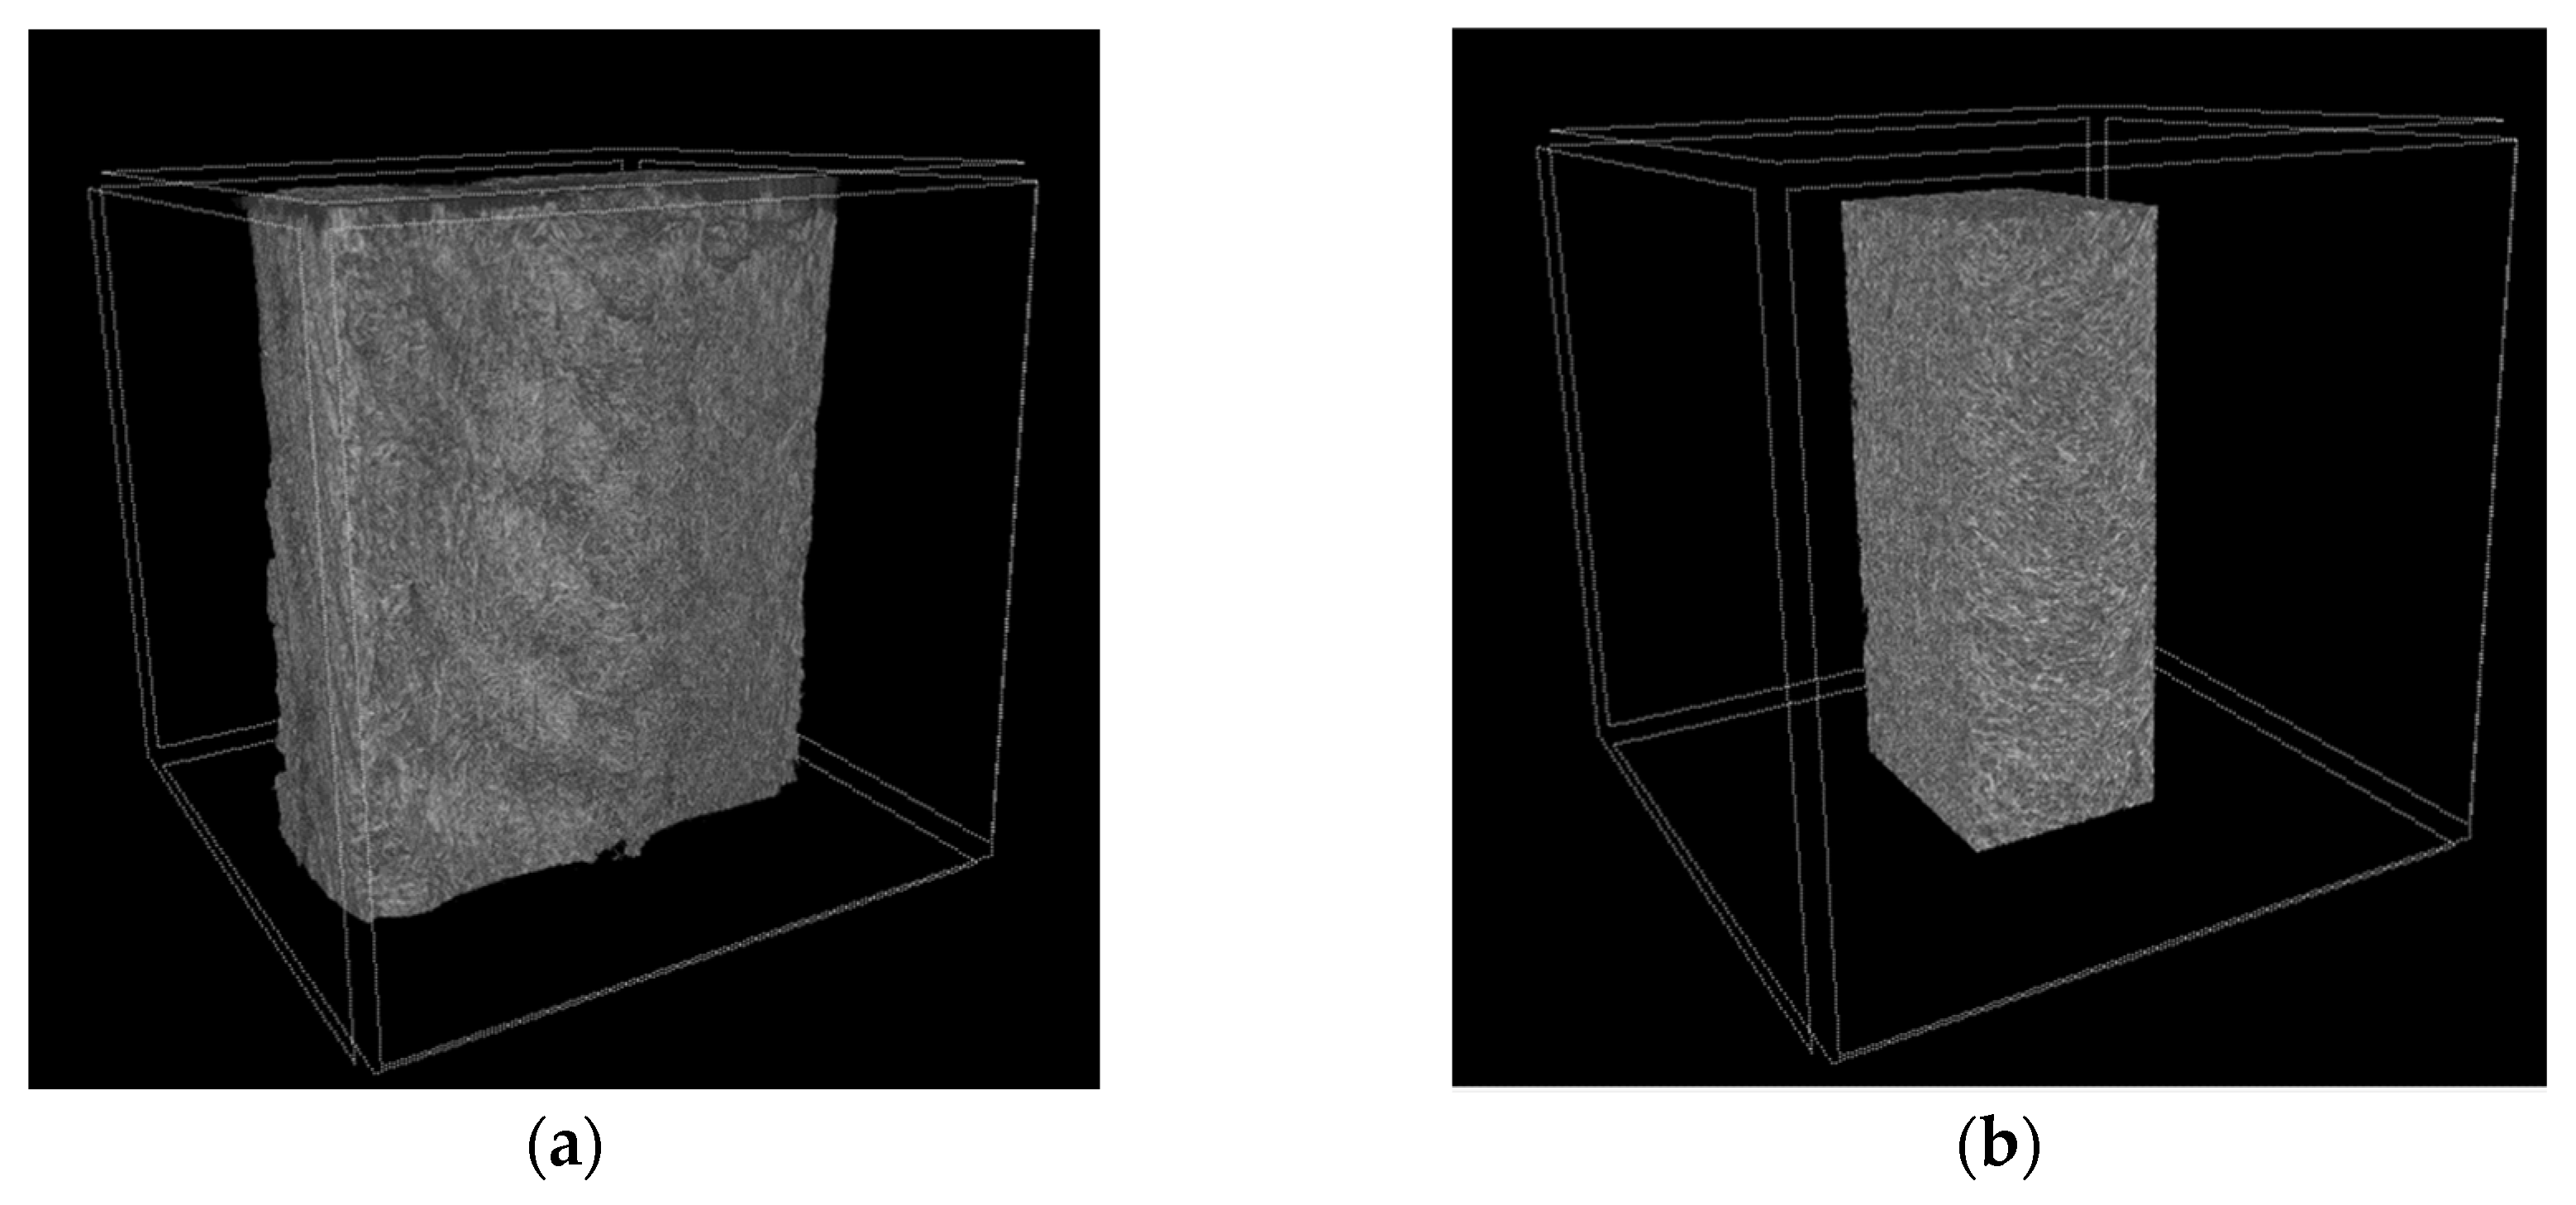
Computed microtomography (micro-CT) of the samples was carried out with an ‘OREL-MT’ tomograph assembled at Tomsk Polytechnic University [
27]. The tomograph was equipped with a ‘XWT 160-TC’ high-focus X-ray machine (X-RAY WorX, Garbsen, Germany), a ‘PaxScan-2520V’ flat-panel X-ray detector (Varian, Palo Alto, CA, USA), and a research object positioning system. Conical X-ray beam geometry and projection magnification were implemented to increase the spatial resolution of images. The ‘Bruker-microCT’ software package v.1.18 was used for tomographic reconstruction and visualization of the obtained data [
28]. The key characteristics of the tomograph are presented in
Table 1.
The following micro-CT mode was utilized: an anode voltage of 100 kV, an anode current of 35 μA, an angular step of scanning projections of 0.2 degrees, a number of projections of 1800, and a voxel size of 6.35 μm.
The Taguchi method was used for trial optimizing the 3D printing parameters. The input factors were the V3D travel speed, the Text extruder temperature, and the ν extrusion rate. Initially, the levels of these input parameters were empirically determined for the sustainable 3D printing process within their wide ranges.
The T
ext extruder temperature was preset at 440 °C since this level enabled the melting of the high-viscosity PEEK/30GF composite. It was an important parameter for 3D printing at the V
3D travel speeds of about 40 mm/s (to ensure an acceptable production rate). Lower T
ext extruder temperatures significantly reduced the 3D printing rate because they did not allow a sufficient amount of the molten composite material to be extruded. So, the T
ext extruder temperatures were 420, 440, and 460 °C (
Table 2). The V
3D travel speeds were preset at 20, 30 and 40 mm/s. As mentioned above, the ν extrusion rates were controlled by varying rotation speeds of the microextruder screw. Initially, a multiplier of 4.5 rpm was determined corresponding to the number of screw revolutions per unit track length upon 3D printing. According to the results of some trial experiments, the shapes of the samples additively manufactured from the PEEK/30GF composite correlated well with their digital models. So, the ν extrusion rates were preset at 4.0, 4.5, and 5.0 rpm (
Table 2).
3. Results
3.1. Mechanical Properties
Table 3 illustrates representative values of the key mechanical properties obtained by averaging over at least four experimental points according to the Taguchi L9 design. A preliminary analysis of these data enabled the conclusion that the ranges of changes in the input parameters used when planning the experiment did not lead to multiple variations in the mechanical properties of the AM samples. In addition, the obtained values were noticeably inferior to the data reported by the feedstock manufacturer since they involved the use of injection molding or compression sintering as a fabrication method [
29].
Then, graphs were drawn according to the Taguchi method [
10], characterizing the influence of each of the (input) parameters on the mechanical properties of the AM samples. This made it possible to quantify their effect by analyzing the implemented modes (the combinations of the 3D printing parameters) and propose the rational one. For this purpose, the ‘bigger is better’ principle and the signal-to-noise (S/N) ratio were applied. According to this methodology, the maximum S/N ratios characterized the maximum variability of the output parameters (the mechanical properties) and corresponded to the achievement of their maximum values. In this case, such a fact reflected the greater significance of a particular level of a 3D printing parameter.
It should be noted that in contrast to the elastic modulus and the tensile strength used as the output parameters, for which the maximum values had to be achieved, a target value of elongation at break was not obvious according to the ‘bigger is better’ principle. Typically, particulate composites at filling degrees of 25–30% were characterized by brittle failure, corresponding to their high mechanical strength. In this approximation, just a negligible elongation at the break value reflected the preference of the 3D printing mode. On the other hand, the porosity of the PEEK/30GF composite significantly reduced its ductility, being a negative factor. Accordingly, the authors prefer not to discuss in detail the role of the elongation at break values and not to consider it when analyzing the data on the influence of technological factors.
For the ‘ν extrusion rate’ input factor, higher tensile strength and elastic modulus values were achieved when using its third level of 5 rpm (
Figure 1a,b, respectively). At the same time, a multidirectional trend was observed for the elongation at break levels (
Figure 1c), which confirmed the above reasoning on the inexpediency of taking it into account. Therefore, the maximum ν extrusion rate had to be preset according to the Taguchi method.
An analysis of the influence of the ‘T
ext extruder temperature’ input factor on the mechanical properties of the samples showed that their elastic modulus values were characterized by a pronounced rising trend with the maximum at T
ext = 460 °C (
Figure 1b). For the tensile strength, higher values were also observed at T
ext = 440–460 °C (
Figure 1a), while the minimum S/N ratio for the ‘elongation at break’ parameter corresponded to the maximum T
ext level of 460 °C (
Figure 1c). Thereby, the high T
ext extruder temperatures had to be preset according to the Taguchi method.
Varying the ‘V3D travel speed’ input parameter from 20 up to 40 mm/s provided higher tensile strength and elastic modulus values at its average level of 30 mm/s, despite they were not significantly lower at the minimum of 20 mm/s. Elongation at break values was characterized by minimal variability at the applied V3D travel speeds. For this reason, the authors again preferred to exclude this “output” parameter from the assessment. Based on the above, the low V3D travel speeds had to be preset according to the Taguchi method.
Finally, the Delta (Δ) influence degrees of the input (technological) parameters were ranked according to the Taguchi principle to ensure higher mechanical properties of the samples (
Table 4). From the tensile strength perspective, all three factors had comparable Δ influence degrees of 0.804–0.879. For the elastic modulus, the T
ext extruder temperature was two times ‘more important’ of a factor than the other two. In the case of elongation at break, the maximum Δ influence degree of 0.853 was exerted by the V
3D travel speed, while it was the minimum (Δ = 0.175) for the T
ext extruder temperature.
As a preliminary discussion, it should be noted that the above findings were somewhat correlated with the results of Deng et al. [
30], who applied the Taguchi method for optimizing the 3D printing mode for neat PEEK (its MFI was surely lower than that of the PEEK/30GF composite). In that case, the highest tensile strength of 40 MPa was achieved at the maximum T
ext extruder temperature of 370 °C and V
3D travel speed of 60 mm/s, while, the highest elastic modulus of 1563 MPa was obtained at a lower T
ext level of 360 °C but the same maximum V
3D travel speed of 60 mm/s. The greatest elongation at break value of 14.3% was observed at the minimum V
3D travel speed of 20 mm/s. These maximum mechanical properties were noticeably inferior to the cast polymer. In [
30], it was stated that 3D printing angles, nozzle diameters, and bead widths had to be optimized as well.
So, the results of the above analysis carried out within the framework of the adopted Taguchi method did not allow both to determine the exact (but not applied in the experiments) values of the input parameters and to give an unambiguous interpretation of the reason for their Δ influence degrees. For clarifying these nuances and assessing the ‘3D printing mode–structure–properties’ relationship, the micro- and chemical structures of the samples were examined by SEM and IR spectroscopy, respectively.
3.2. Microstructures
Figure S1 shows lower magnification SEM micrographs of the PEEK/30GF composites additively manufactured using the FDM modes presented in
Table 2. Note, that no signs of agglomeration of GFs were observed. The pattern of the fracture surfaces (obtained after exposing the samples to liquid nitrogen) was not brittle. Generally, this fact was consistent with the relatively high elongation at break values of ~5%, since similar PEEK-based composites possessed minimal ductility (~1%) at comparable filling degrees. On the other hand, the presented SEM micrographs did not reveal any fundamental differences in the “macrostructures” of all investigated samples.
An analysis of the SEM micrographs”take’ at higher magnification (
Figure 2) enabled the conclusion that there was no predominant orientation of GFs along the direction of laying the molten filament, despite the FDM method used for 3D printing, which involved the extrusion of the molten granular feedstock. The reason could be the fact that GFs were stochastically oriented in the initial granulate.
Nevertheless, the more fundamental identified result was high porosity levels, reaching up to dozens vol.%. In the Discussion section, estimates of the effect of porosity on the elastic modulus of the PEEK/30GF composite are given, explaining its low level at the sufficiently high filling degree of reinforcing GFs.
The authors did not attempt to statistically estimate the porosity levels for each of the nine samples. The reason was the fact that the elongation at break values, which were very sensitive to porosity, did not change within noticeable limits. For this reason, one could conclude that it was inappropriate to determine a correlation between the porosity and the set of the 3D printing parameters.
In addition to the porosity statement and the approximate estimates of its levels given above, it was important to note the dimensions of pores in order to discuss the aspect of their formation, including in terms of the applied 3D printing parameters. According to
Figure 2, pores were generally isolated (not through), while their characteristic sizes (with a predominantly round shape) were several tens of microns. At the same time, the pores were not predominantly formed near reinforcing GFs.
Thus, the revealed high porosity levels indicated that some thermal destruction of the polymer could occur at the elevated Text extruder temperatures of 420–460 °C (recall that the melting point of PEEK was ~343 °C). To verify this fact, the results of the IR spectral analysis of the samples additively manufactured at different Text extruder temperatures are discussed below.
Note that it was difficult to ensure uniform spreading of the high-viscosity molten composite containing fibrous inclusions, which differed significantly in rheological properties, upon 3D printing at high both ν extrusions rates and V
3D travel speeds. Loading PEEK with 30 wt.% GFs necessitated a higher extrusion pressure, so the 3D printer equipped with the microextruder was utilized. For this reason, it could not be expected that the formed structures were highly dense and continuous. This fact was analyzed in more detail by computer simulation using ANNs, the results of which are reported below in
Section 4.
3.3. Chemical Structures
Figure S2 presents the IR spectra of the samples of the PEEK/30GF composite additively manufactured at the T
ext extruder temperatures of 420, 440, and 460 °C. The key task was to show that short-term heating up to 460 °C, at which the higher mechanical properties of the samples were achieved, did not contribute to the thermal destruction of the polymer matrix. Such a statement was based on the fact that the given IR spectra differed little from each other even for modes 7 and 9, characterized by the T
ext extruder temperature of 460 °C.
4. Application of ANNs for Simulation of the 3D Printing Process
Since the study did not allow for the explicit determination of the exact optimal values of technological parameters, partly because their preset ranges may not have been wide enough, ANNs were implemented for computer simulation of the 3D printing process. Since the sample size of nine experimental points was ultra-small, several additional experiments were carried out.
In this section, the statement of the research aim could be formulated as follows. As noted above, computer simulation was an effective tool for optimizing the 3D printing parameters, i.e., improving the mechanical properties with a minimum number of full-scale experiments. Previously, a similar problem was solved by the authors for ultrasonic welding of laminated composites [
25]. The proposed methodology involved solving two key issues: (i) synthesis of a single nonlinear model of 3D printing as a process with many inputs and outputs, and (ii) the addition of a priori knowledge to ensure acceptable predictive accuracy of computer-aided simulation using ANNs.
4.1. Experimental Data Analysis
In addition to the nine modes (combinations of the 3D printing parameters) analyzed above by the Taguchi method, six additional modes No. 10–15 were tested (
Table 5;
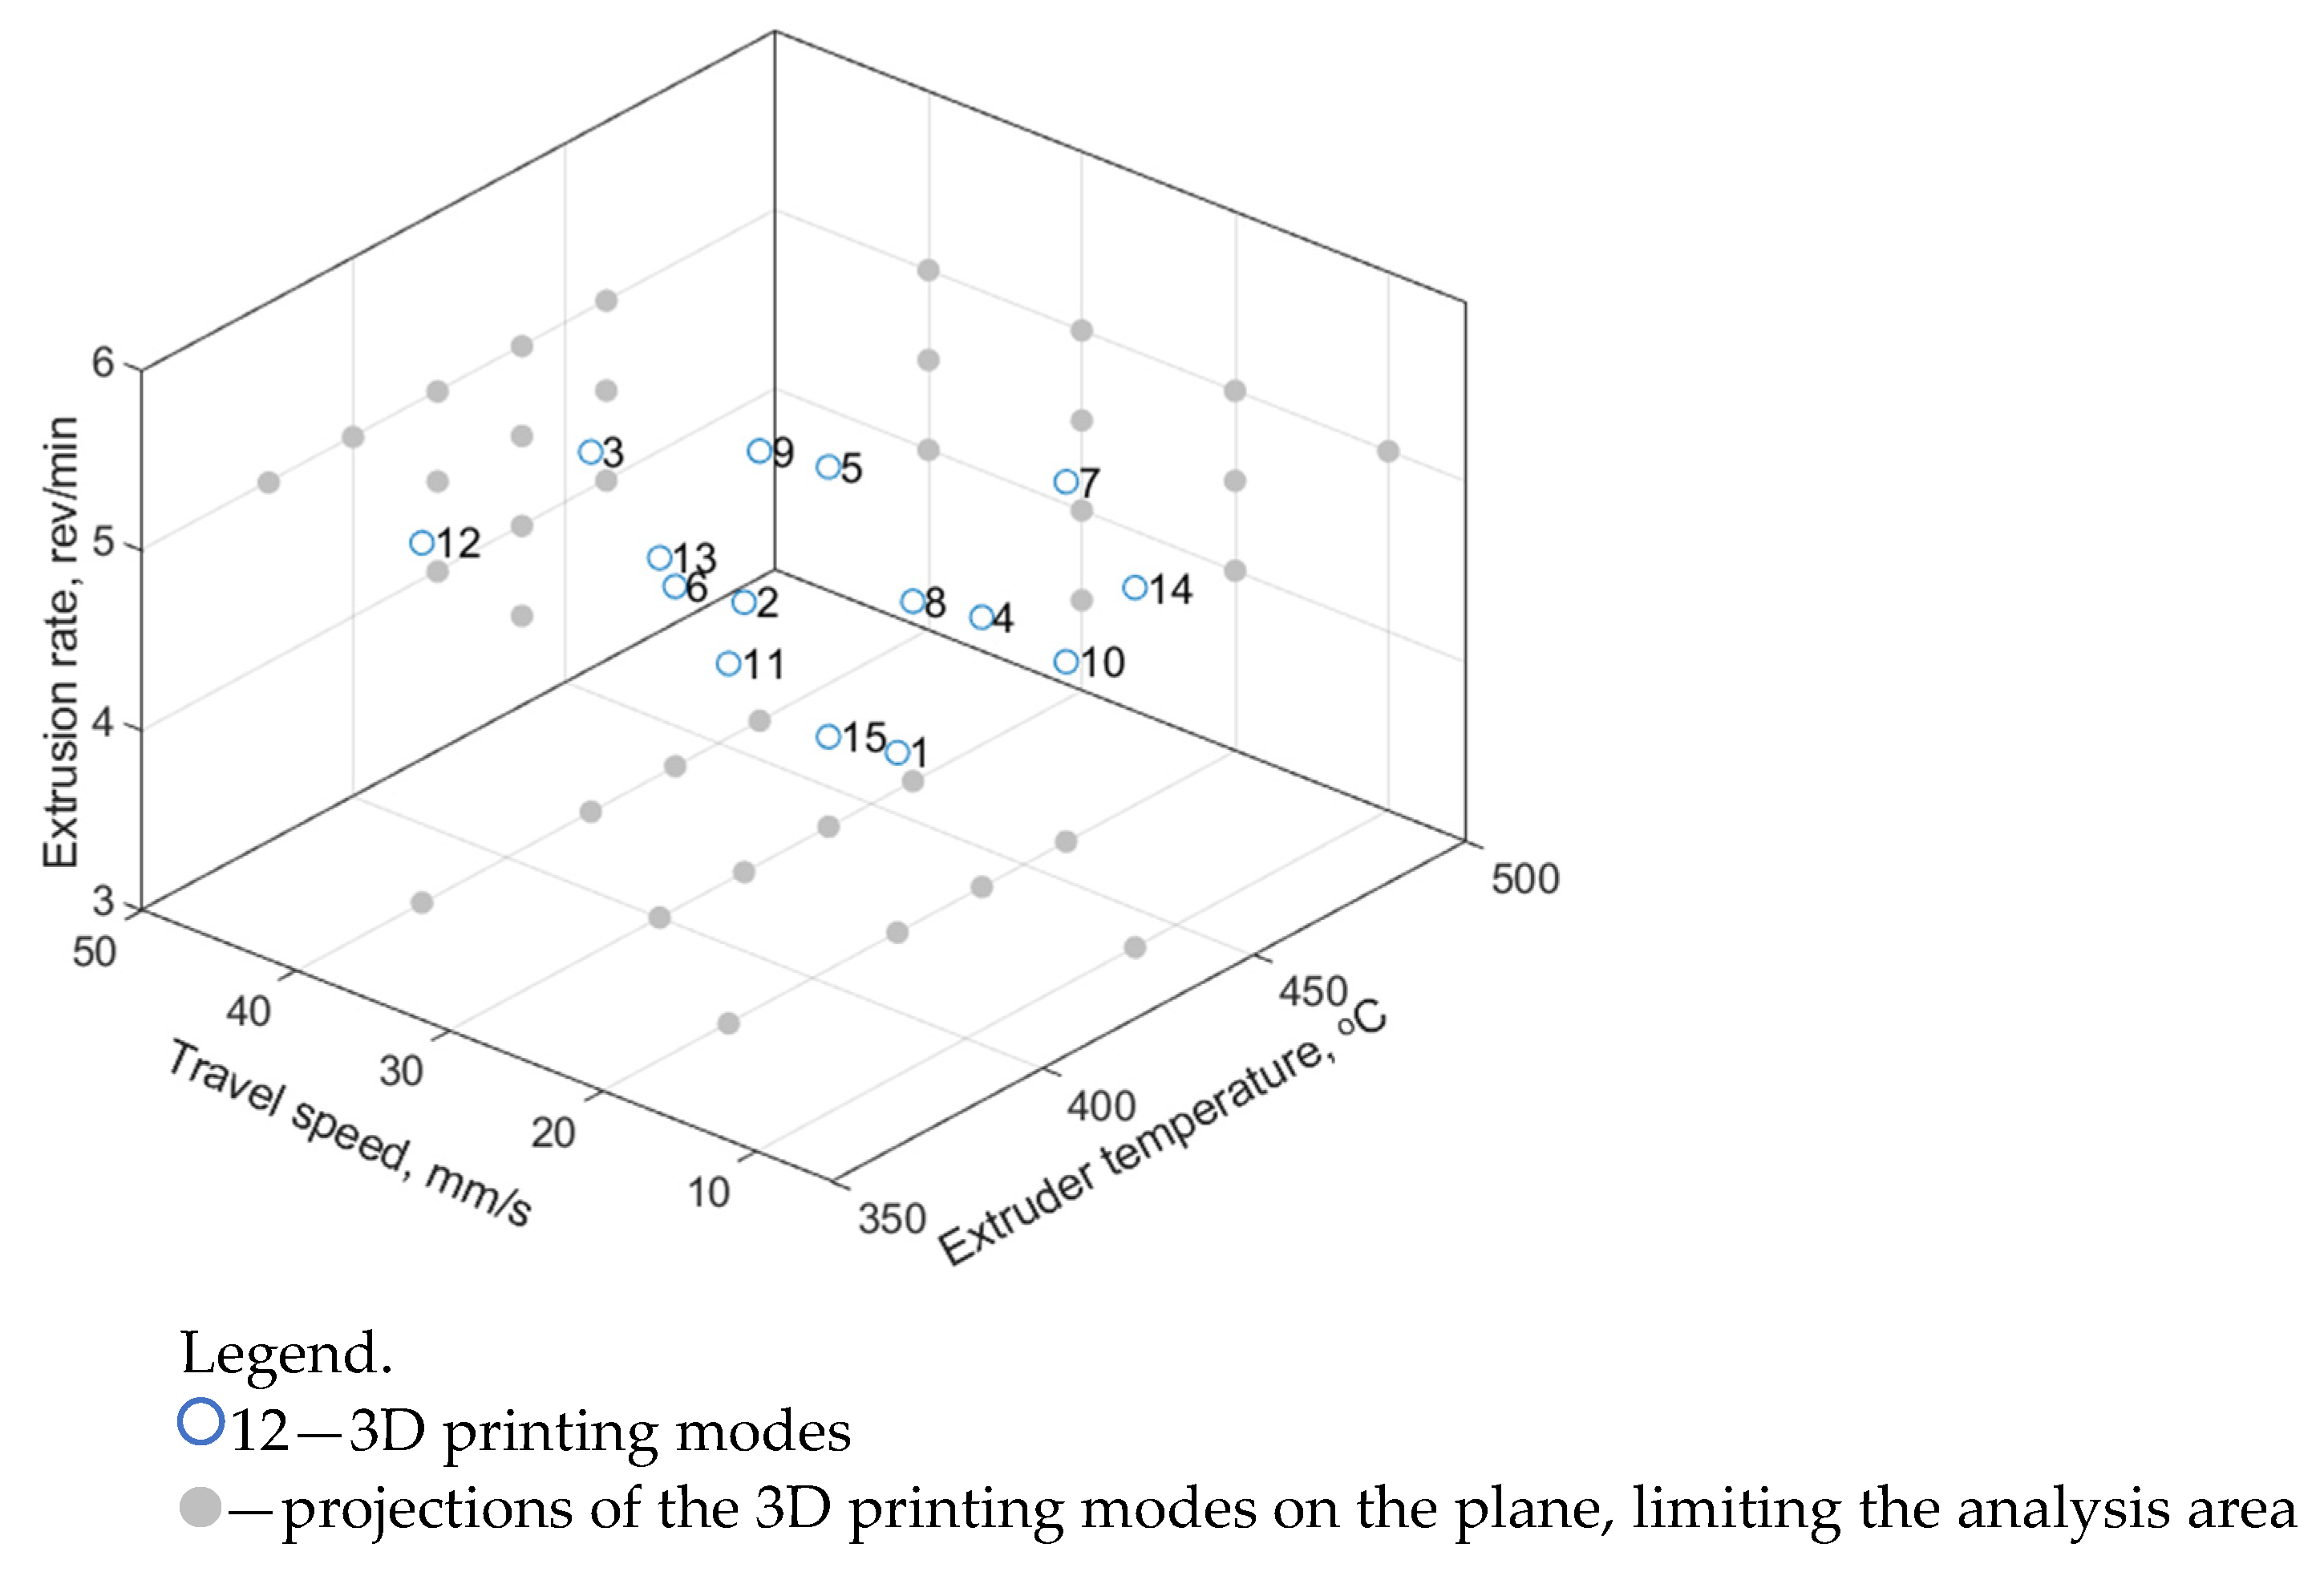
Figure 3) in order to expand the training sample. As noted above, four to seven laboratory experiments were performed for each set of the input parameters (75 in total), as well as the same numbers of the output ones were determined (tensile strength, elastic modulus, and elongation at break). An illustration of the distribution of the (input) parameters in a three-dimensional space is shown in
Figure 3.
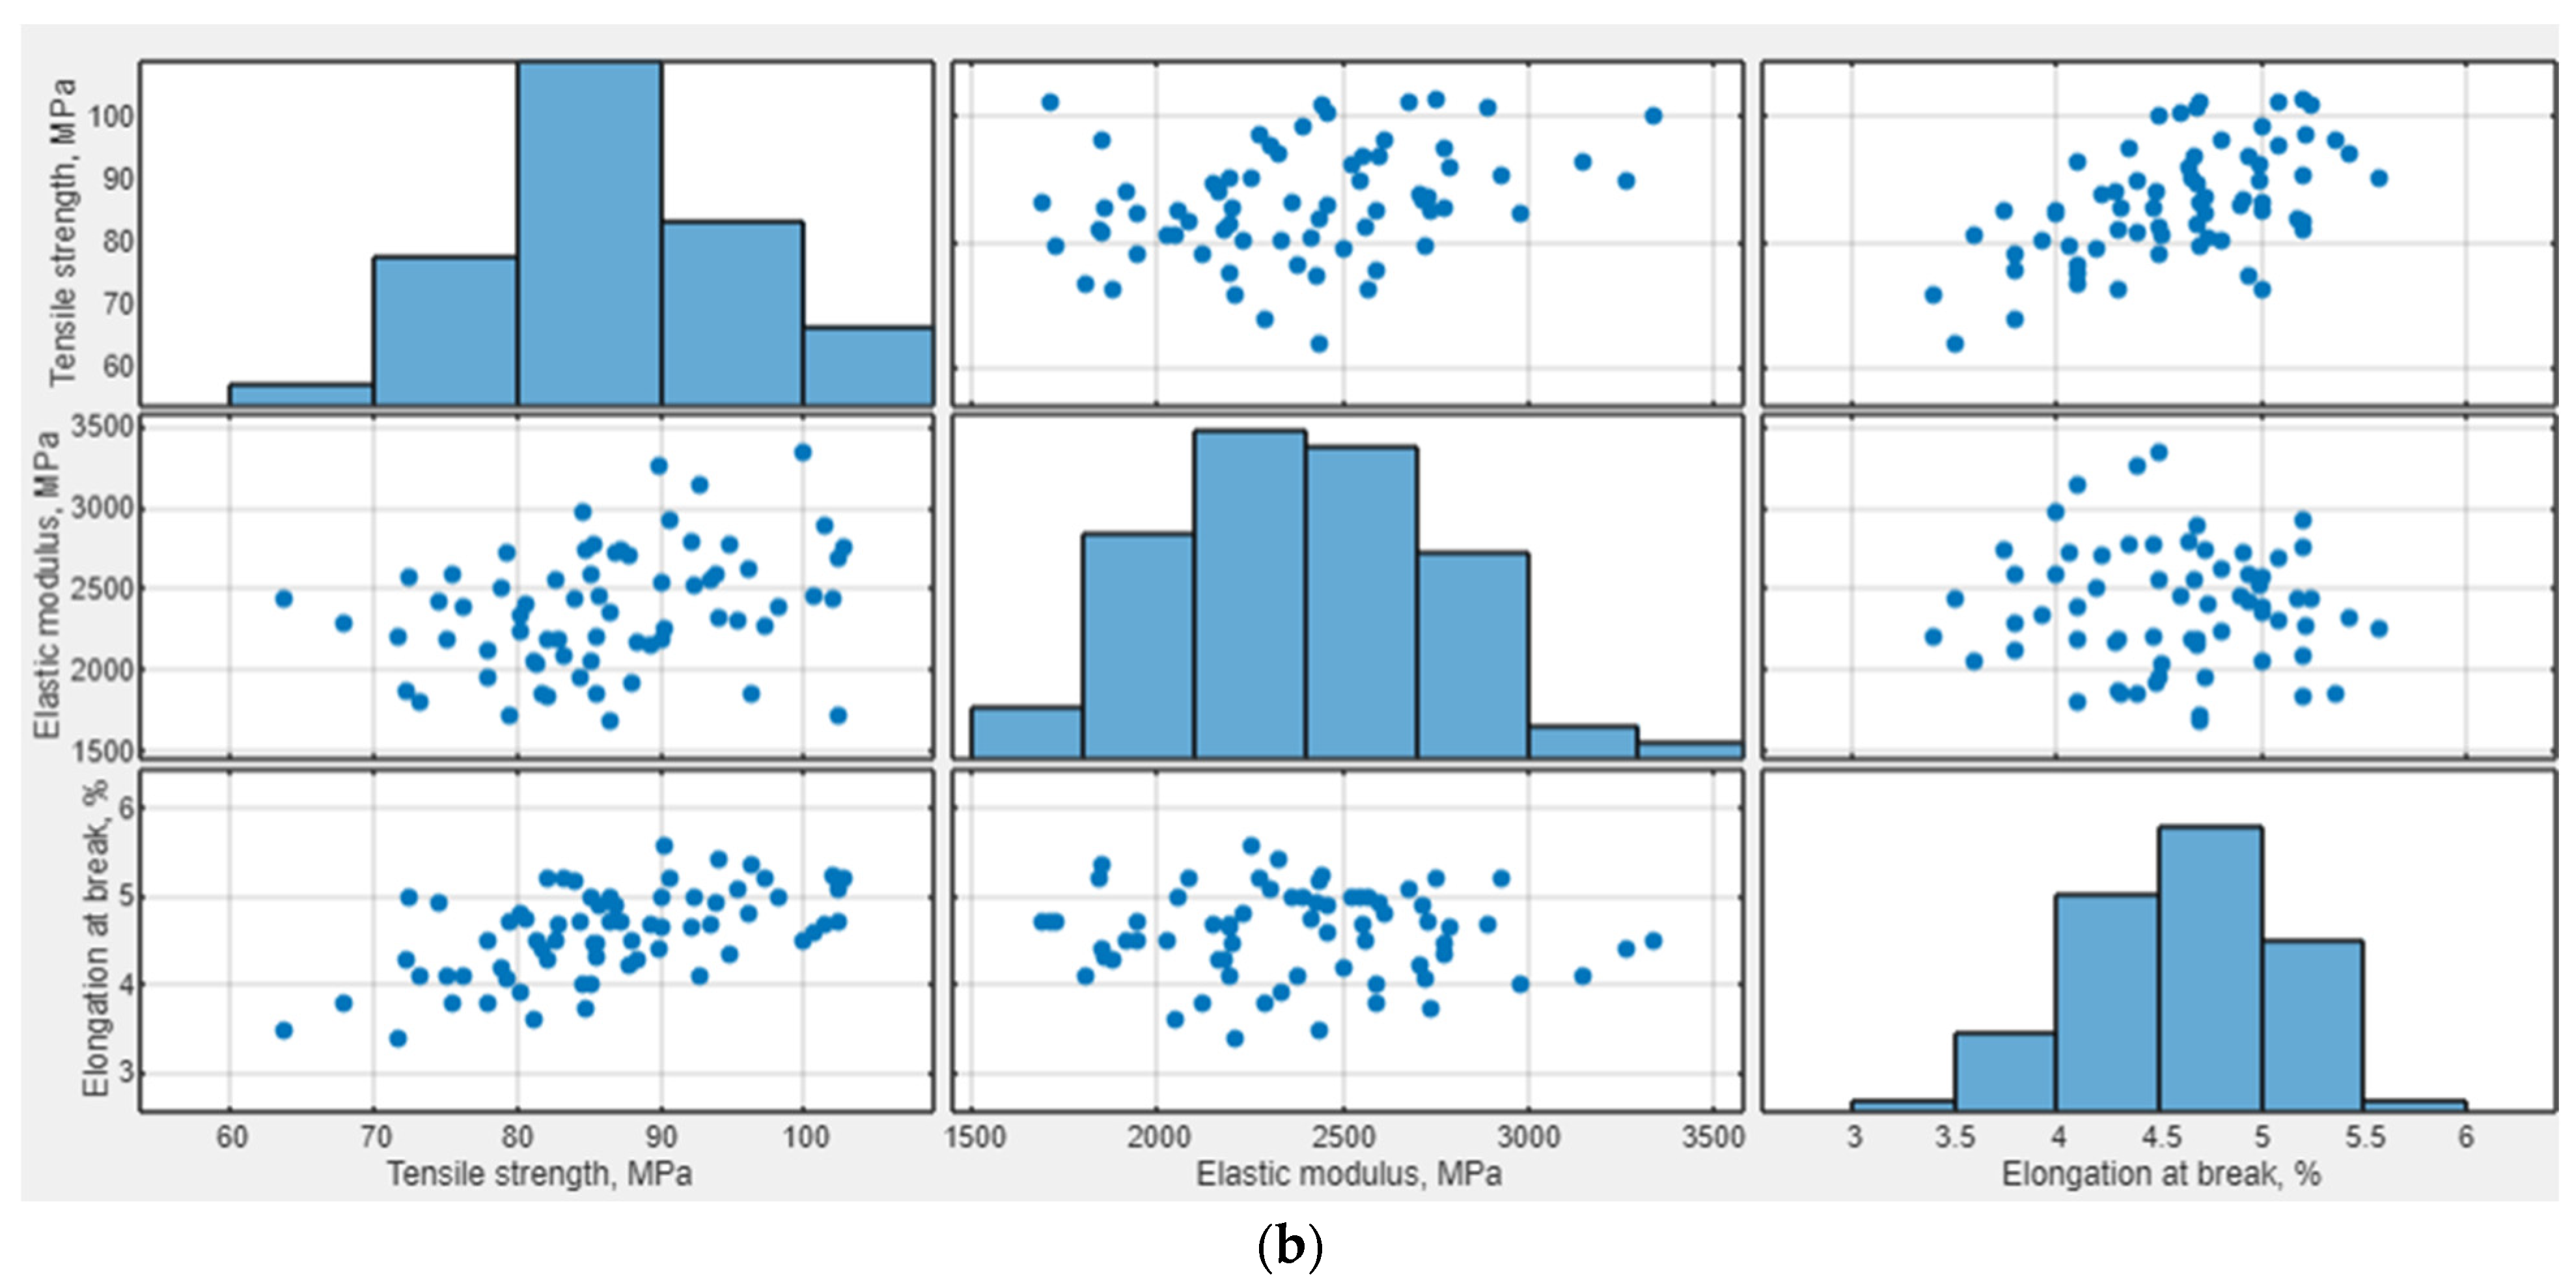
The obtained data were analyzed by drawing dependencies of the mechanical properties of the samples of the PEEK/30GF composite on the 3D printing parameters (
Figure 4a), interdependencies of their mechanical properties (
Figure 4b), and calculating regression models for each of them. Among the obtained data, six laboratory experiments were identified and excluded from a subsequent analysis, the results of which were outside the range of confidence intervals (at a significance level of 0.05).
The assumption of a significant nonlinear dependence of the mechanical properties of the samples on the 3D printing parameters was observed in
Figure 4a, which was confirmed by both low coefficients of determination values and high standard errors of multiple linear regression models (
Table 6).
4.2. Analysis of Priori Knowledge
4.2.1. Prerequisites for a Priori Knowledge
A preliminary analysis of both 3D-printing parameters and predicted mechanical properties of the samples was based on previously acquired knowledge about the features of the analyzed process:
The 3D printing process could not be implemented under one of the following conditions: the Text extruder temperature was below the melting point of the polymer matrix (mode 16), the absence of the fed material (at ν = 0 rpm, mode 20 or V3D = 0 mm/s, mode 18). So, the mechanical properties of such samples were assumed to be zero.
It was also assumed that the mechanical properties were lower at an excessively high Text extruder temperature of 560 °C (mode 17) due to possible thermal degradation of PEEK. The same applied to high V3D travel speed of 60 mm/s (mode 19) and ν extrusion rate of 8 rpm (mode 21), based on the assumption that an excessive amount of the extruded polymer did not allow a homogeneous structure to form.
The mechanical properties of the samples of the PEEK/30GF composite, summarized on the basis of a priori knowledge, are presented in the
Supplementary (Tables S1 and S2) section.
4.2.2. Selecting Acceptable Minimum Values
Then, the authors expertly formulated the requirements for the minimum acceptable values of the output parameters (the mechanical properties according to
Table 7). Checking the results of the laboratory experiments for compliance with these acceptable values showed that there was not a single mode among the applied ones (
Table 5) that would meet all the requirements. However, modes 4, 5, 7, 8, and 10 were identified, for which the acceptable minimum values were achieved in at least one experiment (
Figure 5).
4.3. ANN-Based Computer Simulation of the 3D Printing Process
In this study, the authors used two types of simple ANNs that provided nonlinear computer simulation: feedforward networks (FFNNs) and radial basis function networks (RBFNNs). Their inputs were the 3D-printing parameters, while the outputs were the mechanical properties. The selection of both architecture and parameters was described in detail previously [
25,
31,
32], so the applied approach corresponded to that reported in [
25].
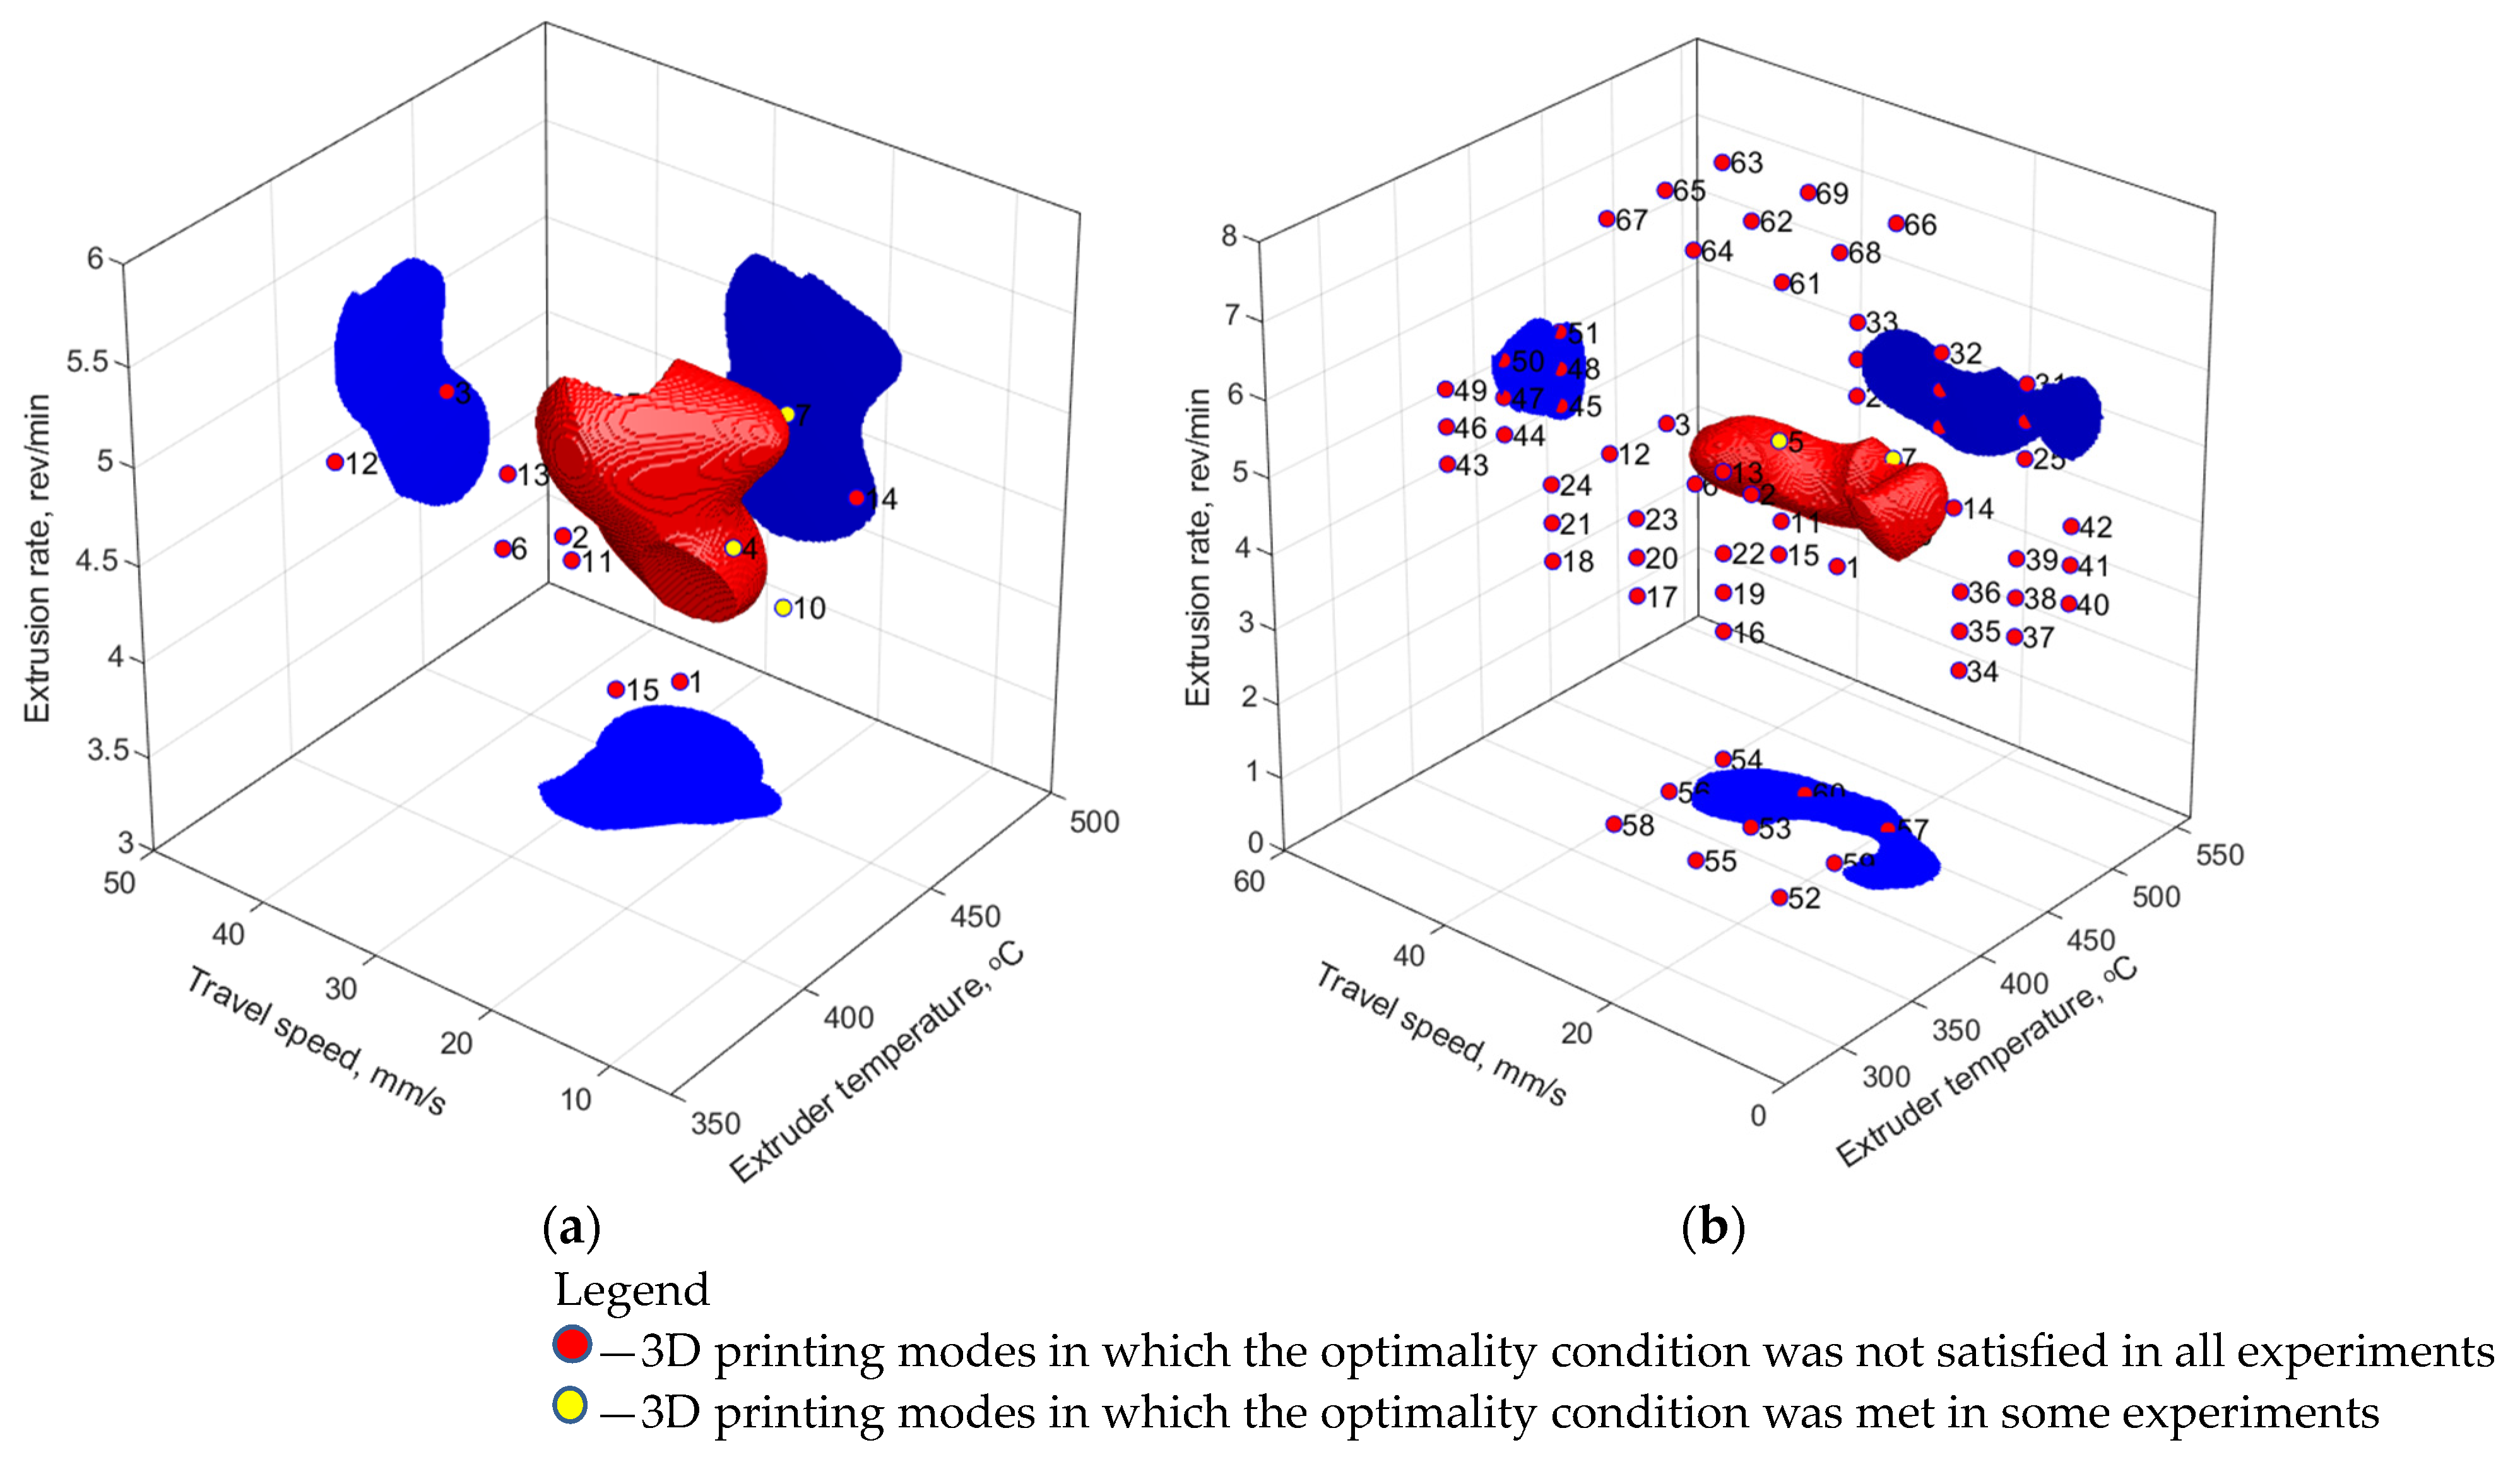
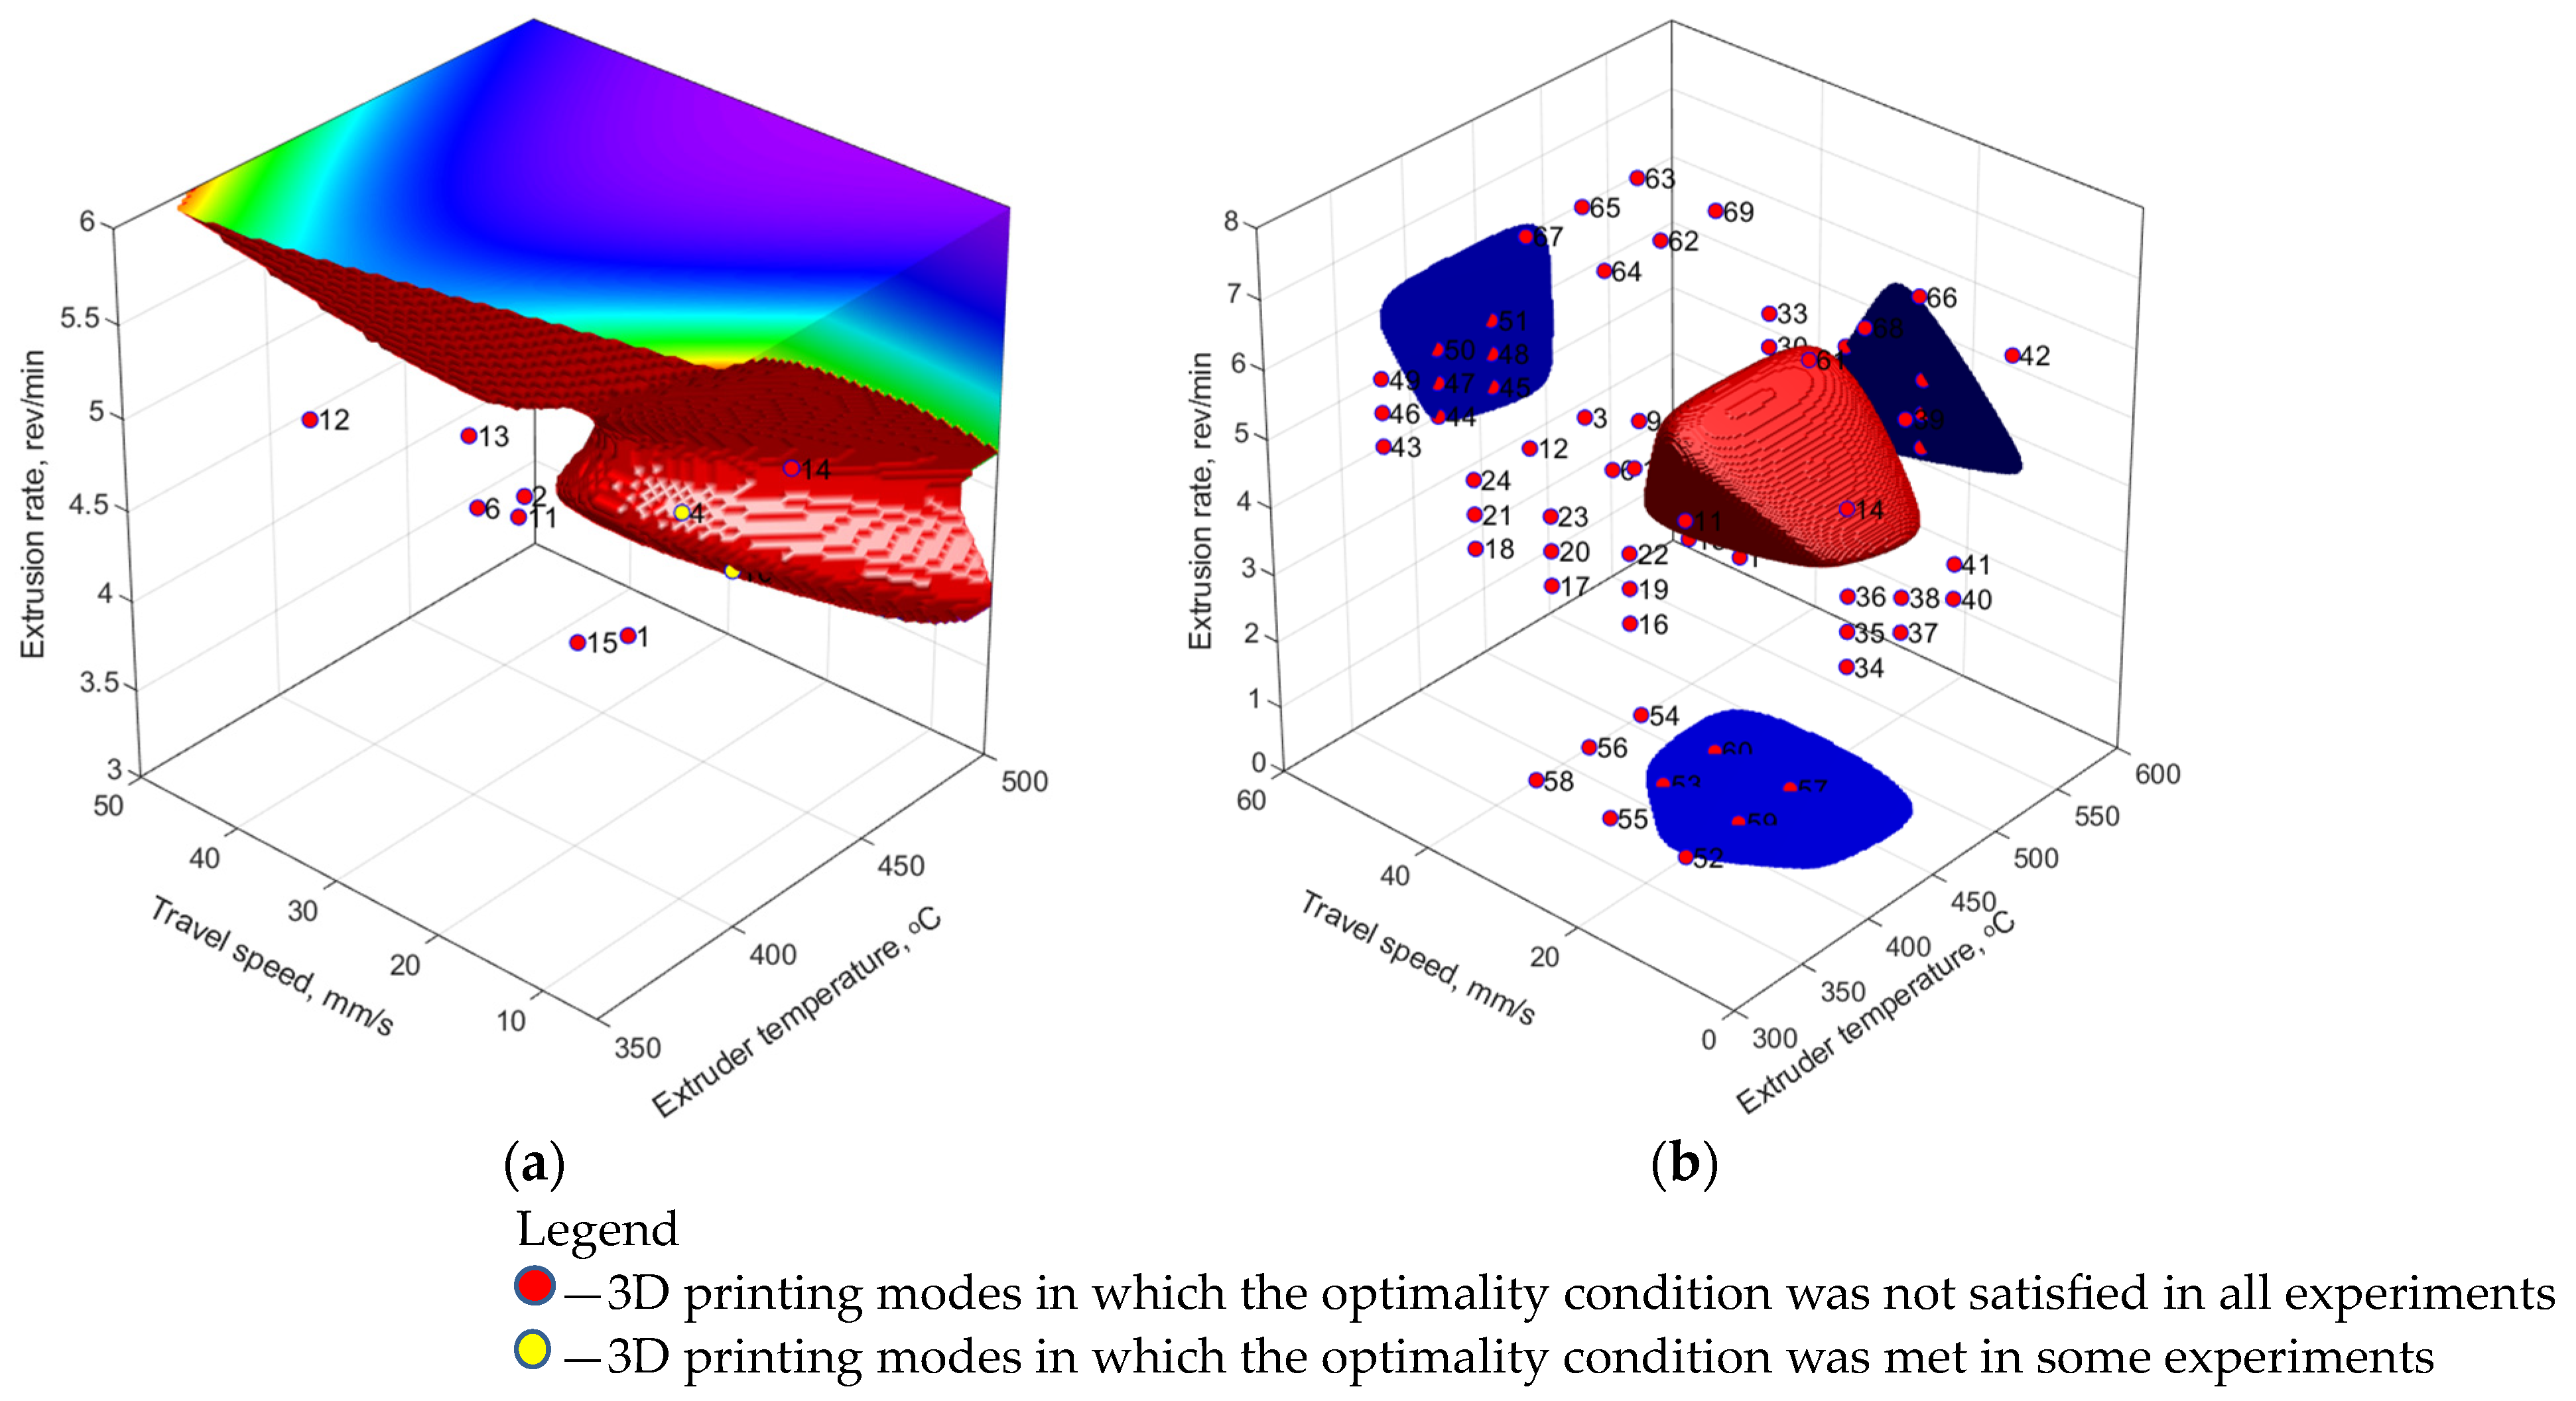
In the first stage, a sample containing the verified experimental data was used, i.e., a total of 15 vectors of the 3D printing parameters (modes) and 66 vectors of the corresponding mechanical properties. For the FFNN model, the number of hidden layer neurons (from 3 to 8) and activation functions (linear, hyperbolic tangent sigmoid, log-sigmoid) were varied. Upon their learning, synthesized property vectors formed from the experimental values with the addition of pseudo-random numbers with zero mathematical expectation and normalized standard deviation equal to 0.01 were added to the training sample. Computer simulation was carried out many times with an enumeration of the main parameters of the ANNs. For the RBFNN model, the ‘spread’ parameter varied from 0.1 to 0.9, while the ‘goal’ was changed within the 0.100–0.001 range. The results of assessing the areas of suboptimal parameters (SOPs) of the 3D printing process (
Table 6) are shown in
Figure 6a and
Figure 7a for the RBFNN and FFNN models, respectively.
In the second stage, the training sample included the experimental data and a priori knowledge. In order to estimate the influence of training sample size, its effect on the accuracy of model construction for the FFNN was carried out at variation of the number of vectors of input parameters as well as the amount of synthesized data,
Figure 8. During the synthesis of the models, the mean square error (MSE) was utilized as the optimization function. It allowed for the characterization of the deviation of the model from the training set. The mean absolute deviation (MAD) of the normalized model values over priory values not taken/specified/determined in the training set was utilized for characterizing the prognosis capability of the models. The verification of the FFNN models over the data of priory knowledge planes has shown quite different dependence: the presence of MAD maximum at the sample size of 69 modes (vectors of the input parameters) and 120 vectors of the corresponding mechanical properties. At the same time, for the FFNN model, the training sample was enlarged by synthesized data with characteristics similar to those at the first stage (see above). It might be concluded that the latter has increased the prognosis capabilities of the developed models. The best characteristics of the ANNs were sought in the same ranges, so two models were selected, for which SOP areas were characterized by the simplest structures (
Figure 6b and
Figure 7b).
Table 8 presents the statistical characteristics of the learning results for the selected models. Comparing them with the data obtained using the regression model (
Table 6), it has been concluded that computer simulation using the ANNs, due to its nonlinearity, was characterized by a low mean square error (MSE) but a high determination coefficient (R
2). The use of a priori knowledge made it possible to increase the determination coefficient, i.e., reduce the unexplained variance of the model. However, the root-mean-square error increased, which was a natural result of enhancing the modeling area in the extrapolation zone.
For the RBFNN model (
Figure 6a), the SOP area was finite and closed. The 3D printing modes, which partially satisfied the optimality condition, turned out to be outside its boundaries. The addition of a priori knowledge to the training sample led to a slight enlargement of the SOP area, compliance with the modes that partially satisfied the target mechanical properties, and significant complication of its shape (
Figure 6b).
The SOP area, drawn according to the FFNN model after its learning based only on the experimental and synthesized data, was not limited to four planes: high values of both T
ext extruder temperature and ν extrusion rate, as well as both low and high levels of the V
3D travel speed (
Figure 7a). Such behavior was caused by the location of the satisfactory experimental results on the boundaries of the SOP area and the poor ability of the FFNN model to be extrapolated. Respectively, such a model predicted the target mechanical properties at the boundaries of the analyzed data area and could not be considered adequate. Adding a priori knowledge in the field of extrapolation to the training sample made it possible to limit the SOP area throughout the entire volume and localize the predicted optimal parameters (
Figure 7b).
Within the SOP areas, the 3D printing parameters were sought, at which the mechanical properties were maximum. The weighted root-mean-square value was chosen as the maximum search measure. The search results are presented in
Table 8. Excluding the “FFNN 66 + 132” model from consideration, all other ones enabled the prediction of the optimal values of both T
ext extruder temperatures of 450–460 °C and ν extrusion rates of 4.1–4.59 rpm. A noticeable discrepancy in the predicted data was observed only for the V
3D travel speeds (from 13.92 up to 30.91 mm/s), which could be explained by the difference in the general simulation approaches.
The RBFNN model was based on the concept of minimizing approximation in each value of the training sample and searching for the minimum predicted values in the extrapolation zones. Therefore, it was obvious that it predicted the optimal values close to the known parameters in all cases. Conversely, the root-mean-square minimization was applied in the FFNN model to identify general trends in the training sample. This algorithm could lead (as was shown in the studied case) to the removal of the predicted optimal parameters from the region of known values.
The predicted 3D printing parameters were not duly verified for several reasons. Firstly, they differed slightly from the results of the laboratory experiments, enhancing the probability of obtaining similar data. Secondly, the results of the applied Taguchi method (
Section 3) were in qualitative agreement with the data obtained by computer simulation using the ANNs. Thirdly, the achieved mechanical properties of the additively manufactured samples were lower than the values given by the manufacturer of the PEEK/30GF feedstock for injection molding, so the reasons for this phenomenon are discussed below.


