Article

The Role of Drying Schedule and Conditioning in Moisture Uniformity in Wood: A Machine Learning Approach

1
Department of Wood Science, University of British Columbia, Vancouver, BC V6T 1Z4, Canada
2
FPInnovations, Vancouver, BC V6T 1Z4, Canada
3
Department of Mechanical Engineering, University of British Columbia, Vancouver, BC V6T 1Z4, Canada
*
Author to whom correspondence should be addressed.
Polymers 2023, 15(4), 792; https://doi.org/10.3390/polym15040792
Submission received: 12 January 2023 / Revised: 30 January 2023 / Accepted: 2 February 2023 / Published: 4 February 2023
(This article belongs to the Special Issue Advances in Wood Composites V)

Abstract

:
Monitoring the moisture content (MC) of wood and avoiding large MC variation is a crucial task as a large moisture spread after drying significantly devalues the product, especially in species with high green MC spread. Therefore, this research aims to optimize kiln-drying and provides a predictive approach to estimate and classify target timber moisture, using a gradient-boosting machine learning model. Inputs include three wood attributes (initial moisture, initial weight, and basic density) and three drying parameters (schedule, conditioning, and post-storage). Results show that initial weight has the highest correlation with the final moisture and possesses the highest relative importance in both predictive and classifier models. This model demonstrated a drop in training accuracy after removing schedule, conditioning, and post-storage from inputs, emphasizing that the drying parameters are significant in the robustness of the model. However, the regression-based model failed to satisfactorily predict the moisture after kiln-drying. In contrast, the classifying model is capable of classifying dried wood into acceptable, over-, and under-dried groups, which could apply to timber pre- and post-sorting. Overall, the gradient-boosting model successfully classified the moisture in kiln-dried western hemlock timber.

1. Introduction

Timber drying impacts the final product quality and plays an essential role in the dimensional stability, and mechanical properties of timber, as the physical [1], elastic and viscoelastic properties of wood are moisture-dependent [2]. Additionally, timber drying facilitates coating, cutting, and remanufacturing procedures, rendering dried wood less susceptible to deformation, cracks, and decay [3,4]. Target moisture (Mt) in kiln-drying should correspond to the indoor or outdoor environment where the final product will be used. A well-managed drying operation dramatically improves timber drying quality [5,6].
Considerable variability in initial moisture (Mi) among timber pieces of the same kiln batch is inevitable, especially in softwoods with substantial differences between the properties of sapwood and heartwood [7]. Different timber pieces in the same load undergo various drying levels due to inherent variations in Mi and other wood properties [8,9]. Consequently, final moisture (Mf) among timber fluctuates along a broad range. Large-scale kilns aggravate this problem because of the non-uniform kiln-drying conditions in the chamber’s width, depth, and height [10]. Non-uniformity of the final moisture between kiln-dried timber pieces substantially impacts their monetary values. Over-dried wood is in less demand in the market since over-drying increases shrinkage and shapes distortion [11]. Additionally, under-dried wood is hardly acceptable in the market due to its susceptibility to fungal decay and low mechanical strength [11].
Almost every wood species requires a specific drying schedule, which could be time-based, moisture-based, or combined [12]. Drying schedules involve predetermined heat, humidification, ventilation, and air circulation [13,14]. Combined (time- and moisture-based) schedules typically apply to the kiln-drying coastal softwood species in British Columbia, Canada. In a combined schedule, drying factors are time-based from the beginning of the drying until around the fiber saturation point (Mfsp). However, upon reaching that point, they become constant until reaching Mt. Drying schedules’ aggressiveness influences the final moisture variation in a kiln batch [8,15]. Moreover, post-drying steps such as conditioning in kilns and outdoor storage may apply to reduce moisture variation within and between timber pieces [16,17]. Conditioning is a high-humidity step at the end of some drying schedules (after reaching Mt) to minimize the moisture differences between and within timber pieces (shell and core of timber) and relieve internal stresses (casehardening) [9]. However, some Japanese sawmills use stickers and store kiln-dried batches outdoors for a period of one to two weeks to reduce the moisture variation and moisture profile in thickness, resulting in internal stress dissipation [16].
Pacific coast hemlock (also known as ‘‘hem-fir’’) is an abundant source of fiber on the British Columbia coast which is comprised of western hemlock (Tsuga heterophylla) and amabilis fir (Abies amabilis) [18]. Thick solid hem-fir products, specifically timbers with cross-sectional areas of 90 × 90 mm2, 105 × 105 mm2, and 115 × 115 mm2 (also known as “baby-squares”) are commonly the preferred material in timber construction, especially in Japan, which is one of BC’s largest overseas markets [19]. Hemlock is a difficult-to-dry species due to its naturally high green moisture content, the presence of wet wood (or wet pockets), and often compression wood. Past research focused on optimizing drying schedules [15,20,21], pre-sorting [22,23,24], and post-sorting [25] strategies. Studies examining the collapse and recovery during the drying process [26,27], cracking occurrence during the drying process [28], and numerical simulations of coupled moisture and heat transfer in wood during kiln drying [29] were also reported in the literature. Kiln-drying scheduling is also covered in some studies [30,31] as an important factor impacting the final moisture content and drying defects [32]. In addition, previous studies focused on characterizing and modeling final moisture and its spread in air-dried [33], radio-frequency kiln-dried [34,35,36], heat treated [37], and heat-and-vent kiln-dried batches [38,39,40]. Additionally, previous studies investigated moisture prediction in kiln-dried lumber merely based on wood properties; however, the combined effects of drying conditions and wood properties on the moisture uniformity after kiln-drying still represent a knowledge gap [41]. Furthermore, initial wood indices, especially Mi content and its variation, remarkably affect Mf variation. Therefore, a holistic approach is required to characterize the combined effects of wood indices and drying schedules on wood properties after kiln-drying [38]. For this reason, the current study aims to investigate and predict the Mf of kiln baby-square western hemlock under different schedules.
Accordingly, a machine learning approach was adopted to study the relationship between the wood properties and to quantify the roles of drying schedule, conditioning, and post-storage. This study uses a gradient-boosting algorithm known as TreeNet for moisture prediction and classification. The most widely used machine learning models in the literature on wood science and technology are artificial neural networks (ANNs). They have been used in a wide range of applications for wood identification [42,43], defect detection [42,43], and wood properties prediction [44,45]. The most emphases were on employing the multilayer perceptron (MLP) model [46,47,48]. However, compared to ANNs, fewer studies investigated the performance of ensemble machine learning methods such as gradient boosting for predicting wood properties. Ensemble learning improves prediction accuracy by using multiple machine learning algorithms known as a weak learner and fusing the results by applying a different voting mechanism [49]. This study uses the TreeNet gradient boosting model, variable clustering, and correlation analysis to predict the Mf in kiln-dried western hemlock and explain the role of initial wood properties, drying schedules, and conditioning on the moisture distribution in dried timber.

2. Materials and Methods
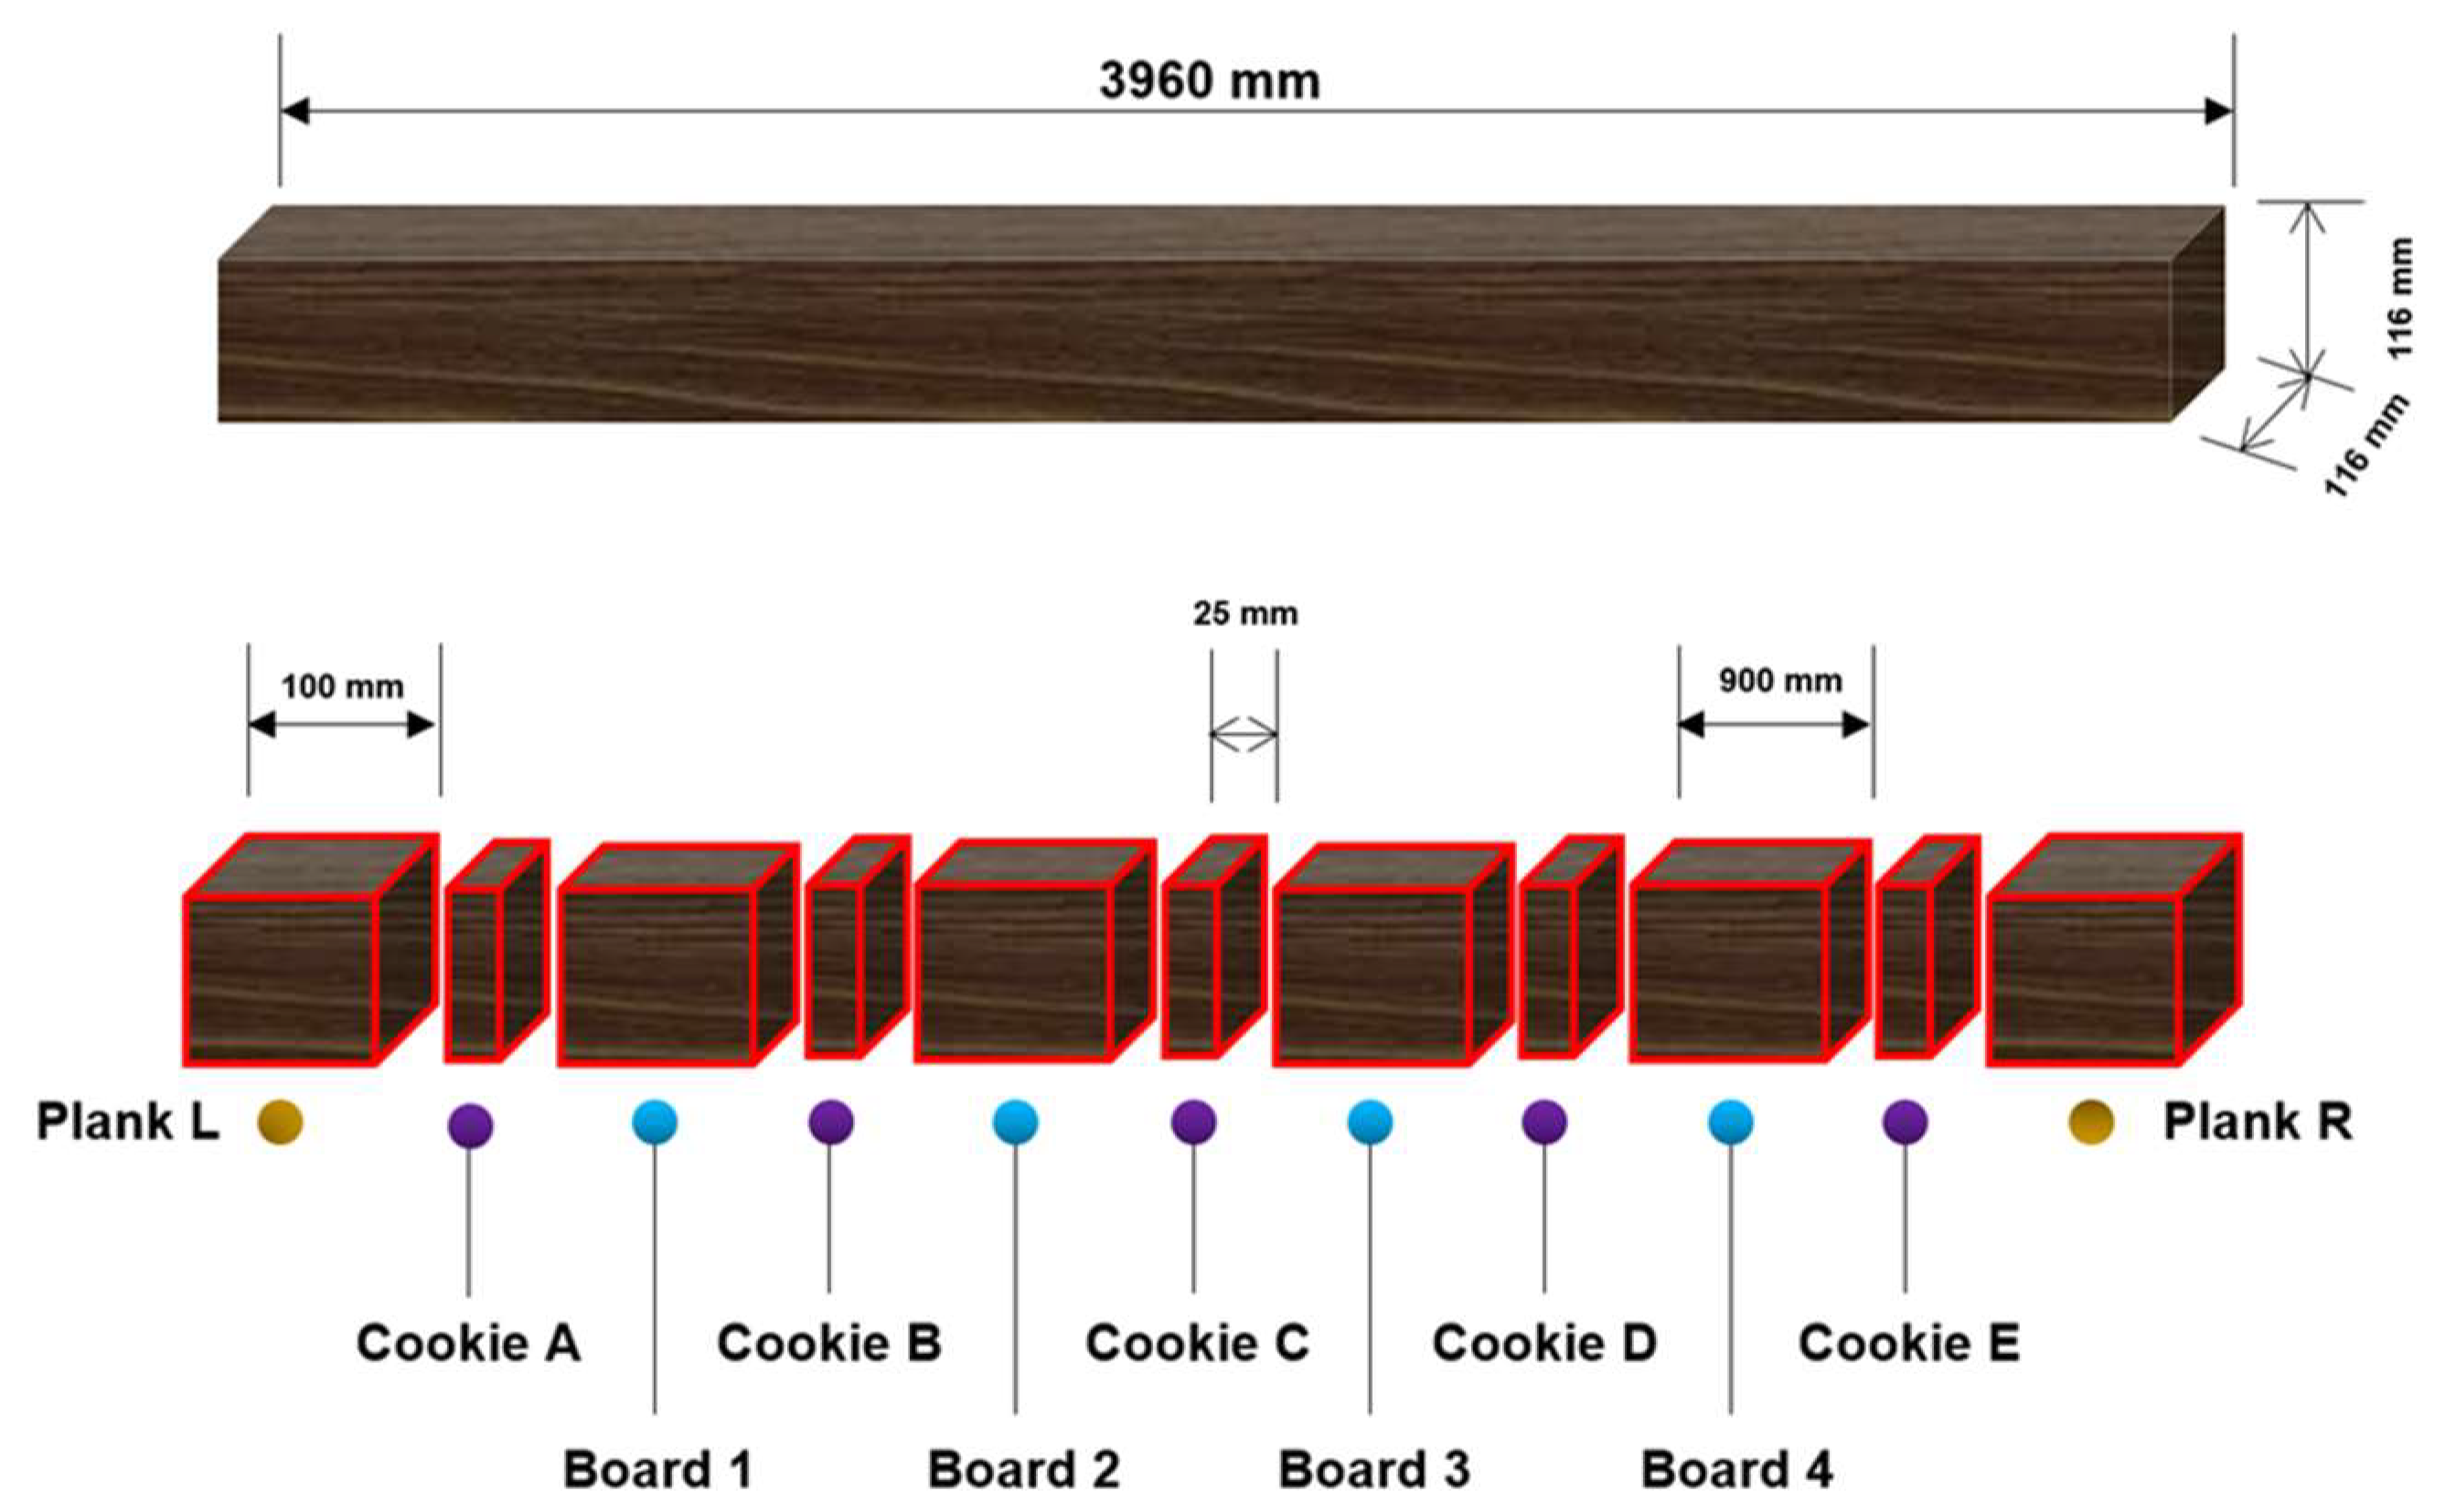
2.1. Materials

A local sawmill located on Vancouver Island, British Columbia provided 96 timber pieces of second-growth western hemlock baby squares (116 mm × 116 mm; 3.96 m in length) for this study. All timber pieces were in green condition with a grade of II (standard) or better [50]. Each piece was cut into four kiln specimens and five cookies using a circular saw. Figure 1 represents the cutting protocol. According to the cutting protocol, one section of 100 mm in length was removed from each end of every timber piece to mitigate the risk of end moisture loss. Subsequently, four kiln specimens and five cookies were cut from each timber piece. The length of the kiln specimens and cookies were 900 mm and 25 mm, respectively. Overall, 480 cookies and 384 kiln specimens were provided from the entire timber population.

2.2. Experiments

Cookies were used to measure Mi and basic density (ρb) according to Kollmann [51] and Skaar [52]. In the next step, six out of 384 kiln specimens were arbitrarily discarded, and the rest (378 kiln specimens) were randomly assigned to nine drying batches. Table 1 summarizes the nine drying runs used in this study. The control drying schedule was applied to the first drying batch, followed by conditioning. The first modified drying schedule had four modes as the combination of presence and absence of conditioning and post-storage. Similarly, the second modified drying schedule had four modes as the combination of existence and nonexistence of conditioning and post-storage.
Each drying batch contained 42 timber specimens. The Mi and ρb could influence the Mf and needed to be neutralized to make the drying results comparable between all drying batches. Therefore, the entire timber population was categorized into nine groups so that Mi and ρb had the smallest standard deviation. The cross-sections of the specimens were coated using polyvinyl acetate (PVA) before drying to prevent end moisture loss. A conventional heat-and-vent kiln with a capacity of 0.73 m3 in FPInnovations, Vancouver, British Columbia was used for this research. The same aluminum stickers, with a weight and length of 8.94 kg and 19 mm, respectively, were used for each drying run, which contained 42 kiln specimens (six rows and seven columns).
The drying schedule developed in the past [53,54] was used as the control (unmodified) schedule. This time-based schedule consisted of eight steps, using a pre-determined number of hours for each step. In step nine, the drying process was switched to a moisture content-based schedule, drying the timber to the Mt without changing the settings. The Mt was set to 12%, the average equilibrium moisture content Memc in Japan from October to May [16]. This Mt was chosen to avoid additional moisture loss from the specimens during post-drying storage time. The last step (conditioning) was time-based. After completing a drying run, the timber pieces cooled down for twelve hours inside the kiln with the doors closed. In addition to the control schedule, two modified drying schedules were also used. In schedule I, the same dry-bulb temperature was reached in the last step and the Memc decreased more aggressively. Schedule II was considered an aggressive drying schedule because it reached a higher dry-bulb temperature in the final drying step, having a steep reduction in Memc. Furthermore, the Mf was kept under 93 °C to avoid developing a honeycomb. Table 2, Table 3 and Table 4 illustrate the control schedule, schedule I, and schedule II, respectively. All kiln specimens were reweighed post-drying to evaluate their final moisture Mf.
After kiln-drying, all timber pieces were reweighed. The kiln-dried weight or final weight (wf) of each sample was used to calculate its Mf, according to the equations documented in Perre [8] and Siau [55].

2.3. Machine Learning

The model inputs included Mi, wi, ρb, types of drying schedule (control, I, II), conditioning (Yes/No), and post-drying storage (Yes/No). The objective was to predict the Mf and classify the timber condition after drying. Accordingly, the boards with Mf < 10 and Mf 19 were labeled as over-dried and under-dried, respectively. Additionally, boards with 10 ≤ Mf < 19 were labeled as normal. TreeNet, a gradient-boosting algorithm, was used for both the regression and classification tasks. It uses the decision tree-based CART model [56] for ensemble learning. Decision tree models are easy to interpret, and the importance of the predictor variables and their relationships can be identified through exploratory data analysis. Details of the CART model can be found elsewhere [57,58]. The CART algorithm was successfully used for check prediction in weathered thermally modified timber [59] and for characterization and classification of artificially weathered wood [60,61,62]. Ensemble learning based on bagging or boosting algorithms could be applied to reduce the variance of a single prediction by a tree using multiple weak learners (decision tree). A benchmark study on medium-sized data has shown that tree-based ensemble models such as XGBoost (eXtreme Gradient Boosting) and random forest could outperform the ANNs despite the presence of irregular patterns in the target function and uninformative features [63]. Random forest uses the bagging method, in which each tree is trained using a subset of data, and the model output is based on the voting scheme among weak learners [64]. Random forest was used to predict the mechanical properties of wood fiber insulation boards [65]. It is also utilized in wood machining for tool temperature prediction [66] and frozen lumber classification [67].
Unlike bagging methods, in which weak learners are trained in a similar way, boosting methods perform the training process sequentially, whereas subsequent models correct the performance of prior models. In the gradient-boosting algorithm of TreeNet, a subset of data is used to train a CART model with a maximum number of terminal nodes or tree depth. Then, the CART model is updated depending on the loss function but shrinks the update by the defined learning rate. The process is repeated, and CART models are sequentially added for a specified number of iterations, equal to the number of trees to build [68]. Boosting methods are used for wood species recognition [69], online color classification systems of solid wood flooring [70], predicting the mechanical properties of wood composite [71], and wood machining monitoring [72]. In this study, the number of trees was set to 2000. Additionally, the maximum terminal node per tree and the minimum number of cases allowed for a tree were set to 12 and 3, respectively. Additionally, the learning rate and subsample fraction were equal to 0.01 and 0.3, respectively. Finally, the number of predictors for node splitting was equal to the square root of the total number of predictors.

3. Results and Discussion

The results will analyze and characterize the selected initial and final wood indices and their correlation with drying parameters, drying schedule aggressiveness, drying condition, and post-drying storage. Then, a predictive approach will be provided to estimate the Mf of each timber piece based on its corresponding wood properties and drying conditions. Finally, a classification approach will be delivered to categorize dried wood into three groups: Acceptable (normal), over-dried, and under-dried.

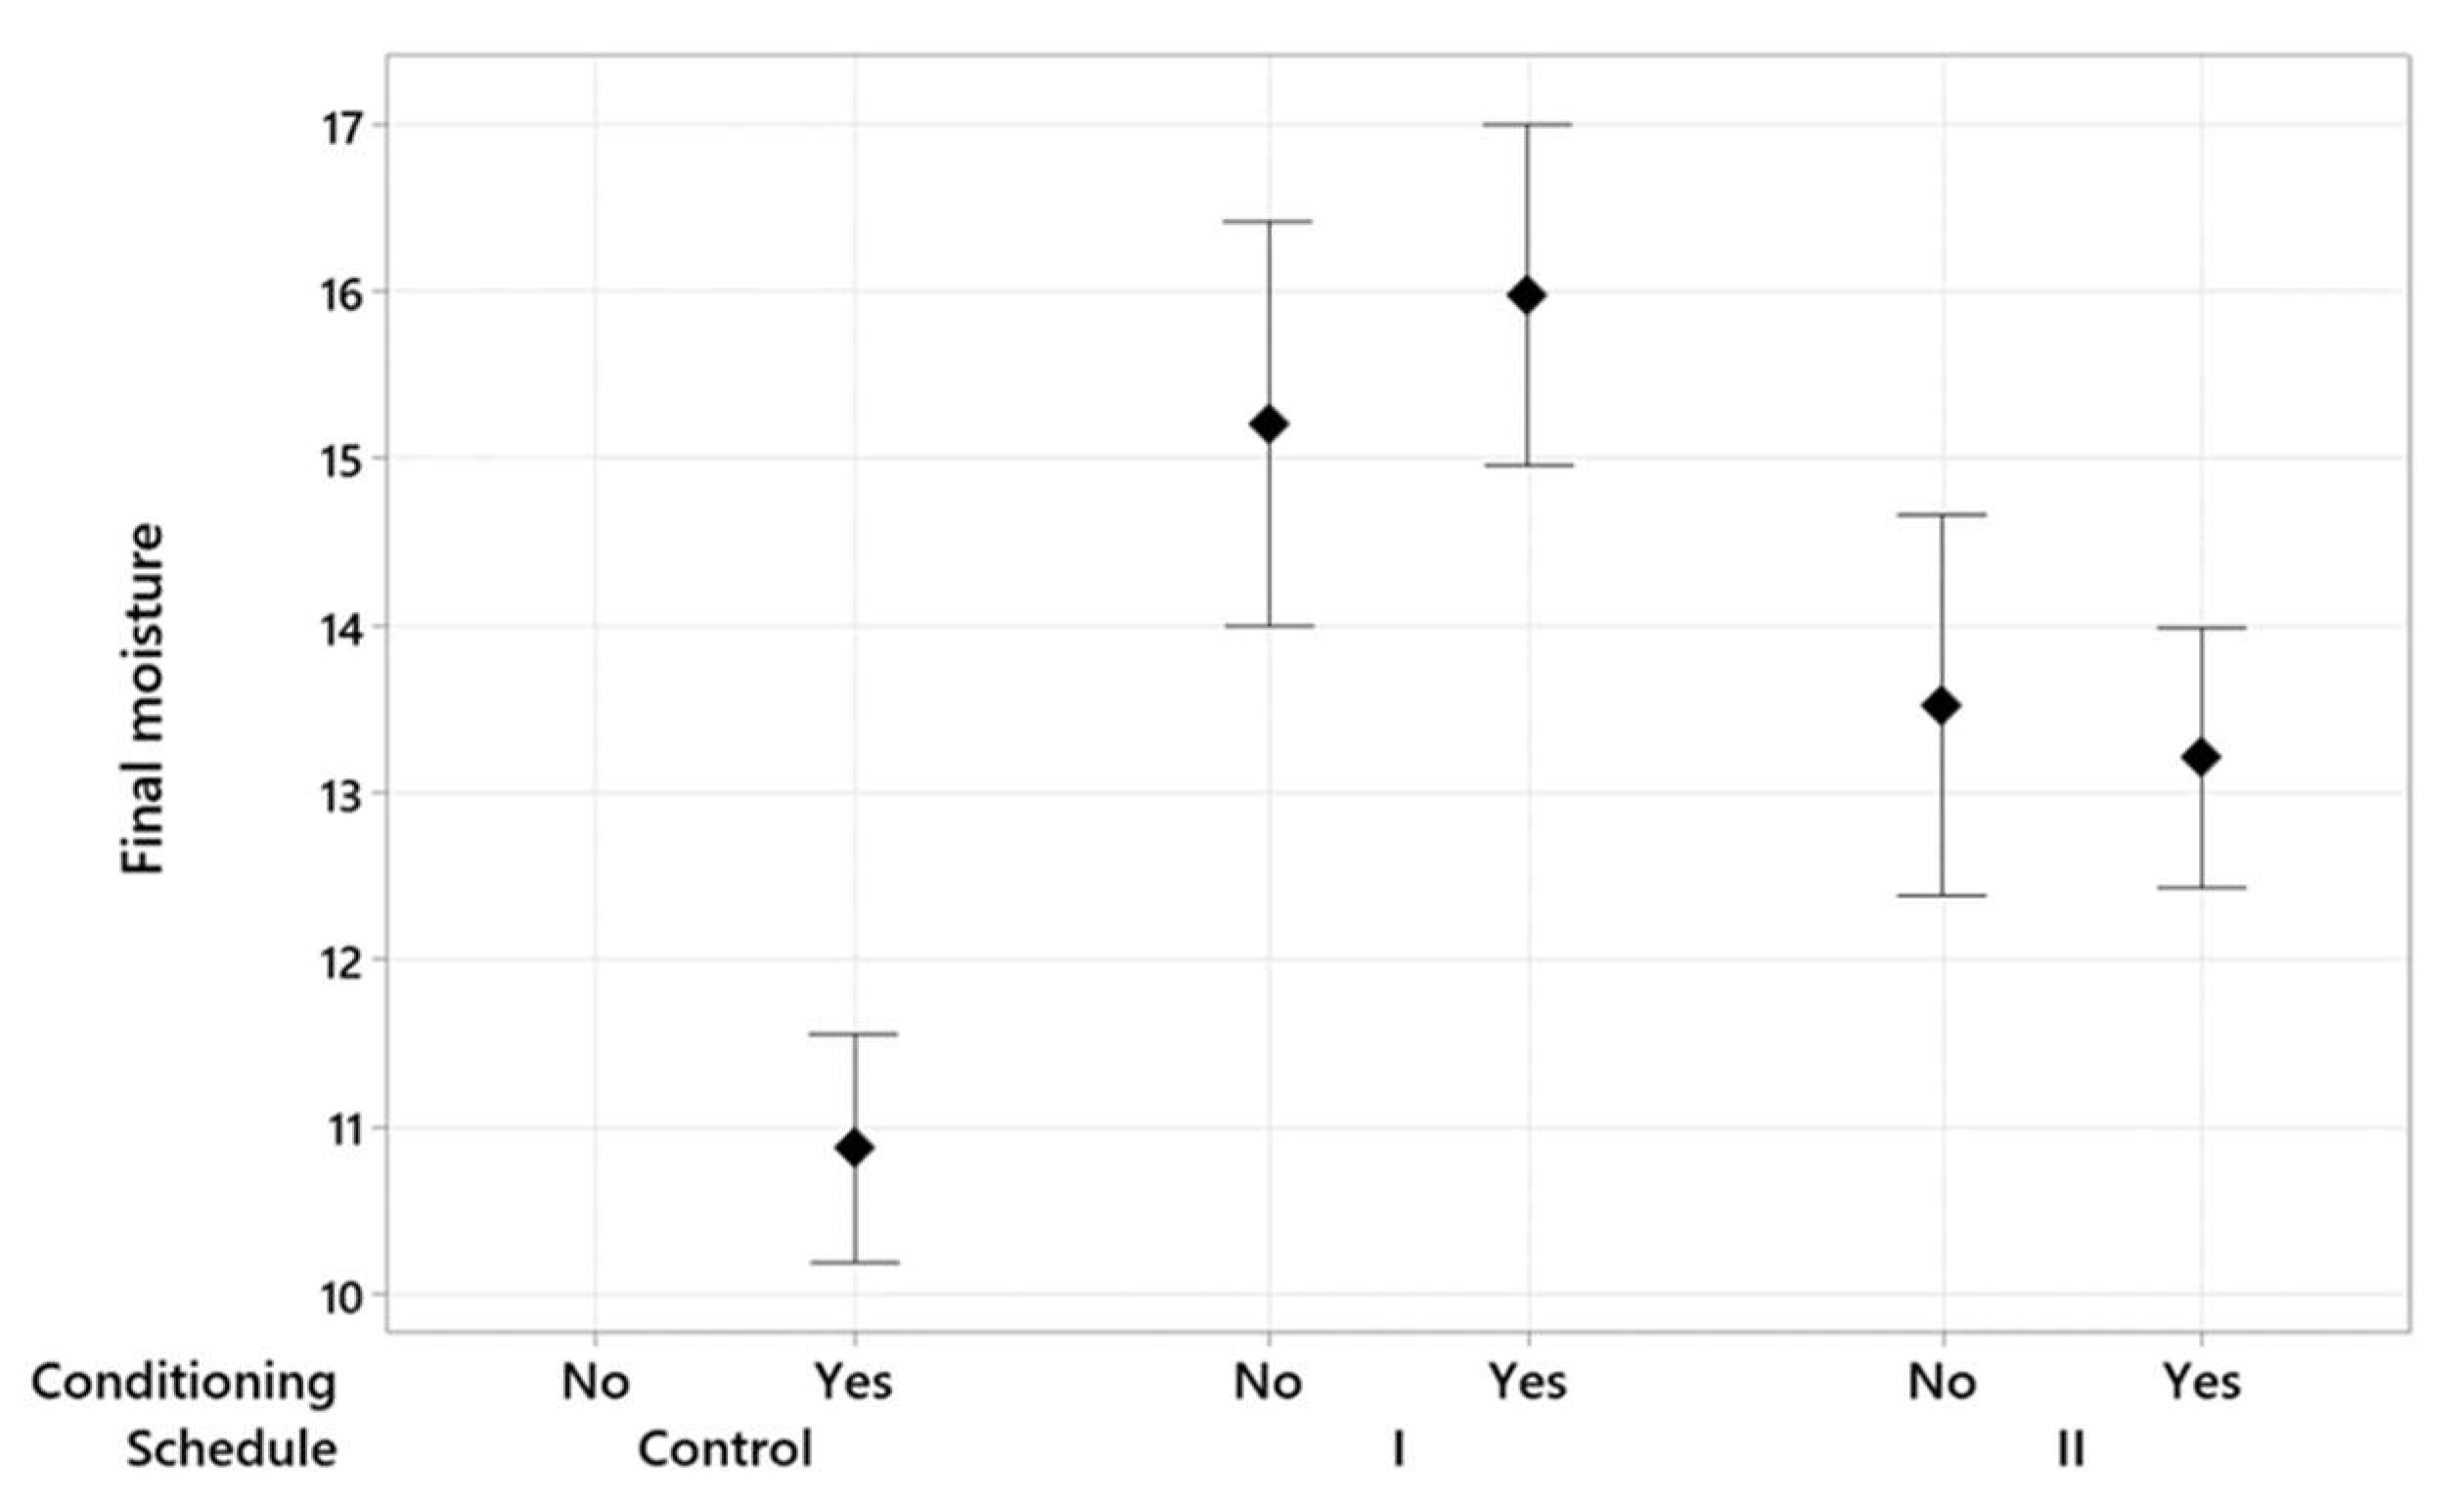
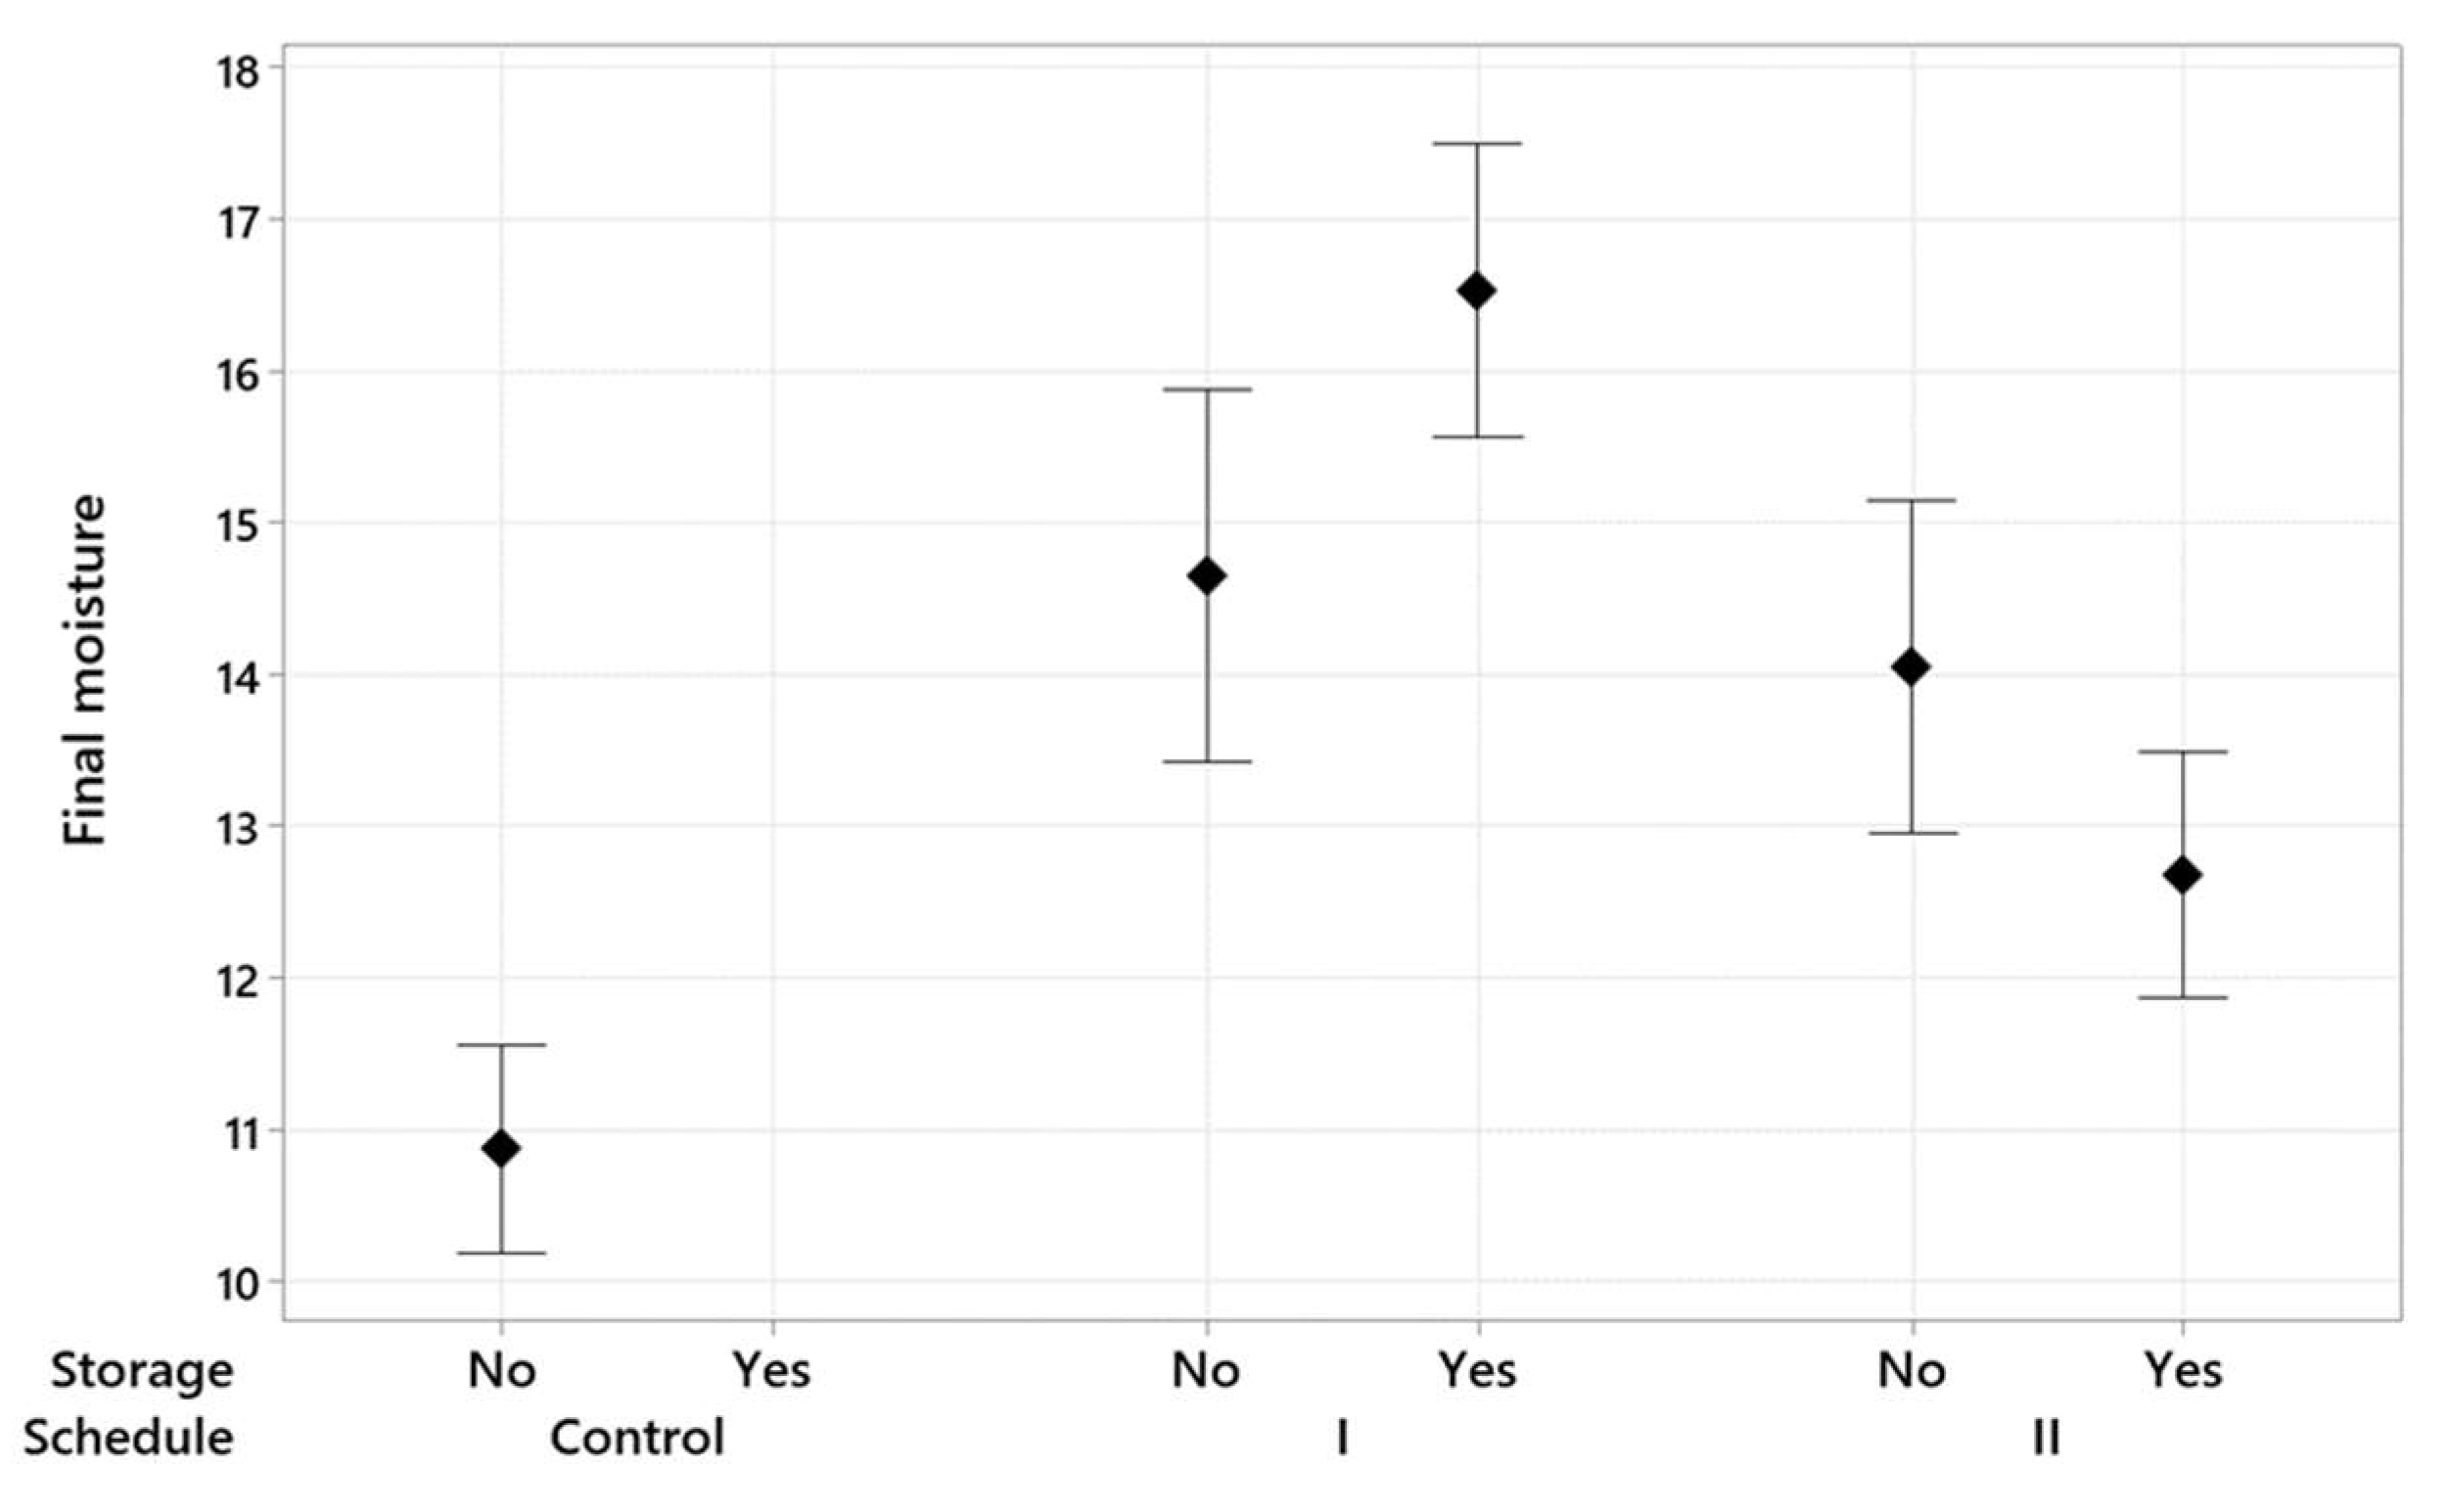
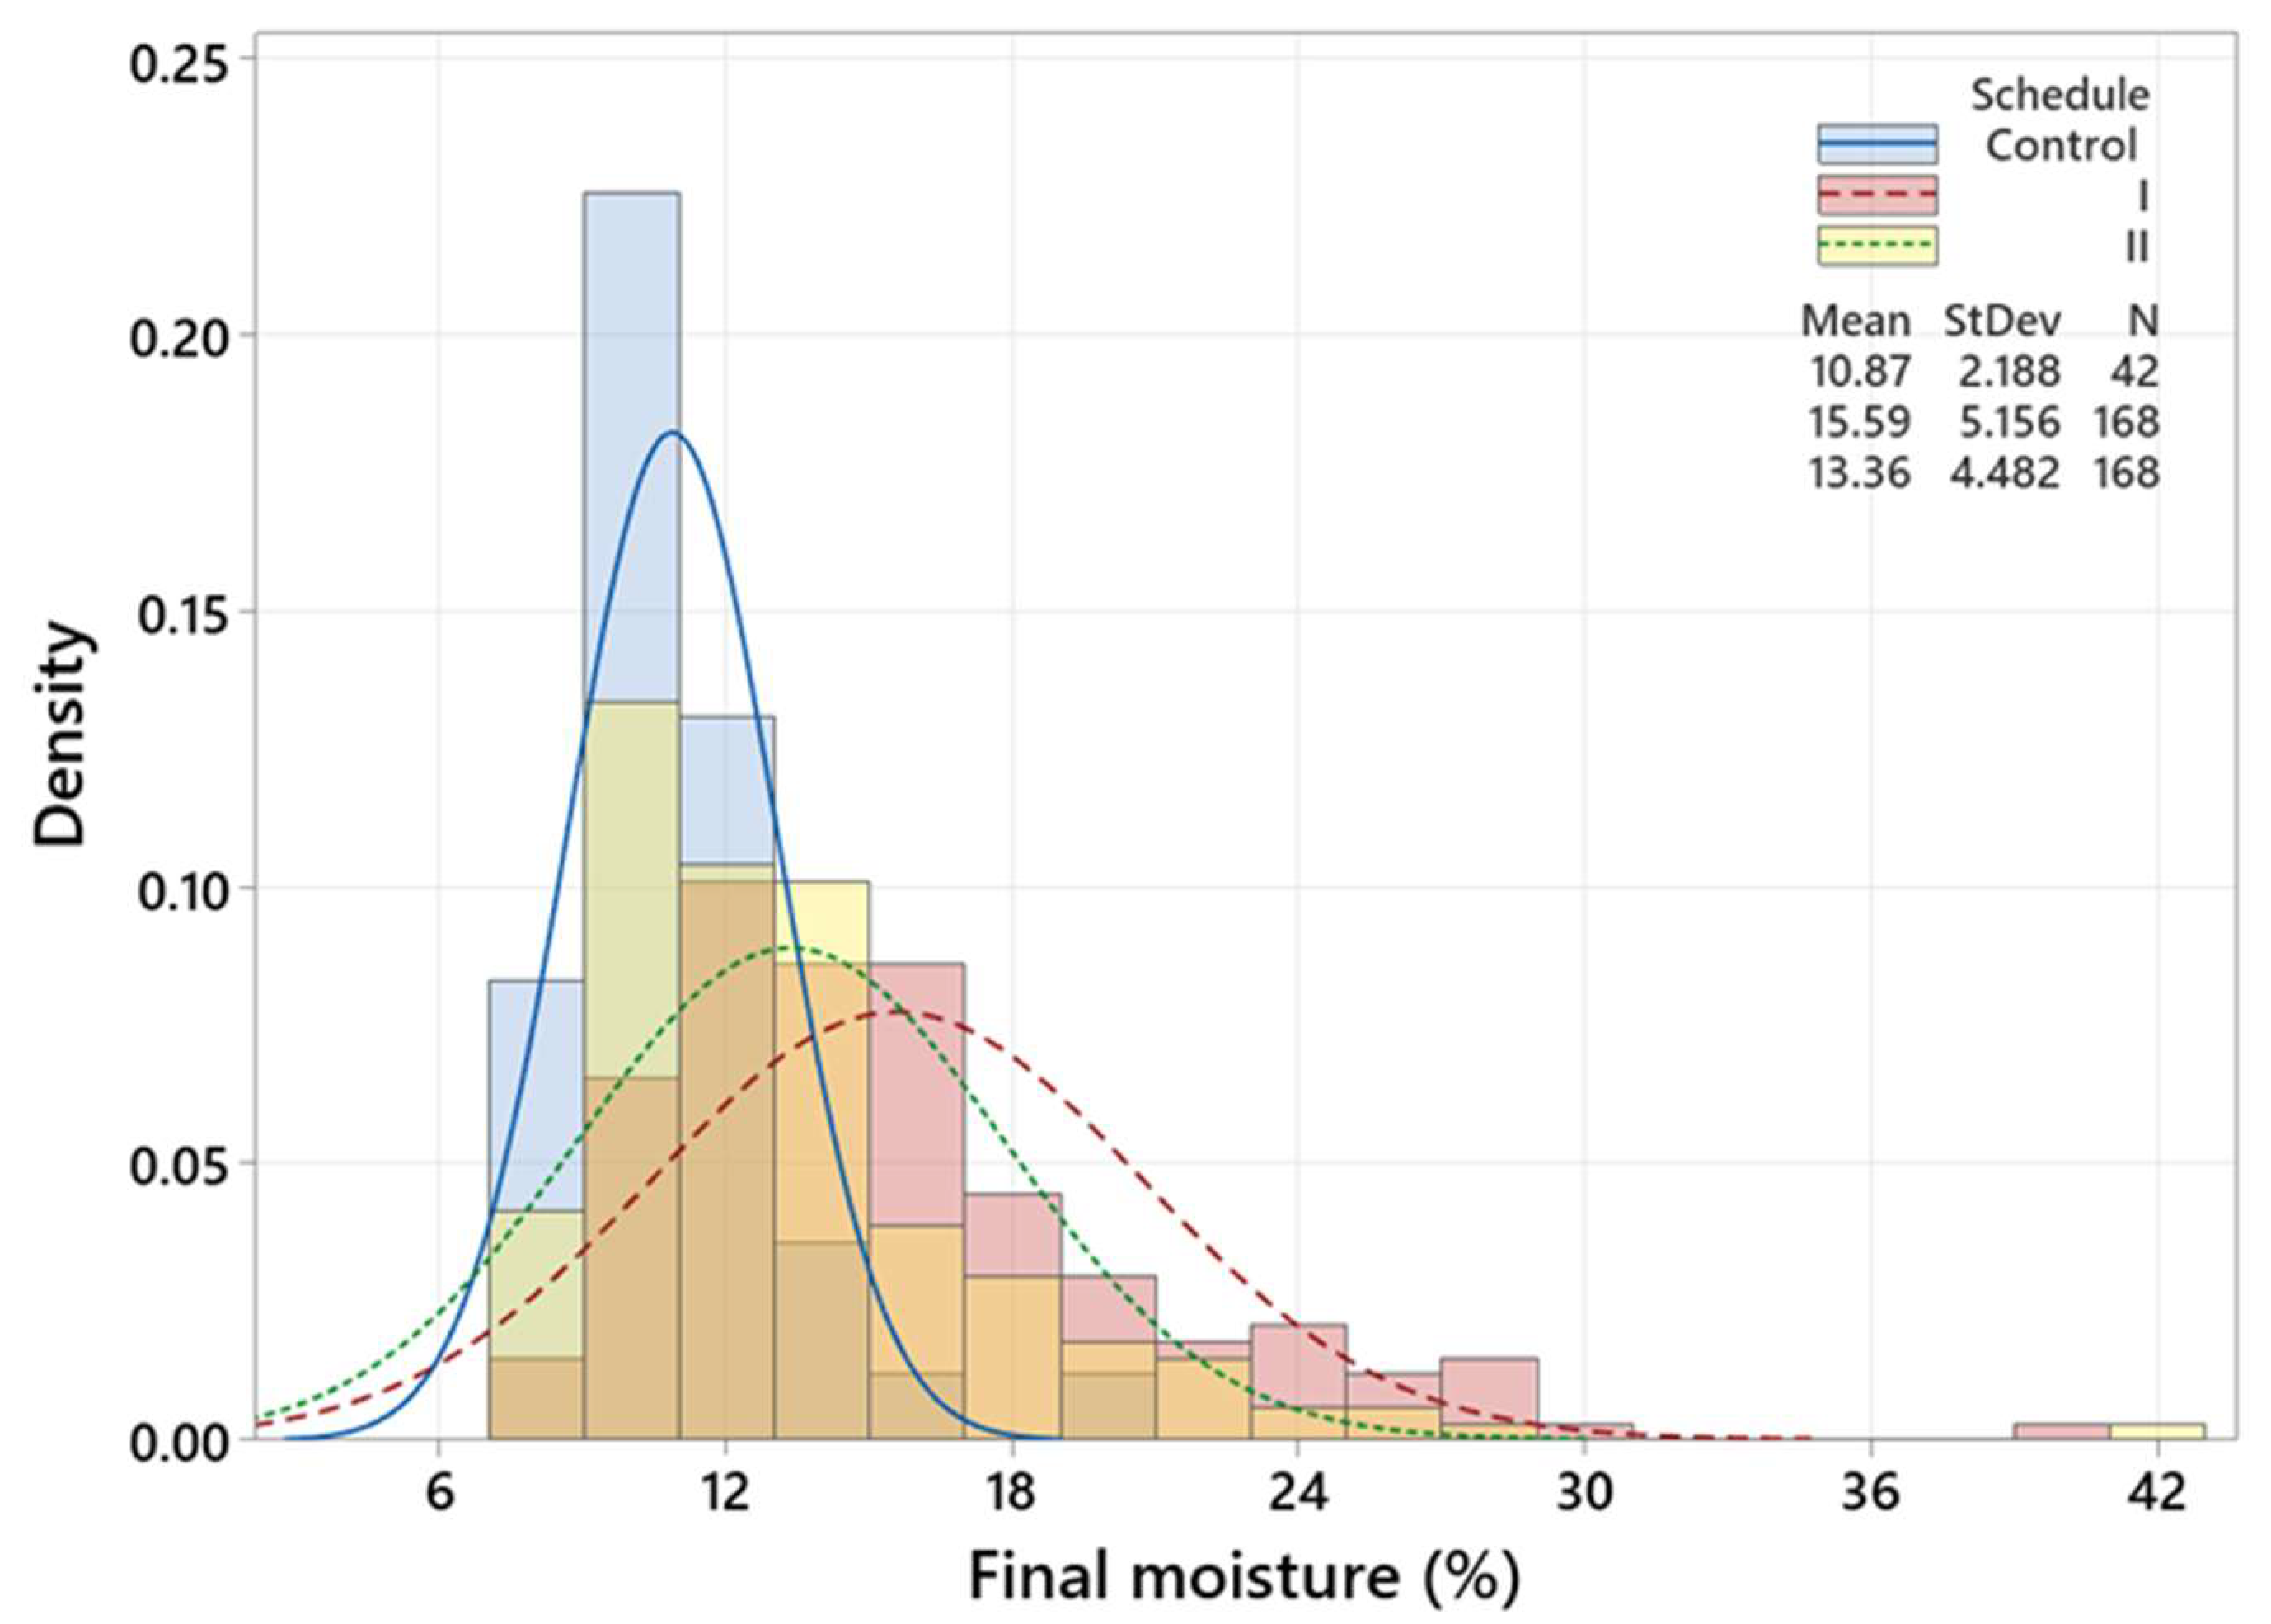
3.1. Wood Indices and Drying Parameters Analysis

Figure 2 and Figure 3 are interval plots representing the impact of conditioning and post-storage on the Mf variation, respectively. These results are based on the 95% of confidence interval for the Mf mean. Both figures indicate that modified drying schedules considerably increased the average Mf, and this effect is more noticeable than the conditioning or post-storage. The control drying schedule had eight time-based steps that took 180 h, which was longer than the modified drying schedules. This long drying time gives grounds to the lower Mf mean at the end of the control drying run, as it allocated sufficient time for under-dried wood to decrease in moisture. Applying conditioning and post-storage reduced the variation in Mf for both modified schedules because, while conditioning and post-storage allow under-dried wood to lose moisture, they let over-dried wood regain moisture. Additionally, while for each drying schedule the role of conditioning and post-storage is insignificant, there was a remarkable difference between the Mf in the two modified drying schedules when the timber pieces underwent conditioning or post-storage.
Figure 4, Figure 5 and Figure 6 are three histograms depicting the distribution of Mf. Figure 4 shows that schedule I accounts for the highest Mf mean (15.59%) and variation (5.16%), while the lowest Mf mean (10.87) and variation (2.19) values belong to the 42 timber pieces that underwent the control schedule. The Mf mean is very close to the Mt, which could be attributed to the long drying time compared to the modified ones. Figure 5 demonstrates that timber pieces with conditioning had a slightly smaller standard deviation (4.31%) than those without conditioning (StDev = 5.47%). Likewise, Figure 6 exhibits that timber pieces with post-storage had an insubstantial smaller standard deviation (4.54%) than those without conditioning (StDev = 5.07%). In conditioning and post-storage, the Memc (12.3%) is very close to Mt (12%), letting the Mf reach Mt and increasing moisture uniformity.
The dependency between the wi and Mi, Mf, and ρb could be studied through a hierarchical clustering analysis, as explained by Fathi et al. [73]. The dendrogram (Figure 7) demonstrates three clusters and shows the similarity level between the studied variables. This dendrogram indicates that ρb had the smallest similarity value (45.42%) with the Mf, which accords with the findings of the previous research on 2″ × 4″ hem-fir [38]. In the present study, Mi and wi showed the most similarity, while Rahimi and Avramidis [38] observed the most similarity between Mf and Mi in the previous research. The initial weight of the timber can be measured accurately and non-destructively. It is challenging to measure the moisture above the fiber saturation by moisture meters, and cutting cookies is a time-consuming and destructive method that cannot be performed at sawmills.
It was interesting to see that the drying schedule, conditioning, and post-storage protocols noticeably impacted the correlation between the Mf and the input variables. Table 5 documents the correlation between Mf and initial wood indices in nine drying runs. Accordingly, the highest correlation between Mi and Mf (0.62%) was in I_C_NS (abbreviated names defined in Table 1), while the lowest correlation between Mi and Mf (0.15%) was in UN. Furthermore, the highest correlation between ρb and Mf (0.60%) was in II_NC_NS, while the lowest correlation between ρb and Mf (0.12%) was in II_NC_S. Moreover, the highest correlation between wi and Mf (0.75%) was in I_NC_S, whereas the lowest correlation between wi and Mf (0.38%) was in II_NC_S. Overall, wi showed the highest correlation values with Mf in all drying runs, excluding II_NC_NS. Overall, ρb has the lowest correlation with Mf because ρb is naturally based on oven-dried weight and is independent of moisture level. Moreover, the volume change is negligible compared to weight change after kiln-drying, which further justifies the insubstantial correlation between ρb and Mf.
However, the correlation values in this study were considerably smaller than the findings of the former study [38]. In the former study, six drying batches underwent an identical drying schedule, while conditioning and post-storage were nonexistent. In contrast, this study included three drying schedules (with different Memc at the final step) followed by conditioning and post-storage. These two post-drying treatments level out Mf variation and give grounds to the lower correlation between Mi and Mf.

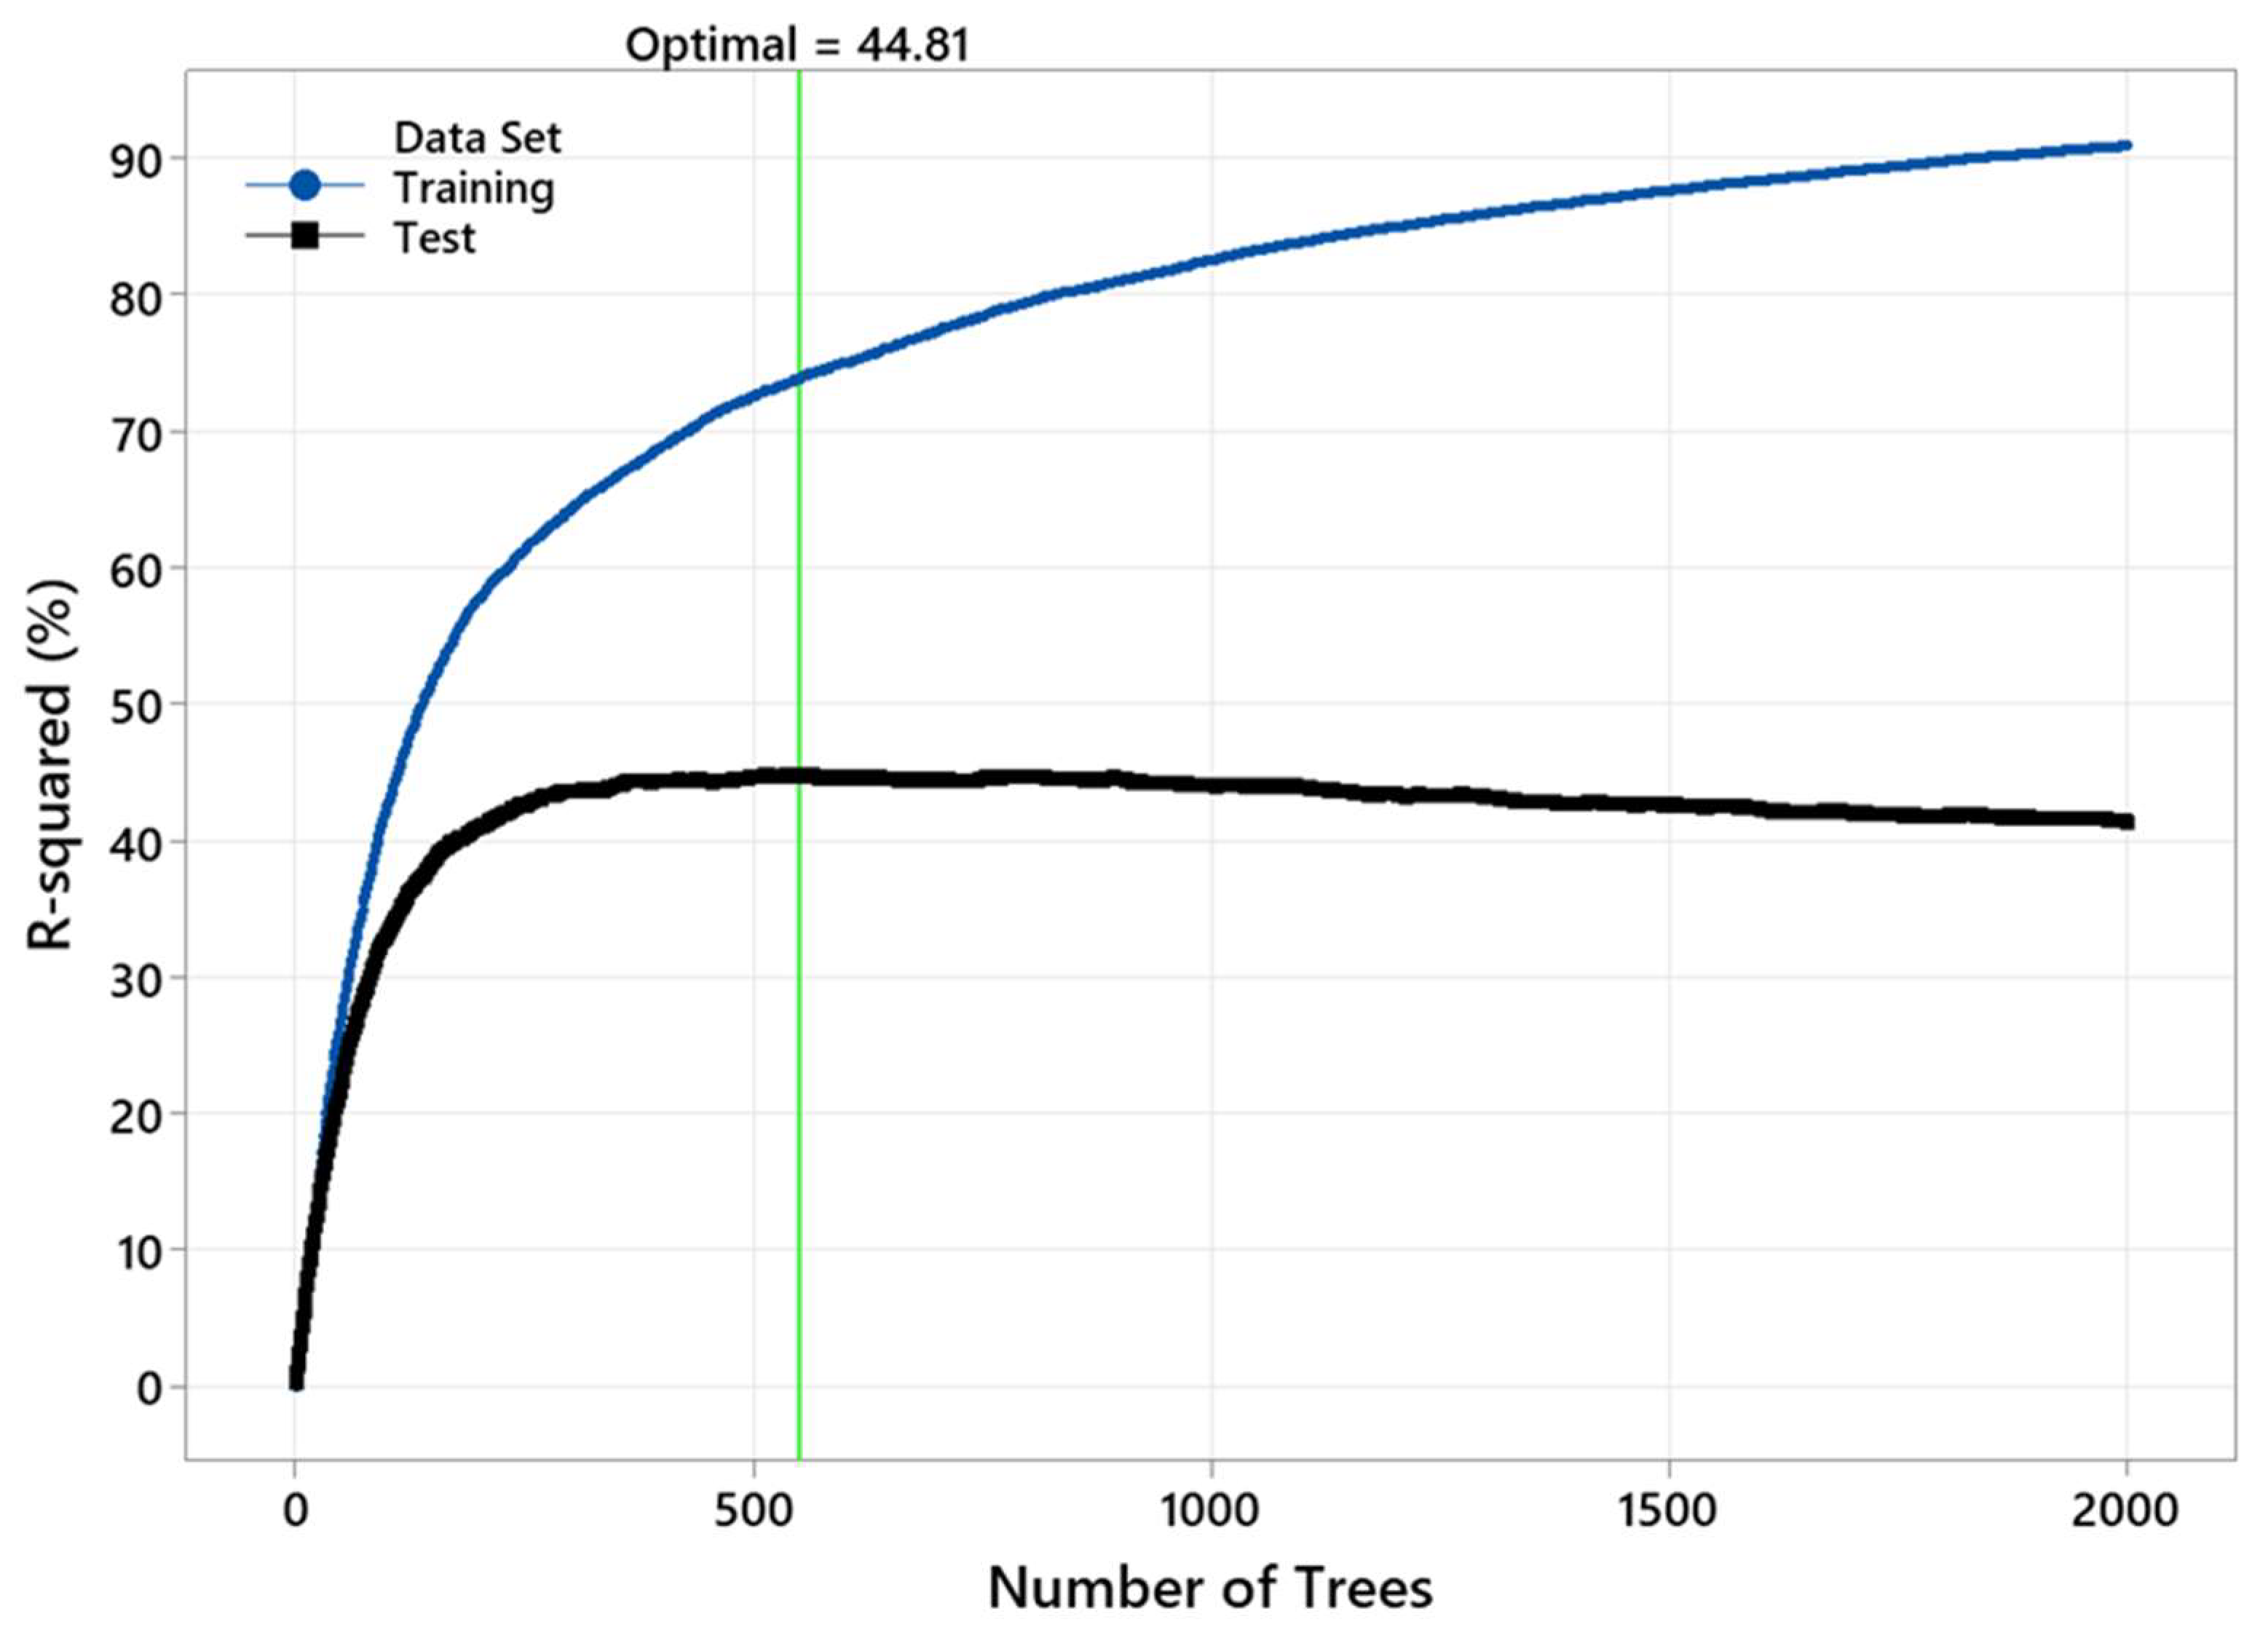
3.2. Moisture Prediction by TreeNet

Figure 8 shows the relative importance (RI) of the inputs in the predictive model, indicating that wi is the most remarkable parameter in this model (RI = 100), followed by the Mi (92.6%) and ρb (84.4%). The RI of drying schedule, post-storage, and conditioning were 63.3%, 45.0%, and 41.0%, respectively. This outcome shows that all the listed parameters considerably impact the model’s performance, though they have different RI values. It is worth mentioning that these results are moderately different from the findings by Rahimi et al. [40], in which Mi was the most important input. This difference may stem from different drying schedules, applying post-drying treatments, or different timber dimensions (2″ × 4″ vs. 4″ × 4″).
Table 6 lists the selected statistical parameters for the training and test datasets in the Mf predictive model. These results were based on the six predictors, including three wood attributes (Mi, wi, and ρb) and three drying parameters (schedule, conditioning, and post-storage). The optimal performance (Figure 9) was achieved by having 550 trees in the model. The predictive model had an R2 of 73.86% and 44.81% for the training and test, respectively.
Figure 9 shows that the R2 depends on the number of trees in the TreeNet model. This model had an unsatisfactory performance, with a low number of trees (N < 250). Comparing the training test results in Figure 9 discloses overfitting issues with the model. The actual (experimental) Mf versus the fitted (predicted) Mf is also shown in Figure 10.
An additional study was performed to assess the role of the categorical parameters, including the drying schedule, conditioning, and post-storage, on the performance of the predictive model. Thus, another regression model was trained, using only three parameters (Mi, wi, and ρb). Table 7 shows the model summary for this analysis. This model included 2000 grown trees with 214 optimal numbers of trees. The predictive model had an R2 of 56.80% and 32.10% for the training and test, respectively. A comparison between the results of the two models (Table 6 and Table 7) reveals that including the drying parameters improved the accuracy of the predictive model. Overall, the developed model failed to predict the Mf accurately. This failure is justified by the small sample size per drying run (42 boards) compared to the previous research (384 boards) [38]. Furthermore, applying post-drying treatments leveled off the moisture variation and slightly diluted the role of Mi in predicting Mf.

3.3. Moisture Classification

Since the regression approach failed to predict the Mf with acceptable accuracy, it was attempted to classify the Mf as having the input parameters and predict the chance of having over- or under-dried timber. This would be a crucial quality control task for drying processes. Accordingly, the classification was performed using TreeNet with the same assumption defined for the regression approach. Figure 11 illustrates the RI of the inputs in the predictive model for moisture classification. In this model, wi is the most important parameter (RI = 100), followed by Mi (90.0%) and ρb (71.8%). The RI values of schedule, post-storage, and conditioning were, in turn, 53.7%, 43.7%, and 32.7%, respectively. It is observed that the inputs have the same order in terms of relative importance for the moisture prediction (Figure 8) and moisture classification (Figure 11) models.
Table 8 lists the confusion matrix and the classification summary. The highest accuracy for the training and test data belonged to the over-dried (89.66%) and acceptable class (71.64%). Additionally, the lowest accuracy for the training and test data belonged to the acceptable (71.64%) and over-dried (58.62%) classes. Overall, the model could classify the wood with an accuracy of 76.19% during the training and 69.05% for the test data. Considering the small sample size, this is a promising performance that could be further enhanced by expanding the dataset.
Table 9 documents the summary of the misclassification and error. This result indicates that, collectively, the error increased from the training data (23.81%) to the test data (30.95%) for all classes. Classifying over-dried timber had the best training result, with a 10.34% error, while acceptable class had the best test result with a 28.36% error.
Overall, classification could categorize timber pieces into three classes based on their Mf with acceptable accuracy. This could be beneficial to wood manufacturing companies, as sawmills can apply this model to improve pre-and post-sorting strategies. The optimum breakpoints for the dry-sort-re-dry method could be accurately determined using the outcome of this classification approach. It is noteworthy that this research included some limitations, including relatively small sample size (42 boards per run) and single setpoint (Mt = 12%). Therefore, future research should focus on a bigger sample size to improve the training and test performance of the model. Moreover, future studies should broaden the range of Mf moisture prediction by selecting multiple Mt for different drying runs. This study utilized the TreeNet gradient boosting model. Despite the proven effectiveness of tree-based ensemble models, future research can perform comparative studies to better reveal the performance of the selected model against other techniques, such as ANNs or support vector machines. While this research focused on Mf between timber pieces, future studies may have to characterize and model Mf within every single piece of timber (core and shells) [74] and casehardening [75]. Moreover, future studies may have to provide predictive and classifying models for drying defects, such as surface checks [76], internal checks (honeycombing) [77], and shape distortions [78]. Finally, future research should investigate the effectiveness of different NDE methods for the fast and reliable assessment of timber MC. Acoustic and ultrasound signals were shown to be sensitive to wood characteristics such as MC [79]. Additionally, the suitability of near-infrared (NIR) spectroscopy, as a widely used NDE method for wood characterization and monitoring [80,81,82,83], could be assessed for MC monitoring in kiln-dried timber at sawmills.

4. Conclusions

This research provided a holistic approach that considers selected wood indices and drying parameters in modeling moisture after kiln drying. Including the drying parameters in the model significantly improved the accuracy of the TreeNet, despite showing lower relative importance compared to the wood attributes. This finding emphasizes that a robust and accurate model should include not only wood attributes but also drying parameters. From a practical standpoint, wi had the highest correlation with Mf among the input variables. This result was outstanding from a practical viewpoint, as weighing timber in sawmills is a fast and non-destructive test. The outcome of this research is an advanced step in optimizing drying schedules concerning final moisture variation. Classifying models are highly applicable to optimizing post-sorting strategies such as dry-sort-re-dry.

Author Contributions

Conceptualization: S.R., V.N. and S.A.; Methodology: S.R., V.N. and S.A.; Software and Analysis: F.S. and V.N.; Writing: S.R. and V.N.; Editing: S.R., V.N., S.A. and F.S. All authors have read and agreed to the published version of the manuscript.

Funding

This research received no external funding.

Institutional Review Board Statement

Not applicable.

Data Availability Statement

Not applicable.

Acknowledgments

The authors would like to thank Katrin Rohrbach and FPInnovations for their collaborations and support.

Conflicts of Interest

The authors declare no conflict of interest.

References

  1. Glass, S.V.; Zelinka, S.L. Chapter 4: Moisture Relations and Physical Properties of Wood. In Wood Handbook Wood as an Engineering Material. General Technical Report FPL-GTR-282; U.S. Department of Agriculture, Forest Service, Forest Products Laboratory: Madison, WI, USA, 2021; 22p. [Google Scholar]
  2. Fathi, H.; Kazemirad, S.; Nasir, V. Anondestructive guided wave propagation method for the characterization of moisture-dependentviscoelastic properties of wood materials. Mater. Struct. 2020, 53, 147. [Google Scholar] [CrossRef]
  3. Herrera-Díaz, R.; Sepúlveda-Villarroel, V.; Pérez-Peña, N.; Salvo-Sepúlveda, L.; Salinas-Lira, C.; Llano-Ponte, R.; Ananías, R.A. Effect of wood drying and heat modification on some physical and mechanical properties of radiata pine. Dry. Technol. 2018, 36, 537–544. [Google Scholar] [CrossRef]
  4. Lamrani, B.; Bekkioui, N.; Simo-Tagne, M.; Ndukwu, M.C. Recent progress in solar wood drying: An updated review. Dry. Technol. 2022, 1–23. [Google Scholar] [CrossRef]
  5. Haygreen, J.G.; Bowyer, J.L. Forest Products and Wood Science, an Introduction, 3rd ed.; Iowa State University Press: Ames, IA, USA, 1996; 484p. [Google Scholar]
  6. Reeb, J.E. Drying Wood. FOR-55; University of Kentucky: Lexington, KY, USA; Cooperative Extension Service: Fairbanks, AK, USA, 1997; 8p. [Google Scholar]
  7. Pang, S. Moisture content gradient in a softwood board during drying: Simulation from a 2-D model and measurement. Wood Sci. Technol. 1996, 30, 165–178. [Google Scholar] [CrossRef]
  8. Perre, P. Fundamental Wood Drying; European COST: Nancy, France, 2007; 366p. [Google Scholar]
  9. Simpson, W.T. Dry Kiln Operator’s Manual; United States Department of Agriculture, Forest Service Forest Products Laboratory: Madison, WI, USA, 1991; 256p. [Google Scholar]
  10. Esping, B. Energy Saving in Wood Drying; Wood Technology Report No. 12; Svenska Traforsknings Institute: Stockholm, Sweden, 1982. (In Swedish) [Google Scholar]
  11. Bond, B.H.; Espinoza, O. A decade of improved lumber drying technology. Curr. For. Rep. 2016, 2, 106–118. [Google Scholar] [CrossRef]
  12. Simpson, W.T. Drying wood: A review-part I. Dry. Technol. 1983, 2, 235–264. [Google Scholar] [CrossRef]
  13. Keey, R.B.; Langrish, T.A.; Walker, J.C. Kiln-Drying of Lumber; Springer Science & Business Media: Berlin, Germany, 2000; 326p. [Google Scholar]
  14. Rosen, H.N. Drying of Wood and Wood Products. In Handbook of Industrial Drying, 2nd ed.; Marcel Dekker: New York, NY, USA, 1995; pp. 899–921. [Google Scholar]
  15. Shahverdi, M.; Oliveira, L.; Avramidis, S. Kiln-drying optimization for quality pacific coast hemlock lumber. Dry. Technol. 2017, 35, 1867–1873. [Google Scholar] [CrossRef]
  16. Rohrbach, K.; Oliveira, L.; Avramidis, S. Drying schedule structure and subsequent post-drying equalisation effect on hemlock timber quality. Int. Wood Prod. J. 2014, 5, 55–64. [Google Scholar] [CrossRef]
  17. Nogi, M.; Yamamoto, H.; Okuyama, T. Relaxation mechanism of residual stress inside logs by heat treatment: Choosing the heating time and temperature. J. Wood Sci. 2003, 49, 22–28. [Google Scholar] [CrossRef]
  18. Coast Forest Products Association Coastal Products. Available online: http://www.coast-forest.org/products/product-directory/species/ (accessed on 24 November 2018).
  19. Wada, N.; Avramidis, S.; Oliveira, L.C. Internal moisture evolution in timbers exposed to ambient conditions following kiln drying. Eur. J. Wood Prod. 2014, 72, 377–384. [Google Scholar] [CrossRef]
  20. Sackey, E.K.; Avramidis, S.; Oliveira, L.C. Exploratory Evaluation of Oscillation Drying for Thick Hemlock Timbers. Holzforschung 2004, 58, 428–433. [Google Scholar] [CrossRef]
  21. Bradic, S.; Avramidis, S. Impact of Juvenile Wood on Hemlock Timber Drying Characteristics. For. Prod. J. 2007, 57, 53–59. [Google Scholar]
  22. Berberovic, A.; Milota, M.R. Impact of wood variability on the drying rate at different moisture content levels. For. Prod. J. 2011, 61, 435–442. [Google Scholar] [CrossRef]
  23. Elustondo, D.; Oliveira, L.; Ananias, R.A. Visual method to assess lumber sorting before drying. Dry. Technol. 2013, 31, 32–39. [Google Scholar] [CrossRef]
  24. Watanabe, K.; Mansfield, S.D.; Avramidis, S. Application of near-infrared spectroscopy for moisture-based sorting of green hem-fir timber. J. Wood Sci. 2011, 57, 288–294. [Google Scholar] [CrossRef]
  25. Aune, J.E. Kiln Tests with Species and Moisture Content Sorted, 116 mm Square, Hem-Fir Merch Lumber; Final Report Prepared for the Stability Work Group; ZAIRAI Lumber Partnership Ltd.: Vancouver, BC, Canada, 2000. [Google Scholar]
  26. Yang, L.; Liu, H. Study of the collapse and recovery of Eucalyptus urophydis during conventional kiln drying. Eur. J. Wood Prod. 2021, 79, 129–137. [Google Scholar] [CrossRef]
  27. Dawson, B.S.; Pearson, H.; Kimberley, M.O.; Davy, B.; Dickson, A.R. Effect of supercritical CO2 treatment and kiln drying on collapse in Eucalyptus nitens wood. Eur. J. Wood Prod. 2020, 78, 209–217. [Google Scholar] [CrossRef]
  28. Botter-Kuisch, H.P.; Van den Bulcke, J.; Baetens, J.M.; Van Acker, J. Cracking the code: Real-time monitoring of wood drying and the occurrence of cracks. Wood Sci. Technol. 2020, 54, 1029–1049. [Google Scholar] [CrossRef]
  29. Suchomelová, P.; Trcala, M.; Tippner, J. Numerical simulations of coupled moisture and heat transfer in wood during kiln drying: Influence of material nonlinearity. BioResources 2019, 14, 9786–9805. [Google Scholar]
  30. Kumar, S.; Kelkar, B.U.; Mishra, A.K.; Jena, S.K. Variability in physical properties of plantation-grown progenies of Melia composita and determination of a kiln-drying schedule. J. For. Res. 2018, 29, 1435–1442. [Google Scholar] [CrossRef]
  31. Marier, P.; Gaudreault, J.; Noguer, T. Kiln drying operations scheduling with dynamic composition of loading patterns. For. Prod. J. 2021, 71, 101–110. [Google Scholar] [CrossRef]
  32. Yin, Q.; Liu, H.H. Drying stress and strain of wood: A Review. Appl. Sci. 2021, 11, 5023. [Google Scholar] [CrossRef]
  33. Watanabe, K.; Matsushita, Y.; Kobayashi, I.; Kuroda, N. Artificial neural network modeling for predicting final moisture content of individual Sugi (Cryptomeria japonica) samples during air-drying. J. Wood Sci. 2013, 59, 112–118. [Google Scholar] [CrossRef]
  34. Chai, H.; Chen, X.; Cai, Y.; Zhao, J. Artificial neural network modeling for predicting wood moisture content in high frequency vacuum drying process. Forests 2018, 10, 16. [Google Scholar] [CrossRef]
  35. Rabidin, Z.A.; Seng, G.K.; Wahab, M.J.A. Characteristics of timbers dried using kiln drying and radio frequency-vacuum drying systems. In MATEC Web of Conferences; EDP Sciences: Les Ulis, France, 2017; Volume 108, p. 10001. [Google Scholar] [CrossRef]
  36. Liu, H.; Zhang, J.; Jiang, W.; Cai, Y. Characteristics of commercial-scale Radio-frequency/vacuum (RF/V) drying for hardwood lumber. BioResources 2019, 14, 6923–6935. [Google Scholar] [CrossRef]
  37. Ozsahin, S.; Murat, M. Prediction of equilibrium moisture content and specific gravity of heat-treated wood by artificial neural networks. Eur. J. Wood Prod. 2018, 76, 563–572. [Google Scholar] [CrossRef]
  38. Rahimi, S.; Avramidis, S. Predicting moisture content in kiln dried timbers using machine learning. Eur. J. Wood. Prod. 2022, 80, 681–692. [Google Scholar] [CrossRef]
  39. Rahimi, S.; Nasir, V.; Avramidis, S.; Sassani, F. Wood moisture monitoring and classification in kiln-dried timber. Struct. Control Health Monit. 2022, 29, e2911. [Google Scholar] [CrossRef]
  40. Rahimi, S.; Nasir, V.; Avramidis, S.; Sassani, F. Benchmarking moisture prediction in kiln-dried Pacific Coast hemlock wood. Int. Wood Prod. J. 2022, 13, 219–226. [Google Scholar] [CrossRef]
  41. Rahimi, S.; Avramidis, S.; Lazarescu, C. Estimating moisture content variation in kiln dried Pacific coast hemlock. Holzforschung 2021, 76, 26–36. [Google Scholar] [CrossRef]
  42. Nisgoski, S.; de Oliveira, A.A.; de Muñiz, G.I.B. Artificial neural network and SIMCA classification in some wood discrimination based on near-infrared. Wood Sci. Technol. 2017, 51, 929–942. [Google Scholar] [CrossRef]
  43. Cui, X.; Wang, Q.; Zhao, Y.; Qiao, X.; Teng, G. Laser-induced breakdown spectroscopy (LIBS) for classification of wood species integrated with artificial neural network (ANN). Appl. Phys. B 2019, 125, 56. [Google Scholar] [CrossRef]
  44. Bardak, S.; Tiryaki, S.; Nemli, G.; Aydın, A. Investigation and neural network prediction of wood bonding quality based on pressing conditions. Int. J. Adhes. Adhes. 2016, 68, 115–123. [Google Scholar] [CrossRef]
  45. Bardak, S.; Tiryaki, S.; Bardak, T.; Aydin, A.Y.T.A.Ç. Predictive performance of artificial neural network and multiple linear regression models in predicting adhesive bonding strength of wood. Strength Mater. 2016, 48, 811–824. [Google Scholar] [CrossRef]
  46. Ayanleye, S.; Nasir, V.; Avramidis, S.; Cool, J. Effect of wood surface roughness on prediction of structural timber properties by infrared spectroscopy using ANFIS, ANN and PLS regression. Eur. J. Wood Prod. 2021, 79, 101–115. [Google Scholar] [CrossRef]
  47. Tiryaki, S.; Aydın, A. An artificial neural network model for predicting compression strength of heat-treated woods and comparison with a multiple linear regression model. Constr. Build. Mater. 2014, 62, 102–108. [Google Scholar] [CrossRef]
  48. Tiryaki, S.; Malkoçoğlu, A.; Özşahin, Ş. Using artificial neural networks for modeling surface roughness of wood in machining process. Constr. Build. Mater. 2014, 66, 329–335. [Google Scholar] [CrossRef]
  49. Dong, X.; Yu, Z.; Cao, W.; Shi, Y.; Ma, Q. A survey on ensemble learning. Front. Comput. Sci. 2020, 14, 241–258. [Google Scholar] [CrossRef]
  50. Rohrbach, K. Schedule and Post-Drying Storage Effects on Western Hemlock Squares Quality. Master’s Thesis, University of British Columbia, Vancouver, BC, Canada, 2008; p. 113. [Google Scholar]
  51. Kollmann, F. Technologie des Holzes und der Holzwerkstoffe, Zweiter Band; Springer: Berlin/Heidelberg, Germany, 1955. [Google Scholar]
  52. Skaar, C. Water in Wood; Syracuse University Press: Syracuse, NY, USA, 1972. [Google Scholar]
  53. Hao, B.; Avramidis, S. Annual ring orientation effect and slope of grain in hemlock timber drying. For. Prod. J. 2004, 54, 41–49. [Google Scholar]
  54. Hao, B.; Avramidis, S. Timber moisture class assessment in kiln drying. J. Inst. Wood Sci. 2006, 17, 121–133. [Google Scholar] [CrossRef]
  55. Siau, J.F. Wood: Influence of Moisture on Physical Properties; Department of Wood Science and Forest Products, Virginia Polytechnic Institute and State University: Blacksburg, VA, USA, 1995; 227p. [Google Scholar]
  56. Steinberg, D. CART: Classification and regression trees. In The Top Ten Algorithms in Data Mining; Wu, X., Kumar, V., Eds.; Taylor & Francis Group: New York, NY, USA, 2009; pp. 179–201. [Google Scholar]
  57. van Blokland, J.; Nasir, V.; Cool, J.; Avramidis, S.; Adamopoulos, S. Machine learning-based prediction of surface checks and bending properties in weathered thermally modified timber. Constr. Build. Mater. 2021, 307, 124996. [Google Scholar] [CrossRef]
  58. Breiman, L.; Friedman, J.H.; Olshen, R.A.; Stone, C.J. Classification and Regression Trees; Chapman & Hall/CRC: Boca Raton, FL, USA, 1984. [Google Scholar]
  59. van Blokland, J.; Nasir, V.; Cool, J.; Avramidis, S.; Adamopoulos, S. Machine learning-based prediction of internal checks in weathered thermally modified timber. Constr. Build. Mater. 2021, 281, 122193. [Google Scholar] [CrossRef]
  60. Nasir, V.; Fathi, H.; Kazemirad, S. Combined machine learning–wave propagation approach for monitoring timber mechanical properties under UV aging. Struct. Health Monit. 2021, 20, 2035–2053. [Google Scholar] [CrossRef]
  61. Nasir, V.; Fathi, H.; Fallah, A.; Kazemirad, S.; Sassani, F.; Antov, P. Prediction of mechanical properties of artificially weathered wood by color change and machine learning. Materials 2021, 14, 6314. [Google Scholar] [CrossRef]
  62. Nasir, V.; Parvari, Y.; Fathi, H.; Kazemirad, S.; Sassani, F. Identification of wood species and duration of exposure in weathered wood using guided wave propagation. Wood Mater. Sci. Eng. 2022, 1–12. [Google Scholar] [CrossRef]
  63. Grinsztajn, L.; Oyallon, E.; Varoquaux, G. Why do tree-based models still outperform deep learning on tabular data? arXiv 2022, arXiv:2207.08815. [Google Scholar]
  64. Liaw, A.; Wiener, M. Classification and regression by random Forest. R News 2002, 2, 18–22. [Google Scholar]
  65. Schubert, M.; Luković, M.; Christen, H. Prediction of mechanical properties of wood fiber insulation boards as a function of machine and process parameters by random forest. Wood Sci. Technol. 2020, 54, 703–713. [Google Scholar] [CrossRef]
  66. Nasir, V.; Kooshkbaghi, M.; Cool, J.; Sassani, F. Cutting tool temperature monitoring in circular sawing: Measurement and multi-sensor feature fusion-based prediction. Int. J. Adv. Manufac. Technol. 2021, 112, 2413–2424. [Google Scholar] [CrossRef]
  67. Nasir, V.; Kooshkbaghi, M.; Cool, J. Sensor fusion and random forest modeling for identifying frozen and green wood during lumber manufacturing. Manuf. Lett. 2020, 26, 53–58. [Google Scholar] [CrossRef]
  68. Modeler, S.P. Introducing TreeNet Gradient-Boosting Machine; Minitab, LLC: State College, PA, USA, 2019. [Google Scholar]
  69. Sun, Y.; Lin, Q.; He, X.; Zhao, Y.; Dai, F.; Qiu, J.; Cao, Y. Wood species recognition with small data: A deep learning approach. Int. J. Comput. Intell. Syst. 2021, 14, 1451–1460. [Google Scholar] [CrossRef]
  70. Zhuang, Z.; Liu, Y.; Ding, F.; Wang, Z. Online color classification system of solid wood flooring based on characteristic features. Sensors 2021, 21, 336. [Google Scholar] [CrossRef] [PubMed]
  71. Carty, D.M.; Young, T.M.; Zaretzki, R.L.; Guess, F.M.; Petutschnigg, A. Predicting and correlating the strength properties of wood composite process parameters by use of boosted regression tree models. For. Prod. J. 2015, 65, 365–371. [Google Scholar] [CrossRef]
  72. Nasir, V.; Dibaji, S.; Alaswad, K.; Cool, J. Tool wear monitoring by ensemble learning and sensor fusion using power, sound, vibration, and AE signals. Manuf. Lett. 2021, 30, 32–38. [Google Scholar] [CrossRef]
  73. Fathi, H.; Nasir, V.; Kazemirad, S. Prediction of the mechanical properties of wood using guided wave propagation and machine learning. Const. Build. Mater. 2020, 262, 120848. [Google Scholar] [CrossRef]
  74. McMillen, J.M. Stresses in Wood during Drying; U.S. Department of Agriculture, Forest Service, Forest Products Laboratory: Madison, WI, USA, 1958; Volume 1652, 174p. [Google Scholar]
  75. Diawanich, P.; Tomad, S.; Matan, N.; Kyokong, B. Novel assessment of casehardening in kiln-dried lumber. Wood Sci. Technol. 2012, 46, 101–114. [Google Scholar] [CrossRef]
  76. Denig, J.; Wengert, E.M.; Simpson, W.T. Drying Hardwood Lumber; Gen. Tech. Rep. FPL-GTR-118; U.S. Department of Agriculture, Forest Service, Forest Products Laboratory: Madison, WI, USA, 2000; 138p. [Google Scholar]
  77. Rahimi, S.; Faezipour, M.; Tarmian, A. Drying of internal-check prone poplar lumber using three different conventional kiln drying schedules. J. Indian Acad. Wood Sci. 2011, 8, 6–10. [Google Scholar] [CrossRef]
  78. Pratt, G.H. Timber Drying Manual; Building Research Establishment: Buckinghamshire, UK, 1974; 152p. [Google Scholar]
  79. Nasir, V.; Ayanleye, S.; Kazemirad, S.; Sassani, F.; Adamopoulos, S. Acoustic emission monitoring of wood materials and timber structures: A critical review. Const. Build. Mater. 2022, 350, 128877. [Google Scholar] [CrossRef]
  80. Leblon, B.; Adedipe, O.; Hans, G.; Haddadi, A.; Tsuchikawa, S.; Burger, J.; Stirling, R.; Pirouz, Z.; Groves, K.; Nader, J.; et al. A review of near-infrared spectroscopy for monitoring moisture content and density of solid wood. For. Chron. 2013, 89, 595–606. [Google Scholar] [CrossRef]
  81. Tsuchikawa, S.; Kobori, H. A review of recent application of near infrared spectroscopy to wood science and technology. J. Wood Sci. 2013, 61, 213–220. [Google Scholar] [CrossRef]
  82. Tsuchikawa, S. A review of recent near infrared research for wood and paper. Appl. Spectrosc. Rev. 2007, 42, 43–71. [Google Scholar] [CrossRef]
  83. Tsuchikawa, S.; Schwanninger, M. A review of recent near-infrared research for wood and paper (Part 2). Appl. Spectrosc. Rev. 2013, 48, 560–587. [Google Scholar] [CrossRef]
Figure 1. Cutting pattern of the baby-square western hemlock.
Polymers 15 00792 g001
Figure 2. Interval plot of the Mf for different drying schedules with the presence and absence of conditioning treatment. The results are at 95% of the confidence interval for the Mf mean.
Polymers 15 00792 g002
Figure 3. Interval plot of the Mf for different drying schedules with the presence and absence of post-storge treatment. The results are at 95% of the confidence interval for the Mf mean.
Polymers 15 00792 g003
Figure 4. Histogram and distribution curves of the Mf for the control, modified I and modified II schedules.
Polymers 15 00792 g004
Figure 5. Histogram and distribution curves of the Mf in the existence and nonexistence of the conditioning treatment.
Polymers 15 00792 g005
Figure 6. Histogram and distribution curves of the Mf in the existence and nonexistence of the post-storage treatment.
Polymers 15 00792 g006
Figure 7. The variable clustering analysis illustrates the correlation coefficient distance between wood attributes.
Polymers 15 00792 g007
Figure 8. The relative importance of the inputs used to train the random forest approach for the Mf predictive model.
Polymers 15 00792 g008
Figure 9. The variation in R2 with the number of trees in the TreeNet model.
Polymers 15 00792 g009
Figure 10. The actual Mf against the predicted Mf.
Polymers 15 00792 g010
Figure 11. The relative importance of the inputs used to train the random forest approach for the Mf classifier model.
Polymers 15 00792 g011
Table 1. Nine drying batches of baby square western hemlock.
Run NumberScheduleConditioningStorageName
1Control (unmodified)YesNoUN
2Modified IYesNoI_C_NS
3Modified INoNoI_NC_NS
4Modified IINoNoII_NC_NS
5Modified IYesYesI_C_S
6Modified INoYesI_NC_S
7Modified IIYesYesII_C_S
8Modified IINoYesII_NC_S
9Modified IIYesNoII_C_NS
Table 2. Control (unmodified) drying schedule used in industrial kilns in British Columbia sawmills. This schedule comprises eight time-based steps, one moisture-based step, and one conditioning step.
StepTime
(h)
Dry-Bulb
Temperature
(°C)
Wet-Bulb
Temperature (°C)
Relative Humidity (%)Equilibrium Moisture Content (%)
11248.948.9100.025.5
22451.750.694.220.8
32455.052.889.017.6
42457.855.086.516.2
52461.756.777.712.7
62465.658.971.910.8
72470.060.663.78.8
82473.962.859.47.8
9Till Mf = 12%77.865.055.77.0
101271.766.779.412.3
Table 3. First modified schedule. This schedule comprises six time-based steps and one moisture-based step, followed by optional conditioning (step 8) and optional post-storage (step 9).
StepTime
(h)
Dry-Bulb
Temperature
(°C)
Wet-Bulb
Temperature (°C)
Relative Humidity (%)Equilibrium Moisture Content (%)
11248.948.9100.025.5
22457.854.483.815.1
32454.446.162.79.7
42460.046.146.16.8
52462.246.141.06.0
62471.151.737.05.1
7Till Mf = 12%78.854.430.14.1
812 (optional)71.766.779.412.3
9168 (optional)20166512.3
Table 4. Second modified schedule. This schedule comprises five time-based steps and one moisture-based step, followed by optional conditioning (step 7) and optional post-storage (step 8).
StepTime
(h)
Dry-Bulb
Temperature
(°C)
Wet-Bulb
Temperature (°C)
Relative Humidity (%)Equilibrium Moisture Content (%)
11248.948.9100.025.5
22462.860.689.817.2
32468.364.483.213.9
42471.164.473.110.7
52479.464.450.46.2
6Till Mf = 12%85.064.439.54.7
712 (optional)71.766.779.412.3
8168 (optional)20166512.3
Table 5. The correlation between Mf and initial wood indices in nine drying runs (abbreviated names of the drying schedules are defined in Table 1).
Drying ScheduleCorrelation between Wood Indices
Mi and Mfwi and Mfρb and Mf
UN0.150.400.18
I_C_NS0.620.740.28
I_NC_NS0.540.610.29
II_NC_NS0.220.590.60
I_C_S0.450.610.29
I_NC_S0.470.750.50
II_C_S0.530.610.15
II_NC_S0.250.380.12
II_C_NS0.370.550.28
Table 6. Model summary for predicting the Mf using TreeNet including six inputs.
StatisticsTraining (%)Test (%)
R-squared (R2)73.8644.81
Root mean squared error (RMSE)2.483.61
Mean squared error (MSE)6.1513.05
Mean absolute deviation (MAD)1.682.43
Mean absolute percent error (MAPE)0.120.17
Table 7. Model summary for predicting the Mf using TreeNet including three inputs.
StatisticsTraining (%)Test (%)
R-squared (R2)56.8032.10
Root mean squared error (RMSE)3.194.00
Mean squared error (MSE)10.1716.04
Mean absolute deviation (MAD)2.332.92
Mean absolute percent error (MAPE)0.170.21
Table 8. Confusion matrix and the summary of the classification with a random forest model.
Actual ClassCountPredicted Training Class Predicted Test Class
Over-
Dried
AcceptableUnder-DriedCorrect (%)Over-
Dried
AcceptableUnder-DriedCorrect (%)
Over-dried58525189.663423158.62
Acceptable268441923271.64381923871.64
Under-dried52084484.622153567.31
ALL378962057776.19742307469.05
Table 9. Summary of misclassification and error for random forest model.
Actual ClassCountPredicted Training ClassPredicted Test Class
MisclassedError (%)MisclassedError (%)
Over-dried58610.342441.38
Acceptable2687628.367628.36
Under-dried52815.381732.69
ALL3789023.8111730.95
Disclaimer/Publisher’s Note: The statements, opinions and data contained in all publications are solely those of the individual author(s) and contributor(s) and not of MDPI and/or the editor(s). MDPI and/or the editor(s) disclaim responsibility for any injury to people or property resulting from any ideas, methods, instructions or products referred to in the content.

