Article

Assessing the Impact and Suitability of Dense Carbon Dioxide as a Green Solvent for the Treatment of PMMA of Historical Value

1
LAQV-REQUIMTE and Department of Conservation and Restoration, NOVA School of Science and Technology, Universidade NOVA de Lisboa, 2829-516 Caparica, Portugal
2
LAQV-REQUIMTE and Department of Chemistry, NOVA School of Science and Technology, Universidade NOVA de Lisboa, 2829-516 Caparica, Portugal
3
Environmental Archaeology and Materials Science, National Museum of Denmark, 2800 Kongens Lyngby, Denmark
4
Kelvin Centre for Conservation and Cultural Heritage Research, School of Culture and Creative Arts, University of Glasgow, Glasgow G12 8QH, UK
5
Centro Interuniversitário de História das Ciências e da Tecnologia, Department of Conservation and Restoration, NOVA School of Science and Technology, Universidade NOVA de Lisboa, 2829-516 Caparica, Portugal
*
Authors to whom correspondence should be addressed.
Polymers 2023, 15(3), 566; https://doi.org/10.3390/polym15030566
Submission received: 28 November 2022 / Revised: 14 January 2023 / Accepted: 19 January 2023 / Published: 21 January 2023
(This article belongs to the Special Issue Polymeric Materials in Modern—Contemporary Art II)

Abstract

:
Surface cleaning of plastic materials of historical value can be challenging due to the high risk of inducing detrimental effects and visual alterations. As a result, recent studies have focused on researching new approaches that might reduce the associated hazards and, at the same time, minimize the environmental impact by employing biodegradable and green materials. In this context, the present work investigates the effects and potential suitability of dense carbon dioxide (CO2) as an alternative and green solvent for cleaning plastic materials of historical value. The results of extensive trials with CO2 in different phases (supercritical, liquid, and vapor) and under various conditions (pressure, temperature, exposure, and depressurization time) are reported for new, transparent, thick poly(methyl methacrylate) (PMMA) samples. The impact of CO2 on the weight, the appearance of the samples (dimensions, color, gloss, and surface texture), and modifications to their physicochemical and mechanical properties were monitored via a multi-analytical approach that included optical microscopy, Raman and attenuated total reflection Fourier transform infrared (ATR-FTIR) spectroscopies, and micro-indentation (Vickers hardness). Results showed that CO2 induced undesirable and irreversible changes in PMMA samples (i.e., formation of fractures and stress-induced cracking, drastic decrease in the surface hardness of the samples), independent of the conditions used (i.e., temperature, pressure, CO2 phase, and exposure time).

1. Introduction

Over the last 30 years, the challenge of conserving plastic materials has come to the forefront of heritage science. Despite being constantly demonized as a threat to the environment and wildlife because it is long-lasting and difficult to decompose, dispose of, or recycle, plastic is among the most fragile materials that can be encountered in museums and other heritage collections [1,2,3]. Signs of degradation can become readily visible within a few decades [2] as discoloration, yellowing, deformation, cracks or crazing on surfaces, blooming or weeping of additives that migrate to the surface, formation of superficial degradation products, embrittlement, or even total disintegration of the object, as a result of plasticizer loss or cross-linking [2,4].
Surface cleaning is an important factor in the care of plastic artifacts to increase their material stability while improving or restoring their visual appearance. However, conservation treatments of plastic objects and works of art, such as cleaning or consolidation, still pose considerable challenges to conservators, who must adhere to the ethical principles of reversibility and minimal damage [5]. Given the vast diversity of plastics, it is complex to outline common guidelines, and some types of plastics are more difficult to treat compared with others, such as poly(methyl methacrylate) (PMMA), which is highly prone to scratching [6,7,8]. While studies have mainly focused on understanding degradation pathways [9,10,11,12], developing rapid and in situ methods for plastics identification and characterization [13,14,15,16,17], and designing preventive conservation strategies [18,19,20,21,22,23], knowledge and expertise surrounding interventive conservation approaches (i.e., cleaning and consolidation) remain limited.
The research project POPART (Preservation of Plastic Artefacts in Museum Collections, 2008–2012) was the first to perform an extensive evaluation of cleaning options for various plastics, investigating dry, aqueous, and nonaqueous techniques and their effectiveness at removing sebum and carbonaceous soils [8]. The outcomes from this project suggested that satisfactory results can be achieved by using a polyester microfiber cloth dampened with anionic and nonionic detergent solutions, but with the potential drawback of inducing a few scratches and leaving cleaning residues. PMMA, which among plastics is considered the most stable [9,24], was found to be susceptible to scratching.
After the POPART project, research into developing new cleaning options for plastics remains relatively sparse. Recent studies have explored the use of more sustainable conservation approaches, such as deep eutectic solvent (DES) formulations for the removal of degraded gelatin on cellulose nitrate cinematographic films [25]; natural and biodegradable solvents, such as limonene and ethyl lactate; nonionic surfactant based on alkoxylated fatty alcohols (commercial product Plurafac® LF 900) [26]; and various types of confining systems and gels for the cleaning of PMMA and other plastics [27,28,29].
Research by Kampasakali et al. found that limonene (applied with an Evolon® CR cloth) was effective at cleaning plastics as it satisfactorily removed both the carbon and sebum soil types. However, solvent residues were noted on the surface after cleaning and required further clearance with a dry cloth. Plurafac® LF 900 proved to be very effective in removing carbonaceous soil, while ethyl lactate removed sebum soil, but left stains of soil mixed with solvent residues on the surface [26]. Confining systems and gels, such as agar, gellan gum, Nanorestore Gel MWR, or Nanorestore Gel Peggy 5 or 6, were shown to reduce mechanical friction and, hence, induce significantly less damage compared with traditional cleaning tools. In terms of cleaning efficacy, however, the gels did not perform particularly well, especially in removing sebum soil [28,29]. While these studies have undoubtedly expanded the range of suitable options available to conservators, definitive and safer solutions for cleaning the most susceptible plastics are still needed. In addition, interest is growing in sustainable chemical processes and supercritical fluid technology, particularly carbon dioxide.
Supercritical carbon dioxide (scCO2) is considered a green solvent. It is chemically stable, relatively inert, nontoxic, and nonflammable. It is abundant in nature, but is also available as a by-product of many industrial processes and can be readily recycled [30,31]. scCO2 is widely used as an alternative to organic solvents in various chemical processes, including the synthesis of polymers [32,33], preparation of pharmaceutical formulations or drug release [34,35], extraction of essential oils [36,37,38] or caffeine from coffee beans [39,40], industrial and precision cleaning, and decontamination [41,42,43,44,45].
Carbon dioxide (CO2) naturally occurs as a gas in the atmosphere, but under certain conditions of pressure and temperature, it also acts as a solid (known as dry ice or snow), liquid, and supercritical fluid, exhibiting unique and versatile features. A supercritical fluid is a substance that, above its critical temperature and pressure, presents simultaneously physicochemical properties between those of a gas and a liquid (i.e., density, solvation power, viscosity, and diffusivity) [31,46]. Supercritical carbon dioxide exhibits a readily accessible critical point (Tc = 31 °C and pc = 7.38 MPa) compared with other compounds, such as water (Tc = 373 °C and pc = 22 MPa) [47].
The most significant advantage of working with scCO2 is its tunability. Minimal variations in pressure and/or temperature conditions can lead to significant modifications of its phase and properties. For example, after use, it can be easily released as a gas simply by returning to atmospheric pressure and temperature without leaving residues. Supercritical CO2 is a good solvent for nonpolar and very slightly polar compounds. However, its solvation power is directly proportional to its density and, hence, to the applied pressure. In addition, various separating agents (i.e., solvents, surfactants, etc.) can be used to increase or decrease its polarity, such as ethanol or methanol [46]. These unique and versatile features make scCO2 a perfect candidate for application in the heritage conservation field. Despite its very limited use in this field, liquid and supercritical CO2 have been tested in various treatments on a range of different materials, such as drying of waterlogged wood [48,49]; removal of various pesticides from objects in ethnographic collections comprising wood, leather, and textiles [50,51]; deacidification of paper-based objects [52,53,54,55,56,57]; and cleaning and disinfection of paper [58] and textiles [59,60,61,62,63].
The use of liquid/supercritical CO2 showed potential for cleaning fragile materials. Sousa et al. [59] tested liquid/supercritical CO2 on an extensively deteriorated silk textile from the 18th century that disintegrated on handling. Trials demonstrated that CO2 did not induce physical damage or promote material loss and enabled satisfactory soil removal, which could not be achieved using traditional approaches.
The use of CO2 remains relatively unexplored in treating plastics. Supercritical CO2 was applied for the first and only time on various plastics and cellulose acetate textiles during the POPART project, and trials led to unsatisfactory results. However, it should be noted that tests were limited and were performed under undisclosed conditions using an industrial apparatus, with the test plastics packed inside nylon stockings [8].
Considering the potential benefits of CO2 for cleaning applications (i.e., no or minimal interaction with the substrate, no residues left after treatment, and the possibility of easily fine-tuning the solvation strength), the present work aimed at reassessing the suitability of CO2 for application on plastics. PMMA was selected for this study, as it is one of the most common plastics found in post-1945 artworks, and despite being considered a stable plastic compared with other types, it can be easily damaged and scratched with consequent loss of original gloss. Extensive trials were performed on new PMMA samples using liquid and supercritical CO2, exploring a wide range of experimental conditions (i.e., temperature, pressure, and exposure time) and using a multianalytical characterization approach to monitor potential changes in the samples. Vapor CO2 was used as a comparative cleaning agent. The ultimate goal was (i) to provide a better understanding of the interactions of CO2-PMMA, which can also potentially inform the use of CO2 on other plastics, and (ii) to highlight experimental conditions that could be safely used for designing conservation strategies, such as cleaning.

2. Materials and Methods

2.1. Samples

A colorless and transparent PMMA sheet 3 mm thick, produced by cell casting, was bought from PLEXIGLAS® (PLEXIGLAS® GS Clear 0F00 GT, Röhm GmbH & Co., Darmstadt, Germany) supplied with a protective film on both sides. Individual samples measuring approximately 15 mm × 20 mm × 3 mm were cut manually using an electric bandsaw, using the protective film to avoid abrasion and soiling during cutting. The film was removed only immediately prior to sample characterization and testing. No further surface treatment was performed (i.e., rinsing). The PMMA sample batch was stored in the dark in laboratory conditions.

2.2. Description of the CO2 Apparatus and Experimental Conditions

Trials were performed in a high-pressure, laboratory-scale apparatus shown schematically in Figure 1a. Experimental conditions (temperature, pressure, exposure, and depressurization time) are summarized in Table 1.
Three specimens (15 mm × 20 mm × 3 mm) per trial were placed on a stainless-steel grid support and then inserted into a 33 mL stainless-steel cell equipped with a sapphire window at each end, which enabled visual access to the samples during the process (Figure 1b). The cell was sealed and immersed in a thermostatic water bath, preheated at the desired temperature. A BlueShadow Pump 40P (Knauer, Berlin, Germany) was used to introduce fresh CO2 with 99.998% purity (Air Liquide, Paris, France) until the desired pressure was reached inside the cell. A stream of CO2 was then allowed to flow through the vessel for the selected time (Table 1). At the end of each experiment, the cell was manually depressurized at a constant rate to avoid inducing damage to the substrate.
After exposure to CO2, samples were left at ambient conditions for at least 2 h before commencing the post-treatment characterization and were subsequently stored in a partially open sample holder under ambient laboratory conditions to allow degassing.

2.3. Sample Characterization

2.3.1. Change in Mass

To monitor weight changes (%) and potential physical changes, samples were weighed using a Sartorius CP225D micro analytical balance (Göttingen, Germany) with an accuracy of ±0.00001 g. The humidity inside the balance enclosure was controlled using silica gel. Samples were weighed before and after the test (approximately 2 h), and then again after 2 days, and 1, 2, 4, and 35 weeks. Three independent measurements per sample were taken; the average and the standard deviations were calculated.

2.3.2. Change in Dimensions

Samples’ dimensions (length, width, and thickness) were measured using a TOPEX 31C629 micrometer screw gauge (Grupatopex, Warsaw, Poland), with a length of 135 mm, a 0–25 mm working range, and an accuracy of ±0.01 mm. Samples were measured before, after the test (approximately 2 h), and over time (i.e., after 1, 2, 4, and 35 weeks). Three independent measurements per sample were taken. Average dimensions, volume, and standard deviations were calculated.

2.3.3. Imaging

Full-scale images of the samples before and after tests were acquired with a Dino-Lite® Edge AM7915MZTL microscope (AnMo Electronics Corporation, Taipei, Taiwan) with an Open Cap N3C-O (9.5 mm length), varying Dino-Lite® lighting levels (Flexible LED Control) that were controlled through the DinoCapture 2.0 software (Almere, The Netherlands), at a magnification of approximately ×20 (scale is 2 mm).
Detailed images of the samples’ surfaces were acquired using an Axioplan 2ie microscope (Zeiss, Germany), equipped with an incident halogen light illuminator (tungsten light source, HAL 100) and coupled with a DXM1200F digital camera and ACT-1 control software (Nikon, Japan). Micrographs were captured within a few days of exposure to CO2 and again after 35 weeks, using reflected (incident) light in brightfield, darkfield, and cross-polarized modes, and transmitted light in cross-polarized mode, at varied magnifications (×50, ×100, ×200, and ×500).

2.3.4. Raman Spectroscopy (μ-Raman)

Raman microscopy was carried out using a Horiba Jobin Yvon LabRAM 300 spectrometer (Kyoto, Japan), equipped with a He-Ne 17 mW laser operating at 632.8 nm and coupled to the confocal microscope with high-stability Olympus BX41. The system was calibrated using a silicon standard. The laser power at the surface of the samples was reduced with the aid of neutral density filters (optical densities 0.3), and the laser beam was focused with an Olympus ×50 objective. Spectra were recorded as an extended scan, with a grating of 600 groves/mm and an integration time of 10 s. Three spectra for each sample were acquired before and after tests at three independent locations, approximately always the same by using a template mask. Raman data analysis was performed using the LabSpec 5 software. All spectra are presented as acquired, without any baseline correction. The intensities of all spectra were normalized by the peak intensity of the CC4 symmetric stretching mode of PMMA at 813 cm−1, following the procedure used by Ikeda-Fukazawa et al. [64]. In this study of the sorption and diffusivity of CO2 into PMMA, they noticed that the vibration energy of the CC4 symmetric stretching mode remained almost constant during the CO2 sorption, which indicates that this stretching mode is not affected by the sorption process.

2.3.5. Attenuated Total Reflection Fourier Transform Infrared (ATR-FTIR) Spectroscopy

Infrared spectra were obtained using a Handheld Agilent 4300 spectrometer (Agilent, Santa Clara, CA, USA) equipped with a ZnSe beam splitter, a Michelson interferometer, and a thermoelectrically cooled DTGS detector. Spectra were collected with a diamond ATR crystal element, 128 scans and a resolution of 4 cm−1, in the spectral region of 4000–650 cm−1. Background spectra were collected between every acquisition. Three spectra for each sample were acquired before and after tests and after 2 h, 5 days, and 1, 2, and 35 weeks at three different locations. The OriginPro 8 software (OriginLab Corporation, Northampton, MA, USA) was used to analyze the spectra. All spectra are presented as acquired, without baseline corrections or other treatments except normalization to the carbonyl peak intensity, allowing a direct comparison of relative intensities.

2.3.6. Surface Hardness

Surface hardness was measured with a Zwick/Roell Indentec ZHµ hardness (Gravimeta, Oporto, Portugal) testing machine using a 300 gf load and a dwell time of 15 s. Analysis conditions were selected based on a recent study on the characterization and long-term stability of historical PMMA sheets [9]. Tests were performed on one sample out of the three exposed to each CO2 trial. Hardness values and standard deviation were determined as the average of 10 independent readings (5 on each side) obtained at a distance > 5d from each other. Measurements were collected approximately 3 h after exposure to CO2 and after 2 days and 1, 2, 4, and 35 weeks. Variations in hardness values for each sample over time were determined by comparison with a set of four control samples that had not been exposed to CO2.
Hardness values for control and CO2-exposed samples were compared using a one-way ANOVA statistical test. Where results were statistically different, a post hoc test (Tukey–Kramer multiple comparison) was performed. Results for these tests are reported above related graphs in lower-case letters. Where no statistical differences were revealed, the bars are labeled with the same letter(s). All statistical tests were conducted using the Origin 2022b software (OriginLab Corporation, Northampton, MA, USA).

3. Results and Discussion

3.1. Post-Treatment Assessment

3.1.1. Appearance, Weight, Dimensions, and Visual Observations

During the experiment, no visible alterations were detected in the samples by looking through the sapphire windows. However, upon depressurization and removal of the specimens from the high-pressure cell, the samples appeared to have a more glossy surface (judged by the naked eye). Although this effect seemed to reduce within a few days, the appearance of the CO2-exposed samples remained (and remains) different compared with the control/unexposed ones. In addition, most of the samples also presented slightly rounded corners, and it was possible to observe some distortions at the edges, which appeared swollen (Figure 2a,b). Significant alterations were noticed for samples subjected to scCO2 at 55 °C and 28 MPa (i.e., Test 4), which showed a whitish/milky appearance and the presence of extensive bubbling in the samples’ bulk (Figure 2c,d).
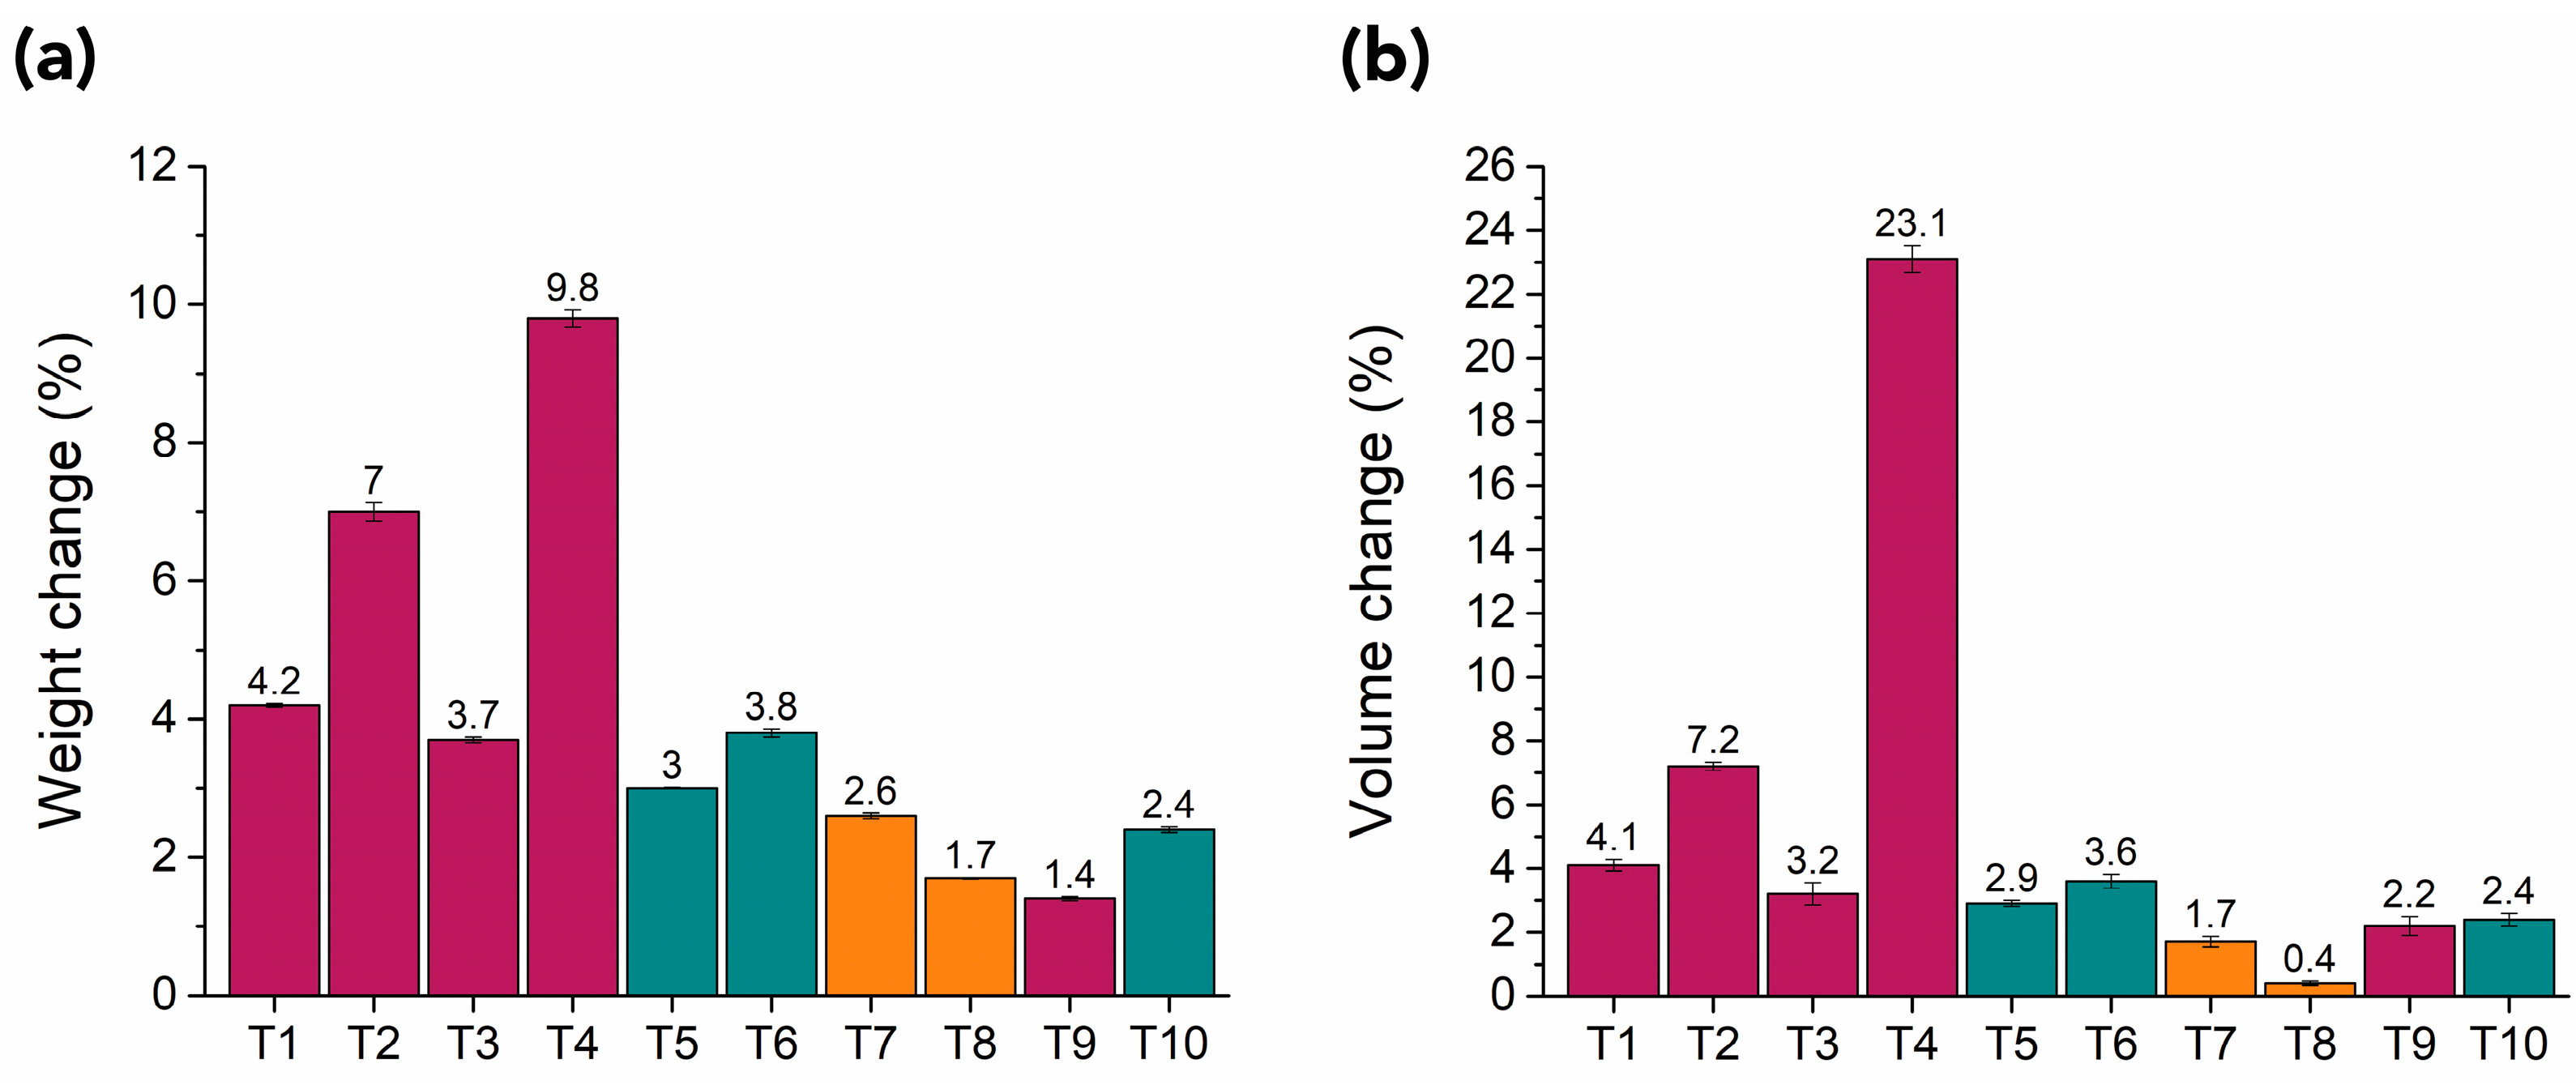
Variations in the weight and volume of the samples, measured approximately 2 h after the CO2 trials, are summarized in Figure 3. A significant increase in weight was noted for all the samples, with larger changes for specimens treated at 28 MPa (Tests 2 and 4, Figure 2a). Concurrent dilation in thickness, length, and width was also observed, especially for samples exposed to CO2 at supercritical conditions and for tests at 28 MPa (Tests 1–4, Figure 3b). Reducing the exposure time to 30 min instead of 60 did not have a significant impact on the response of PMMA to CO2 (Test 9 and Test 10, Figure 3a,b); also see Table 1).
Differences in mass and volume expansion indicate sorption/dissolution of CO2 into the polymer network, with consequent swelling, as reported in previous studies [65,66,67,68]. Polymers show very low solubility in CO2, which is a function of temperature, pressure, and concentration, but also depends on the polymers’ molecular weight (Mw) and molecular weight distribution [69,70,71,72]. According to the literature, CO2 is a good solvent for many nonpolar and some polar molecules with low Mw, including most common monomers and oligomers, but has limited solubility for larger components and polymers with Mw above 1000 [69,70,73]. By contrast, CO2′s solubility in polymers might be considerable and associated with swelling of the matrix [32,74].
The sorption and swelling behavior of PMMA/CO2 systems have been widely studied, mainly via in situ experiments (i.e., while the specimens are inside the CO2 apparatus), exploring a wide range of temperature and pressure conditions, and through different analytical methods [75,76,77,78,79,80,81,82,83,84,85,86,87,88,89,90,91,92,93].
The dissolution of carbon dioxide in a polymer matrix is driven by various factors: temperature and pressure experimental conditions (sorption is greater at higher pressure and relatively low temperatures), polymer morphology and degree of crystallinity, and interaction between CO2 and specific functional groups in the polymer (such as carbonyl groups or phenyl rings) [94,95]. Glassy polymers, particularly PMMA, have stronger CO2 solubility than semicrystalline/crystalline polymers and exhibit larger weight variations due to CO2 uptake [65,66,68,80]. As a highly amorphous polymer, PMMA has little molecular orientation and large free volume, whereas crystalline polymers have highly ordered molecular arrangement and relatively less free volume; hence, CO2 is not absorbed as easily by them. Weight and volume variations shown in Figure 3 are in line with observations from previous studies, with bigger changes noted for tests performed at high pressure (i.e., 28 MPa).
Sorption of CO2 into a polymer matrix is also reported to promote plasticization and reduction of the glass transition temperature (Tg) [96,97,98,99,100], as well as the formation of a cellular/porous structure [67,87,101,102,103]. The formation of bubbles might occur during the depressurization stage, and bubbles are more likely to form when the operational conditions are of high temperature and/or high pressure and the depressurization to ambient conditions is performed very quickly [104]. Carbon dioxide impregnates the polymer matrix to a different degree, depending on various factors, such as experimental conditions and polymer type [74]. Upon depressurization, CO2 that has already dissolved in the polymer matrix can become supersaturated and nucleate bubbles, which induces foam or minor defects in the polymer structure [105,106,107,108]. Induced bubble formation, growth, and foaming are methods widely used in polymer processing for various applications, such as creating a porous structure into polymers, and for drug loading [32,73,74,109,110].
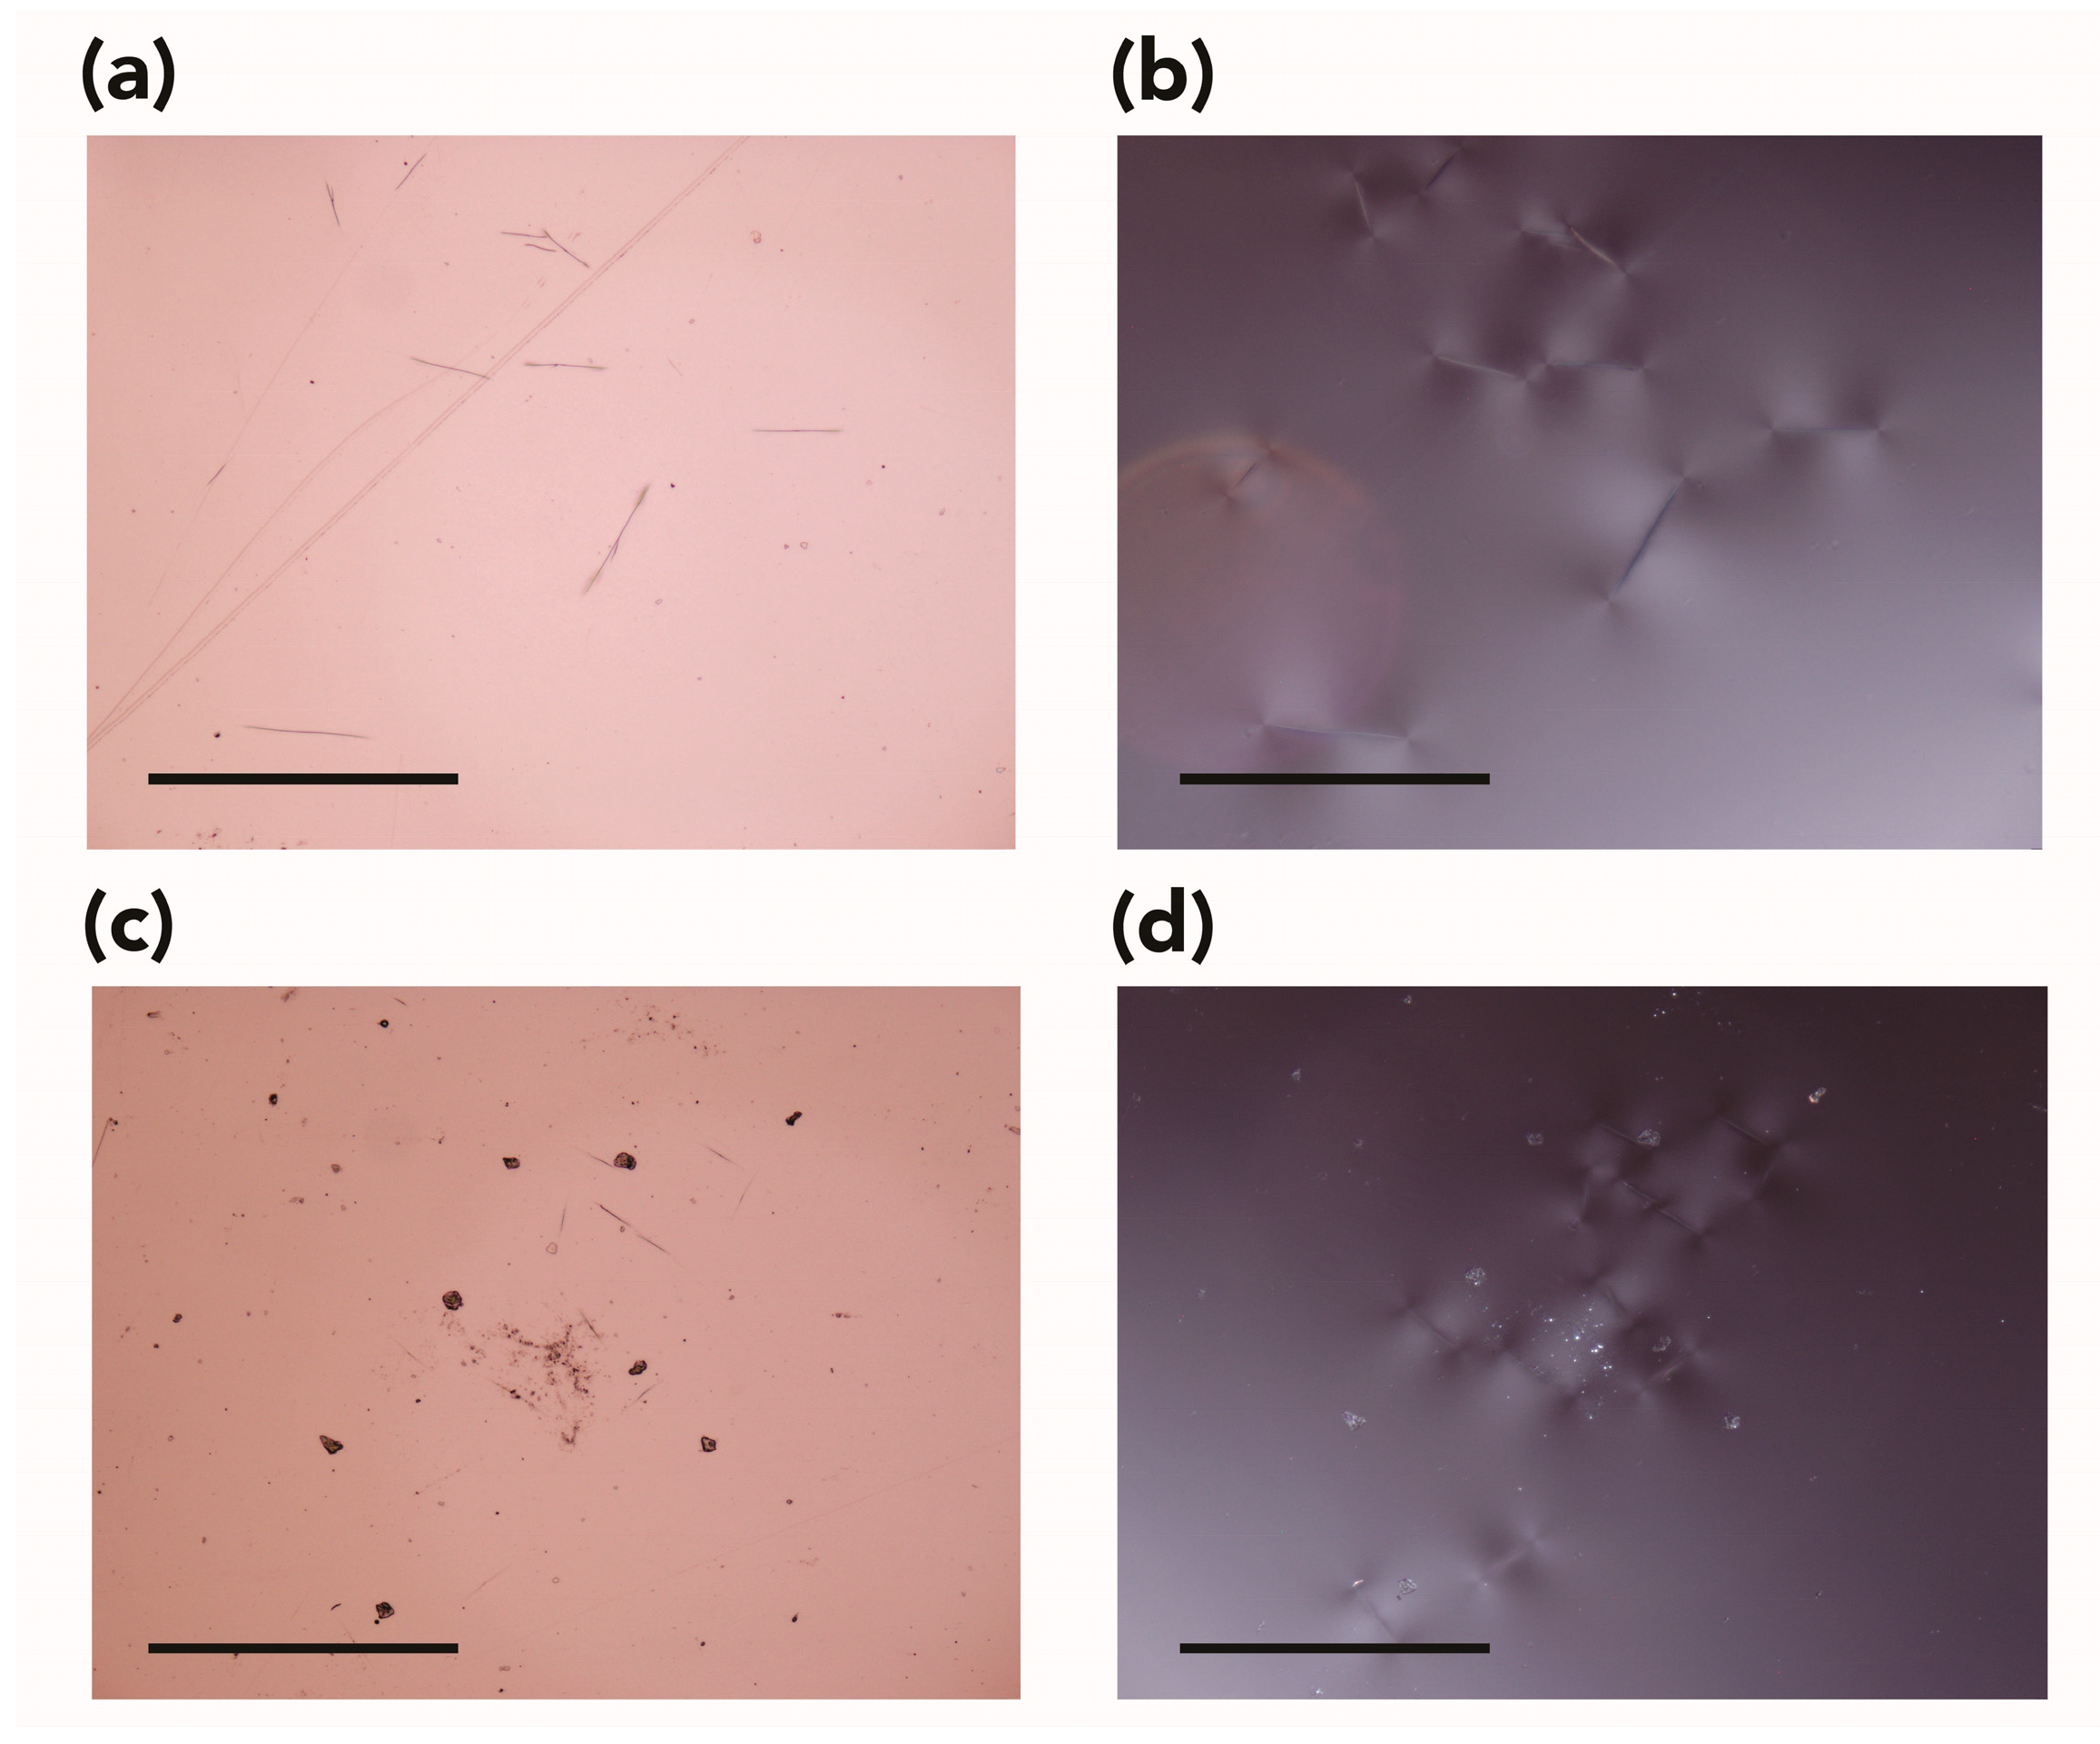
In the present study, cavities/bubbles were readably visible in samples subjected to scCO2 at 55 °C and 28 MPa (i.e., Test 4, Figure 2c,d). Tiny, discrete bubbles invisible to the naked eye were noticed in samples exposed under experimental conditions of 35 °C and 28 MPa (Figure 4a) when examined with optical microscopy (OM). For all the other tests, no cavities/bubbles were observed, and this could be due to the mild experimental conditions used and the relatively slow depressurization rate.
Optical microscopy examination also highlighted the presence of other small defects and physical damage. Regardless of the experimental conditions used, surface scratches, potential crazing, and small cracks were observed (Figure 4b,c).
In addition, one could observe the presence of indentation marks left by the tip of the pressure clamp used in ATR-FTIR spectroscopy (Figure 4d). These marks were not observed on control samples.
Analysis of the distorted and swollen areas showed the presence of a continuous, solid line or optical boundary inside the samples in the proximity of the edges (Figure 5, left and middle columns). The formation of the optical boundary can be observed in optically transparent polymers and is associated with the sorption and diffusion of a solvent through the samples. In previous studies, the analysis of the propagation front via optical microscopy was used to study in situ the diffusion of methanol in PMMA and dodecane in polystyrene (PS) [111] or the swelling and sorption kinetics of scCO2 in poly(dimethylsiloxane) [112], PS [113], PMMA, and poly(butyl methacrylate) (PBMA) [67,81,82]. These studies showed that the boundary appears after a few minutes of exposure to high-pressure CO2 and propagates slowly in all directions until it contracts and disappears in the center when the phase equilibrium between the CO2 and the polymer has been reached; that is, the CO2 is completely absorbed by the specimen.
In the current study, the experiments were stopped before reaching the equilibrium phase, and the assessment was performed ex situ. It was therefore possible to still observe the optical boundary when the samples were removed from the high-pressure cell. The propagation of the optical front is consistent with data collected for weight changes and swelling. From a visual assessment, its size seems dependent on the experimental conditions: the more intense the conditions, the more the CO2 penetrates into the PMMA; hence, the bigger the optical boundary. Further analysis of the optical boundary and its correlations with the experimental conditions used in this study were evaluated via molecular dynamics studies and will be presented in a forthcoming paper.
For the PMMA/CO2 binary system, the presence of the optical boundary not only indicates CO2 uptake but also represents an interface between glassy and plasticized regions, as recently discussed by Rodríguez et al. [114].
Compared with control samples (Figure 5a), the CO2-exposed samples also showed differences in appearance and color in the areas defined by the optical boundary when observed under polarized light using an optical microscope (Figure 5b–d). In all mock-ups, the presence of distinct isochromatic fringes corresponding to the optical boundary indicated stress-induced regions (Figure 5, right column). The different colors correspond to different stress levels, and the higher the density of the color fringes, the greater the stress [115,116].

3.1.2. Mechanical Properties

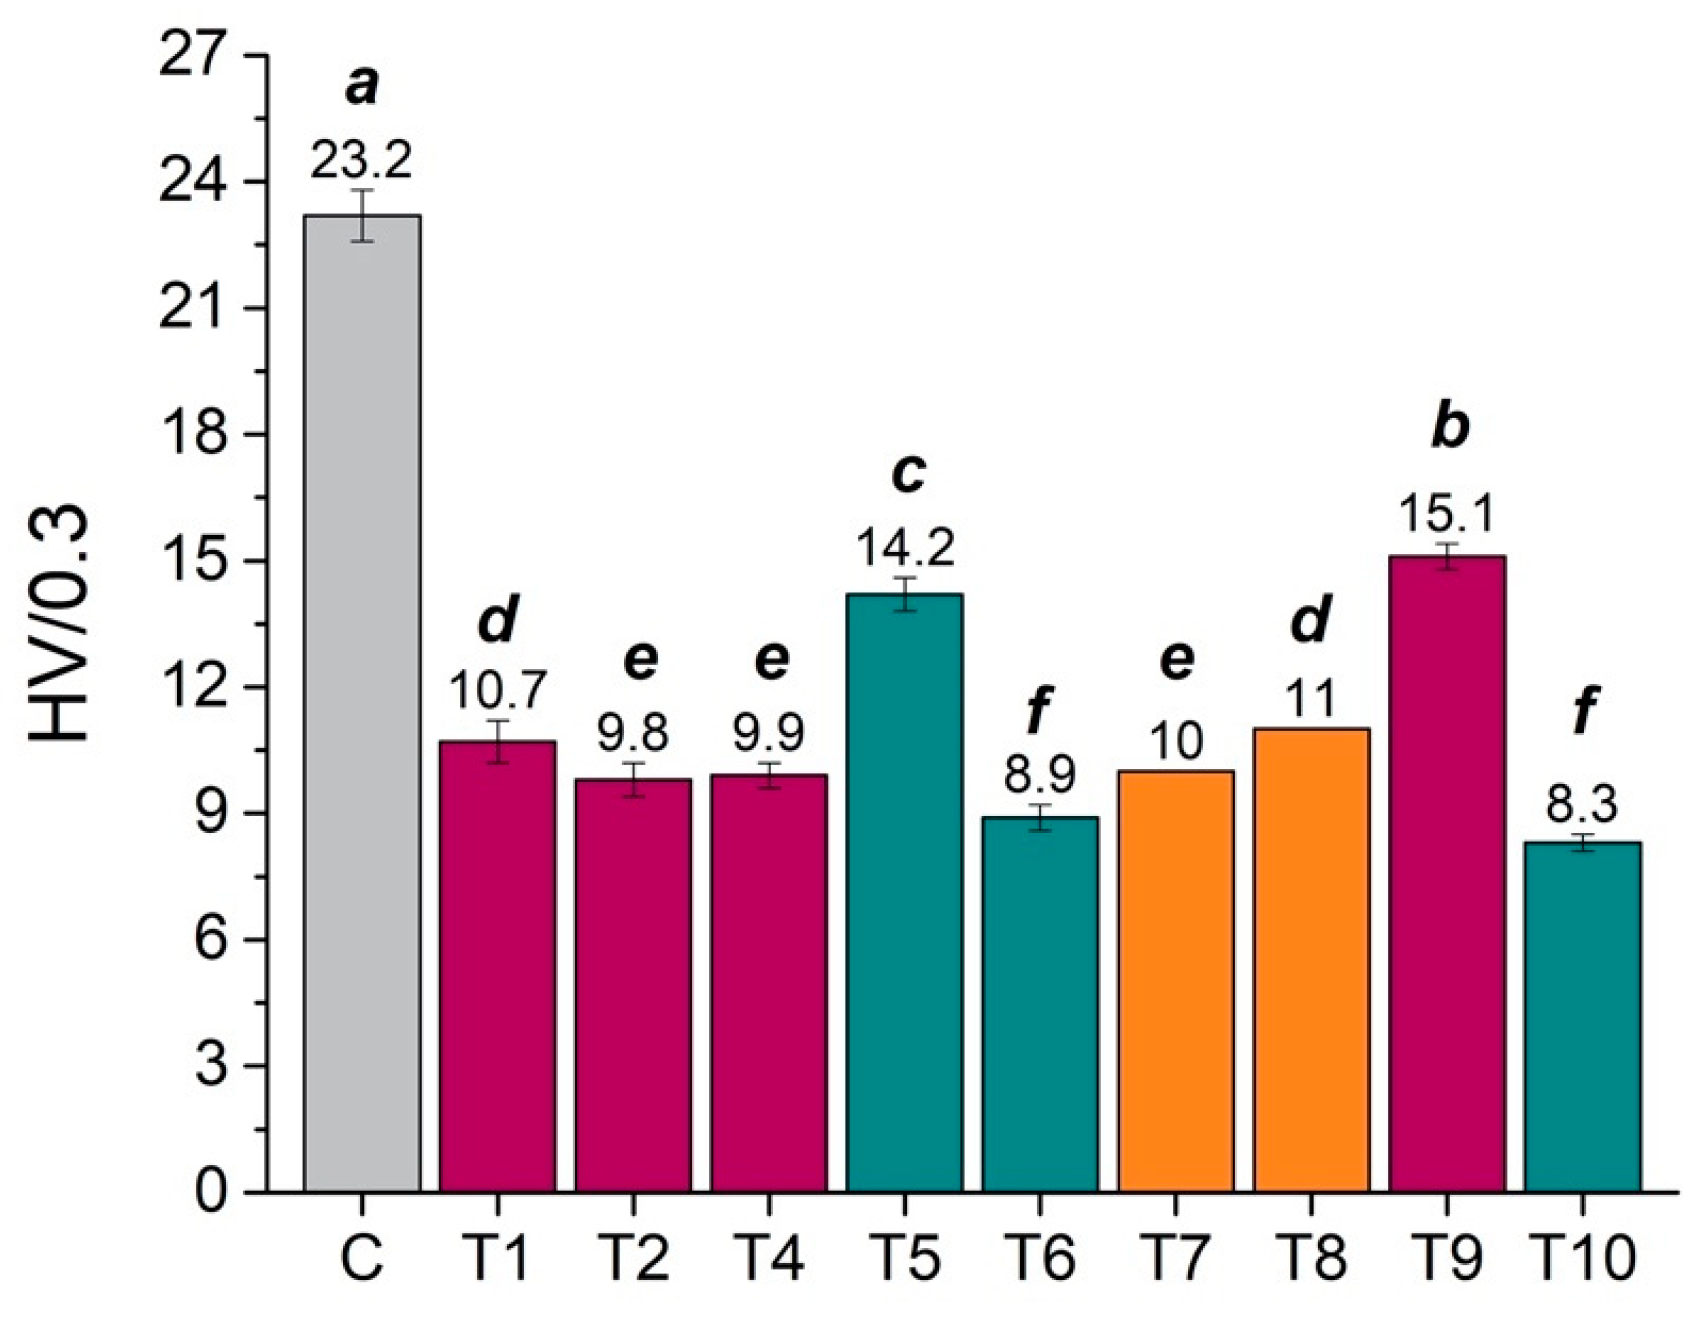
A significant decrease in the surface hardness of CO2-exposed samples compared with a set of controls was registered a few hours after tests. Corresponding Vickers hardness values (HV) are summarized in Figure 6. Lower HV values are attributed to a plasticization effect [96,97,98,99,100] and reduction of the glass transition temperature (Tg) due to the sorption of CO2 into the amorphous, unstructured regions in PMMA, as previously discussed. These conditions can promote localized rearrangements in pockets of free volume within the polymer network. The consequence is a significant increase in the chain mobility and intermolecular distances between them, which induce disentanglement and reorientation of the chains to a more thermodynamically favorable “crystalline” state [65,66,80,90,97,117,118,119]. These effects indicate that the CO2-exposed polymer is significantly plasticized by carbon dioxide with the potential of changing the mechanical properties of the material [65,66].
An indirect indication that the softening of the surface had occurred was also provided using optical microscopy (see Figure 4). After tests, the surface of all samples presented several scratches, abrasion scuffs, and marks produced while running ATR-FTIR spectra, suggesting that the samples were more fragile and prone to damage than before treatment. Special care and caution should be taken when removing the samples from the high-pressure cell and when handling and analyzing them.
Surface softening occurred for all specimens, and corresponding micro-hardness values were within the same range. However, the ANOVA post hoc Tukey–Kramer multiple comparison tests highlighted significant differences among the various CO2 trials, as shown in Figure 6 (mean values that do not share a letter are significantly different). It should be noted that hardness measurements for Tests 5 and 9 (see Table 1) were performed approximately 15 h after tests, rather than 4 h as for all the other samples, and this might explain the higher HV value.
Changes in the mechanical properties of PMMA (and other polymers) samples subjected to exposure to CO2 under different conditions were also registered by other authors with the aid of different techniques. That is, a decrease in tensile strength and Young’s modulus was also observed [65,66,68].

3.1.3. Spectroscopic Examinations

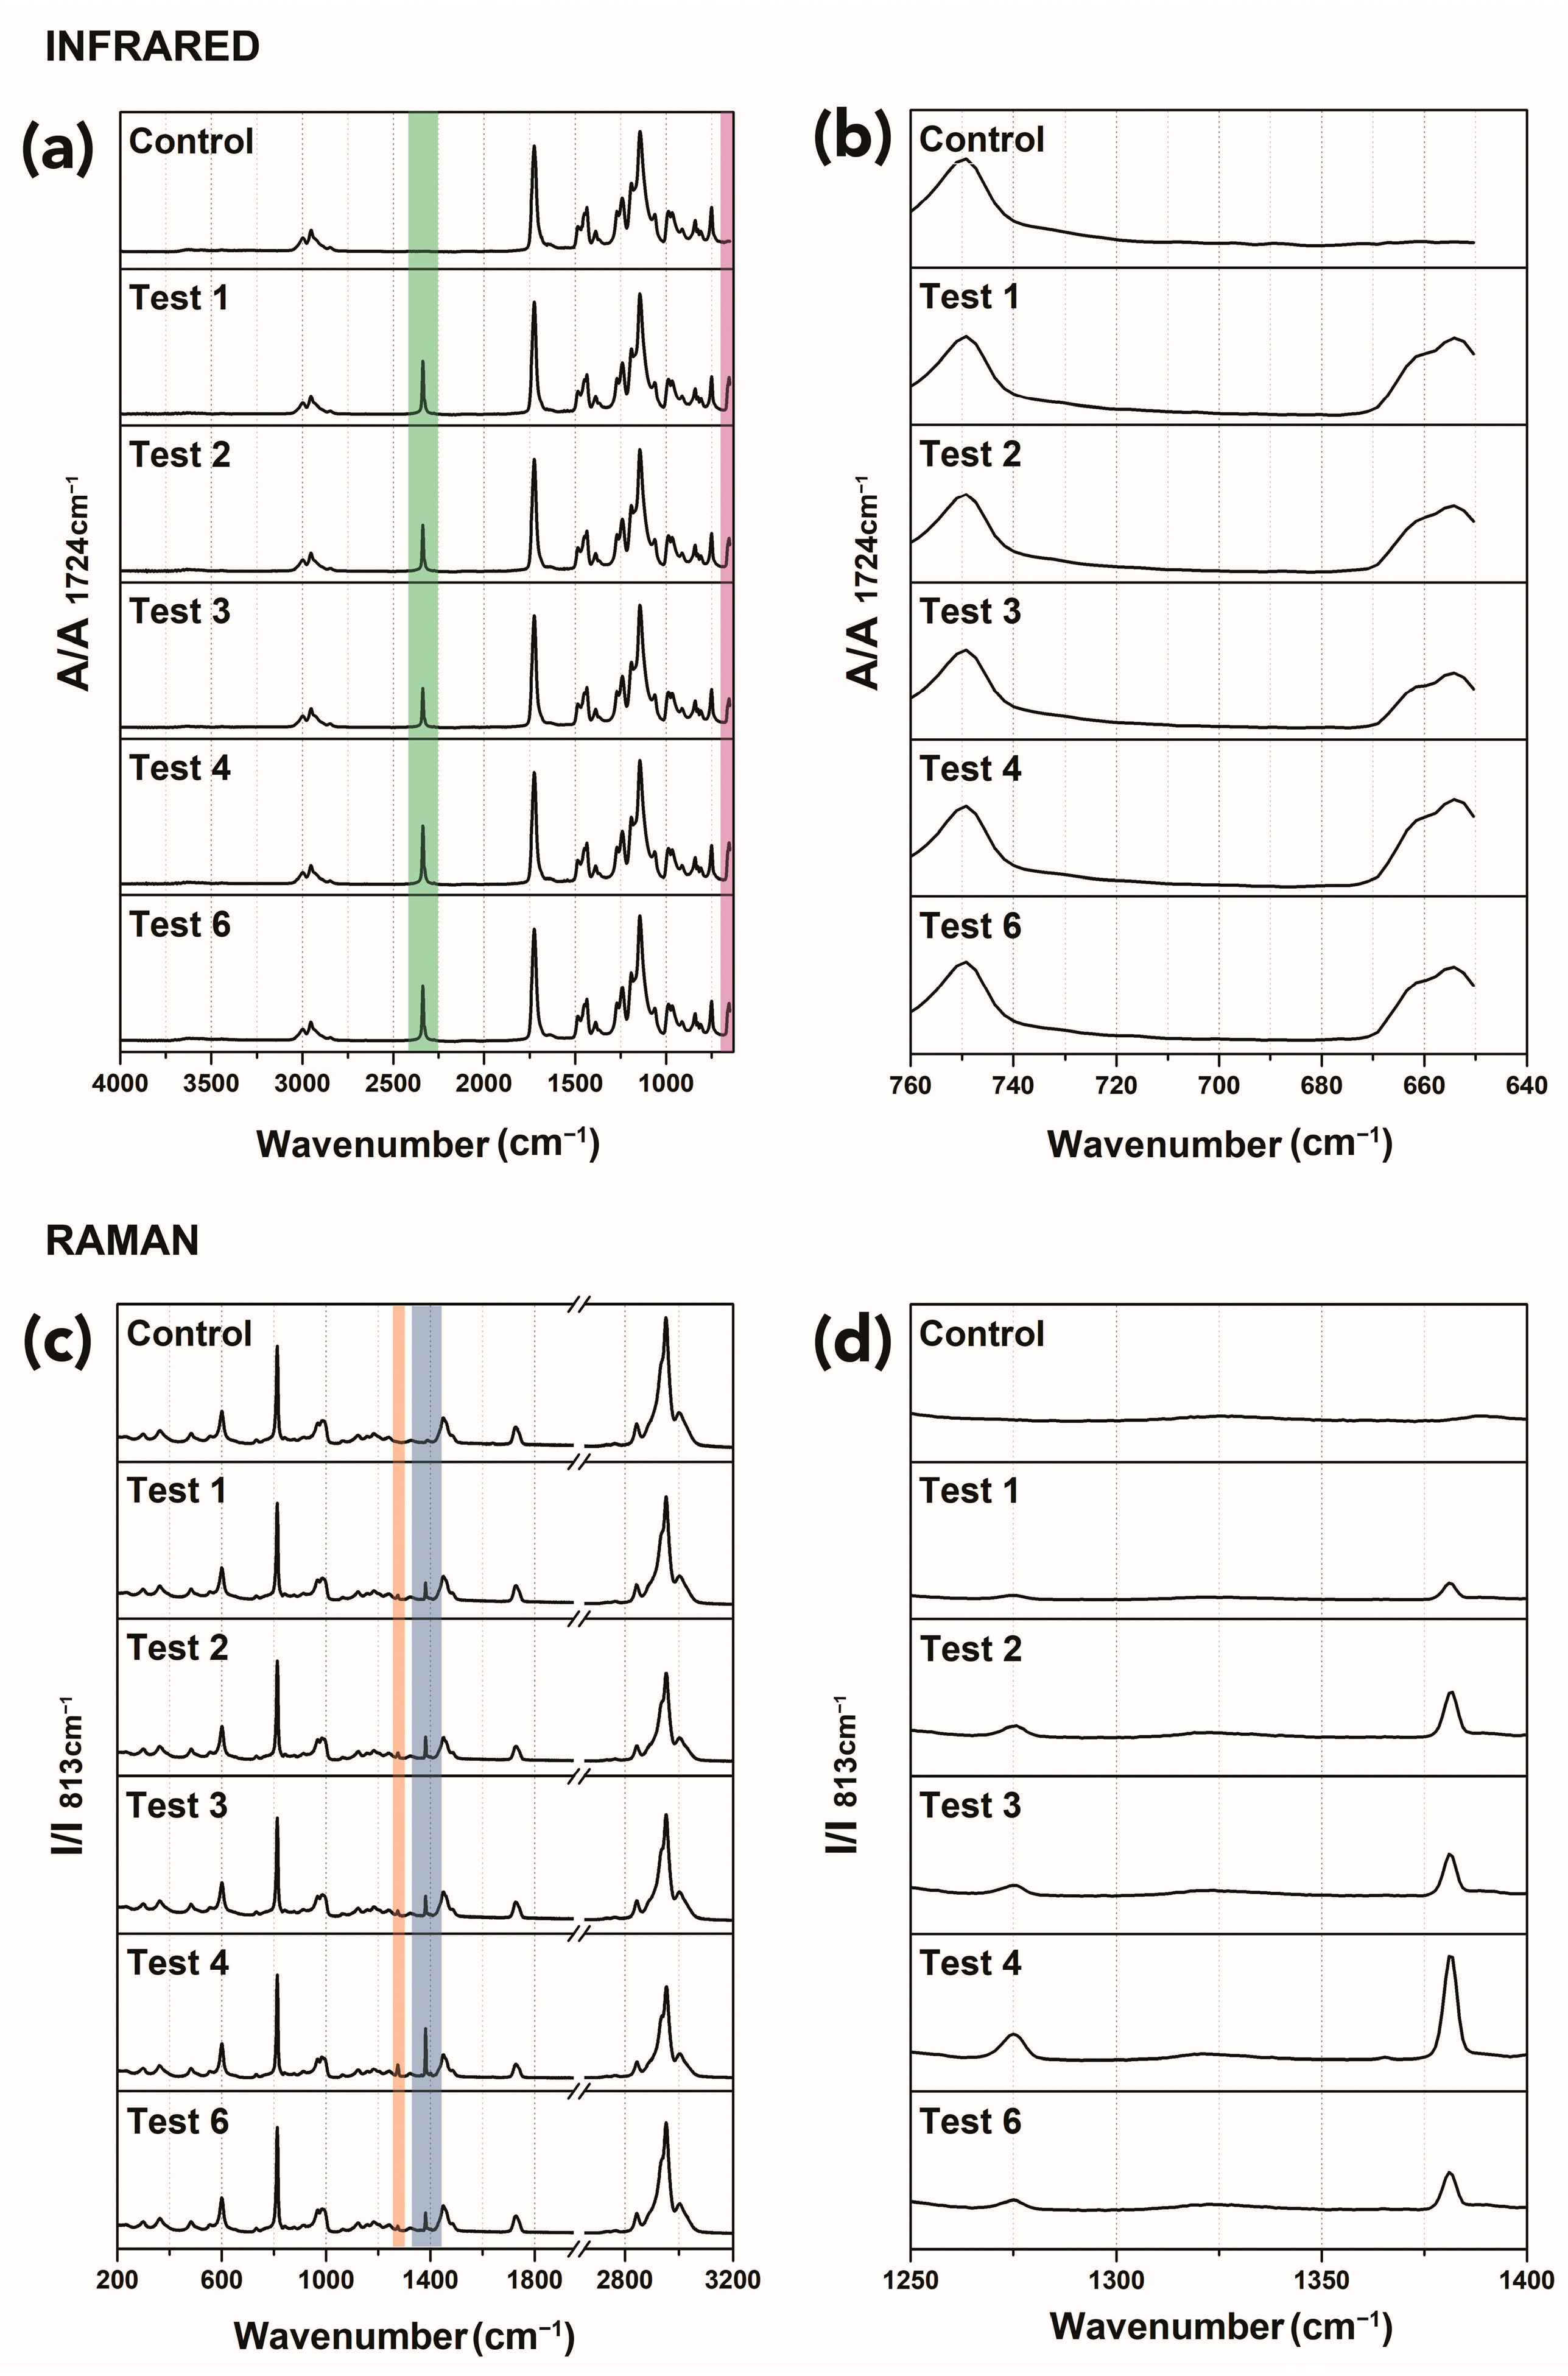
Figure 7 shows ATR-FTIR spectra (top, panels (a) and (b)) and Raman spectra (bottom, panels (c) and (d)) for control and samples exposed to CO2 at different conditions (Tests 1–4 and Test 6; see Table 1).
All spectra present a similar profile, which is representative of the PMMA homopolymer. The ATR-FTIR spectrum of the control sample (Figure 7, panels (a) and (b)) shows the following diagnostic peaks: C–H stretching (at 2995, 2951, and 2843 cm−1), C–C–O stretching (at 1269 and 1239 cm−1), C=O carbonyl stretching absorption peak (1731 cm−1), C–O–C stretch (1190 and 1143 cm−1) [120]. After trials, new absorption bands developed that were attributed to CO2 sequestered within the polymer, namely, a band at approximately 2338 cm−1 (highlighted in green in Figure 7a) and at 662 and 654 cm−1 (highlighted in violet in Figure 7a), the latter clearly visible in Figure 7b, where a detail of the 760–640 cm–1 region is shown [94,95,121].
Typical vibration bands for PMMA as analyzed by Raman spectroscopy (Figure 7c, control) are the C–H stretching vibration peaks (~2996, 2949, and 2842 cm−1), carbonyl stretching (1727 cm−1), and C–H bend (at 1450 cm−1), according to the literature [122,123]. Spectra for samples exposed to CO2 show the presence of additional sharp peaks that can be attributed to CO2 in the gas phase and dissolved in PMMA [64,124], namely, the peaks at 1391 and 1286 cm−1, highlighted in blue and orange, respectively, in Figure 7c and more clearly visible in Figure 7d, where a detail of the region 1250–1400 cm−1 is shown.

3.2. Long-Term Assessment

The loss of absorbed carbon dioxide from the polymer was monitored through mass reduction with time [80].
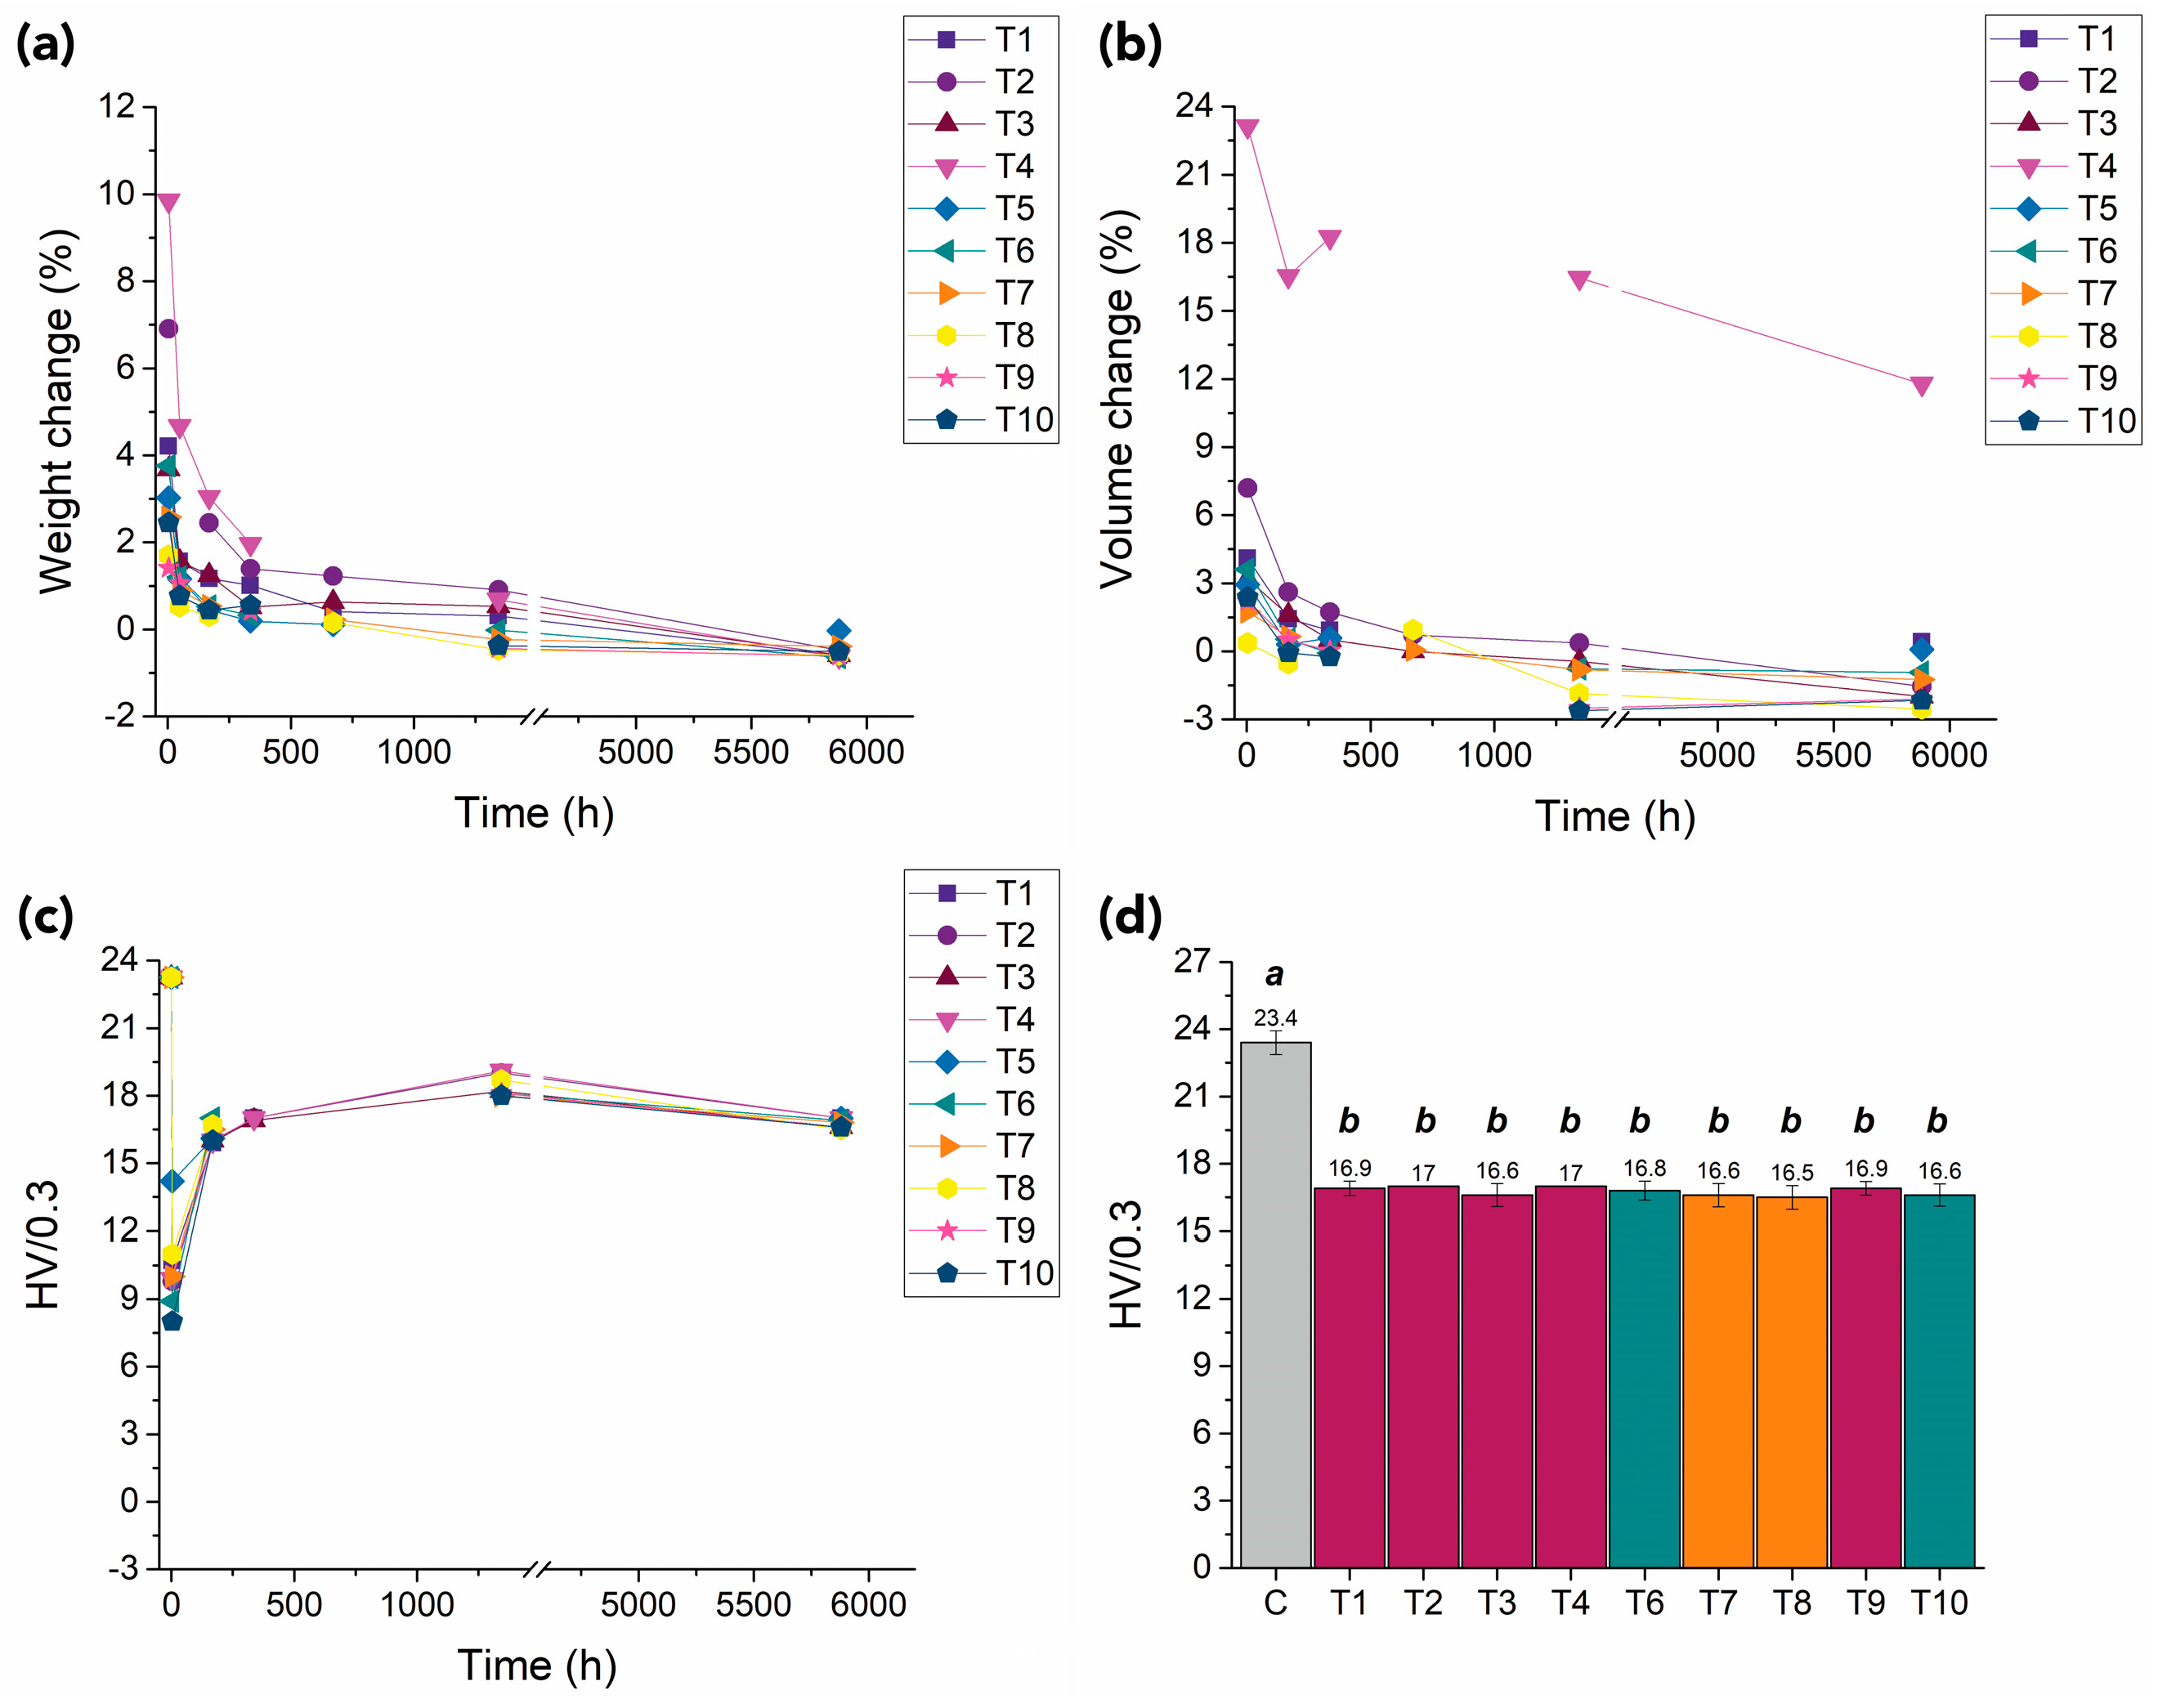
The desorption of CO2 was similar for all exposed samples (Figure 8a). Degassing occurred quickly within a few days and then slowed exponentially with time, with specimens reaching their original weight values. Within approximately 6000 h (~35 weeks), all samples showed maximum weight loss. Alterations were, however, in the range of 0.6% of the original weight, considerably below what could be attributed to experimental error; hence, these changes are not significant. More significant alterations in polymers’ weight after exposure to CO2 might be attributed to the extraction of monomers, oligomers, additives, stabilizers, processing aids, and plasticizers, as reported in the literature [88,89]. The samples’ dimensions also recovered to original values except for samples treated at 55 °C and 28 MPa (Test 4), which remained visibly swollen (Figure 8b).
With the desorption of CO2 from the samples, an increase in the hardness value was observed (Figure 8c). This can be related to a further rearrangement of the polymer chains occurring while the CO2 leaves the samples. Hardness values stabilized approximately 20 days after tests (~480 h). Oscillations in the values might be related to humidity uptake [9]. After 35 weeks, HV values were similar for all samples, with no significant differences noted by the ANOVA post hoc Tukey–Kramer multiple comparison tests (Figure 8d). Even though recovery of the hardness occurs with time, the values of the CO2-exposed samples remained lower and significantly different from the initial ones for the control of unexposed PMMA.
After 35 weeks, ATR-FTIR and Raman spectra of the CO2-exposed samples remained unaltered and similar to the control profile, suggesting that no molecular alterations had occurred due to exposure. Peaks assigned to CO2 almost completely disappeared from both infrared and Raman spectra 5 days after trials. A representative example is reported for Test 1 (scCO2 at 25 °C and 7 MPa) in Figure 9.
The visual appearance of the samples dramatically changed. Specimens became slightly shinier (assessed by the naked eye), and a dense network of fractures and stress-induced cracking became more evident over time, completely covering the samples’ surfaces (Figure 10).

4. Conclusions

This paper presented a systematic study on the effects of carbon dioxide at different conditions (supercritical, liquid, and vapor) on a new poly(methyl methacrylate) cast sheet to evaluate its safety and suitability as a solvent for conservation purposes. A multi-analytical approach involving OM under reflected and transmitted light (in brightfield and cross-polarized light modes, respectively), μ-Raman and ATR-FTIR spectroscopies, and micro-indentation was adopted to capture and follow potential changes in the appearance and physical, chemical and mechanical properties of the samples. The data collected showed that liquid and supercritical CO2 strongly interacted with the PMMA samples, inducing irreversible changes. Similar effects were also observed for tests performed with vapor CO2.
The most dramatic alterations noted involved changes in the visual aesthetic of the samples and their mechanical properties. Following exposure to CO2, a drastic decrease in the surface hardness of the samples was noted. The exposed specimens became more fragile and prone to scratching, which warrants caution when handling the samples. Observation under OM revealed the presence of severe scuffs and marks, including indentation marks left during ATR spectroscopy, which were not observed in samples not subjected to CO2. Smaller alterations were recorded if samples were exposed to CO2 for a shorter period (i.e., 30 min, Tests 9 and 10). Modification to the appearance of the samples occurred slowly and over time. A shift in the specimens’ gloss and some distortions around the edges were noticed immediately after trials. While these effects diminished slightly with time, a dense network of fractures and stress-induced cracking developed, covering the samples’ surfaces completely.
Considering that the modifications observed have compromised the samples’ aesthetic and future stability, it can be stated that CO2 is unsuitable as a green solvent for conservation treatments of PMMA. Polymer-based objects in cultural heritage collections exhibit different formulations and intrinsic characteristics; hence, the modifications observed on PMMA should not be expected to occur on all other plastics if exposed to CO2. For example, amorphous polymers might experience severe sorption/dissolution of carbon dioxide into the polymer network, with consequent swelling, dilation, extraction of plasticizers or other additives, and modification of the mechanical properties. In contrast, crystalline polymers, polyurethanes, and other foams might be less affected. Further research on the use of CO2 as a solvent for the treatment of other synthetic polymers will be the focus of forthcoming publications.

Author Contributions

Conceptualization, J.L.F. and T.C.; methodology, A.B. and J.L.F.; validation, A.B., I.S., T.C., A.M.R., Y.S., A.Q. and J.L.F.; formal analysis, A.B. and I.S.; investigation, A.B. and I.S.; resources, A.B. and I.S.; data curation, A.B. and I.S.; writing—original draft preparation, A.B.; writing—review and editing, A.B., I.S., T.C., A.M.R., Y.S., A.Q. and J.L.F.; visualization, A.B.; supervision, T.C. and J.L.F.; project administration, J.L.F.; funding acquisition, J.L.F. and T.C. All authors have read and agreed to the published version of the manuscript.

Funding

This research was financed by Fundação para a Ciência e a Tecnologia, Ministério da Ciência, Tecnologia, e Ensino Superior (FCT/MCTES), Portugal, through the funded research project “PlasCO2—Green CO2 Technologies for the Cleaning of Plastics in Museums and Heritage Collections” (PTDC/ARTOUT/29692/2017) and the Associate Laboratory for Green Chemistry (LAQV) financed by national funds (UIDB/50006/2020 and UIDP/50006/2020).

Institutional Review Board Statement

Not applicable.

Informed Consent Statement

Not applicable.

Data Availability Statement

Not applicable.

Acknowledgments

The authors would like to thank: all the PlasCO2 project team members, in particular Filipe Teixeira (CQUM, Universidade do Minho) for the fruitful discussion and Rui Silva (DCM and CENIMAT|I3N, FCT NOVA) for giving access to the micro-hardness tester.

Conflicts of Interest

The authors declare no conflict of interest. The funders had no role in the design of the study; in the collection, analyses, or interpretation of data; in the writing of the manuscript; or in the decision to publish the results.

References

  1. Quye, A.; Williamson, C. (Eds.) Plastics Collecting and Conserving; NMS Publishing Limited: Edinburgh, UK, 1999. [Google Scholar]
  2. Shashoua, Y. Conservation of Plastics—Materials Science, Degradation and Preservation; Elsevier: Oxford, UK, 2008. [Google Scholar]
  3. Van Oosten, T.; Lorne, A.; Béringuer, O. PUR Facts: Conservation of Polyurethane Foam in Art and Design; Amsterdam University Press: Amsterdam, The Netherlands, 2011. [Google Scholar]
  4. Lavédrine, B.; Fournier, A.; Martin, G. (Eds.) Preservation of Plastic Artefacts in Museum Collections (POPART); Comité Des Travaux Historiques et Scientifiques (CTHS): Paris, France, 2012. [Google Scholar]
  5. Appelbaum, B. Criteria for Treatment: Reversibility. J. Am. Inst. Conserv. JAIC 1987, 26, 65–73. [Google Scholar] [CrossRef]
  6. Wei, W. International Research on the Conservation and Restoration of Face-Mounted Photographs. In Proceedings of the ICOM-CC 15th Triennial Meeting, New Delhi, India, 22–26 September 2008; Allied Publishers Pvt Ltd: New Delhi, India, 2008; Volume 1, pp. 709–715. [Google Scholar]
  7. Wei, W. Surface Micro-Roughness, Cleaning, and Perception. In Proceedings of the ICOM Committee for Conservation 16th Triennial Meeting, Lisbon, Portugal, 19–23 September 2011. [Google Scholar]
  8. Balcar, N.; Barabant, G.; Bollard, C.; Kuperholc, S.; Keneghan, B.; Laganà, A.; van Oosten, T.; Segel, K.; Shashua, Y. Studies in Cleaning Plastics. In Preservation of Plastic Artefacts in Museum Collections (POPART); Lavédrine, B., Fournier, A., Martin, G., Eds.; Comité des Travaux Historiques et Scientifiques (CTHS): Paris, France, 2012; pp. 225–269. [Google Scholar]
  9. Babo, S.; Ferreira, J.L.; Ramos, A.M.; Micheluz, A.; Pamplona, M.; Casimiro, M.H.; Ferreira, L.M.; Melo, M.J. Characterization and Long-Term Stability of Historical PMMA: Impact of Additives and Acrylic Sheet Industrial Production Processes. Polymers 2020, 12, 2198. [Google Scholar] [CrossRef] [PubMed]
  10. Micheluz, A.; Angelini, E.M.; Lopes, J.A.; Melo, M.J.; Pamplona, M. Discoloration of Historical Plastic Objects: New Insight into the Degradation of β-Naphthol Pigment Lakes. Polymers 2021, 13, 2278. [Google Scholar] [CrossRef] [PubMed]
  11. Krieg, T.; Mazzon, C.; Gómez-Sánchez, E. Material Analysis and a Visual Guide of Degradation Phenomena in Historical Synthetic Polymers as Tools to Follow Ageing Processes in Industrial Heritage Collections. Polymers 2021, 14, 121. [Google Scholar] [CrossRef] [PubMed]
  12. Neves, A.; Ramos, A.M.; Callapez, M.E.; Friedel, R.; Réfrégiers, M.; Thoury, M.; Melo, M.J. Novel Markers to Early Detect Degradation on Cellulose Nitrate-Based Heritage at the Submicrometer Level Using Synchrotron UV–VIS Multispectral Luminescence. Sci. Rep. 2021, 11, 20208. [Google Scholar] [CrossRef]
  13. Lazzari, M.; Reggio, D. Some Applications of a Novel Surface Enhanced Raman Spectroscopy (SERS)-Based Strategy for the Detection of Art Materials. In Science and Digital Technology for Cultural Heritage; CRC Press: London, UK, 2019; pp. 333–337. ISBN 9780429345470. [Google Scholar]
  14. Reggio, D.; Saviello, D.; Lazzari, M.; Iacopino, D. Characterization of Contemporary and Historical Acrylonitrile Butadiene Styrene (ABS)-Based Objects: Pilot Study for Handheld Raman Analysis in Collections. Spectrochim. Acta. A Mol. Biomol. Spectrosc. 2020, 242, 118733. [Google Scholar] [CrossRef]
  15. Soares, I.; de Sá, S.F.; Ferreira, J.L. A First Approach into the Characterisation of Historical Plastic Objects by in Situ Diffuse Reflection Infrared Fourier Transform (DRIFT) Spectroscopy. Spectrochim. Acta. A Mol. Biomol. Spectrosc. 2020, 240, 118548. [Google Scholar] [CrossRef]
  16. Da Ros, S.; Curran, K.; del Gaudio, I.; Ormsby, B.; Townsend, J.H.; Cane, D.; Gili, A. Unveiling the Importance of Diffusion on the Deterioration of Cellulose Acetate Artefacts: The Profile of Plasticiser Loss as Assessed by Infrared Microscopy. In Proceedings of the Transcending Boundaries: Integrated Approaches to Conservation, ICOM-CC 19th Triennial Conference Preprints, Beijing, China, 17–21 May 2021. [Google Scholar]
  17. Angelini, E.; de Sá, S.F.; Soares, I.; Callapez, M.E.; Ferreira, J.L.; Melo, M.J.; Bacci, M.; Picollo, M. Application of Infrared Reflectance Spectroscopy on Plastics in Cultural Heritage Collections: A Comparative Assessment of Two Portable Mid-Fourier Transform Infrared Reflection Devices. Appl. Spectrosc. 2021, 75, 818–833. [Google Scholar] [CrossRef]
  18. Shashoua, Y. Modern plastics: Do they suffer from the cold? Stud. Conserv. 2004, 49, 91–95. [Google Scholar] [CrossRef]
  19. Shashoua, Y. Mesocycles in Conserving Plastics. Stud. Conserv. 2016, 61, 208–213. [Google Scholar] [CrossRef]
  20. Curran, K. A System Dynamics Approach to the Preventive Conservation of Modern Polymeric Materials in Collections. Stud. Conserv. 2018, 63, 342–344. [Google Scholar] [CrossRef] [Green Version]
  21. King, R.; Grau-Bové, J.; Curran, K. Plasticiser Loss in Heritage Collections: Its Prevalence, Cause, Effect, and Methods for Analysis. Herit. Sci. 2020, 8, 123. [Google Scholar] [CrossRef]
  22. Cappitelli, F.; Villa, F.; Sanmartín, P. Interactions of Microorganisms and Synthetic Polymers in Cultural Heritage Conservation. Int. Biodeterior. Biodegrad. 2021, 163, 105282. [Google Scholar] [CrossRef]
  23. Stuart, B.; Wong, S.; Goodall, R.; Beale, A.; Chu, C.; Nel, P.; Amin-Jones, H.; Thomas, P. Safe Storage? An Assessment of Polyethylene for the Storage of Heritage Objects. Stud. Conserv. 2022, 1–10. [Google Scholar] [CrossRef]
  24. Waentig, F. Plastics in Art; Michael Imhof Verlag: Petersberg, Germany, 2008. [Google Scholar]
  25. Lozano, M.V.C.; Sciutto, G.; Prati, S.; Mazzeo, R. Deep Eutectic Solvents: Green Solvents for the Removal of Degraded Gelatin on Cellulose Nitrate Cinematographic Films. Herit. Sci. 2022, 10, 114. [Google Scholar] [CrossRef]
  26. Kampasakali, E.; Fardi, T.; Pavlidou, E.; Christofilos, D. Towards Sustainable Museum Conservation Practices: A Study on the Surface Cleaning of Contemporary Art and Design Objects with the Use of Biodegradable Agents. Heritage 2021, 4, 115. [Google Scholar] [CrossRef]
  27. Kavda, S.; Dhopatkar, N.; Angelova, L.V.; Richardson, E.; Golfomitsou, S.; Dhinojwala, A. Surface Behaviour of PMMA: Is Gel Cleaning the Way to Go? Stud. Conserv. 2016, 61, 297–299. [Google Scholar] [CrossRef]
  28. Shashoua, Y.; Alterini, M.; Pastorelli, G.; Cone, L. From Microfibre Cloths to Poly(Vinyl Alcohol) Hydrogels—Conservation Cleaning of Plastics Heritage. J. Cult. Herit. 2021, 52, 38–43. [Google Scholar] [CrossRef]
  29. Angelova, L.V.; Sofer, G.; Bartoletti, A.; Ormsby, B. A Comparative Surface Cleaning Study of Op Structure, an Op Art PMMA Sculpture by Michael Dillon. J. Am. Inst. Conserv. 2022, 1–20. [Google Scholar] [CrossRef]
  30. Zhang, X.; Heinonen, S.; Levänen, E. Applications of Supercritical Carbon Dioxide in Materials Processing and Synthesis. RSC Adv. 2014, 4, 61137–61152. [Google Scholar] [CrossRef]
  31. Brunner, G. Gas Extraction; Topics in Physical Chemistry; Steinkopff: Heidelberg, Germany, 1994; Volume 4, ISBN 9783662073827. [Google Scholar]
  32. Fleming, O.S.; Kazarian, S.G. Polymer Processing with Supercritical Fluids. In Supercritical Carbon Dioxide: In Polymer Reaction Engineering; Kemmere, M.F., Meyer, T., Eds.; Weinheim Wiley-VCH: Hoboken, NJ, USA, 2006; pp. 205–238. ISBN 9783527310920. [Google Scholar]
  33. Nalawade, S.P.; Picchioni, F.; Janssen, L.P.B.M. Supercritical Carbon Dioxide as a Green Solvent for Processing Polymer Melts: Processing Aspects and Applications. Prog. Polym. Sci. 2006, 31, 19–43. [Google Scholar] [CrossRef] [Green Version]
  34. Aguiar-Ricardo, A.; Bonifácio, V.D.; Casimiro, T.; Correia, V.G.; Bonifácio, V.D.; Casimiro, T.; Correira, V. Supercritical Carbon Dioxide Design Strategies: From Drug Carriers to Soft Killers. Philos. Trans. Math. Phys. Eng. Sci. 2015, 373, 20150009. [Google Scholar] [CrossRef] [PubMed]
  35. Champeau, M.; Thomassin, J.-M.; Tassaing, T.; Jérôme, C. Drug Loading of Polymer Implants by Supercritical CO2 Assisted Impregnation: A Review. J. Control. Release 2015, 209, 248–259. [Google Scholar] [CrossRef] [PubMed]
  36. Coelho, J.P.; Cristino, A.F.; Matos, P.G.; Rauter, A.P.; Nobre, B.P.; Mendes, R.L.; Barroso, J.G.; Mainar, A.; Urieta, J.S.; Fareleira, J.M.N.A.; et al. Extraction of Volatile Oil from Aromatic Plants with Supercritical Carbon Dioxide: Experiments and Modeling. Molecules 2012, 17, 10550–10573. [Google Scholar] [CrossRef] [Green Version]
  37. Yu, X.; Zhang, H.; Wang, J.; Wang, J.; Wang, Z.; Li, J. Phytochemical Compositions and Antioxidant Activities of Essential Oils Extracted from the Flowers of Paeonia Delavayi Using Supercritical Carbon Dioxide Fluid. Molecules 2022, 27, 3000. [Google Scholar] [CrossRef]
  38. Chouaibi, M. Chapter 31—Supercritical Carbon Dioxide Extraction of Clove Essential Oil: Optimization and Characterization. In Clove (Syzygium aromaticum); Ramadan, M.F., Ed.; Academic Press: Cambridge, MA, USA, 2022; pp. 531–540. ISBN 9780323851770. [Google Scholar]
  39. De Marco, I.; Riemma, S.; Iannone, R. Life Cycle Assessment of Supercritical CO2 Extraction of Caffeine from Coffee Beans. J. Supercrit. Fluids 2018, 133, 393–400. [Google Scholar] [CrossRef]
  40. Coelho, J.P.; Filipe, R.M.; Paula Robalo, M.; Boyadzhieva, S.; Cholakov, G.S.; Stateva, R.P. Supercritical CO2 Extraction of Spent Coffee Grounds. Influence of Co-Solvents and Characterization of the Extracts. J. Supercrit. Fluids 2020, 161, 104825. [Google Scholar] [CrossRef]
  41. McHardy, J.; Sawan, S.P. (Eds.) Supercritical Fluid Cleaning: Fundamentals, Technology, and Applications; Materials Science and Process Technology Series; Noyes Publications: Westwood, NJ, USA, 1998; ISBN 9780815514169. [Google Scholar]
  42. Banerjee, S.; Sutanto, S.; Kleijn, J.M.; van Roosmalen, M.J.E.; Witkamp, G.-J.; Stuart, M.A.C. Colloidal Interactions in Liquid CO2—A Dry-Cleaning Perspective. Adv. Colloid Interface Sci. 2012, 175, 11–24. [Google Scholar] [CrossRef]
  43. Lawandy, N.M.; Smuk, A.Y. Supercritical Fluid Cleaning of Banknotes. Ind. Eng. Chem. Res. 2014, 53, 530–540. [Google Scholar] [CrossRef]
  44. Ben Said, A.; Guinot, C.; Ruiz, J.-C.; Grandjean, A.; Dole, P.; Joly, C.; Chalamet, Y. Supercritical CO2 Extraction of Contaminants from Polypropylene Intended for Food Contact: Effects of Contaminant Molecular Structure and Processing Parameters. J. Supercrit. Fluids 2016, 110, 22–31. [Google Scholar] [CrossRef]
  45. Alassali, A.; Aboud, N.; Kuchta, K.; Jaeger, P.; Zeinolebadi, A. Assessment of Supercritical CO2 Extraction as a Method for Plastic Waste Decontamination. Polymers 2020, 12, 1347. [Google Scholar] [CrossRef] [PubMed]
  46. Clifford, T. Fundamentals of Supercritical Fluids; Oxford University Press: Oxford, UK, 1999. [Google Scholar]
  47. Weingärtner, H.; Franck, E.U.; Weingärtner, H.; Franck, E.U. Supercritical Water as a Solvent. Angew. Chem. Int. Ed. 2005, 44, 2672–2692. [Google Scholar] [CrossRef] [PubMed]
  48. Kaye, B.; Cole-Hamilton, D.J.; Morphet, K. Supercritical Drying: A New Method for Conserving Waterlogged Archaeological Materials. Stud. Conserv. 2000, 45, 233. [Google Scholar] [CrossRef]
  49. Cretté, S.A.; Näsänen, L.M.; González-Pereyra, N.G.; Rennison, B. Conservation of Waterlogged Archaeological Corks Using Supercritical CO2 and Treatment Monitoring Using Structured-Light 3D Scanning. J. Supercrit. Fluids 2013, 79, 299–313. [Google Scholar] [CrossRef]
  50. Tello, H.; Unger, A. Pesticides “Green Chemistry” Finds Its Way into Conservation Science. ICOM-CC Work. Group Ethnogr. Conserv. Newsl. 2006, 27, 3–5. [Google Scholar]
  51. Kang, S.M.; Unger, A.; Morrell, J.J. The Effect of Supercritical Carbon Dioxide Extraction on Color Retention and Pesticide Reduction of Wooden Artifacts. J. Am. Inst. Conserv. 2004, 43, 151–160. [Google Scholar] [CrossRef]
  52. Selli, E.; Langè, E.; Mossa, A.; Testa, G.; Seves, A. Preservation Treatments of Aged Papers by Supercritical Carbon Dioxide. Macromol. Mater. Eng. 2000, 280–281, 71–75. [Google Scholar] [CrossRef]
  53. Dobrodskaya, T.V.; Egoyants, P.A.; Ikonnikov, V.K.; Romashenkova, N.D.; Sirotin, S.A.; Dobrusina, S.A.; Podgornaya, N.I. Treatment of Paper with Basic Agents in Alcohols and Supercritical Carbon Dioxide to Neutralize Acid and Prolong Storage Time. Russ. J. Appl. Chem. 2004, 77, 2017–2021. [Google Scholar] [CrossRef]
  54. Ikonnikov, V.K.; Dobrodskaya, T.V.; Romaschenkova, N.D.; Sirotin, S.A.; Dobrusina, S.A.; Podgornaya, N.I. Development of Technology for Large-Batch Treatment of Paper-Based Information Carriers with Carbon Dioxide Ensuring Their Long-Term Preservation. Russ. J. Phys. Chem. B 2010, 4, 1196–1206. [Google Scholar] [CrossRef]
  55. Wang, Y.J.; Tan, W.; Liu, C.Y.; Fang, Y.X. Deacidification of Paper in Supercritical Carbon Dioxide (CO2SCF) Solvent System with Magnesium Acetate and Calcium Hydroxide. Adv. Mater. Res. 2012, 347–353, 504–507. [Google Scholar] [CrossRef]
  56. Tan, W.; Cheng, L.F.; Fang, Y.X. Deacidification of Paper Using Supercritical Carbon Dioxide Containing Calcium Propionate or Magnesium Bicarbonate. Adv. Mater. Res. 2013, 781–784, 2637–2640. [Google Scholar] [CrossRef]
  57. Yanjuan, W.; Yanxiong, F.; Wei, T.; Chunying, L. Preservation of Aged Paper Using Borax in Alcohols and the Supercritical Carbon Dioxide System. J. Cult. Herit. 2013, 14, 16–22. [Google Scholar] [CrossRef]
  58. Teixeira, F.S.; dos Reis, T.A.; Sgubin, L.; Thomé, L.E.; Bei, I.W.; Clemencio, R.E.; Corrêa, B.; Salvadori, M.C. Disinfection of Ancient Paper Contaminated with Fungi Using Supercritical Carbon Dioxide. J. Cult. Herit. 2018, 30, 110–116. [Google Scholar] [CrossRef]
  59. Sousa, M.; Melo, M.J.; Casimiro, T.; Aguiar-Ricardo, A. The Art of CO2 for Art Conservation: A Green Approach to Antique Textile Cleaning. Green Chem. 2007, 9, 943. [Google Scholar] [CrossRef]
  60. Frade, C.S.C.; Cruz, P.; Lopes, E.; Sousa, M.M.; Hallett, J.; Santos, R.; Aguiar-Ricardo, A.; Casimiro, T. Cleaning Classical Persian Carpets with Silk and Precious Metal Thread: Conservation and Ethical Considerations. In Proceedings of the ICOM Committee for Conservation 16th Triennial Meeting, Lisbon, Portugal, 19–23 September 2011; Critério Artes Gráficas, Lda.. ICOM Committee for Conservation: Lisbon, Portugal, 2011. [Google Scholar]
  61. Aslanidou, D.; Tsioptsias, C.; Panayiotou, C. A Novel Approach for Textile Cleaning Based on Supercritical CO2 and Pickering Emulsions. J. Supercrit. Fluids 2013, 76, 83–93. [Google Scholar] [CrossRef]
  62. Aslanidou, D.; Karapanagiotis, I.; Panayiotou, C. Tuneable Textile Cleaning and Disinfection Process Based on Supercritical CO2 and Pickering Emulsions. J. Supercrit. Fluids 2016, 118, 128–139. [Google Scholar] [CrossRef]
  63. Aslanidou, D.; Karapanagiotis, I.; Panayiotou, C. Superhydrophobic, Superoleophobic Coatings for the Protection of Silk Textiles. Prog. Org. Coat. 2016, 97, 44–52. [Google Scholar] [CrossRef]
  64. Ikeda-Fukazawa, T.; Kita, D.; Nagashima, K. Raman Spectroscopic Study of CO2 Sorption Process in Poly Methyl Methacrylate. J. Polym. Sci. Part B Polym. Phys. 2008, 46, 831–842. [Google Scholar] [CrossRef]
  65. Shieh, Y.-T.; Su, J.-H.; Manivannan, G.; Lee, P.H.C.; Sawan, S.P.; Spall, W.D. Interaction of Supercritical Carbon Dioxide with Polymers. I. Crystalline Polymers. J. Appl. Polym. Sci. 1996, 59, 695–705. [Google Scholar] [CrossRef]
  66. Shieh, Y.T.; Su, J.H.; Manivannan, G.; Lee, P.H.C.; Sawan, S.P.; Spall, W.D. Interaction of Supercritical Carbon Dioxide with Polymers. II. Amorphous Polymers. J. Appl. Polym. Sci. 1996, 59, 707–717. [Google Scholar] [CrossRef]
  67. Üzer, S.; Akman, U.; Hortaçsu, Ö. Polymer Swelling and Impregnation Using Supercritical CO2: A Model-Component Study towards Producing Controlled-Release Drugs. J. Supercrit. Fluids 2006, 38, 119–128. [Google Scholar] [CrossRef]
  68. Jiménez, A.; Thompson, G.L.; Matthews, M.A.; Davis, T.A.; Crocker, K.; Lyons, J.S.; Trapotsis, A. Compatibility of Medical-Grade Polymers with Dense CO2. J. Supercrit. Fluids 2007, 42, 366–372. [Google Scholar] [CrossRef] [PubMed] [Green Version]
  69. Rindfleisch, F.; DiNoia, T.P.; McHugh, M.A. Solubility of Polymers and Copolymers in Supercritical CO2. J. Phys. Chem. 1996, 100, 15581–15587. [Google Scholar] [CrossRef]
  70. Kirby, C.F.; McHugh, M.A. Phase Behavior of Polymers in Supercritical Fluid Solvents. Chem. Rev. 1999, 99, 565–602. [Google Scholar] [CrossRef] [PubMed]
  71. McHugh, M.A. Solubility of Polymers in Supercritical Carbon Dioxide. In Green Chemistry Using Liquid and Supercritical Carbon Dioxide; DeSimone, J., Tumas, W., Eds.; Oxford University Press: New York, NY, USA, 2003; pp. 125–133. ISBN 9780195154832. [Google Scholar]
  72. Sadowski, G. Phase Behavior of Polymer Systems in High-Pressure Carbon Dioxide. In Supercritical Carbon Dioxide: In Polymer Reaction Engineering; Kemmere, M.F., Thierry, M., Eds.; WILEY-VCH Verlag GmbH & Co. KGaA: Weinheim, Germany, 2005; pp. 15–36. [Google Scholar]
  73. Kemmere, M.F.; Meyer, T. (Eds.) Supercritical Carbon Dioxide: In Polymer Reaction Engineering; Wiley-VCH Verlag GmbH & Co. KGaA: Weinheim, Germany, 2005; ISBN 9783527310920. [Google Scholar]
  74. Di Maio, E.; Kiran, E. Foaming of Polymers with Supercritical Fluids and Perspectives on the Current Knowledge Gaps and Challenges. J. Supercrit. Fluids 2018, 134, 157–166. [Google Scholar] [CrossRef]
  75. Koros, W.J.; Smith, G.N.; Stannett, V. High-pressure Sorption of Carbon Dioxide in Solvent-cast Poly(Methyl Methacrylate) and Poly(Ethyl Methacrylate) Films. J. Appl. Polym. Sci. 1981, 26, 159–170. [Google Scholar] [CrossRef]
  76. Kamiya, Y.; Hirose, T.; Mizoguchi, K.; Naito, Y. Gravimetric Study of High-Pressure Sorption of Gases in Polymers. J. Polym. Sci. Part B Polym. Phys. 1986, 24, 1525–1539. [Google Scholar] [CrossRef]
  77. Wissinger, R.G.; Paulaitis, M.E. Swelling and Sorption in Polymer– CO2 Mixtures at Elevated Pressures. J. Polym. Sci. Part B Polym. Phys. 1987, 25, 2497–2510. [Google Scholar] [CrossRef]
  78. Chang, S.-H.; Park, S.-C.; Shim, J.-J. Phase Equilibria of Supercritical Fluid–Polymer Systems. J. Supercrit. Fluids 1998, 13, 113–119. [Google Scholar] [CrossRef]
  79. Kamiya, Y.; Mizoguchi, K.; Terada, K.; Fujiwara, Y.; Wang, J.-S. CO2 Sorption and Dilation of Poly(Methyl Methacrylate). Macromolecules 1998, 31, 472–478. [Google Scholar] [CrossRef]
  80. Webb, K.F.; Teja, A.S. Solubility and Diffusion of Carbon Dioxide in Polymers. Fluid Phase Equilibria 1999, 158–160, 1029–1034. [Google Scholar] [CrossRef]
  81. Gallyamov, M.O.; Vinokur, R.A.; Nikitin, L.N.; Said-Galiyev, E.E.; Khokhlov, A.R.; Schaumburg, K. Poly(Methyl Methacrylate) and Poly(Butyl Methacrylate) Swelling in Supercritical Carbon Dioxide and the Formation of a Porous Structure. Высoкoмoлекулярные Сoединения. Серия А 2002, 44, 12. [Google Scholar]
  82. Nikitin, L.N.; Said-Galiyev, E.E.; Vinokur, R.A.; Khokhlov, A.R.; Gallyamov, M.O.; Schaumburg, K. Poly(Methyl Methacrylate) and Poly(Butyl Methacrylate) Swelling in Supercritical Carbon Dioxide. Macromolecules 2002, 35, 934–940. [Google Scholar] [CrossRef]
  83. Liu, D.; Li, H.; Noon, M.S.; Tomasko, D.L. CO2-Induced PMMA Swelling and Multiple Thermodynamic Property Analysis Using Sanchez−Lacombe EOS. Macromolecules 2005, 38, 4416–4424. [Google Scholar] [CrossRef]
  84. Rajendran, A.; Bonavoglia, B.; Forrer, N.; Storti, G.; Mazzotti, M.; Morbidelli, M. Simultaneous Measurement of Swelling and Sorption in a Supercritical CO2−Poly(Methyl Methacrylate) System. Ind. Eng. Chem. Res. 2005, 44, 2549–2560. [Google Scholar] [CrossRef]
  85. Pantoula, M.; Panayiotou, C. Sorption and Swelling in Glassy Polymer/Carbon Dioxide Systems. J. Supercrit. Fluids 2006, 37, 254–262. [Google Scholar] [CrossRef]
  86. Pantoula, M.; von Schnitzler, J.; Eggers, R.; Panayiotou, C. Sorption and Swelling in Glassy Polymer/Carbon Dioxide Systems. J. Supercrit. Fluids 2007, 39, 426–434. [Google Scholar] [CrossRef]
  87. Tang, Q.; Yang, B.; Zhao, Y.; Zhao, L. Sorption and Diffusion of Sub/Supercritical Carbon Dioxide in Poly(Methyl Methacrylate). J. Macromol. Sci. Part B 2007, 46, 275–284. [Google Scholar] [CrossRef]
  88. Carlà, V.; Hussain, Y.; Grant, C.; Sarti, G.C.; Carbonell, R.G.; Doghieri, F. Modeling Sorption Kinetics of Carbon Dioxide in Glassy Polymeric Films Using the Nonequilibrium Thermodynamics Approach. Ind. Eng. Chem. Res. 2009, 48, 3844–3854. [Google Scholar] [CrossRef]
  89. Eslami, H.; Kesik, M.; Karimi-Varzaneh, H.A.; Müller-Plathe, F. Sorption and Diffusion of Carbon Dioxide and Nitrogen in Poly(Methyl Methacrylate). J. Chem. Phys. 2013, 139, 124902. [Google Scholar] [CrossRef]
  90. Li, R.; Zhang, Z.; Fang, T. Experimental Research on Swelling and Glass Transition Behavior of Poly(Methyl Methacrylate) in Supercritical Carbon Dioxide. J. Supercrit. Fluids 2016, 110, 110–116. [Google Scholar] [CrossRef]
  91. Gurina; Budkov; Kiselev Molecular Dynamics Study of the Swelling of Poly(Methyl Methacrylate) in Supercritical Carbon Dioxide. Materials 2019, 12, 3315. [CrossRef] [PubMed]
  92. Ushiki, I.; Hayashi, S.; Kihara, S.; Takishima, S. Solubilities and Diffusion Coefficients of Carbon Dioxide and Nitrogen in Poly(Methyl Methacrylate) at High Temperatures and Pressures. J. Supercrit. Fluids 2019, 152, 104565. [Google Scholar] [CrossRef]
  93. Sobornova, V.V.; Belov, K.V.; Dyshin, A.A.; Gurina, D.L.; Khodov, I.A.; Kiselev, M.G. Molecular Dynamics and Nuclear Magnetic Resonance Studies of Supercritical CO2 Sorption in Poly(Methyl Methacrylate). Polymers 2022, 14, 5332. [Google Scholar] [CrossRef] [PubMed]
  94. Kazarian, S.G.; Vincent, M.F.; Bright, F.V.; Liotta, C.L.; Eckert, C.A. Specific Intermolecular Interaction of Carbon Dioxide with Polymers. J. Am. Chem. Soc. 1996, 118, 1729–1736. [Google Scholar] [CrossRef]
  95. Kazarian, S.G.; Brantley, N.H.; West, B.L.; Vincent, M.F.; Eckert, C.A. In Situ Spectroscopy of Polymers Subjected to Supercritical CO2: Plasticization and Dye Impregnation. Appl. Spectrosc. 1997, 51, 491–494. [Google Scholar] [CrossRef]
  96. Chiou, J.S.; Barlow, J.W.; Paul, D.R. Plasticization of Glassy Polymers by CO2. J. Appl. Polym. Sci. 1985, 30, 2633–2642. [Google Scholar] [CrossRef]
  97. Goel, S.K.; Beckman, E.J. Plasticization of Poly(Methyl Methacrylate) (PMMA) Networks by Supercritical Carbon Dioxide. Polymer 1993, 34, 1410–1417. [Google Scholar] [CrossRef]
  98. Handa, Y.P.; Kruus, P.; O’Neill, M. High-Pressure Calorimetric Study of Plasticization of Poly(Methyl Methacrylate) by Methane, Ethylene, and Carbon Dioxide. J. Polym. Sci. Part B Polym. Phys. 1996, 34, 2635–2639. [Google Scholar] [CrossRef]
  99. Alessi, P.; Cortesi, A.; Kikic, I.; Vecchione, F. Plasticization of Polymers with Supercritical Carbon Dioxide: Experimental Determination of Glass-Transition Temperatures. J. Appl. Polym. Sci. 2003, 88, 2189–2193. [Google Scholar] [CrossRef]
  100. Watanabe, M.; Hashimoto, Y.; Kimura, T.; Kishida, A. Characterization of Engineering Plastics Plasticized Using Supercritical CO2. Polymers 2020, 12, 134. [Google Scholar] [CrossRef] [PubMed] [Green Version]
  101. Tsivintzelis, I.; Angelopoulou, A.G.; Panayiotou, C. Foaming of Polymers with Supercritical CO2: An Experimental and Theoretical Study. Polymer 2007, 48, 5928–5939. [Google Scholar] [CrossRef]
  102. Zhou, C.; Wang, P.; Li, W. Fabrication of Functionally Graded Porous Polymer via Supercritical CO2 Foaming. Compos. Part B Eng. 2011, 42, 318–325. [Google Scholar] [CrossRef]
  103. Tsivintzelis, I.; Sanxaridou, G.; Pavlidou, E.; Panayiotou, C. Foaming of Polymers with Supercritical Fluids: A Thermodynamic Investigation. J. Supercrit. Fluids 2016, 110, 240–250. [Google Scholar] [CrossRef]
  104. Goel, S.K.; Beckman, E.J. Generation of Microcellular Polymeric Foams Using Supercritical Carbon Dioxide. I: Effect of Pressure and Temperature on Nucleation. Polym. Eng. Sci. 1994, 34, 1137–1147. [Google Scholar] [CrossRef]
  105. Feng, J.J.; Bertelo, C.A. Prediction of Bubble Growth and Size Distribution in Polymer Foaming Based on a New Heterogeneous Nucleation Model. J. Rheol. 2004, 48, 439–462. [Google Scholar] [CrossRef] [Green Version]
  106. Chen, X.; Feng, J.J.; Bertelo, C.A. Plasticization Effects on Bubble Growth during Polymer Foaming. Polym. Eng. Sci. 2006, 46, 97–107. [Google Scholar] [CrossRef]
  107. Taki, K. Experimental and Numerical Studies on the Effects of Pressure Release Rate on Number Density of Bubbles and Bubble Growth in a Polymeric Foaming Process. Chem. Eng. Sci. 2008, 63, 3643–3653. [Google Scholar] [CrossRef]
  108. Al-Enezi, S. CO2 Induced Foaming Behavior of Polystyrene near the Glass Transition. Int. J. Polym. Sci. 2017, 2017, 7804743. [Google Scholar] [CrossRef] [Green Version]
  109. Tomasko, D.L.; Li, H.; Liu, D.; Han, X.; Wingert, M.J.; Lee, L.J.; Koelling, K.W. A Review of CO2 Applications in the Processing of Polymers. Ind. Eng. Chem. Res. 2003, 42, 6431–6456. [Google Scholar] [CrossRef]
  110. Kiran, E. Supercritical Fluids and Polymers—The Year in Review—2014. J. Supercrit. Fluids 2016, 110, 126–153. [Google Scholar] [CrossRef]
  111. Morrissey, P.; Vesely, D. Accurate Measurement of Diffusion Rates of Small Molecules through Polymers. Polymer 2000, 41, 1865–1872. [Google Scholar] [CrossRef]
  112. Royer, J.R.; DeSimone, J.M.; Khan, S.A. Carbon Dioxide-Induced Swelling of Poly(Dimethylsiloxane). Macromolecules 1999, 32, 8965–8973. [Google Scholar] [CrossRef]
  113. Nikitin, L.N.; Gallyamov, M.O.; Vinokur, R.A.; Nikolaec, A.Y.; Said-Galiyev, E.E.; Khokhlov, A.R.; Jespersen, H.T.; Schaumburg, K. Swelling and Impregnation of Polystyrene Using Supercritical Carbon Dioxide. J. Supercrit. Fluids 2003, 26, 263–273. [Google Scholar] [CrossRef]
  114. Rodríguez, D.C.; Carrascal, D.; Solórzano, E.; Pérez, M.A.R.; Pinto, J. Analysis of the Retrograde Behavior in PMMA-CO2 Systems by Measuring the (Effective) Glass Transition Temperature Using Refractive Index Variations. J. Supercrit. Fluids 2021, 170, 105159. [Google Scholar] [CrossRef]
  115. Laganà, A.; van Oosten, T. Back to Transparency, Back to Life. Research into the Restoration of Broken Transparent Unsaturated Polyester and Poly(Methyl Methacrylate) Works of Art. In Proceedings of the ICOM-CC 16th Triennial Conference Preprints, Lisbon, Portugal, 19–23 September 2011; pp. 1–9. [Google Scholar]
  116. Laganà, A.; David, M.; Doutre, M.; de Groot, S.; van Keulen, H.; Madden, O.; Schilling, M.; van Bommel, M. Reproducing Reality. Recreating Bonding Defects Observed in Transparent Poly(Methyl Methacrylate) Museum Objects and Assessing Defect Formation. J. Cult. Herit. 2021, 48, 254–268. [Google Scholar] [CrossRef]
  117. Wissinger, R.G.; Paulaitis, M.E. Glass Transitions in Polymer / CO2 Mixtures at Elevated Pressures. J. Polym. Sci. Part B Polym. Phys. 1991, 29, 631–633. [Google Scholar] [CrossRef]
  118. Condo, P.D.; Johnston, K.P. Retrograde Vitrification of Polymers with Compressed Fluid Diluents: Experimental Confirmation. Macromolecules 1992, 25, 6730–6732. [Google Scholar] [CrossRef]
  119. Zhang, Z.; Handa, Y.P. CO2-Assisted Melting of Semicrystalline Polymers. Macromolecules 1997, 30, 8505–8507. [Google Scholar] [CrossRef] [Green Version]
  120. Jung, M.R.; Horgen, F.D.; Orski, S.V.; Rodriguez, C.V.; Beers, K.L.; Balazs, G.H.; Jones, T.T.; Work, T.M.; Brignac, K.C.; Royer, S.-J.; et al. Validation of ATR FT-IR to Identify Polymers of Plastic Marine Debris, Including Those Ingested by Marine Organisms. Mar. Pollut. Bull. 2018, 127, 704–716. [Google Scholar] [CrossRef]
  121. Yuan, Y.; Teja, A.S. Quantification of Specific Interactions between CO2 and the Carbonyl Group in Polymers via ATR-FTIR Measurements. J. Supercrit. Fluids 2011, 56, 208–212. [Google Scholar] [CrossRef]
  122. Lipschitz, I. The Vibrational Spectrum of Poly(Methyl Methacrylate): A Review. Polym. Plast. Technol. Eng. 1982, 19, 53–106. [Google Scholar] [CrossRef]
  123. Matsushita, A.; Ren, Y.; Matsukawa, K.; Inoue, H.; Minami, Y.; Noda, I.; Ozaki, Y. Two-Dimensional Fourier-Transform Raman and near-Infrared Correlation Spectroscopy Studies of Poly(Methyl Methacrylate) Blends: 1. Immiscible Blends of Poly(Methyl Methacrylate) and Atactic Polystyrene. Vib. Spectrosc. 2000, 24, 171–180. [Google Scholar] [CrossRef]
  124. Takahashi, M.; Yamamoto, Y.; Nawaby, A.V.; Handa, Y.P. Raman Spectroscopic Investigation of the Phase Behavior and Phase Transitions in a Poly(Methyl Methacrylate)-Carbon Dioxide System. J. Polym. Sci. Part B Polym. Phys. 2003, 41, 2214–2217. [Google Scholar] [CrossRef]
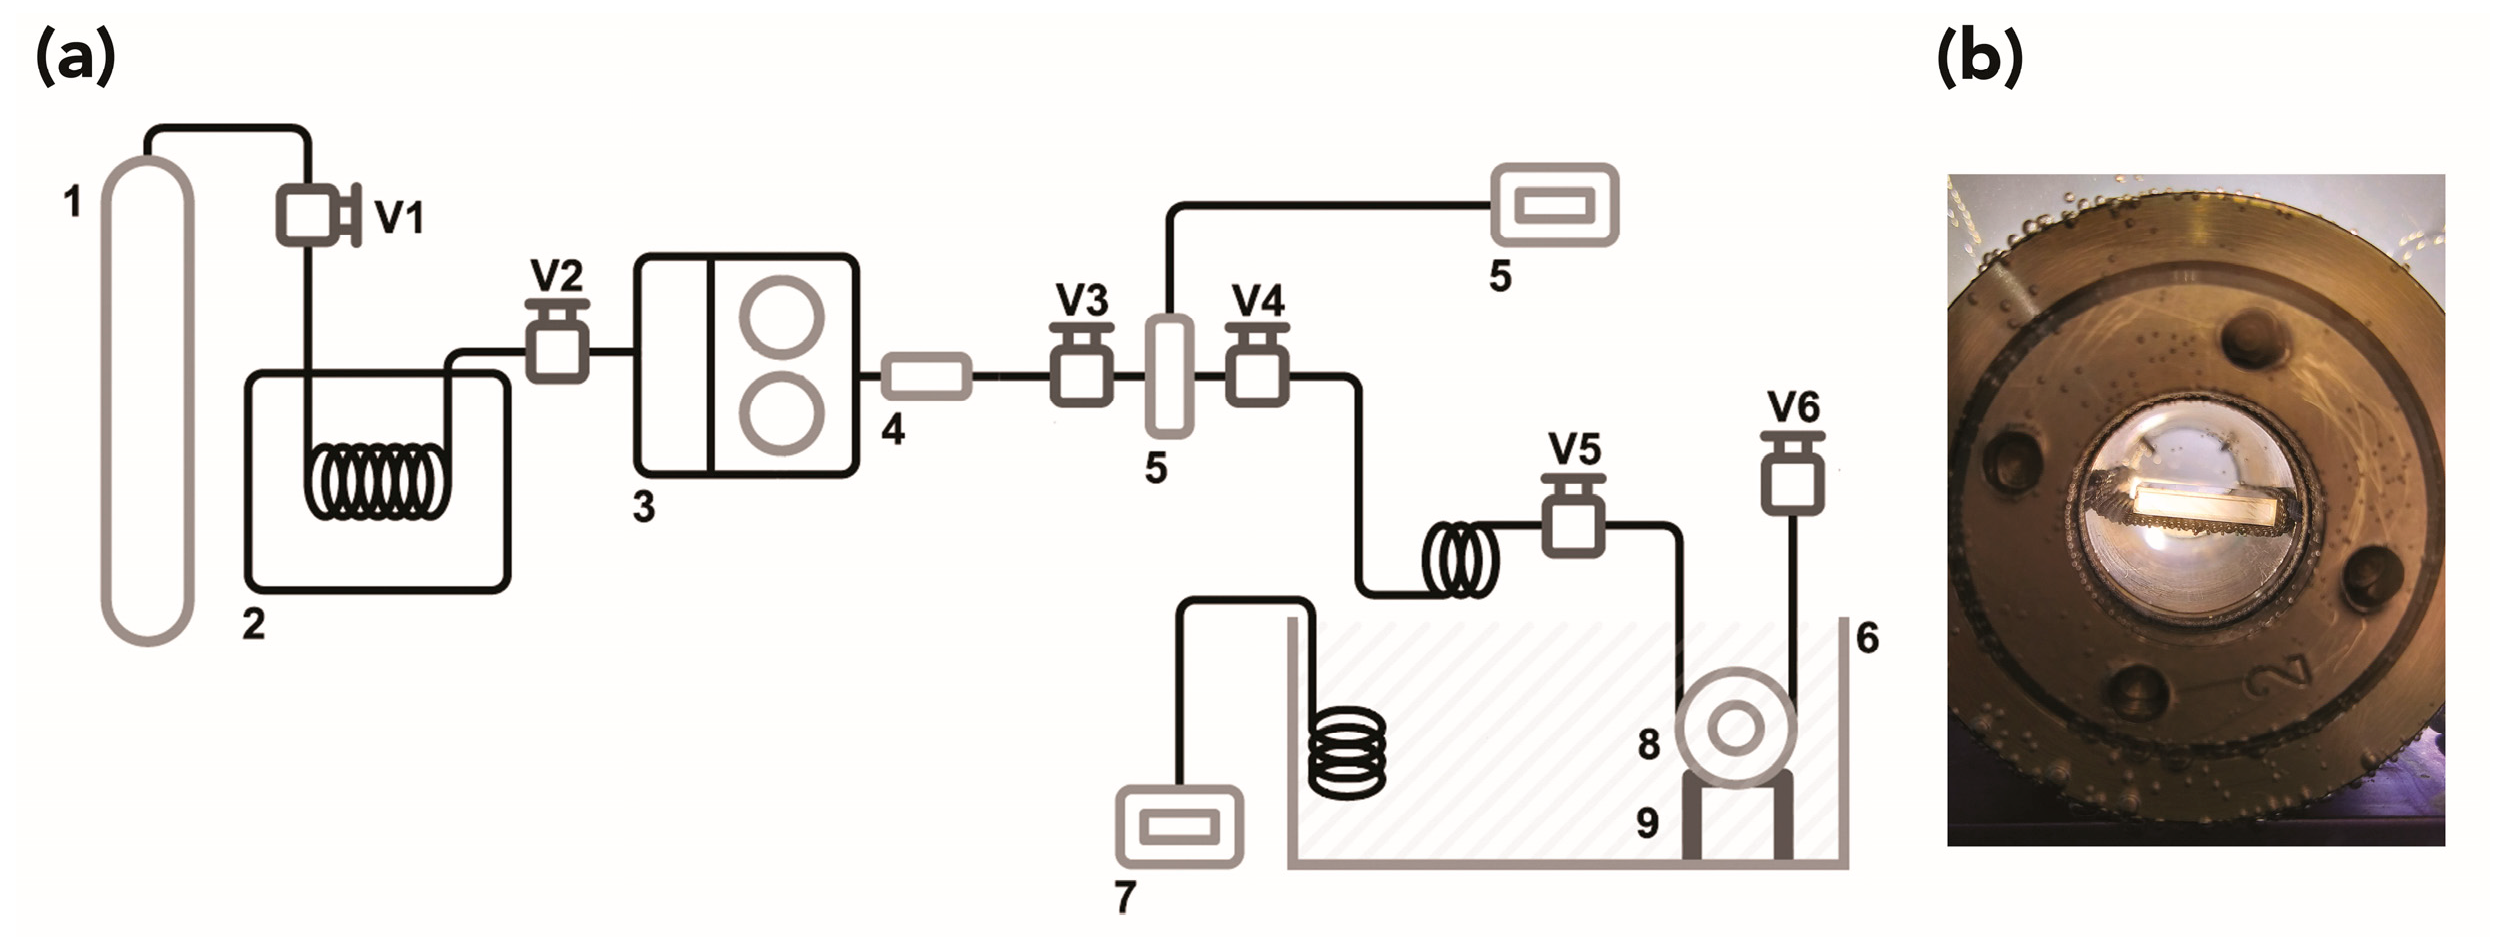
Figure 1. (a) Schematic diagram showing the apparatus used for trials: (1) CO2 cylinder, (2) refrigeration unit, (3) high-pressure pump, (4) check valve, (5) pressure transducer, (6) thermostatic bath, (7) temperature controller, (8) high-pressure cell with sapphire windows, (9) cell support, (V1) to (V6) high-pressure valves. (b) Poly(methyl methacrylate) (PMMA) samples on a stainless-steel grid support inserted in the stainless-steel cell.
Polymers 15 00566 g001
Figure 2. Representative digital photographs for PMMA samples (a) before and (b) after exposure to liquid CO2 at 25 °C and 7 MPa (Test 5) and (c) before and (d) after exposure to CO2 at 55 °C and 28 MPa (Test 4), showing the presence of extensive bubbles trapped in the sample’s bulk.
Polymers 15 00566 g002
Figure 3. Average and standard deviation values for changes in (a) weight and (b) volume for PMMA samples treated with CO2 at different conditions (supercritical: purple bars; liquid: blue bars; vapor: orange bars), measured approximately 2 h after tests.
Polymers 15 00566 g003
Figure 4. Representative microphotographs acquired in reflected light in brightfield showing (a) the presence of abrasion and (b) cracks, (c) free and impinged bubbles in the sample’s bulk, and (d) indentation mark left by the tip of the pressure clamp used to ensure contact between the exposed test sample and the crystal during ATR-FTIR spectroscopy. Magnification ×50.
Polymers 15 00566 g004
Figure 5. Representative microphotographs in brightfield (left and middle columns) and cross-polarized light (right column) showing the optical boundary and the isochromatic fringes for (a) control untreated sample, (b) sample exposed to vapor CO2 at 25 °C and 6 MPa, (c) sample exposed to liquid CO2 at 25 °C and 10 MPa, (d) sample exposed to supercritical CO2 at 35 °C and 10 MPa. Note: images in the left column were focused on the surface, while images in the middle column were focused inside the sample to better visualize the optical boundary, and hence, the surface appears slightly unfocused. Magnification ×50.
Polymers 15 00566 g005
Figure 6. Vickers hardness values (average and standard deviations) for a control, unexposed sample (gray bar labeled C) and CO2-exposed samples (colored bars T1–T10) at different conditions (supercritical: purple bars; liquid: blue bars; vapor: orange bars), measured approximately 4 h after tests. Statistical significance for ANOVA and Tukey–Kramer multiple comparison tests was established at a p-value < 0.05; mean values that do not share a superscribed letter are significantly different.
Polymers 15 00566 g006
Figure 7. (a) ATR-FTIR spectra overlaid, (b) detail of the spectra in the region 760–640 cm−1, (c) Raman extended spectra, and (d) detail of the Raman spectra in the region 1250–1400 cm−1, for control (untreated PMMA sample) and samples subjected to CO2 at different conditions. The colored rectangles in the spectra highlight the CO2 absorption bands at approximately 2338 cm−1 (highlighted in green, panel a) and at 662 and 654 cm−1 (highlighted in violet, panel a), while the orange and blue rectangles in the Raman spectra (panel c) highlight the peaks at 1391 and 1286 cm−1, respectively. All peaks are attributed to the CO2 in the gas phase and dissolved in PMMA.
Polymers 15 00566 g007
Figure 8. Summary of changes over time (up to 35 weeks, i.e., ~6000 h) in (a) weight, (b) volume, and (c) mean Vickers hardness values for PMMA samples exposed to CO2 under different conditions. (d) Vickers hardness values (average and standard deviation) after 35 weeks for a control, an untreated sample (gray bar labeled C), and CO2-exposed samples (colored bars T1–T10) at different conditions (supercritical: purple bars; liquid: blue bars; vapor: orange bars). Statistical significance for ANOVA and Tukey–Kramer multiple comparison tests was established at a p-value < 0.05. Mean values that do not share a letter are significantly different and vice versa.
Polymers 15 00566 g008
Figure 9. ATR-FTIR and Raman spectra for a sample exposed to scCO2 at 35 °C and 10 MPa (α) before the test (β), 2 h after the test (γ), 5 days after the test (δ), 1 week after the test (ε), and 35 weeks after the test. The colored rectangles in the infrared graph highlight the CO2 absorption bands at approximately 2338 cm−1 (highlighted in green) and at 662 and 654 cm−1 (highlighted in violet), while the orange and blue rectangles in the Raman spectra highlight the peaks at 1391 and 1286 cm−1, respectively. All peaks are attributed to the CO2 in the gas phase and dissolved in PMMA. CO2 peaks disappeared 5 days after exposure.
Polymers 15 00566 g009
Figure 10. Representative microphotographs for: (a) control untreated sample, in reflected light in brightfield; (b) sample exposed to vapor CO2 at 25 °C and 6 MPa, in transmitted cross-polarized light; (c) sample exposed to liquid CO2 at 25 °C and 10 MPa, in reflected light in brightfield; (d) sample exposed to supercritical CO2 at 35 °C and 10 MPa, transmitted cross-polarized light. Magnification ×50.
Polymers 15 00566 g010
Table 1. Summary of experimental conditions used for CO2 trials on poly(methyl methacrylate) (PMMA).
Test
No.
Temperature (°C)Pressure (MPa)CO2 Density
(g/mL)
CO2 PhaseFlux
(mL/min)
Compression Time (min)Exposure Time (min)Depressurization Time (min)
135100.71281Supercritical10~156020
235280.91864Supercritical10~156020
355100.32507Supercritical10~156020
455280.8357Supercritical10~156020
52570.74303Liquid10~156020
625100.81763Liquid10~156020
7356.70.19798Vapor10~156020
82560.19061Vapor10~156020
935100.71281Supercritical10~153020
1025100.81763Liquid10~153020
Disclaimer/Publisher’s Note: The statements, opinions and data contained in all publications are solely those of the individual author(s) and contributor(s) and not of MDPI and/or the editor(s). MDPI and/or the editor(s) disclaim responsibility for any injury to people or property resulting from any ideas, methods, instructions or products referred to in the content.