Article

Sunflower and Watermelon Seeds and Their Hybrids with Pineapple Leaf Fibers as New Novel Thermal Insulation and Sound-Absorbing Materials

Mechanical Engineering Department, College of Engineering, King Saud University, P.O. Box 800, Riyadh 11421, Saudi Arabia
*
Author to whom correspondence should be addressed.
Undergraduate senior student.
Polymers 2023, 15(22), 4422; https://doi.org/10.3390/polym15224422
Submission received: 13 October 2023 / Revised: 10 November 2023 / Accepted: 14 November 2023 / Published: 16 November 2023
(This article belongs to the Special Issue Modification of Natural Polymers)

Abstract

:
Pineapple leaf fiber (PALF), striped sunflower seed fiber (SFSF), and watermelon seed (WMS) are considered natural waste polymer materials, which are biodegradable and sustainable. This study presents new novel thermal insulation and sound absorption materials using such waste as raw materials. PALF, SFSF, and WMS were used as loose, bound, and hybrid samples with different compositions to develop promising thermal insulation and sound-absorbing materials. Eleven sample boards were prepared: three were loose, three were bound, and five were hybrid between PALF with either SFSF or WMS. Wood adhesive was used as a binder for both the bound and hybrid sample boards. Laboratory scale sample boards of size 30 cm × 30 cm with variable thicknesses were prepared. The results show that the average thermal conductivity coefficient for the loose samples at the temperature range 20–80 °C is 0.04694 W/(m.K), 0.05611 W/(m.K), and 0.05976 W/m.K for PALF, SFSF, and WMS, respectively. Those for bound sample boards are 0.06344 W/(m.K), 0.07113 W/(m.K), and 0.08344 W/m.K for PALF, SFSF, and WMS, respectively. The hybrid ones between PALF and SFSF have 0.05921 W/m.K and 0.06845 W/(m.K) for two different compositions. The other hybrid between PALF and WMS has 0.06577 W/(m.K) and 0.07007 for two different compassions. The sound absorption coefficient for most of the bound and hybrid boards is above 0.5 and reaches higher values at some different frequencies. The thermogravimetric analysis for both SFSF and WMS shows that they are thermally stable up to 261 °C and 270 °C, respectively. The three-point bending moment test was also performed to test the mechanical properties of the bound and hybrid sample boards. It should be mentioned that using such waste materials as new sources of thermal insulation and sound absorption materials in buildings and other applications would lead the world to utilize the waste until zero agrowaste is reached, which will lower the environmental impact.

1. Introduction

Energy efficiency and sustainability have been a priority for almost all engineering applications for decades. Almost all fields of engineering are witnessing plans to cut down on energy consumption and increase sustainability. The European Union plans to reduce emission levels from the aviation and power industries by 21% compared to the 2005 emission levels, while for residential, transportation, and agriculture waste, this will be by about 20% compared to the 2005 emission levels [1]. Within the complex interaction between engineering developments and regulatory frameworks, the construction sector has seen a major increase in the adoption of environmentally sustainable materials [2,3,4]. In 2022, for similar reasons, the Kingdom of Saudi Arabia initiated a massive ecological campaign to plant 10 billion trees in the years to come. A growing number of countries are enacting environmental protection legislation, and this initiative is evidence of that trend [5]. Given the scale of this endeavor, effective waste management becomes imperative, not merely as a disposal concern but also as an avenue for resource optimization. One promising avenue for this waste is its integration into ecofriendly engineering solutions, particularly as a constituent material in sustainable construction practices. For example, solid waste, which is the byproduct of the pineapple processing industries, was estimated to be about 40–50% from fresh fruit as pineapple peelings, crowns, and cores [6]. Tangjuank [7] has reported the use of pineapple leaves as a good thermal insulation material. He developed insulation boards using natural rubber latex as a binder with different percentages. His results show a thermal conductivity coefficient range of 0.035 W/m.K to 0.043 W/m.K, which depends on the density of the board. Kumfu and Jintakosol [8] have produced thermal insulation boards using pineapple leaves with natural rubber latex as a binder at different percentages. Their developed boards had a thermal conductivity coefficient of 0.057 W/m.K at a density of 338 kg/m3 using a hot-pressing technique. Thilagavathi et al. [9] developed nonwovens from pure pineapple fibers and by blending polyester with pineapple fibers using the needle-punching technique. Their result showed that the nonwovens made by blending PALF with low-melt polyester had better sound and thermal insulation characteristics compared to pure PALF fibers. Do et al. [10] have produced flexible aerogel composites made from pineapple leaf and cotton waste fibers as thermal insulation materials. The thermal conductivity coefficient of their aerogel composites was in the range of 0.039–0.043 W/(m.K).
Striped sunflower seeds are primarily eaten as a snack food; as a result, they may be called confectionery sunflower seeds. When the sunflower seeds are dehulled, they produce a large number of wasted shells (hulls or husks). In 2018, the global production of sunflower seeds was 52 million tons, led by Ukraine with 27% and Russia with 25% of the world total. Argentina, Romania, and China also contributed significant volumes [11]. Sunflower stems, plaster, water, and sodium benzoate as a fungal inhibitor have been used to develop renewable composite boards for thermal insulation and sound absorption by Carvalho et al. [12]. Georgiev et al. [13] have shown that wheat straws and the husks of sunflower seeds can be used in a proper percentage to improve the physical and thermal properties of clay porous bricks. Sunflower stalks and cotton textile waste were used with an epoxy binder to form thermal insulation for buildings by Binici et al. [14]. The effect of moisture content on the thermal conductivity coefficient of sunflower seeds was studied by Darvishi and Zarein [15]. Their result showed a direct correlation between increasing the moisture content and decreasing the bulk density on the increased thermal conductivity. They obtained a thermal conductivity coefficient range of 0.1854 to 0.3047 W/(m.K). Binici et al. [16] have reported a compressed thermal insulation construction material made of vermiculite, wheat stalk, sunflower stalk, and gypsum as a binder. Their result showed a thermal conductivity coefficient of 0.063–0.334 W/(m.K) at a density of 0.166–0.302 g/cm3. This large number of wasted hulls will create a large environmental problem; they must be recycled in an economical and safe way.
Another source of waste is the hulls or shells of watermelon seeds. Statistics depict that the volume of watermelon produced in Saudi Arabia is approximately 216,708 tons [17]. Therefore, many seeds with or without kernels will produce an environmental problem and should be eliminated. On the other hand, Odewunmi et al. [18] have used the wasted watermelon seed extract as an effective corrosion inhibitor of mild steel in an HCl solution using electrochemical techniques at 25 °C.
There are studies [19,20,21,22] that have investigated the efficacy of several supplementary natural fibers as insulation materials. Plant materials encompass a diverse range of botanical resources, such as rice, date palm trees, wheat straw, kenaf, sugar cane, flax, and hemp. These plant materials exhibit considerable potential for utilization in numerous applications. Natural fibers are very promising and have great potential as ecofriendly raw materials to be used especially in insulation [23] and sound absorption [24,25]. Ali and Abdulkarem [26] have reported new thermal insulation materials extracted from date palm surface fibers. The thermal conductivity coefficient range of their produced sample boards was between 0.0475 and 0.0697 W/(m.K) using cornstarch resin as a binder. Fouladi et al. [27] have studied the sound absorption coefficients of four different fibers: coir, corn, sugar cane, and dry grass with different panel thicknesses and compared them with common building and acoustic panel materials, discovering that they are outstanding alternatives. Berardi and Iannace [28] have reported sound absorption and noise reduction coefficients for some natural fibers, such as wood, kenaf, hemp, cork, coconut, cane, sheep wool, and cardboard. Their results show that those coefficients depend on the thickness, porosity, and density of the materials, and they have suggested that those materials be used in buildings.
The objective of this study is to evaluate the feasibility of utilizing fibers obtained from pineapple leaves, sunflower seeds, and watermelon seeds as raw natural polymer materials for thermal insulation and sound absorption. To the best of the authors’ knowledge, there is currently a lack of research that specifically investigates the utilization of these particular natural materials for the designated insulation purposes. The utilization of natural wood adhesive in the assembly of these components provides additional support for the adherence of the study to the principles of environmental sustainability. Therefore, this study is a novel addition to the current collection of knowledge on environmentally conscious construction methods and sustainable building principles.

2. Materials and Methods

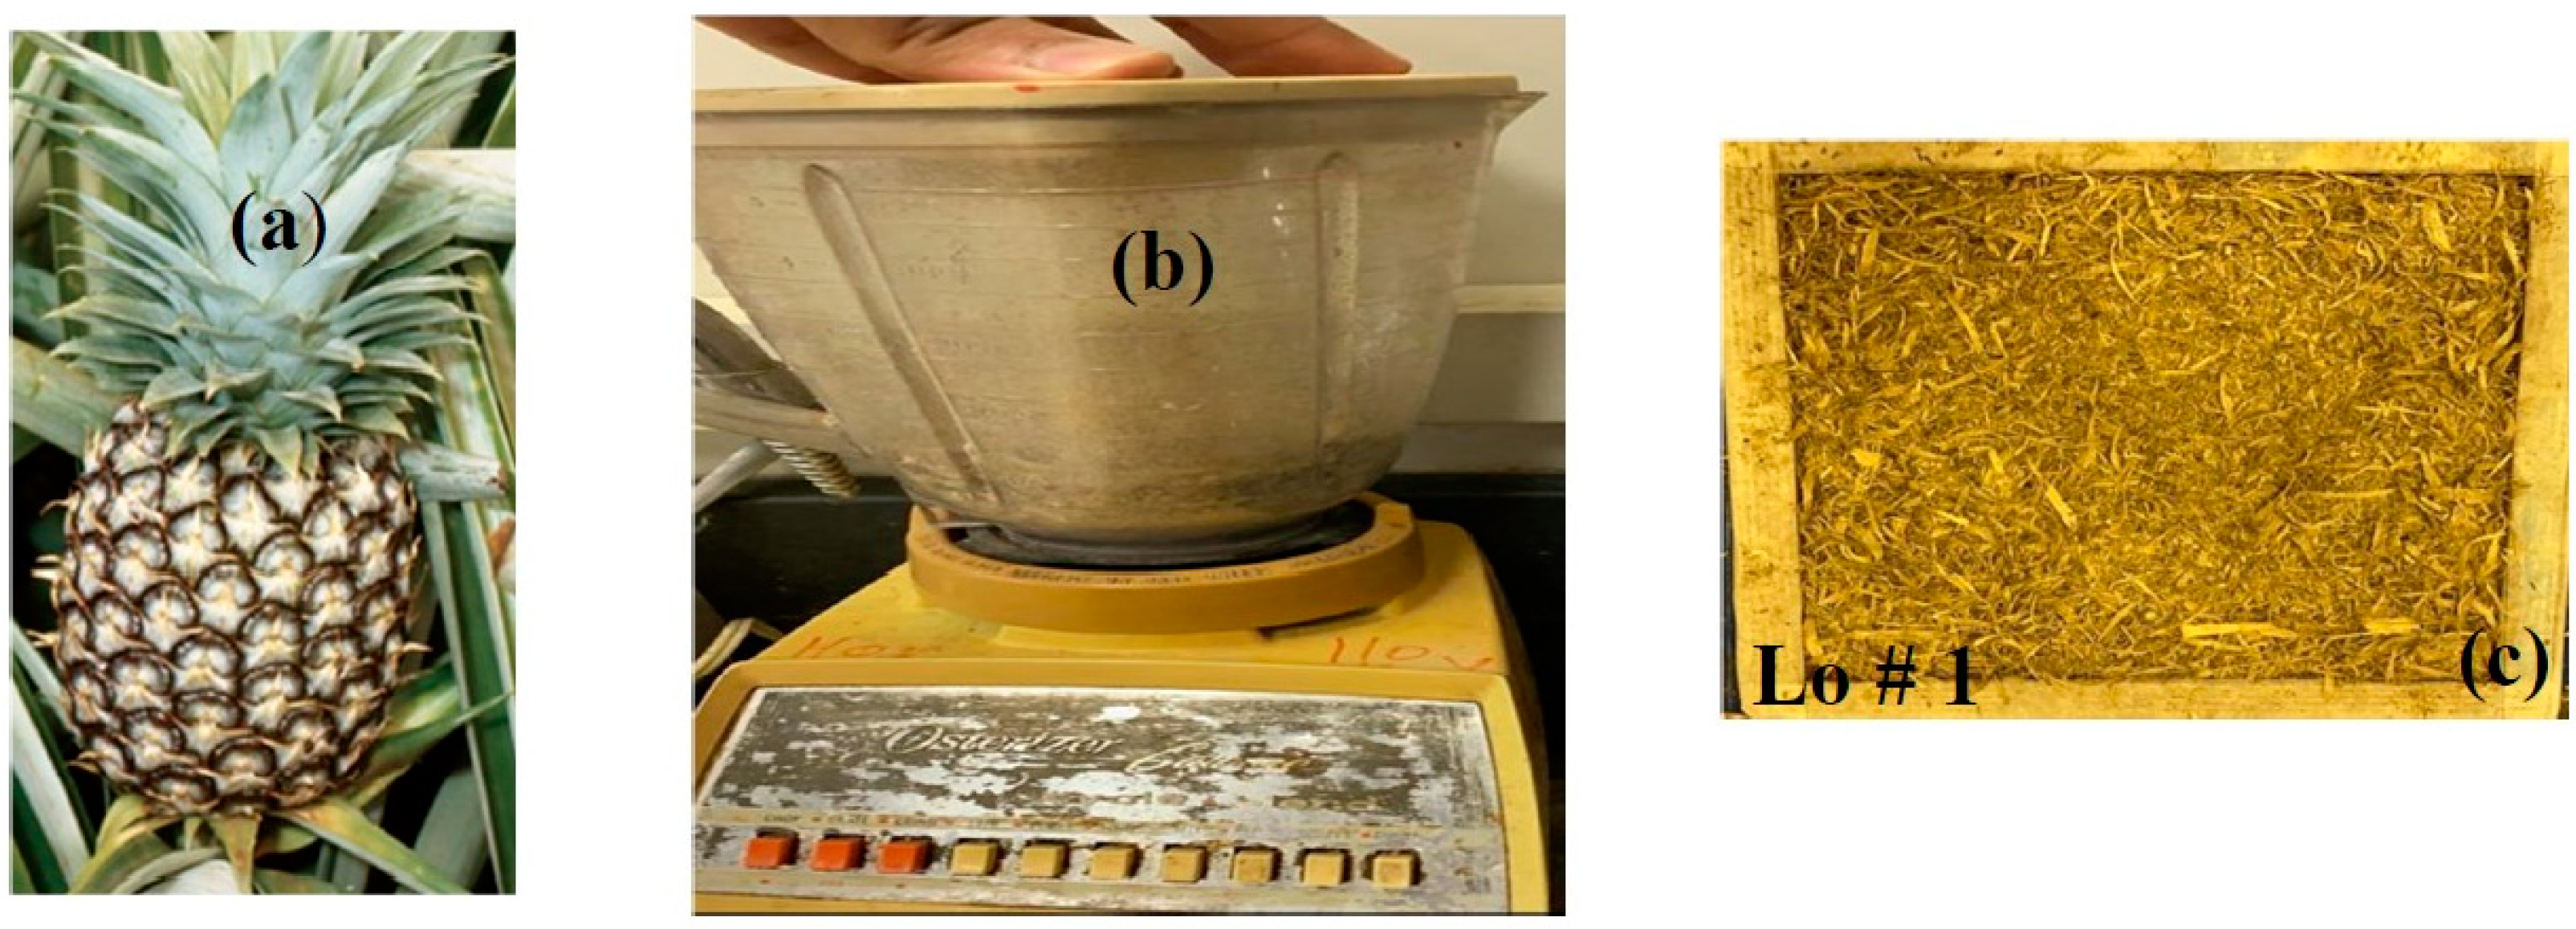
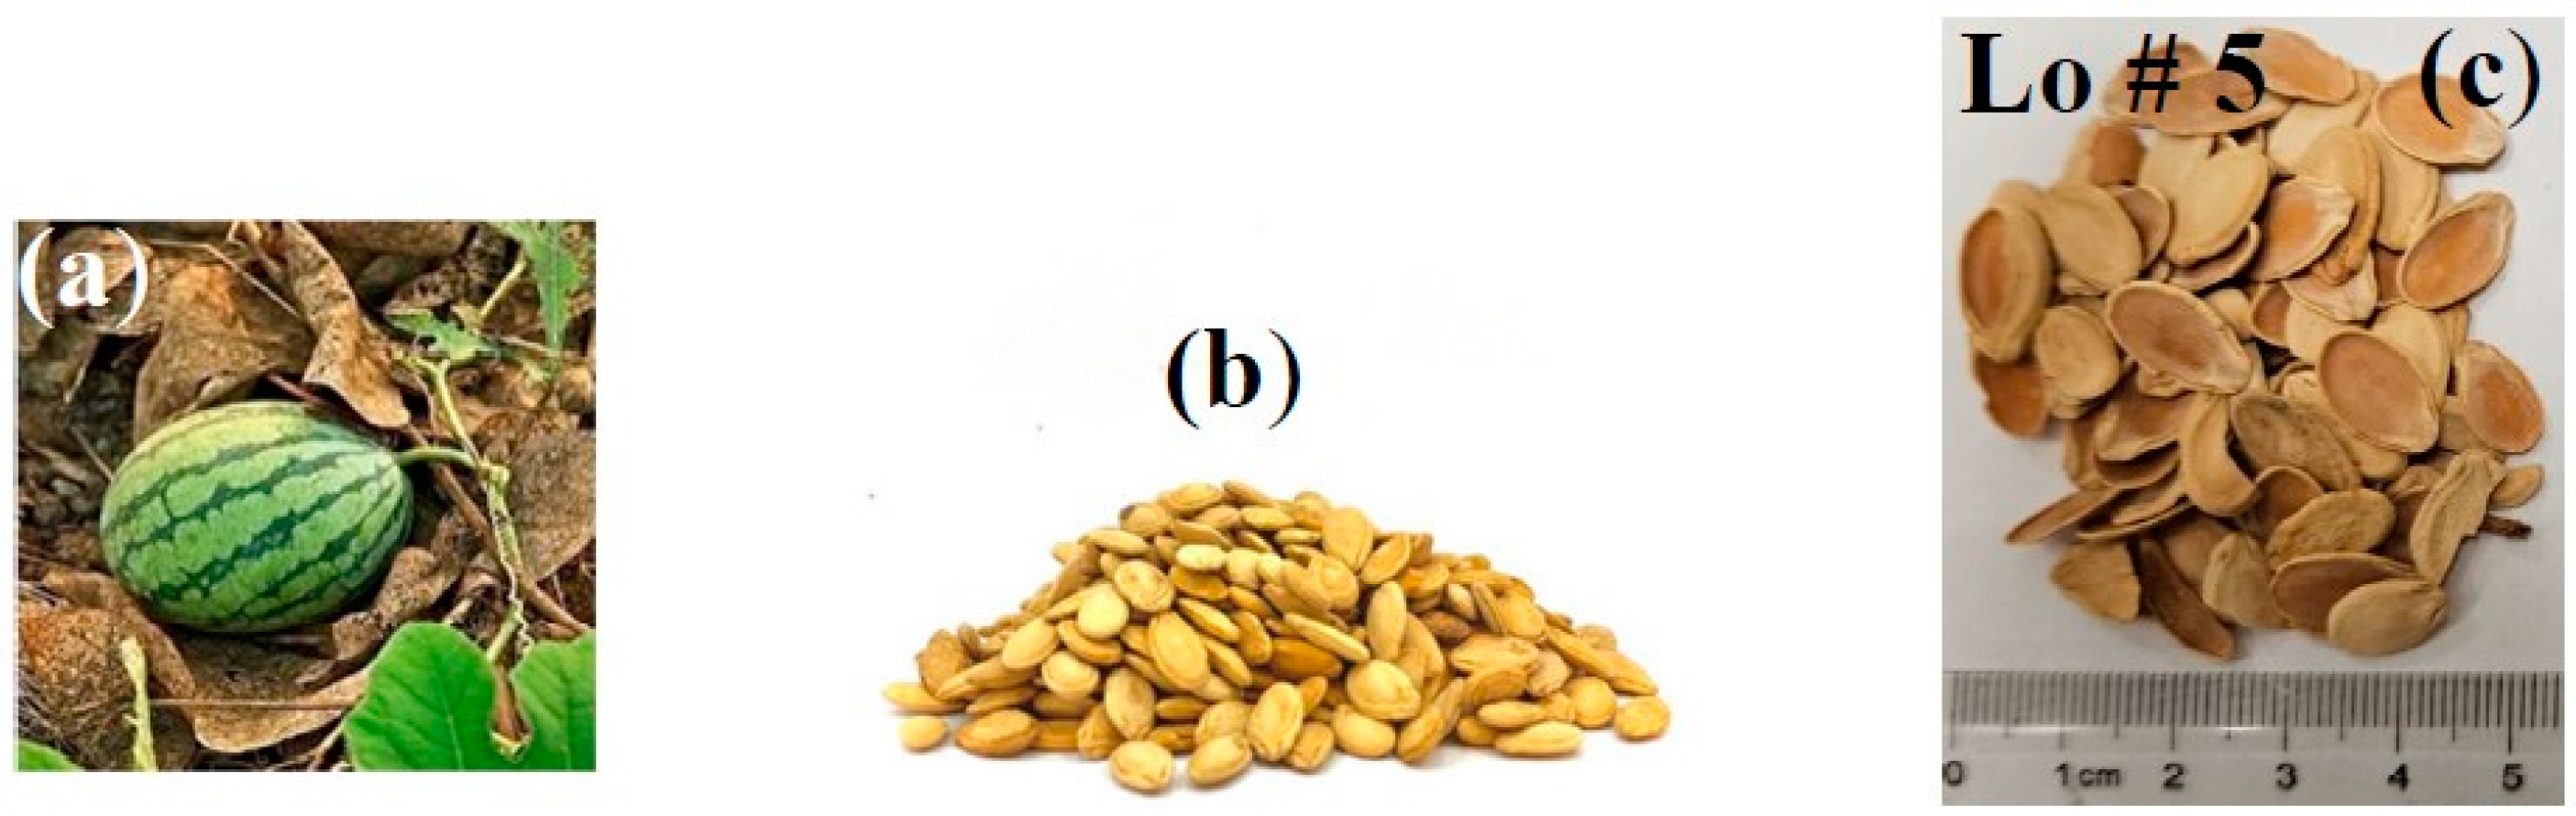
2.1. Obtaining and Preparing the Raw Materials

Three waste materials were used in this study, namely, pineapple leaf fiber (PALF), sunflower seed fiber (SFSF), and watermelon seed (WMS). The pineapple leaves were extracted and collected from the crown leaves of the pineapple fruit, washed to remove any dust or impurities, and dried in the sun at 40 °C for three days and then moved to an electric oven for a few hours at 100 °C until they were completely dried with no condensed water vapor on the glass of the oven. The dried hot samples were left in the laboratory until they absorbed the moisture of the laboratory (RH = 51.7) at room temperature of 21.6 °C. A blinder was used to grind the leaves into fibers as shown in Figure 1. The pineapple leaves were usually collected from the local juice stores as daily waste. The ground leaves had an average approximate length of 1–3 cm as shown in Figure 1c. It should be noted that the ground pieces (Figure 1c) were used as they were without any kind of chemical treatment.
Sunflower seed hulls are an abundant waste produced by the edible oil industry. Therefore, the objective was to use those hulls to produce new insulation materials by testing them as loose or bound hulls. Sunflower seed hulls were collected from some well-known companies in our local area. The collected hulls were washed, dried, and ground similar to the PALF mentioned earlier. Figure 2 shows the sunflower seeds and the ground hulls. Watermelon (Citrullus lanatus) is consumed all over the world and contains a large number of seeds, which are discarded. Properly using those seeds will solve some of the environmental problems. The watermelon seeds were collected as they were, washed, and dried as mentioned earlier. Figure 3 shows the watermelon and the extracted seeds.

2.2. Preparing the Samples for Testing

Different molds were prepared to hold the different samples either as loose materials, bound, or as a hybrid using wood adhesive as a binder (Table 1 shows the characteristics of the adhesive). Figure 1c above shows the wood mold used to hold the loose materials with inside dimensions of 26.5 × 26.5 × 2.0 cm3 to be suitable for thermal conductivity measurements as will be shown later. Different bound or hybrid material samples were prepared, mixed with the wood adhesive solution with specific concentration, put in the mold, and moved to the presser and then to the oven for drying followed by the heat flow meter for thermal conductivity measurements. The mold dimensions are 30 × 30 × H cm3, where H presents the variable height (thickness) up to 10 cm. Figure 4 shows the preparation steps used in producing the bound or hybrid samples on the laboratory scale.
Table 2 shows the specifications, dimensions, density, binder ratio, and others for the produced samples, and Figure 5 shows the laboratory-prepared bound and hybrid samples of size 30 × 30 cm2 with different thicknesses as listed in Table 2.

3. Laboratory Tests

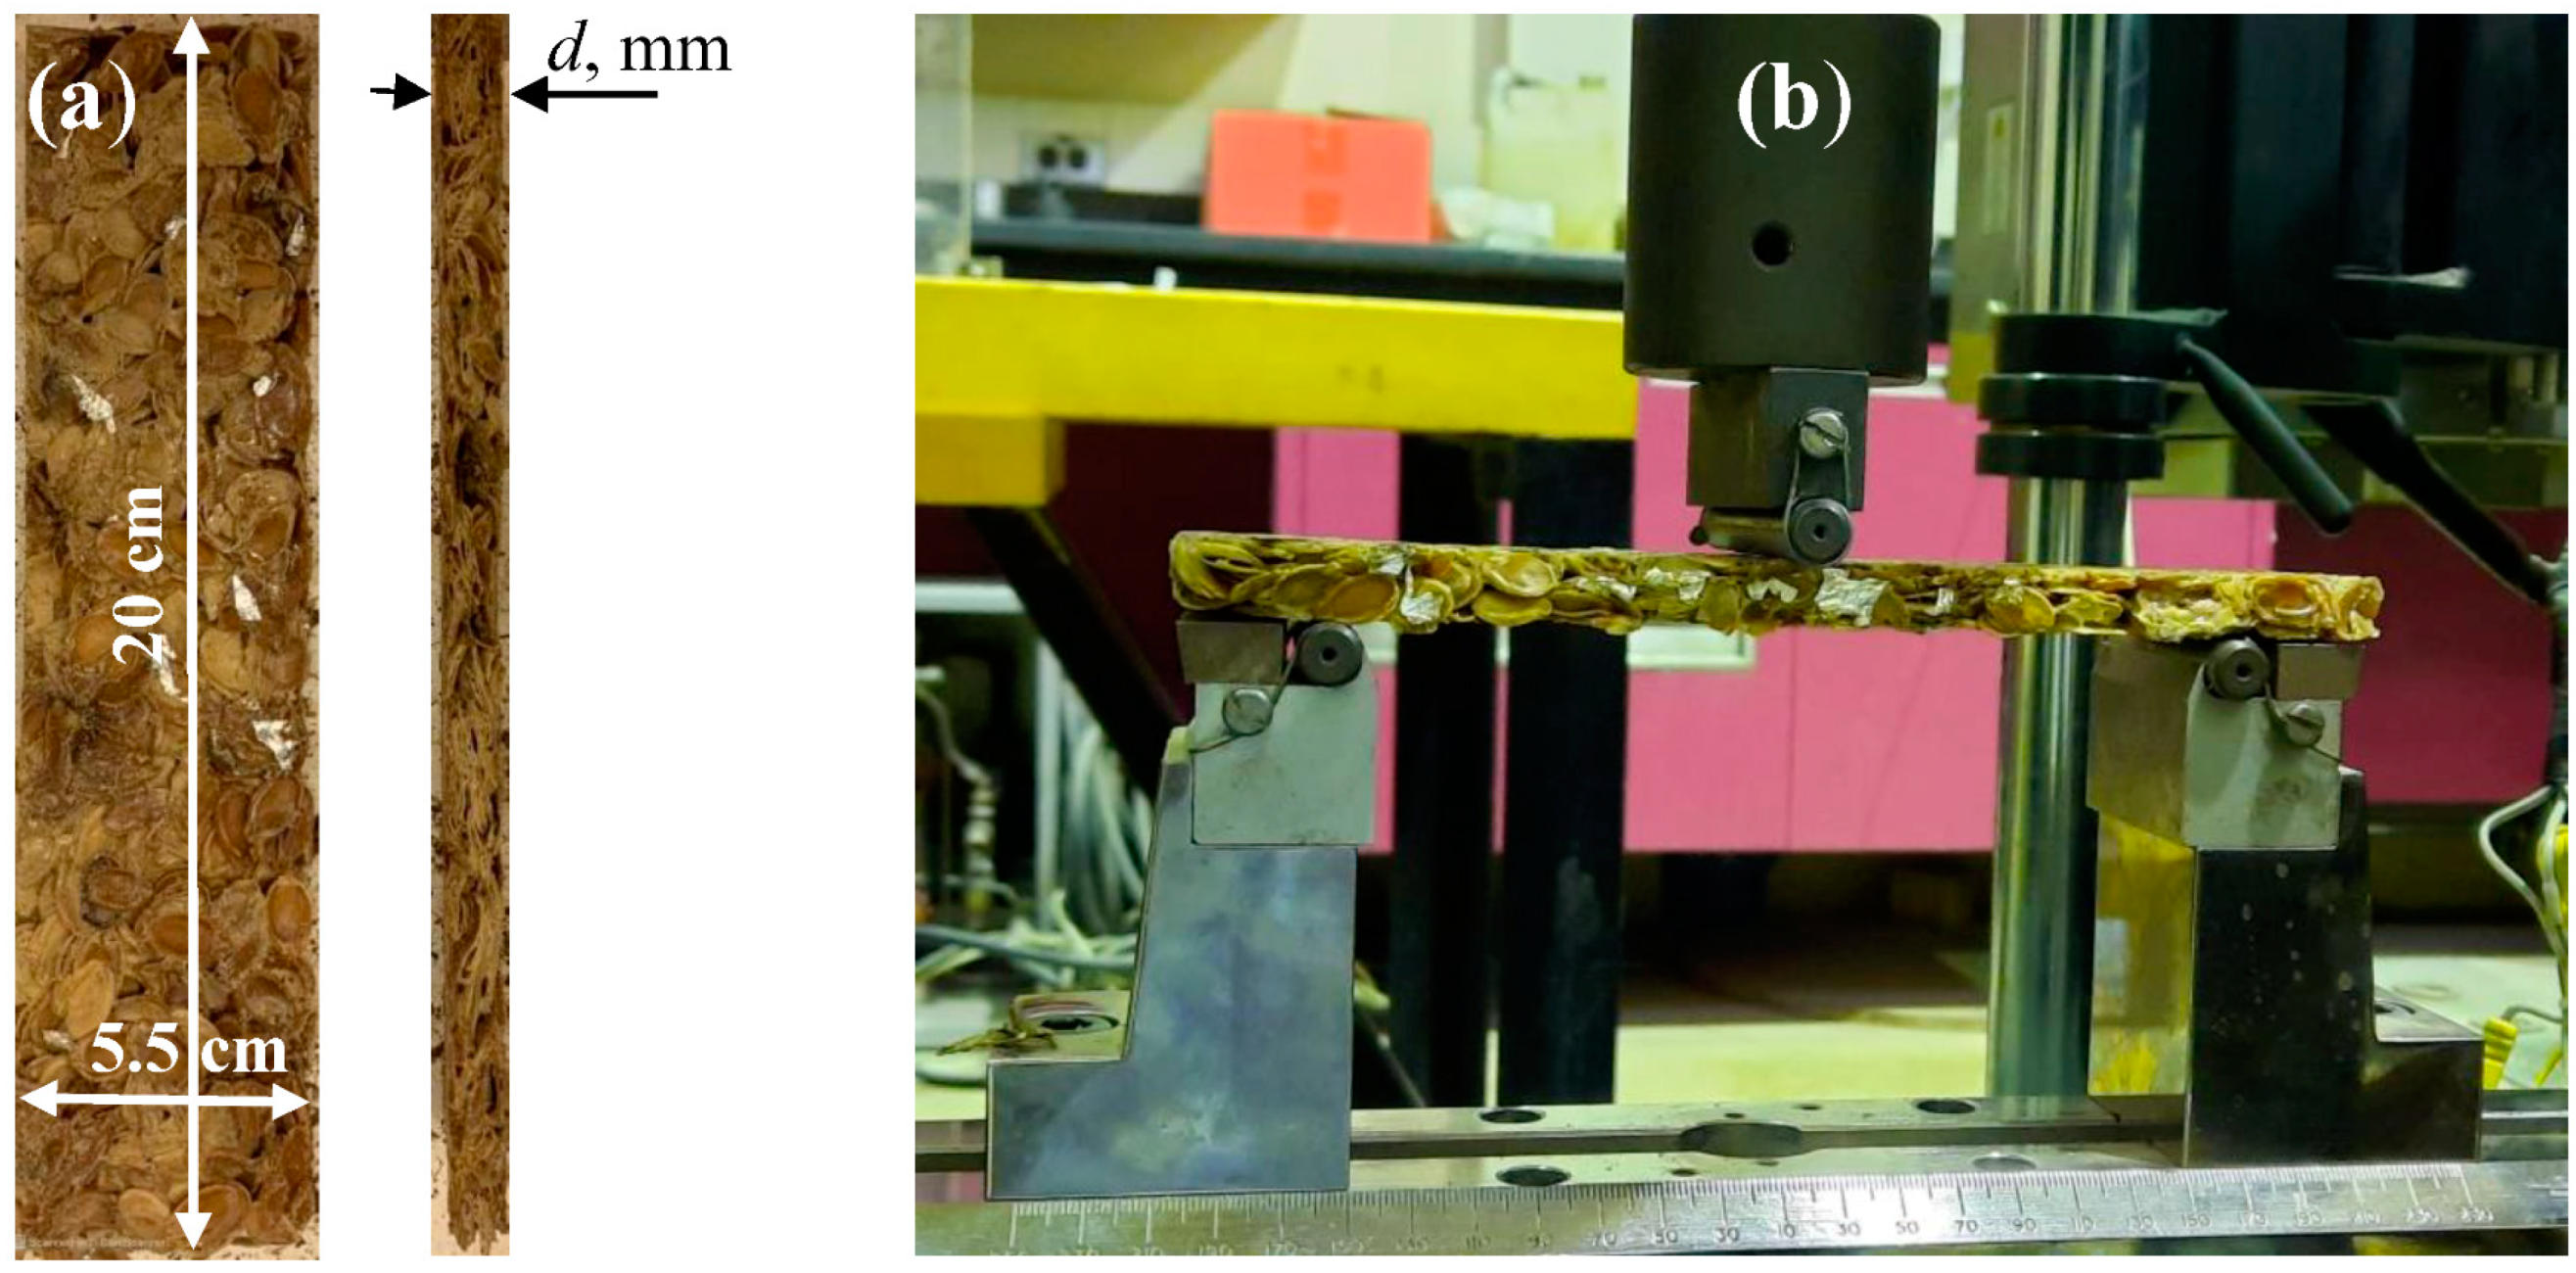
3.1. Three-Point Bending Moment Test

The three-point bending moment test was obtained for all bound and hybrid composite samples listed in Table 2. The test was performed on the cut specimens shown in Figure 6a. The dimensions of the specimens are 20 cm × 5.5 cm × d, where d is a variable thickness corresponding to each specimen as shown in Table 2. The important bending parameters, such as bending force F (N), deflection D (mm), flexural stress σf, and flexural strain ϵ f, were obtained for each specimen using the universal testing machine (UTM, INSTRON 5984) (Figure 6b) of crosshead speed of 2 mm/min. The definition of σf, εf, and flexural elastic modulus Ef is defined by
σ f = 3 F L 2 b d 2 ,   ϵ f = 6 D d L 2 ,   E f = L 3 S 4 b d 3
All other parameters are defined in Table 3. This test followed the standard ASTM D790-03 [33].

3.2. Thermal Stability Test

Thermal stability test analyses were characterized for both the raw materials of sunflower (SF) and watermelon (WM) seeds using the thermogravimetric analysis (TGA), differential (DTGA), and differential scanning calorimetry (DSC). TA instruments (New Castle, DE, USA), SDT Q600 V20.9 Build 20 setup, which was fitted with a Nitrogen purge gas, was used to conduct the thermogravimetric analysis test. Initially, 7.27 mg and 6.57 mg were used for SFS and WMS, respectively. Each amount was put in an alumina pan and heated up to 550 °C. The initial temperature, heating rate, and mass flow rate of the Nitrogen gas are 25 °C, 10 °C/min, and 100 mL/min, respectively. The TGA and the DSC test analyses followed ASTM E1131-08 [34] and ASTM D3418 [35] standards, respectively.

3.3. Thermal Conductivity Test

Thermal conductivity coefficients were determined at a temperature range of about 20 °C to 80 °C for all samples shown in Table 2 and Figure 5. Lambda heat flow meter (HFM, 436), bench type (Figure 4e), was used for thermal conductivity coefficient determination. The method of measurement followed the guarded hot plate standard method ASTM-C518 [36]. The HFM can enclose any sample of specific size 30 cm × 30 cm × H, where the thickness H can vary up to 10 cm. The created heat flow between the hot and cold plates was at a 20 °C mean temperature difference. The HFM has a self-automated sensor to measure the sample’s thickness in cm. The accuracy of measuring the temperature and the thermal conductivity coefficient is ±0.01 °C and ±1% to 3% W/mK, respectively, as provided by the manufacturer.

3.4. Sound Absorption Test

BSWA Technology Ltd.’s (Beijing, China) impedance tube with different diameters was used to determine the sound absorption coefficients (SACs) at different frequencies. Specimen sizes of 3 and 10 cm in diameter were prepared from the bound (Bo) and hybrid (Hy) samples for SAC measurement as shown in Figure 7. Complete details and descriptions of the BSWA tubes, microphones, and principles of operation can be obtained from our previous publication, Ali et al. [37]. The impedance tube test procedure followed ISO 10534-1 [38] and ISO 10534-2 [39] standards.

3.5. Moisture Content Test

Small amounts (a few grams, Figure 8) of the loose, bound, and hybrid samples were dried in the convection oven (Figure 4c) for 24 h; then their masses were recorded as the dried masses and named m2. After that, their masses were triggered every 5 min (m1) in the laboratory environment with a temperature and relative humidity of 21.6 °C and 51.7%, respectively, until they reached a steady state of constant values. The percentage amount of absorbed moisture was calculated using Equation (2), which followed the ASTM D2974-07A [40] standard.
%   of   moisture   content = m 1 m 2 m 2 × 100

4. Results and Discussion

The results are presented for all tests conducted and described in Section 3; the sample specifications are shown in Table 2 and Figure 5, Figure 6, Figure 7 and Figure 8.

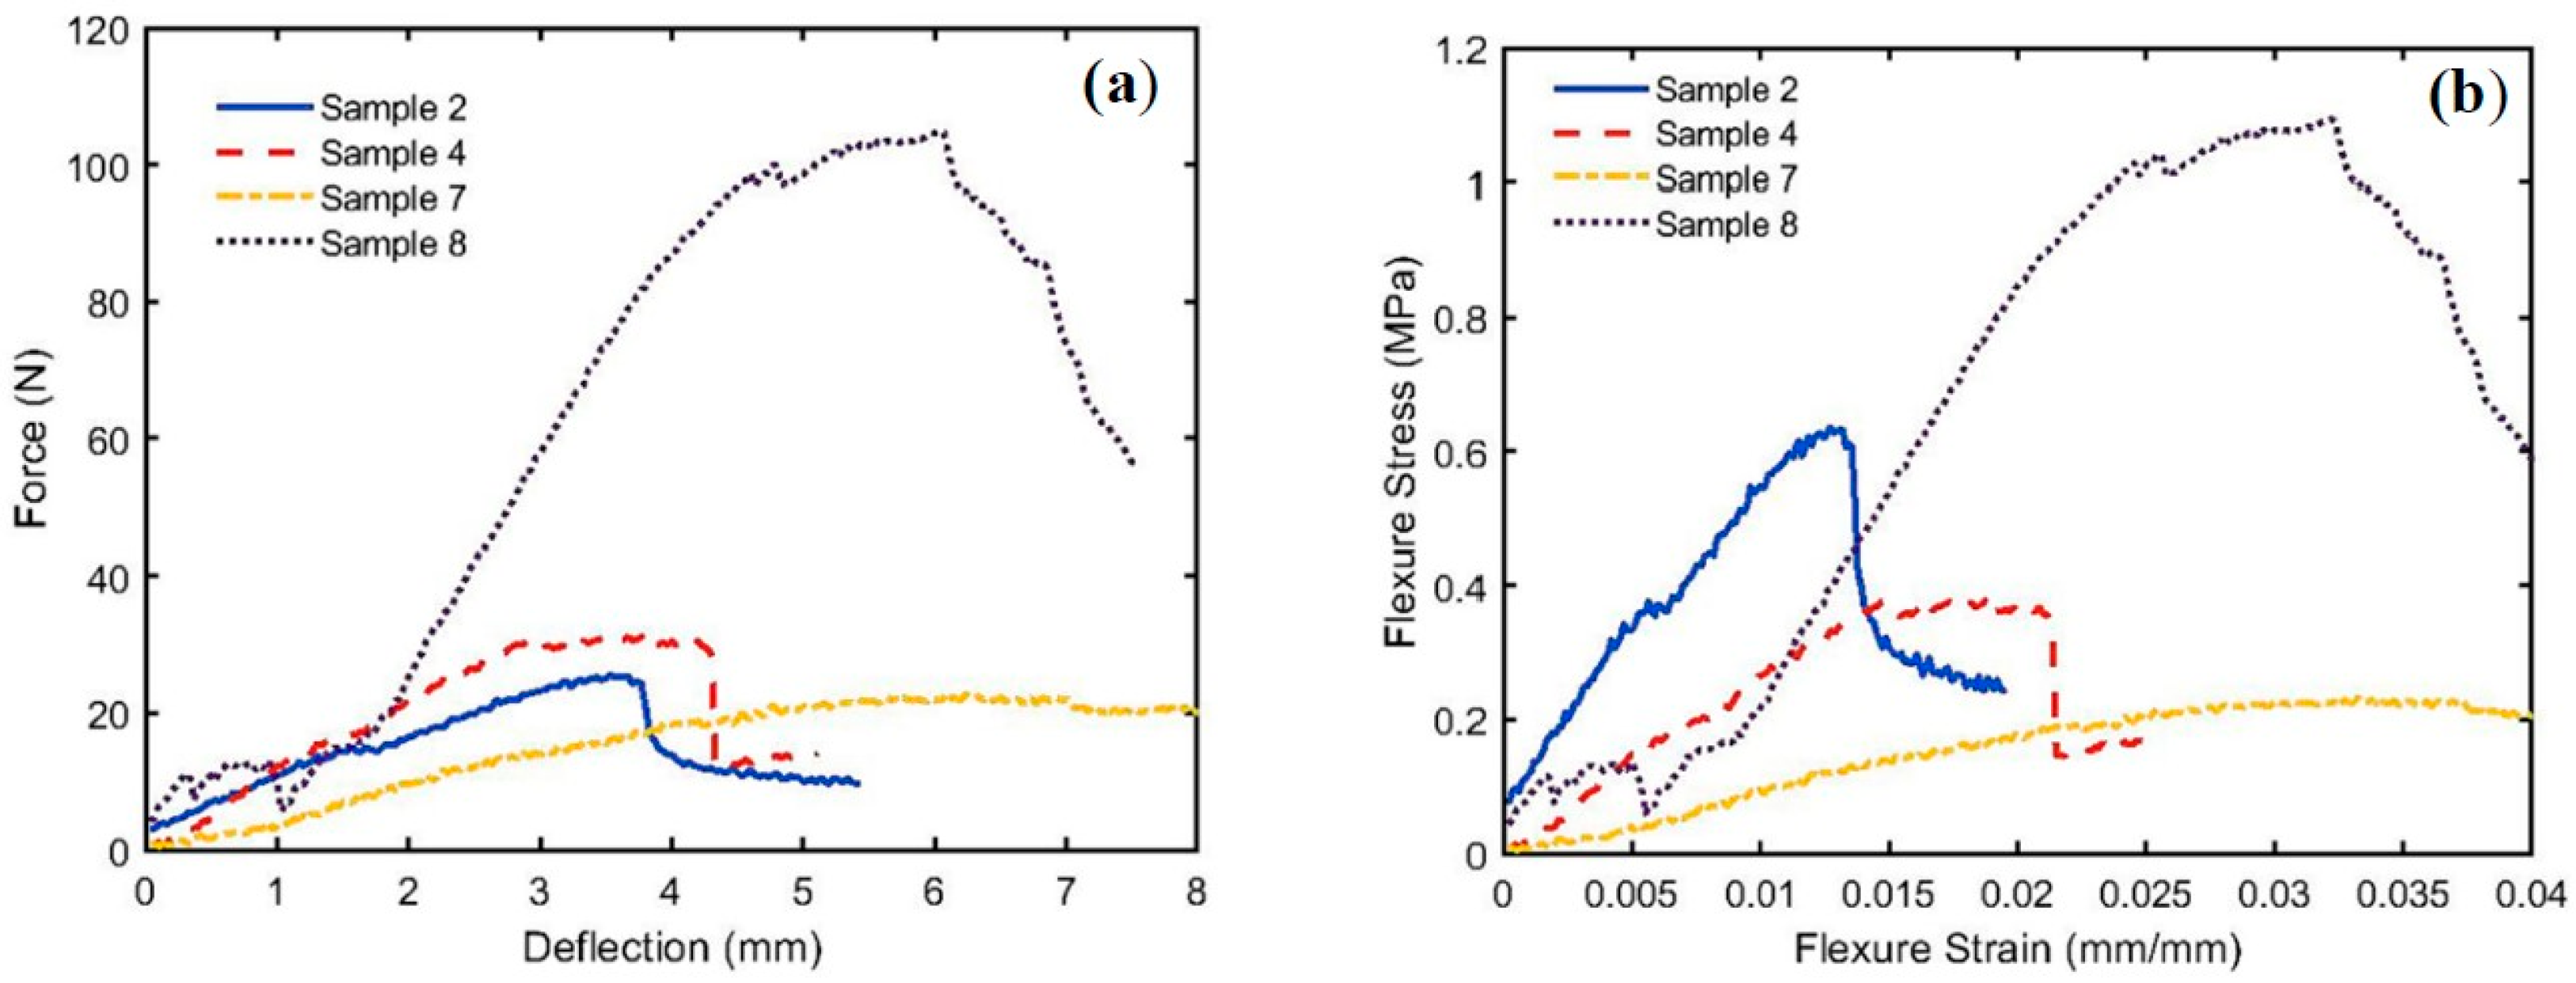
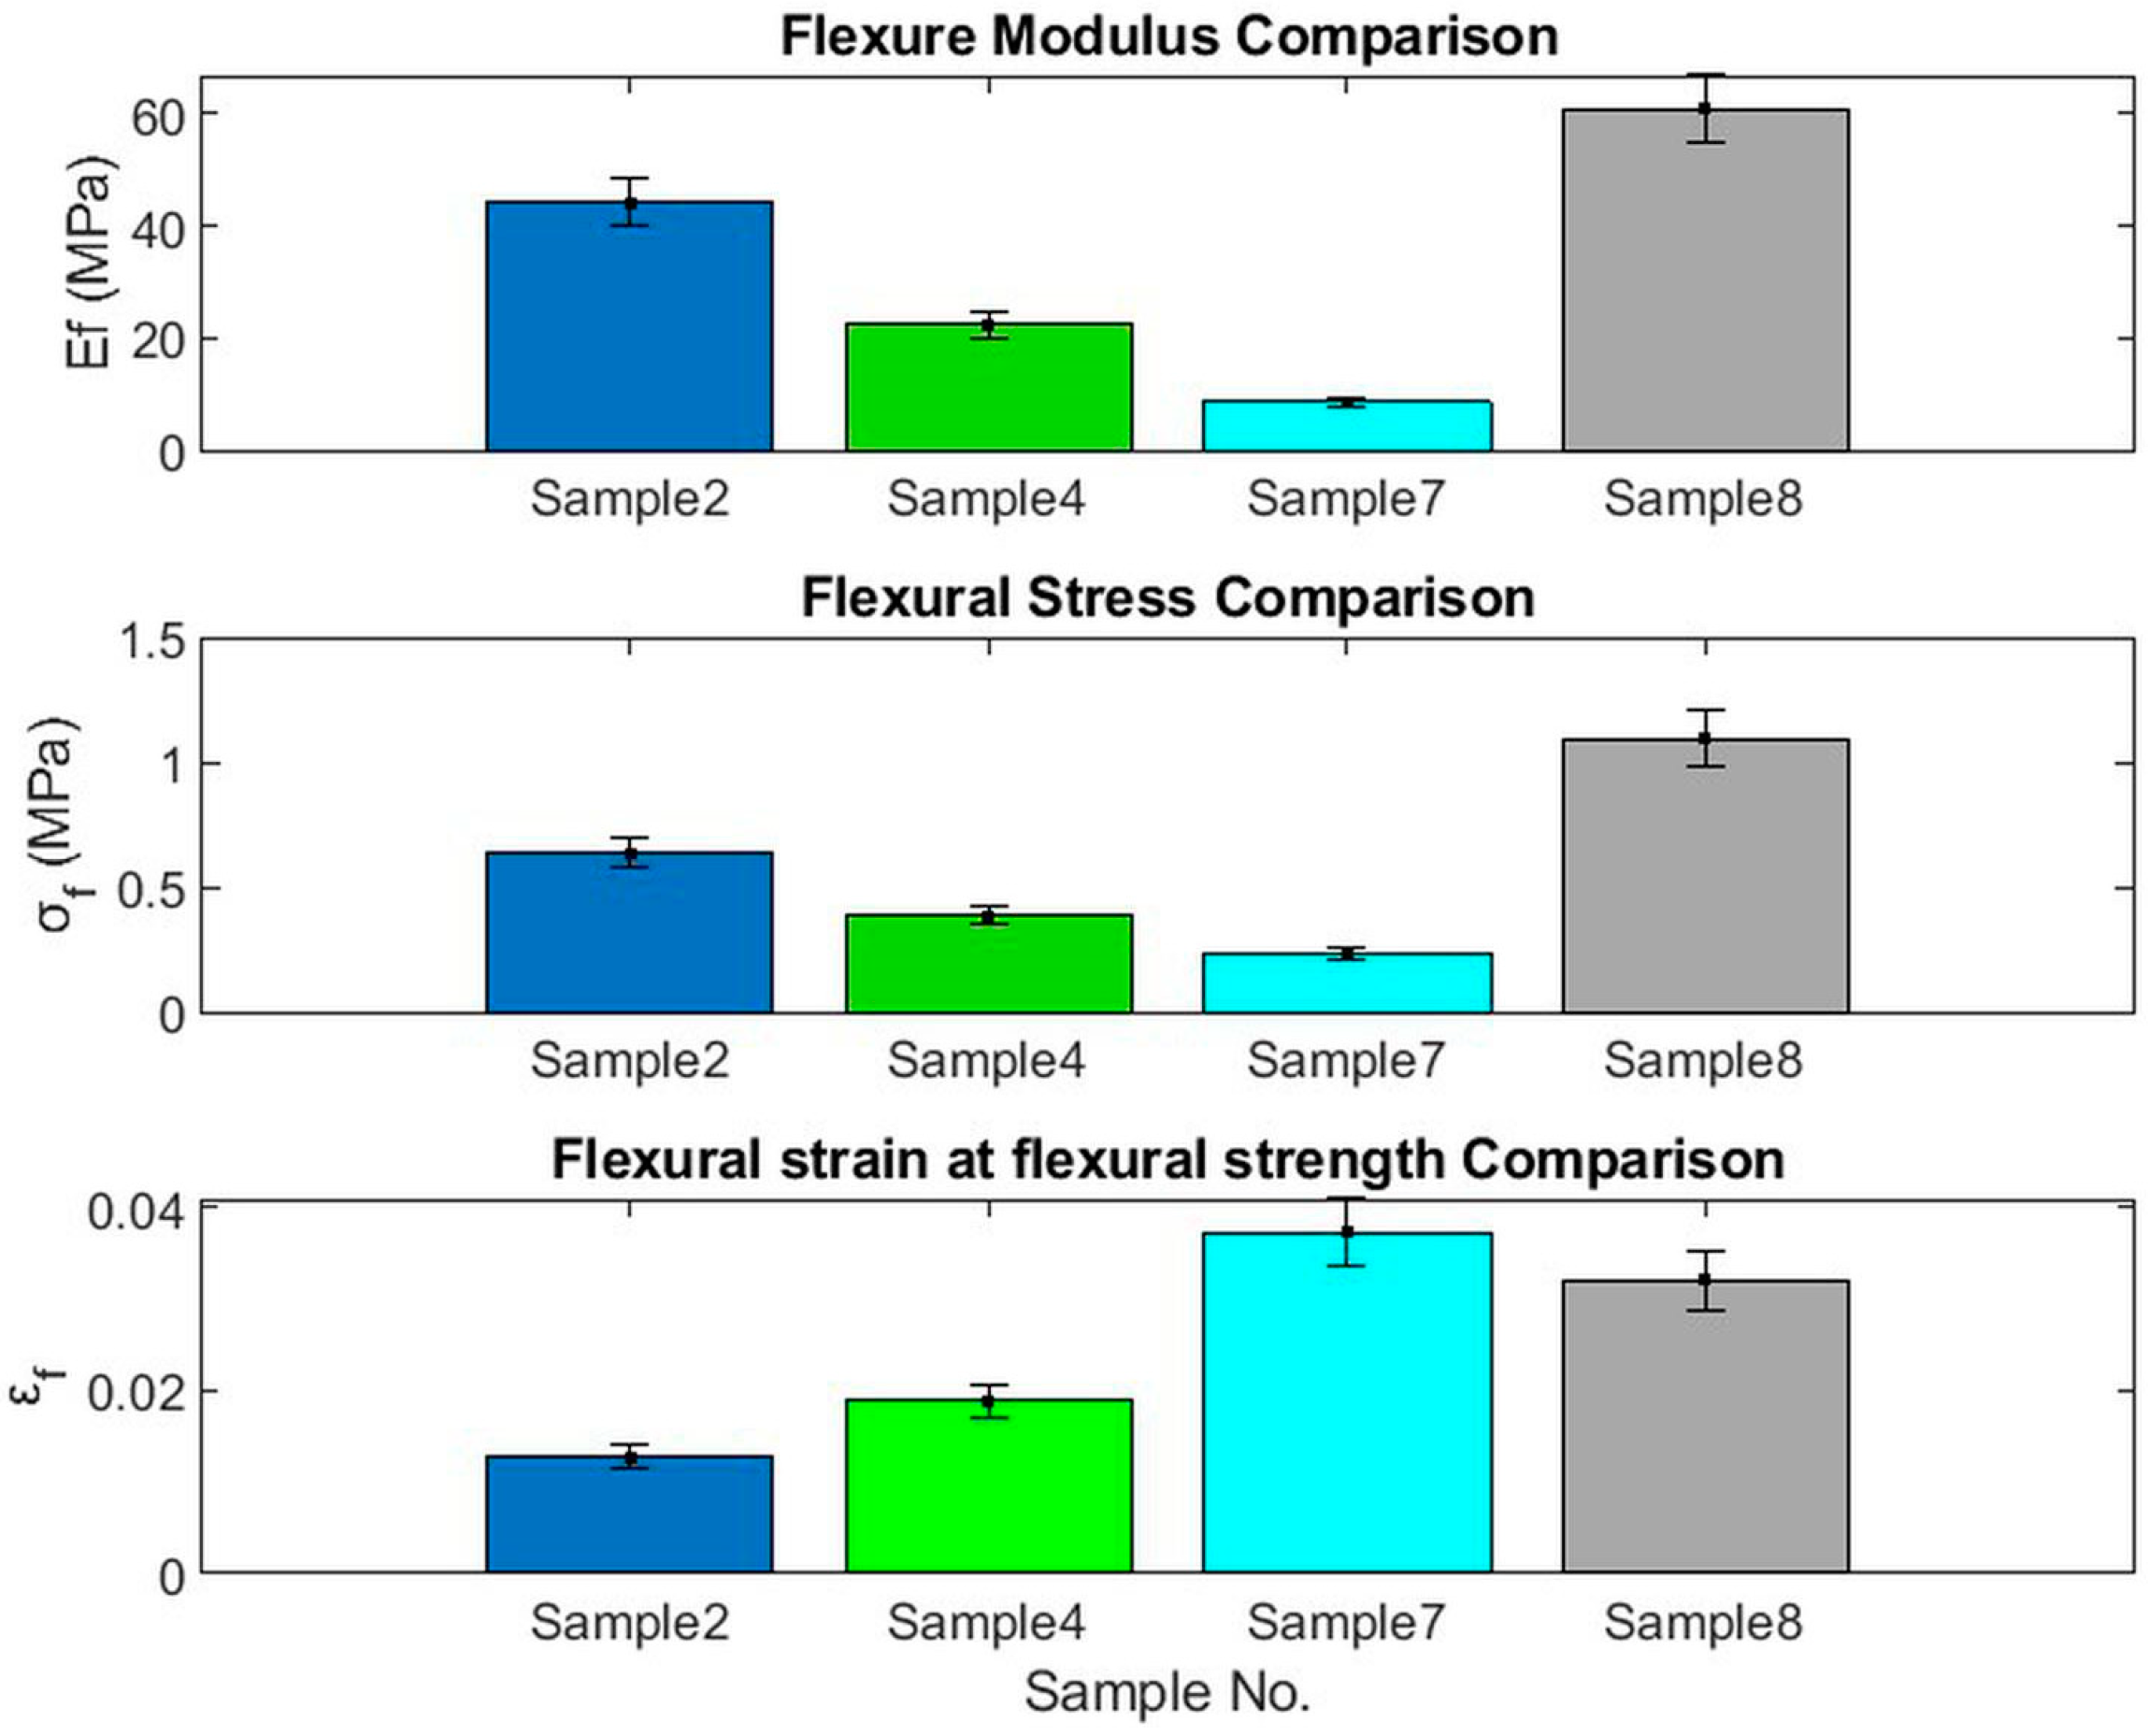
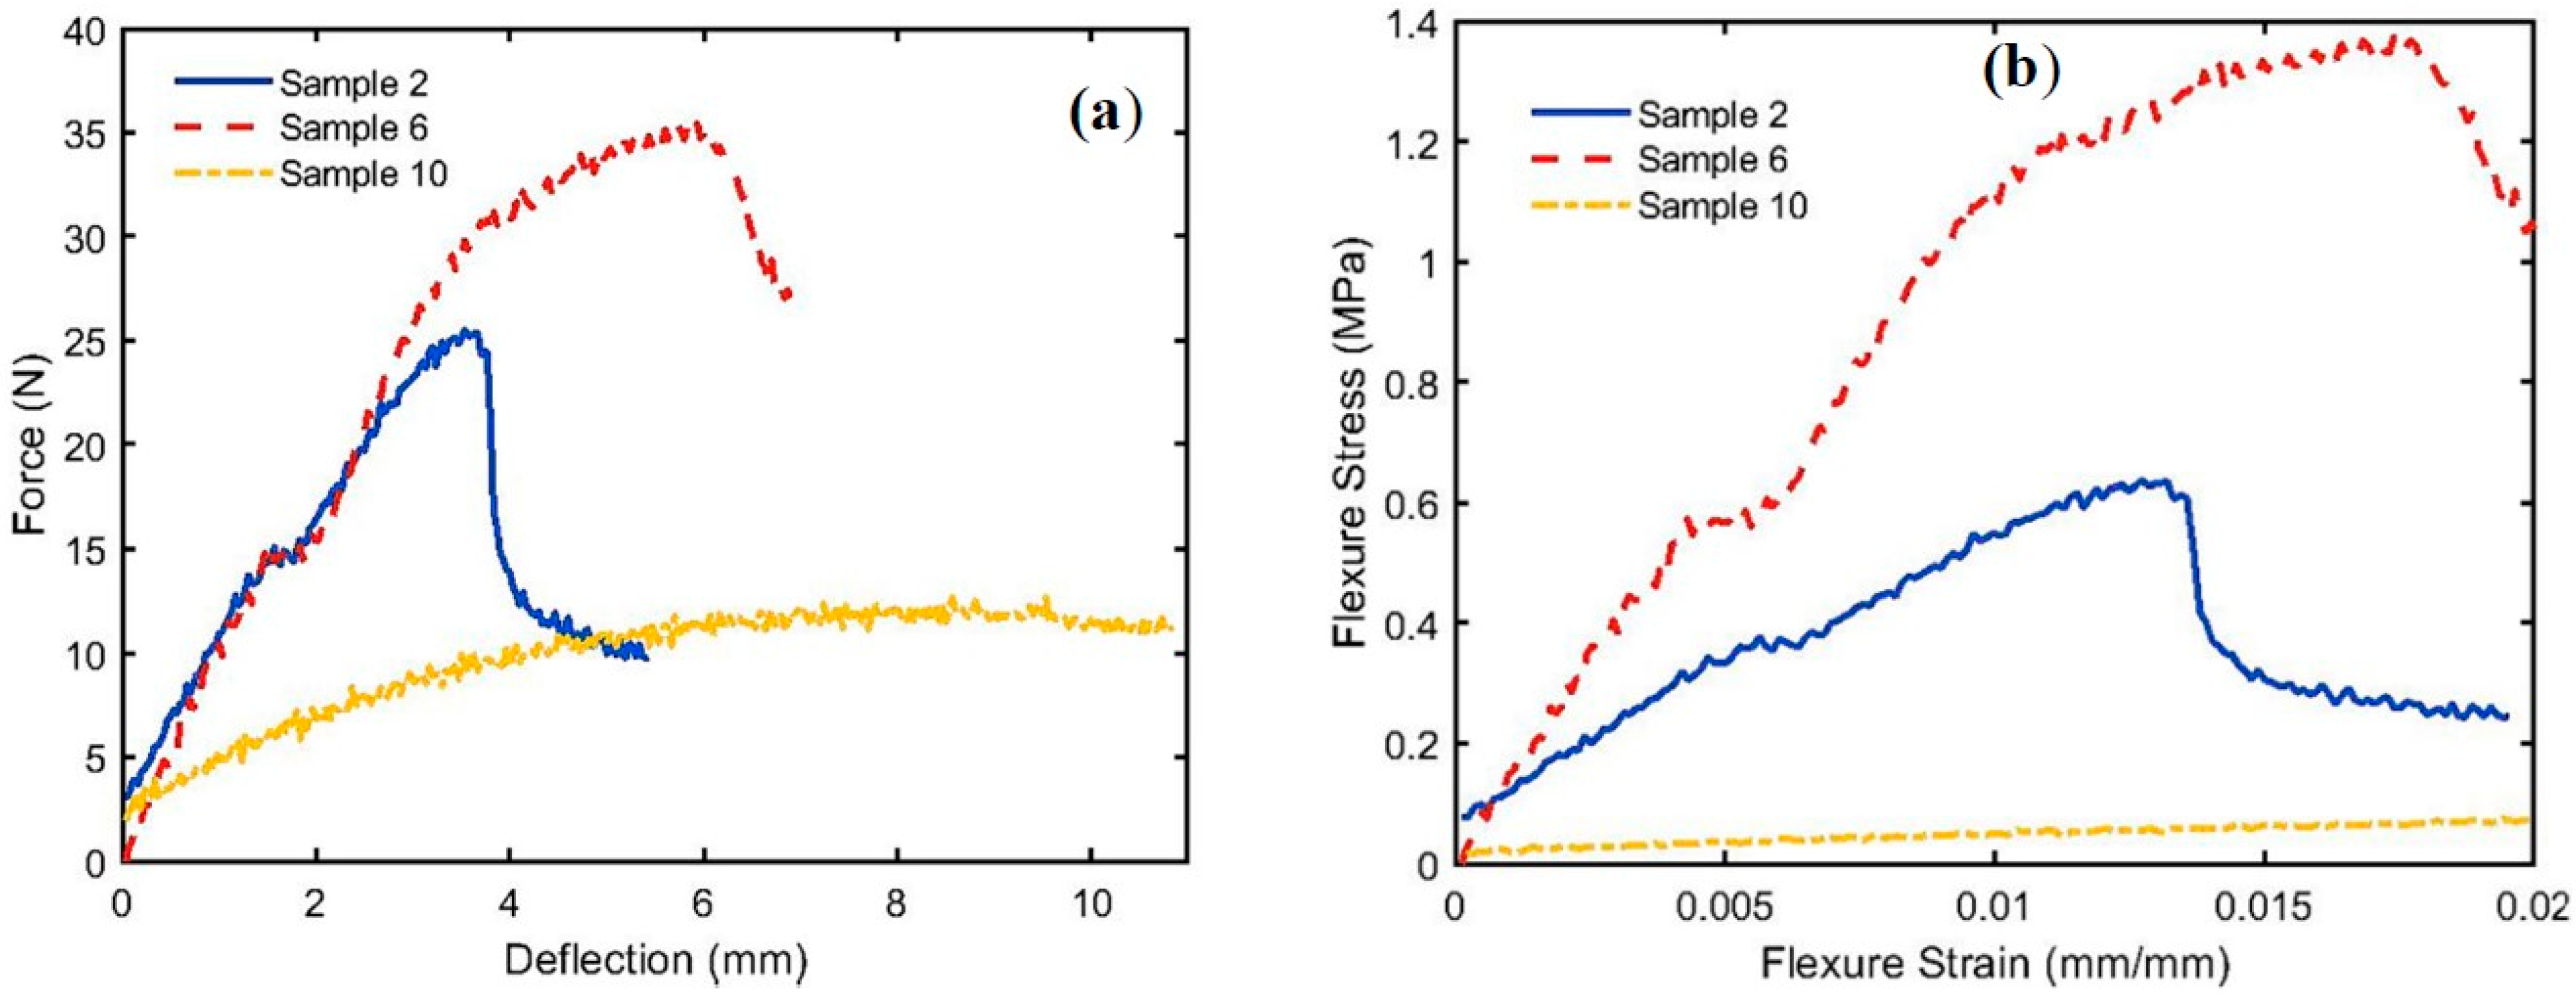
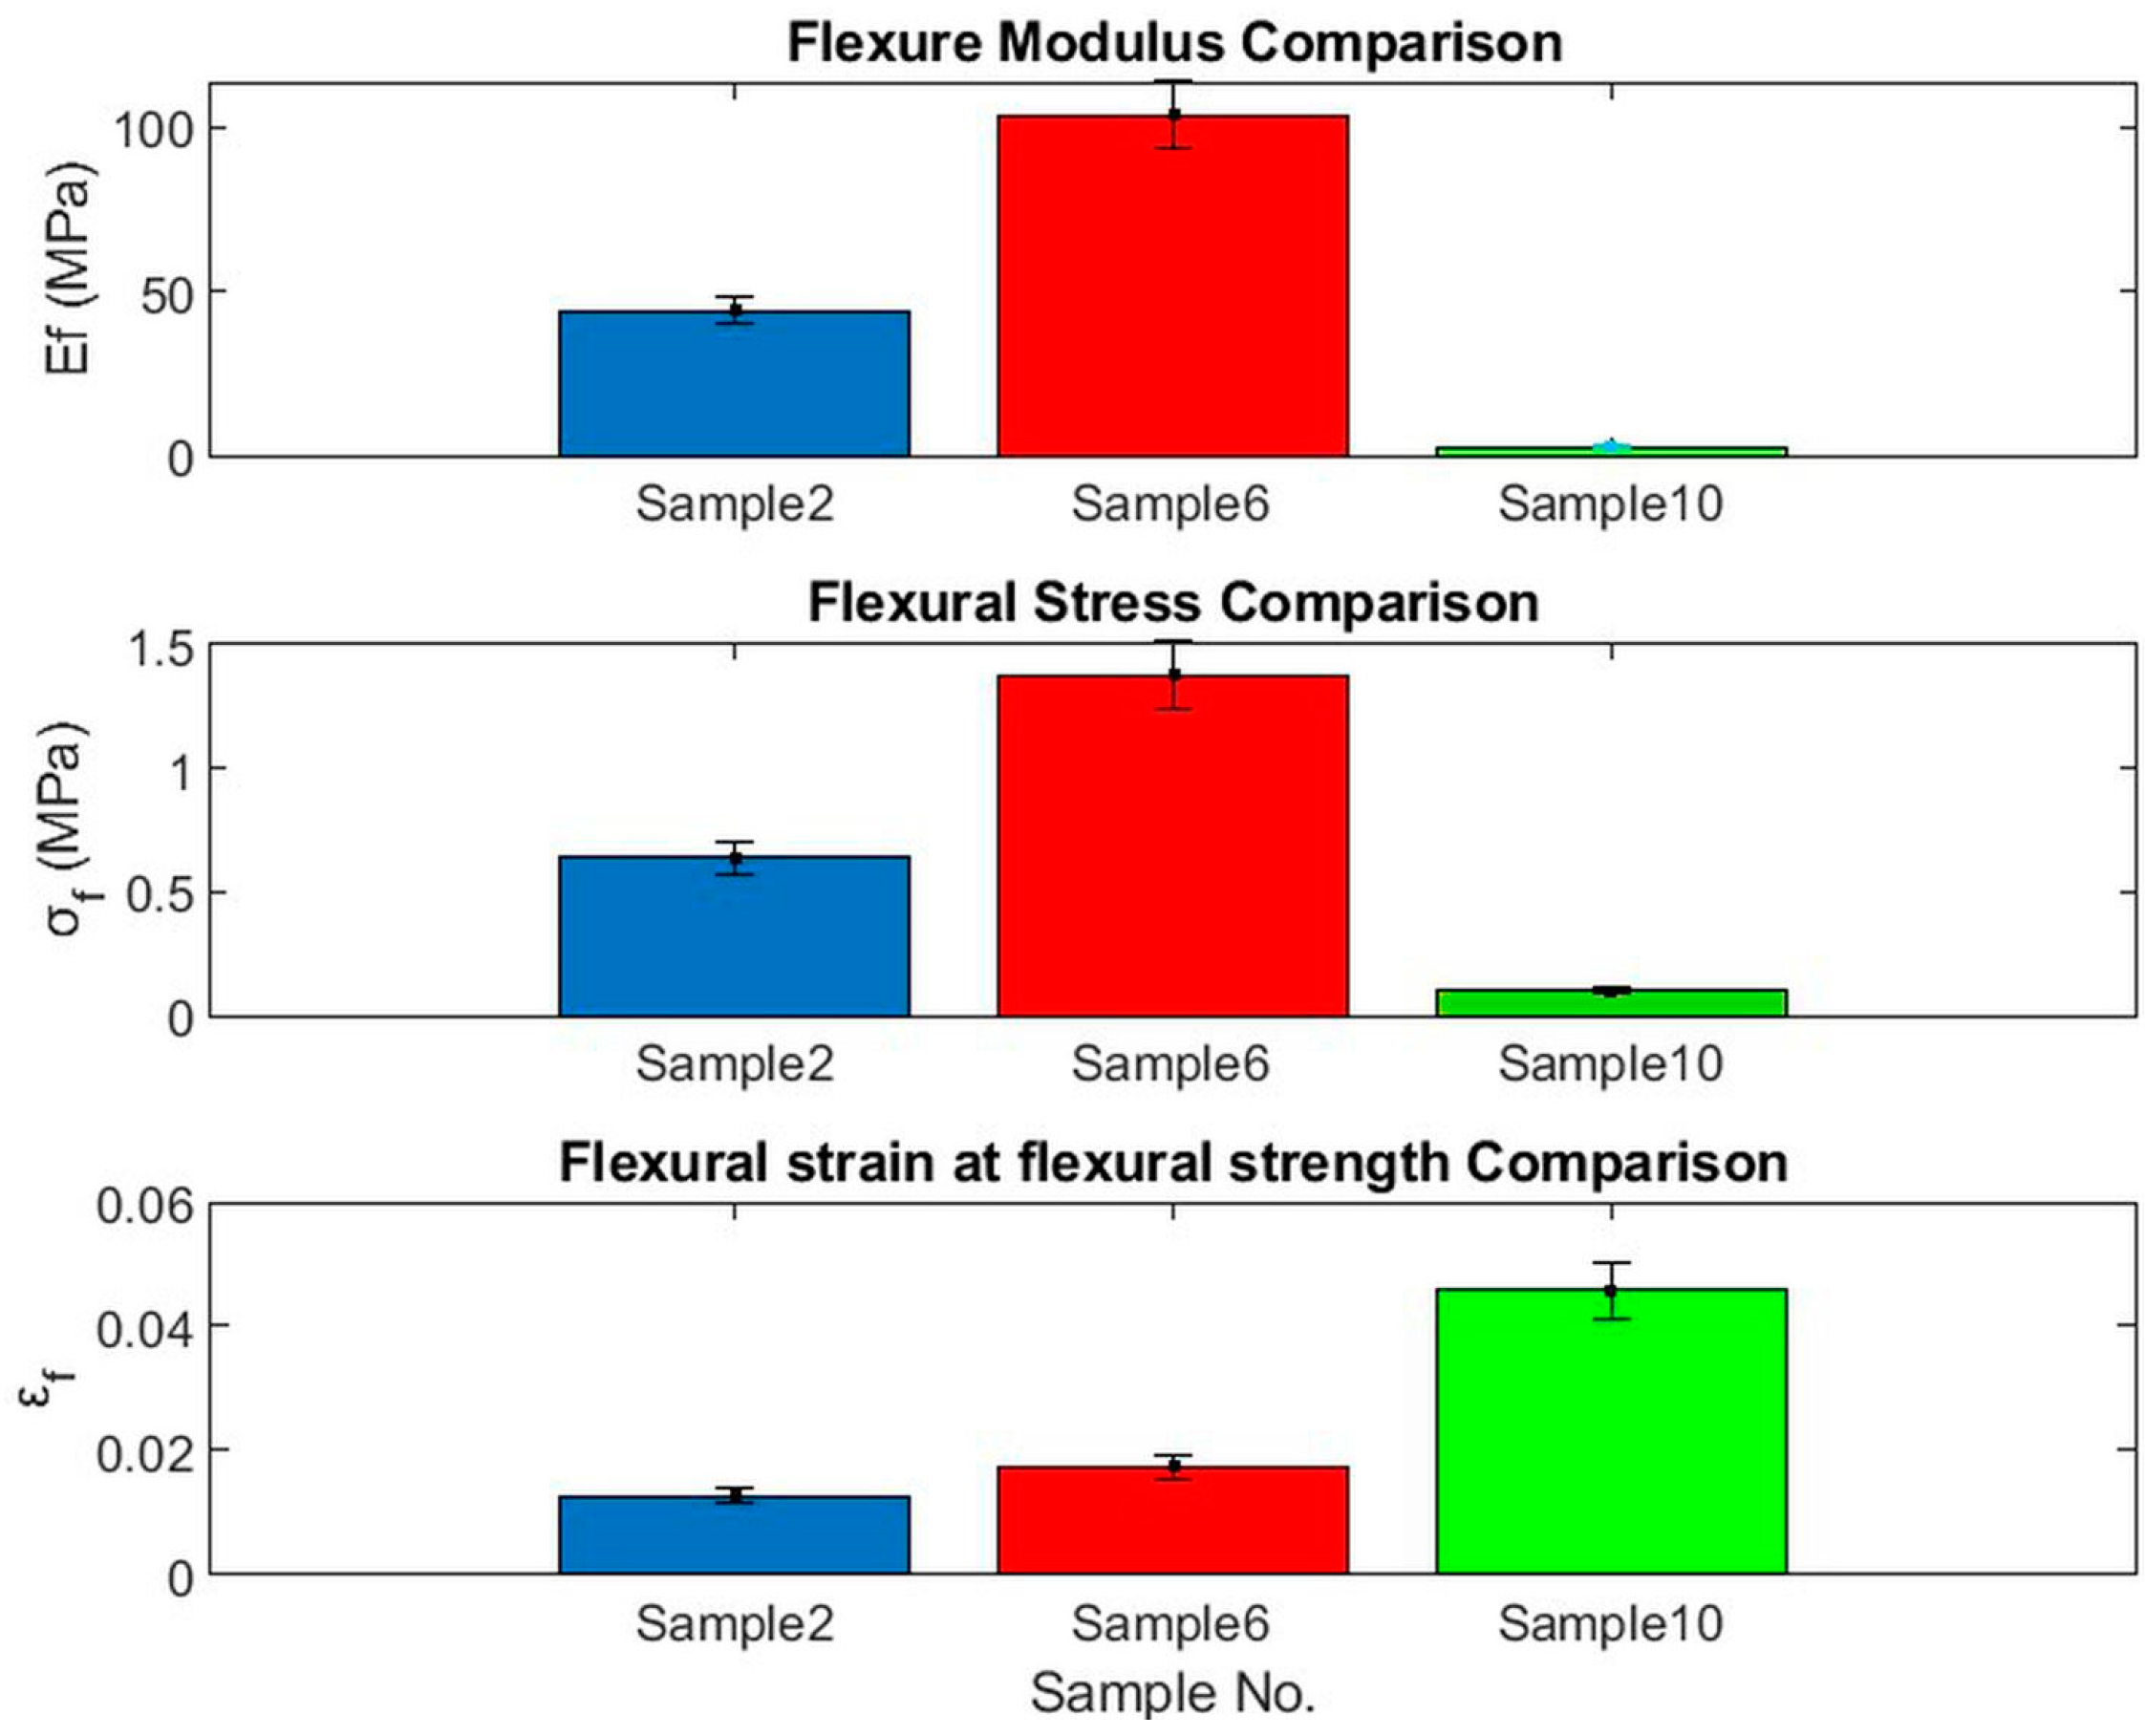
4.1. Bending Moment Test

Figure 9a,b show the load-deflection and flexural stress σ f profiles, respectively, for the bound specimens of PALF (Bo # 2), SFSF (Bo # 4), a hybrid of both (Hy # 7), and (Hy # 8). The calculated parameters, such as σ f , ϵ f, E f , and the slope S, are shown in Table 4 for each specimen.
It should be noted that the slope S was calculated for the initial straight-line profiles shown in Figure 9a up to the elastic limit. The flexural strain at flexural strength ϵ f was obtained from the stress–strain curves (Figure 9a) when the curves start to deviate from linearity [41]. Figure 10 shows a comparison between those parameters. It should be noted that the flexural modulus E f , flexural stress σ f , and ϵf depend on the degree of compactness, the polymerized binder ratio, and the thickness of the specimen. Consequently, specimen numbers 2 and 8 have a higher density (more compact) than the others do; therefore, they reflect higher E f and σ f values, and, in addition to that, the percentage of polymerized binder for # 8 is higher than that of # 2.
Figure 11 shows the load-deflection and flexural stress σ f profiles, respectively, for the bound specimens of PALF (Bo # 2), WMS (Bo # 6), and hybrid (Hy # 10). Figure 12 shows a comparison between the bound (# 2, and 6) and hybrid (# 10) specimens of PALF and WMS. The same trends were observed as shown in Figure 9 and Figure 10 for the bound and hybrid specimens of PALF and SFSF. The numerical values of governing parameters, such as E f , σ f , and ϵf, are shown in Table 4, and the specimen dimensions are shown in Table 3, which is mentioned earlier. Figure 12 indicates that specimen number 6 has better performance because it has a higher density (more compact) and has a high percentage of polymerized binder (31%). The percentage of uncertainty was calculated following the procedure described by Moffat [42], and a computer program was written to perform that. The maximum uncertainties of Flexural Modulus (Ef), Flexural Stress (σf), and Flexural Strain (εf) are 8.23%, 5.50%, and 2.76%, respectively. The error bars are added in Figure 10 and Figure 12 for all samples.

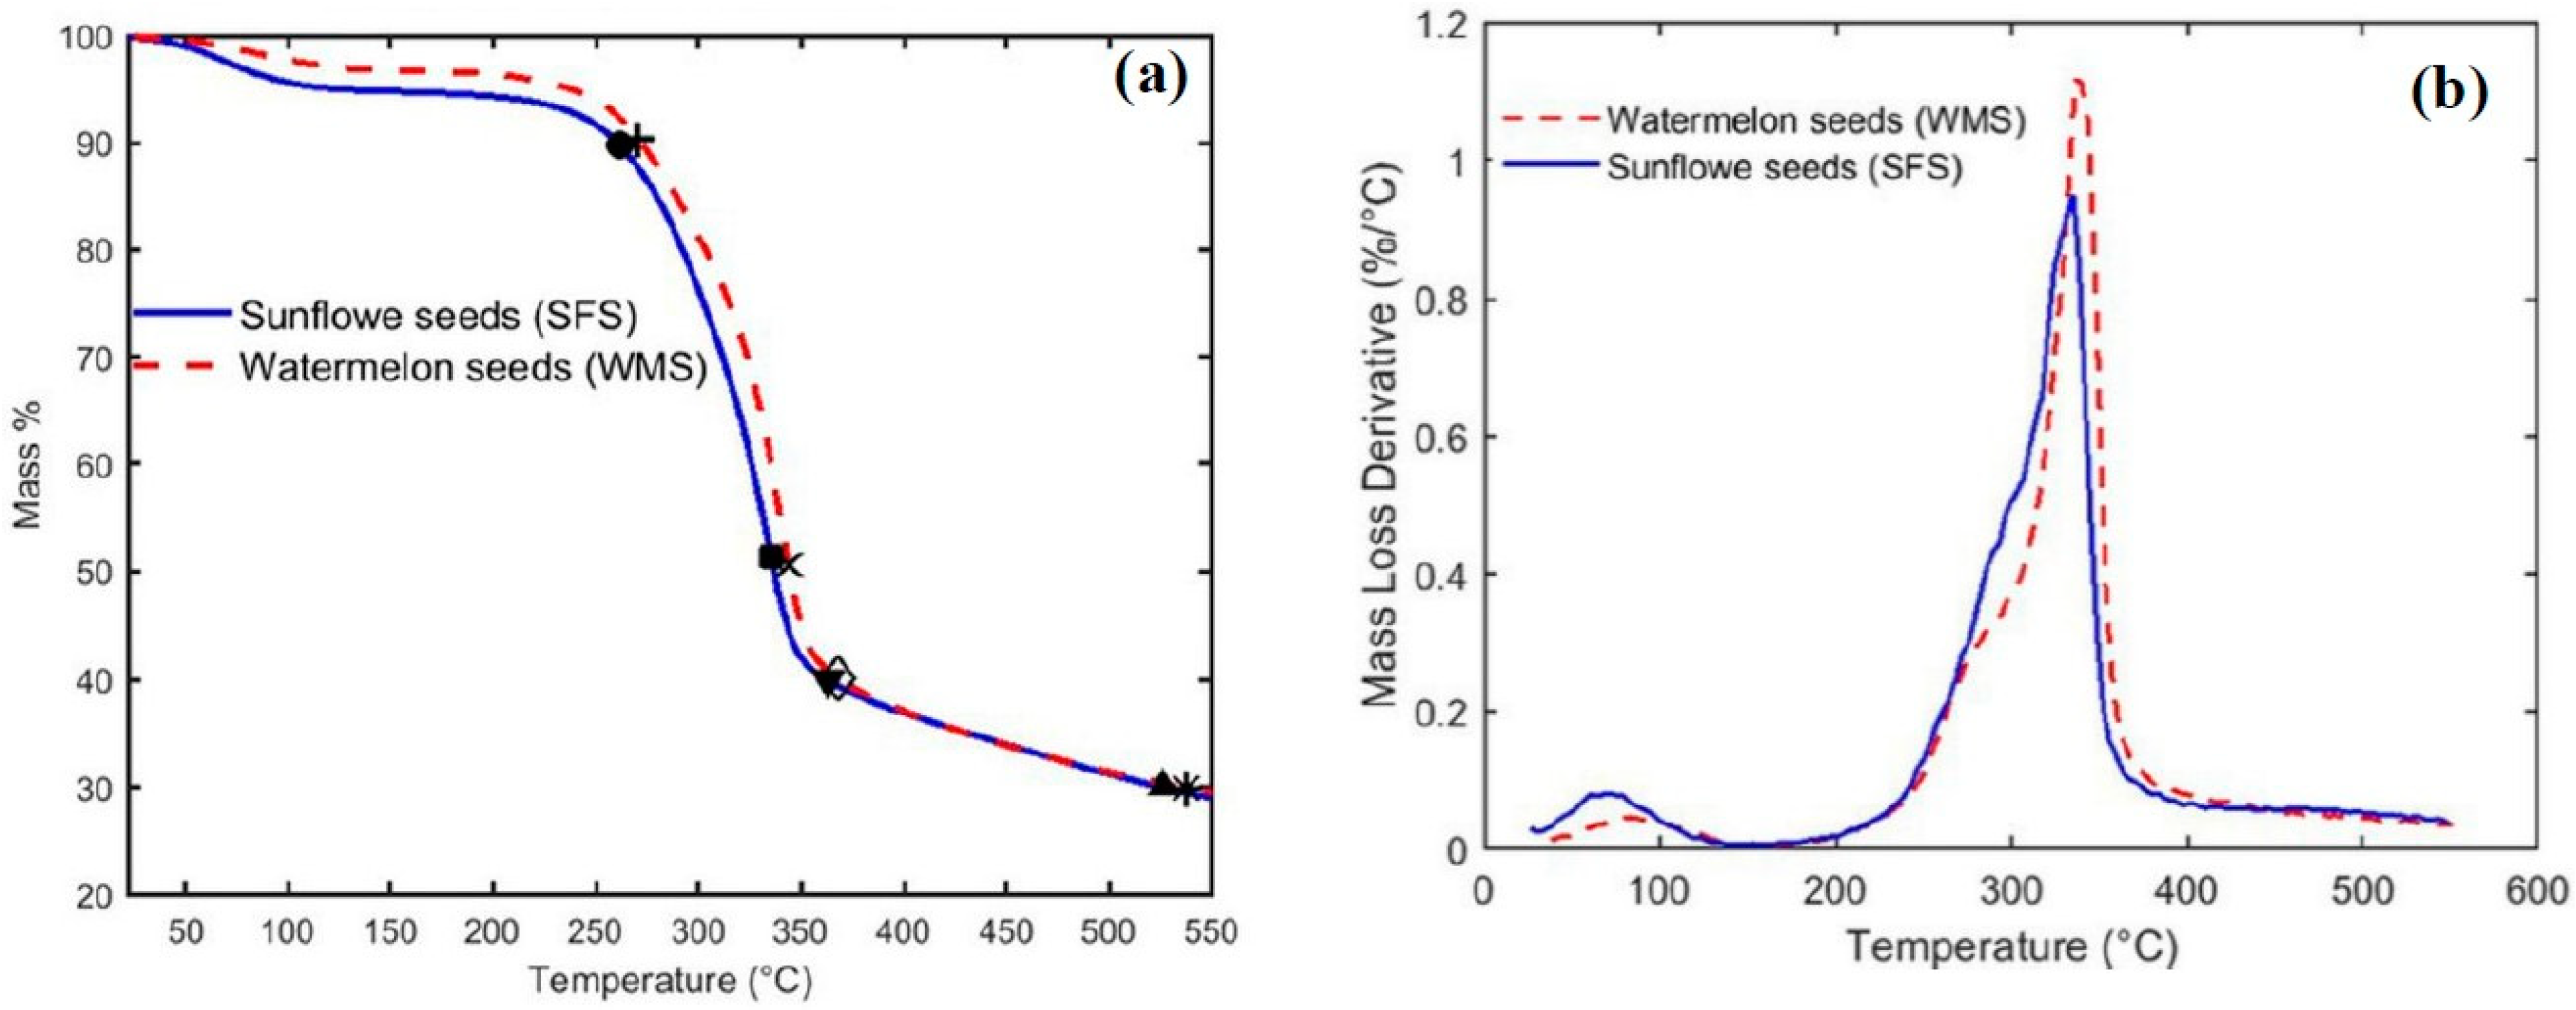
4.2. Thermal Stability Test Analyses

Comparisons between the thermogravimetric analysis (TGA) profiles of sunflower (SF) and watermelon (WM) seeds are shown in Figure 13a, and their derivative thermogravimetric analyses (DTGAs) are constructed in Figure 13b. Figure 13a shows that the raw materials of both seeds are thermally stable up to about 261 °C (●) and 270 °C (+) for both SFS and WMS, respectively, where they only lost 10% of their mass. The major loss of mass for SFS is between 261 °C (●) and 363 °C (▼), where the material lost 60% of its mass. On the other hand, WMS lost 60% of its mass between 270 °C (+) and 368 °C (◊). Both seeds almost reached a char at 526 °C (▲) and 538 °C (*) for SFS and WMS, respectively, where they lost almost 70% of their masses. Both SFS and WMS decompose to about 50% of their mass at 335 °C (■) and 440 °C (×), respectively. The degradation of the temperature range and its peak for both SFS and WMS is shown in Figure 13b. Consequently, Figure 13a,b ensure that both raw materials of SFS and WMS are thermally stable at high temperatures. Therefore, these materials with their high thermally stable temperatures can be used as new novel thermal insulation materials for buildings and could enhance our environmental future by using such new natural and biodegradable materials that are safe for humans to replace both synthetically and petrochemically produced thermal insulation materials.
Figure 14 shows that the endothermic transition starts at about 363 °C and 351 °C for SFS and WMS, respectively, and they both reach a maximum at 550 °C. At these two temperatures, the samples lost about 60% and 55% of their mass as indicated by the TGA analysis shown in Figure 13a. Therefore, these two endothermic transition peaks could be defined as the initial melting points of these two materials. Consequently, The DSC analysis indicates that these two fibers are stable up to 261 °C and 270 °C for SFS and WMS as also indicated by Figure 13a, where they almost lost only the moisture content.

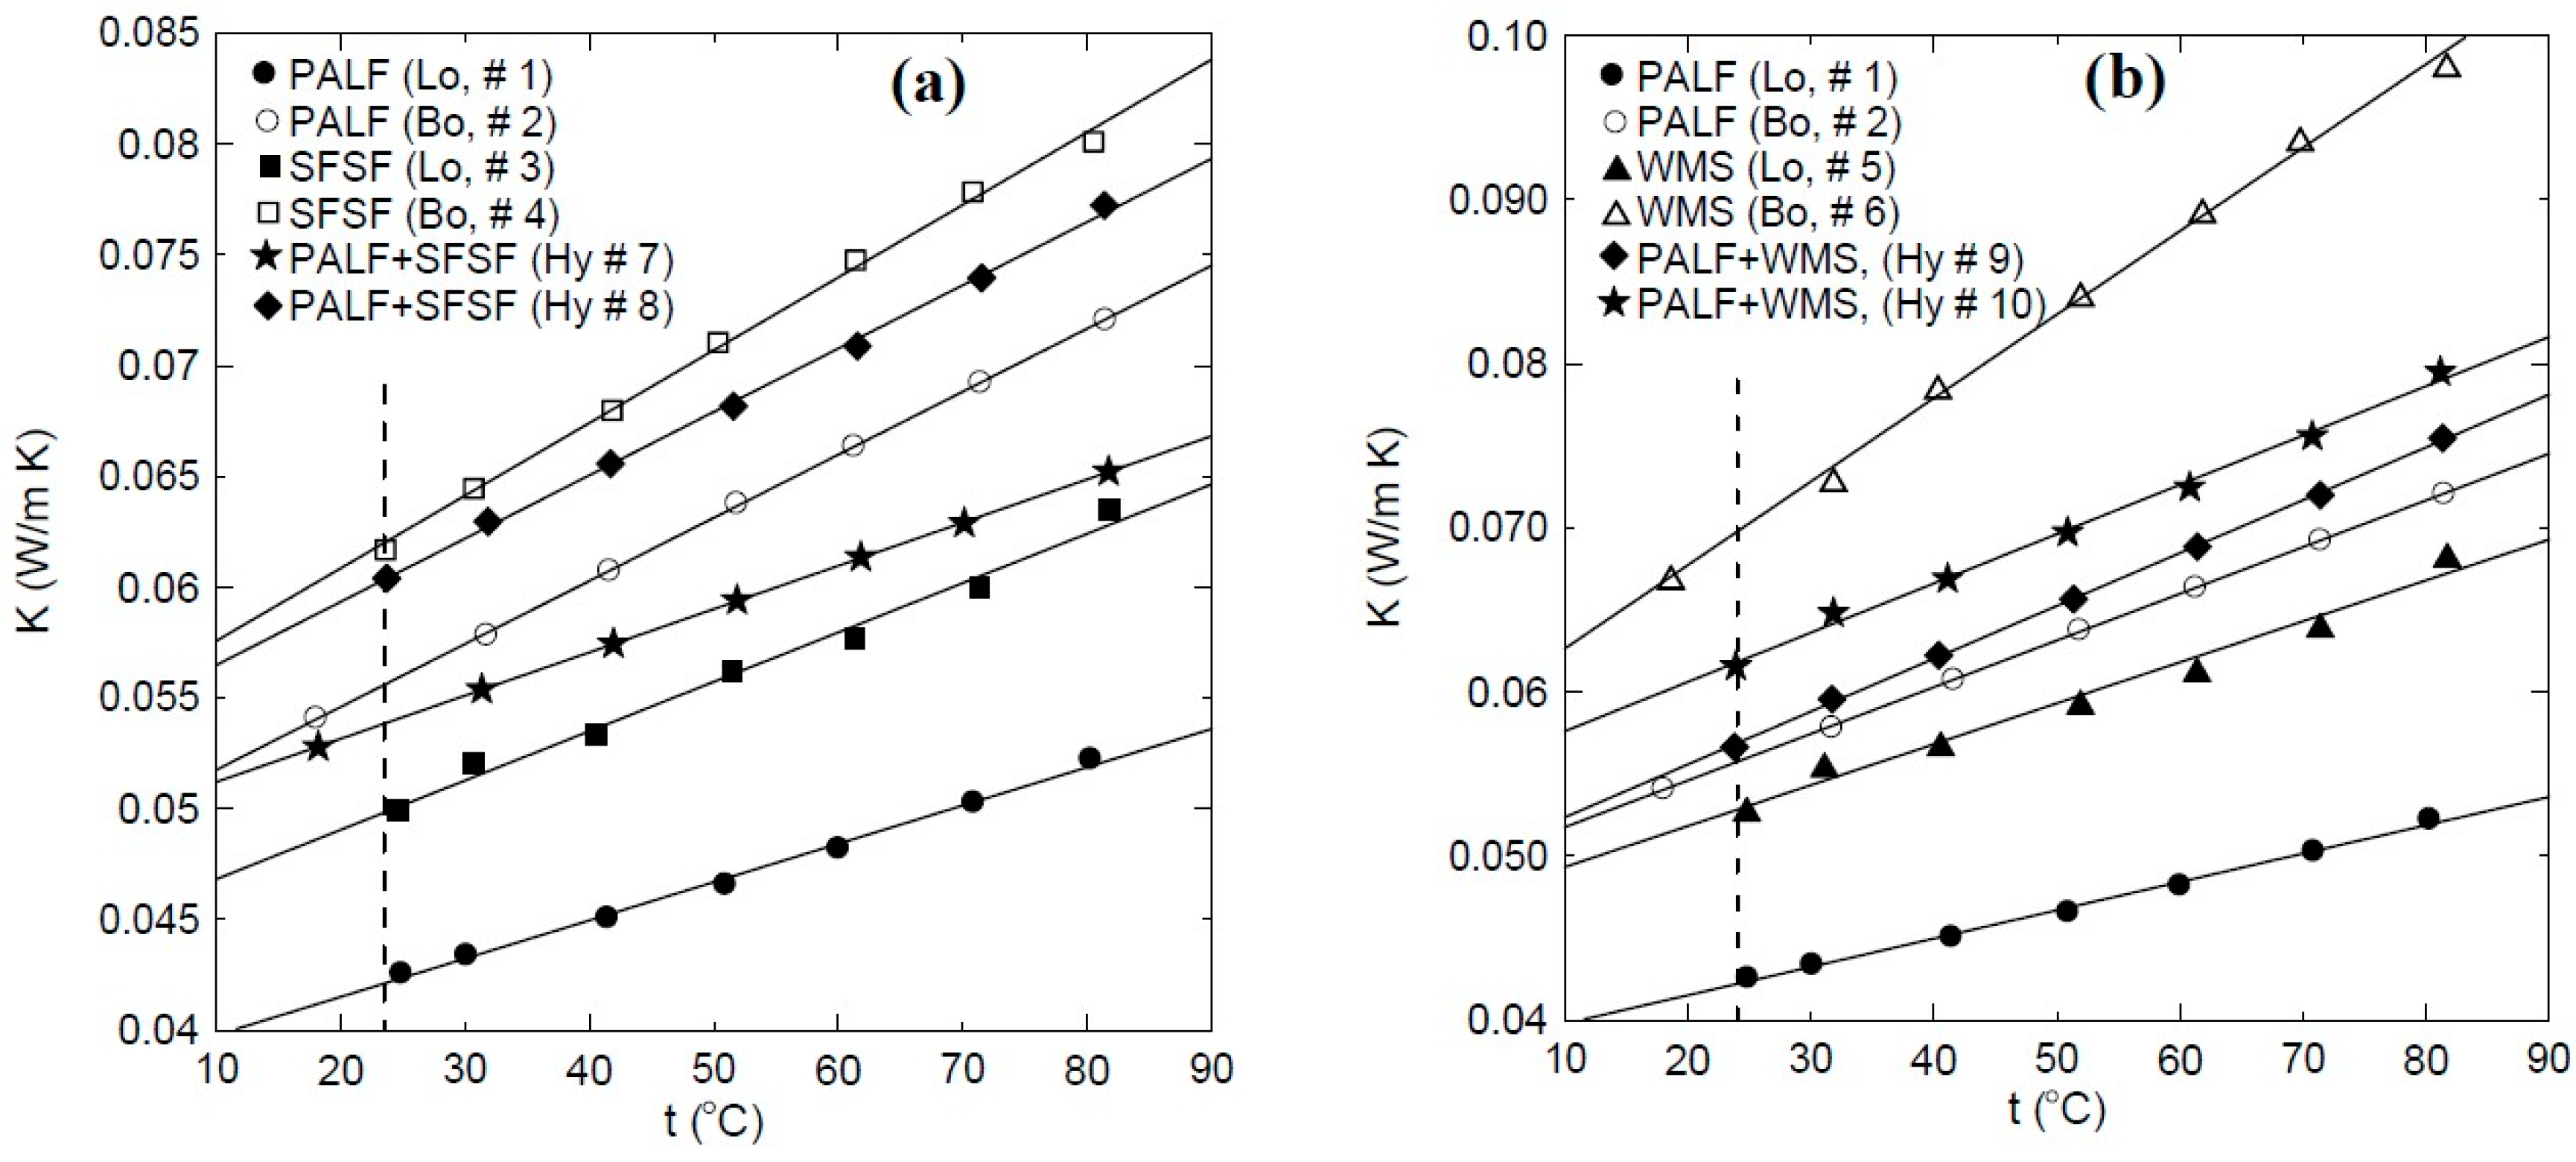
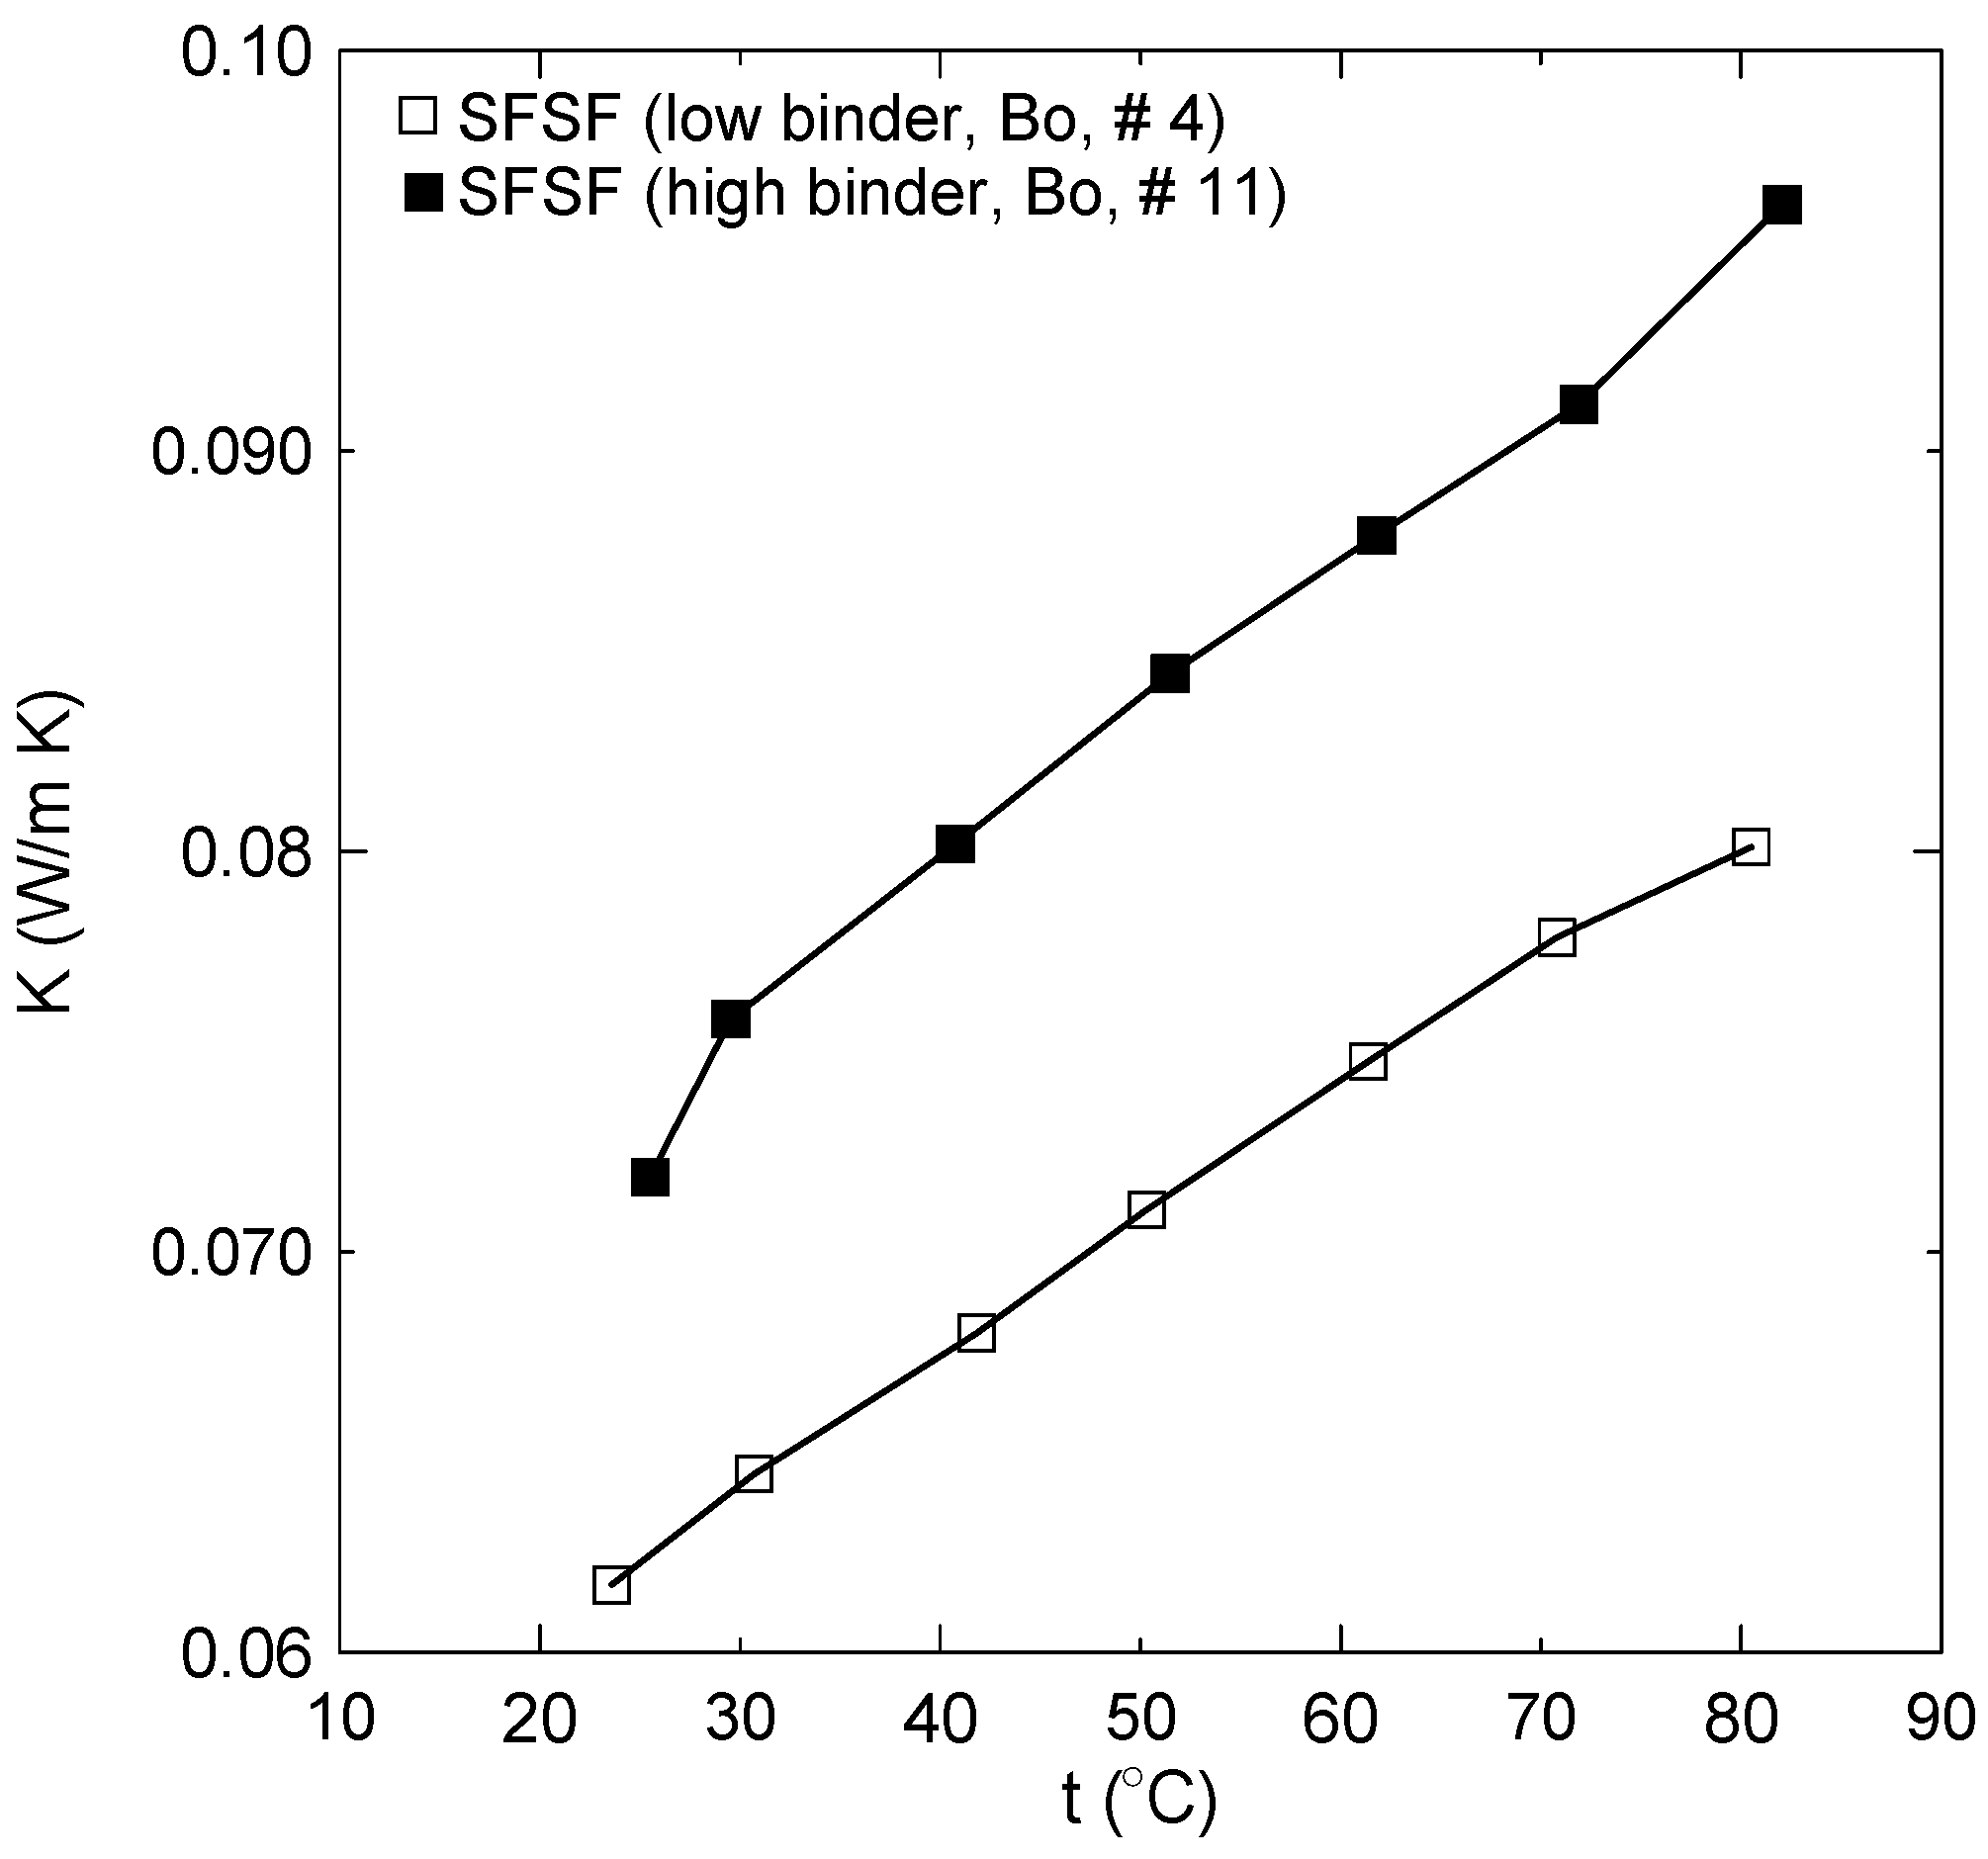
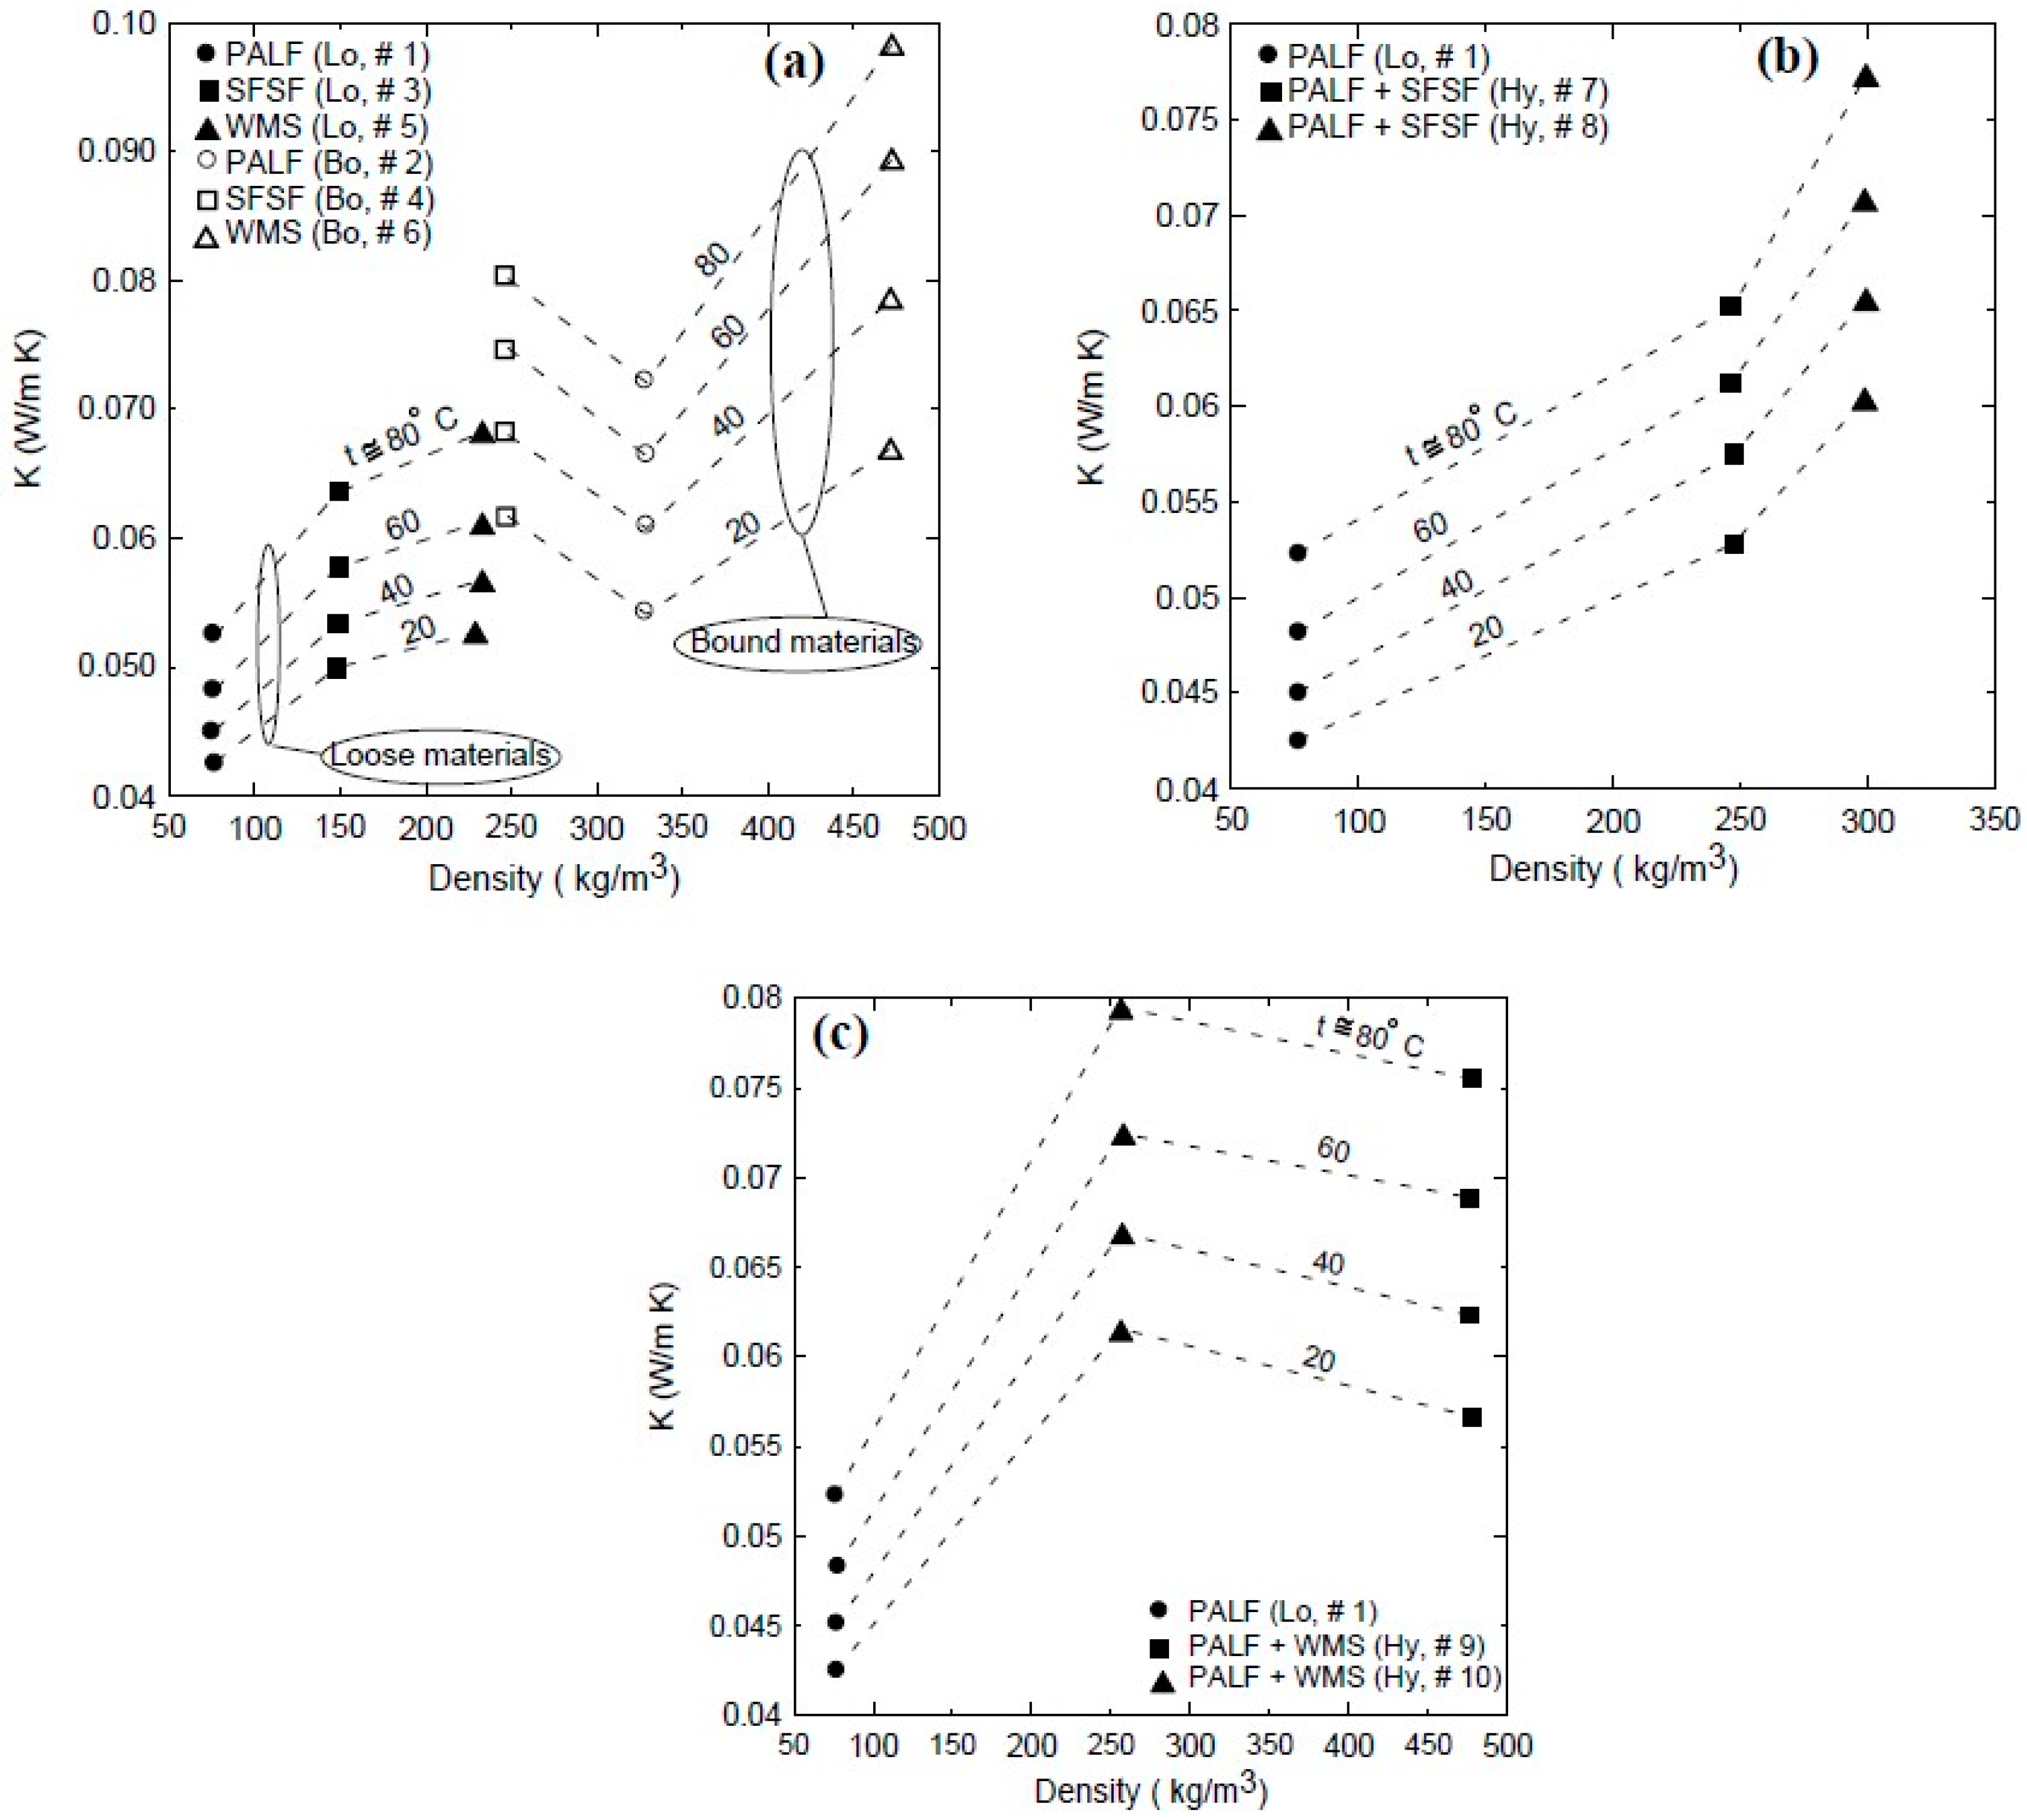
4.3. Thermal Conductivity Coefficient Analyses

Figure 15 shows the thermal conductivity coefficients for loose and bound samples of PALF (● #1, ○ #2), SFSF (■ #3, □ #4), and WMS (▲ #5, Δ #6). As indicated, all the loose samples have lower thermal conductivity coefficients (K) than the bound samples. This could be attributed to the air gaps between the loose fibers, which have low thermal conductivity. However, most of those air gaps were filled by the used binder, which has higher thermal conductivity. Therefore, the result is an increase in the effective thermal conductivity coefficients of the bound samples compared to the loose ones. The vertical dashed line shows that the thermal conductivity coefficients of all samples are less than 0.07 W/m.K at the ambient temperature of 24 °C, which allows them to be used for thermal insulation. All samples have linear correlation to cover a temperature range greater than 20 °C and less than 80 °C in the form:
K = A + B × t
Table 5 shows the constants A and B and the coefficient of determination for each linear regression. Figure 15 shows also that the thermal conductivity coefficient is almost a linear function of temperature and increases in the temperature range of 20 °C–80 °C as 22.7%, 33.2%, 27.1%, 29.8%, 29.3%, 46.7%, 23.5%, 27.9%, 33.2%, and 29.1% for sample numbers 1, 2, 3, 4, 5, 6, 7, 8, 9, and 10, respectively, as shown in Table 2. Figure 16a shows a comparison between the thermal conductivity coefficient profiles of the bound samples of PALF and SFSF and their hybrid samples 7 and 8. It is clear that as the percent of PALF increases in the hybrid sample (#7), this leads to an enhancement in the thermal conductivity coefficient compared to that of the bound sample (#4) of SFSF, and the opposite is true as shown in sample number 8. Figure 16b shows similar profiles of the thermal conductivity coefficients for the bound and hybrid samples except for PALF and WMS. The same enhancement trend in the thermal conductivity coefficient is observed as the percent of PALF is increased in the hybrid samples as shown in sample # 9 compared to sample number 10. The vertical dashed line shown in Figure 16 indicates that the thermal conductivity coefficients of all samples are less than 0.07 W/m.K at the ambient temperature, which allows them to be used as thermal insulation materials for buildings. It should be noted that increasing the binder ratio in the bound or hybrid sample would deteriorate the thermal conductivity coefficient. Therefore, Figure 17 is constructed to show this effect, where sample number 11 (■) has a polymerized mass percent of 54 compared to number 4 () of 31 using SFSF as the material. The increase in the thermal conductivity coefficient is about 19% at a temperature 50 °C, where the mass of the binder increases by about 159%. Table 6 shows a comparison between the current finding of the thermal conductivity coefficients and those of some similar natural thermal insulation materials available in the literature. Figure 18a–c show the thermal conductivity coefficient profiles at different temperatures versus the density of the samples shown in Table 2. Figure 18a presents two different sets of profiles, one for loose materials (solid symbols) of PALF, SFSF, and WMS and the other (hollow symbols) for bound ones. This figure indicates that the thermal conductivity coefficients in general increase as either the temperature or the density increases for a fixed volume of the material as shown for the loose samples. However, the thermal conductivity coefficients still increase for the bound samples compared to their corresponding loose ones. It should be noted that each symbol presents a different sample along each isothermal profile as shown in the legend of the figure. Figure 18b,c show the same profiles but for hybrid samples of (PALF, SFSF) and (PALF, WMS), respectively. It is worth mentioning that the second and third symbols along each isothermal line present the hybrid samples compared to the first sample of the loose materials. Figure 18b,c indicate that the thermal conductivity coefficients are a function of both the temperature and the density and they increase as each of them increases compared to that of the loose material.

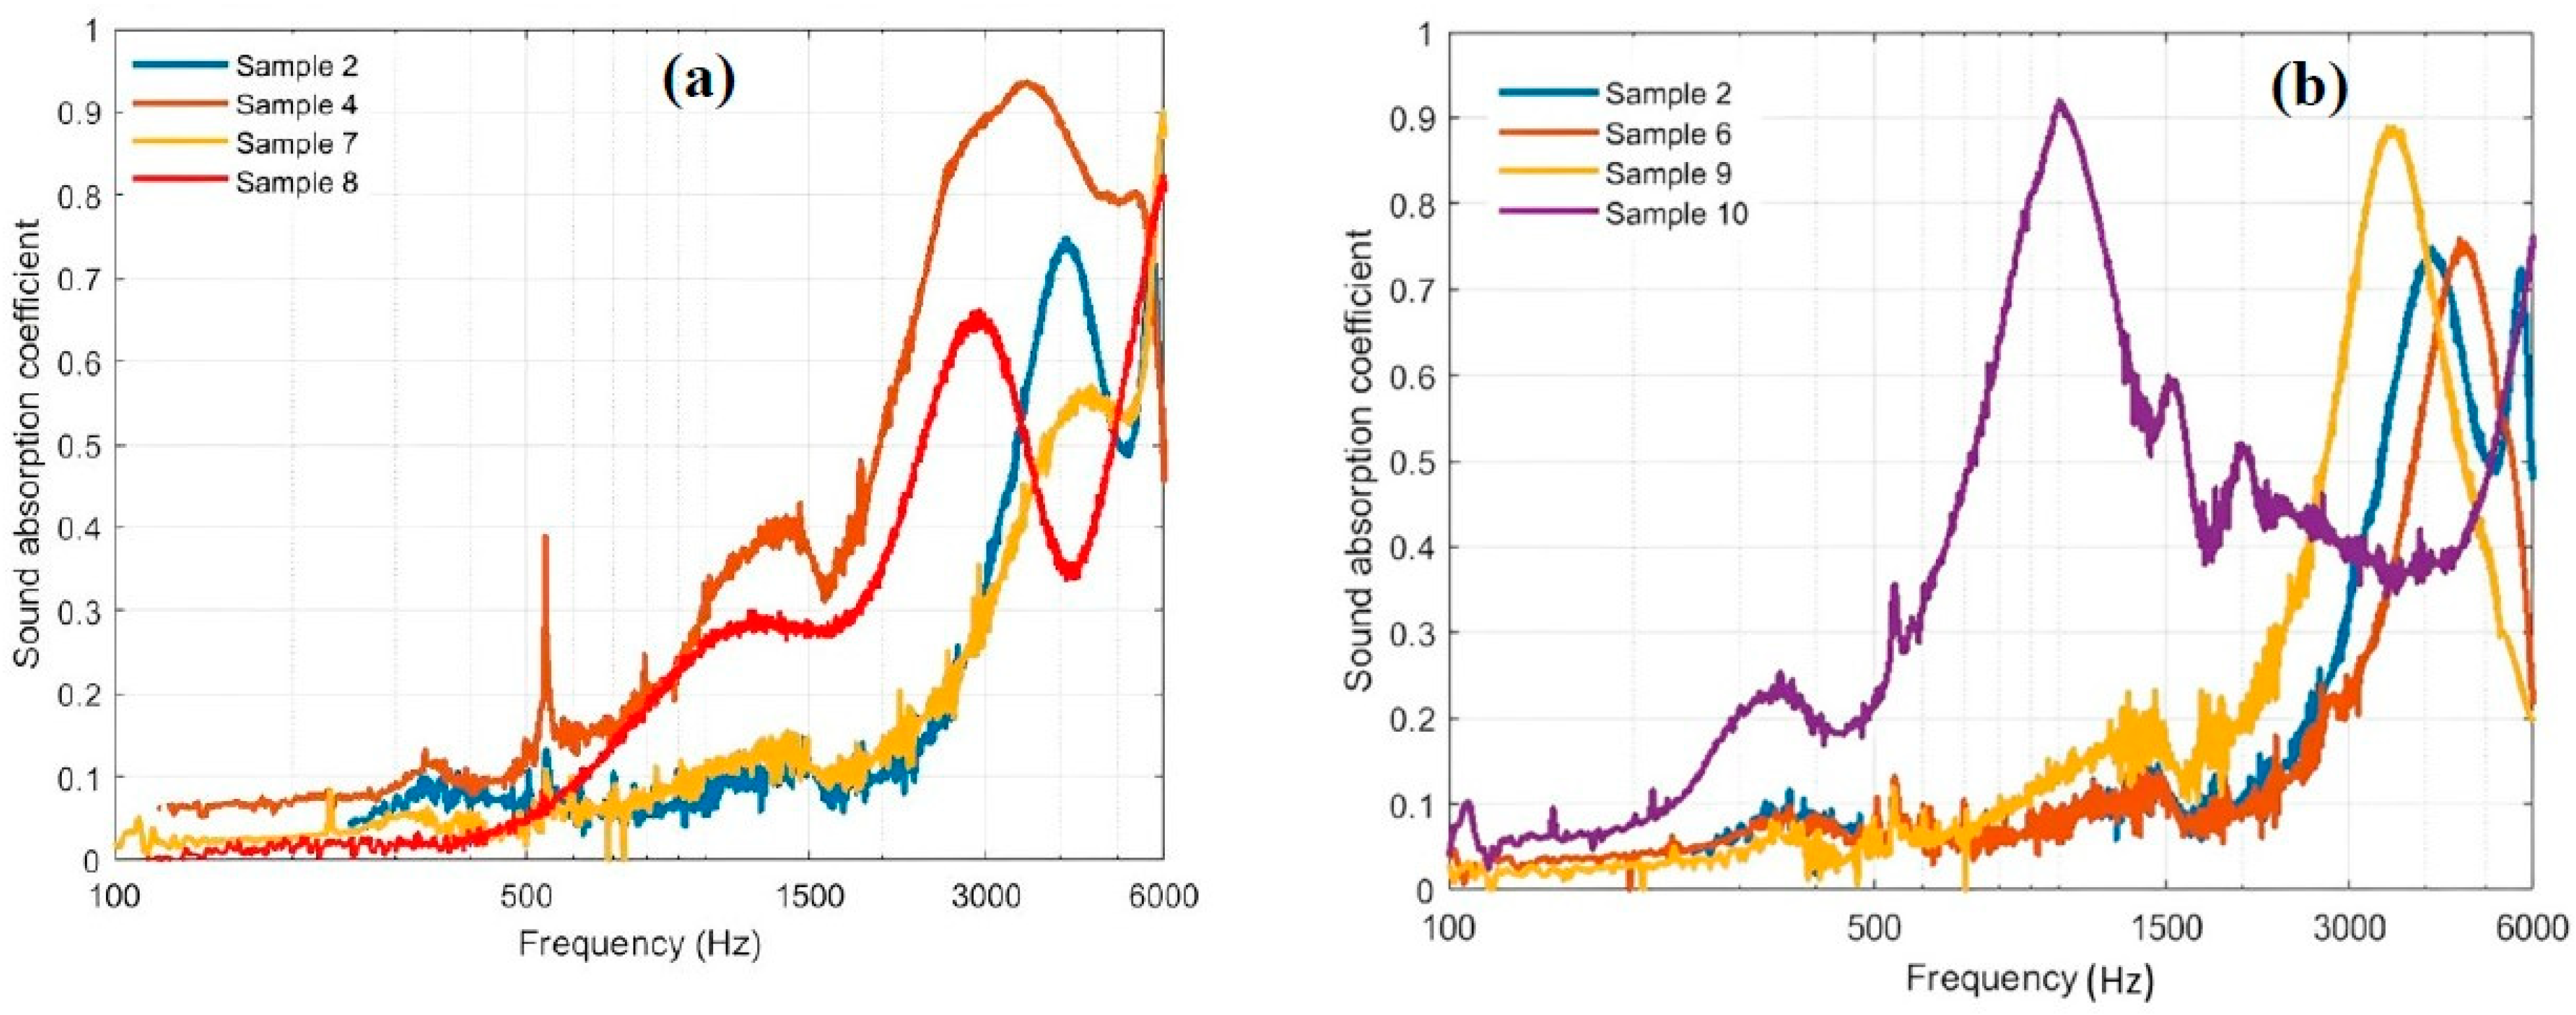
4.4. Sound Absorption Coefficient Determinations

Sound absorption coefficients (SACs) were measured for samples 2, 4, 6, 7, 8, 9, and 10 covering the whole frequency range up to 6000 Hz using the impedance tubes of 3 and 10 cm diameters as described in Section 3.4. Samples 2, 4, and 6 are for Bound PALF, SFSF, and WMS. Samples 7, 8, 9, and 10 are for the hybrid ones. Figure 19a presents the SACs for samples 2, 4, 7, and 8, which involve bound PALF and SFSF and their hybrids. The SAC for sample 2 is greater than 0.5 for a frequency greater than 3500 Hz with two bell shaped maximums at 4000 Hz and 5600 Hz, where the SACs are 0.73 and 0.66, respectively. Sample number 4 has a better SAC above 0.8 for a frequency range of 2500 to 5500 Hz. Sample number 7 has an SAC greater than 0.5 for a frequency greater than 4000 Hz and reaches 0.9 at 6000 Hz. Sample number 8 has an SAC greater than 0.5 for a frequency range of 2500 Hz to 3500 Hz and values greater than 5000 Hz. Figure 19b shows the profiles for the SACs for samples 2, 6, 9, and 10, which present the bound samples of PALF and WMS and their hybrids, respectively. Sample number 6 has an SAC greater than 0.5 for a frequency range of 3800 Hz to 5500 Hz with a peak of 0.74 at 4750 Hz. Sample 9 has a better SAC greater than 0.5 at a frequency range of about 2800 Hz to 4800 Hz with a peak of ≈0.9 at about 3500 Hz. On the other hand, sample number 10 has a good SAC at a low frequency range of about 750 Hz to 1500 Hz with a peak of about 0.9 at 1000 Hz. This figure ensures that the bound sample # 4 gives a better SAC for a wider frequency range than the hybrid ones as shown in Figure 19a. On the other hand, hybrid sample # 9 presents a better SAC than the other bound samples as shown in Figure 19b. In general, most of the samples show a good ability to absorb the sound waves and therefore could be used as sound absorption materials for buildings and other applications. It should be noted that the presence of air passages in the samples help absorb an echo, which in turn gives a higher SAC. This could be attributed to the fact that some samples have a better SAC than others, which is based on the structure rigidity of the sample, which in turn depends on the amount of polymerized binder in the sample. Table 7 shows the noise reduction (NRC) coefficient, which was calculated by using the mean value from four 1/3 octave values of the SAC (250 Hz, 500 Hz, 1000 Hz, and 2000 Hz). The result is rounded to the nearest 0.05 [28,46]. Table 7 also compares the NRC of the current boards with some similar boards and fibers in the literature using the same technique. It should be mentioned that the NRC depends on the material type, density, thickness, and porosity. It is noted that the NRC decreases as the density of the board increases, which means more reflection than absorption [28,47].

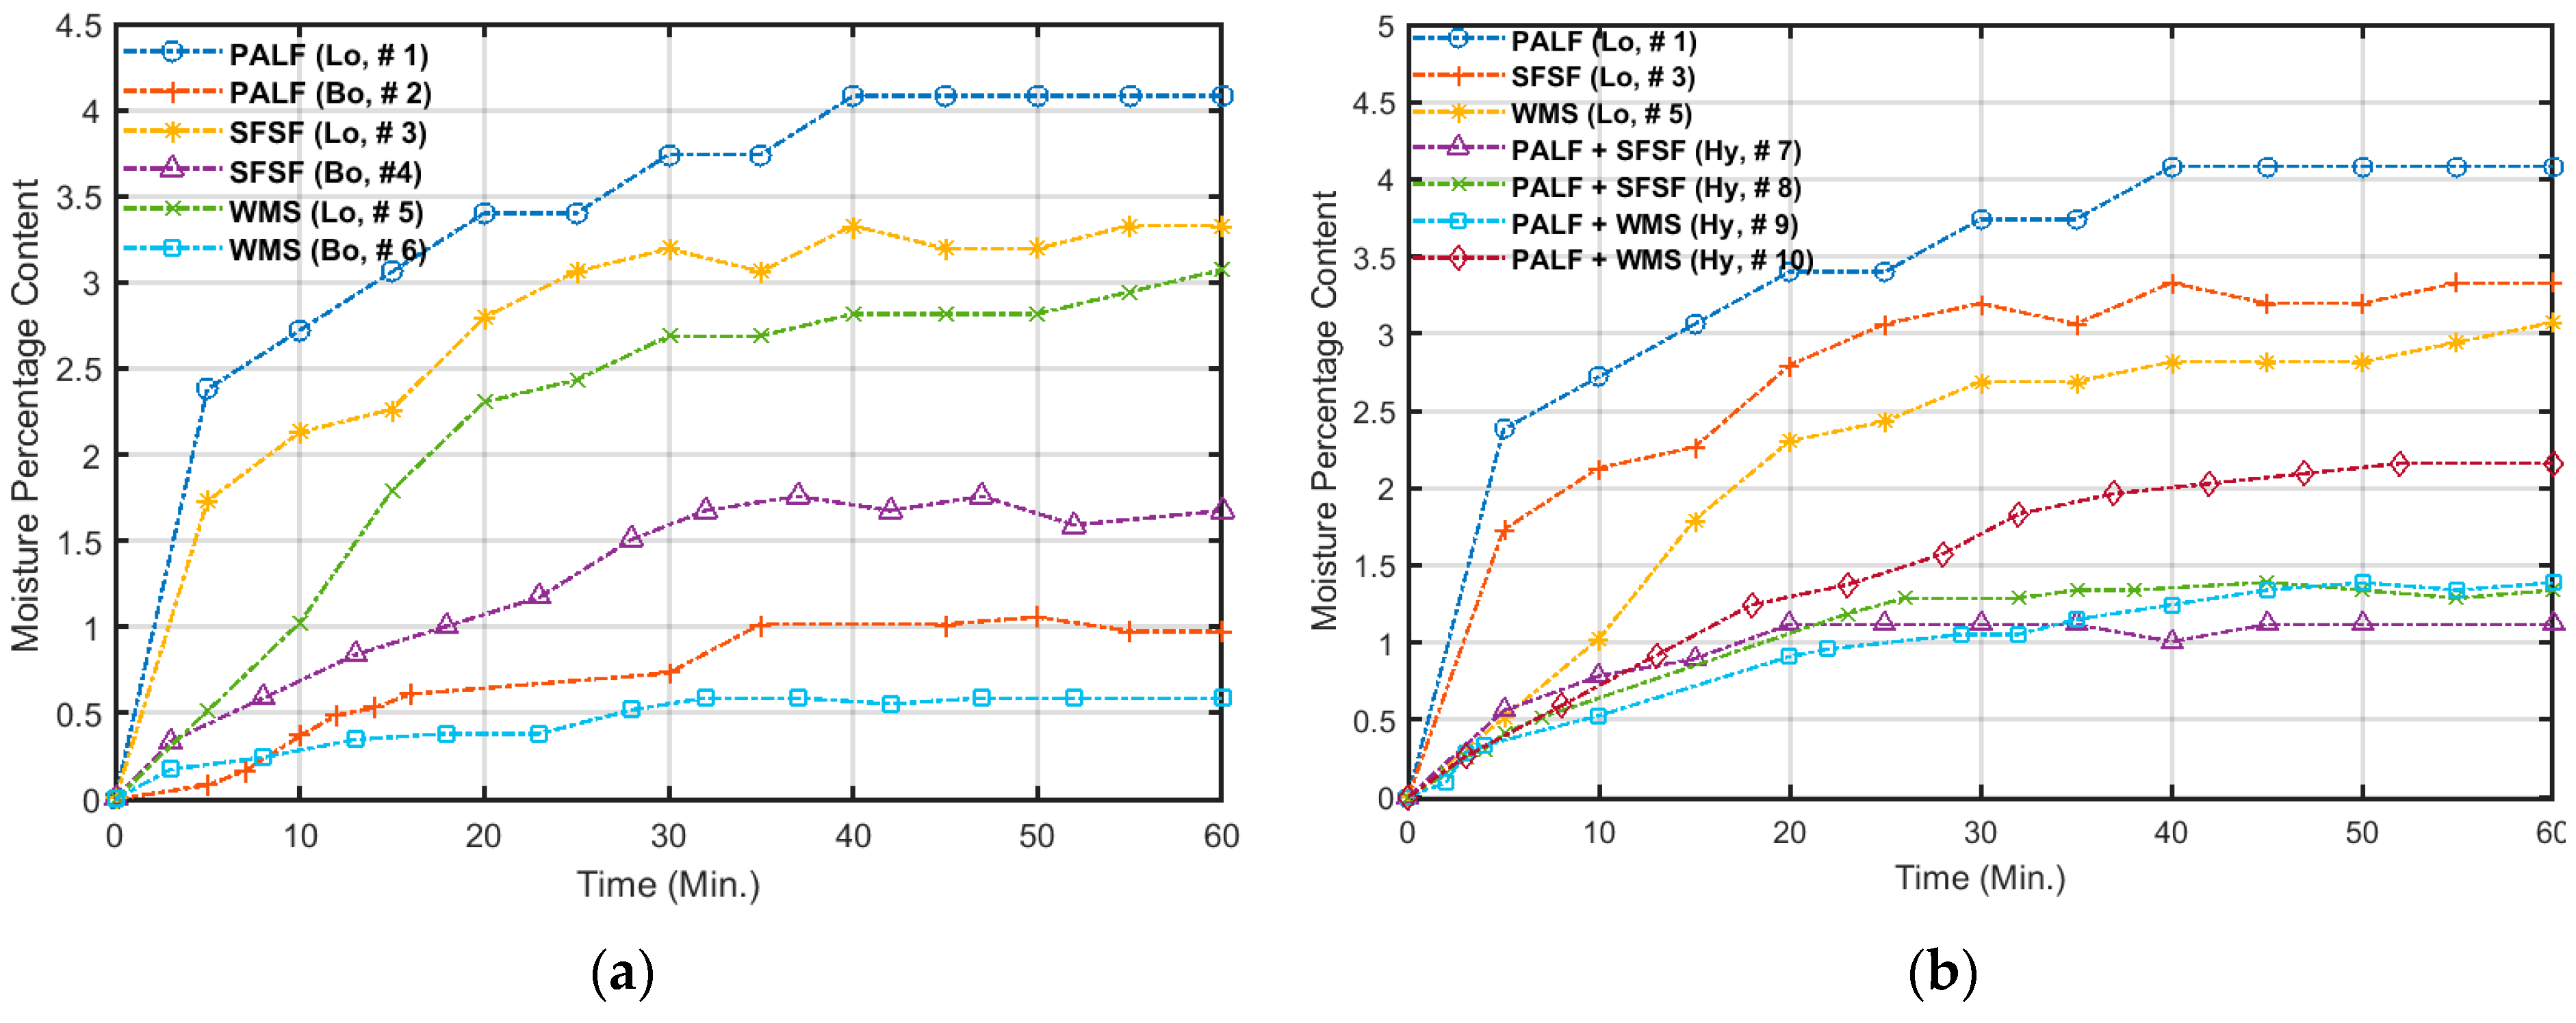
4.5. Moisture Content

The moisture content profiles for the loose and bound samples as a group are shown in Figure 20a,b for loose and hybrid samples as another group. The test was performed as described in Section 3.5 at the laboratory conditions of t = 21.6 °C, RH = 51.7. Figure 20a indicates that the maximum moisture content was observed by the loose samples followed by the bound samples. The moisture content for the loose samples is in the range of 3.1–4.1% and that of the bound samples is in the range of 0.6–1.7%. On the other hand, the moisture content for the hybrid samples is in the range of 1.1–2.2% as shown in Figure 20b. It is clear that as the samples become bound or hybrid, their ability to absorb water decreases because most of the pores (voids and spaces) are already filled by the polymerized binder. These low percentages of moisture content allow these new materials to be used as thermal insulation materials because the thermal conductivity coefficient is moisture-dependent and deteriorates as the moisture content increases. It should be noted that Bainbridge [50] has shown for a similar natural fiber (straw bale) that a 16% moisture content is safe.

5. Conclusions

New novel thermal insulation and sound absorption materials were developed and tested using the wasted pineapple leaf fiber (PALF), striped sunflower seed fiber (SFSF), and watermelon seed (WMS) as the raw materials. The new loose PALF, SFSF, and WMS have thermal conductivity coefficients of 0.04256, 0.04995, and 0.05284 W/m.K at an ambient temperature of about 24 °C. We learned that adding PALF to both SFSF and WMS in a large hybrid composition enhances the thermal conductivity coefficient more than the bound ones. The SFSF and the WMS are thermally stable at higher temperatures of 261 °C and 270 °C. Most hybrid and bound samples show a high sound absorption coefficient greater than 0.5 at a high frequency. However, sample # 10 shows a good acoustic characteristic at a low-frequency range of 750–1500 Hz. The bending moment tests for the bound and hybrid samples indicate that most of them have good mechanical characteristics. These conclusions ensure that the newly developed materials have a promising effect to be used as thermal and sound absorption materials for building and other applications and replace the thermal insulation materials produced from synthetic and petrochemicals. This will have a good environmental impact by removing huge amounts of waste while producing new natural, biodegradable, and ecofriendly thermal insulation and sound absorption materials.

Author Contributions

Conceptualization, Z.A.-S., R.A. and K.A.-S.; Methodology, M.A., Z.A.-S., R.A., K.A.-S., A.N., F.A., M.A.-H., A.A. and I.A.; Validation, M.A., Z.A.-S., R.A., K.A.-S. and A.N.; Formal analysis, M.A., K.A.-S., A.N., F.A., M.A.-H., A.A. and I.A.; Investigation, R.A. and A.N.; Resources, Z.A.-S.; Writing—original draft, M.A.; Supervision, M.A. and Z.A.-S.; Project administration, M.A.; Funding acquisition, M.A. All authors have read and agreed to the published version of the manuscript.

Funding

This research was funded by the Deputyship for Research & Innovation, Ministry of Education in Saudi Arabia (No. IFKSUOR3–422–1).

Institutional Review Board Statement

Not applicable.

Data Availability Statement

Data will be available upon request.

Acknowledgments

The authors extend their appreciation to the Deputyship for Research & Innovation, Ministry of Education in Saudi Arabia for funding this research work through the project No. IFKSUOR3–422–1.

Conflicts of Interest

The authors declare no conflict of interest.

Nomenclatures

BoBound
DSCDifferential Scanning Calorimetry
DTGADifferential thermogravimetric analysis
HyHybrid
LoLoose
KThermal conductivity coefficient
NRCNoise reduction coefficient
PALFPineapple leaf fiber
RHRelative humidity
SACSound absorption coefficient
SFSSunflower seed
SFSFSunflower seed fiber
TGAThermogravimetric analysis
WMSWatermelon seed

References

  1. Malina, R.; McConnachie, D.; Winchester, N.; Wollersheim, C.; Paltsev, S.; Waitz, I. The impact of the European Union Emissions Trading Scheme on US aviation. J. Air Transp. Manag. 2012, 19, 36–41. [Google Scholar] [CrossRef]
  2. Rangappa, S.M.; Siengchin, S. Natural fibers as perspective materials. Appl. Sci. Eng. Prog. 2018, 11, 233. [Google Scholar] [CrossRef]
  3. Sangmesh, B.; Patil, N.; Jaiswal, K.K.; Gowrishankar, T.P.; Selvakumar, K.K.; Jyothi, M.S.; Jyothilakshmi, R.; Kumar, S. Development of sustainable alternative materials for the construction of green buildings using agricultural residues: A review. Constr. Build. Mater. 2023, 368, 130457. [Google Scholar]
  4. Silva, G.; Kim, S.; Aguilar, R.; Nakamatsu, J. Natural fibers as reinforcement additives for geopolymers—A review of potential eco-friendly applications to the construction industry. Sustain. Mater. Technol. 2020, 23, e00132. [Google Scholar] [CrossRef]
  5. Saudi and Middle East Green Initiatives. Available online: https://www.greeninitiatives.gov.sa/ar-sa/about-mgi/mgi-targets/planting-trees/plant-trees-across-the-middle-east/ (accessed on 9 February 2023).
  6. Buckle, K. Biotechnology opportunities in waste treatment and utilisation for the food industry. In Biotechnology and the Food Industry; Benthame Electronic Books: Sharjah, United Arab Emirates, 1989; pp. 261–277. [Google Scholar]
  7. Tangjuank, S. Thermal insulation and physical properties of particleboards from pineapple leaves. Int. J. Phys. Sci. 2011, 6, 4528–4532. [Google Scholar]
  8. Kumfu, S.; Jintakosol, T. Thermal Insulation Produced from Pineapple Leaf and Natural Rubber Latex. Adv. Mater. Res. 2012, 506, 453–456. [Google Scholar] [CrossRef]
  9. Thilagavathi, G.; Muthukumar, N.; Neela Krishnanan, S.; Senthilram, T. Development and Characterization of Pineapple Fibre Nonwovens for Thermal and Sound Insulation Applications. J. Nat. Fibers 2020, 17, 1391–1400. [Google Scholar] [CrossRef]
  10. Do, N.H.; Tran, V.T.; Tran, Q.B.; Le, K.A.; Thai, Q.B.; Nguyen, P.T.; Duong, H.M.; Le, P.K. Recycling of Pineapple Leaf and Cotton Waste Fibers into Heat-insulating and Flexible Cellulose Aerogel Composites. J. Polym. Environ. 2021, 29, 1112–1121. [Google Scholar] [CrossRef]
  11. Flagella, Z.; Monteleone, M. Perspectives on sunflower as an energy crop. In Energy Crops; Halford, G., Karp, A., Eds.; RSC Energy and Environment, Series No. 3; Royal Society of Chemistry: Cambridge, UK, 2011; Chapter 9. [Google Scholar]
  12. de Carvalho, P.S.; Dalla Nora, M.; da Rosa, L.C. Development of an acoustic absorbing material based on sunflower residue following the cleaner production techniques. J. Clean. Prod. 2020, 270, 122478. [Google Scholar] [CrossRef]
  13. Georgiev, A.; Yoleva, A.; Djambazov, S. Effect of wheat straw and sunflower seeds husks as pore forming agents on the properties of porous clay bricks. J. Chem. Technol. Met. 2017, 52, 885–891. [Google Scholar]
  14. Binici, H.; Eken, M.; Kara, M.; Dolaz, M. An environment-friendly thermal insulation material from sunflower stalk, textile waste and stubble fibers. In Proceedings of the 2013 International Conference on Renewable Energy Research and Applications (ICRERA), Madrid, Spain, 20–23 October 2013. [Google Scholar]
  15. Darvishi, H.; Zarein, M. Thermal Conductivity of Sunflower Seed as a Function of Moisture Content and Bulk Density. World Appl. Sci. J. 2012, 18, 1321–1325. [Google Scholar] [CrossRef]
  16. Binici, H.; Aksogana, O.; Dıncerc, A.; Lugad, E.; Ekene, M.; Isikaltunf, O. The possibility of vermiculite, sunflower stalk and wheat stalk using for thermal insulation material production. Therm. Sci. Eng. Prog. 2020, 18, 100567. [Google Scholar] [CrossRef]
  17. FAOSTAT. Food and Agriculture Data. Food and Agriculture Organization of the United Nations, Statistics Division. Available online: http://www.fao.org/faostat/en/#home (accessed on 25 October 2017).
  18. Odewunmi, N.A.; Umoren, S.A.; Gasem, Z.M. Watermelonwaste products as green corrosion inhibitors for mild steel in HCl solution. J. Environ. Chem. Eng. 2015, 3, 286–296. [Google Scholar] [CrossRef]
  19. Bharath, K.N.; Basavarajappa, S. Applications of biocomposite materials based on natural fibers from renewable resources: A review. Sci. Eng. Compos. Mater. 2016, 23, 123–133. [Google Scholar] [CrossRef]
  20. Sanjay, M.; Arpitha, G.R.; Naik, L.L.; Gopalakrishna, K.; Yogesha, B.J.N.R. Applications of natural fibers and its composites: An overview. Nat. Resour. 2016, 7, 108–114. [Google Scholar] [CrossRef]
  21. Sen, T.; Reddy, H.J. Various industrial applications of hemp, kinaf, flax and ramie natural fibres. Int. J. Innov. Manag. Technol. 2011, 2, 192. [Google Scholar]
  22. Ali, M.; Alabdulkarem, A.; Nuhait, A.; Al-Salem, K.; Iannace, G.; Almuzaiqer, R.; Al-Turki, A.; Al-Ajlan, F.; Al-Mosabi, Y.; Al-Sulaimi, A. Thermal and acoustic characteristics of novel thermal insulating materials made of Eucalyptus Globulus leaves and wheat straw fibers. J. Build. Eng. 2020, 32, 101452. [Google Scholar] [CrossRef]
  23. Ali, M.; Alabdulkarem, A.; Nuhait, A.; Al-Salem, K.; Almuzaiqer, R.; Bayaquob, O.; Salah, H.; Alsaggaf, A.; Algafri, Z. Thermal analyses of loose agave, wheat straw fibers and agave/wheat straw as new hybrid thermal insulating materials for buildings. J. Nat. Fibers 2021, 18, 2173–2188. [Google Scholar] [CrossRef]
  24. Arenas, J.P.; Crocker, M.J. Recent trends in porous sound-absorbing materials. Sound Vib. 2010, 44, 12–18. [Google Scholar]
  25. Alabdulkarem, A.; Ali, M.; Iannace, G.; Sadek, S.; Almuzaiqer, R. Thermal analysis, microstructure and acoustic characteristics of some hybrid natural insulating materials. Constr. Build. Mater. 2018, 187, 185–196. [Google Scholar] [CrossRef]
  26. Ali, M.E.; Alabdulkarem, A. On thermal characteristics and microstructure of a new insulation material extracted from date palm trees surface fibers. Constr. Build. Mater. 2017, 138, 276–284. [Google Scholar] [CrossRef]
  27. Fouladi, M.H.; Nassir, M.H.; Ghassem, M.; Shamel, M.; Peng, S.Y.; Wen, S.Y.; Xin, P.Z.; Nor, M.J.M. Utilizing Malaysian natural fibers as sound absorber. In Modeling and Measurement Methods for Acoustic Waves and for Acoustic Microdevices; Electronic Books; Intech Open: London, UK, 2013; pp. 161–170. [Google Scholar]
  28. Berardi, U.; Iannace, G. Acoustic characterization of natural fibers for sound absorption applications. Build. Environ. 2015, 94, 840–852. [Google Scholar] [CrossRef]
  29. Available online: https://www.gulfindustrialgroup.com/saaf/wp-content/uploads/2016/08/WOOD-ADHESIVE-78-1040-MSDS.pdf (accessed on 1 October 2023).
  30. ASTM D2196; Standard Test Methods for Rheological Properties of Non-Newtonian Materials by Rotational Viscometer. ASTM International: West Conshohocken, PA, USA, 2020.
  31. ASTM D1172; Standard Guide for pH of Aqueous Solutions of Soaps and Detergents. ASTM International: West Conshohocken, PA, USA, 2015.
  32. ASTM D1644; Standard Test Methods for Nonvolatile Content of Varnishes. ASTM International: West Conshohocken, PA, USA, 2017.
  33. ASTM D790-03;A; Standard Test Methods for Flexural Properties of Unreinforced and Reinforced Plastics and Electrical Insulating Materials. ASTM International: West Conshohocken, PA, USA, 2003. Available online: www.astm.org (accessed on 1 October 2023).
  34. ASTM E1131-08; Standard Test Method for Compositional Analysis by Thermogravimetry. ASTM International: West Conshohocken, PA, USA, 2008.
  35. ASTM D3418; Standard Test Method for Transition Temperatures of Polymers by Differential Scanning Calorimetry. ASTM International: West Conshohocken, PA, USA, 2008.
  36. ASTM-C518; Standard Test Method for Steady-State Thermal Transmission Properties by Means of the Heat Flow Meter Apparatus (C 518). American Society of Testing and Materials (ASTM): West Conshohocken, PA, USA, 2010; pp. 152–166.
  37. Ali, M.; Almuzaiqer, R.; Al-Salem, K.; Alabdulkarem, A.; Nuhait, A. New novel thermal insulation and sound-absorbing materials from discarded facemasks of COVID-19 pandemic. Sci. Rep. 2021, 11, 23240. [Google Scholar] [CrossRef] [PubMed]
  38. ISO 10534-1, A; Determination of Sound Absorption Coefficient and Impedance in Impedance Tubes—Part 1: Method Using Standing Wave Ratio. International Organization for Standardization: Geneva, Switzerland, 1996.
  39. ISO 10534-2, A; Determination of Sound Absorption Coefficient and Impedance in Impedance Tubes—Part 2: Transfer-function Method. International Organization for Standardization: Geneva, Switzerland, 1998.
  40. ASTM D2974—07A ASTM D2974-07; Standard Test Methods for Moisture, Ash, and Organic Matter of Peat and Other Organic Soils. ASTM International: West Conshohocken, PA, USA, 2007.
  41. RILEM-TC. Test for the determination of modulus of rupture and limit of proportionality of thin fibre reinforced cement sections. In RILEM Recommendations for the Testing and Use of Constructions Materials; RILEM, Ed.; E & F SPON: London, UK, 1984; pp. 161–163. ISBN 2351580117. [Google Scholar]
  42. Moffat, R.J. Describing uncertainties in experimental results. Exp. Therm. Fluid Sci. 1988, 1, 3–7. [Google Scholar] [CrossRef]
  43. Asdrubali, F.; D’Alessandr, F.; Schiavoni, S. A review of unconventional sustainable building insulation materials. Sustain Mater Technol. 2015, 4, 1–17. [Google Scholar] [CrossRef]
  44. Korjenic, A.; Petranek, V.; Zach, J.; Hroudova, J. Development and performance evaluation of natural thermal-insulation materials composed of renewable resources. Energy Build. 2011, 43, 2518–2523. [Google Scholar] [CrossRef]
  45. Manohar, K.; Ramlakhan, D.; Kochhar, G.; Haldar, S. Biodegradable fibrous thermal insulation. J. Braz. Soc. Mech. Sci. Eng. 2006, 28, 45–47. [Google Scholar] [CrossRef]
  46. Danihelova, A.; Nemec, M.; Gergel, T.; Gejdos, M.; Gordanova, J.; Scensny, P. Usage of Recycled Technical Textiles as Thermal Insulation and an Acoustic Absorber. Sustainability 2019, 11, 2968. [Google Scholar] [CrossRef]
  47. Nandanwar, A.; Kiran, M.C.; Varadarajulu, K.C. Influence of Density on Sound Absorption Coefficient of Fiber Board. Open J. Acoust. 2017, 7, 1–9. [Google Scholar] [CrossRef]
  48. Na, Y.; Lancaster, J.; Casali, J.; Cho, G. Sound Absorption Coefficients of Micro-fiber Fabrics by Reverberation Room Method. Text. Res. J. 2007, 77, 330–335. [Google Scholar] [CrossRef]
  49. Shahid, N.S.M.; Ahmad, M.A.; Tahir, F.L. Sound Absorption Coefficient of Different Green Materials Polymer on Noise Redction. Int. J. Innov. Tech. Explor. Eng. 2020, 9, 2773–2777. [Google Scholar] [CrossRef]
  50. Bainbridge, D.A. High performance low cost buildings of straw. Agric. Ecosyst. Environ. 1986, 16, 281–284. [Google Scholar] [CrossRef]
Figure 1. Preparation of pineapple leaf fiber; (a) crown leaves, (b) blender used for grinding the crown leaves, and (c) pineapple leaf fiber (PALF) (loose sample # 1).
Polymers 15 04422 g001
Figure 2. Extraction of sunflower seed hulls; (a) sunflower seeds and (b) ground hulls (loose sample # 3).
Polymers 15 04422 g002
Figure 3. Extraction of watermelon seeds; (a) watermelon, (b) extracted seeds, and (c) seed shells (loose sample # 5).
Polymers 15 04422 g003
Figure 4. Preparing the samples for thermal conductivity measurements. (a) mixing materials with the binder in the mold, (b) pressing the material, (c) drying oven, (d) extracting drying sample, and (e) heat flow meter for thermal conductivity measurements.
Polymers 15 04422 g004
Figure 5. Laboratory-prepared samples with size 30 × 30 cm2 and with different thicknesses (a) bound PALF sample # 2, (b) bound SFSF sample # 4, (c) bound WMS sample # 6, (d) hybrid of PALF and SFSF sample # 7, (e) hybrid of PALF and SFSF sample # 8, (f) hybrid of PALF and WMS sample # 9, (g) hybrid of PALF and WMS sample # 10, and (h) sunflower seed fiber (SFSF) bound sample with high binder ratio # 11 (see Table 2 for more details).
Polymers 15 04422 g005
Figure 6. Bending specimen dimensions (a) and (b) the universal testing machine (UTM, INSTRON 5984) used to perform the bending moment test.
Polymers 15 04422 g006
Figure 7. Specimens used for sound absorption coefficient for 3 and 10 cm in diameter; their thickness are given in Table 2.
Polymers 15 04422 g007
Figure 8. Small pieces used for the moisture content test.
Polymers 15 04422 g008
Figure 9. Bending parameters for bound and hybrid specimens of PALF and SFSF; (a) load-deflection and (b) stress–strain curves.
Polymers 15 04422 g009
Figure 10. Comparison among E f , σ f , and ϵf for specimen numbers 2, 4, 7, and 8 for bound and hybrid between PALF and SNSF.
Polymers 15 04422 g010
Figure 11. Bending parameters for bound and hybrid specimens of PALF and WMS; (a) load-deflection and (b) stress–strain curves.
Polymers 15 04422 g011
Figure 12. Comparison among E f , σ f , and ϵf for specimen numbers 2, 6, and 10 for bound and hybrid between PALF and WMS.
Polymers 15 04422 g012
Figure 13. Thermogravimetric analyses for both sunflower and brown seeds; (a) TGA profiles and (b) derivative thermogravimetric analyses (DTGAs).
Polymers 15 04422 g013
Figure 14. The Differential Scanning Calorimetry (DSC) analysis for both the sunflower (SF) and the watermelon (WM) seeds.
Polymers 15 04422 g014
Figure 15. Thermal conductivity coefficients for loose and bound samples of PALF, SFSF, and WMS; solid lines present the curve fitting through the data.
Polymers 15 04422 g015
Figure 16. Comparison between the thermal conductivity coefficients for loose, bound, and hybrid samples; solid lines present the curve fitting through the data. (a) PALF and SFSF and (b) PALF and WMS.
Polymers 15 04422 g016
Figure 17. The effect of the binder ratio on the thermal conductivity coefficient profiles.
Polymers 15 04422 g017
Figure 18. Thermal conductivity coefficient profiles at different temperatures versus the density of the samples. (a) Loose and bound single-material samples. (b) Hybrid samples of PALF and SFSF. (c) Hybrid samples of PALF and WMS.
Polymers 15 04422 g018
Figure 19. Sound absorption coefficient profiles for (a) bound and hybrid samples of PALF and SFSF and (b) bound and hybrid samples of PALF and WMS.
Polymers 15 04422 g019
Figure 20. Percentage of moisture content in (a) loose and bound samples and (b) loose and hybrid samples.
Polymers 15 04422 g020
Table 1. Technical data of wood adhesive (78–1040) as provided by the manufacturer [29].
Ingredients
NameCase No.Content %
Polyvinyl Acetate9003-20-777–85
Water1132-18-585–10
Dibutyl phthalate (DBP)84-74-21–3
Calcium Carbonate1317-65-310–20
Physical and chemical properties
Base materialPolyvinyl AcetateCoverage (Approx.)4–5 m3/kg, depending on the surfaces
ColorMilky whiteApplication temperature5–50 °C
Viscosity at 25 °C, ASTM D2196 [30]25,000–34,000 CPS
(Sp.# 7 at 20 rpm)
Drying time30 min to approx. 1 h (depends on the thickness of the adhesive layer, kind of wood, and climatic conditions)
Density1.10–1.5 g/cm3Open time1–5 min (depends on climatic conditions)
PH, ASTM D1172 [31]6.5–8Full cure24 h (depending on climatic conditions)
Solid contents, ASTM D1644 [32]51–56%Pressing time1–2 h (depending on climatic conditions and wood type)
Table 2. Matrix of the loose (Lo), bound (Bo), and hybrid (Hy) samples used in this study (PALF, SFSF, and WMS stand for pineapple leaf fiber, sunflower seed fiber, and watermelon seed, respectively). Wood adhesive was used as a binder for bound and hybrid samples.
MaterialSample Number
Lo
(# 1)
Bo
(# 2)
Lo
(# 3)
Bo
(# 4)
Lo
(# 5)
Bo
(# 6)
Hy
(# 7)
Hy
(# 8)
Hy
(# 9)
Hy
(# 10)
Bo
(# 11)
PALF %100870.00.00.00.042.017.033.017.00.0
SFSF %0.00.0100690.00.042.055.00.00.046.0
WMS%0.0000.00.010069.00.00.033.052.00.0
The ratio of the polymerized binder to the total mass %0.0130.0310.031.016.028.034.031.054.0
Thickness, H (mm)21.013.021.021.021.011.021.022.011.026.018.0
Figure #Figure 1cFigure 5aFigure 2bFigure 5bFigure 3bFigure 5cFigure 5dFigure 5eFigure 5fFigure 5gFigure 5h
Density of dried specimen (kg/m3)76.5329148248235472247299478256432
Total dried mass (g)106370210469333467475592486600700
Table 3. Dimensions and definitions of the parameters used in Equation (1).
Sample No.Thickness d, (mm)Width b, (mm)Span, L (mm)Slope (S) (N/mm)
213.049.51506.39
421.054.01509.20
611.048.01507.85
721.052.01504.51
822.049.015031.13
1026.048.01501.98
Table 4. Important parameters for the three-point bending test for the specimens listed in Table 3.
Sample No.Slope (N/mm), SFlexure Modulus (MPa), EfFlexural Stress (MPa), σfFlexural Strain at Flexural Strength, ϵf
26.3944.300.640.013
49.2022.330.380.019
67.85103.651.370.017
74.518.650.230.037
831.1360.811.090.032
101.982.540.100.046
Table 5. Coefficients for linear regressions for all samples.
Figure #ABR2, %
Sample 1, ●Figure 150.0380.000299.6
Sample 2, ○Figure 150.0490.000399.9
Sample 3, ■Figure 150.0450.000298.9
Sample 4, □Figure 150.0540.000399.7
Sample 5, ▲Figure 150.0470.000298.0
Sample 6, ΔFigure 150.0580.000599.7
Sample 7, *Figure 16a0.0490.0002100.0
Sample 8, ♦Figure 16a0.0540.000399.8
Sample 9, ♦Figure 16b0.0490.000399.95
Sample 10, ⁎Figure 16b0.0550.000399.6
Table 6. Comparison of the average thermal conductivity values with those in the literature for some unconventional insulation materials.
Natural Raw MaterialsDensity (kg/m3)Thermal Conductivity (W/(m.K)References
Bo PALF (#2)3290.0541–0.0721Current
Bo SFSF (#4)2480.0617–0.0801Current
Bo WMS (#6)4720.0669–0.0982Current
Hy (#7)2470.0528–0.0652Current
Hy (#8)2990.0604–0.0772Current
Hy (#9)4780.0566–0.0755Current
Hy (#10)2560.0616–0.0795Current
Bound Eucalyptus globulus leaves153.00.0472–0.0599[22]
Bound wheat straw fibers130.00.0466–0.0569[22]
Hybrid of Eucalyptus globulus leaves + wheat straw fibers211.00.0460–0.0574[22]
Hybrid (date palm tree surface fibers + apple of Sodom fibers)114.0–233.00.0423–0.0529[25]
Date palm surface fibers176–2600.0475–0.0697[26]
Bagasse70–3500.0460–0.0550[43]
Straw bale50–1500.0380–0.0670[43]
Rice husk154–1680.0464–0.566[43]
Corn cob171–3340.101[43]
Jute26.10.0458[44]
Flax32.10.0429[44]
Technical hemp30.20.0486[44]
Coconut fiber40–900.0480–0.0576[45]
Rock wool40–2000.033–0.040[43]
Expanded polystyrene15–350.031–0.038[43]
Kenaf30–1800.034–0.043[43]
Table 7. Sound absorption coefficient (SAC), density, and noise reduction coefficient (NRC) for bound and hybrid samples.
Natural Fiber MaterialsDensity, kg/m3Thickness of Board or Fiber, mSound Absorption CoefficientsNRCReferences
Frequency, Hz
25050010002000
PALF (Bo, 2)3290.0130.050.070.050.100.05Current study
SFSF (Bo, 4)2480.0210.070.130.320.520.25Current study
WMS (Bo, 6)4720.0110.050.070.050.090.05Current study
(PALF + SFSF)
(Hy, 7)
2470.0210.030.050.110.130.10Current study
(PALF + SFSF)
(Hy, 8)
2990.0220.0070.050.250.350.15Current study
(PALF + WMS)
(Hy, 9)
4780.0110.030.060.130.210.10Current study
(PALF + WMS)
(Hy, 10)
2560.0260.120.210.910.520.45Current study
Kenaf (light)500.060.190.330.680.90.55[28]
Kenaf (dense)1000.040.180.320.700.940.55[28]
Wood (fibers)1000.040.400.500.650.910.60[28]
Wood (mineralized)2600.030.100.100.200.400.20[28]
Coconut600.04/0.060.20.340.670.790.50[28]
Cork1000.030.020.100.300.860.30[28]
Cane (only wooden)4000.040.060.120.470.430.25[28]
Fleece (100% polyester) fiber600.00350.080.120.190.210.15[48]
Queenscord fiber1600.00190.050.140.340.300.20[48]
Mesh fiber1000.00330.180.020.050.070.10[48]
Suede fiber3000.00060.090.130.240.280.20[48]
Wood fiberboard4800.0180.110.140.210.340.20[47]
Wood fiberboard3800.0250.160.170.310.330.25[47]
Wood fiberboard2400.0180.160.200.300.400.25[47]
Banana stem1000.010---0.050.100.420.15[49]
Grass480.010---0.060.150.440.20[49]
Palm oil leaves1520.010---0.050.080.190.10[49]
Lemongrass2010.010---0.060.150.450.20[49]
Disclaimer/Publisher’s Note: The statements, opinions and data contained in all publications are solely those of the individual author(s) and contributor(s) and not of MDPI and/or the editor(s). MDPI and/or the editor(s) disclaim responsibility for any injury to people or property resulting from any ideas, methods, instructions or products referred to in the content.

