
Polyvinyl Alcohol–Citric Acid: A New Material for Green and Efficient Removal of Cationic Dye Wastewater


Abstract
:1. Introduction
2. Materials and Methods
2.1. Materials
2.2. Synthesis of PVA–CA
2.3. Characterization
2.4. Adsorption Experiment
2.4.1. Determination of Methylene Blue Solution Standard Curve
2.4.2. Adsorption Performance Evaluation
2.4.3. Single-Factor Experiments
2.4.4. Recyclability of PVA–CA
2.5. Adsorption Kinetics
2.6. Adsorption Isotherm
2.7. Adsorption Thermodynamics
2.8. Computational Methods
3. Results and Discussion
3.1. Characterization
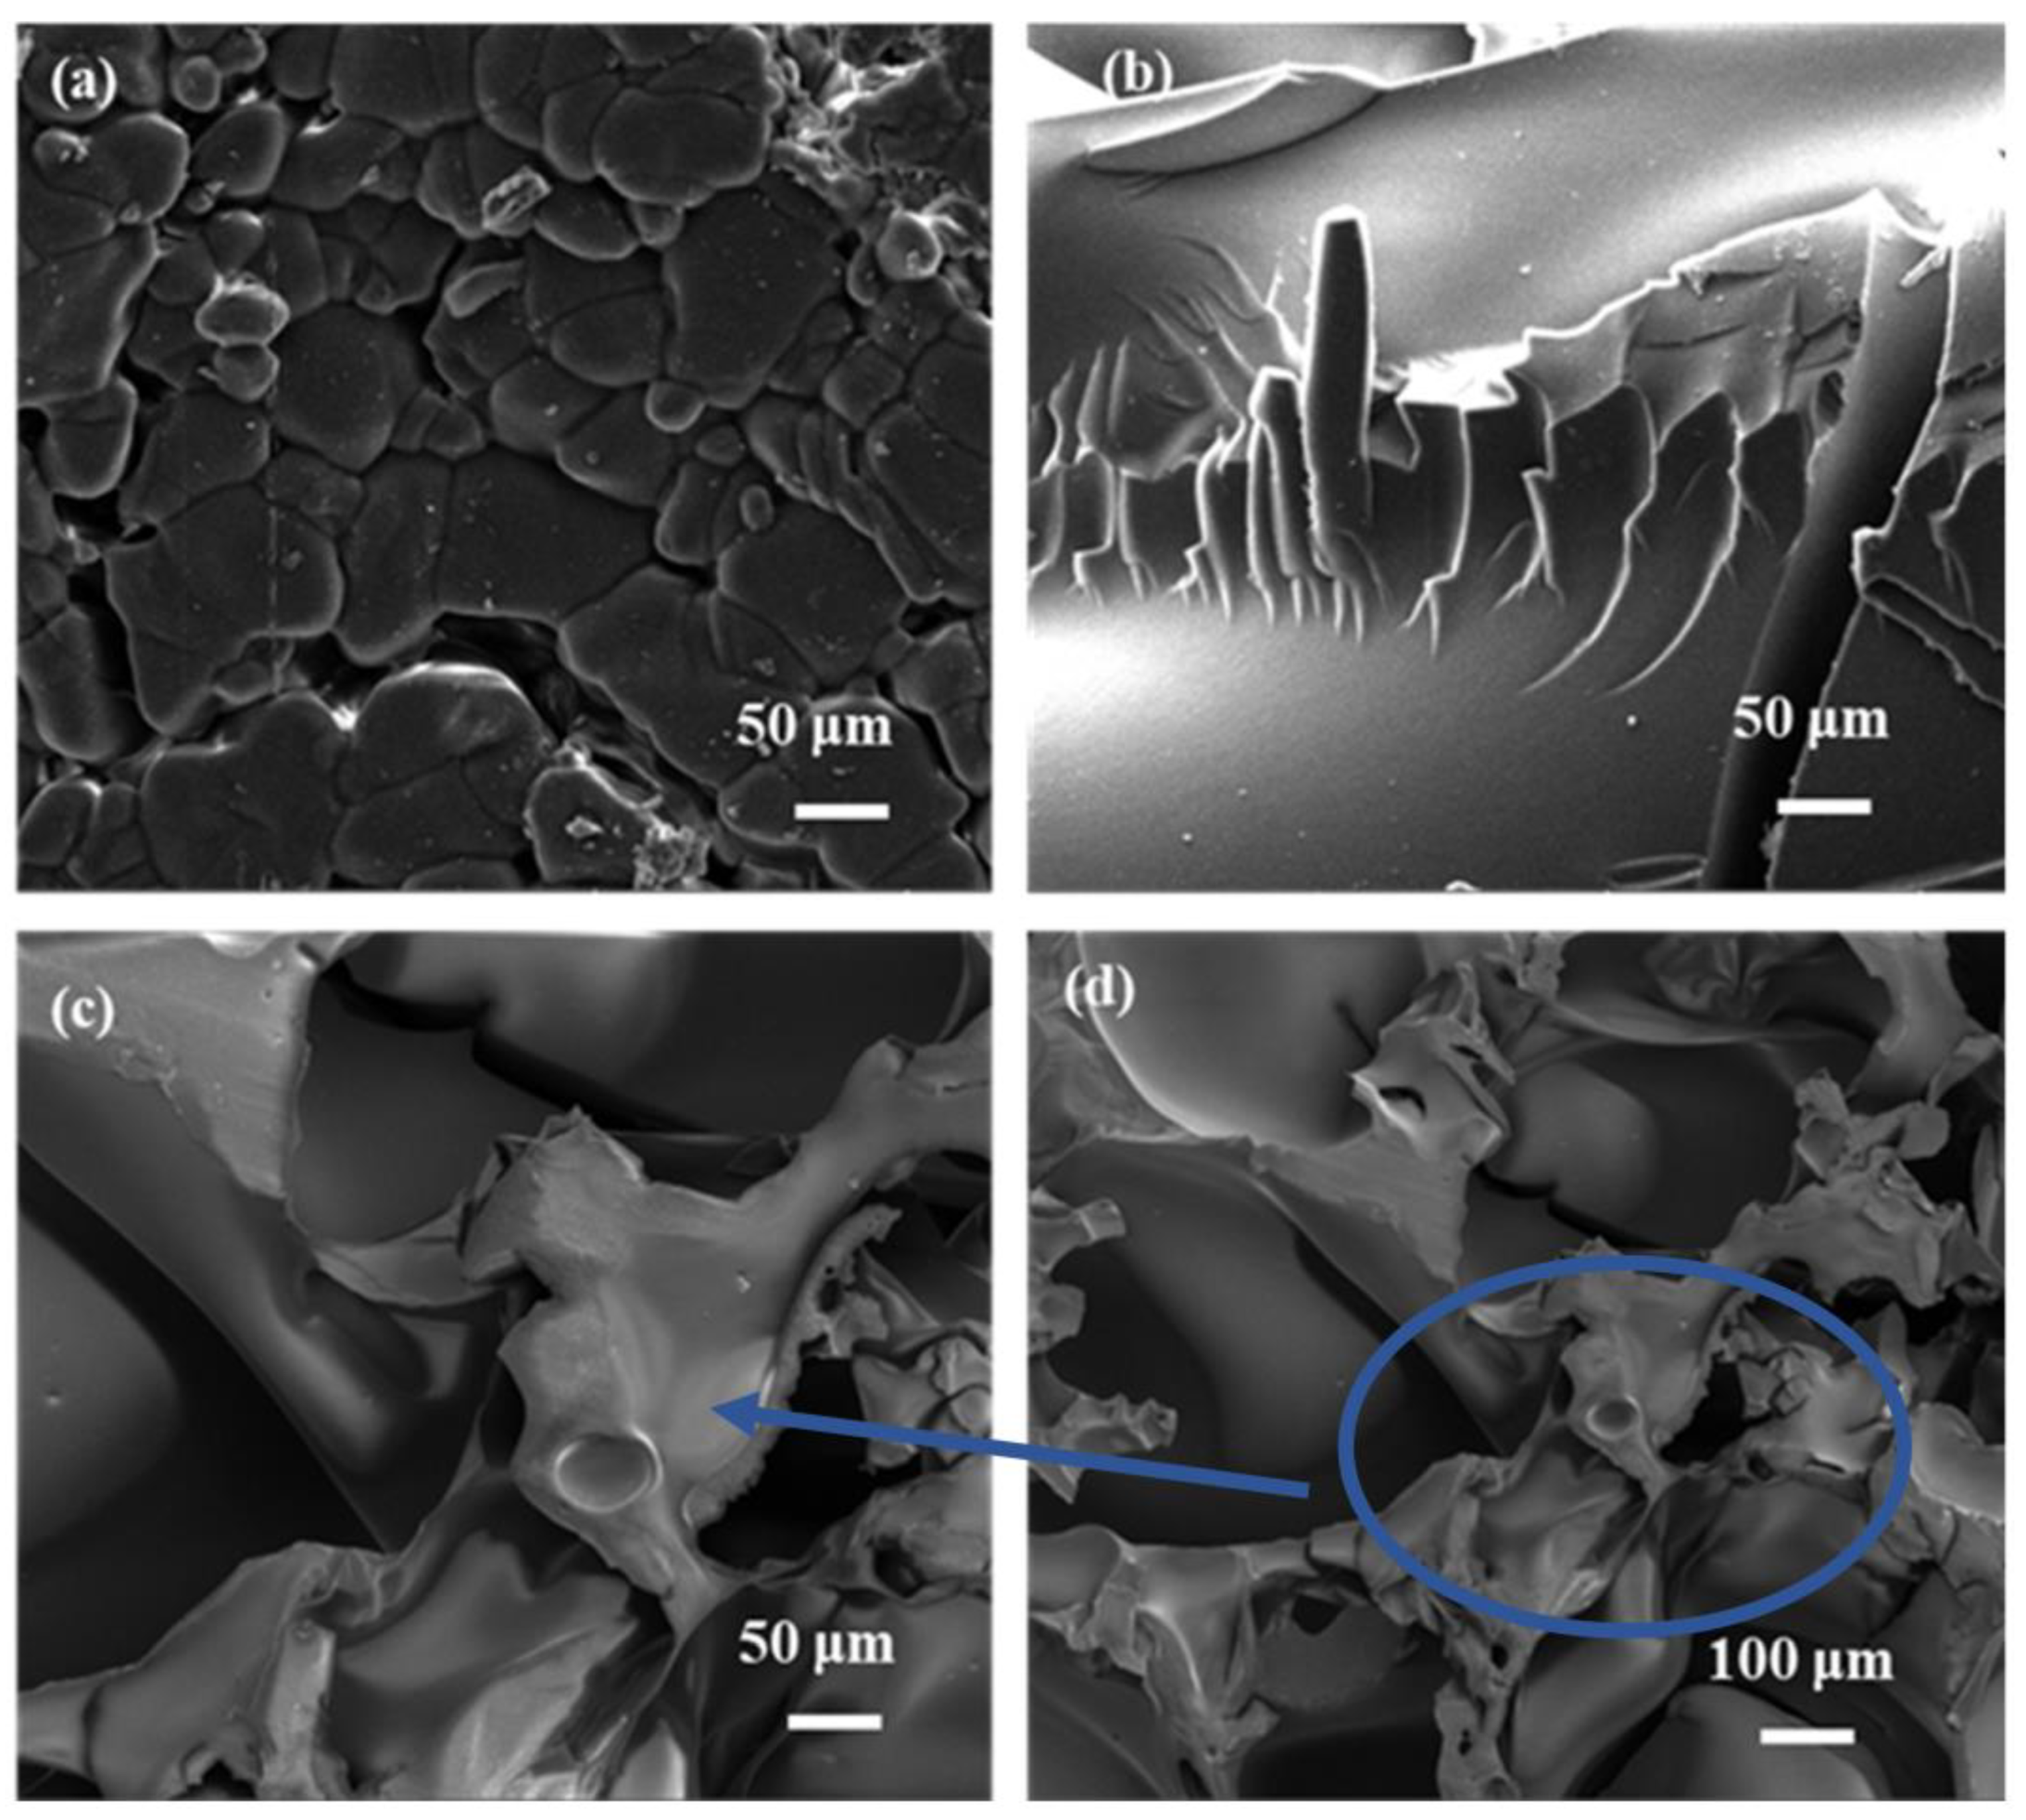
3.1.1. SEM Analysis
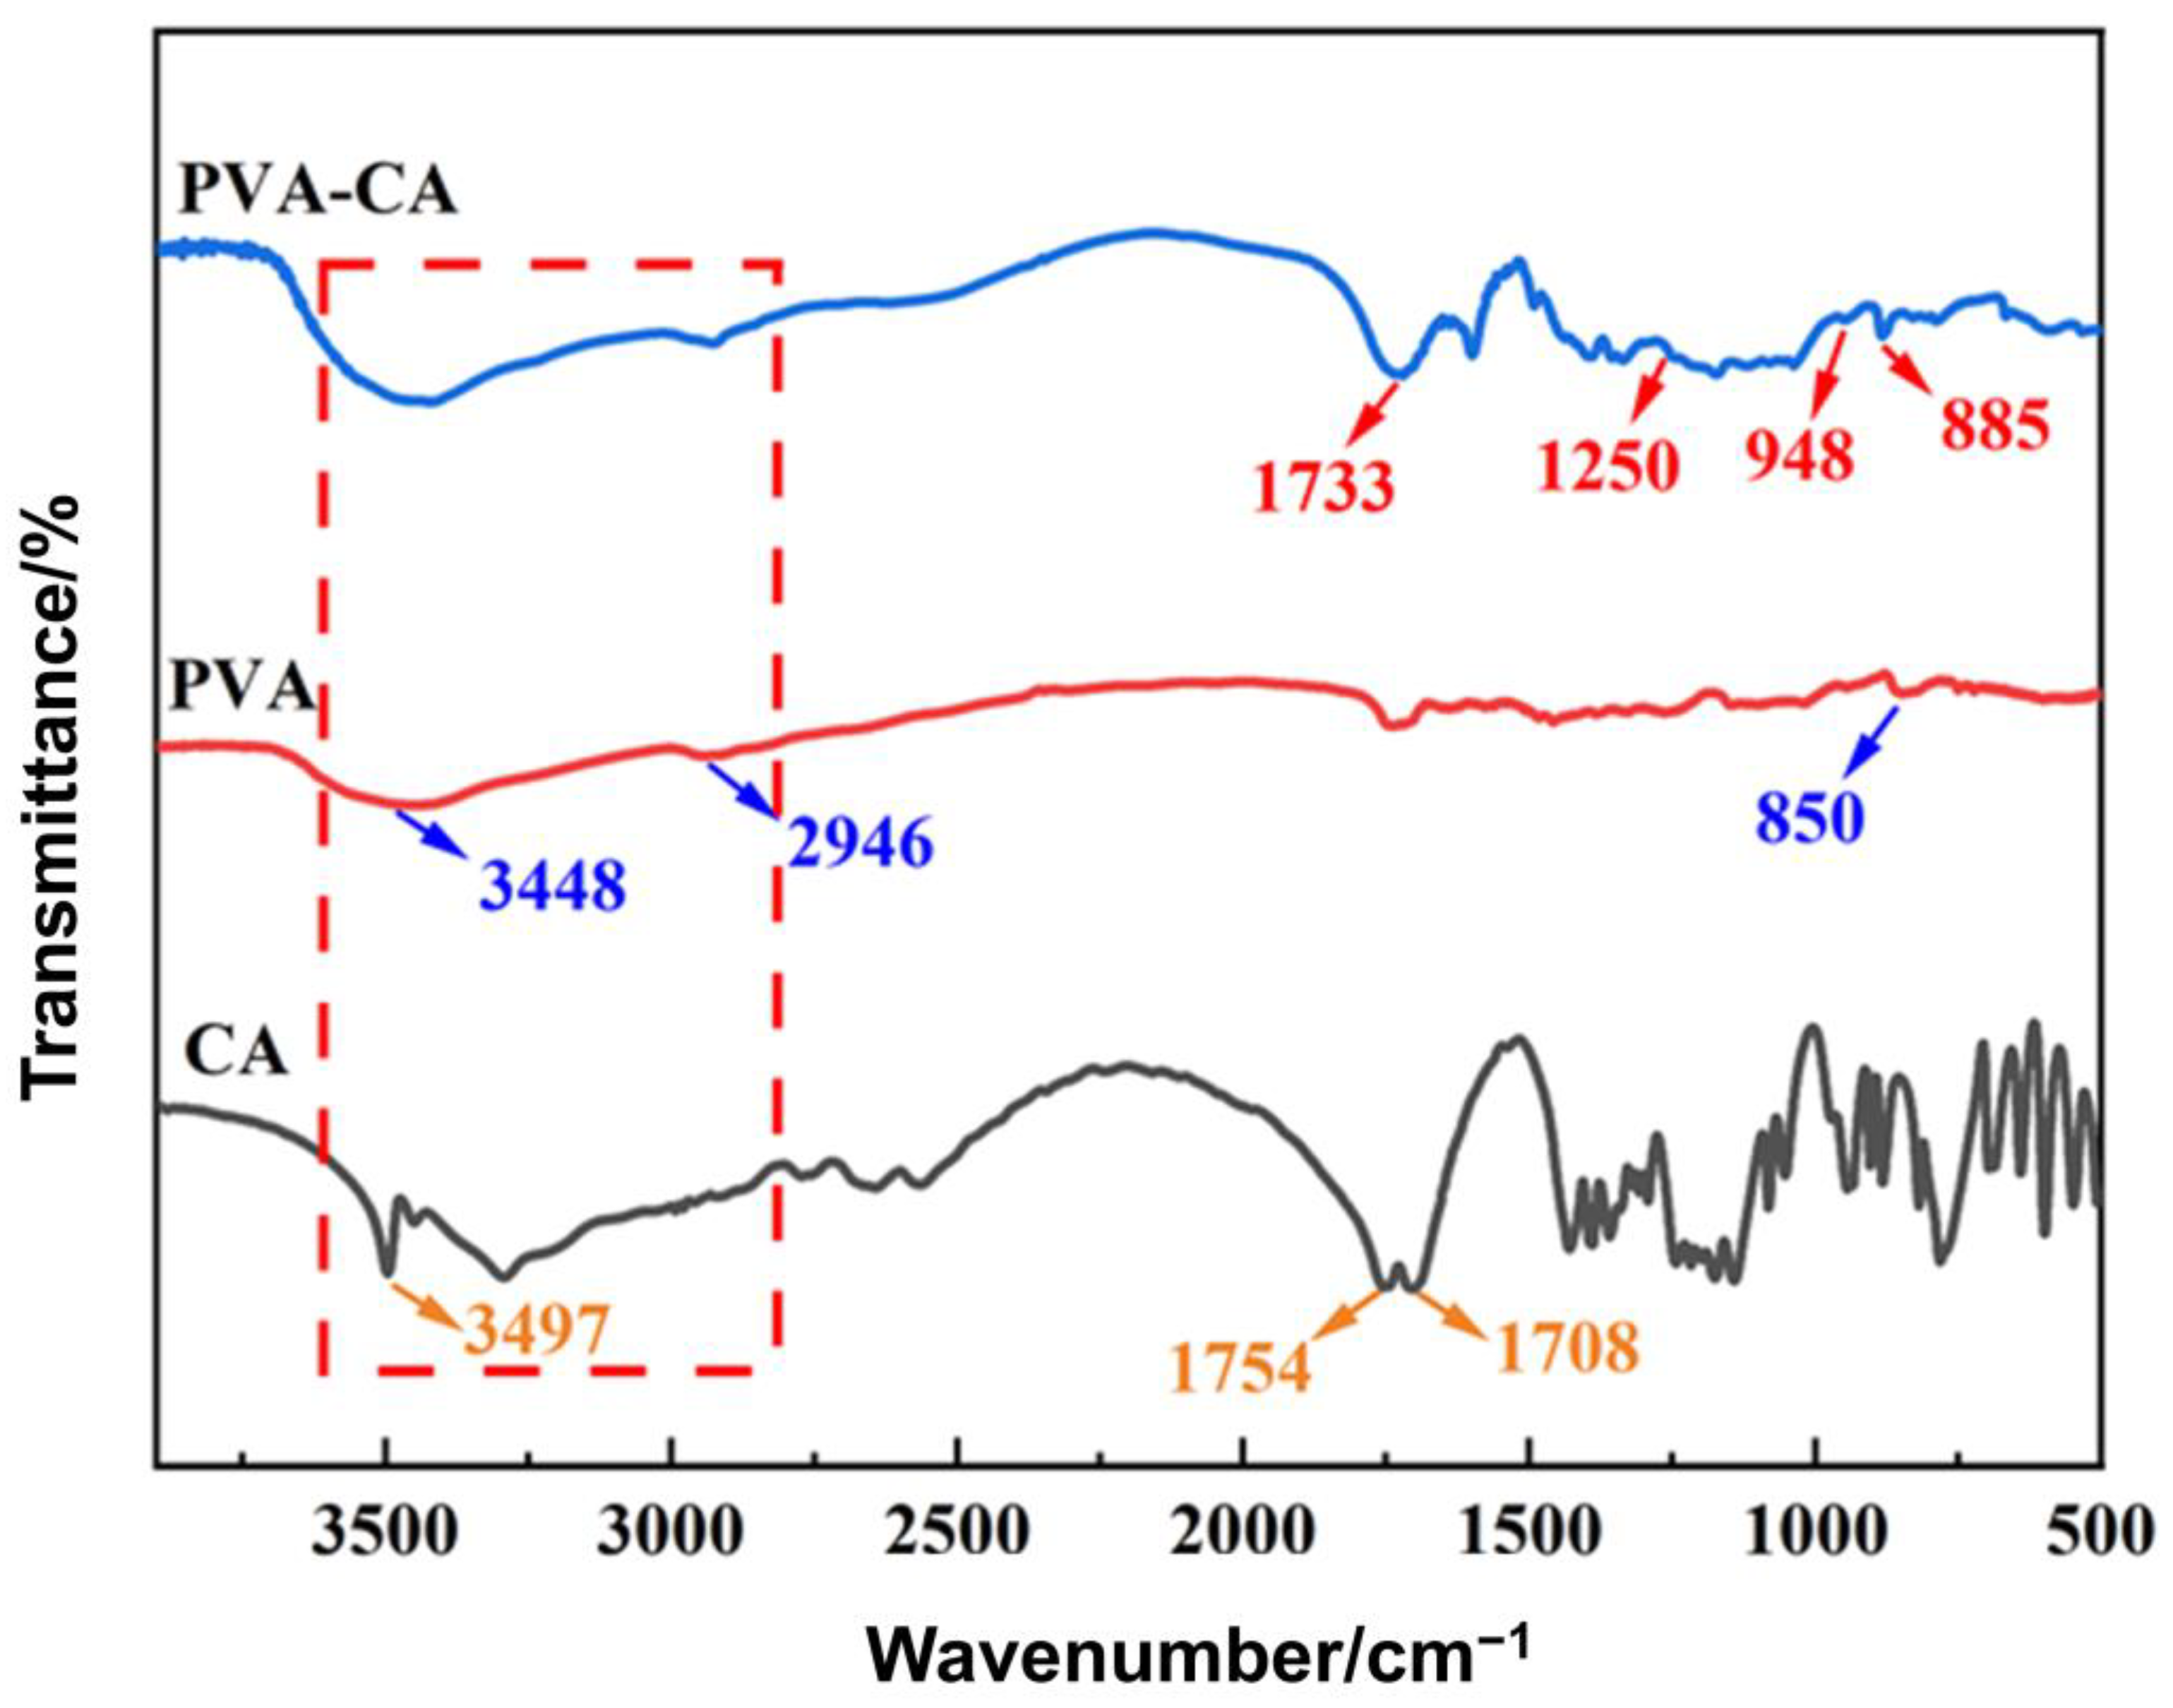
3.1.2. FT-IR Analysis
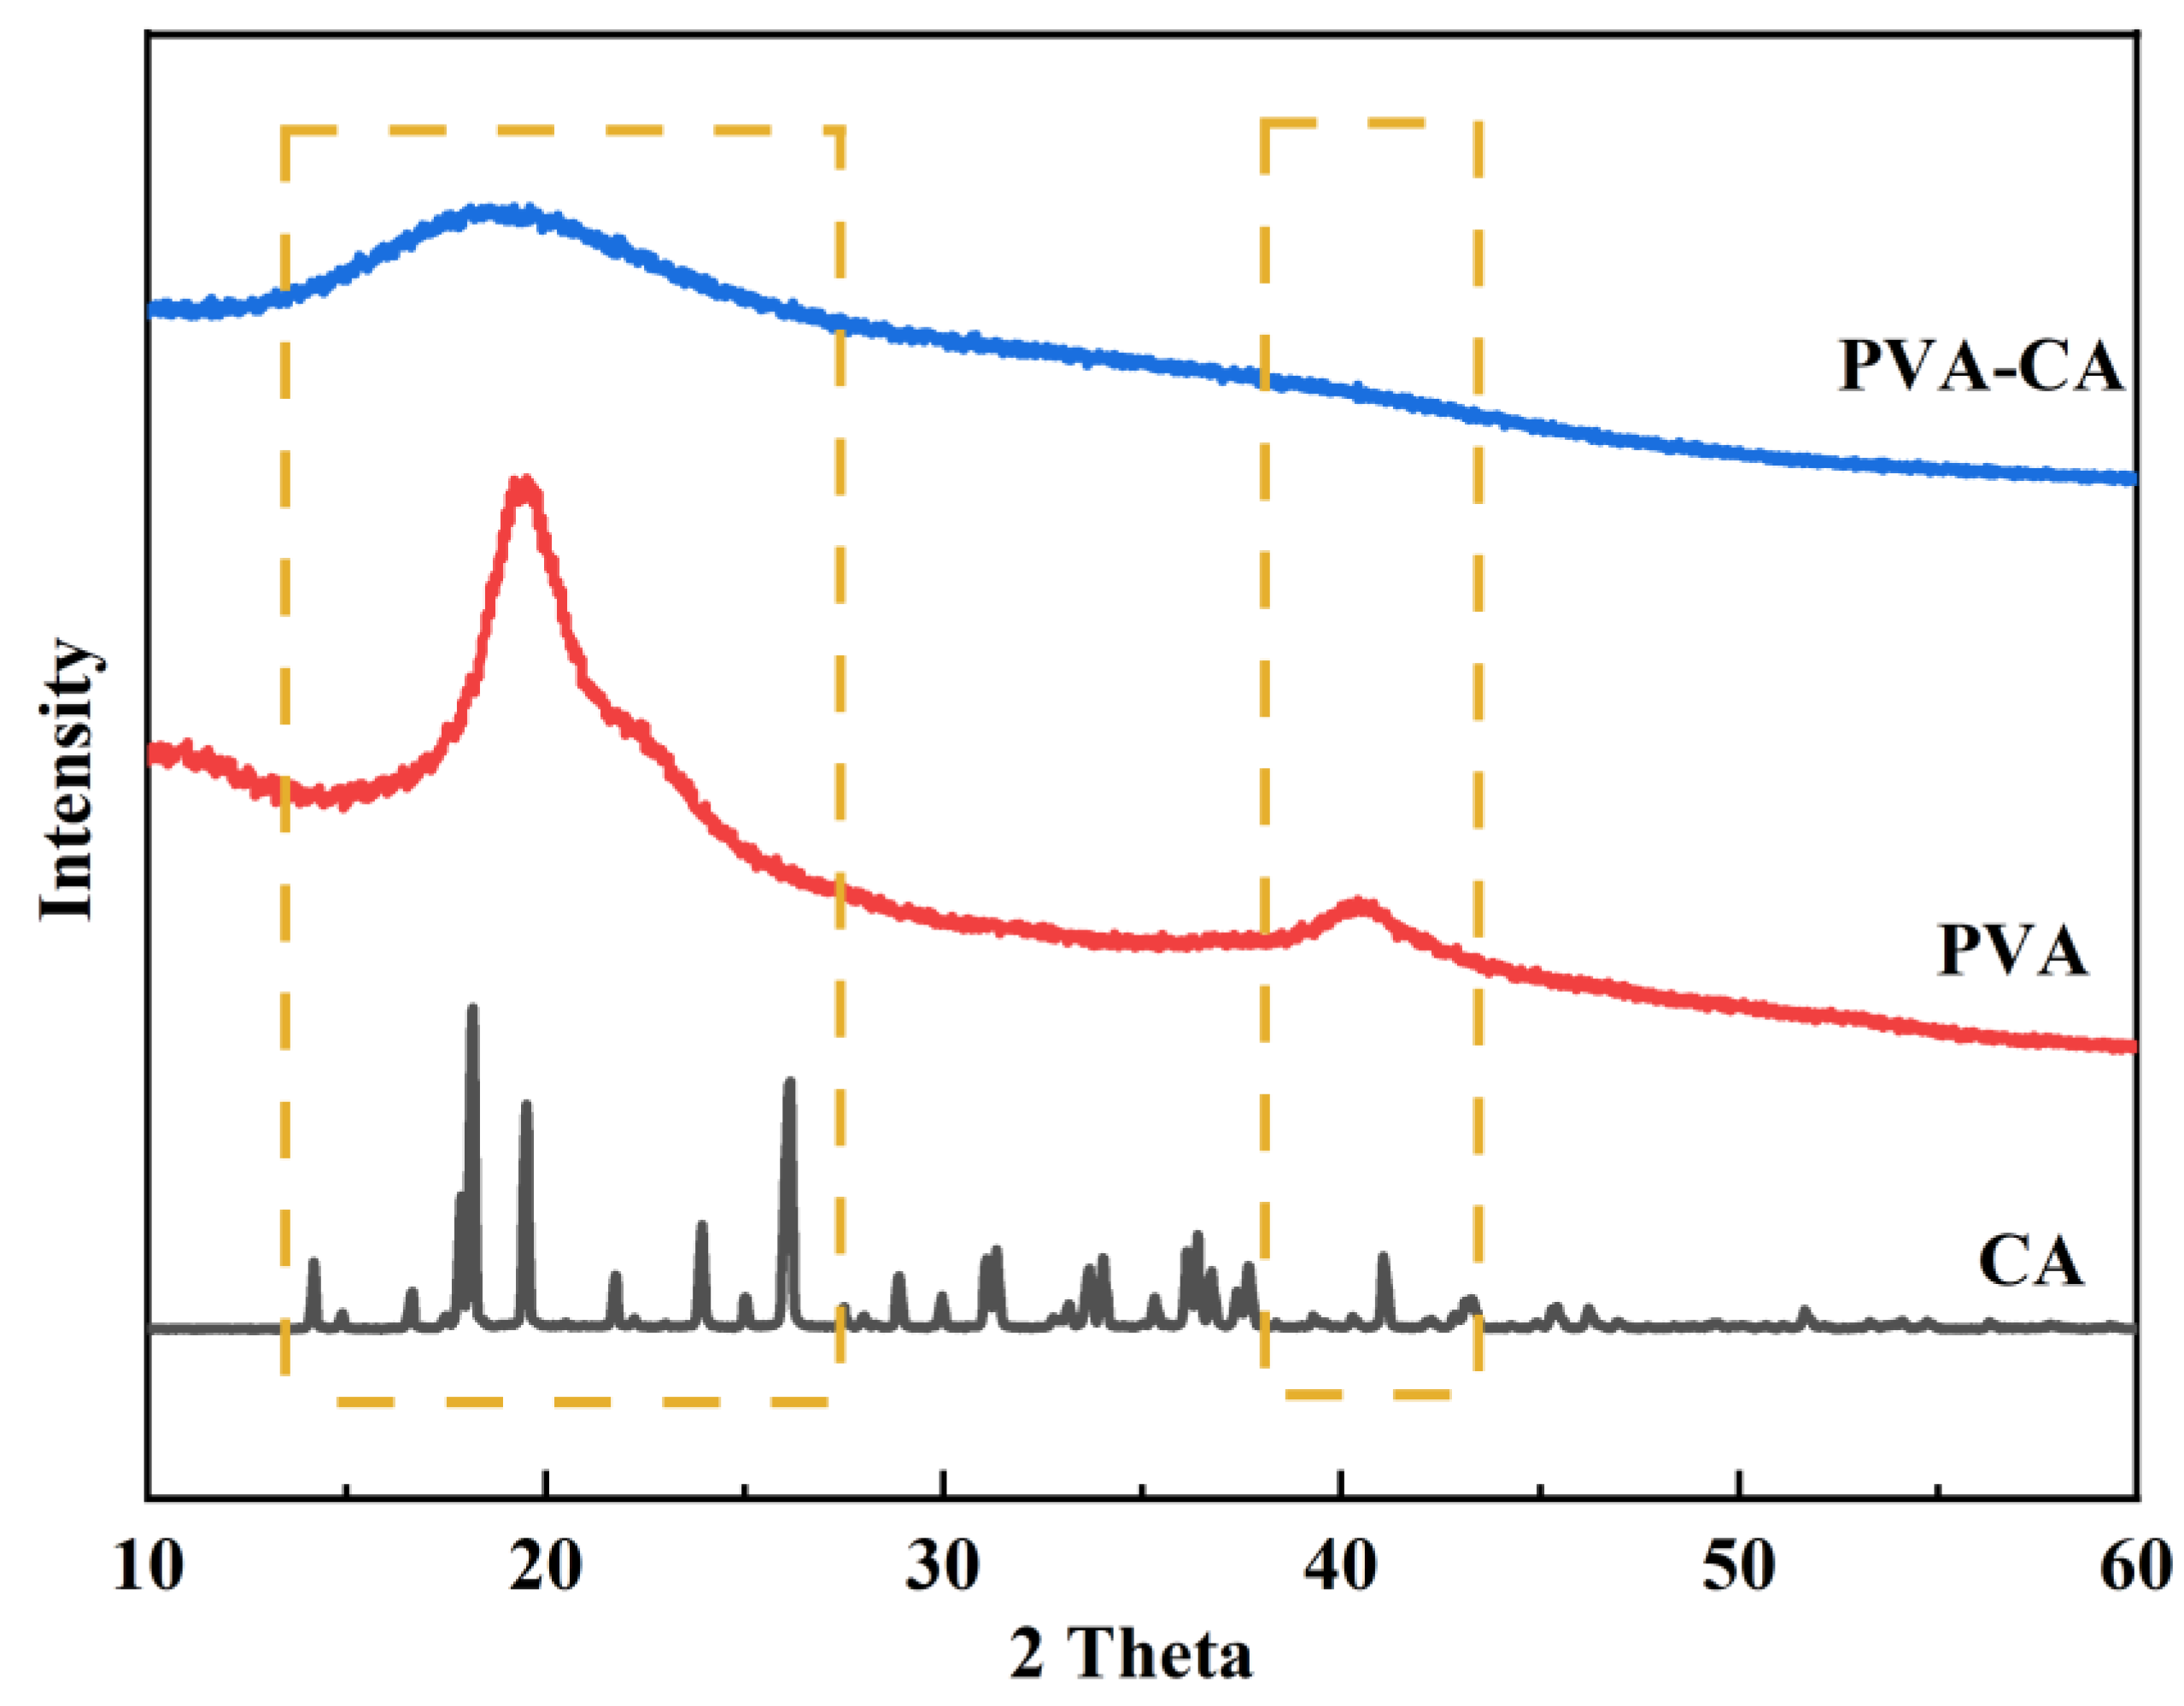
3.1.3. XRD Analysis
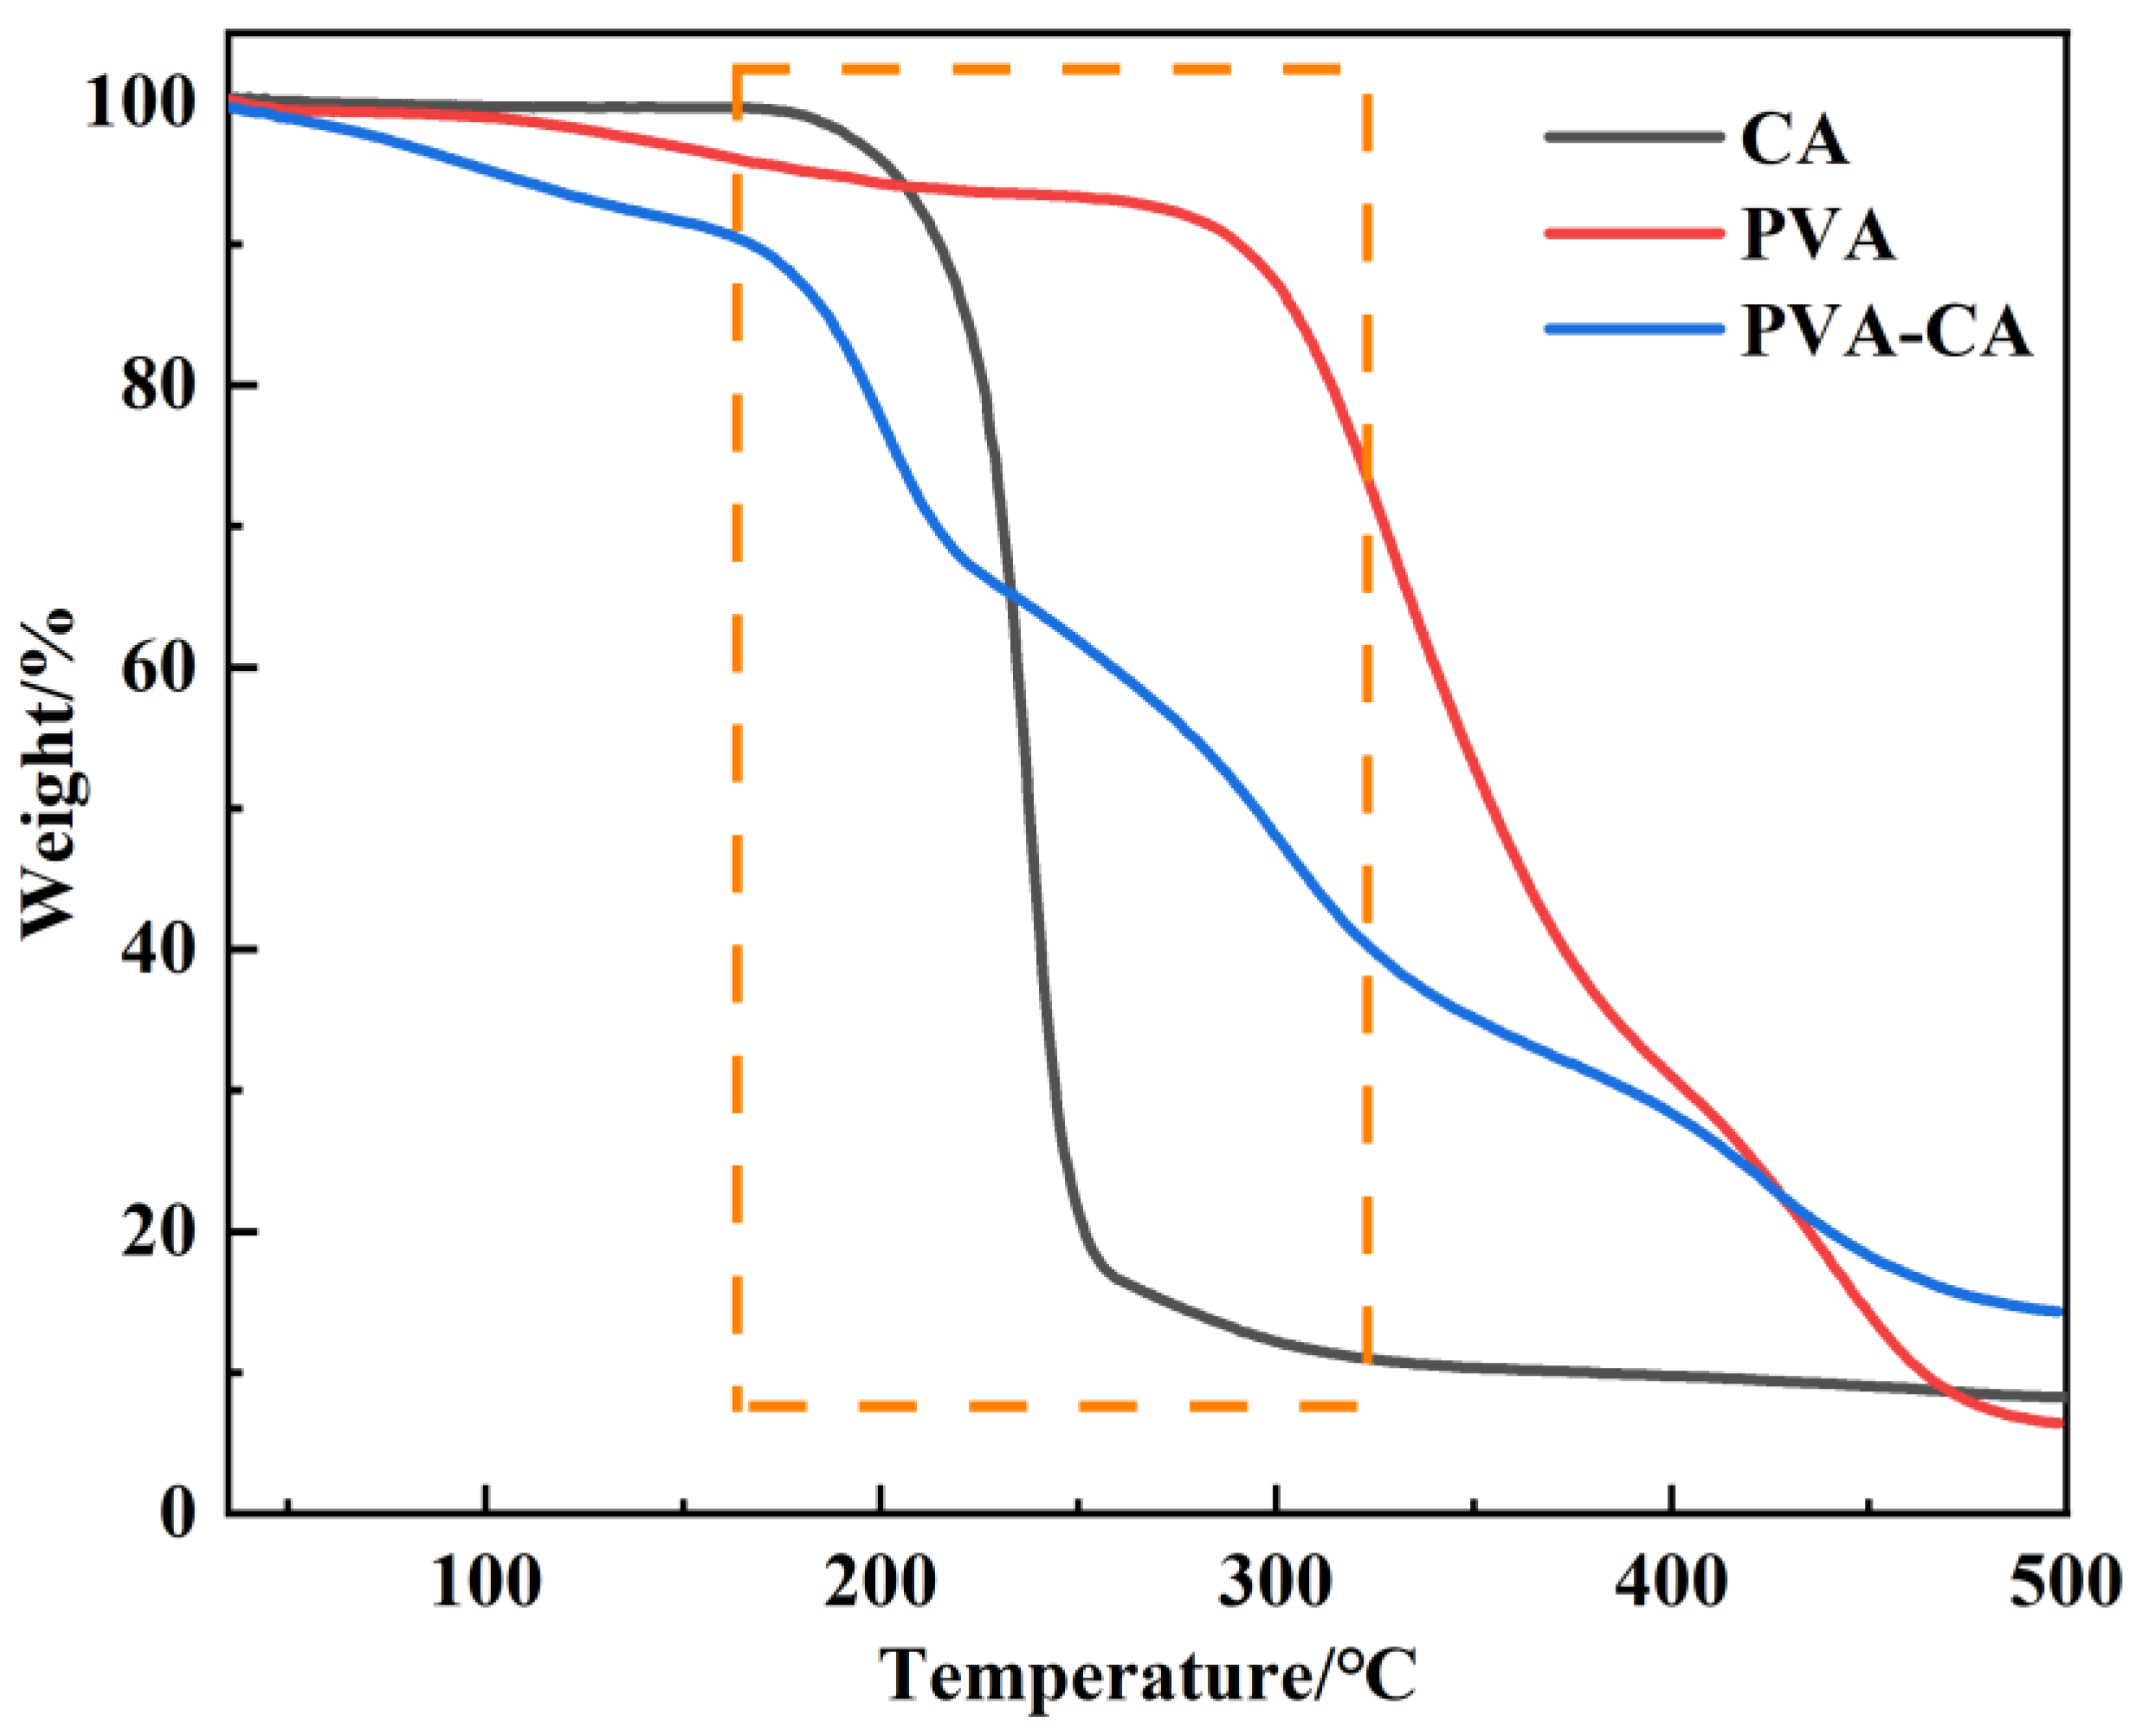
3.1.4. TGA Analysis
3.2. Investigation of MB Adsorption Performance
3.2.1. Effect of Dose on Adsorption Performance
3.2.2. Effect of pH on Adsorption Performance
3.2.3. Effect of Contact Time on Adsorption Performance
3.2.4. Effect of Concentration of MB on Adsorption Performance
3.2.5. Effect of Temperature on Adsorption Performance
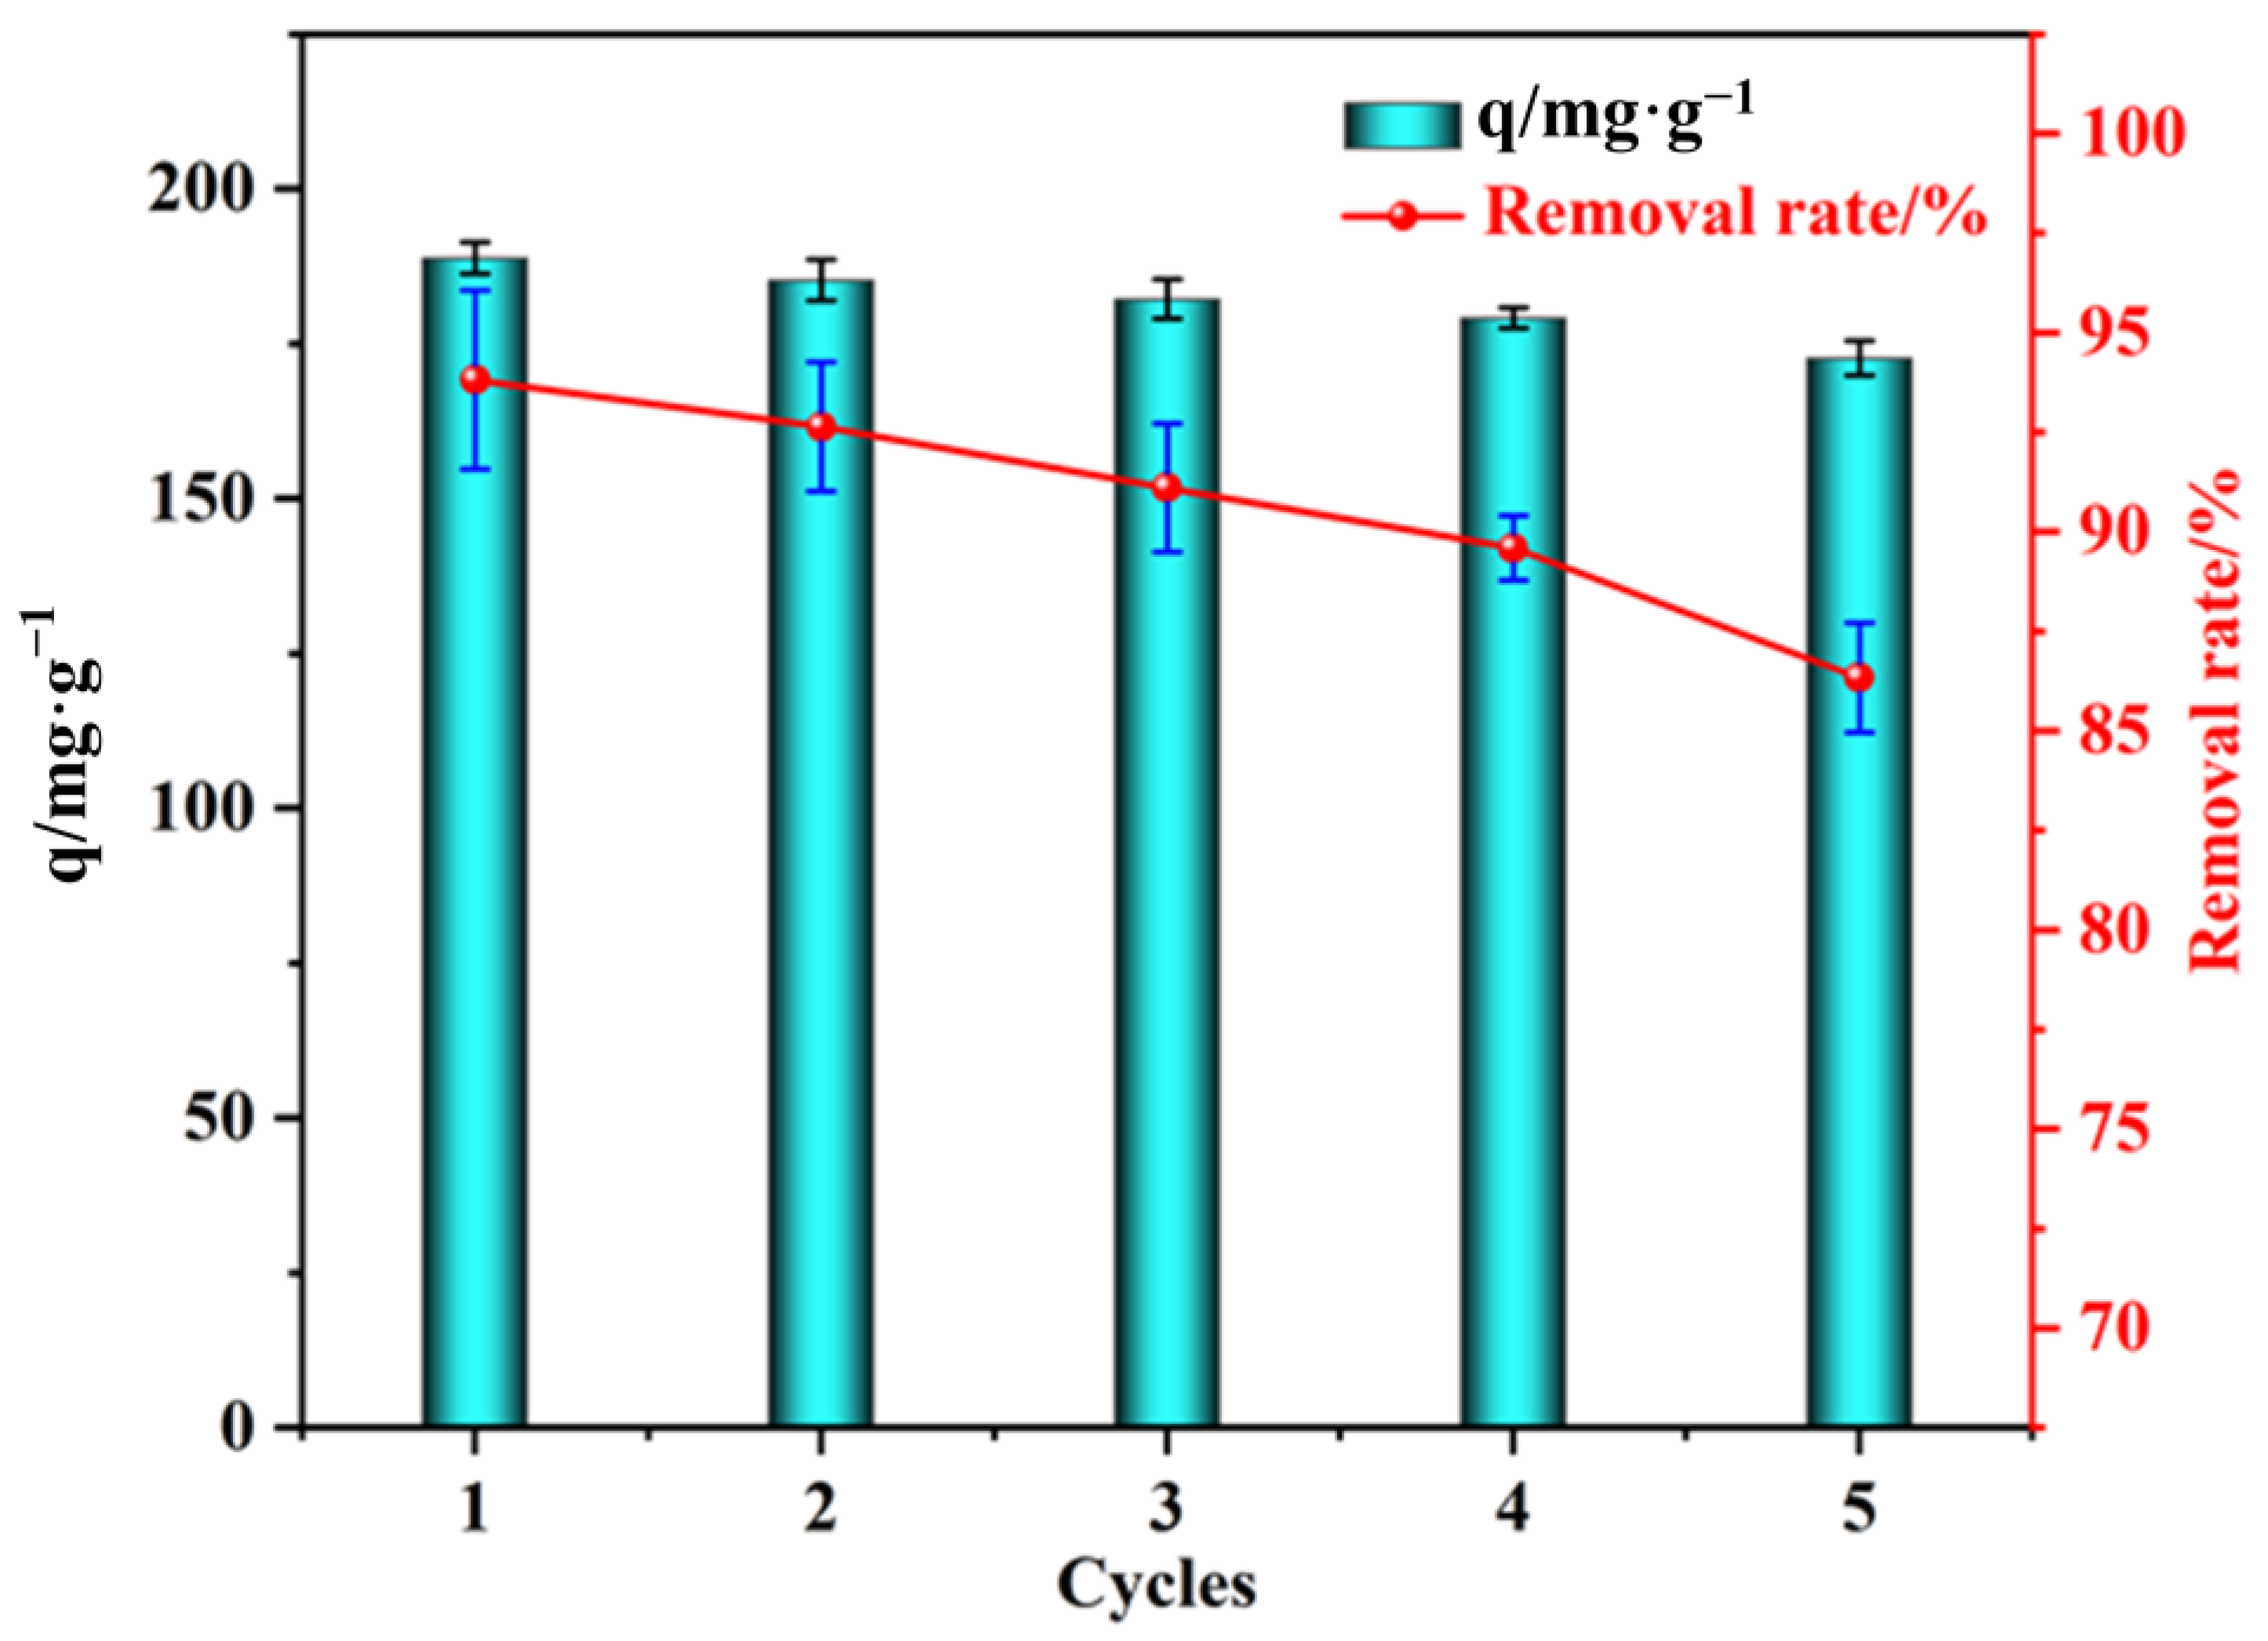
3.2.6. Regeneration of Adsorbents
3.3. Investigation of MB Adsorption Behavior
3.3.1. Adsorption Kinetic Studies
3.3.2. Study of Adsorption Isotherm
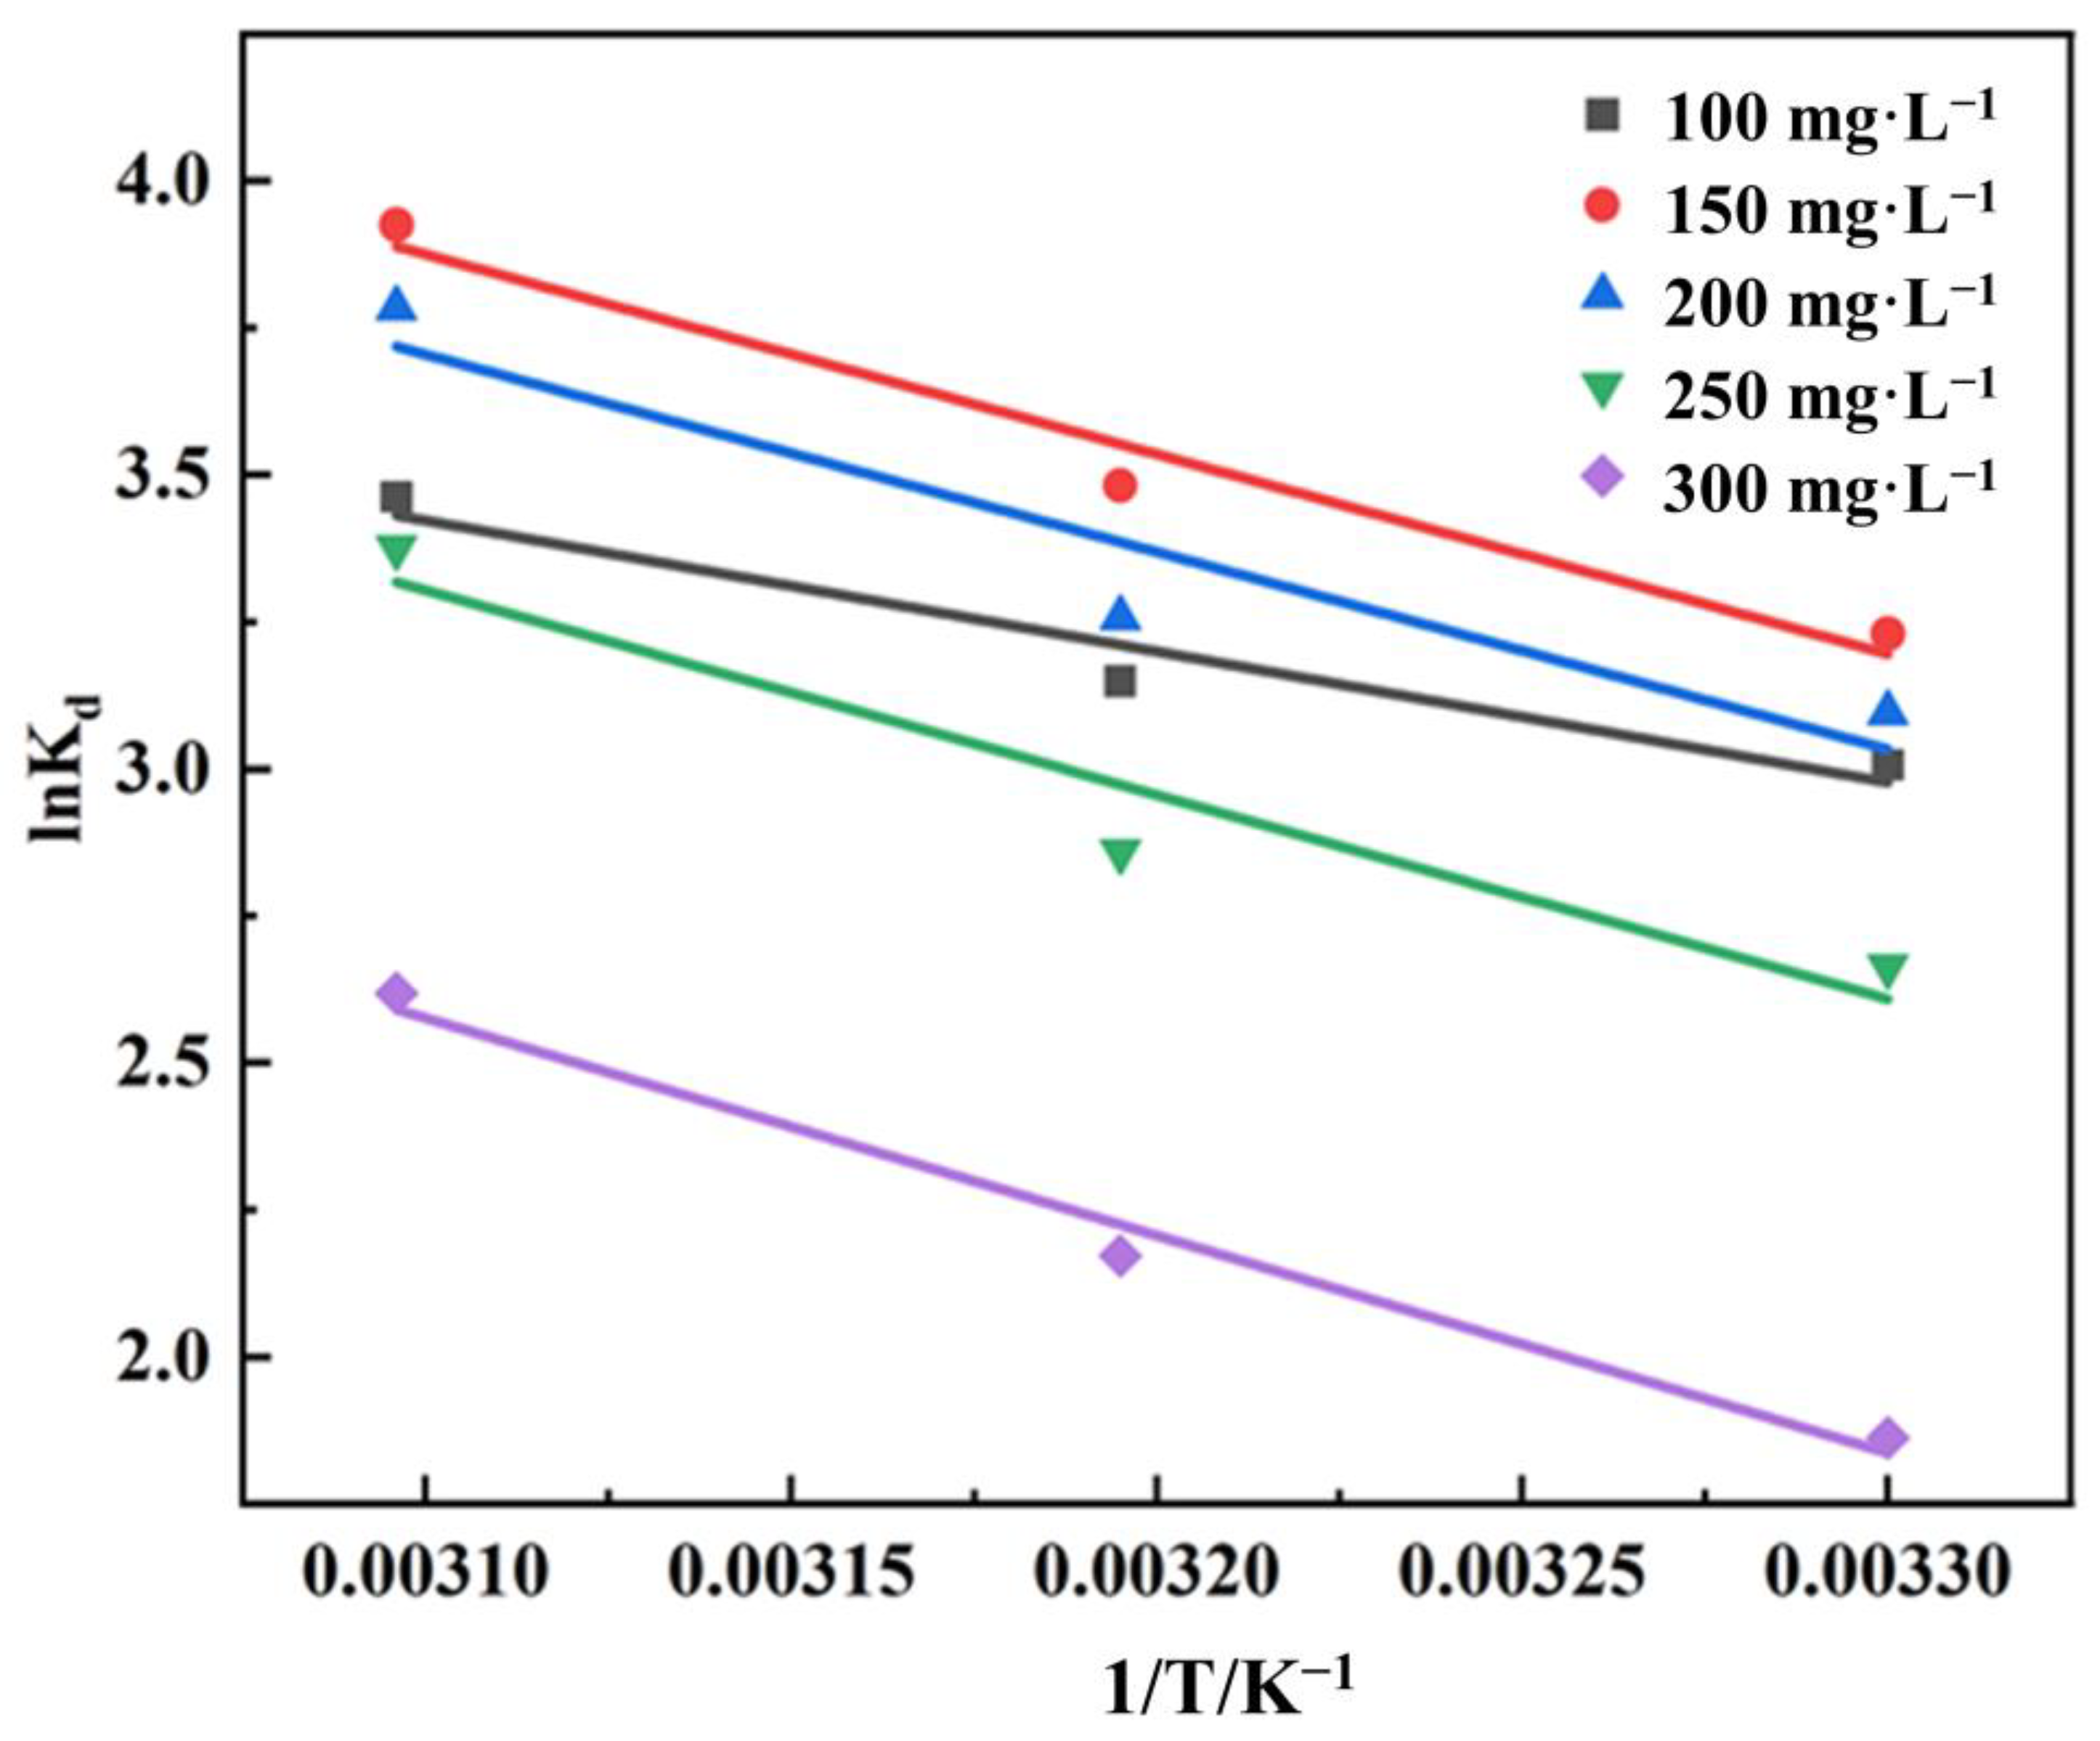
3.3.3. Study of Adsorption Thermodynamic Study
3.4. Absorption Mechanism
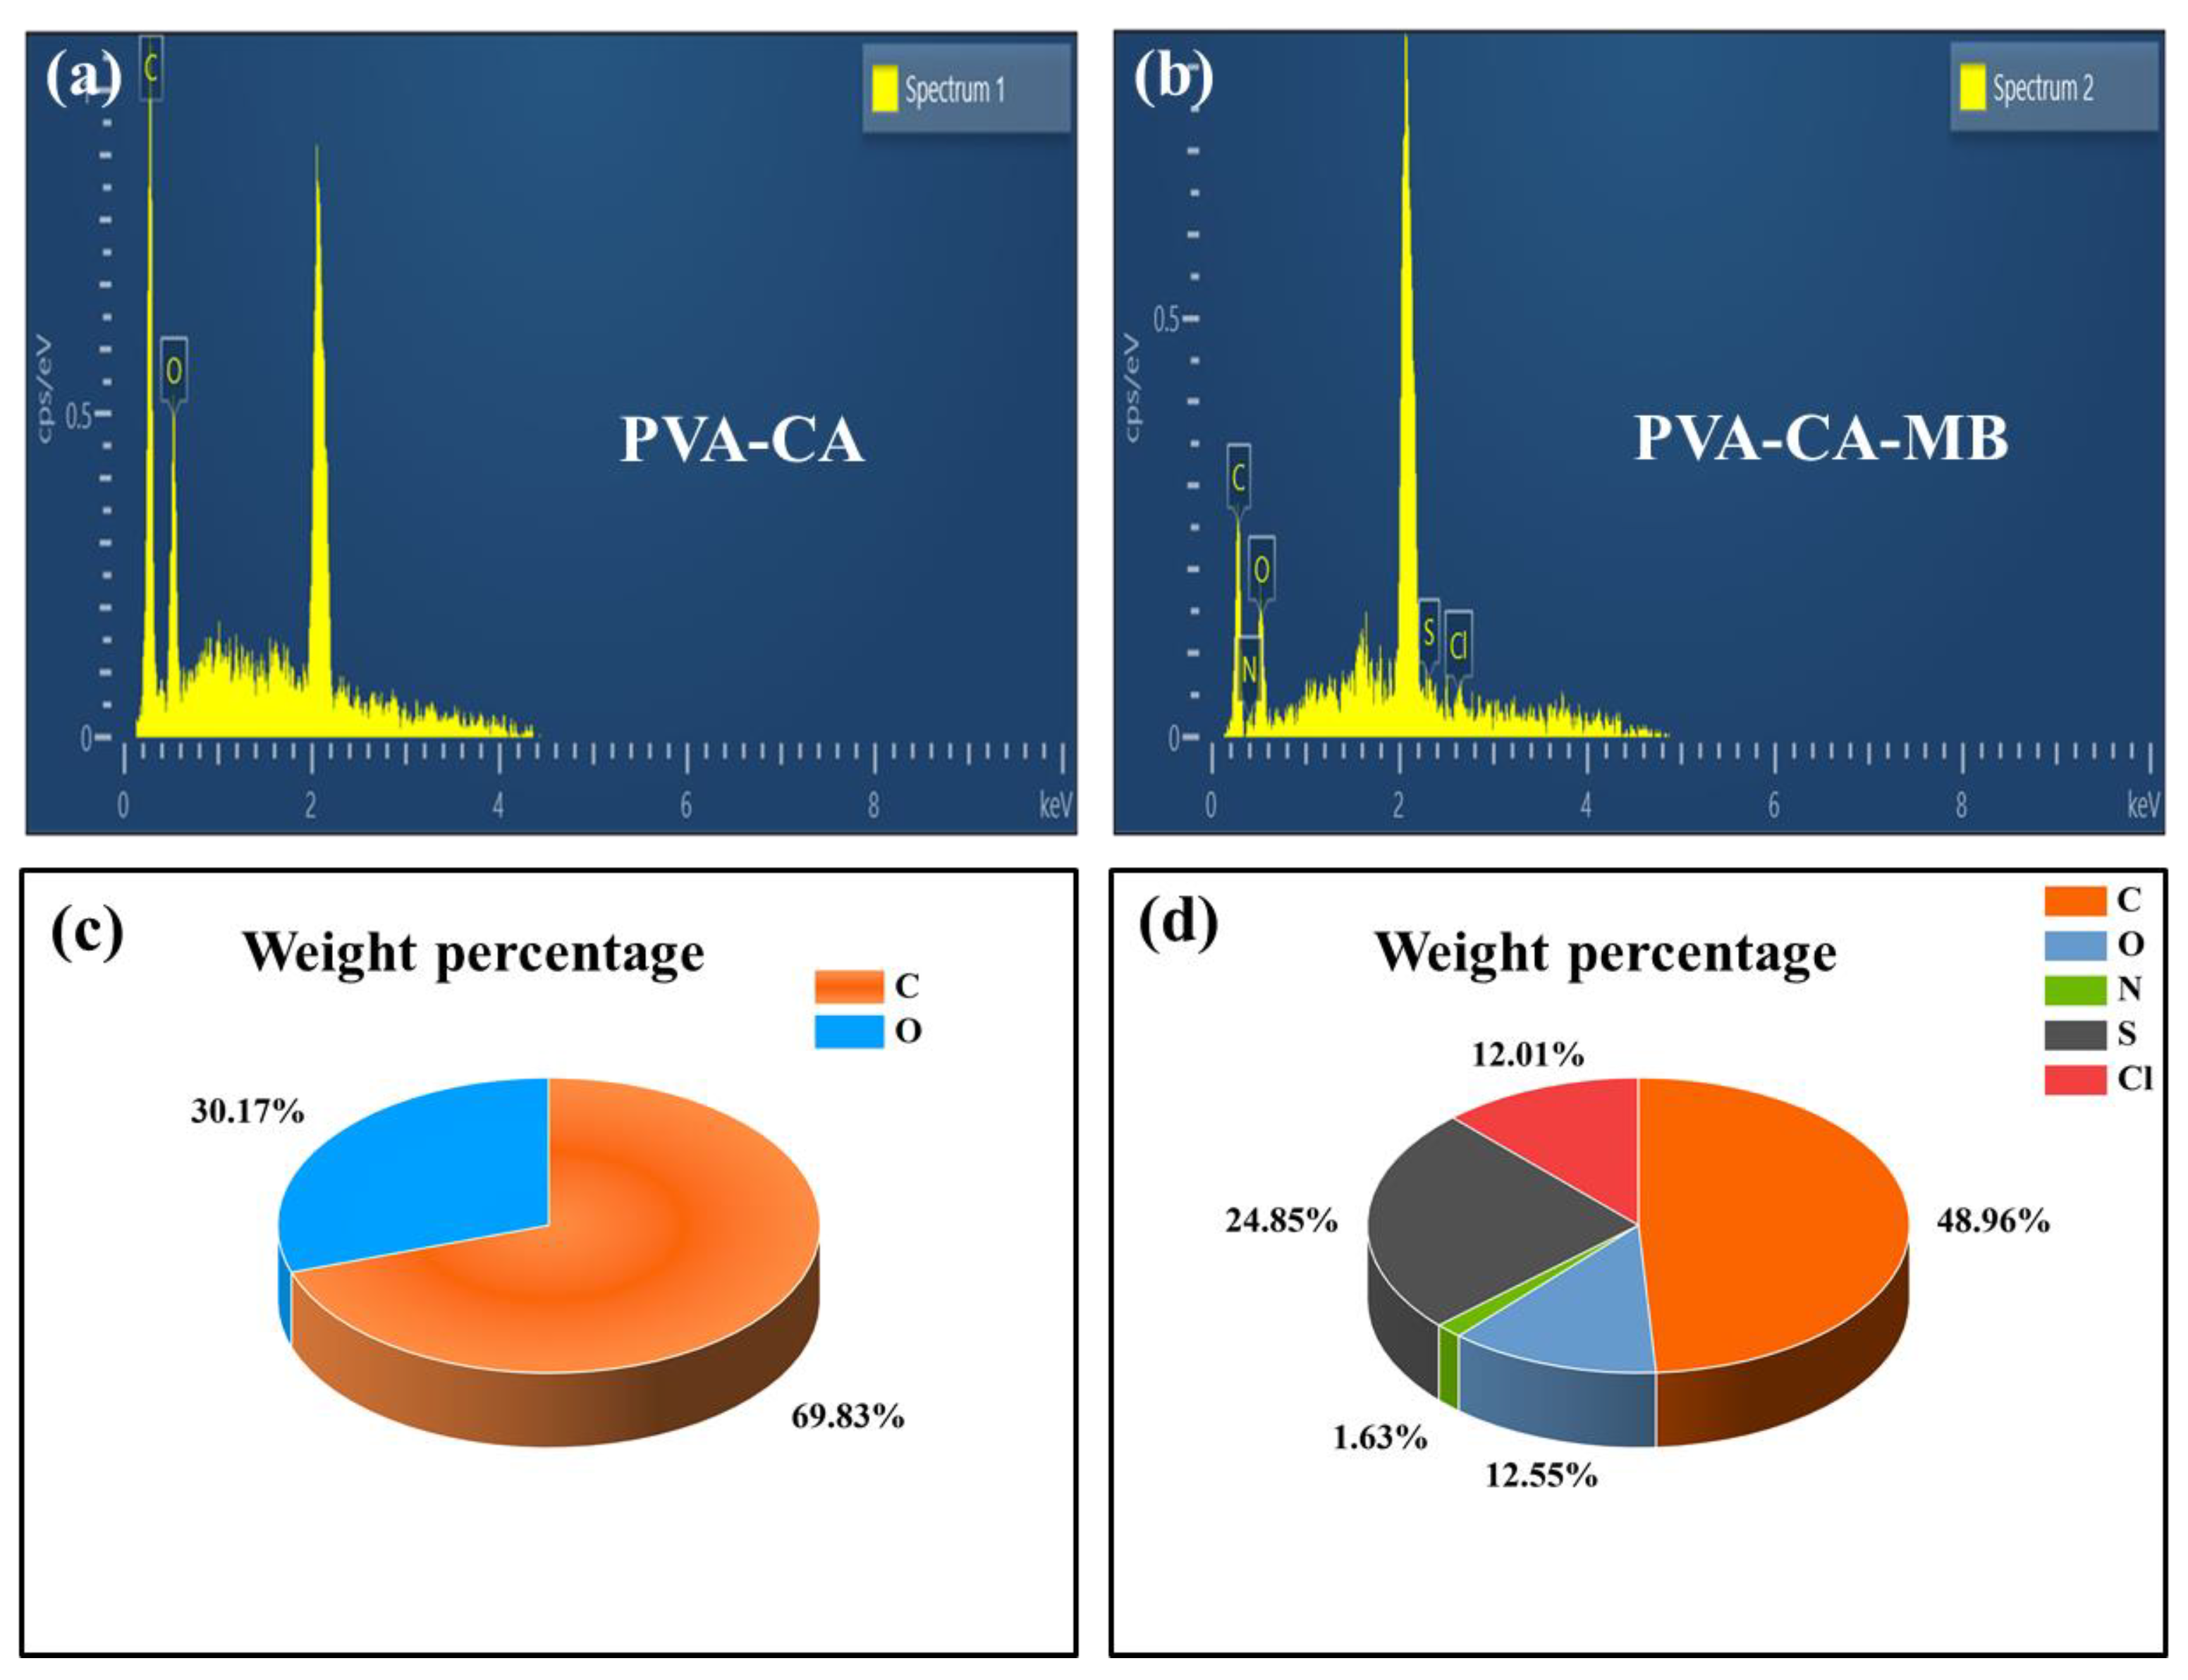
3.4.1. EDS Energy Spectrum Adsorption Validation
3.4.2. Mechanistic Assumptions
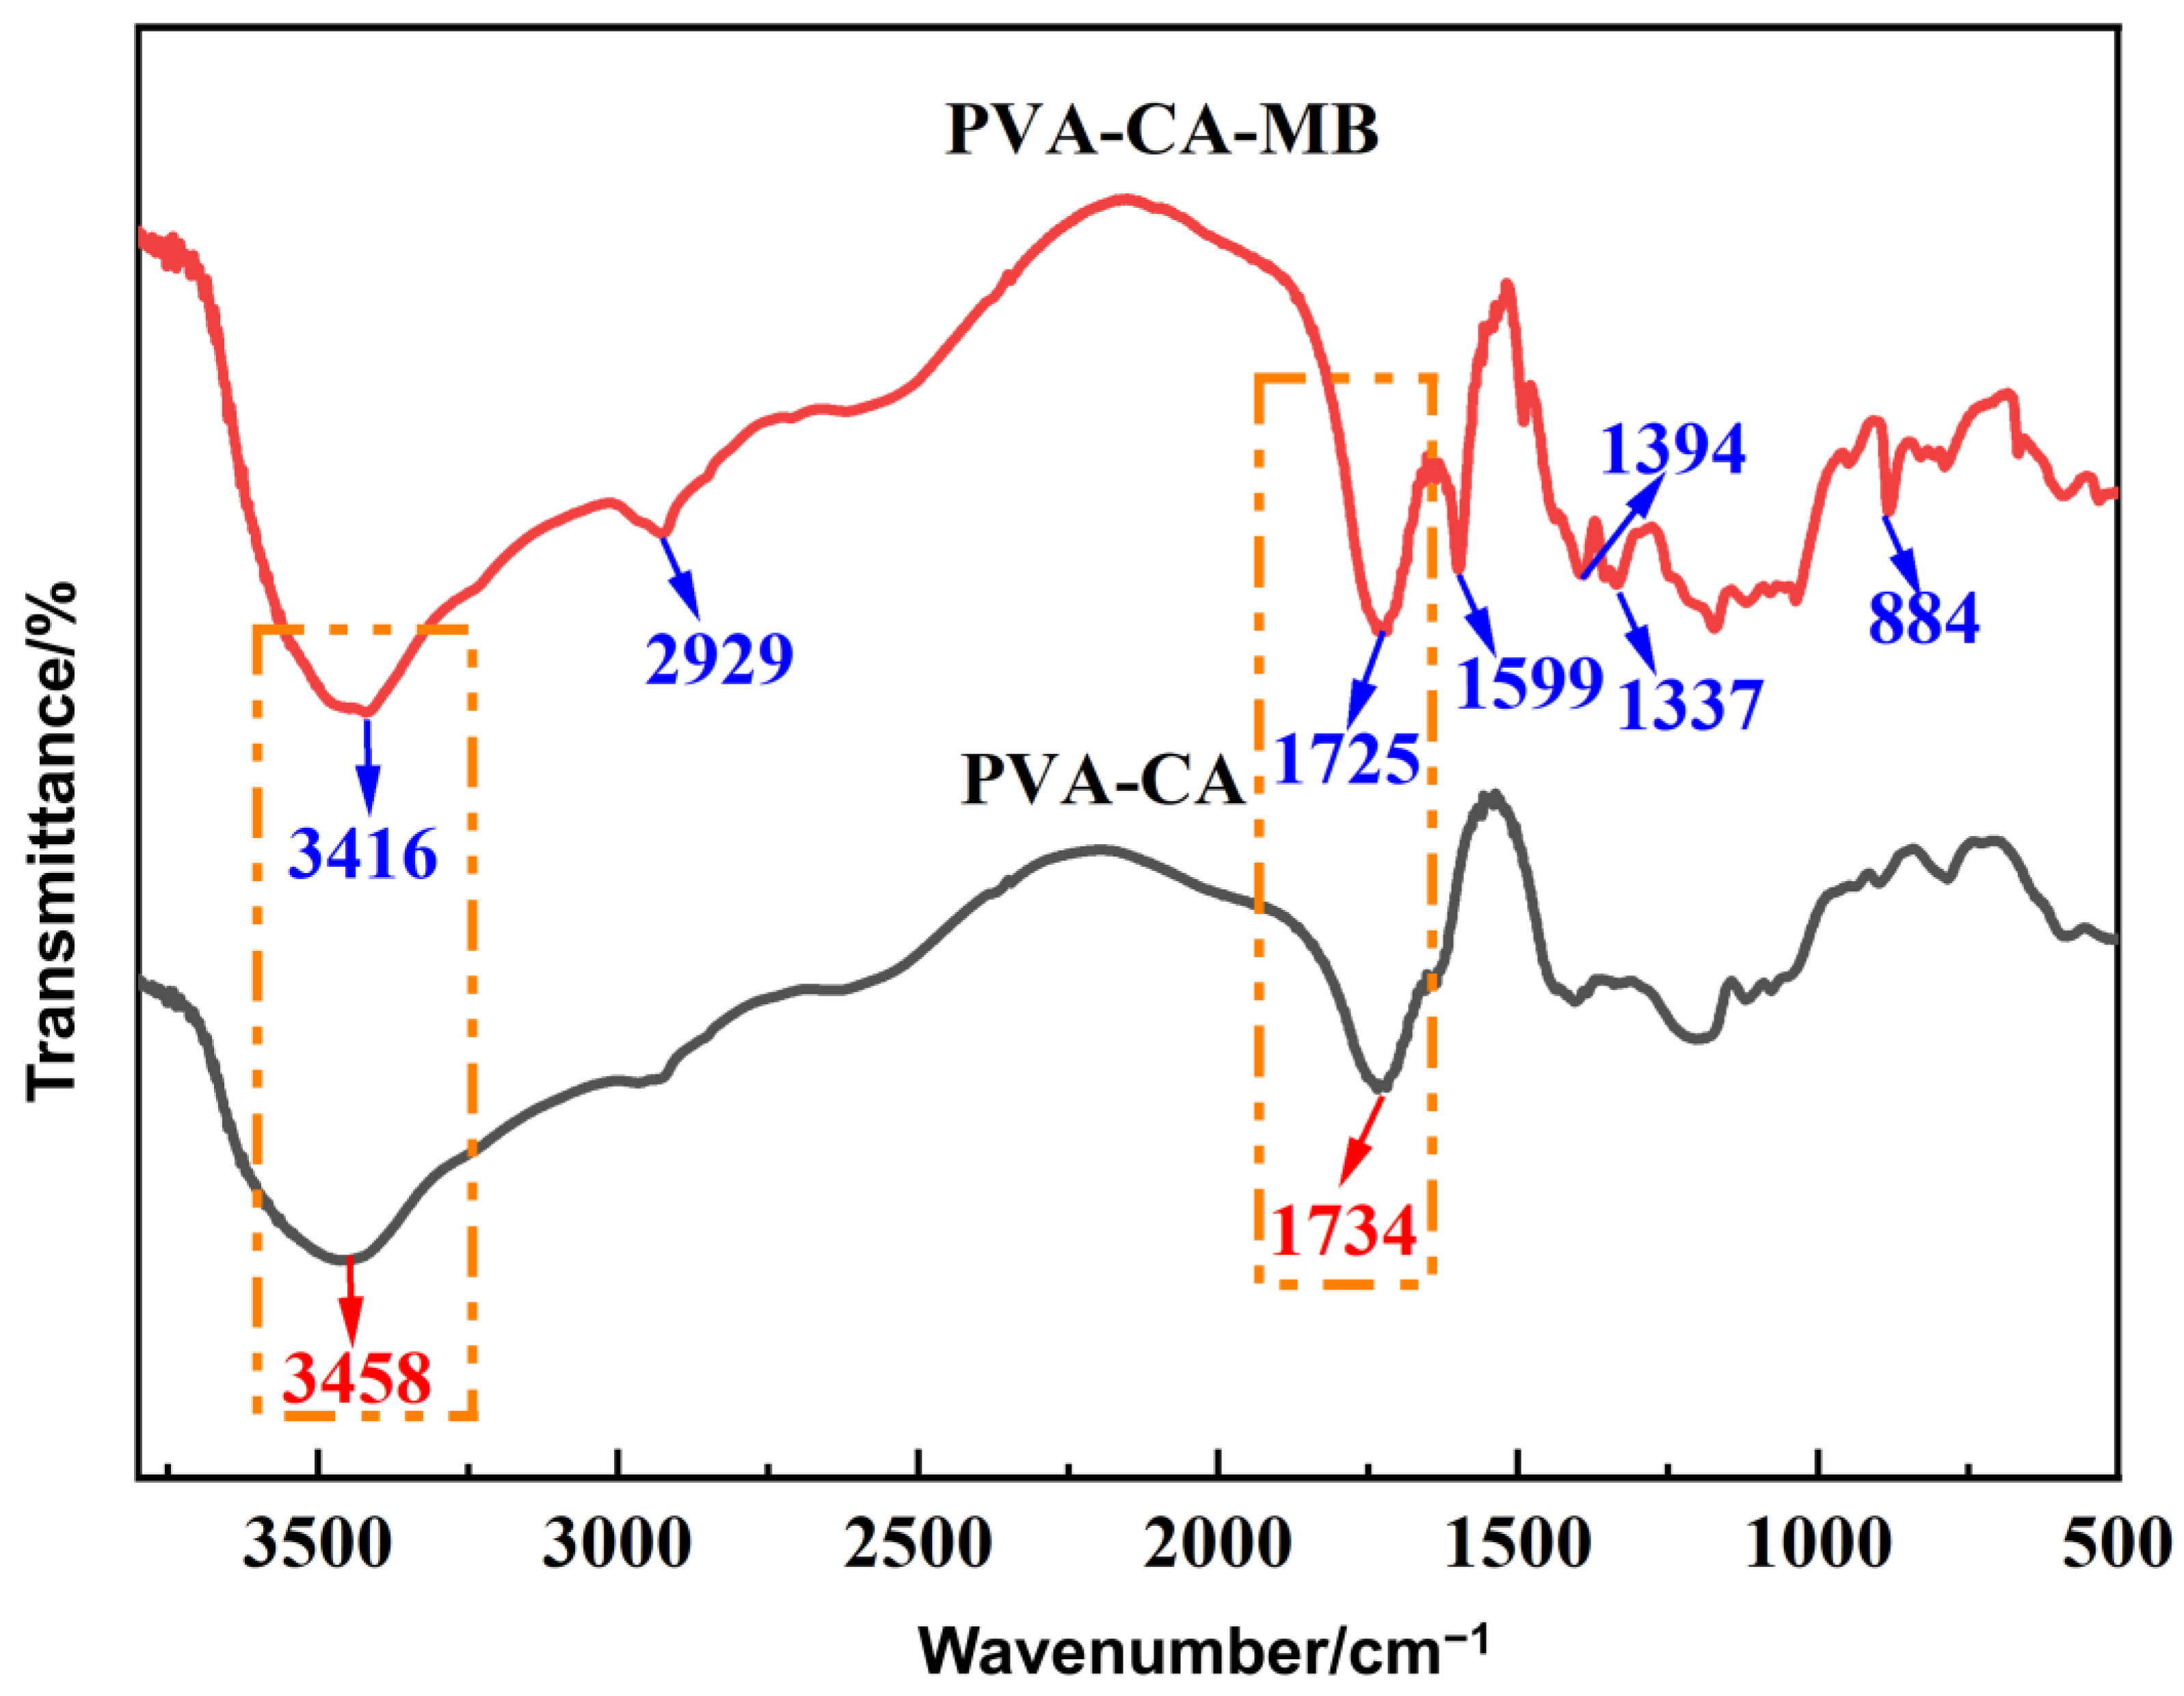
3.4.3. FT-IR Analysis
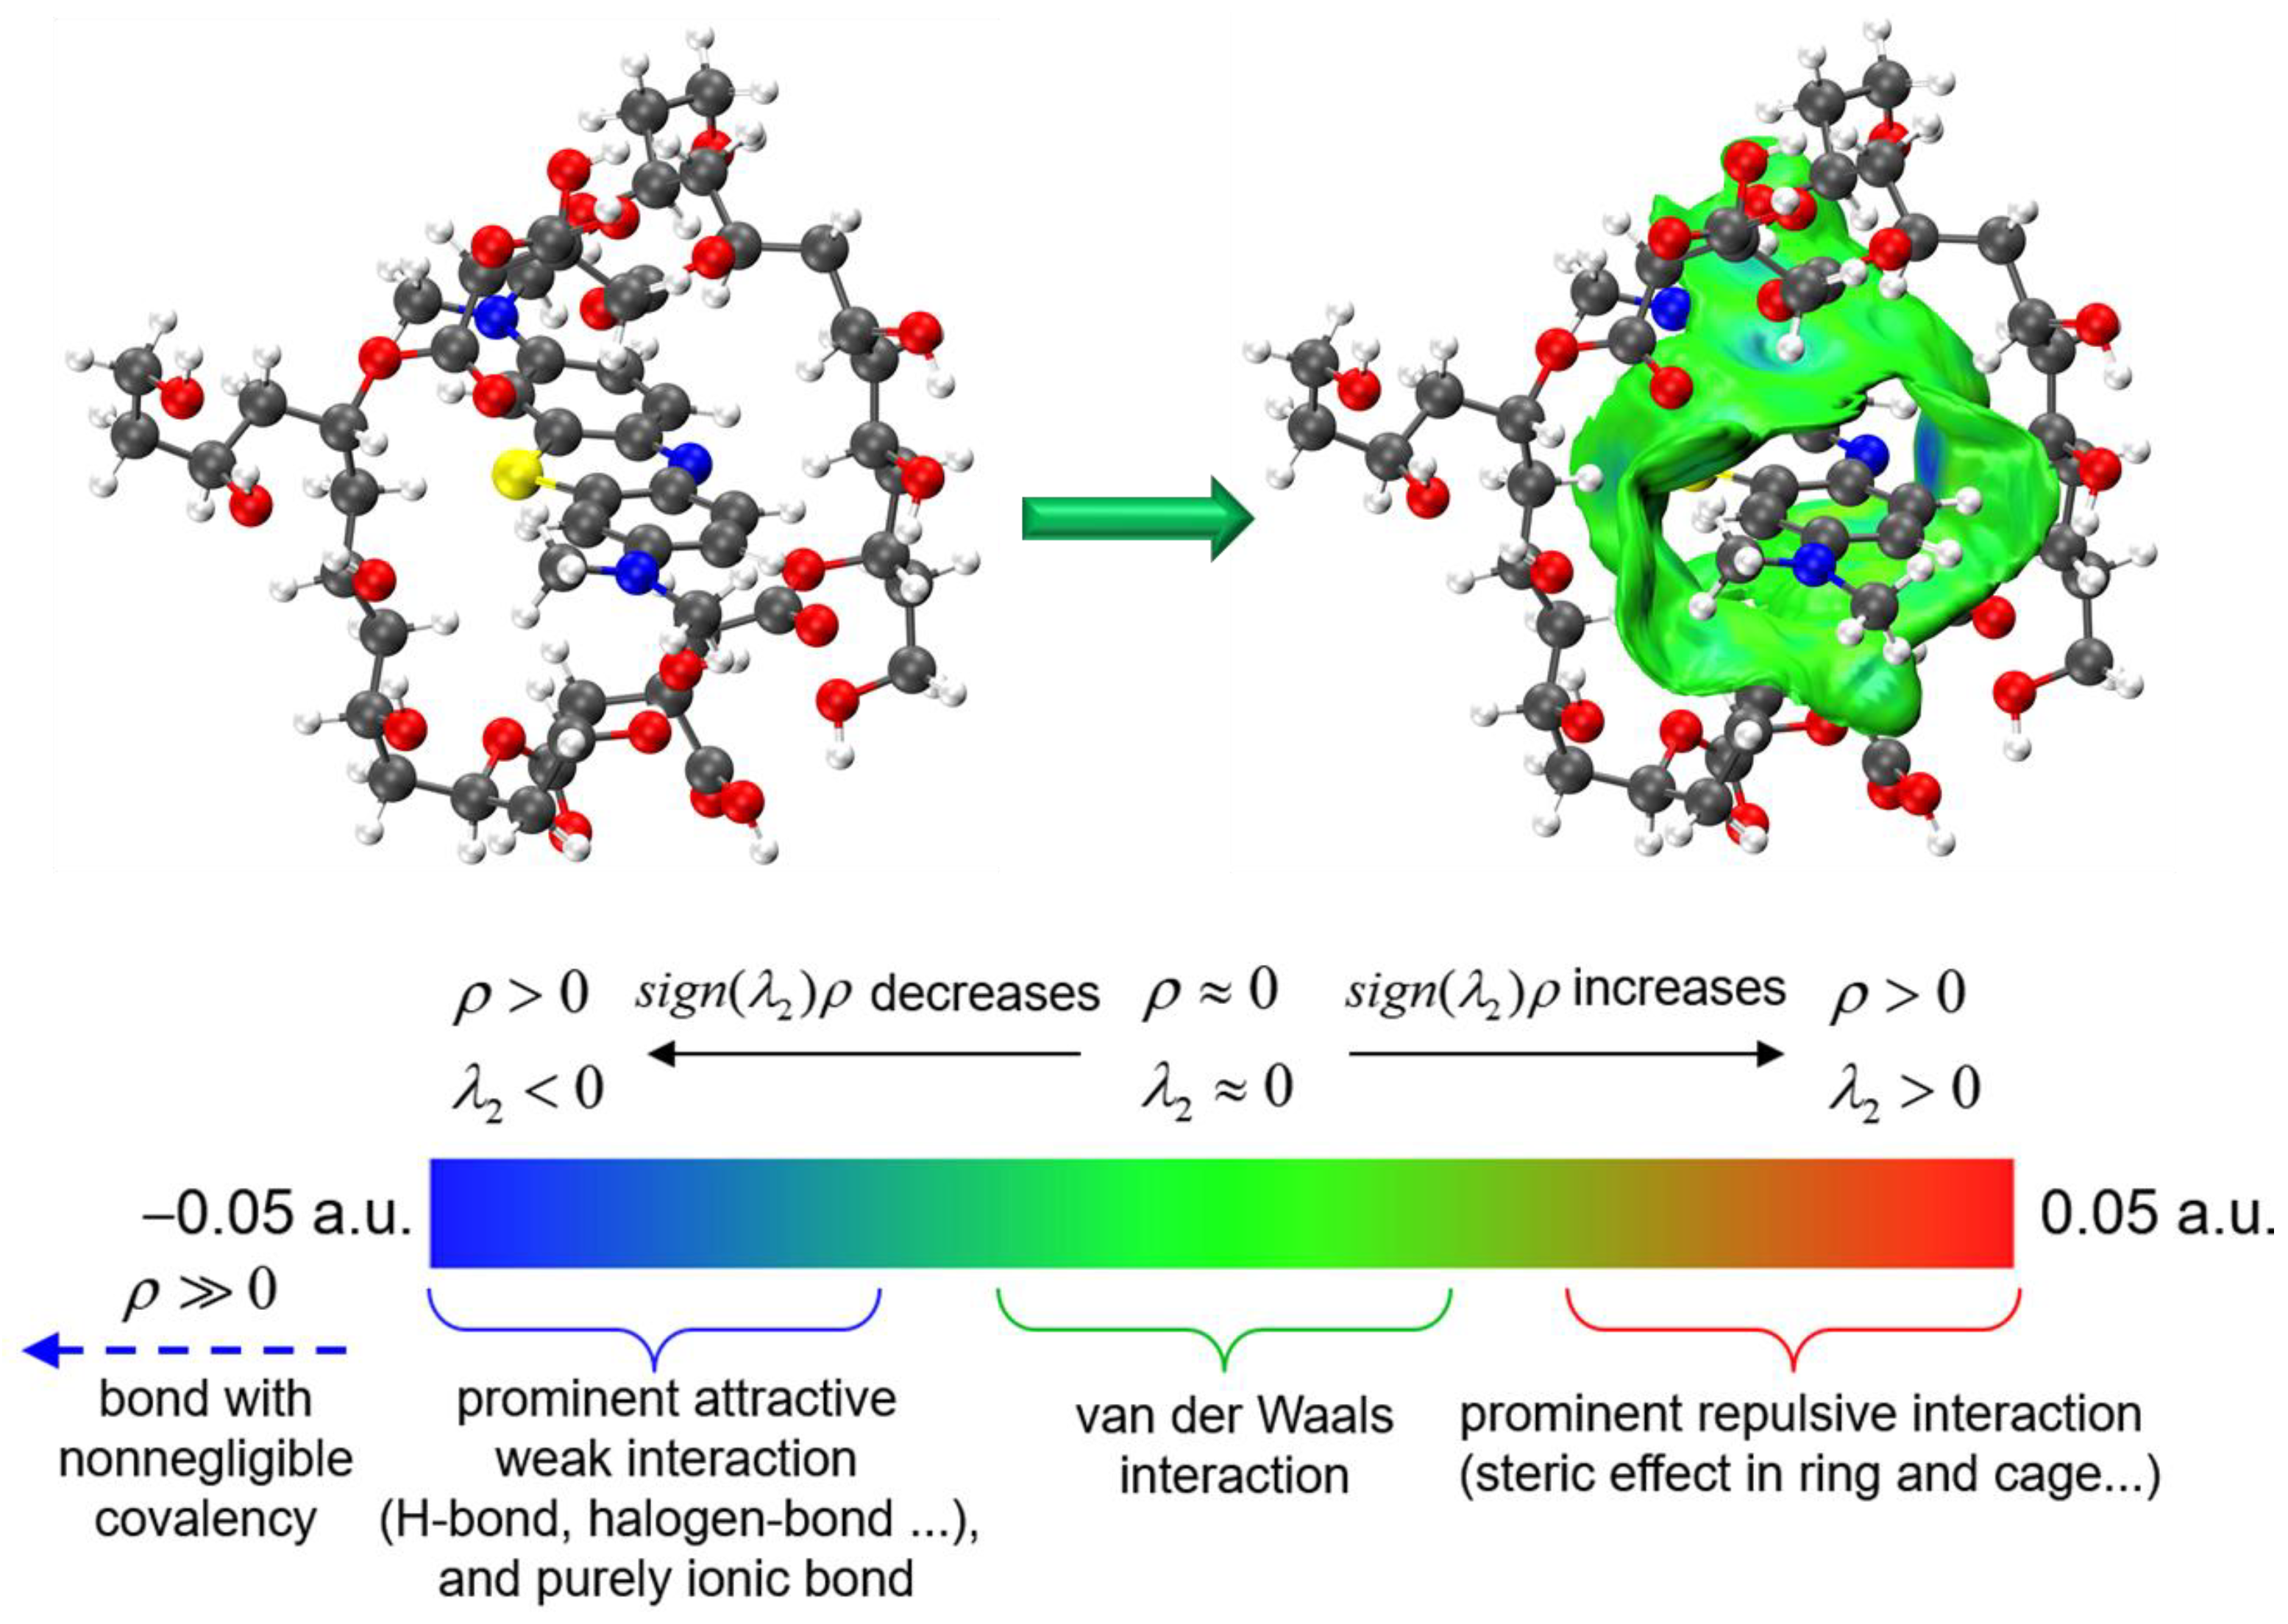
3.4.4. Simulation and Computational Analysis
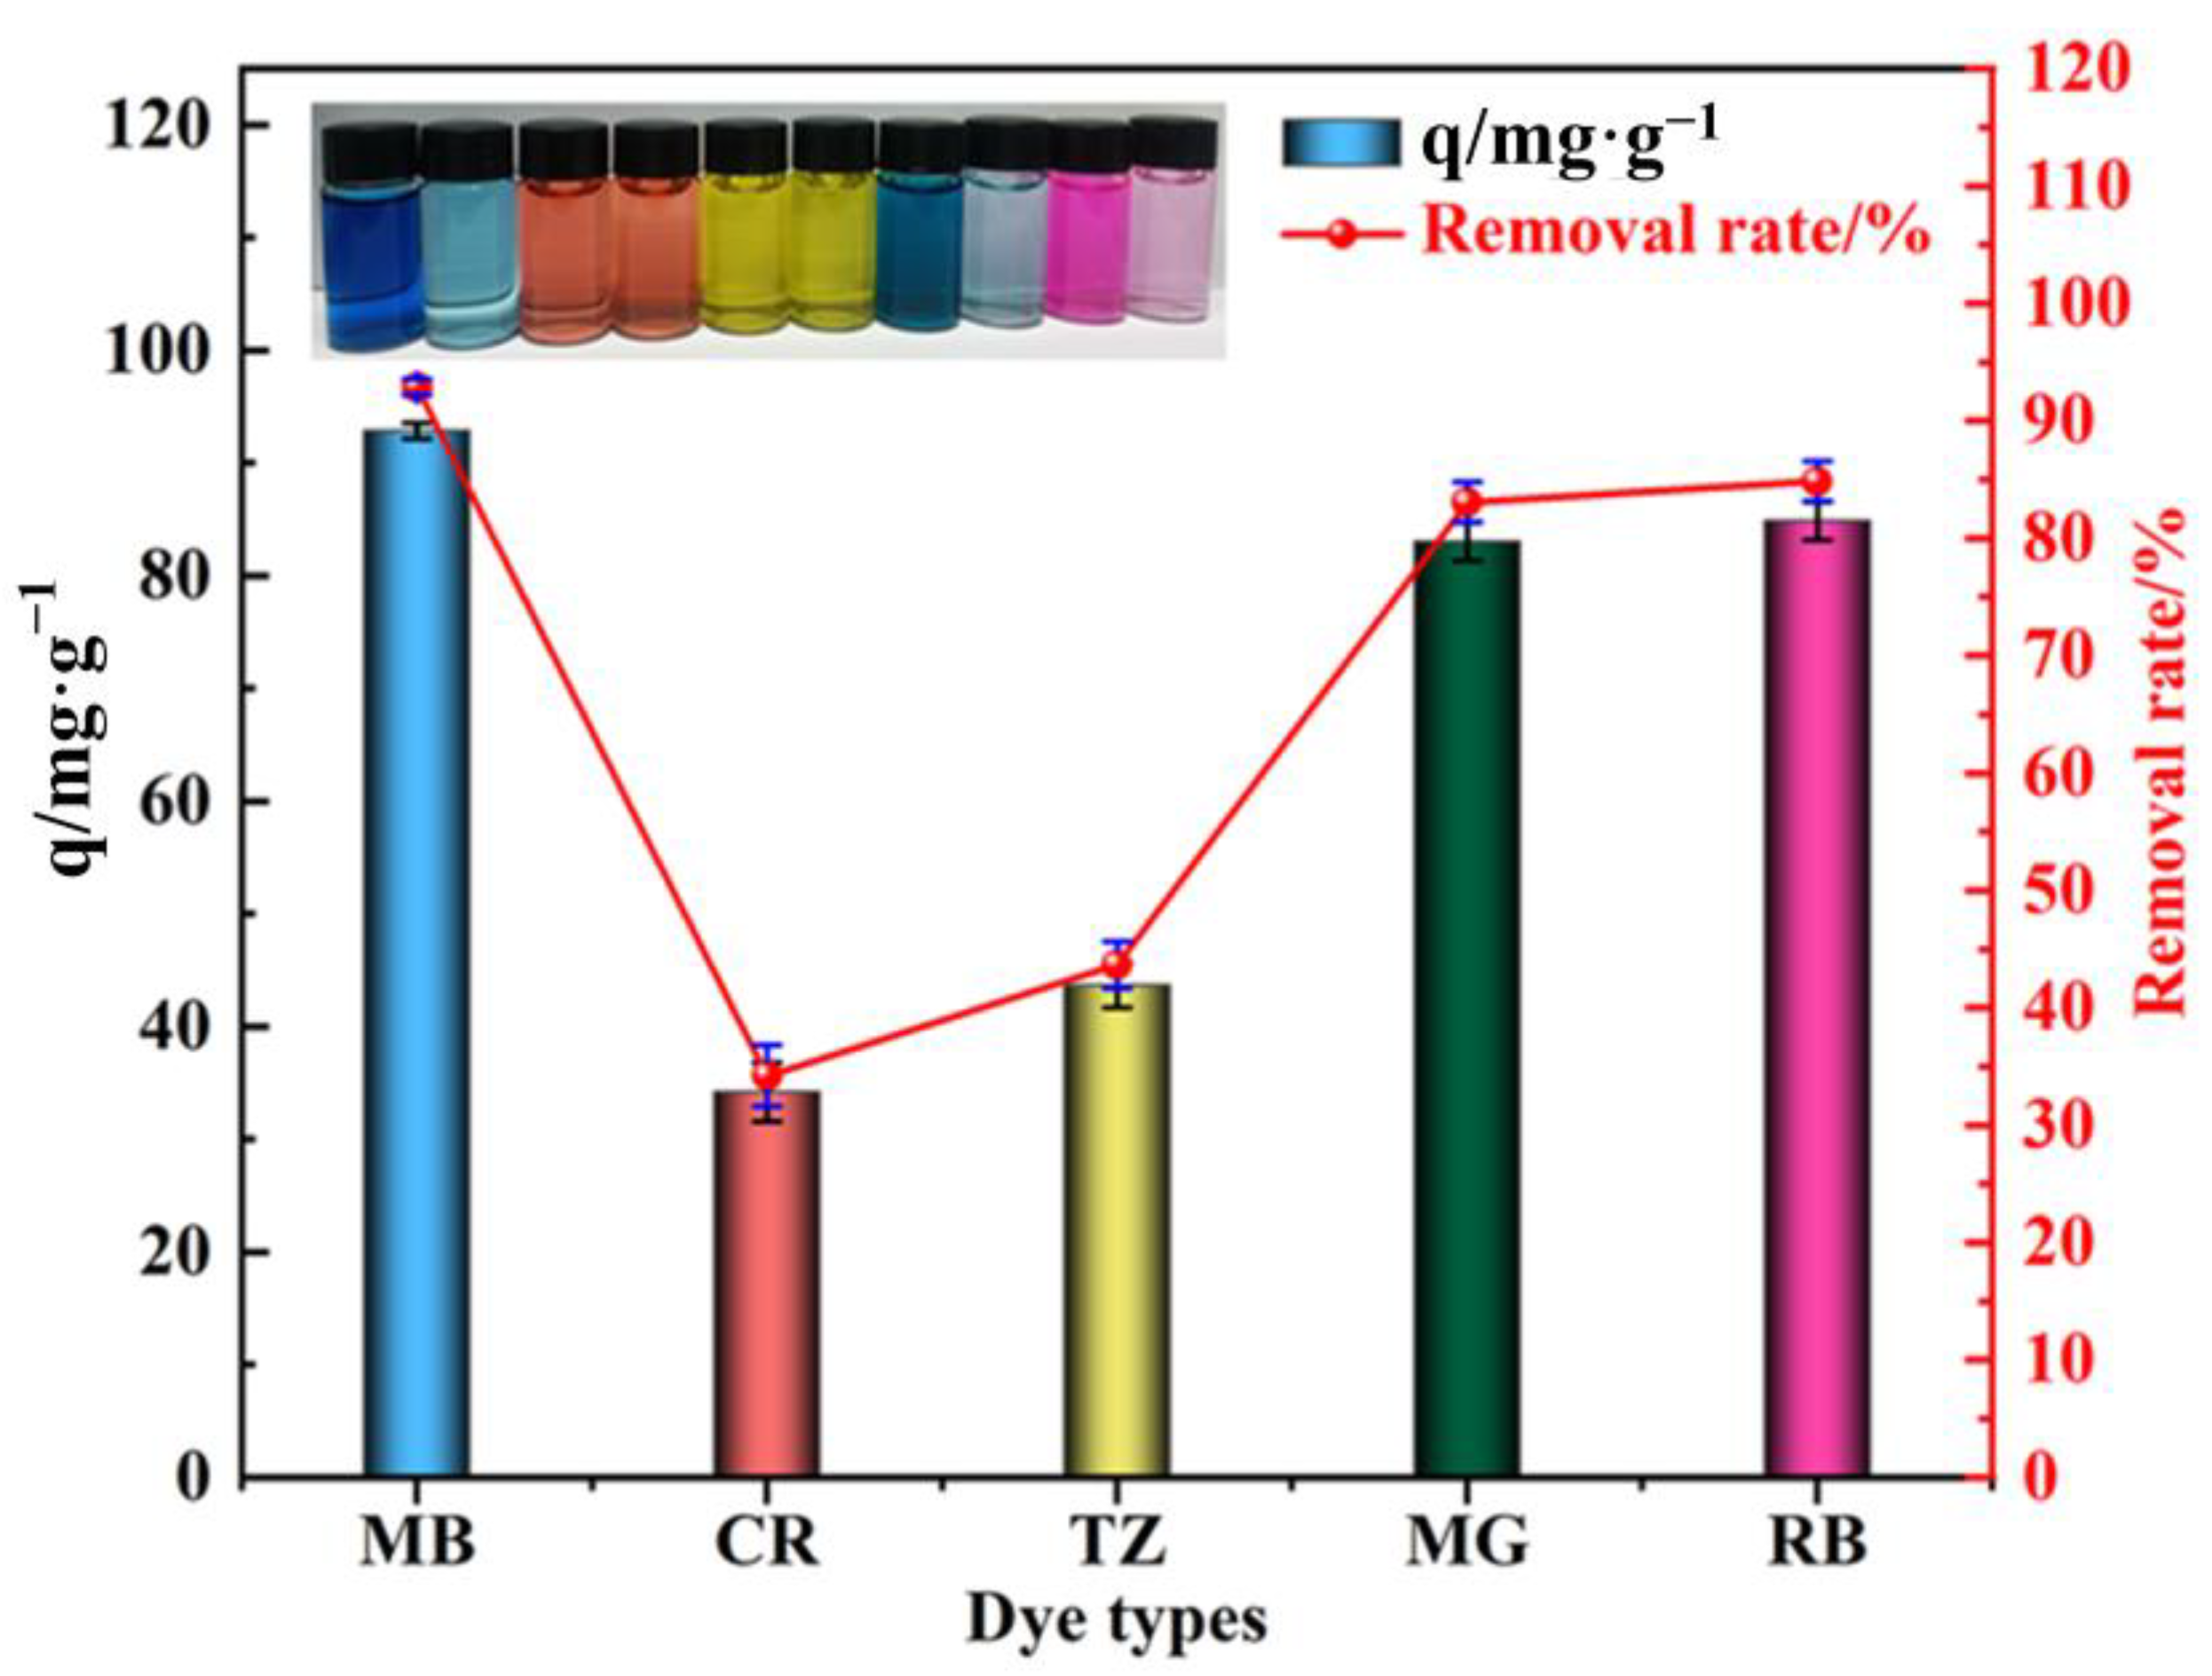
3.5. Generality Testing
4. Conclusions
Supplementary Materials
Author Contributions
Funding
Institutional Review Board Statement
Data Availability Statement
Conflicts of Interest
References
- Crini, G.; Lichtfouse, E.; Wilson, L.D.; Morin-Crini, N. Conventional and non-conventional adsorbents for wastewater treatment. Environ. Chem. Lett. 2018, 17, 195–213. [Google Scholar] [CrossRef]
- Saravanan, A.; Senthil Kumar, P.; Jeevanantham, S.; Karishma, S.; Tajsabreen, B.; Yaashikaa, P.R.; Reshma, B. Effective water/wastewater treatment methodologies for toxic pollutants removal: Processes and applications towards sustainable development. Chemosphere 2021, 280, 130595. [Google Scholar] [CrossRef]
- Abousalman-Rezvani, Z.; Roghani-Mamaqani, H.; Riazi, H.; Abousalman-Rezvani, O. Water treatment using stimuli-responsive polymers. Polym. Chem. 2022, 13, 5940–5964. [Google Scholar] [CrossRef]
- Kolya, H.; Kang, C.-W. Next-generation water treatment: Exploring the potential of biopolymer-based nanocomposites in adsorption and membrane filtration. Polymers 2023, 15, 3421. [Google Scholar] [CrossRef] [PubMed]
- Moharm, A.E.; El Naeem, G.A.; Soliman, H.M.A.; Abd-Elhamid, A.I.; El-Bardan, A.A.; Kassem, T.S.; Nayl, A.A.; Bräse, S. Fabrication and characterization of effective biochar biosorbent derived from agricultural waste to remove cationic dyes from wastewater. Polymers 2022, 14, 2587. [Google Scholar] [CrossRef] [PubMed]
- Ahmad, R.; Ejaz, M.O. Efficient adsorption of crystal violet (CV) dye onto benign chitosan-modified l-cysteine/bentonite (CS-Cys/Bent) bionanocomposite: Synthesis, characterization and experimental studies. Dyes Pigm. 2023, 216, 111305. [Google Scholar] [CrossRef]
- Eltaweil, A.S.; Elgarhy, G.S.; El-Subruiti, G.M.; Omer, A.M. Carboxymethyl cellulose/carboxylated graphene oxide composite microbeads for efficient adsorption of cationic methylene blue dye. Int. J. Biol. Macromol. 2020, 154, 307–318. [Google Scholar] [CrossRef]
- Li, Y.; Du, Q.; Liu, T.; Sun, J.; Wang, Y.; Wu, S.; Wang, Z.; Xia, Y.; Xia, L. Methylene blue adsorption on graphene oxide/calcium alginate composites. Carbohydr. Polym. 2013, 95, 501–507. [Google Scholar] [CrossRef]
- Chen, L.; Li, Y.; Du, Q.; Wang, Z.; Xia, Y.; Yedinak, E.; Lou, J.; Ci, L. High performance agar/graphene oxide composite aerogel for methylene blue removal. Carbohydr. Polym. 2017, 155, 345–353. [Google Scholar] [CrossRef]
- Kumar, A.; Sood, A.; Han, S.S. Poly (vinyl alcohol)-alginate as potential matrix for various applications: A focused review. Carbohydr. Polym. 2022, 277, 118881. [Google Scholar] [CrossRef]
- Baker, M.I.; Walsh, S.P.; Schwartz, Z.; Boyan, B.D. A review of polyvinyl alcohol and its uses in cartilage and orthopedic applications. J. Biomed. Mater. Res. B Appl. Biomater. 2012, 100, 1451–1457. [Google Scholar] [CrossRef] [PubMed]
- Su, J.F.; Bai, Y.H.; Huang, T.L.; Wei, L.; Gao, C.Y.; Wen, Q. Multifunctional modified polyvinyl alcohol: A powerful biomaterial for enhancing bioreactor performance in nitrate, Mn(II) and Cd(II) removal. Water Res. 2020, 168, 115152. [Google Scholar] [CrossRef] [PubMed]
- Liang, H.; Zou, C. Adsorption of naphthenic acids from oil sand process-affected water with water-insoluble poly (β-cyclodextrin-citric acid). Can. J. Chem. Eng. 2019, 97, 1894–1902. [Google Scholar] [CrossRef]
- Yu, P.; Zhou, G.; Yang, R.; Li, Y.; Zhang, L.; Sun, L.; Fu, X.; Hao, T. Green synthesis of ion-imprinted macroporous composite magnetic hydrogels for selective removal of nickel (II) from wastewater. J. Mol. Liq. 2021, 344, 117963. [Google Scholar] [CrossRef]
- Teodorescu, M.; Bercea, M.; Morariu, S. Biomaterials of PVA and PVP in medical and pharmaceutical applications: Perspectives and challenges. Biotechnol. Adv. 2019, 37, 109–131. [Google Scholar] [CrossRef]
- Panda, P.K.; Sadeghi, K.; Seo, J. Recent advances in poly (vinyl alcohol)/natural polymer based films for food packaging applications: A review. Food Packag. Shelf Life 2022, 33, 100904. [Google Scholar] [CrossRef]
- Moulay, S. Review: Poly(vinyl alcohol) functionalizations and applications. Polym. Plast. Technol. Eng. 2015, 54, 1289–1319. [Google Scholar] [CrossRef]
- Seligra, P.G.; Medina Jaramillo, C.; Fama, L.; Goyanes, S. Biodegradable and non-retrogradable eco-films based on starch-glycerol with citric acid as crosslinking agent. Carbohydr. Polym. 2016, 138, 66–74. [Google Scholar] [CrossRef] [PubMed]
- Song, P.; Wang, H. High-performance polymeric materials through hydrogen-bond cross-linking. Adv. Mater. 2020, 32, e1901244. [Google Scholar] [CrossRef]
- Park, H.-R.; Chough, S.-H.; Yun, Y.-H.; Yoon, S.-D. Properties of starch/PVA blend films containing citric acid as additive. J. Polym. Environ. 2005, 13, 375–382. [Google Scholar] [CrossRef]
- Verma, P.; Srivastava, A.; Shukla, A.; Tandon, P.; Shimpi, M.R. Vibrational spectra, hydrogen bonding interactions and chemical reactivity analysis of nicotinamide-citric acid cocrystals by an experimental and theoretical approach. New J. Chem. 2019, 43, 15956–15967. [Google Scholar] [CrossRef]
- Zhang, W.; Roy, S.; Assadpour, E.; Cong, X.; Jafari, S.M. Cross-linked biopolymeric films by citric acid for food packaging and preservation. Adv. Colloid Interface Sci. 2023, 314, 102886. [Google Scholar] [CrossRef] [PubMed]
- Truong, Y.B.; Choi, J.; Mardel, J.; Gao, Y.; Maisch, S.; Musameh, M.; Kyratzis, I.L. Functional cross-linked electrospun polyvinyl alcohol membranes and their potential applications. Macromol. Mater. Eng. 2017, 302, 1700024. [Google Scholar] [CrossRef]
- Gürler, N.; Paşa, S.; Erdoğan, Ö.; Cevik, O. Physicochemical properties for food packaging and toxicity behaviors against healthy cells of environmentally friendly biocompatible starch/citric acid/polyvinyl alcohol biocomposite films. Starke 2021, 75, 2100074. [Google Scholar] [CrossRef]
- Shameli, A.; Ameri, E. Synthesis of cross-linked PVA membranes embedded with multi-wall carbon nanotubes and their application to esterification of acetic acid with methanol. Chem. Eng. J. 2017, 309, 381–396. [Google Scholar] [CrossRef]
- Reddy, N.; Yang, Y. Citric acid cross-linking of starch films. Food Chem. 2010, 118, 702–711. [Google Scholar] [CrossRef]
- Yang, W.; He, X.; Luzi, F.; Dong, W.; Zheng, T.; Kenny, J.M.; Puglia, D.; Ma, P. Thermomechanical, antioxidant and moisture behaviour of PVA films in presence of citric acid esterified cellulose nanocrystals. Int. J. Biol. Macromol. 2020, 161, 617–626. [Google Scholar] [CrossRef]
- Díez, B.; Homer, W.J.A.; Leslie, L.J.; Kyriakou, G.; Rosal, R.; Topham, P.D.; Theodosiou, E. Chemically cross-linked poly(vinyl alcohol) electrospun fibrous mats as wound dressing materials. J. Chem. Technol. Biotechnol. 2021, 97, 620–632. [Google Scholar] [CrossRef]
- Hajialigol, S.; Masoum, S. Optimization of biosorption potential of nano biomass derived from walnut shell for the removal of malachite green from liquids solution: Experimental design approaches. J. Mol. Liq. 2019, 286, 110904. [Google Scholar] [CrossRef]
- Heo, J.W.; An, L.; Chen, J.; Bae, J.H.; Kim, Y.S. Preparation of amine-functionalized lignins for the selective adsorption of methylene blue and congo red. Chemosphere 2022, 295, 133815. [Google Scholar] [CrossRef]
- Durrani, W.Z.; Nasrullah, A.; Khan, A.S.; Fagieh, T.M.; Bakhsh, E.M.; Akhtar, K.; Khan, S.B.; Din, I.U.; Khan, M.A.; Bokhari, A. Adsorption efficiency of date palm based activated carbon-alginate membrane for methylene blue. Chemosphere 2022, 302, 134793. [Google Scholar] [CrossRef] [PubMed]
- Karaman, C.; Karaman, O.; Show, P.L.; Orooji, Y.; Karimi-Maleh, H. Utilization of a double-cross-linked amino-functionalized three-dimensional graphene networks as a monolithic adsorbent for methyl orange removal: Equilibrium, kinetics, thermodynamics and artificial neural network modeling. Environ. Res. 2022, 207, 112156. [Google Scholar] [CrossRef] [PubMed]
- Kumar, M.; Tamilarasan, R.; Sivakumar, V. Adsorption of Victoria blue by carbon/Ba/alginate beads: Kinetics, thermodynamics and isotherm studies. Carbohydr. Polym. 2013, 98, 505–513. [Google Scholar] [CrossRef] [PubMed]
- Lu, T.; Chen, Q. Independent gradient model based on Hirshfeld partition: A new method for visual study of interactions in chemical systems. J. Comput. Chem. 2022, 43, 539–555. [Google Scholar] [CrossRef]
- Lu, T.; Chen, F. Multiwfn: A multifunctional wavefunction analyzer. J. Comput. Chem. 2012, 33, 580–592. [Google Scholar] [CrossRef]
- Chang, S.; Simeng, Y.; Henglong, T.; Shihao, F.; Zhu, L. Adsorption properties and interactions analysis of cyclodextrin-based polymer networks towards organic dyes. Carbohydr. Polym. Technol. Appl. 2023, 5, 100317. [Google Scholar] [CrossRef]
- He, Y.; Ke, H.; Lu, Y. Alcoholysis of ethylene-vinyl acetate copolymer catalyzed by alkaline: A kinetic study based on in situ FTIR spectroscopy. Chem. Eng. J. 2023, 464, 142695. [Google Scholar] [CrossRef]
- Liu, C.; Song, L.; Cao, S.; Zhang, H.; Han, J. Green synthesis of 2-hydroxypropyl-β-cyclodextrin polymers crosslinked by citric acid for highly efficient removal of methylene blue. Polymer 2023, 280, 126043. [Google Scholar] [CrossRef]
- Liudvinaviciute, D.; Rutkaite, R.; Bendoraitiene, J.; Klimaviciute, R. Thermogravimetric analysis of caffeic and rosmarinic acid containing chitosan complexes. Carbohydr. Polym. 2019, 222, 115003. [Google Scholar] [CrossRef]
- Altaher, H.; Khalil, T.E.; Abubeah, R. The effect of dye chemical structure on adsorption on acated carbon: A comparative study. Color. Technol. 2014, 130, 205–214. [Google Scholar] [CrossRef]
- Chen, Z.; Song, X.; Soh, W.W.M.; Wen, Y.; Zhu, J.; Zhang, M.; Li, J. In situ synthesis of magnetic Poly(DMAEAB-co-NIPAm)@Fe3O4 composite hydrogel for removal of dye from water. Gels 2021, 7, 201. [Google Scholar] [CrossRef] [PubMed]
- Fathy, M.; Moghny, T.A.; Mousa, M.A.; Abdelraheem, O.H.; Emam, A.A. Synthesis and study bromophenol blue dye adsorption efficiency of reduced graphene oxide produced by catalytic acid spray (CAS) method. J. Aust. Ceram. Soc. 2019, 56, 567–577. [Google Scholar] [CrossRef]
- Rathour, R.K.S.; Bhattacharya, J.; Mukherjee, A. β-Cyclodextrin conjugated graphene oxide: A regenerative adsorbent for cadmium methylene blue. J. Mol. Liq. 2019, 282, 606–616. [Google Scholar] [CrossRef]
- Wang, W.; Tian, G.; Wang, D.; Zhang, Z.; Kang, Y.; Zong, L.; Wang, A. All-into-one strategy to synthesize mesoporous hybrid silicate microspheres from naturally rich red palygorskite clay as high-efficient adsorbents. Sci. Rep. 2016, 6, 39599. [Google Scholar] [CrossRef] [PubMed]
- Hussain, M.; Gao, Y.; Semba, S.; Irshad, M.; Shair, F. Examination of optimum benefits of customer and LSE by incentive and dynamic price-based demand response. Energy Sources Part B 2020, 15, 383–401. [Google Scholar] [CrossRef]
- Wu, J.; Dong, Z.; Li, X.; Li, P.; Wei, J.; Hu, M.; Geng, L.; Peng, X. Constructing acid-resistant chitosan/cellulose nanofibrils composite membrane for the adsorption of methylene blue. J. Environ. Chem. Eng. 2022, 10, 107754. [Google Scholar] [CrossRef]
- Zhu, X.; An, S.; Liu, Y.; Hu, J.; Liu, H.; Tian, C.; Dai, S.; Yang, X.; Wang, H.; Abney, C.W. Efficient removal of organic dye pollutants using covalent organic frameworks. AIChE J. 2017, 63, 3470–3478. [Google Scholar] [CrossRef]
- Krishna Kumar, A.S.; Warchol, J.; Matusik, J.; Tseng, W.L.; Rajesh, N.; Bajda, T. Heavy metal and organic dye removal via a hybrid porous hexagonal boron nitride-based magnetic aerogel. NPJ Clean Water 2022, 5, 24. [Google Scholar] [CrossRef]


| Adsorbent Material | Adsorption Capacity (mg g−1) | Ref. |
|---|---|---|
| Walnut shell | 11.76 | [29] |
| Date pit-activated carbon | 39.68 | [29] |
| Polymeric hydrogel | 355.9 | [40] |
| Reduced graphene oxide | 37.78 | [41] |
| Nickel oxide nanoparticles | 93.46 | [42] |
| β-CD conjugated graphene oxide | 323.98 | [43] |
| Mg-Silicate | 408.0 | [44] |
| Chitosan coated sodium zeolites | 287.0 | [45] |
| Cellulose nanofibrils | 14.71 | [46] |
| TS–COF–2 | 445.0 | [47] |
| PVA–CA | 709.86 | This work |
| MB Concentration/mg L−1 | Kinetic Model Categories and Related Parameters | ||||||
|---|---|---|---|---|---|---|---|
| qe /mg g−1 | Quasi-First-Order Kinetic Model | Quasi-Second-Order Kinetic Model | |||||
| qe,cal/mg g−1 | K1/min−1 | R2 | qe,cal/mg g−1 | K2/min−1 | R2 | ||
| 50 | 94.0 | 106.49 | 0.0175 | 0.97709 | 90.56 | 0.00028 | 0.99145 |
| 100 | 189.6 | 104.64 | 0.0137 | 0.92136 | 195.53 | 0.00017 | 0.99566 |
| 150 | 285.6 | 354.61 | 0.0115 | 0.96437 | 286.97 | 0.00003 | 0.99171 |
| Temperature/K | Isothermal Adsorption Model Categories and Related Parameters | |||||
|---|---|---|---|---|---|---|
| Langmuir | Freundlich | |||||
| qmax/mg g−1 | KL L mg−1 | R2 | 1/n | KF/L mg−1 | R2 | |
| 303 | 603.29 | 0.05767 | 0.9435 | 0.4188 | 102.8605 | 0.7323 |
| 313 | 650.72 | 0.06423 | 0.9514 | 0.3940 | 106.6763 | 0.7901 |
| 323 | 709.86 | 0.07213 | 0.9728 | 0.3670 | 112.7007 | 0.8244 |
| The Concentration of MB/mg L−1 | Temperature/K | ΔG0/kJ mol−1 | ΔH0/kJ mol−1 | ΔS0/J mol−1 K−1 |
|---|---|---|---|---|
| 100 | 303 | −7.4976 | 18.5012 | 85.8045 |
| 313 | −8.3556 | |||
| 323 | −9.2137 | |||
| 150 | 303 | −8.0464 | 28.2333 | 119.7350 |
| 313 | −9.2438 | |||
| 323 | −10.4411 | |||
| 200 | 303 | −7.6380 | 27.8958 | 117.2734 |
| 313 | −8.8108 | |||
| 323 | −9.9835 | |||
| 250 | 303 | −6.5670 | 28.9155 | 117.1038 |
| 313 | −7.7380 | |||
| 323 | −8.9090 | |||
| 300 | 303 | −4.5836 | 30.7286 | 116.6739 |
| 313 | −5.7503 | |||
| 323 | −6.9171 |
| PVA–CA-MB Total Energy/Ha | PVA–CA Energy/Ha | MB Energy/Ha | Adsorption Energy/Ha | Adsorption Energy/kJ mol−1 |
|---|---|---|---|---|
| −4474.5128 | −3291.8174 | −1182.6135 | −0.0819 | −215.0310 |
Disclaimer/Publisher’s Note: The statements, opinions and data contained in all publications are solely those of the individual author(s) and contributor(s) and not of MDPI and/or the editor(s). MDPI and/or the editor(s) disclaim responsibility for any injury to people or property resulting from any ideas, methods, instructions or products referred to in the content. |
© 2023 by the authors. Licensee MDPI, Basel, Switzerland. This article is an open access article distributed under the terms and conditions of the Creative Commons Attribution (CC BY) license (https://creativecommons.org/licenses/by/4.0/).
Share and Cite
He, Y.; Zheng, Y.; Liu, X.; Liu, C.; Zhang, H.; Han, J. Polyvinyl Alcohol–Citric Acid: A New Material for Green and Efficient Removal of Cationic Dye Wastewater. Polymers 2023, 15, 4341. https://doi.org/10.3390/polym15224341
He Y, Zheng Y, Liu X, Liu C, Zhang H, Han J. Polyvinyl Alcohol–Citric Acid: A New Material for Green and Efficient Removal of Cationic Dye Wastewater. Polymers. 2023; 15(22):4341. https://doi.org/10.3390/polym15224341
Chicago/Turabian StyleHe, Ye, Yangyang Zheng, Xia Liu, Chang Liu, Huacheng Zhang, and Jie Han. 2023. "Polyvinyl Alcohol–Citric Acid: A New Material for Green and Efficient Removal of Cationic Dye Wastewater" Polymers 15, no. 22: 4341. https://doi.org/10.3390/polym15224341
APA StyleHe, Y., Zheng, Y., Liu, X., Liu, C., Zhang, H., & Han, J. (2023). Polyvinyl Alcohol–Citric Acid: A New Material for Green and Efficient Removal of Cationic Dye Wastewater. Polymers, 15(22), 4341. https://doi.org/10.3390/polym15224341