
Utilization of Torrefied and Non-Torrefied Short Rotation Willow in Wood–Plastic Composites


Abstract
:1. Introduction
2. Materials and Methods
2.1. Materials
2.2. Preparation and Characterization of the Filler
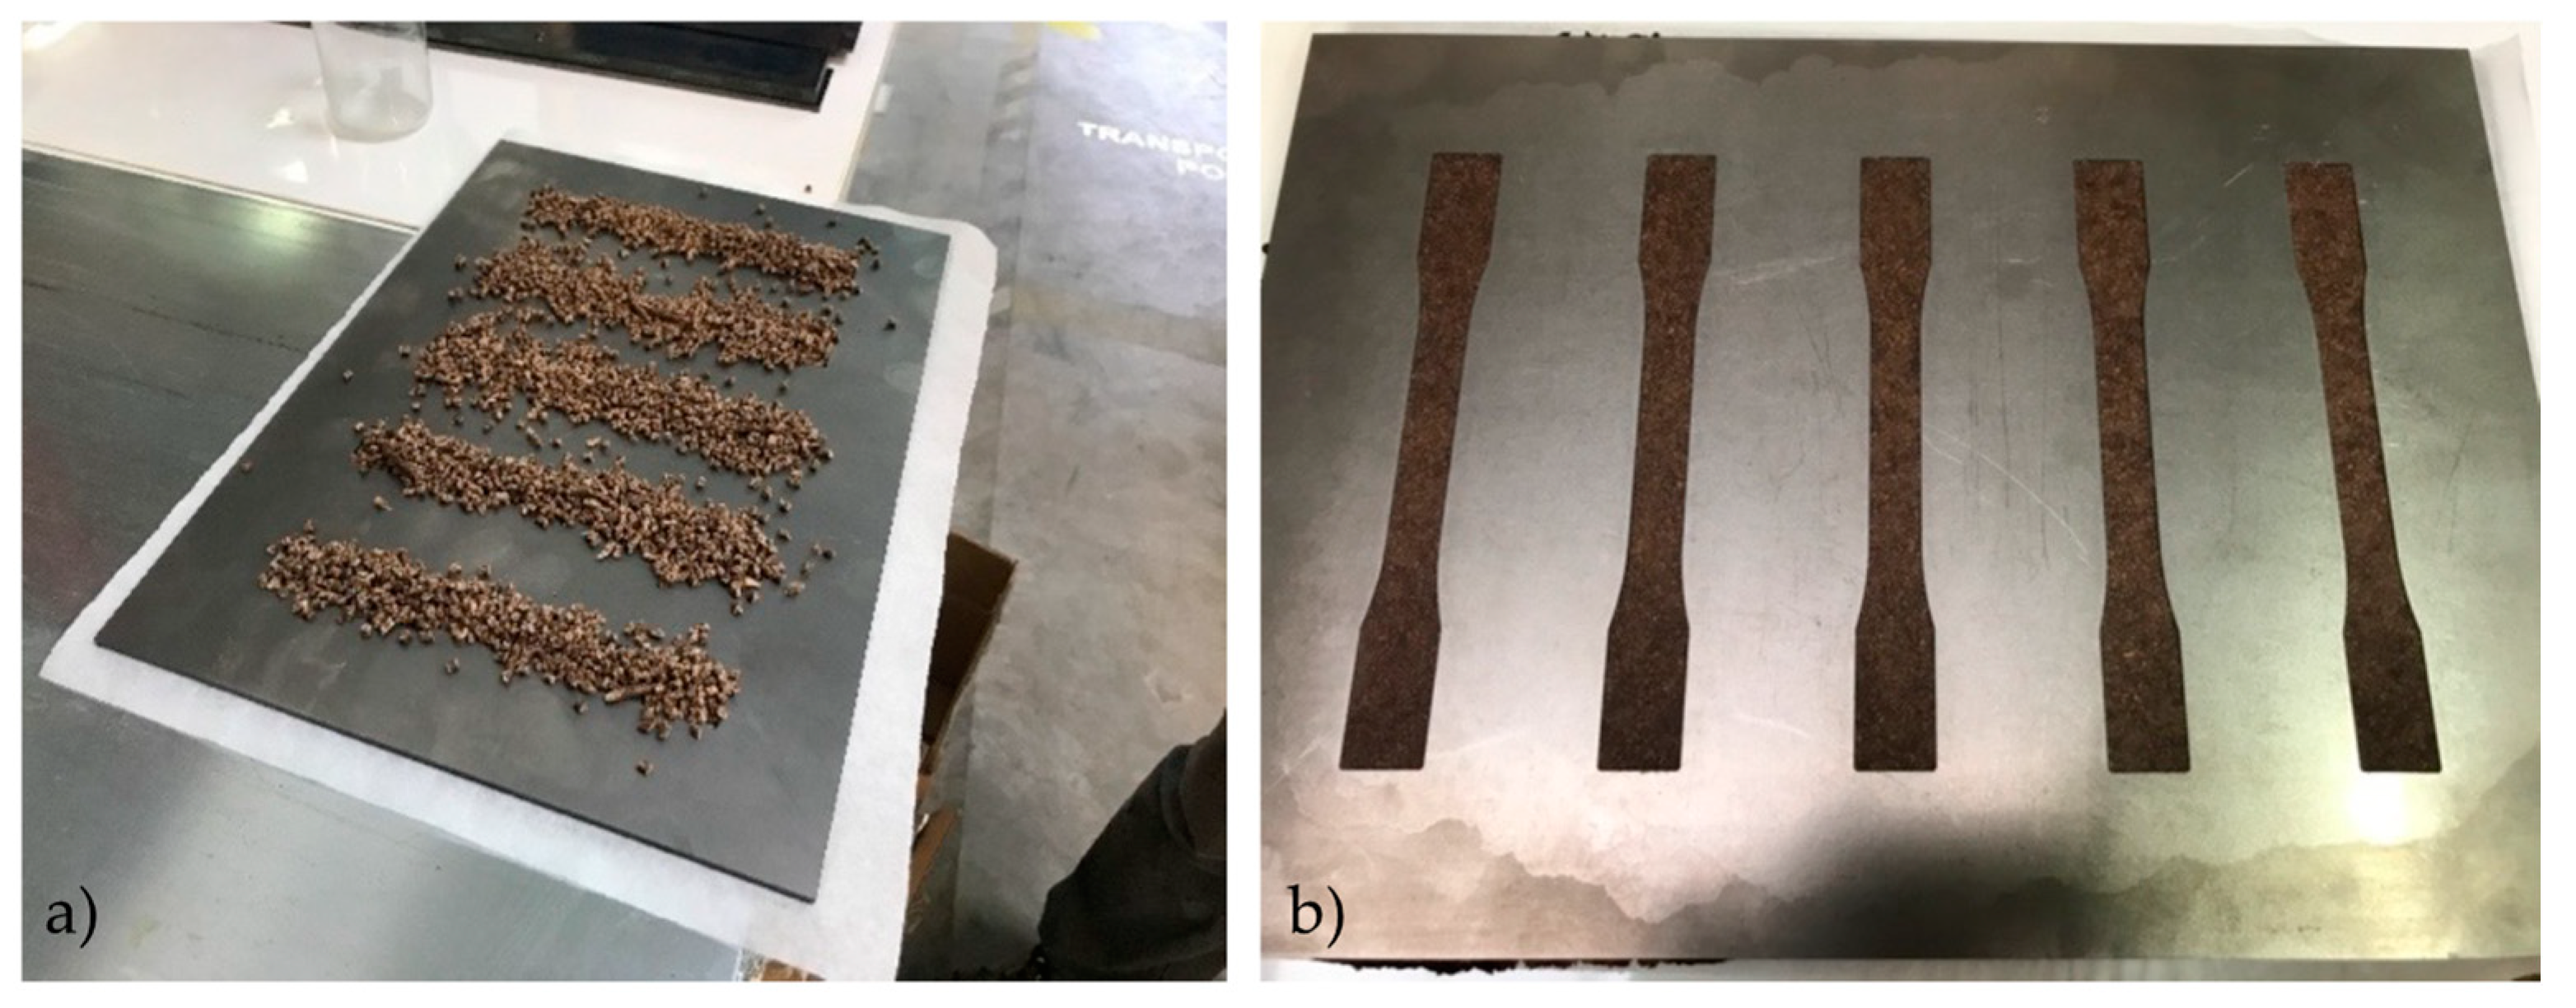
2.3. Blending and Production of WPC
2.4. Scanning Electron Microscopy
2.5. Mechanical Properties
2.6. Water Absorption
2.7. Thermal Properties
- First heating cycle from 25 to 190 °C at 20 °C/min.
- Cooling cycle from 190 to −30 °C at 20 °C/min.
- Second heating cycle from −30 to 190 °C at 20 °C/min.
2.8. Statistical Evaluation
3. Results and Discussion
3.1. Particle Size of the Raw and Torrefied Wood Fillers
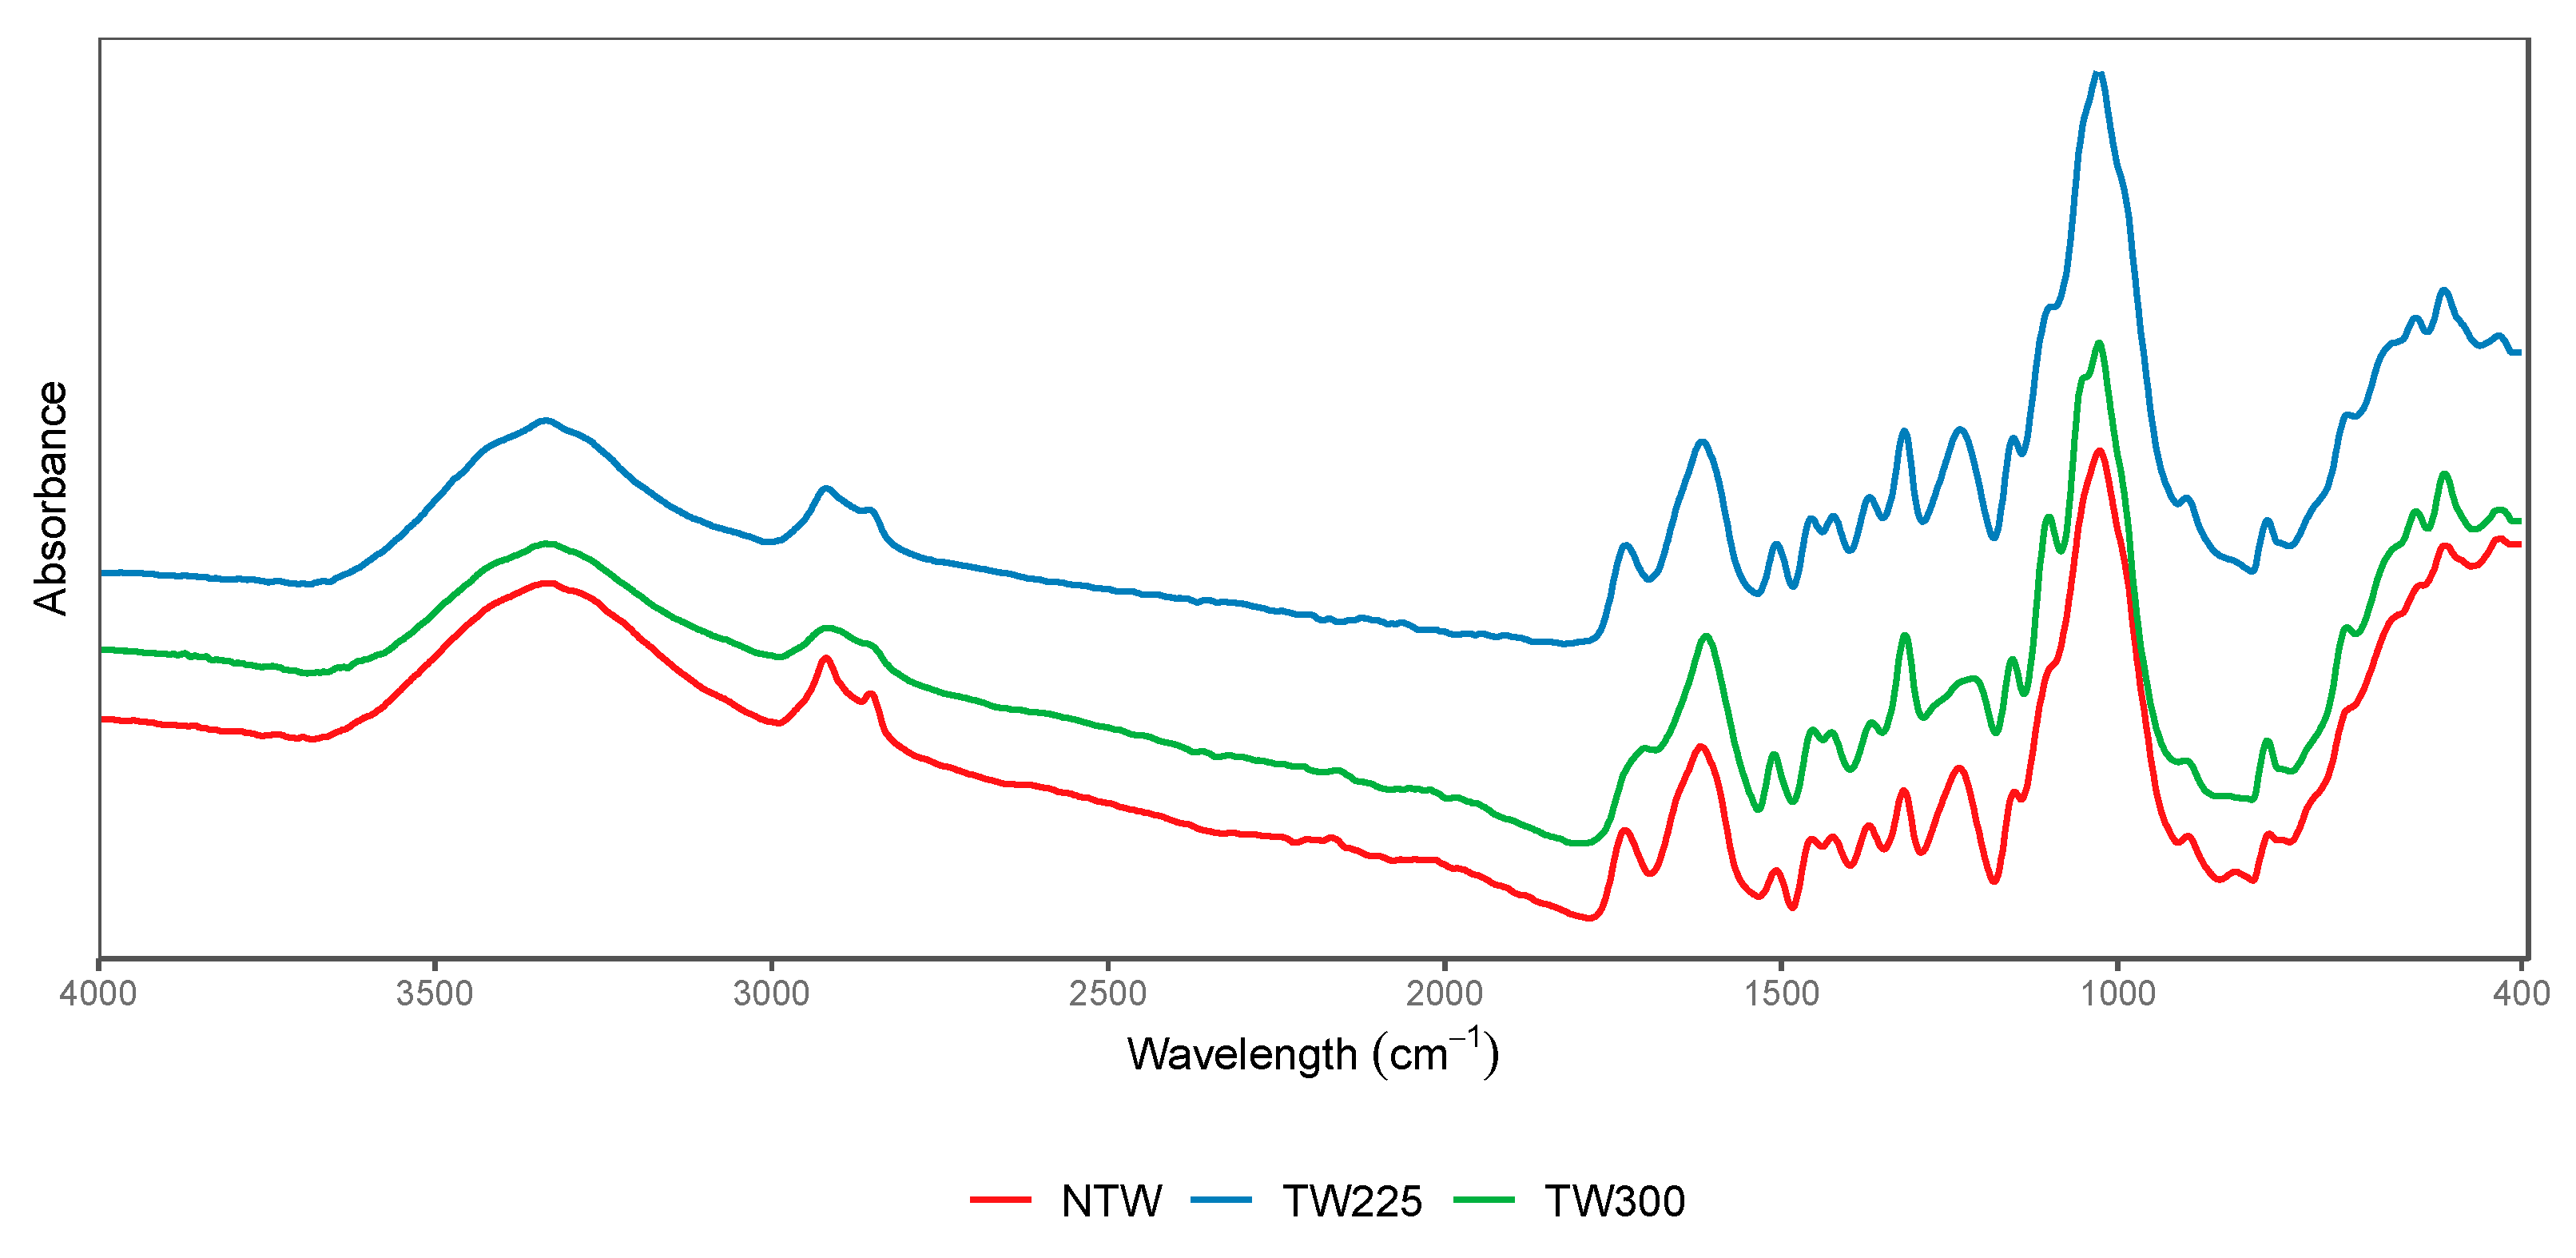
3.2. FTIR
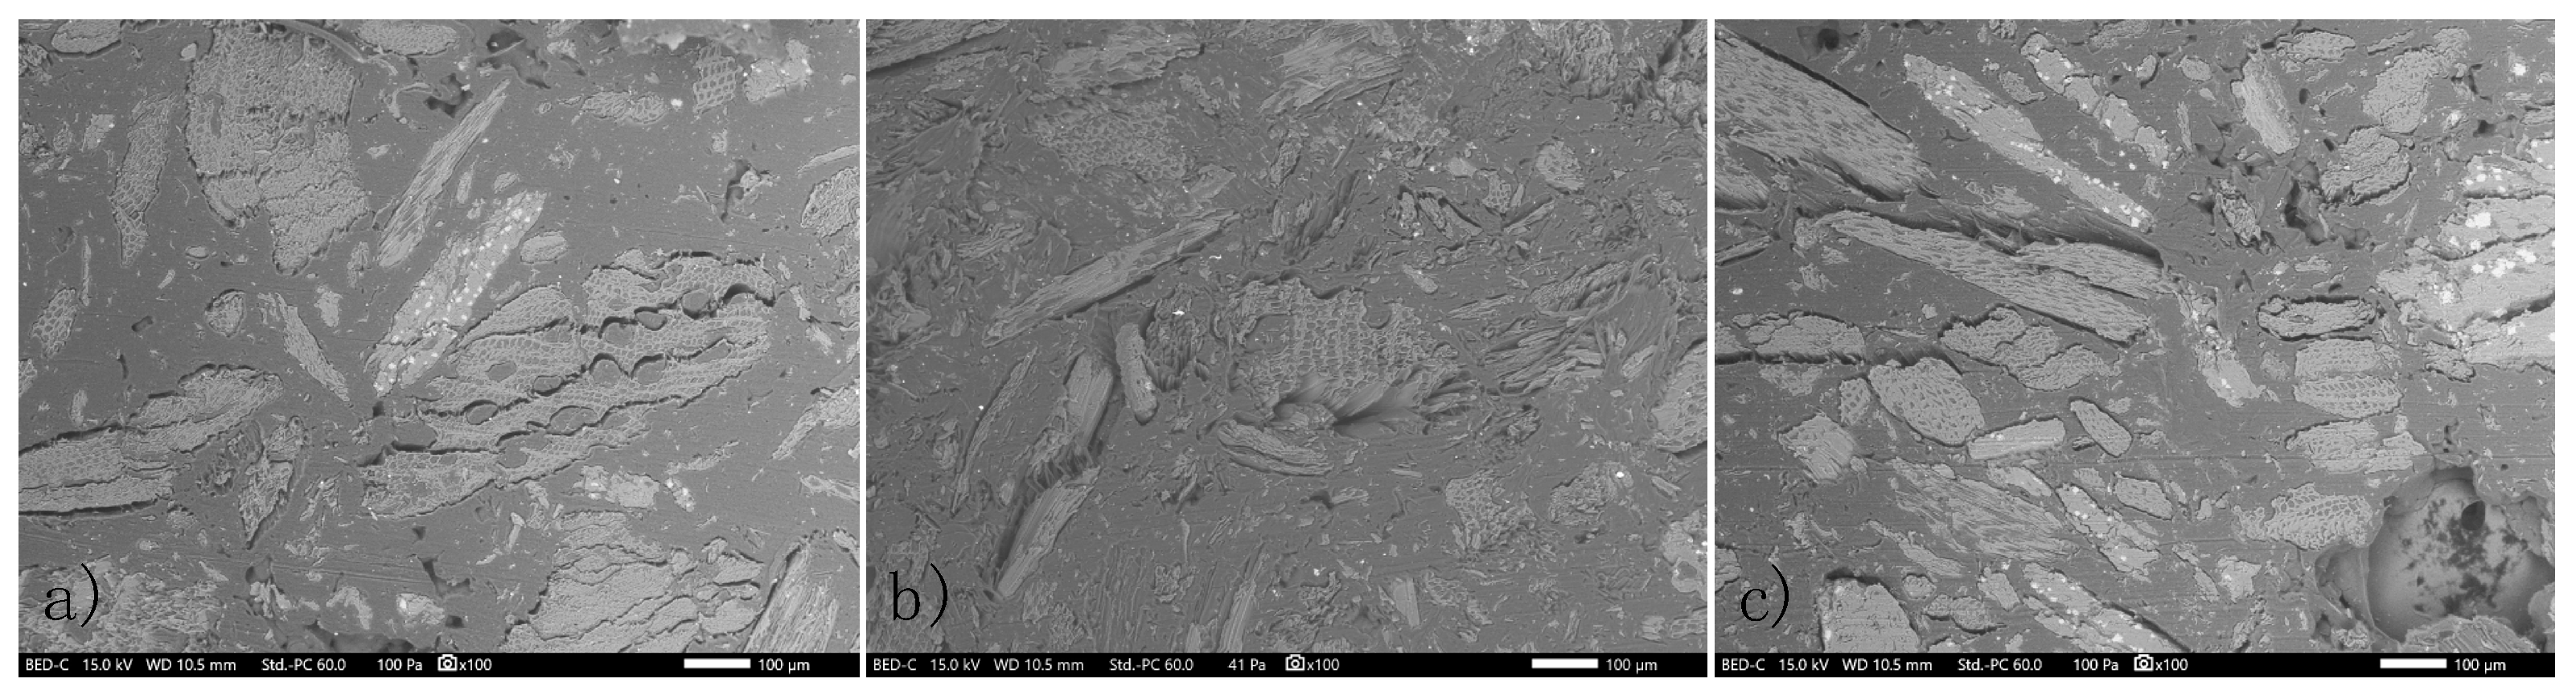
3.3. SEM
3.4. Mechanical Properties
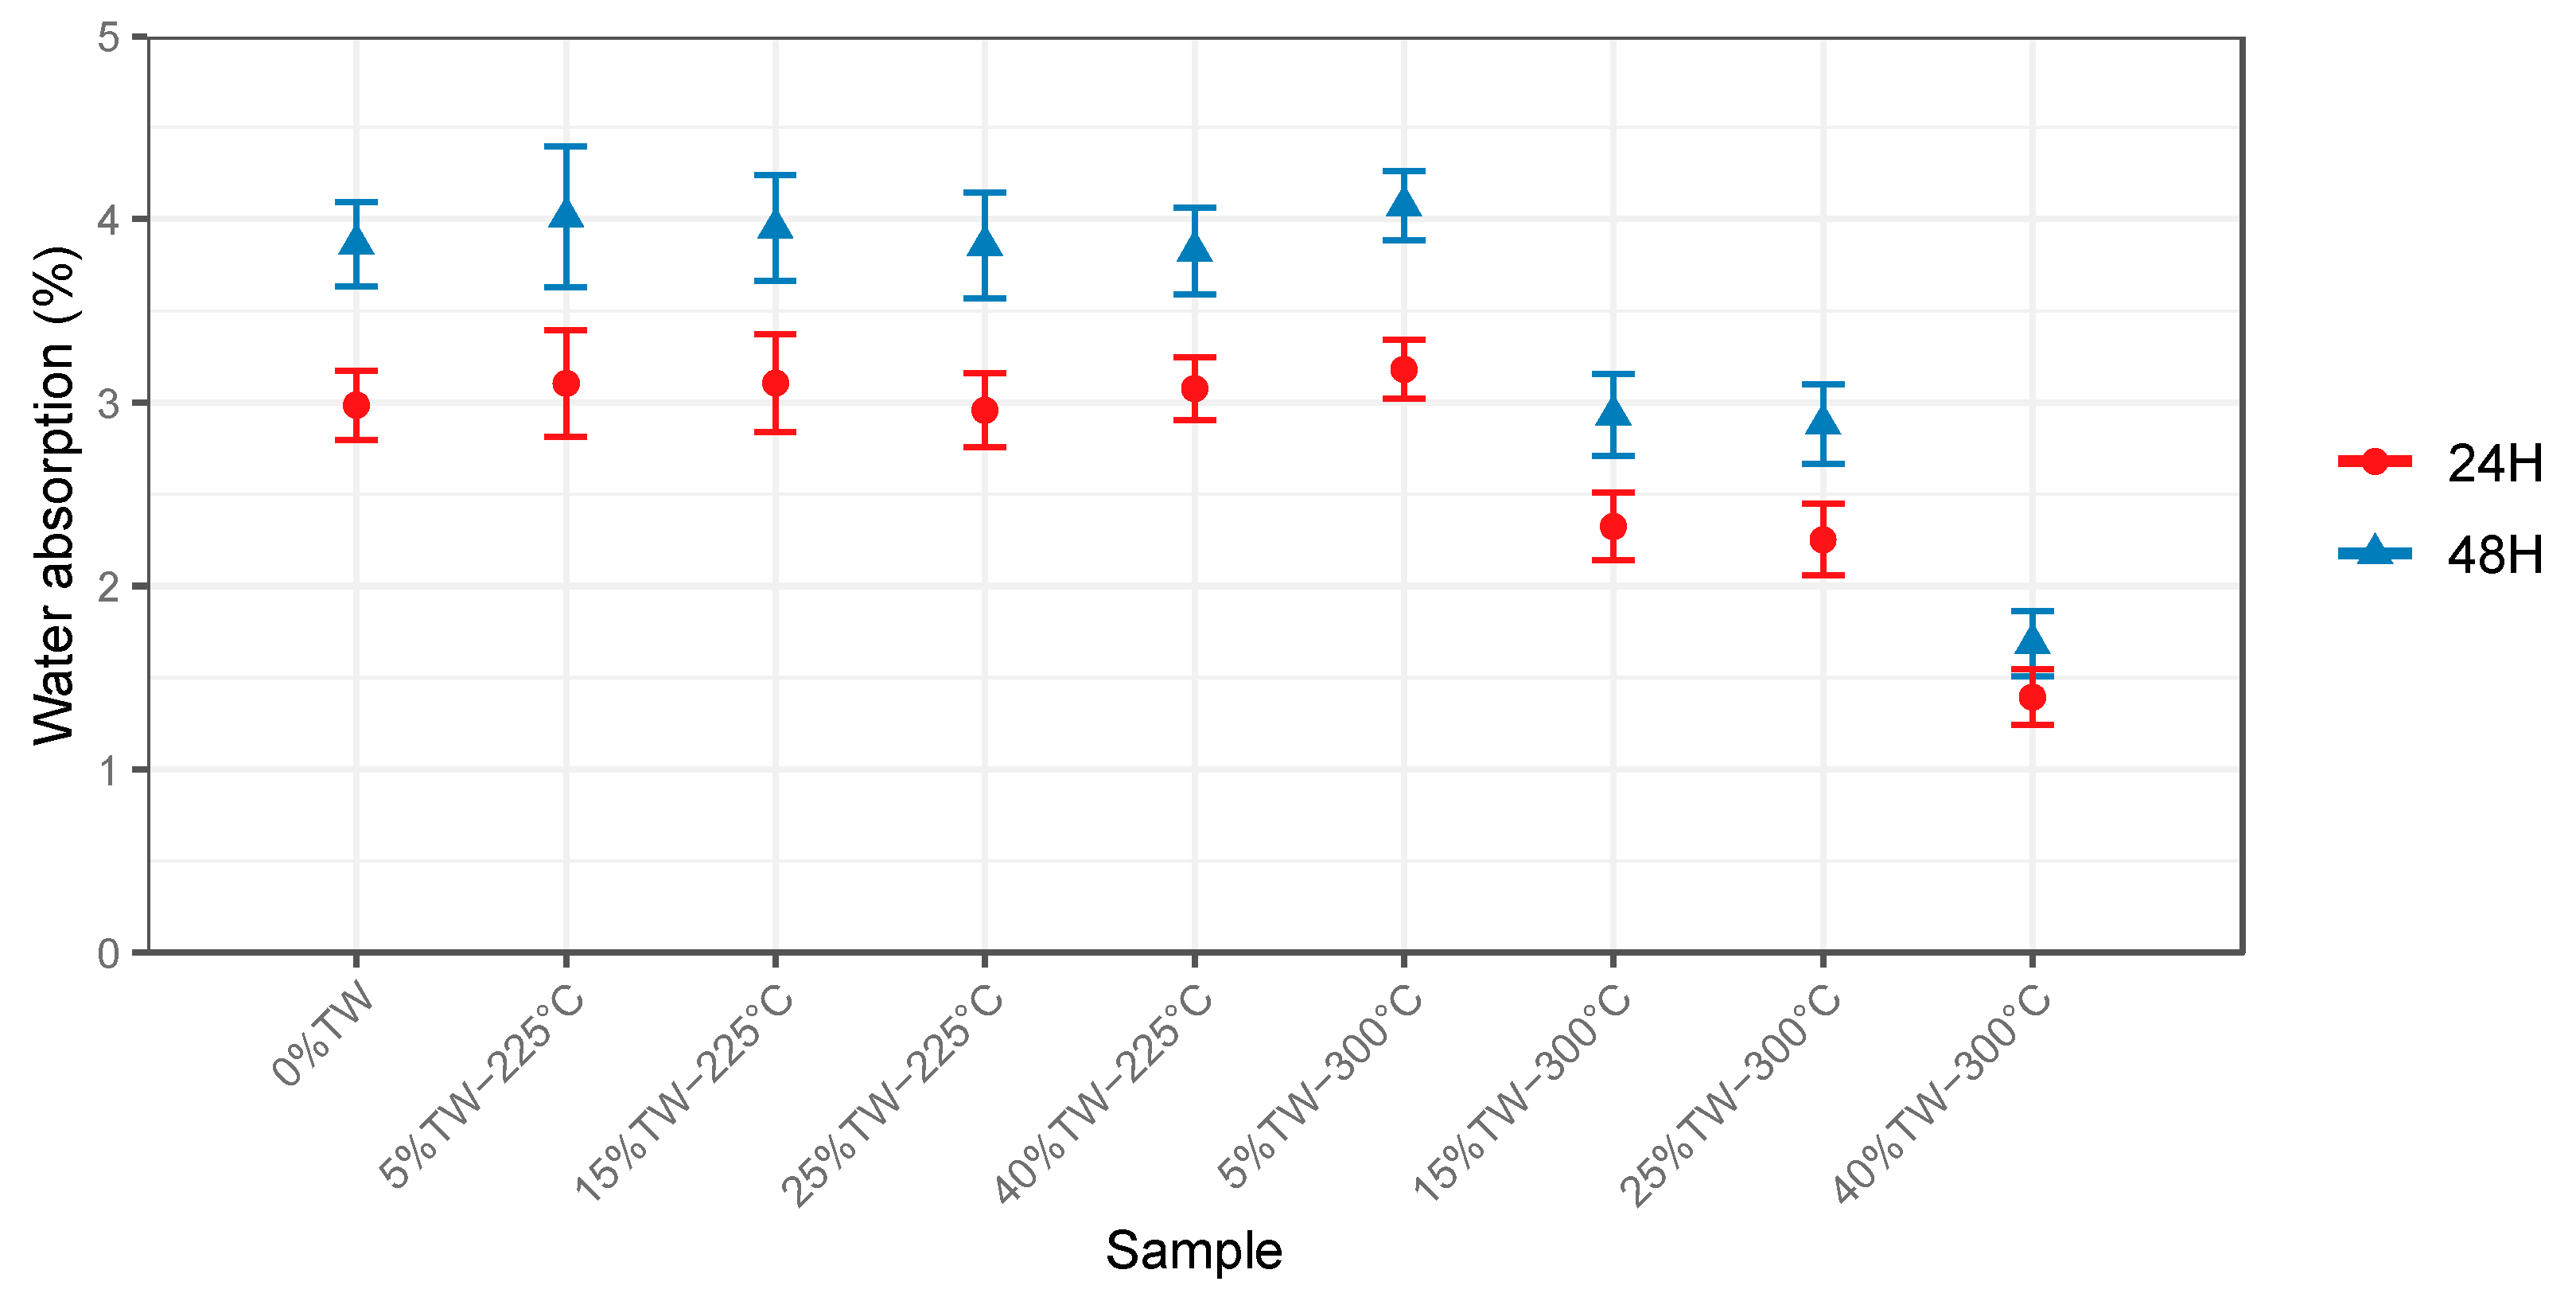
3.5. Water Absorption
3.6. Thermal Properties
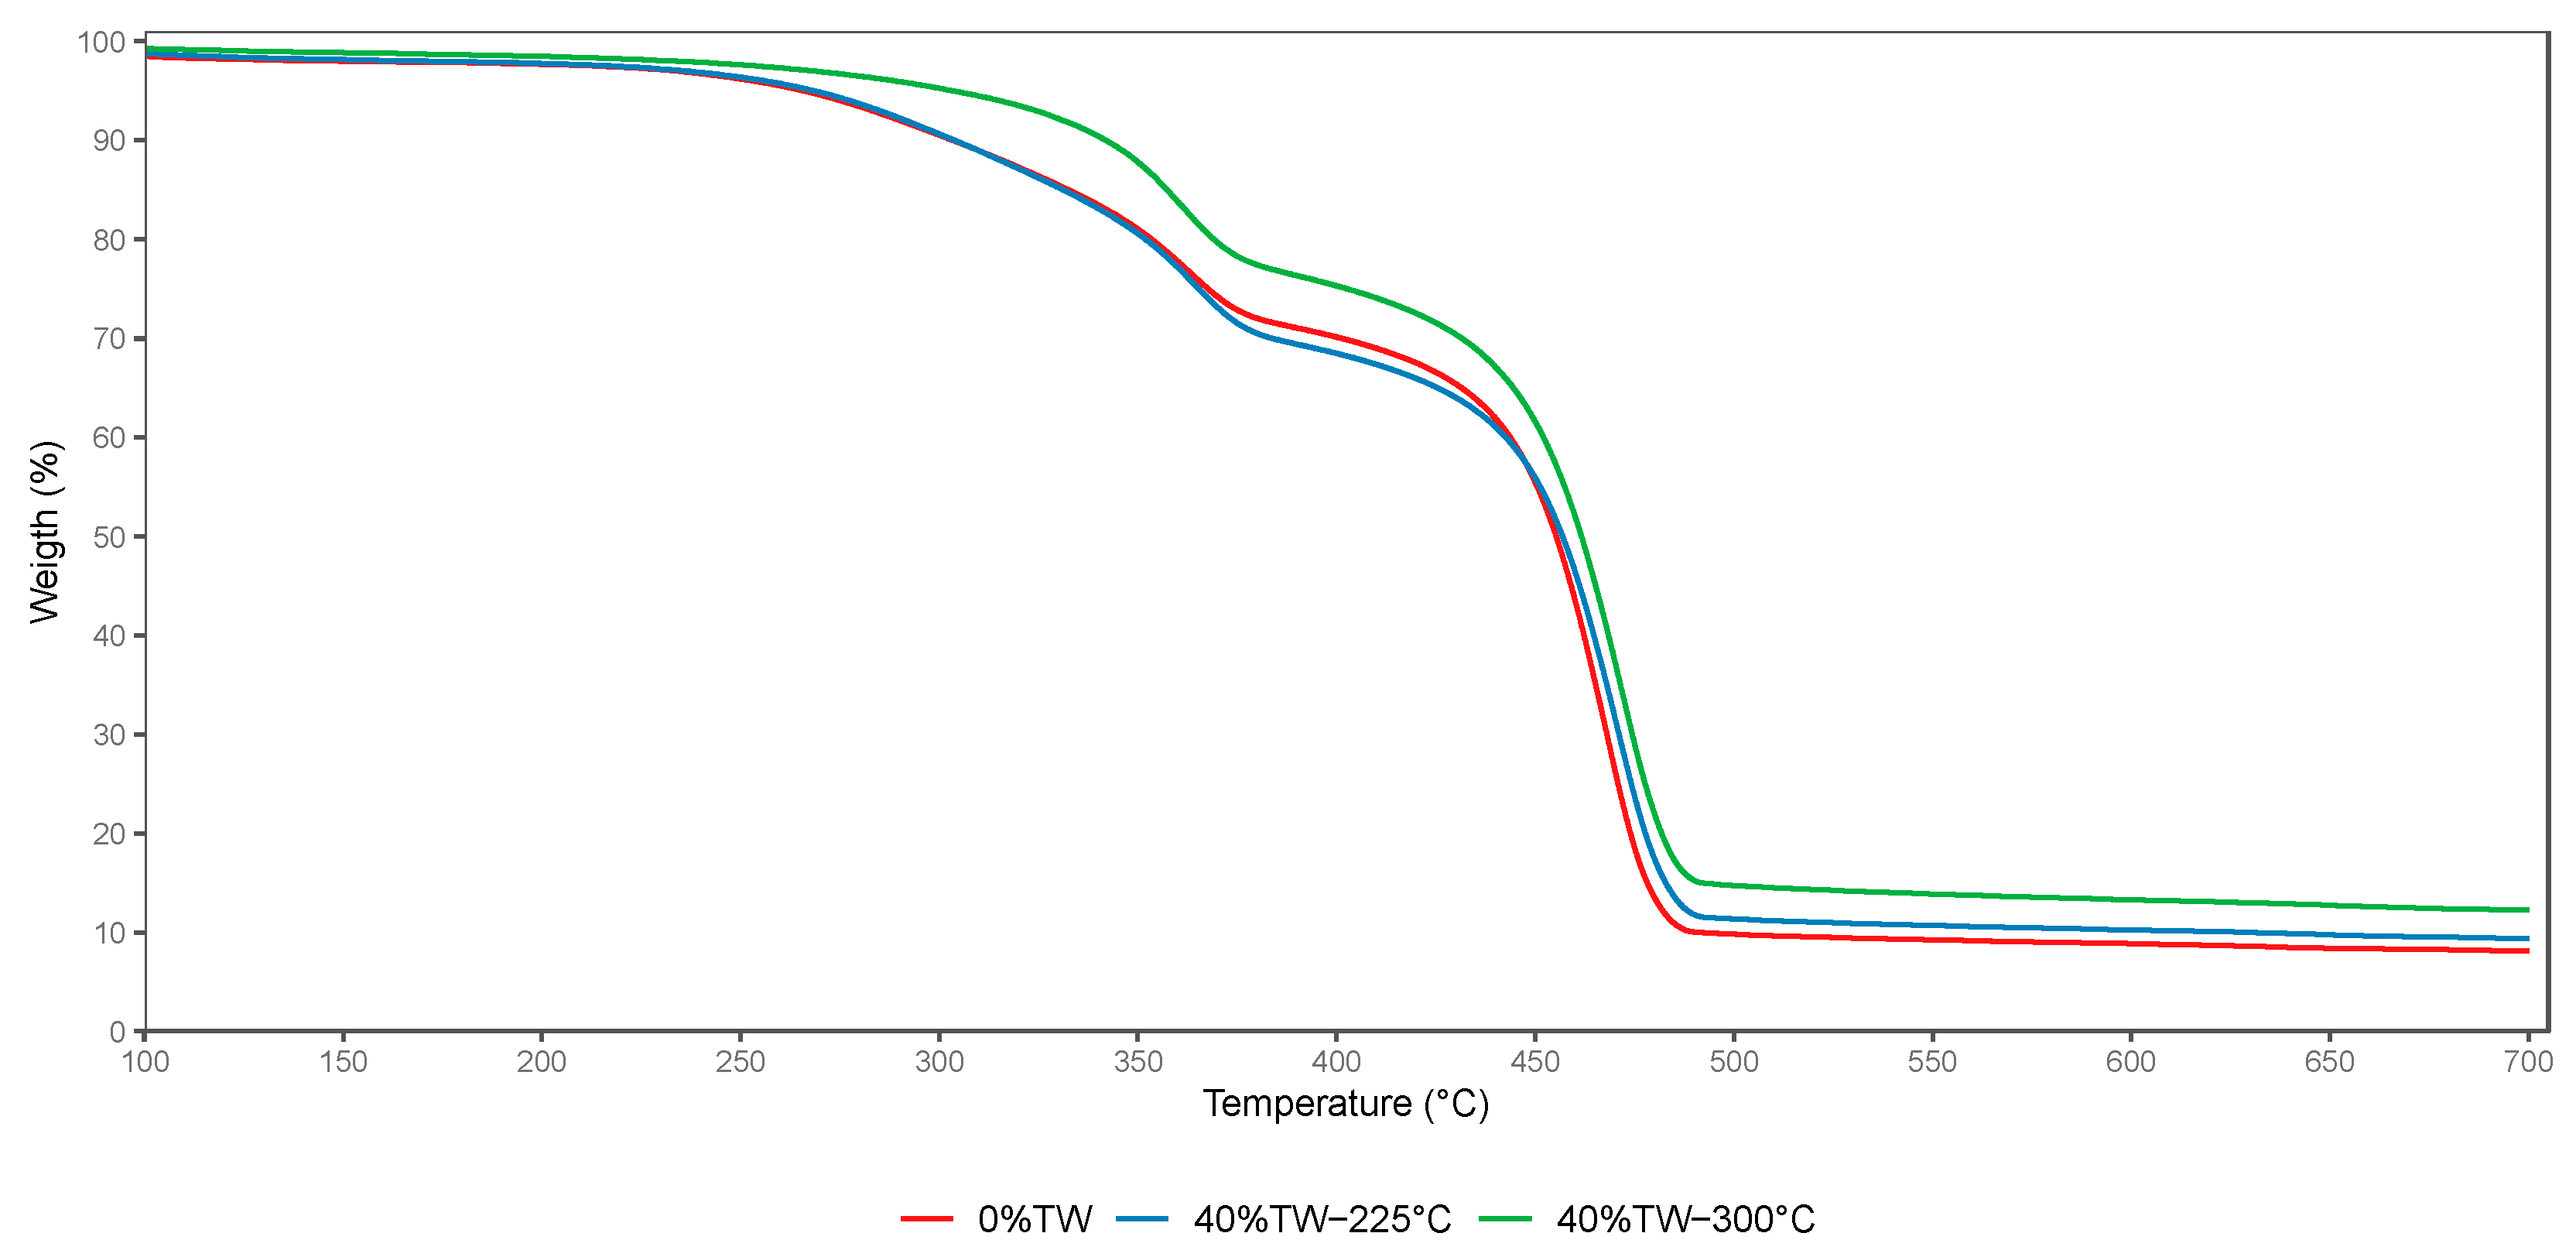
3.6.1. Thermogravimetric Analysis
3.6.2. Differential Scanning Calorimetry
4. Conclusions
Supplementary Materials
Author Contributions
Funding
Institutional Review Board Statement
Data Availability Statement
Acknowledgments
Conflicts of Interest
References
- Zalesny, R.S.; Cunningham, M.W.; Hall, R.B.; Mirck, J.; Rockwood, D.L.; Stanturf, J.A.; Volk, T.A. Woody Biomass from Short Rotation Energy Crops. In ACS Symposium Series; Zhu, J., Zhang, X., Pan, X., Eds.; American Chemical Society: Washington, DC, USA, 2011; Volume 1067, pp. 27–63. ISBN 978-0-8412-2643-2. [Google Scholar]
- Pleguezuelo, C.R.R.; Zuazo, V.H.D.; Bielders, C.; Bocanegra, J.A.J.; PereaTorres, F.; Martínez, J.R.F. Bioenergy Farming Using Woody Crops. A Review. Agron. Sustain. Dev. 2015, 35, 95–119. [Google Scholar] [CrossRef]
- European Commission; Joint Research Centre; Camia, A.; Giuntoli, J.; Jonsson, R.; Robert, N.; Cazzaniga, N.; Jasinevičius, G.; Avitabile, V.; Grassi, G.; et al. The Use of Woody Biomass for Energy Production in the EU; Publications Office: Luxembourg, 2021. [Google Scholar]
- Abrahamson, L.P.; Kopp, R.F.; Smart, L.B.; Volk, T.A. Fast-Growing Willow Shrub Named ‘Millbrook’. United States: N. p.; 2007. Available online: https://image-ppubs.uspto.gov/dirsearch-public/print/downloadPdf/PP17646 (accessed on 28 September 2023).
- Barton-Pudlik, J.; Czaja, K. Fast-Growing Willow (Salix viminalis) as a Filler in Polyethylene Composites. Compos. Part B Eng. 2018, 143, 68–74. [Google Scholar] [CrossRef]
- Darwish, M.; Ismail, H.; Orz, A.; Ammar, A.; Eldebaby, O.; Solaiman, O.; Nassar, K.; Abouzeid, M.N.; Youssef, P. Manufacturing and Characteristics of Structural Sections from Wood Plastic Composites. In Proceedings of the Canadian Society of Civil Engineering Annual Conference 2021; Walbridge, S., Nik-Bakht, M., Ng, K.T.W., Shome, M., Alam, M.S., El Damatty, A., Lovegrove, G., Eds.; Springer Nature: Singapore, 2023; pp. 583–594. [Google Scholar]
- Ashori, A. Wood–Plastic Composites as Promising Green-Composites for Automotive Industries! Bioresour. Technol. 2008, 99, 4661–4667. [Google Scholar] [CrossRef]
- Kelleci, O.; Aksu, S.; Aydemir, D.; İStek, A.; Köksal, S.E. Wood Plastic Composite (WPC) Application inIndoor Furniture Sector. In Proceedings of the 2nd International FurnitureCongress, Muğla, Turkey, 13–15 October 2016; pp. 310–314. [Google Scholar]
- Partanen, A.; Carus, M. Wood and Natural Fiber Composites Current Trend in Consumer Goods and Automotive Parts. Reinf. Plast. 2016, 60, 170–173. [Google Scholar] [CrossRef]
- Kim, J.K.; Pal, K. Recent Advances in the Processing of Wood-Plastic Composites; Engineering Materials; Springer: Berlin, Heidelberg, 2011; Volume 32, ISBN 978-3-642-14876-7. [Google Scholar]
- Schwarzkopf, M.J.; Burnard, M.D. Wood-Plastic Composites—Performance and Environmental Impacts. In Environmental Impacts of Traditional and Innovative Forest-based Bioproducts; Kutnar, A., Muthu, S.S., Eds.; Environmental Footprints and Eco-design of Products and Processes; Springer: Singapore, 2016; pp. 19–43. ISBN 978-981-10-0653-1. [Google Scholar]
- Ayrilmis, N.; Kaymakci, A. Fast Growing Biomass as Reinforcing Filler in Thermoplastic Composites: Paulownia Elongata Wood. Ind. Crops Prod. 2013, 43, 457–464. [Google Scholar] [CrossRef]
- Jaya Tripathi, A.B.; Causer, T.; Ciolkosz, D.E.; DeVallance, D.B.; Nunes, L.J.R. Non-Energetic Application of Carbon-Rich Torrefied Biomass in the Bioeconomy: A Review. Biofuels 2023, 1–17. [Google Scholar] [CrossRef]
- Kim, J.-W.; Harper, D.P.; Taylor, A.M. Effect of Wood Species on the Mechanical and Thermal Properties of Wood-Plastic Composites. J. Appl. Polym. Sci. 2009, 112, 1378–1385. [Google Scholar] [CrossRef]
- Kim, J.-W.; Harper, D.P.; Taylor, A.M. Effect of wood species on water sorption and durability of wood–plastic composites. Wood Fiber Sci. 2008, 40, 519–531. [Google Scholar]
- Fabiyi, J.S.; McDonald, A.G.; Morrell, J.J.; Freitag, C. Effects of Wood Species on Durability and Chemical Changes of Fungal Decayed Wood Plastic Composites. Compos. Part A Appl. Sci. Manuf. 2011, 42, 501–510. [Google Scholar] [CrossRef]
- Bouafif, H.; Koubaa, A.; Perré, P.; Cloutier, A. Effects of Fiber Characteristics on the Physical and Mechanical Properties of Wood Plastic Composites. Compos. Part A Appl. Sci. Manuf. 2009, 40, 1975–1981. [Google Scholar] [CrossRef]
- Sandberg, D.; Kutnar, A.; Karlsson, O.; Jones, D. Wood Modification Technologies: Principles, Sustainability, and the Need for Innovation, 1st ed.; CRC Press: Boca Raton, FL, USA, 2021. [Google Scholar]
- Ayrilmis, N.; Jarusombuti, S.; Fueangvivat, V.; Bauchongkol, P. Effect of Thermal-Treatment of Wood Fibres on Properties of Flat-Pressed Wood Plastic Composites. Polym. Degrad. Stab. 2011, 96, 818–822. [Google Scholar] [CrossRef]
- Pelaez-Samaniego, M.R.; Yadama, V.; Lowell, E.; Espinoza-Herrera, R. A Review of Wood Thermal Pretreatments to Improve Wood Composite Properties. Wood Sci. Technol. 2013, 47, 1285–1319. [Google Scholar] [CrossRef]
- Karinkanta, P.; Ämmälä, A.; Illikainen, M.; Niinimäki, J. Fine Grinding of Wood—Overview from Wood Breakage to Applications. Biomass Bioenergy 2018, 113, 31–44. [Google Scholar] [CrossRef]
- Ribeiro, J.; Godina, R.; Matias, J.; Nunes, L. Future Perspectives of Biomass Torrefaction: Review of the Current State-Of-The-Art and Research Development. Sustainability 2018, 10, 2323. [Google Scholar] [CrossRef]
- Chiou, B.-S.; Cao, T.; Valenzuela-Medina, D.; Bilbao-Sainz, C.; Avena-Bustillos, R.J.; Milczarek, R.R.; Du, W.-X.; Glenn, G.M.; Orts, W.J. Torrefaction Kinetics of Almond and Walnut Shells: Effects of Inorganic Species. J. Therm. Anal. Calorim. 2018, 131, 3065–3075. [Google Scholar] [CrossRef]
- McCaffrey, Z.; Torres, L.; Flynn, S.; Cao, T.; Chiou, B.-S.; Klamczynski, A.; Glenn, G.; Orts, W. Recycled Polypropylene-Polyethylene Torrefied Almond Shell Biocomposites. Ind. Crops Prod. 2018, 125, 425–432. [Google Scholar] [CrossRef]
- Volfson, S.I.; Fayzullin, I.Z.; Musin, I.N.; Fayzullin, A.Z.; Grachev, A.N.; Pushkin, S.A. The Physicomechanical and Rheological Characteristics of Wood–Polymer Composites Based on Thermally and Mechanically Modified Filler. Int. Polym. Sci. Technol. 2017, 44, 49–54. [Google Scholar] [CrossRef]
- Vold, J.L.; Ulven, C.A.; Chisholm, B.J. Torrefied Biomass Filled Polyamide Biocomposites: Mechanical and Physical Property Analysis. J. Mater. Sci. 2015, 50, 725–732. [Google Scholar] [CrossRef]
- Lu, W.; Yu, W.; Han, X.; Cai, H.; Gao, F. Torrefaction Pretreatment Facilitated Solvents-Resistant and Stable Wood-Plastic Composites. Ind. Crops Prod. 2022, 177, 114454. [Google Scholar] [CrossRef]
- Berthet, M.-A.; Commandré, J.-M.; Rouau, X.; Gontard, N.; Angellier-Coussy, H. Torrefaction Treatment of Lignocellulosic Fibres for Improving Fibre/Matrix Adhesion in a Biocomposite. Mater. Des. 2016, 92, 223–232. [Google Scholar] [CrossRef]
- Karger-Kocsis, J. (Ed.) Polypropylene Structure, Blends and Composites; Springer: Berlin/Heidelberg, Germany, 1995; Volume 3. [Google Scholar]
- Yang, H.; Yan, R.; Chen, H.; Lee, D.H.; Zheng, C. Characteristics of Hemicellulose, Cellulose and Lignin Pyrolysis. Fuel 2007, 86, 1781–1788. [Google Scholar] [CrossRef]
- Moustafa, H.; Guizani, C.; Dupont, C.; Martin, V.; Jeguirim, M.; Dufresne, A. Utilization of Torrefied Coffee Grounds as Reinforcing Agent To Produce High-Quality Biodegradable PBAT Composites for Food Packaging Applications. ACS Sustain. Chem. Eng. 2017, 5, 1906–1916. [Google Scholar] [CrossRef]
- Kuka, E.; Cirule, D.; Kajaks, J.; Andersone, I.; Andersons, B. Wood Plastic Composites Made with Thermally Modified Birch Wood Residues. Int. Wood Prod. J. 2016, 7, 225–230. [Google Scholar] [CrossRef]
- Esteves, B.; Velez Marques, A.; Domingos, I.; Pereira, H. Chemical Changes of Heat Treated Pine and Eucalypt Wood Monitored by FTIR. Maderas Cienc. Tecnol. 2013, 15, 245–258. [Google Scholar] [CrossRef]
- Cheng, S.; Huang, A.; Wang, S.; Zhang, Q. Effect of Different Heat Treatment Temperatures on the Chemical Composition and Structure of Chinese Fir Wood. BioResources 2016, 11, 4006–4016. [Google Scholar] [CrossRef]
- Zouari, M.; Marrot, L.; DeVallance, D.B. Effect of Demineralization and Ball Milling Treatments on the Properties of Arundo Donax and Olive Stone-Derived Biochar. In International Journal of Environmental Science and Technology; Springer: Berlin/Heidelberg, Germany, 2023. [Google Scholar] [CrossRef]
- Chaudemanche, S.; Perrot, A.; Pimbert, S.; Lecompte, T.; Faure, F. Properties of an Industrial Extruded HDPE-WPC: The Effect of the Size Distribution of Wood Flour Particles. Constr. Build. Mater. 2018, 162, 543–552. [Google Scholar] [CrossRef]
- Ramos-Carmona, S.; Pérez, J.F.; Pelaez-Samaniego, M.R.; Barrera, R.; Garcia-Perez, M. Effect of Torrefaction Temperature on Properties of Patula Pine. Maderas Cienc. Tecnol. 2017, 19, 39–50. [Google Scholar] [CrossRef]
- Devallance, D.B.; Oporto, G.S.; Quigley, P. Investigation of Hardwood Biochar as a Replacement for Wood Flour in Wood–Polypropylene Composites. J. Elastomers Plast. 2016, 48, 510–522. [Google Scholar] [CrossRef]
- Chen, W.-H.; Lin, B.-J.; Colin, B.; Pétrissans, A.; Pétrissans, M. A Study of Hygroscopic Property of Biomass Pretreated by Torrefaction. Energy Procedia 2019, 158, 32–36. [Google Scholar] [CrossRef]
- Ortiz-Barajas, D.L.; Arévalo-Prada, J.A.; Fenollar, O.; Rueda-Ordóñez, Y.J.; Torres-Giner, S. Torrefaction of Coffee Husk Flour for the Development of Injection-Molded Green Composite Pieces of Polylactide with High Sustainability. Appl. Sci. 2020, 10, 6468. [Google Scholar] [CrossRef]
- Chiou, B.-S.; Valenzuela-Medina, D.; Wechsler, M.; Bilbao-Sainz, C.; Klamczynski, A.K.; Williams, T.G.; Wood, D.F.; Glenn, G.M.; Orts, W.J. Torrefied Biomass-Polypropylene Composites. J. Appl. Polym. Sci. 2015, 132. [Google Scholar] [CrossRef]

| Sample | Sample Description | NTW | TW | Torrefaction Temperature |
|---|---|---|---|---|
| MA | 0%TW | 40% | 0% | No torrefaction |
| MB | 5%TW-225 °C | 35% | 5% | 225 °C |
| MC | 15%TW-225 °C | 25% | 15% | |
| MD | 25%TW-225 °C | 15% | 25% | |
| ME | 40%TW-225 °C | 0% | 40% | |
| MF | 5%TW-300 °C | 35% | 5% | 300 °C |
| MG | 15%TW-300 °C | 25% | 15% | |
| MH | 25%TW-300 °C | 15% | 25% | |
| MI | 40%TW-300 °C | 0% | 40% |
| Cumulative Particle Size Distribution | Particle Size (µm) | ||
|---|---|---|---|
| NTW | TW 225 °C | TW 300 °C | |
| D10 | 163 | 102 | 43 |
| D50 | 639 | 530 | 290 |
| D90 | 1148 | 1140 | 840 |
| Mean | 661 | 589 | 379 |
| Sample | Modulus of Elasticity | Tensile Strength | |||
|---|---|---|---|---|---|
| (MPa) | SD | (MPa) | SD | No. | |
| MA | 1336 | 84 | 10.8 | 0.7 | 4 |
| MB | 1417 | 86 | 11.6 | 1.1 | 5 |
| MC | 1426 | 47 | 11.3 | 0.6 | 5 |
| MD | 1293 | 80 | 9.9 | 1.0 | 5 |
| ME | 1476 | 48 | 11.0 | 0.2 | 5 |
| MF | 1431 | 118 | 11.6 | 0.8 | 5 |
| MG | 1361 | 93 | 10.5 | 1.8 | 5 |
| MH | 1396 | 26 | 10.5 | 0.5 | 5 |
| MI | 1398 | 119 | 11.0 | 0.7 | 5 |
| Sample | Modulus of Elasticity | Flexural Strength | Density | |||||
|---|---|---|---|---|---|---|---|---|
| (MPa) | SD | (MPa) | SD | No. | (kg/m3) | SD | No. | |
| MA | 1777 | 123 | 26.6 | 2.2 | 10 | 973.8 | 32.5 | 10 |
| MB | 1682 | 75 | 23.0 | 1.6 | 10 | 975.3 | 9.3 | 10 |
| MC | 1604 | 82 | 23.5 | 1.8 | 10 | 992.1 | 8.9 | 10 |
| MD | 1663 | 122 | 24.0 | 3.2 | 10 | 981.7 | 7.5 | 10 |
| ME | 1726 | 97 | 24.5 | 1.6 | 10 | 997.6 | 9.0 | 10 |
| MF | 1603 | 81 | 25.0 | 1.4 | 10 | 984.6 | 8.3 | 10 |
| MG | 1546 | 36 | 23.3 | 1.6 | 10 | 980.5 | 12.5 | 10 |
| MH | 1577 | 175 | 22.0 | 2.8 | 9 | 984.6 | 7.4 | 10 |
| MI | 1622 | 82 | 22.7 | 1.4 | 10 | 979.3 | 7.6 | 10 |
| Sample | Degradation Temperature (°C) | Final Residue at 700 °C (%) | ||
|---|---|---|---|---|
| T5% | T10% | Tmax | ||
| MA | 265.8 | 303.4 | 468.2 | 8.1 |
| MB | 263.2 | 302.2 | 468.3 | 8.9 |
| MC | 271.6 | 307.8 | 466.8 | 8.6 |
| MD | 272.3 | 308.7 | 468.6 | 8.5 |
| ME | 268.5 | 303.9 | 471.0 | 9.4 |
| MF | 271.9 | 309.4 | 471.0 | 9.2 |
| MG | 281.9 | 323.5 | 470.9 | 9.7 |
| MH | 280.0 | 322.6 | 469.4 | 10.9 |
| MI | 303.4 | 342.0 | 472.6 | 12.3 |
| Sample | Tc (°C) | ΔHc (J g−1) | Tm (°C) | ΔHm (J g−1) | Xc (%) |
|---|---|---|---|---|---|
| MA | 112.7 | 48.0 | 160.5 | 40.3 | 32 |
| MB | 112.6 | 64.7 | 160.9 | 51.6 | 42 |
| MC | 113.2 | 52.5 | 160.4 | 40.5 | 33 |
| MD | 116.7 | 56.8 | 160.6 | 35.7 | 29 |
| ME | 113.2 | 44.8 | 160.1 | 31.2 | 25 |
| MF | 112.9 | 62.0 | 160.6 | 41.2 | 33 |
| MG | 112.4 | 44.3 | 160.8 | 30.7 | 25 |
| MH | 113.1 | 34.2 | 159.2 | 25.5 | 21 |
| MI | 111.4 | 48.3 | 159.6 | 34.2 | 28 |
Disclaimer/Publisher’s Note: The statements, opinions and data contained in all publications are solely those of the individual author(s) and contributor(s) and not of MDPI and/or the editor(s). MDPI and/or the editor(s) disclaim responsibility for any injury to people or property resulting from any ideas, methods, instructions or products referred to in the content. |
© 2023 by the authors. Licensee MDPI, Basel, Switzerland. This article is an open access article distributed under the terms and conditions of the Creative Commons Attribution (CC BY) license (https://creativecommons.org/licenses/by/4.0/).
Share and Cite
Pečnik, J.G.; Zouari, M.; Schwarzkopf, M.; DeVallance, D.B. Utilization of Torrefied and Non-Torrefied Short Rotation Willow in Wood–Plastic Composites. Polymers 2023, 15, 3997. https://doi.org/10.3390/polym15193997
Pečnik JG, Zouari M, Schwarzkopf M, DeVallance DB. Utilization of Torrefied and Non-Torrefied Short Rotation Willow in Wood–Plastic Composites. Polymers. 2023; 15(19):3997. https://doi.org/10.3390/polym15193997
Chicago/Turabian StylePečnik, Jaka Gašper, Mariem Zouari, Matthew Schwarzkopf, and David B. DeVallance. 2023. "Utilization of Torrefied and Non-Torrefied Short Rotation Willow in Wood–Plastic Composites" Polymers 15, no. 19: 3997. https://doi.org/10.3390/polym15193997
APA StylePečnik, J. G., Zouari, M., Schwarzkopf, M., & DeVallance, D. B. (2023). Utilization of Torrefied and Non-Torrefied Short Rotation Willow in Wood–Plastic Composites. Polymers, 15(19), 3997. https://doi.org/10.3390/polym15193997