Article

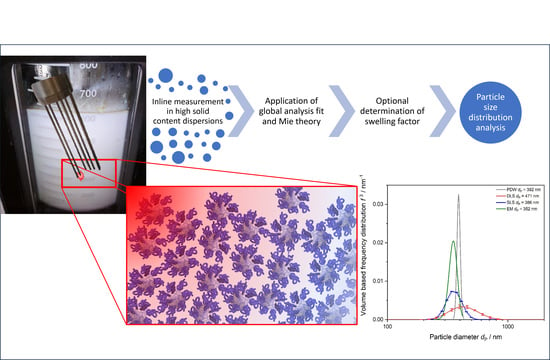
Advanced Particle Size Analysis in High-Solid-Content Polymer Dispersions Using Photon Density Wave Spectroscopy

1
Department of Physical Chemistry, innoFSPEC, University of Potsdam, Am Mühlenberg 3, 14476 Potsdam, Germany
2
Knowledge and Technology Transfer, Faculty of Science, University of Potsdam, Am Mühlenberg 3, 14476 Potsdam, Germany
*
Author to whom correspondence should be addressed.
Polymers 2023, 15(15), 3181; https://doi.org/10.3390/polym15153181
Submission received: 27 June 2023 / Revised: 21 July 2023 / Accepted: 24 July 2023 / Published: 26 July 2023

Abstract

:
High-solid-content polystyrene and polyvinyl acetate dispersions of polymer particles with a 50 nm to 500 nm mean particle diameter and 12–55% (w/w) solid content have been produced via emulsion polymerization and characterized regarding their optical and physical properties. Both systems have been analyzed with common particle-size-measuring techniques like dynamic light scattering (DLS) and static light scattering (SLS) and compared to inline particle size distribution (PSD) measurements via photon density wave (PDW) spectroscopy in undiluted samples. It is shown that particle size measurements of undiluted polystyrene dispersions are in good agreement between analysis methods. However, for polyvinyl acetate particles, size determination is challenging due to bound water in the produced polymer. For the first time, water-swelling factors were determined via an iterative approach of PDW spectroscopy error (Χ2) minimization. It is shown that water-swollen particles can be analyzed in high-solid-content solutions and their physical properties can be assumed to determine the refractive index, density, and volume fraction in dispersion. It was found that assumed water swelling improved the reduced scattering coefficient fit by PDW spectroscopy by up to ten times and particle size determination was refined and enabled. Particle size analysis of the water-swollen particles agreed well with offline-based state-of-the-art techniques.

Graphical Abstract

1. Introduction

Emulsion polymerization processes are one of the most common polymerization processes to produce high-solid-content polymer dispersions. In contrast to suspension polymerization, emulsion polymerization promotes higher solid contents, better heat transfer, faster polymerization rates, and better colloidal stability. A vast variety of polymers and stabilizers are already well-characterized. Accessible products range from low to high density polymers, branched and stretched, and homo- as well as co-polymers. Given the great variety of polymers, many different types of products and different product applications can be achieved [1,2].
The precise analysis of particle size and particle size distribution (PSD) is of the utmost importance for liquid polymer dispersions. These properties play an important role as they define the usage and applications of polymer dispersions, e.g., the fluidity and stability of high-solid-content polymer dispersions [3]. The mean particle size of polymers depends on many thermodynamic and kinetic factors during their synthesis, like the solubility of the monomer–polymer, composition of the reactants, temperature, solvent-to-medium ratio, or even reactor geometry [2,4]. The final mean particle size and PSD during emulsion polymerization are further influenced by the monomer amount introduced and the capability of the stabilizer in the dispersion to sustain the colloidal stability of the particles growing. The amount of stabilizer added accounts for the amount of particles formed and, therefore, also the final mean particle size [5].
To access the mean particle size in high-solid-content polymer dispersions and to determine the PSD, different techniques are known and promoted like turbidimetry, fiber-optic quasi-elastic light scattering or focused beam reflectance measurement, and particle vision and measurement technology. Online measurements in undiluted processes are particularly challenging due to the high turbidity, high number of particles, and multiple scattering [6,7,8,9,10,11]. Most commonly, offline PSD analysis is used. However, offline techniques require extensive sample preparation like dilution, are time consuming, and are not easy to handle. Additionally, dilution always induces a change in the particle system, whose effects on the measurement are not well-known. Analysis of nanoparticle size distribution is possible by multiple techniques. Laser light-scattering techniques are shown to deliver reliable results; however, adding to the extensive sample preparation and dilution, the results are influenced strongly and shifted by the fractions of bigger particles in the sample. For multimodal or very polydisperse samples, light-scattering techniques lack resolution [12,13,14,15].
Input parameters for measurements like the solvent viscosity, the refractive index, the sample concentration, and the sample temperature play a significant role and are compulsory. Necessary sample dilution evidently affects these factors and provokes falsified results. For dynamic light scattering (DLS) measurements, the dilution of the sample affects the autocorrelation function and the resulting particle size. For samples with high particle concentration, i.e., high solid contents, the Stokes–Einstein equation is no longer valid and diffusion coefficients yield wrong hydrodynamic radii [16,17,18,19]. Photon density wave (PDW) spectroscopy offers dispersion analysis of highly turbid particle systems or emulsions without dilution by the independent experimental determination of the optical coefficients, reduced scattering coefficient and absorption coefficient, respectively [20,21,22,23]. This technique is used in this study to determine the PSD in undiluted concentrated polymer dispersions and compared to the DLS, Static Light Scattering (SLS), and Electron Microscopy (EM) analysis of diluted samples.
In this work, two polymer systems are produced and thoroughly analyzed—polystyrene (PS) particles, stabilized by sodium dodecyl sulfate (SDS), and polyvinyl acetate (PVAc), stabilized by poly (vinyl alcohol, PVA). The respective chemical structures of the polymers and stabilizers used in this study are shown in Figure 1. Stabilizers are shown in their deprotonated form. It is reported in literature that PS and SDS are not prone to incorporating water, due to their hydrophobic character, whereas PVAc and PVA, due to their significantly more hydrophilic character, especially PVA with plenty of accessible hydroxyl groups also shown in Figure 1, are not only known to bind water loosely by van der Waals interactions, but are also able to build hydrogen bonds, which bind the water strongly to the hydrophilic sites [24,25,26,27]. Due to the polarizability of SDS, it is possible that water molecules attach to the surfactants surrounding the polymer, but the amount and effect on the particle will be significantly lower than for the PVA stabilized particles. The hydrophobic aklylchains will attach to the polymer and few loose interactions happen with the surrounding media and water.
Three states of bound water were found to be present in PVA: free water, bound–freezable, and bound–non-freezable water, which has nearly the same characteristics as bulk water [28,29,30]. The amount of freezable water accounts only for a very small percentage and is, therefore, complicated to detect. Only a combination of different thermal analyses may be able to determine the amount of water in the PVAc-PVA particle [31,32,33]. It is assumed that the PVAc-PVA particles are swollen with water and also have a swollen emulsifier shell around the PVAc particle core. The degree of swelling is hard to determine due to the different kinds of water-binding mechanisms. The swelling of the polymer particle has a significant influence on the density and refractive index of the particle as well as the solid content and the volume ratio between the PVAc polymer core, polymer shell, and medium in the dispersion. These are the main factors that have a great influence on the PSD measurements. A lot of data on polymer swelling in literature concentrates on the swelling of dry polymer films in water or the swelling of hydrogels [34,35,36]. In this study, undiluted measurements of PVAc-PVA particles are analyzed regarding the swelling of the particle with the medium in high-solid-content dispersions.
For both systems, PS-SDS and PVAc-PVA, particles with various mean particle sizes and PSD can be obtained by emulsion polymerization [5,37,38]. The polymers can be produced in numerous shapes, co-monomer compositions, and sizes from a few nanometers to the upper micrometer size regime [5,39,40]. To produce mean particle sizes between 50 and 500 nm, seeded emulsion polymerization was performed. Seeded emulsion polymerization is a well-known method to produce monodisperse PS dispersions.
Starved-feed emulsion polymerization was used to produce PVAc-PVA particles between 100 and 500 nm mean particle size [20,41,42].

2. Materials and Methods
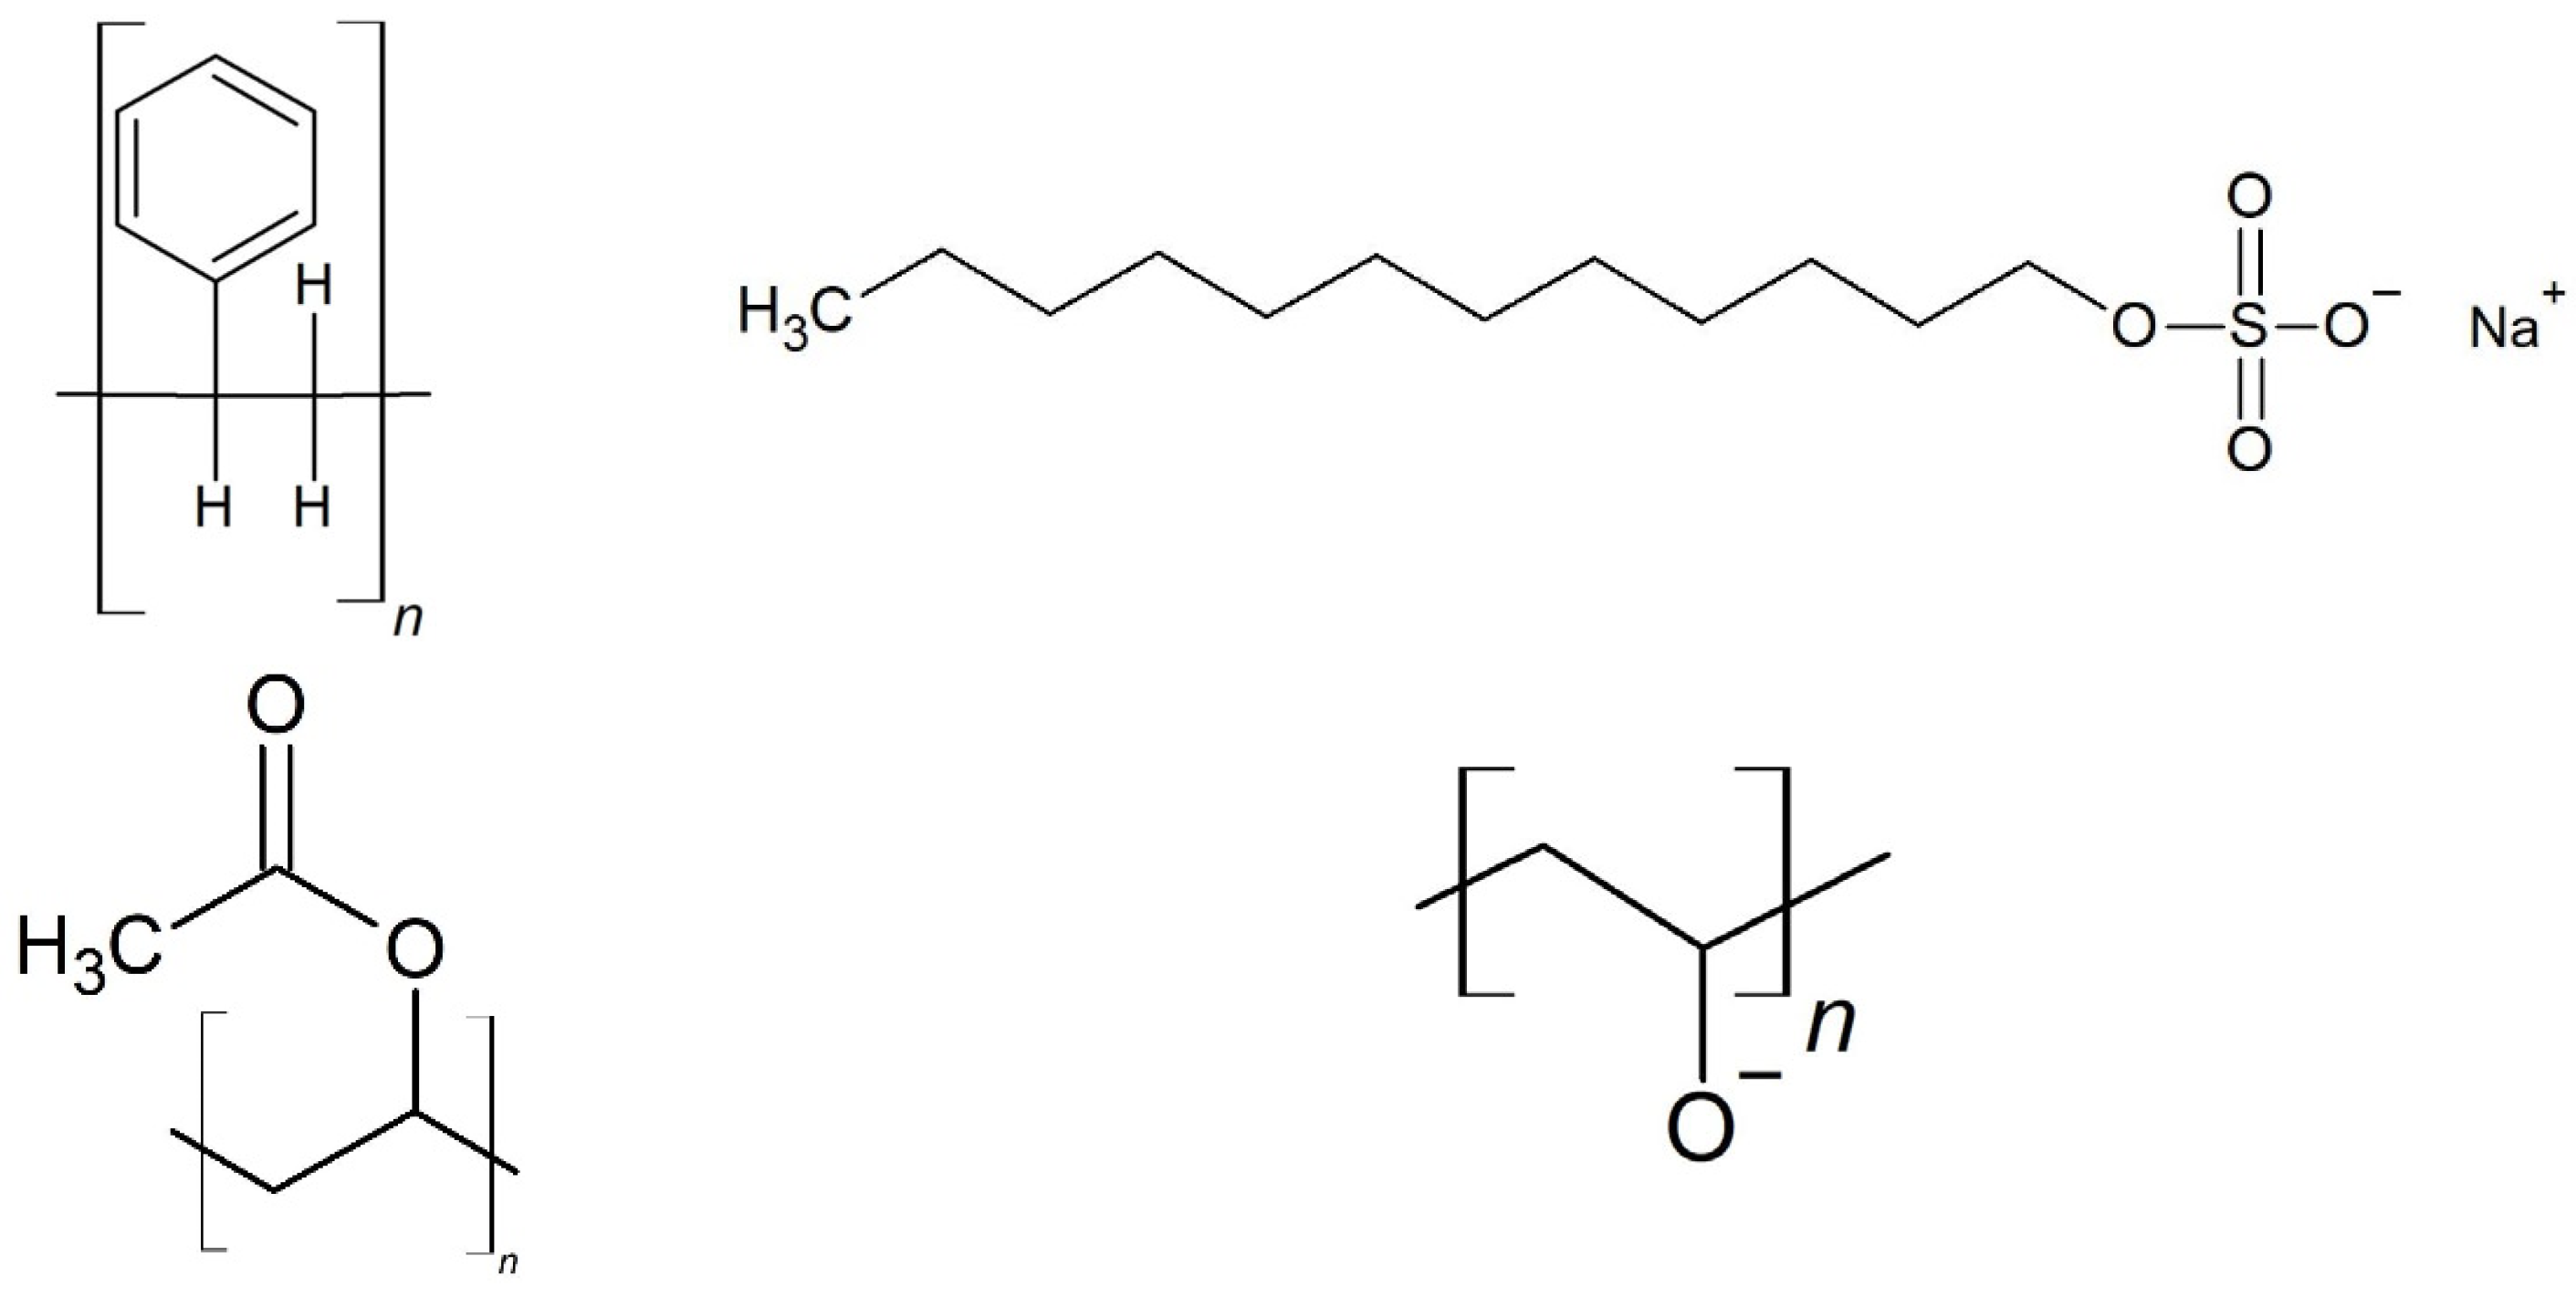
All chemicals were used and handled as described. Styrene was purchased from different suppliers throughout the experiments (104.15 g mol−1, ≥99.5%, Carl Roth, Karlsruhe, Germany and Merck, Darmstadt, Germany). Sodium dodecyl sulfate (SDS, 288.38 g mol−1, Carl Roth, Karlsruhe, Germany), di-sodiumtetraborate decahydrate (Na-Tetra Borate, 381.37 g mol−1, ≥99.5%, Carl Roth, Karlsruhe, Germany), sodium hydroxide (NaOH, 40.0 g mol−1, ≥99%, Carl Roth, Karlsruhe, Germany), aluminum hydroxide (AlOH3, dried gel, 78.01 g mol−1, 99%, abcr GmbH, Karlsruhe, Germany), and potassium peroxodisulfate (KPS, 270.32 g mol−1, ≥99%, Carl Roth, Karlsruhe, Germany) were used as purchased.
Prior to use, the styrene was destabilized by filtering over granulated AlOH3 in a flash column and, afterwards, washed repeatedly in 1 M NaOH using a separating funnel. The styrene showed a light transparent-yellowish color and was further handled at room temperature. Monomer vinyl acetate (VAc, 86.09 g mol−1, ≥99%, Sigma-Aldrich, Darmstadt, Germany) was purged with N2 (Nippon Gases, Duesseldorf, Germany) for 30 min prior to synthesis. Redox initiator pair ascorbic acid (AA, 176.12 g mol−1, 99%, Acros Organics, Geel, Belgium) and sodium persulfate (NaPS, 238.10 g mol−1, ≥99%, Carl Roth, Karlsruhe, Germany) and catalyst ammonium iron (III) sulfate hexahydrate (FAS, 392.14 g mol−1, 99+%, Acros Organics, Geel, Belgium) were used as purchased. Mowiol® 4-88 (polyvinyl alcohol, approx. 31,000 g mol−1, Sigma-Aldrich, Darmstadt, Germany) was used as purchased.

2.1. Synthesis

Preparation of solutions was performed with analytical grade Milli-Q® water from an in-house Milli-Q® water dispenser (Milli-Q®, Integral 5, Merck Millipore, Darmstadt, Germany). An automated lab reactor (OptiMax 1001, Mettler Toledo, Gießen, Germany) at approx. 1 L reaction scale was used for synthesis. Produced polymer dispersions were stored in airtight containers and showed no sign of destabilization for over twelve months.

2.1.1. PS Seed Synthesis

Batch emulsion polymerization was used to produce PS particles with a narrow size distribution to be used further as seed particles. The recipe for the seed synthesis is given in Table 1.
Emulsion polymerization was started by charging 500 g of Milli-Q® water in the 1 L batch reactor. Under stirring at 100 rpm and N2 purging, the initial charge (iC) was heated to 100 °C for 60 min to degas. Temperature was reduced to 55 °C over 45 min. At 55 °C reaction temperature, 135 g styrene, 6.2 g SDS in water, and 0.125 g of Na-Tetra Borate were added. After a short waiting period for the emulsion to form, 30 mL of a 5% KPS solution were added automatically via a computer-controlled dosing unit at 6 mL min−1. Simultaneously, the stirrer was ramped to 200 rpm. The emulsion was left to polymerize at 55 °C reaction temperature for 24 h. After 24 h, a post-polymerization step at 83 °C for 3 h was initiated. The system was cooled to 20 °C over 30 min.

2.1.2. PS-Seeded Emulsion Polymerization

To produce PS nanoparticles of different mean particle sizes, seeded emulsion polymerization was performed. A small amount of the PS seed produced after Table 1 was taken and the particles were grown to various mean particle sizes, as shown in Table 2.

2.1.3. Emulsion Polymerization of Polyvinyl Acetate Dispersions

Recipe for the produced PVAc-PVA dispersions is shown in Table 3 with determined density of the pure polymer and gravimetrically derived solid content after at least 48 h drying at 74 °C in an oven. Details on the emulsion polymerization process can be found in Schlappa et al. [20].

2.2. Dispersion Analysis

After completion of a synthesis, offline sample analysis was performed. After approx. 400-fold dilution with Milli-Q® water to visual transparency, three repetition measurements of each sample were performed by DLS analysis (Zetasizer Ultra, Malvern Panalytical, Worcestershire, UK), at measurement angle of 173°, in disposable 4 mL PS cuvettes, at 25 °C measurement temperature. Samples for SLS measurements (LS13320, Beckman Coulter, Brea, CA, USA) were manually diluted approx. 1:125 with Milli-Q® water and charged to the SLS sample chamber until a polarization intensity differential scattering (PIDS) signal of approx. 40% was achieved. Obscuration values lower than 2% were retained. Results shown for PSDs obtained by light-scattering techniques are mean values of three measurements. Out of the three individual measurements, the mean value is plotted with one standard deviation as error bars. For electron microscopy (EM) analysis, samples were diluted approx. 1000-fold with Milli-Q® water and a drop of sample was placed onto a copper-coal mesh (Plano GmbH, Wetzlar, Germany). The sample was left to dry for an hour at ambient conditions. Quanta FEI 250 electron microscope was used for analysis in STEM mode.

2.3. PDW Spectroscopy Dispersion Analysis

Photon density wave (PDW) spectroscopy is among few techniques which offers dispersion analysis by the determination of the optical coefficients of a highly turbid particle system without dilution even at high solid contents of the dispersed species. The PDW spectroscopy device used here is self-built (University of Potsdam—innoFSPEC, Potsdam, Germany). No sample preparation is needed as the optical fibers can directly be inserted into the dispersion for measuring. Two optical fibers are immersed into the undiluted dispersion. These fibers act as light emission and detection source for intensity-modulated laser light. The detection fiber is mounted to a precision translations stage which moves in scalable distances to and from the emission fiber. Fibers used in this set-up have a 600 µm core diameter. Intensity-modulated laser light (10–1210 MHz) is guided into the sample via the emission fiber and interacts with the sample regarding the samples’ absorption and scattering properties. Due to the multiple scattered light, a PDW is expressed. A small portion of the PDW light is guided to an avalanche photo diode by the detection fiber. The electronic signal is amplified and then analyzed by a network analyzer with respect to phase shift and amplitude. The change in amplitude and phase in dependency of the distance between the emission and detection fiber and the modulation frequency can be related to the absorption coefficient µa and reduced scattering coefficient µs’ of the sample. These optical coefficients can be obtained for different wavelengths one after another.
The reduced scattering coefficients are used to determine the mean particle size and particle size distribution, with the help of the Mie theory and the theory of dependent scattering [22,43]. Highly turbid polymer samples have already been successfully analyzed and characterized by PDW spectroscopy regarding their mean particle diameter and PSD [44,45,46,47]. Inline monitoring of emulsion polymerization processes has also been successfully reported [20,21,48,49,50].
In this study, two polymer systems were evaluated, one which is not prone to incorporating water and one where water swelling of the particles is common, to show the differences in analyzing the particle size by PDW spectroscopy if water swelling of particles occurs. To determine the mean particle size and PSD, theoretical µs’ values are calculated that match the experimentally determined µs’ values by the applied PDW spectroscopy algorithm. If experimental and theoretical values agree well with each other, it can be assumed that the swelling, and particle characteristics represent the actual situation in the dispersion. To theoretically reproduce the experimentally determined µs’, the refractive index, and density of the polymer and medium as it is present in the dispersion, as well as the solid content, an assumption of the mean particle diameter and width of a normal logarithmic Gauss distribution are necessary for a data fit. In a first step, the solid content will be determined gravimetrically. A small weighted sample is placed in a drying cabinet at low temperature (74 °C) in order to keep the polymer intact. Drying was achieved over a period of time >72 h to evaporate the medium and bound water inside the polymer. The dry weight is measured at mass consistency, and the solid content calculated.
A concentration series of 30% (w/w), 20% (w/w), 10% (w/w), 1% (w/w), and 0.1% (w/w) of each polymer dispersion was used to determine the density of the polymer particles. Each sample was measured at 20 °C with a densitometer (DM45 Delta Rage, Mettler Toledo, Gießen, Germany). Density analysis of the particles for the pure polymer (100% (w/w)) was performed by [49]:
ρ D i s p = ρ D ρ P ω ρ D ρ P + ρ P 1 ρ D i s p = ω 1 ρ P 1 ρ D + 1 ρ D
with ρDisp, ρD, and ρP as densities of the dispersion, the dispersant, and the polymer and the solid content w of the dispersion. The density of pure water was considered for zero polymer content (0% (w/w)). The density of the polymer was obtained from the slope of a linear fit; the error was obtained via error propagation.
The same samples were also used for refractive index measurements with a multi-wavelength refractometer (DRS-λ, Schmidt + Haensch, Berlin, Germany) at 20 °C at seven different wavelengths between 403 and 938 nm. The measured refractive indices are extrapolated to the refractive index of the particles using the Newton equation and, afterwards, inter- or extrapolated to the wavelengths of PDW spectroscopy by a Cauchy formula [49,51].
To speed up the PDW calculations, estimates of the mean particle size and PSD can be introduced based on offline reference methods or theoretical particle size considerations. With these parameters, a first PDW spectroscopy fit is obtained within a few minutes.
In the case that this first fit of theoretical µs’ does not match the experimental results, high error values Χ2 for the µs’ fit are given by the software. The value of Χ2 expresses how well the theoretically calculated values agree with the experimentally determined values and is a measurement of the fit quality. If Χ2 values are high, modifications of the input parameters are necessary, as the particle in solution expresses different properties as determined by this first rough estimation of its physical properties. Literature data already suggest that the bound water inside the PVAc-PVA polymer cannot be dried off completely by only drying in an oven. A combination of different thermogravimetric techniques is necessary to determine the exact water content, which is very time consuming, costly, and complicated. The water-swollen polymer in solution does not express the same properties like in a dried state. To validate the mean particle diameter and PSD measurement by PDW spectroscopy, iterative steps of water swelling θswollen are assumed, affecting the density ρ P ,   s w o l l e n , refractive index n P , s w o l l e n , and volume fraction φ P ,   s w o l l e n of the polymer to a great extent. Various percentages of water swelling θswollen in 0.05 steps (from 0% to 50%) are assumed and added to the experimentally derived solid content. A new volume fraction for the particle affected by water swelling is calculated:
φ P , s w o l l e n = ( 1 + θ s w o l l e n )   ( ω g r a v i m e t r i c a l ρ P o l y m e r ) ( ω g r a v i m e t r i c a l ρ e x p e r i m e n t a l + ( 1 ω g r a v i m e t r i c a l ) ρ D )
with this new volume fraction of the swollen polymer φ P ,   s w o l l e n , adjusted values for the density (Formula (1)) and refractive index (Formula (3)) are recalculated.
n P , s w o l l e n = φ P ,   s w o l l e n n P 2 + 1 φ P ,   s w o l l e n n D 2
with the recalculated refractive index of water-swollen polymer as nP,swollen, the increased volume fraction φP,swollen, and the refractive index of the non-swollen particle nP and dispersant nD. These recalculated values are used with the assumed mean particle size and PSD to recalculate µs’ by the automated PDW spectroscopy algorithm. The resulting µs’ values are compared to the experimental values again and the X2 error parameter for the fit of theoretical-to-experimental µs’ is analyzed. The smaller the X2, the better the agreement between experimental and theoretical values, meaning the better the fit quality, and the water-swelling factor θswollen is assumed to represent the real properties of the particles in the analyzed dispersion.
This iterative approach is carried out for several percentages of water swelling until the lowest possible X2 value is found, starting with 10% water-swelling steps, finding the lowest X2 and minimizing the steps up to 1%. A parabola fit is used to find the minimum of X2 of the theoretically determined PDW spectroscopy fits. This percentage of water swelling represents the experimental data best and it can be assumed that the polymer is swollen with water by the derived percentage.
For comparison between size distribution data from DLS, SLS, and PDW spectroscopy, the mean particle diameter calculated from the volume frequency distributions are normalized regarding the bin width. PSDs are usually shown in different types of distributions. Most common types include intensity, number, and volume-based PSDs. PDW spectroscopy provides a volume-based PSD with a mean particle diameter comparable to the so-called De Brouckére mean (d43). The DLS measurement used for comparison gives a PSD in volume from measuring the hydrodynamic radius, calculated from an intensity weighted measurement [52,53,54]. To compare particle size distributions derived from PDW spectroscopy to distributions derived from offline, dilution-based techniques, an area normalization of the distribution is done. Normalization results in volume frequency distributions per nanometer (f3) for every measurement method.

3. Results and Discussion

All high-solid-content samples were synthesized as explained in the experimental section. For all dispersions, a white, turbid liquid without visible coagulation was obtained and stored in airtight containers until further use. Two polymer systems have been examined: the first, PS-SDS, is not known to incorporate water and no swelling of the particles is expected. Results are first shown for PS-SDS dispersions regarding reproducibility, PDW spectroscopy analysis of optical coefficients µa and µs’, and PSD analysis by PDW spectroscopy compared to offline standard PSD measurement methods as a best practice. The second particle system, PVAc-PVA, is analyzed in the same way regarding reproducibility and PDW spectroscopy with a focus on the determination of the particle swelling and size determination of the polymer particles.

3.1. Polystyrene—SDS Dispersions

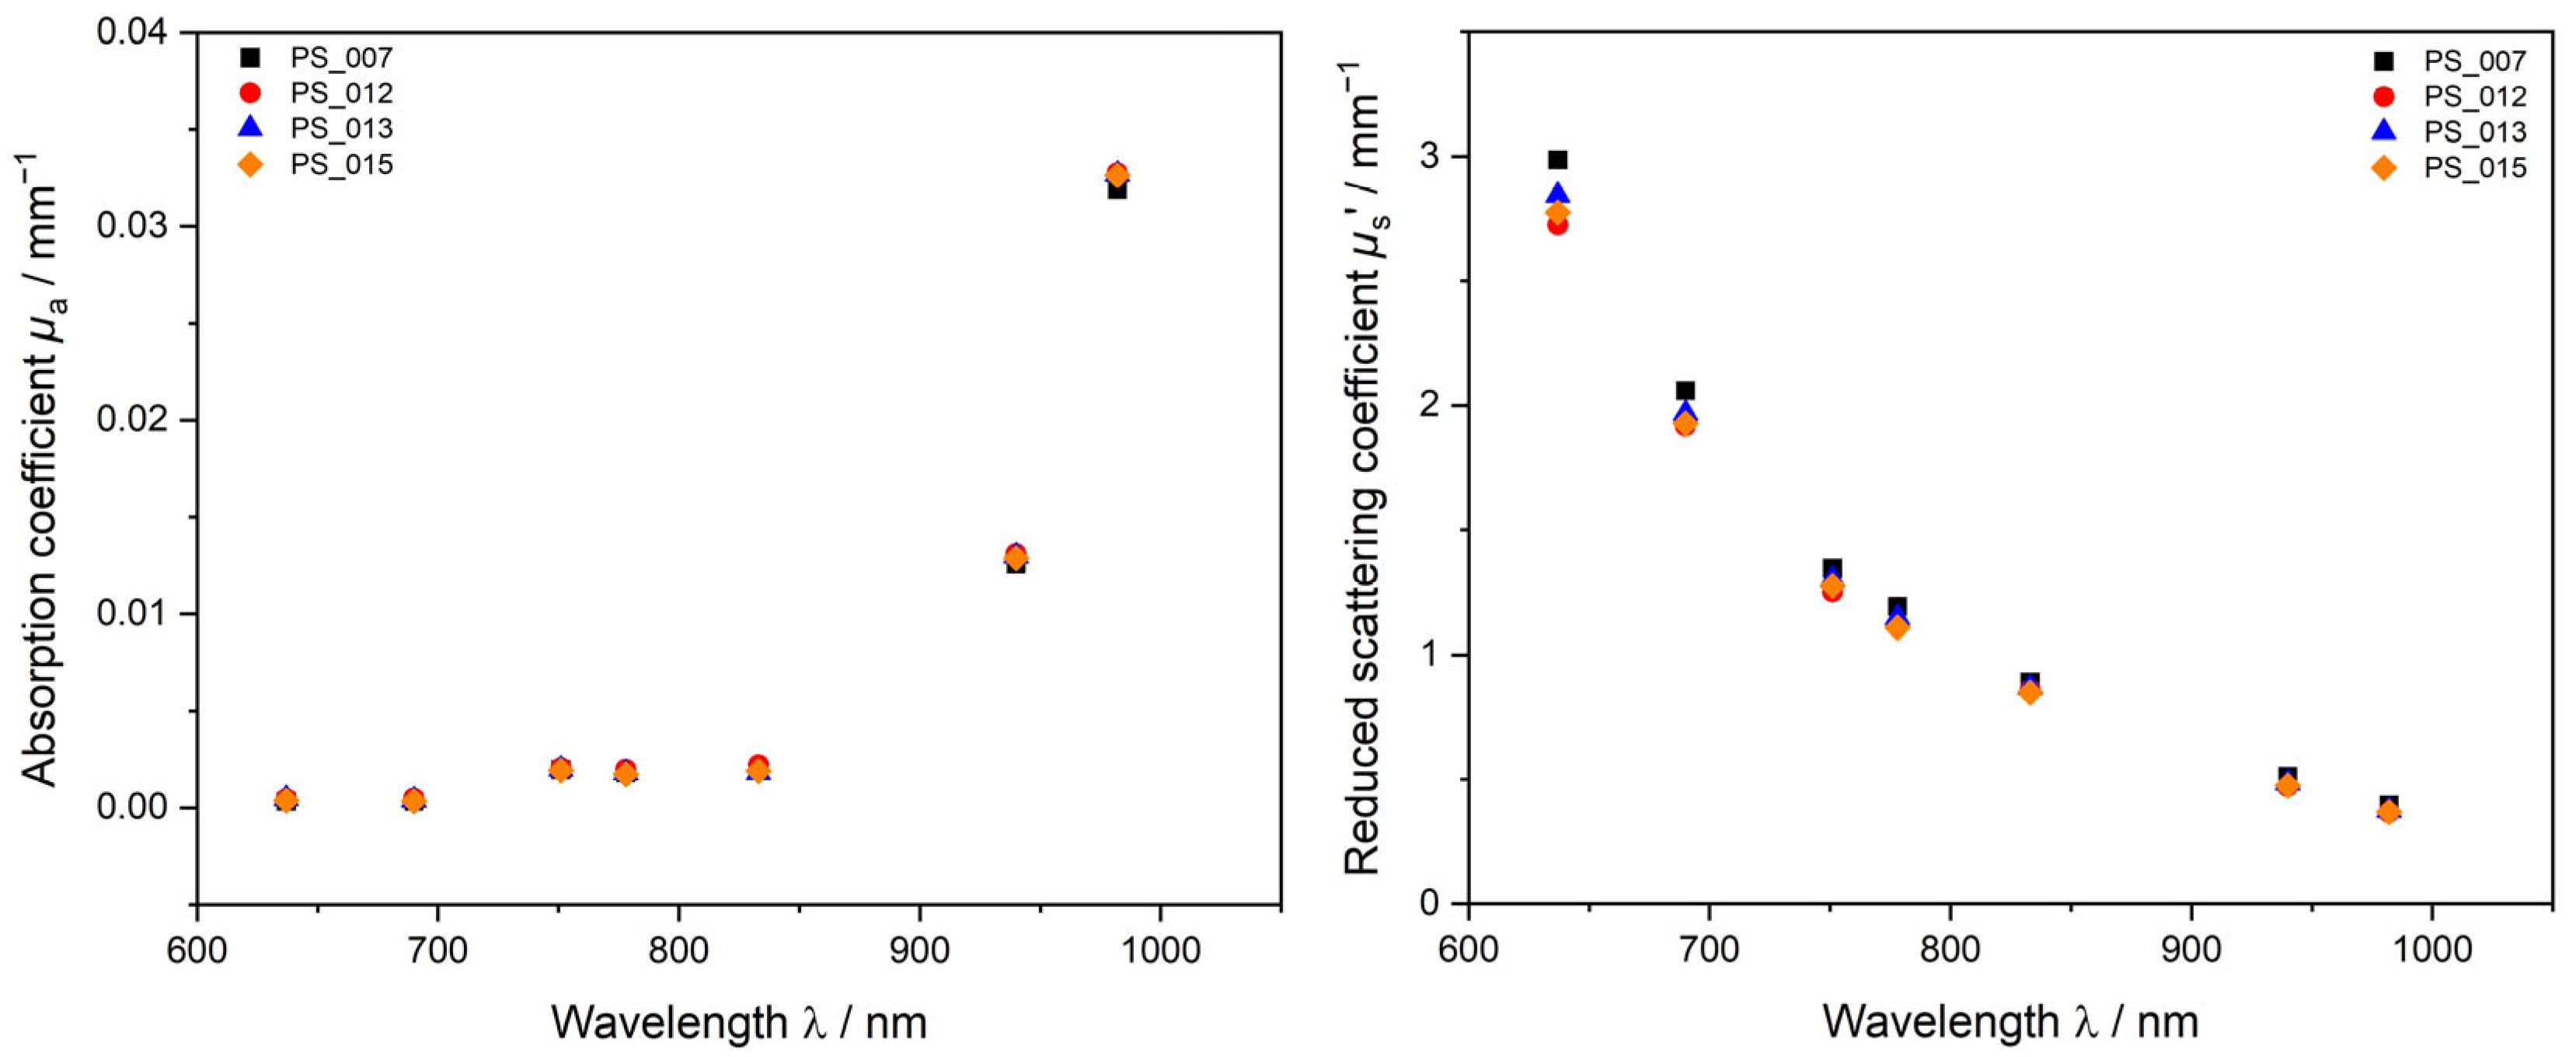
3.1.1. Reproducibility of Polystyrene Dispersions

To investigate the reproducibility during this work, up to four polymerizations have been performed at equal conditions. Figure 2 shows the absorption coefficient µa and reduced scattering coefficient µs’ obtained by PDW spectroscopy measurements of four undiluted PS dispersions obtained by identical syntheses. Results show that the dispersions are alike in their physical and chemical properties. The solid content of the four experiments was determined gravimetrically and statistically analyzed to be w = 36.3 ± 0.3% (w/w) (n = 4). For µa, very good agreement between the four experiments is obtained over the whole measurement range, whereas, for µs’, measurements at the lower wavelengths show small deviations in between the experiments. At wavelengths >700 nm the obtained data points agree very well with each other. The small deviations occurring at the lower wavelength range might occur due to possible fluorescent interferences of the laser and the sample. Another factor which might cause these small deviations in µs’ are the polymer content and small deviations in size of the samples. The difference in PS content in between the measurements, however, is very small; the highest w was gravimetrically determined to be w = 36.8% (w/w) for PS_015 and the lowest w of 36.5% (w/w) for PS_007. Even such small differences in the solid content, and possibly size of a few nanometers, can be detected by PDW spectroscopy via µs’. Due to the higher polymer content of the dispersions, an increase in particle scattering can be observed with PDW spectroscopy, where other methods like gravimetric solid content determination fail to detect this minimal difference in solid content. PS-SDS syntheses are highly reproducible with very small differences in mean particle size.

3.1.2. PDW Spectroscopy Analysis of Undiluted PS-SDS Dispersions

The scattering behavior of a sample contains a lot of information about the particles in the dispersion. PDW spectroscopy measures the reduced scattering coefficient µs’ dependent on the laser wavelength λ in undiluted polymer samples. Figure 3 shows experimentally measured µs’ values of three different PS-SDS dispersions and theoretical values obtained by PDW spectroscopy size analysis from a fit to the experimental data points after assuming the respective input parameters density, refractive index, size, and width of the distribution. For PS-SDS dispersions in the lower nanometer size regime, i.e., <100 nm mean particle diameter (PS 001 and PS 009_1), µs’ values < 4 mm−1 were obtained with µs’ decreasing steadily with increasing wavelength. For a dispersion with a mean particle diameter of approximately 270 nm (PS 003). values for µs’ were up to twenty times higher and a significant change of the trend form and an elevation in the curve can be observed at lower wavelengths around 700 nm. Even with the elevation and changed curve form, the measured µs’ values can be reproduced very well with assumptions of the physical parameters without necessary adjustment.
PDW spectroscopy for polystyrene dispersions is applicable for a wide range of dispersions, mean particle sizes, PSDs, and values of µs’ between 0.1 and 80 mm−1 at least. The theoretical µs’ values by PDW spectroscopy shown in Figure 3 as open symbols are calculated with gravimetrically derived solid content of PS 001 = 12.47% (w/w), PS 009_01 = 37.80% (w/w), and PS 003 = 29.89% (w/w). Density ρ and refractive index n of the pure PS-SDS sample without any further assumption of water swelling were calculated to ρPS-SDS = 1.055 g cm−3 and n ranging from 1.59 at 637 nm to 1.57 at 982 nm. The very good agreement of the fitted µs’ values to the experimental values verifies that SDS as a stabilizer does not incorporate water and PS-SDS particles are not swollen in water-based dispersions. The calculated values for wgravimetrical, nPolymer, and ρPolymer represent the actual particle properties as no water swelling occurs, causing these parameters to change. Therefore, the theoretical µs’ values fit well to the experimental values and low X2 values are obtained. X2 values are PS 001 = 336, PS 003 = 271, and PS-009_01 = 941.

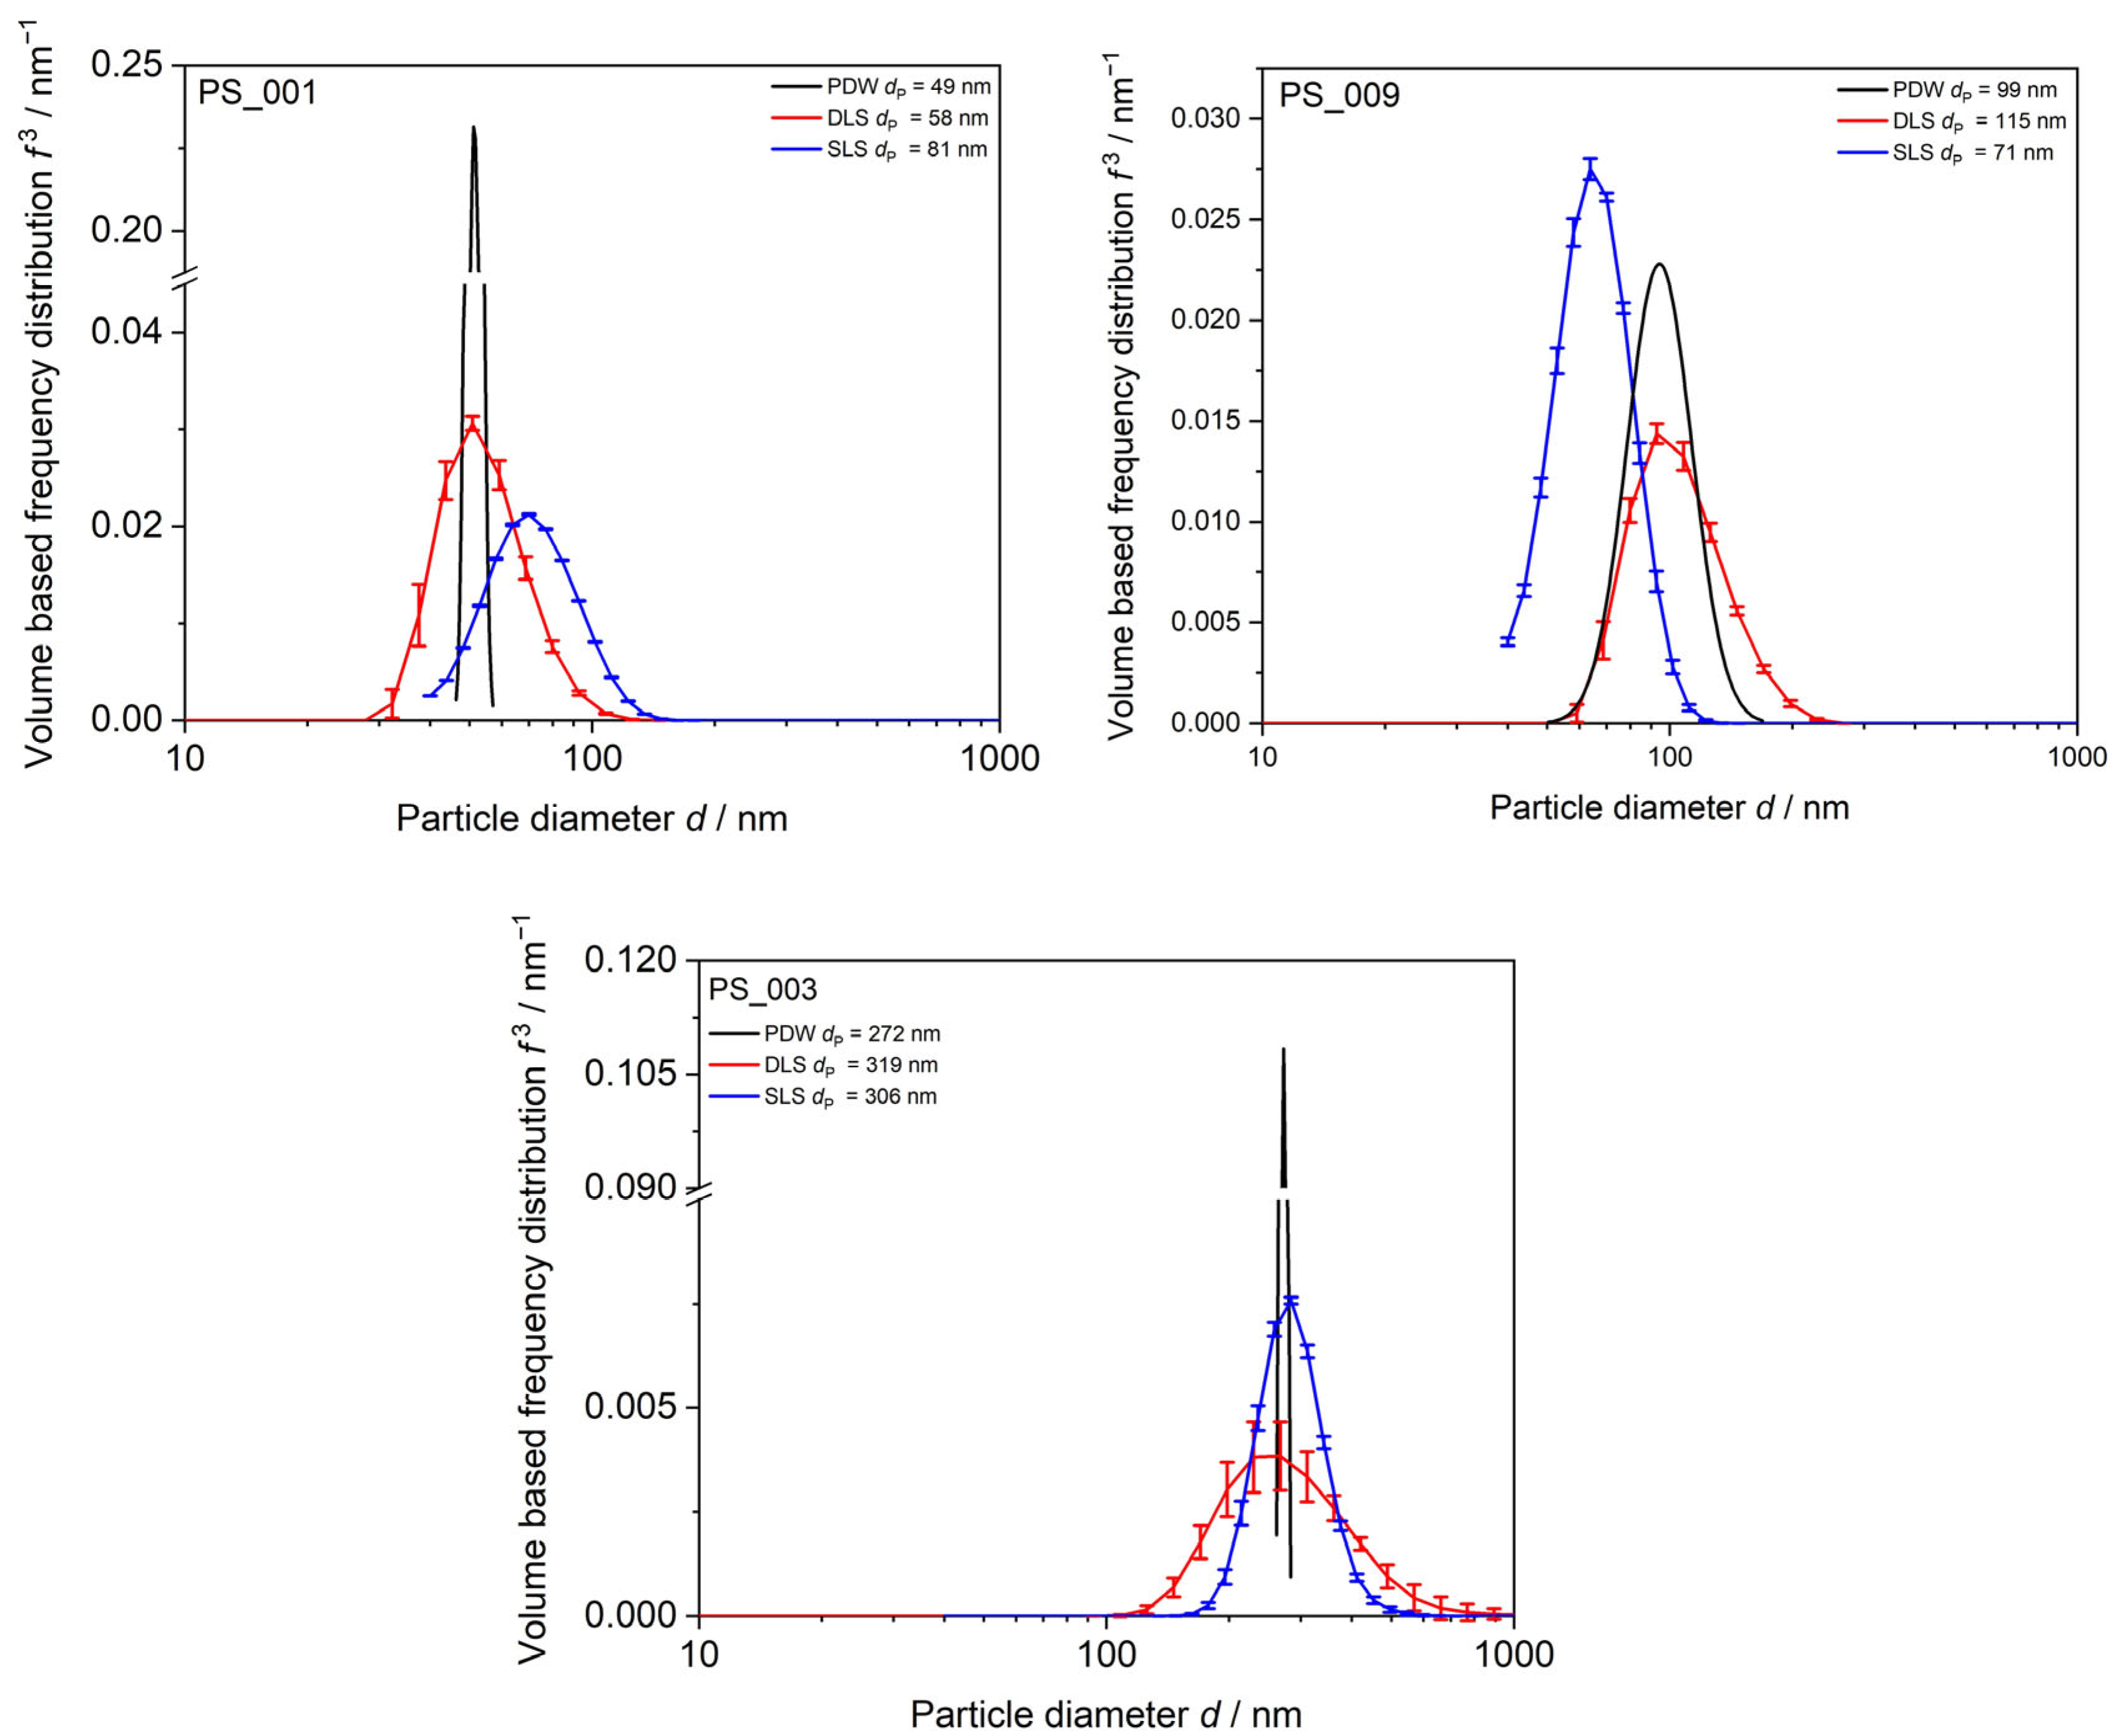
3.1.3. Method Comparison DLS, SLS, and PDW Spectroscopy

The dependency of µs’ on the particle diameter can be described by the Mie theory and dependent scattering and is used to derive a PSD from PDW spectroscopy measurements. To compare the distributions of the three different particle-sizing techniques, normalization regarding the size bin width has been applied and volume-based frequency distributions f3 are calculated. Mean particle diameters determined by each technique are compared in Table A1 in the Appendix A.
DLS always gives mean particle diameter values of approx. 15 to 20% bigger than PDW (Table A1 in the Appendix A). This is caused by the fact that DLS measurements determine the hydrodynamic radius of the particle, whereas PDW spectroscopy determines the size of a hard-sphere particle. The SLS determination of mean particle size shows deviations to DLS and PDW spectroscopy and determined values might be bigger or smaller than for the other techniques. The biggest deviations of up to 40% are found between PDW spectroscopy and SLS for mean particle sizes around 100 nm and smaller. SLS sizing is not suitable for such small particle diameters, as the measurement particle size range starts only at 40 nm on the device used and deviations are unavoidable which falsify the results. For the PSD determination by all three techniques, monomodality is assumed and verified in Figure 4. Comparison between dilution-based light-scattering techniques DLS and SLS and undiluted measurements via PDW spectroscopy are shown in Figure 4. The dilution-based methods result in far wider PSDs than data obtained from PDW spectroscopy, which gives the narrowest PSDs for all three dispersions shown. DLS measurements show tendencies to bigger particle sizes leading to bigger mean dP than PDW spectroscopy measurements. Results found in earlier studies revealed similar results regarding DLS [20,21,48]. SLS measurements show no clear trend. For the smallest particles, SLS shows a big deviation from the other methods with a mean dP of 81 nm rather than 50 nm like DLS and PDW spectroscopy. The SLS device used in this study starts measuring at 40 nm, leading to the assumption that particles of 50 nm mean dP lie within the lowest possible measurement range. For the dispersions with bigger mean particle sizes, SLS shows better agreement to the other methods.

3.2. Polyvinyl Acetate—Polyvinyl Alcohol Dispersions

3.2.1. Reproducibility PVAc-PVA

Figure 5 shows two emulsion polymerization products of PVAc-PVA with 1 g L−1 PVA in the initial charge produced under equal conditions. The left graph shows that, regarding the absorption properties, no differentiation between the two samples is possible. The trend of µa is following the form of pure water absorption, due to the high amount of water as the dispersion medium and little expected absorption from the polymer indicated by literature values from Kou and Pope [55,56]. Lower values are obtained as the polymer is present by approx. 40% (w/w) solid content. In Figure 5 (right), the µs’ trend versus wavelength shows small deviations in between the measurements. In the lower wavelength range, the first experiment 1 g L−1 PVA_1 gives a slightly higher value for µs’. For wavelengths >950 nm, this order is inverted, and the second experiment gives higher values for µs’. The solid content for both syntheses is nearly identical with 1 g L−1_PVA_1 = 41.61% (w/w) and 1 g L−1_PVA_2 = 40.87% (w/w), respectively. The slightly higher solid content might be responsible for the higher µs’ values for 1 g L−1_PVA_1.

3.2.2. PDW Spectroscopy Size Analysis of Undiluted PVAc-PVA Dispersions

For PVAc-PVA syntheses, particles with mean diameters between approximately 270 nm and 510 nm were obtained by starved-feed emulsion polymerization. Regarding the analysis of the undiluted dispersions using PDW spectroscopy, it was found that, for the PVAc-PVA dispersions, the trend form of µs’ vs. wavelength deviates from the decreasing trends shown for the PS-SDS systems in Figure 3. Figure 6 shows experimental and theoretical data for µs’ without any assumption of water swelling. Density and refractive index were calculated from gravimetrically derived solid contents w of PVAc-PVA_1 g L−1 = 41.61% (w/w), PVAc-PVA_2 g L−1 = 40.92% (w/w), and PVAc-PVA 5.5 g L−1 = 41.57% (w/w). Theoretical µs’ as a function of wavelength is shown as open symbols with dotted lines as a guide for the eye.
The experimental values (closed symbols in Figure 6) cannot be fitted exactly, if only the pure polymer properties and no swelling are considered and used for analysis (open symbols). Contrary to the SDS-stabilized PS samples, the PDW spectroscopy fit for the PVA-stabilized PVAc samples is not easily applied, and the calculated data points do not agree well with the experimental µs’ values over the wavelength range. This relates to the physical properties and scattering behavior of the PVAc-PVA particles. The deviation is caused by bound water in the PVAc-PVA particle. Due to the difference in their macromolecular chemical structure of the polymers and stabilizers, the particles express different properties and different water-binding abilities. For the hydrophilic PVAc-PVA particles, water is penetrating inside the particle and causes swelling. For PDW spectroscopy analysis, the volume fraction, refractive index, and density of the particle influence the resulting theoretical µs’ calculation, which is used for the exact size determination to a great extent. Water swelling of the PVAc-PVA particle causes changes to these factors and the calculated µs’ values are erroneous.
Figure 7 and Figure 8 show the results of the iterative approach explained earlier in the section “2.3 PDW Spectroscopy Dispersion Analysis” to determine the water swelling of the particles by a PDW spectroscopy fit analysis of theoretically calculated µs’ to experimentally determined values. For the dispersion PVAc-PVA 2 g L−1 shown in Figure 7, µs’ shows a minimum at approx. 750 nm and increases again to a maximum at 940 nm. The fit of the non-swollen curve (black line) cannot match the experimental results (red squares) and gives a very high value of Χ2 = 5486. Assumed percentages of water swelling leads to a better fit and, correspondingly, smaller Χ2 values (Figure 8). The smallest Χ2 = 1352 for this sample was calculated at 17.01% water swelling and a mean size of 391 ± 43 nm, improving the fit quality by factor four.
Figure 8 shows the Χ2 values of assumed iterative water swelling between 15% and 19%. The minimum is calculated with a parabola fit to be at 17.1% water swelling.
Table 4 gives the data of assumed water-swelling and Χ2 values on the other PVAc-PVA syntheses and clearly shows that, for all PVAc-PVA samples, assumed water-swelling leads to a significant increase in the fit quality and reduction in Χ2. Improvement leads from Χ2 reduction by a factor of three to an improvement of over ten times for two samples. The results show that, for all these syntheses, a certain degree of water swelling needs to be considered and it is very likely that the particles are swollen in the dispersion.

3.2.3. Method Comparison DLS, SLS, EM, and PDW Spectroscopy

Mean particle diameter for all dispersions was also determined by DLS, SLS, and PDW spectroscopy. The determined mean particle diameters for each sample with the determined swelling factor by iterative approach described before to minimize Χ2 are given in Table 5. Deviations between methods again range from 5% to 27% whereas DLS always gives an approx. 5 to 15% bigger mean dP value due to measuring the hydrodynamic radius rather that the hard-sphere particle diameter.
The dispersion was analyzed additionally by EM, using the Hough Circle transformation method with a circularity cut off at c ≤ 0.8. A total of 70 particles were analyzed by determining a histogram and normalized Gaussian distribution. Mean dP of 352 ± 27 nm was determined. Figure 9 shows that all the methods are in good agreement. EM analysis delivers the smallest mean dP as the sample is measured in a dried state and the water-swollen particle might collapse during sample preparation and measurement under vacuum conditions. After assumption of the swelling factor of 17.01%, PDW spectroscopy is able to deliver a result for the mean dP = 392 nm, with a narrow PSD. If one assumes that EM measures only the particle core and the swollen particle is collapsed completely, the mean dP values between EM and PDW spectroscopy reflect the calculated swelling factor within the range of error. According to PDW spectroscopy, 17.01% of the volume of the 392 nm polymer are caused by water swelling, leading to a mean dP of the collapsed particle of 325 nm which lies just within the range of errors of the calculated mean dP from electron microscopy of 352 ± 27 nm.

4. Conclusions

The presented PDW spectroscopy technique offers a wide range of applications, even for material with extreme scattering properties and high solid contents. This study shows that, for both polymer particles analyzed, size determination is possible at industrially relevant reaction conditions without dilution or necessary changes to the sample.
For basic systems like polystyrene dispersions with an SDS stabilizer, which do not incorporate water, the fitting of the experimental data with PDW spectroscopy leads to very good results with low error values of Χ2. In polyvinyl acetate dispersions, however, the theoretical fit to the experimental data is lacking accuracy and the fitted values deviate from the experimental data points, if no water swelling is assumed. Comparing the two polymer systems reveals that analysis of the PS-SDS system compared to the PVAc-PVA system is less challenging and analysis of PS-SDS shows better agreement to offline-based techniques without further adjustment. In this study, we showed that PDW spectroscopy is a solid technique to determine the swelling of the polymer by iterative assumption of the swelling factor and consecutive adaptation of physical parameters.

5. Outlook

For the PVAc-PVA system, the applied model for the µs’ fit needs to be modified, because of the incorporation of water in the PVAc-PVA particle. The incorporated water causes inconsistencies and deviations from the model assumptions for the physical particle properties like solid content and volume fraction, respectively, density, and refractive index, which are necessary for PSD analysis by PDW spectroscopy. The amount of free water and bound water is difficult to determine separately; differential scanning calorimetry (DSC) and further thermogravimetric analysis methods combined are necessary to investigate the amount of water in PVAc-PVA particles. Literature suggests a combination of thermal analysis methods like DSC, TGA, and IR analysis in order to determine the content of bound water in the particle structure.
In future work, the proposed iterative swelling approach and simultaneous adaptation of PDW spectroscopy input parameters needs to be incorporated in the particle size analysis of water-swollen polymers in the automated PDW spectroscopy size calculation algorithm.

Author Contributions

The manuscript was written through contributions of all authors. All authors have given approval to the final version of the manuscript. Conceptualization, S.S. and L.B.; methodology, S.S. and L.B.; software, M.M. and L.B.; validation, S.S., L.B., M.M. and O.R.; formal analysis, S.S.; investigation, S.S.; writing—original draft preparation, S.S.; writing—review and editing, S.S., L.B., M.M. and O.R.; visualization, S.S.; project administration, L.B., M.M. and O.R.; funding acquisition, M.M., L.B. and O.R. All authors have read and agreed to the published version of the manuscript.

Funding

This study was financed by the financial support of the German Federal Ministry of Education and Research (grants 03Z22AN12, 03IHS048A and 03Z22AB1B) and the University of Potsdam. Funded by the Deutsche Forschungsgemeinschaft (DFG, German Research Foundation)—Project-number 491466077.

Institutional Review Board Statement

Not applicable.

Data Availability Statement

The data that support the findings of this study are available on request from the corresponding author.

Acknowledgments

The authors would like to acknowledge funding by the German Federal Ministry of Education and Research (grants 03Z22AN12 and 03Z22AB1B) and the Deutsche Forschungsgemeinschaft (DFG, German Research Foundation)—Project-number 491466077 and the University of Potsdam.

Conflicts of Interest

The authors declare no conflict of interest.

Appendix A

Table A1. Mean particle diameters dP determined by particle-sizing techniques for different PS-SDS dispersions produced.
Sample IDMean dP PDWMean dP SLSMean dP DLSPDW/SLSPDW/DLS
PS_001 *49.0080.8558.500.610.84
PS_003271.96287.79319.570.940.85
PS_004296.42318.80356.290.930.83
PS_007 **100.0272.23114.771.380.87
PS_009_199.1471.83115.271.380.86
PS_009_2101.1772.10131.541.400.77
PS_011 *75.8782.9978.060.910.97
PS_012 **97.3271.07109.131.370.89
PS_013 **99.0071.65116.471.380.85
PS_014251.77250.56254.231.000.99
PS_015 **96.4672.09113.041.340.85
PS_016274.34321.80283.500.850.97
PS_018259.82288.54278.270.900.93
PS_019259.48315.30271.330.820.96
PS_020 *56.9669.2780.460.820.71
* seed synthesis after Table 1. ** syntheses compared in Figure 2.

References

  1. Koltzenburg, S.; Maskos, M.; Nuyken, O. Polymere: Synthese, Eigenschaften und Anwendungen; Springer: Berlin/Heidelberg, Germany, 2014; ISBN 978-3-642-34772-6/978-3-642-34773-3. [Google Scholar]
  2. Asua, J.M. On-line control of emulsion polymerization reactors: A perspective. Can. J. Chem. Eng. 2023, 1–7. [Google Scholar] [CrossRef]
  3. Lerche, D.; Miller, R.; Schaeffler, M. Dispersionseigenschaften 2D-Rheologie, 3D-Rheologie, Stabilitaet, 1st ed.; Eigenverlag: Berlin-Potsdam, Germany, 2015. [Google Scholar]
  4. Aguirre, M.; Ballard, N.; Gonzalez, E.; Hamzehlou, S.; Sardon, H.; Calderon, M.; Paulis, M.; Tomovska, R.; Dupin, D.; Bean, R.H.; et al. Polymer Colloids: Current Challenges, Emerging Applications, and New Developments. Macromolecules 2023, 56, 2579–2607. [Google Scholar] [CrossRef]
  5. Ober, C.K.; Lok, K.P.; Hair, M.L. Monodispersed, micron-sized polystyrene particles by dispersion polymerization. J. Polym. Sci. Polym. Lett. Ed. 1985, 23, 103–108. [Google Scholar] [CrossRef]
  6. Chicoma, D.L.; Sayer, C.; Giudici, R. In-Line Monitoring of Particle Size during Emulsion Polymerization under Different Operational Conditions using NIR Spectroscopy: In-Line Monitoring of Particle Size during Emulsion Polymerization. Macromol. React. Eng. 2011, 5, 150–162. [Google Scholar] [CrossRef]
  7. Frauendorfer, E.; Wolf, A.; Hergeth, W.-D. Polymerization Online Monitoring. Chem. Eng. Technol. 2010, 33, 1767–1778. [Google Scholar] [CrossRef]
  8. Ito, K.; Kato, T.; Ona, T. Non-destructive method for the quantification of the average particle diameter of latex as water-based emulsions by near-infrared Fourier transform Raman spectroscopy. J. Raman Spectrosc. 2002, 33, 466–470. [Google Scholar] [CrossRef]
  9. Besseling, R.; Damen, M.; Wijgergangs, J.; Hermes, M.; Wynia, G.; Gerich, A. New unique PAT method and instrument for real-time inline size characterization of concentrated, flowing nanosuspensions. Eur. J. Pharm. Sci. 2019, 133, 205–213. [Google Scholar] [CrossRef]
  10. Hergeth, W.-D.; Frauendorfer, E. Online-Reaktionsverfolgung bei der Polymerisation. Chem. Ing. Tech. 2010, 82, 503–507. [Google Scholar] [CrossRef]
  11. de Kanter, M.; Meyer-Kirschner, J.; Viell, J.; Mitsos, A.; Kather, M.; Pich, A.; Janzen, C. Enabling the measurement of particle sizes in stirred colloidal suspensions by embedding dynamic light scattering into an automated probe head. Measurement 2016, 80, 92–98. [Google Scholar] [CrossRef]
  12. Calzolai, L.; Gilliland, D.; Rossi, F. Measuring nanoparticles size distribution in food and consumer products: A review. Food Addit. Contam. Part A Chem. Anal. Control Expo. Risk Assess. 2012, 29, 1183–1193. [Google Scholar] [CrossRef]
  13. Heiligtag, F.J.; Niederberger, M. The fascinating world of nanoparticle research. Mater. Today 2013, 16, 262–271. [Google Scholar] [CrossRef]
  14. Modena, M.M.; Rühle, B.; Burg, T.P.; Wuttke, S. Nanoparticle Characterization: What to Measure? Adv. Mater. 2019, 31, e1901556. [Google Scholar] [CrossRef] [PubMed]
  15. Caputo, F.; Vogel, R.; Savage, J.; Vella, G.; Law, A.; Della Camera, G.; Hannon, G.; Peacock, B.; Mehn, D.; Ponti, J.; et al. Measuring particle size distribution and mass concentration of nanoplastics and microplastics: Addressing some analytical challenges in the sub-micron size range. J. Colloid. Interface Sci. 2021, 588, 401–417. [Google Scholar] [CrossRef]
  16. Schärtl, W. Light Scattering from Polymer Solutions and Nanoparticle Dispersions; Springer: Berlin/Heidelberg, Germany, 2007; ISBN 978-3-540-71950-2. [Google Scholar]
  17. Pecora, R. Dynamic Light Scattering Measurement of Nanometer Particles in Liquids. J. Nanoparticle Res. 2020, 2, 9. [Google Scholar] [CrossRef]
  18. Takahashi, K.; Kato, H.; Saito, T.; Matsuyama, S.; Kinugasa, S. Precise Measurement of the Size of Nanoparticles by Dynamic Light Scattering with Uncertainty Analysis. Part Part. Syst. Charact. 2008, 25, 31–38. [Google Scholar] [CrossRef]
  19. Jia, Z.; Li, J.; Gao, L.; Yang, D.; Kanaev, A. Dynamic Light Scattering: A Powerful Tool for In Situ Nanoparticle Sizing. Colloids Interfaces 2023, 7, 15. [Google Scholar] [CrossRef]
  20. Schlappa, S.; Brenker, L.J.; Bressel, L.; Hass, R.; Münzberg, M. Process Characterization of Polyvinyl Acetate Emulsions Applying Inline Photon Density Wave Spectroscopy at High Solid Contents. Polymers 2021, 13, 669. [Google Scholar] [CrossRef] [PubMed]
  21. Jacob, L.I.; Pauer, W. In-line monitoring of latex-particle size during emulsion polymerizations with a high polymer content of more than 60. RSC Adv. 2020, 10, 26528–26534. [Google Scholar] [CrossRef]
  22. Bressel, L.; Hass, R.; Reich, O. Particle sizing in highly turbid dispersions by Photon Density Wave spectroscopy. J. Quant. Spectrosc. Radiat. Transf. 2013, 126, 122–129. [Google Scholar] [CrossRef]
  23. Schiewe, T.; Gutschmann, B.; Santolin, L.; Waldburger, S.; Neubauer, P.; Hass, R.; Riedel, S.L. Real-time monitoring of biomass during Escherichia coli high-cell-density cultivations by in-line photon density wave spectroscopy. Biotechnol. Bioeng. 2023, 1–10. [Google Scholar] [CrossRef]
  24. Li, W.; Xue, F.; Cheng, R. States of water in partially swollen poly(vinyl alcohol) hydrogels. Polymer 2005, 46, 12026–12031. [Google Scholar] [CrossRef]
  25. Hodge, R.M.; Edward, G.H.; Simon, G.P. Water absorption and states of water in semicrystalline poly(vinyl alcohol) films. Polymer 1996, 37, 1371–1376. [Google Scholar] [CrossRef]
  26. Higuchi, A.; Iijima, T. DSC investigation of the states of water in poly(vinyl alcohol) membranes. Polymer 1985, 26, 1207–1211. [Google Scholar] [CrossRef]
  27. Ochigbo, S.; Suleiman, M. Comparisons between Polyvinyl Alcohol (PVOH) and Sodium Dodecyl Sulphate (SDS) as Surfactants in Natural Rubber (NR)/Polyvinyl Acetate (PVAc) Latex Blends. IRJPAC 2015, 5, 99–105. [Google Scholar] [CrossRef]
  28. Guan, L.; Xu, H.; Huang, D. The investigation on states of water in different hydrophilic polymers by DSC and FTIR. J. Polym. Res. 2011, 18, 681–689. [Google Scholar] [CrossRef]
  29. Hatakeyama, T.; Nakamura, K.; Hatakeyama, H. Determination of bound water content in polymers by DTA, DSC and TG. Thermochim. Acta 1988, 123, 153–161. [Google Scholar] [CrossRef]
  30. Wang, R.; Wang, Q.; Li, L. Evaporation behaviour of water and its plasticizing effect in modified poly(vinyl alcohol) systems: Evaporation of water and plasticizing effect in modified PVA. Polym. Int. 2003, 52, 1820–1826. [Google Scholar] [CrossRef]
  31. Bajpai, A.K.; Saini, R. Preparation and characterization of novel biocompatible cryogels of poly (vinyl alcohol) and egg-albumin and their water sorption study. J. Mater. Sci. Mater. Med. 2006, 17, 49–61. [Google Scholar] [CrossRef] [PubMed]
  32. Hodge, R.M.; Bastow, T.J.; Edward, G.H.; Simon, G.P.; Hill, A.J. Free Volume and the Mechanism of Plasticization in Water-Swollen Poly(vinyl alcohol). Macromolecules 1996, 29, 8137–8143. [Google Scholar] [CrossRef]
  33. Miyagi, Z.; Tanaka, K. Sorption of water vapor by poly(vinyl acetate). Colloid. Polym. Sci. 1979, 257, 259–265. [Google Scholar] [CrossRef]
  34. Jain, N.; Singh, V.K.; Chauhan, S. A review on mechanical and water absorption properties of polyvinyl alcohol based composites/films. J. Mech. Behav. Mater. 2017, 26, 213–222. [Google Scholar] [CrossRef]
  35. Gonzlez, G.S.M.; Dimonie, V.L.; Sudol, E.D.; Yue, H.J.; Klein, A.; El-Aasser, M.S. Characterization of poly(vinyl alcohol) during the emulsion polymerization of vinyl acetate using poly(vinyl alcohol) as emulsifier. J. Polym. Sci. Part. A Polym. Chem. 1996, 34, 849–862. [Google Scholar] [CrossRef]
  36. Shaheen, S.M.; Yamaura, K. Preparation of theophylline hydrogels of atactic poly(vinyl alcohol)/NaCl/H2O system for drug delivery system. J. Control. Release 2002, 81, 367–377. [Google Scholar] [CrossRef]
  37. Lepizzera, S.M.; Hamielec, A.E. Nucleation of particles in seeded emulsion polymerization of vinyl acetate with poly(vinyl alcohol) as emulsifier. Macromol. Chem. Phys. 1994, 195, 3103–3115. [Google Scholar] [CrossRef]
  38. Capek, I.; Lin, S.-Y.; Hsu, T.-J.; Chern, C.-S. Effect of temperature on styrene emulsion polymerization in the presence of sodium dodecyl sulfate. II. J. Polym. Sci. Part A Polym. Chem. 2000, 38, 1477–1486. [Google Scholar] [CrossRef]
  39. Mariz, I.d.F.; de La Cal, J.C.; Leiza, J.R. Control of particle size distribution for the synthesis of small particle size high solids content latexes. Polymer 2010, 51, 4044–4052. [Google Scholar] [CrossRef]
  40. Liu, B.; Zhang, M.; Liu, Y.; Tan, Z.; Zhou, C.; Zhang, H. Particle Nucleation and Growth in the Emulsion Polymerization of Styrene: Effect of Monomer/Water Ratio and Electrolyte Concentration. J. Macromol. Sci. Part A 2015, 52, 147–154. [Google Scholar] [CrossRef]
  41. Jacob, L.I.; Pauer, W.; Schröter, B. Influence of redox initiator component ratios on the emulsion copolymerisation of vinyl acetate and neodecanoic acid vinyl ester. RSC Adv. 2022, 12, 14197–14208. [Google Scholar] [CrossRef]
  42. Zecha, H.; Weitzel, H.-P. Method for Producing Vinyl Ester Polymers Having Specifically Settable Dispersity and Low Polydispersity. U.S. Patent US 9,650,507, 2 April 2013. [Google Scholar]
  43. Hass, R.; Münzberg, M.; Bressel, L.; Reich, O. Industrial applications of photon density wave spectroscopy for in-line particle sizing Invited. Appl. Opt. 2013, 52, 1423–1431. [Google Scholar] [CrossRef] [PubMed]
  44. Hass, R.; Munzke, D.; Ruiz, S.V.; Tippmann, J.; Reich, O. Optical monitoring of chemical processes in turbid biogenic liquid dispersions by Photon Density Wave spectroscopy. Anal. Bioanal. Chem. 2015, 407, 2791–2802. [Google Scholar] [CrossRef] [PubMed]
  45. Bressel, K.; Müller, W.; Leser, M.E.; Reich, O.; Hass, R.; Wooster, T.J. Depletion-Induced Flocculation of Concentrated Emulsions Probed by Photon Density Wave Spectroscopy. Langmuir 2020, 36, 3504–3513. [Google Scholar] [CrossRef]
  46. Münzberg, M.; Hass, R.; Reich, O. In-line characterization of phase inversion temperature emulsification by photon density wave spectroscopy. SOFW J. 2013, 4, 38–46. [Google Scholar]
  47. Häne, J.; Brühwiler, D.; Ecker, A.; Hass, R. Real-time inline monitoring of zeolite synthesis by Photon Density Wave spectroscopy. Microporous Mesoporous Mater. 2019, 288, 109580. [Google Scholar] [CrossRef]
  48. Jacob, L.I.; Pauer, W. Scale-up of Emulsion Polymerisation up to 100 L and with a Polymer Content of up to 67 wt%, Monitored by Photon Density Wave Spectroscopy. Polymers 2022, 14, 1574. [Google Scholar] [CrossRef] [PubMed]
  49. Bressel, L. Bedeutung Der Abhaengigen Streuung Für Die Optischen Eigenschaften Hochkonzentrierter Dispersionen. Ph.D. Thesis, University of Potsdam, Potsdam, Germany, 2016. [Google Scholar]
  50. Reich, O. Photonendichtewellenspektroskopie Mit Intensitaetsmodulierten Diodenlasern. Ph.D. Thesis, University of Potsdam, Potsdam, Germany, 2005. [Google Scholar]
  51. Hass, R. Angewandte Photonendichtewellen Spektroskopie. Ph.D. Thesis, University of Potsdam, Potsdam, Germany, 2011. [Google Scholar]
  52. What Is the Z-Average Size Determined by DLS. Available online: https://www.horiba.com/en_en/dynamic-light-scattering-dls-z-average/ (accessed on 28 December 2021).
  53. Thomas, J.C. The determination of log normal particle size distributions by dynamic light scattering. J. Colloid. Interface Sci. 1987, 117, 187–192. [Google Scholar] [CrossRef]
  54. Stetefeld, J.; McKenna, S.A.; Patel, T.R. Dynamic light scattering: A practical guide and applications in biomedical sciences. Biophys. Rev. 2016, 8, 409–427. [Google Scholar] [CrossRef] [PubMed] [Green Version]
  55. Kou, L.; Labrie, D.; Chylek, P. Refractive indices of water and ice in the 0.65- to 2.5-µm spectral range. Appl. Opt. 1993, 32, 3531–3540. [Google Scholar] [CrossRef] [Green Version]
  56. Pope, R.M.; Fry, E.S. Absorption spectrum (380–700 nm) of pure water. II. Integrating cavity measurements. Appl. Opt. 1997, 36, 8710–8723. [Google Scholar] [CrossRef]
Figure 1. Representative chemical structures of polymers PS and PVAc, and stabilizers SDS and PVA used in this study. From top left to bottom right: structure of polymer PS, stabilizer SDS, polymer PVAc, and stabilizer PVA.
Polymers 15 03181 g001
Figure 2. Four repeated emulsion polymerization PS-SDS experiments. Dispersions produced after the same recipe and procedure. Optical parameters µa (left) and µs’ (right), determined in the undiluted sample at approx. 36.3% (w/w) PS-SDS with PDW spectroscopy.
Polymers 15 03181 g002
Figure 3. Calculated theoretical µs’ values obtained with Mie-theory- and global-analysis-based PDW spectroscopy fit (open symbols) fitted to experimental µs’ (closed symbols) with calculated error bars highlighted in light green, light blue and light red. PS-SDS dispersion with mean particle diameter of PS 001 = 49.0 nm (red squares), PS 009_01 = 99.1 nm (blue circles), and PS 003 = 271.7 nm (green triangles).
Polymers 15 03181 g003
Figure 4. PSD of PS-SDS emulsions with mean particle diameters from approx. 49 nm to 272 nm. Comparison between dilution-based DLS, SLS, and undiluted PDW spectroscopy. DLS and SLS values are shown as mean out of three measurements with calculated mean value and standard deviation as error bars.
Polymers 15 03181 g004
Figure 5. Reproducibility of PVAc-PVA dispersion with 1 g L−1 PVA in the initial charge. Repetition experiments were performed at equal reaction conditions.
Polymers 15 03181 g005
Figure 6. Theoretical µs’ values (open symbols) fitted to experimental µs’ values (closed symbols) from a Mie-theory- and global-analysis-based PDW spectroscopy measurement without assumption of water swelling. Three different PVAc-PVA dispersions with increasing content of PVA in the iC are shown. The orange curve shows µs’ for 1 g L−1 PVA in the iC, blue 2 g L−1, and green 5.5 g L−1. Error bars are indicated in brown, light blue and light green respectively.
Polymers 15 03181 g006
Figure 7. Iterative approach of PDW spectroscopy fit of the reduced scattering coefficient µs’ to minimize Χ2 by increasing the water-swelling factor of the PVAc-PVA particle. Sample with 2 g L−1 PVA in the iC. Black line shows the µs’ fit without any water swelling assumed.
Polymers 15 03181 g007
Figure 8. Assumed water swelling, with corresponding Χ2 values fitted with a parabola fit to find the lowest Χ2 value and, therefore, assumed best PDW spectroscopy fit. Parabola fit used gives R2 = 0.96.
Polymers 15 03181 g008
Figure 9. PSD of PVAc-PVA 2 g L−1 dispersion. Comparison between SLS, DLS, EM, and PDW spectroscopy. PDW spectroscopy distribution is determined with the calculated water-swelling factor of 17.01%. DLS and SLS values are shown as mean out of three measurements with calculated mean value and standard deviation as error bars.
Polymers 15 03181 g009
Table 1. Recipe for batch emulsion polymerization of PS seed particles.
ChemicalAmount [g]
MediumMilli-Q® water530
MonomerStyrene135
StabilizerSDS6.2 a
BufferNa-Tetra Borate0.125
InitiatorPotassium peroxodisulfate5.0 b
a dissolved in 30 g Milli Q® water. b dissolved in 95 g Milli Q® water.
Table 2. Recipe for seeded emulsion polymerization of PS particles.
ChemicalAmount [g]Feedrate [mL min−1]
MediumMilli-Q® water308.6 a
SeedPS Seed31.5 b
MonomerStyrene337 c2.1
Stabilizer10% SDS solution d164
BufferNa-Tetra Borate0.25
Initiator5% potassium peroxodisulfate solution 100
a except for syntheses PS003, PS004, and PS005 where 301 g water, PS009_1, and 009_2 where 130 g water, and PS020 where 500 g water were charged. b except for syntheses PS009_1 and PS009_2 where 100 g of PS seed were used. c except for syntheses PS009_1 and PS009_2 where 240 g styrene were fed at 1.5 mL min−1. d except for syntheses PS014 and PS016 where 3%, and PS018 and PS019 where 5% SDS solution were used.
Table 3. Recipe for PVAc-PVA dispersions. Experimental series of five syntheses with increasing amount of stabilizer in the iC.
Sample IDPVAiC [g] Milli-Q®iC [g]c (PVAiC) [g L−1]Solid Content ω [%]Density ρP [g cm−3]
PVAc-PVA 0 g L−10302041.071.216
PVAc-PVA 1 g L−10.2993020.9941.611.214
PVAc-PVA 2 g L−10.5993021.9840.921.216
PVAc-PVA 5.5 g L−11.663025.5041.571.212
PVAc-PVA 11 g L−13.3130210.9640.771.214
Table 4. Degree of water swelling determined by PDW spectroscopy iterative fitting to lowest Χ2 and corresponding improvement factor to non-swollen fit.
SampleDegree of Swelling θswollen/%Χ2Χ2 Improvement Factor
PVAc-PVA 0 g L−119.298713.7
PVAc-PVA 1 g L−122.002507.2
PVAc-PVA 2 g L−117.0713524.06
PVAc-PVA 5.5 g L−112.382,59443.38
PVAc-PVA 11 g L−138.41408412.1
Table 5. Mean dP values of PVAc-PVA particles in dispersion given from volume frequency distribution of PDW spectroscopy, SLS, and DLS measurements.
Sample IDMean dP PDWMean dP SLSMean dP DLSPDW/SLSPDW/DLS
PVAc-PVA 0 g L−1507.91438.51579.781.160.88
PVAc-PVA 1 g L−1_1 *412.34401.17483.301.030.85
PVAc-PVA 1 g L−1_2 *409.86403.54493.211.020.83
PVAc-PVA 2 g L−1391.57385.50470.771.020.83
PVAc-PVA 5.5 g L−1 *306.82324.11359.600.950.85
PVAc-PVA 11 g L−1271.37213.27284.801.270.95
* syntheses compared in Figure 5.
Disclaimer/Publisher’s Note: The statements, opinions and data contained in all publications are solely those of the individual author(s) and contributor(s) and not of MDPI and/or the editor(s). MDPI and/or the editor(s) disclaim responsibility for any injury to people or property resulting from any ideas, methods, instructions or products referred to in the content.

