
The Effect of Alkaline Treatment on Poly(lactic acid)/Date Palm Wood Green Composites for Thermal Insulation


Abstract
:1. Introduction
2. Materials and Methods
2.1. Materials
2.2. Alkalinization and Composite Manufacturing
2.3. Fourier Transform Infrared (FTIR)
2.4. Scanning Electron Microscope (SEM)
2.5. Density ()
2.6. Differential Scanning Calorimeter (DSC)
2.7. Thermal Conductivity
2.8. Specific Heat Capacity () and Thermal Diffusivity ()
2.9. Thermogravimetry Analysis (TGA)
2.10. Mechanical Properties
3. Results
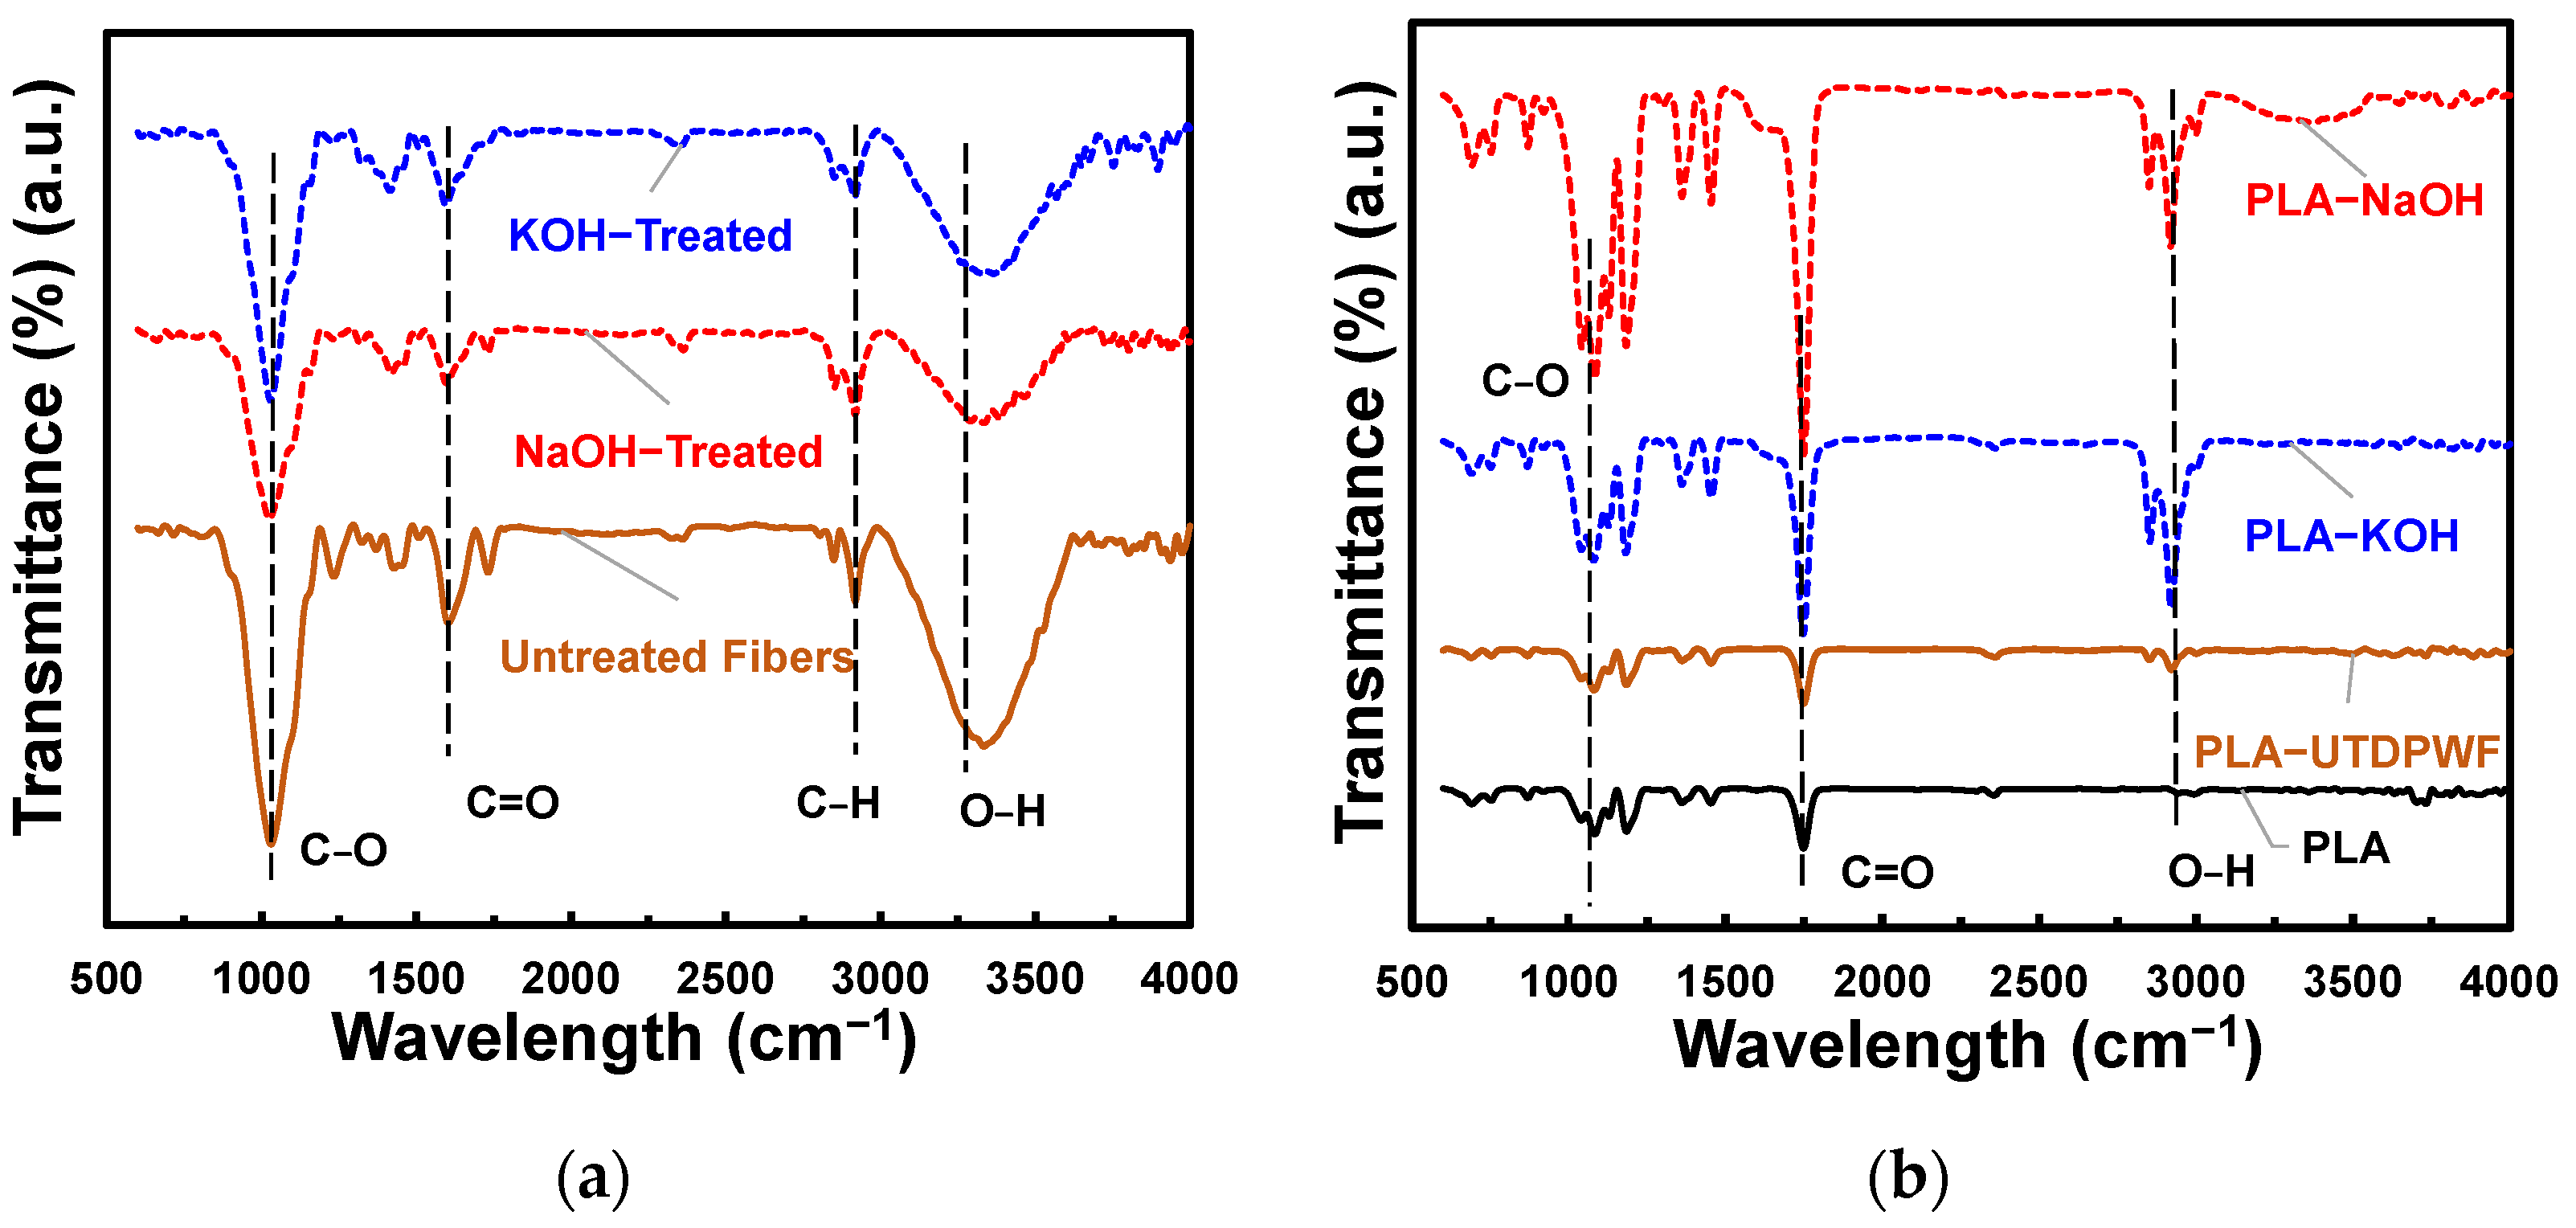
3.1. FTIR
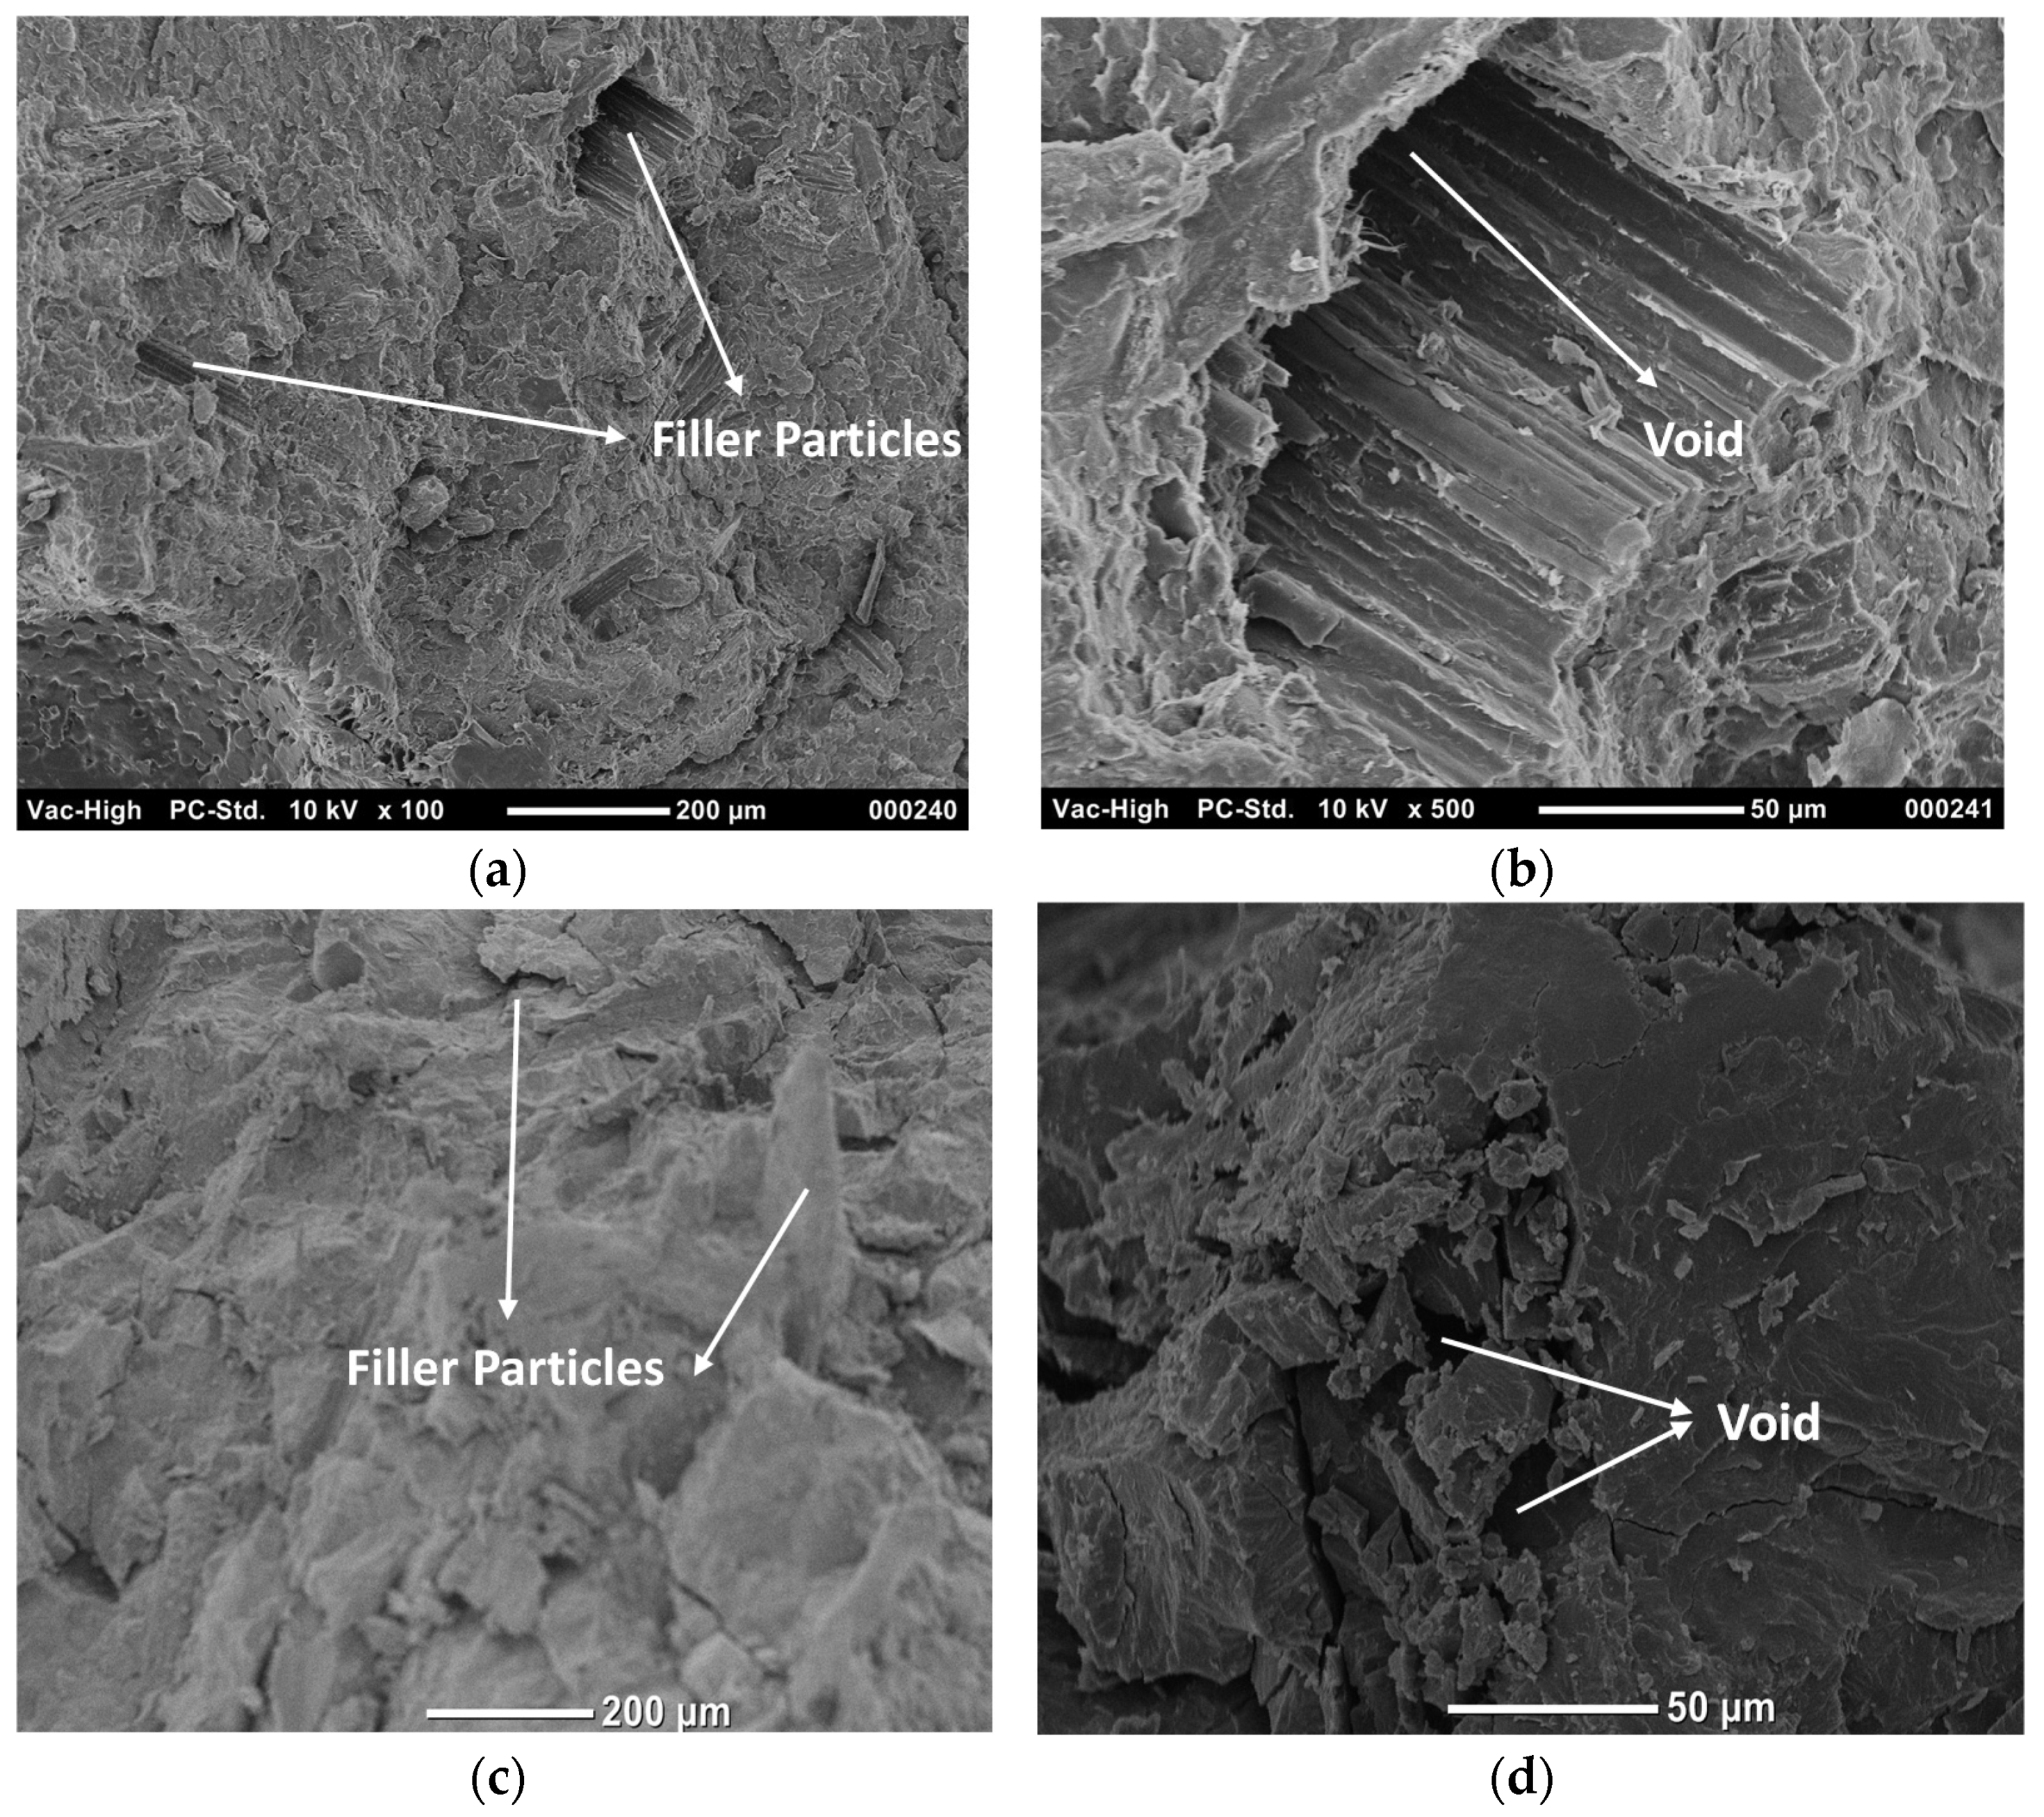
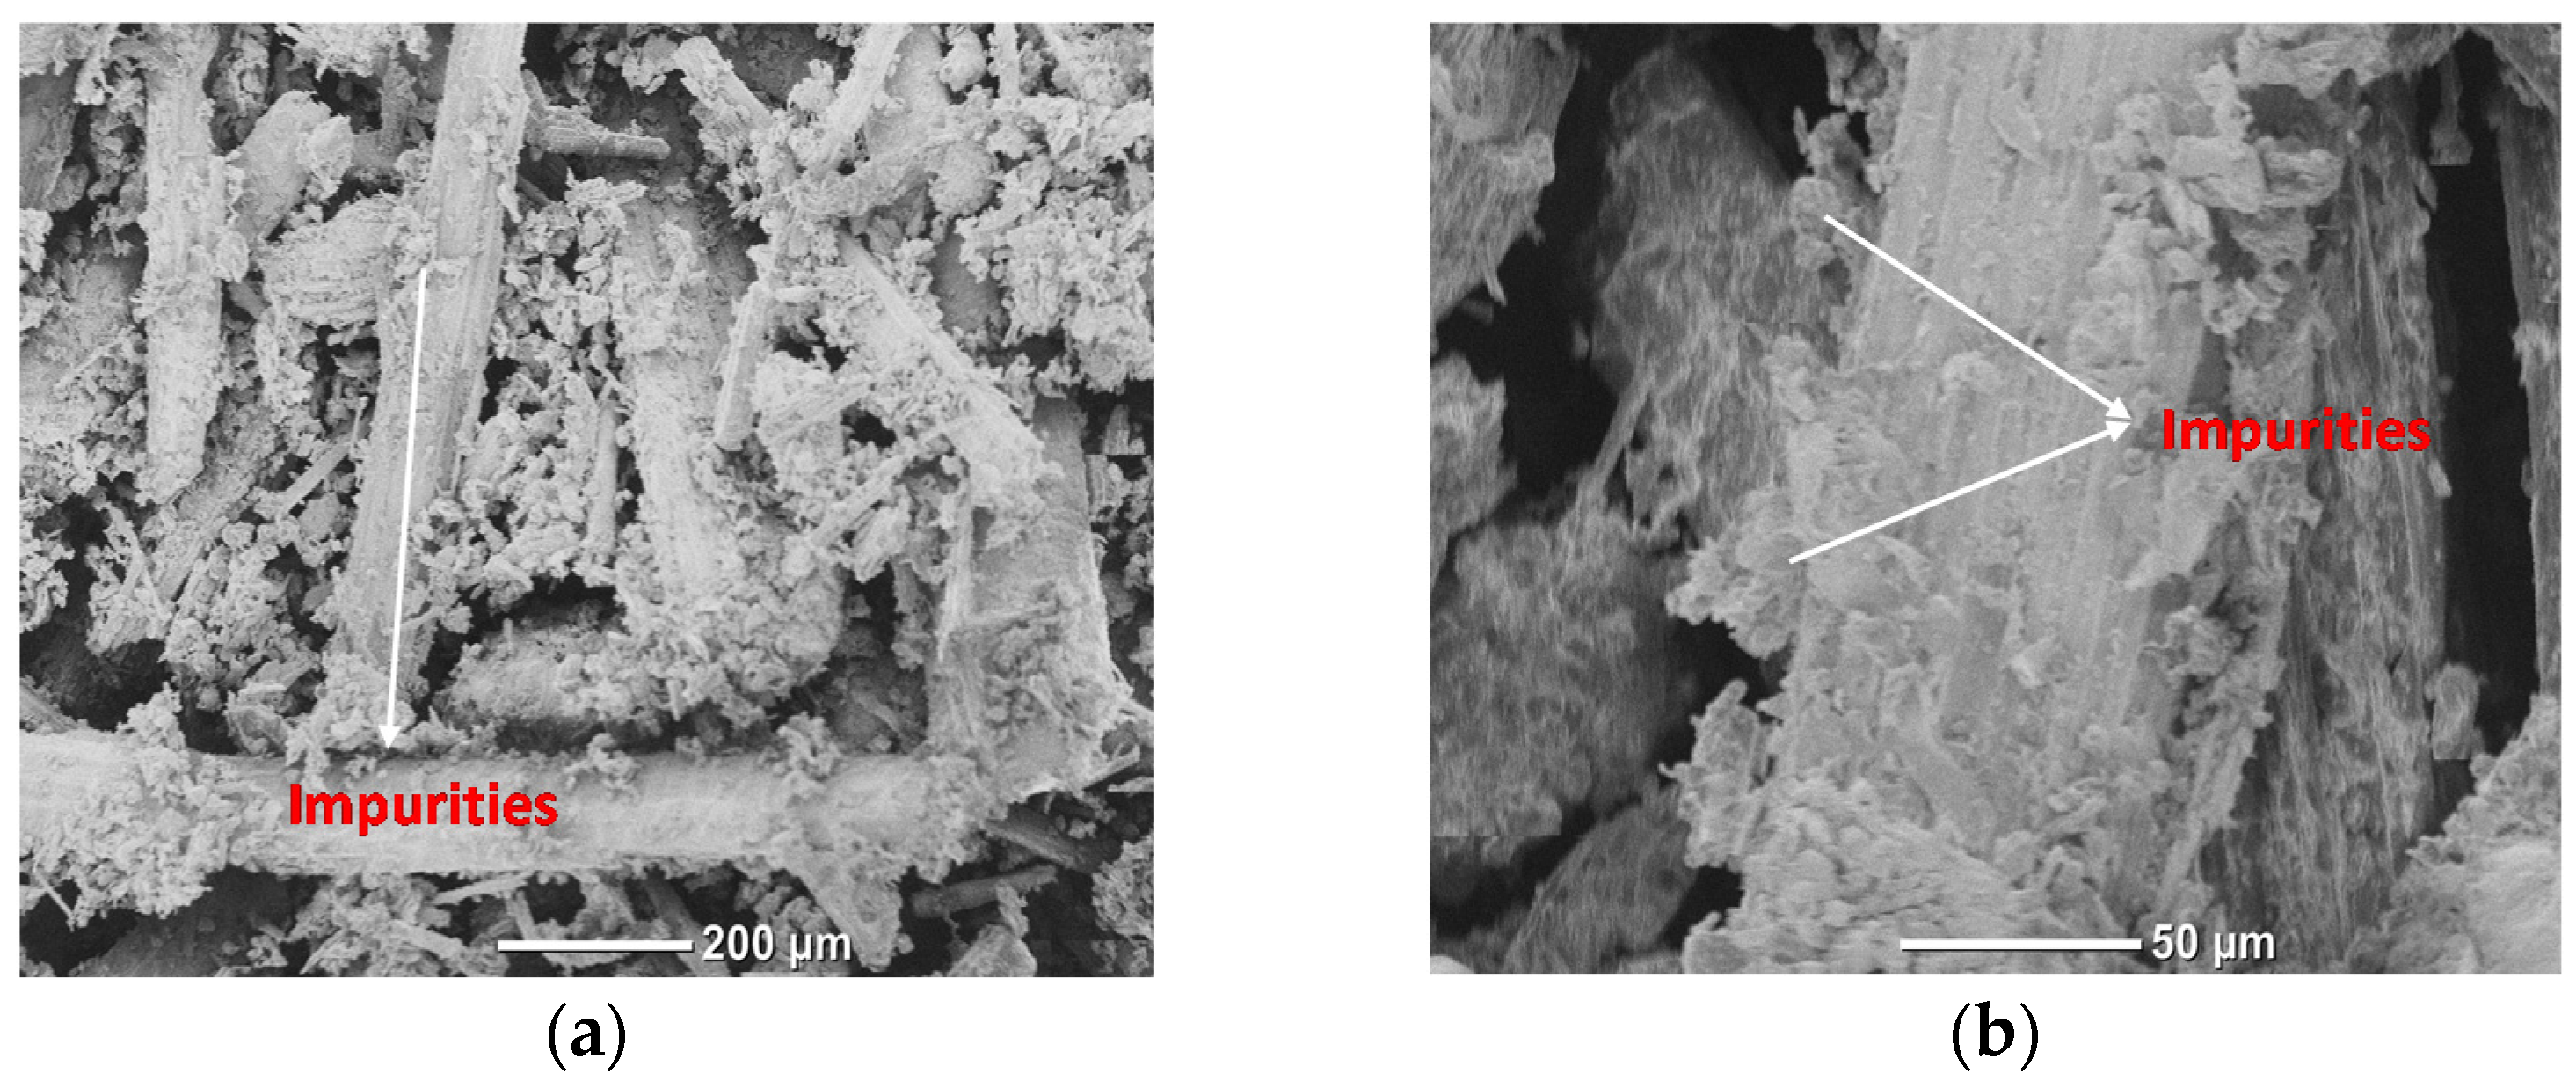
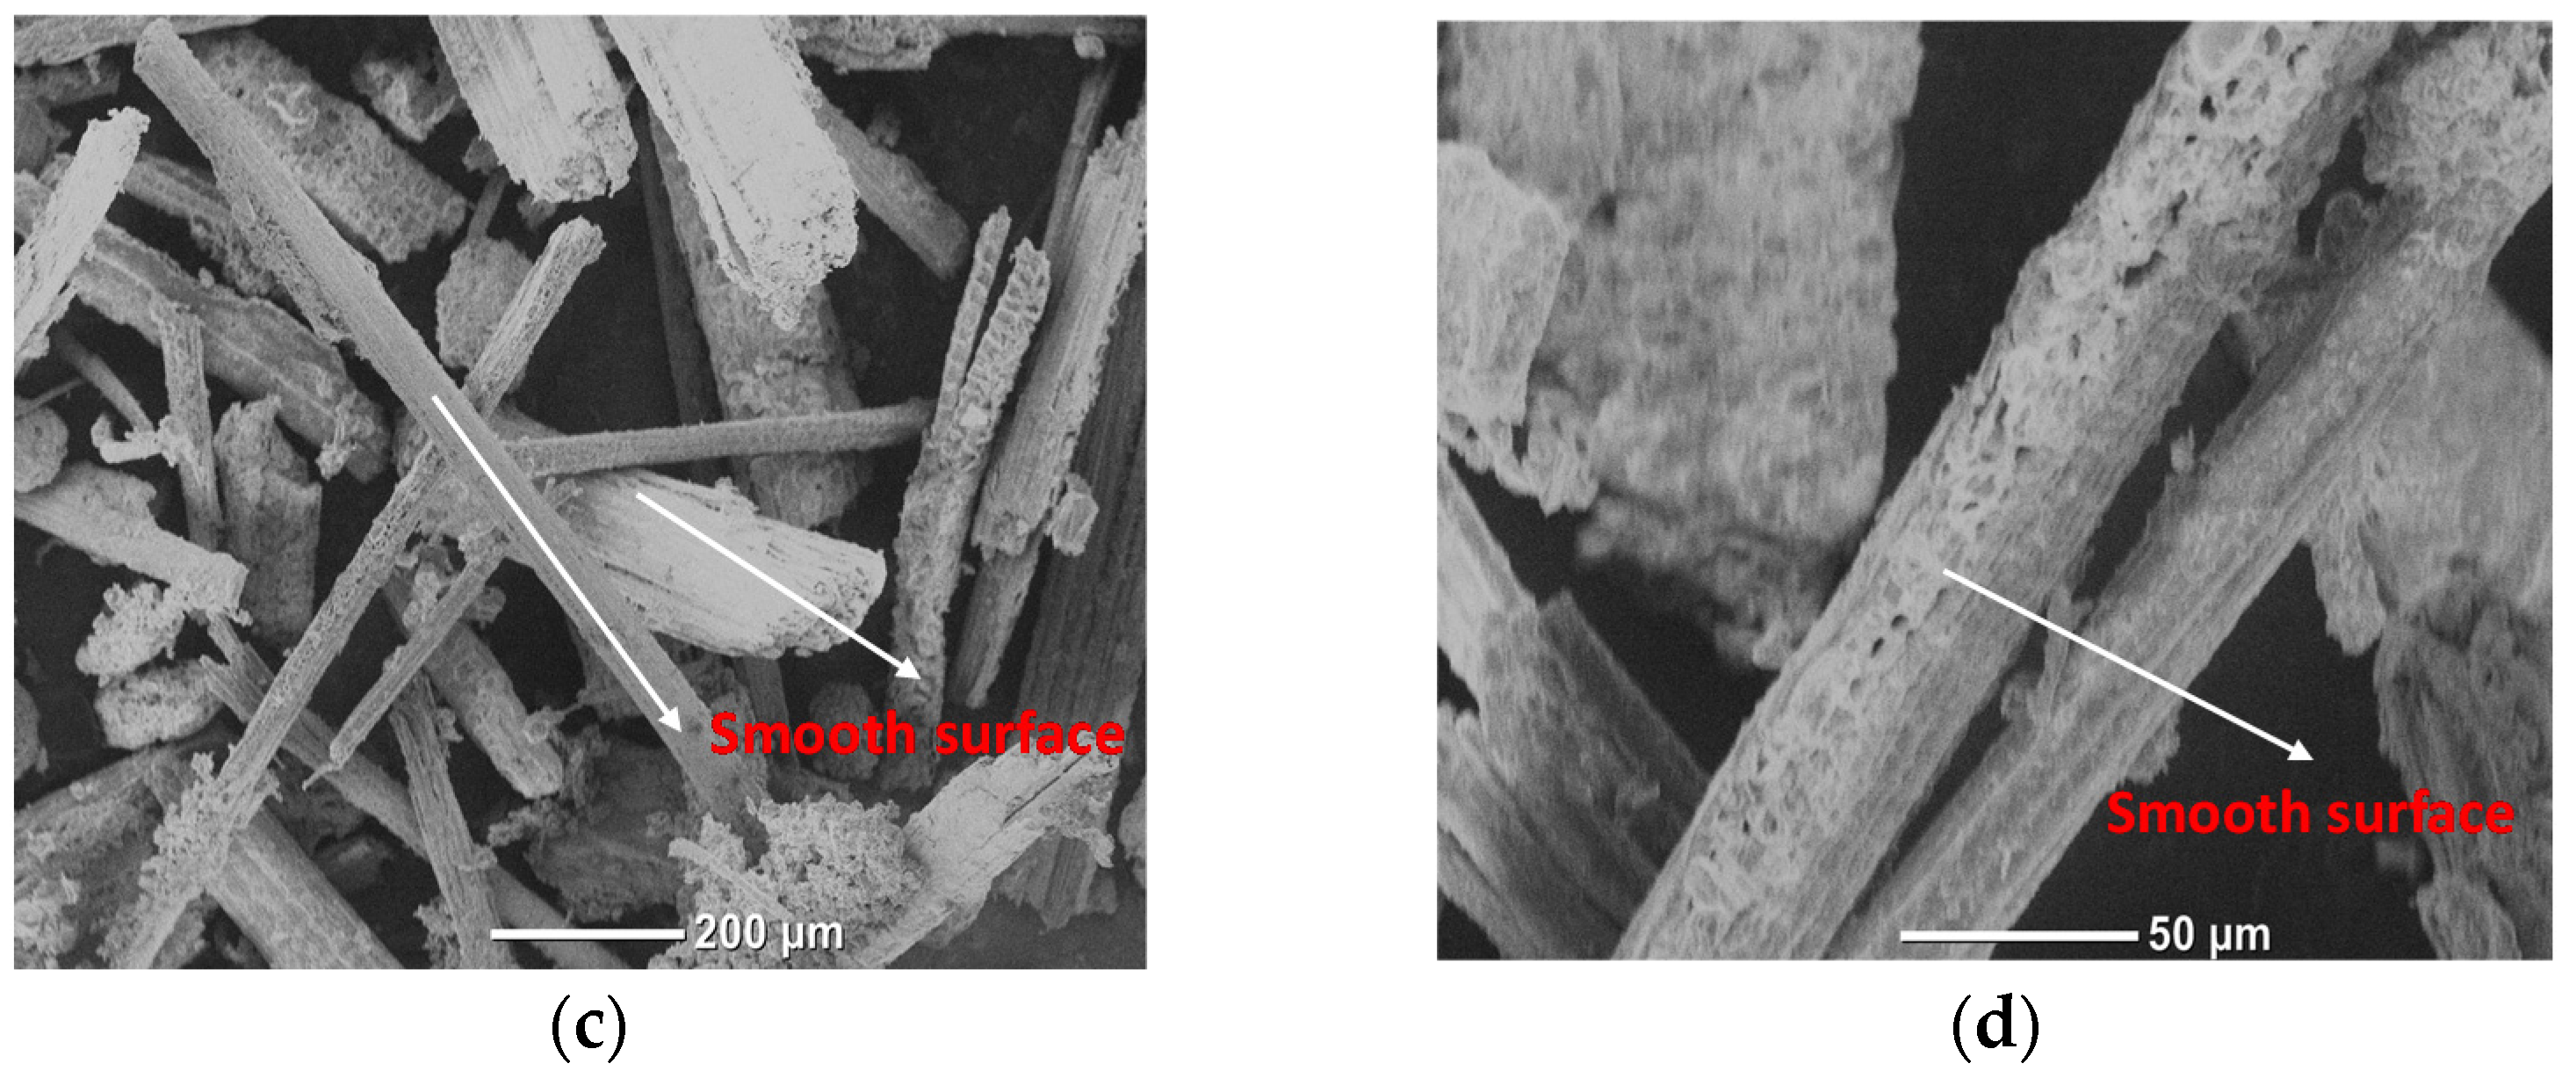
3.2. Microstructure of Composites (SEM)
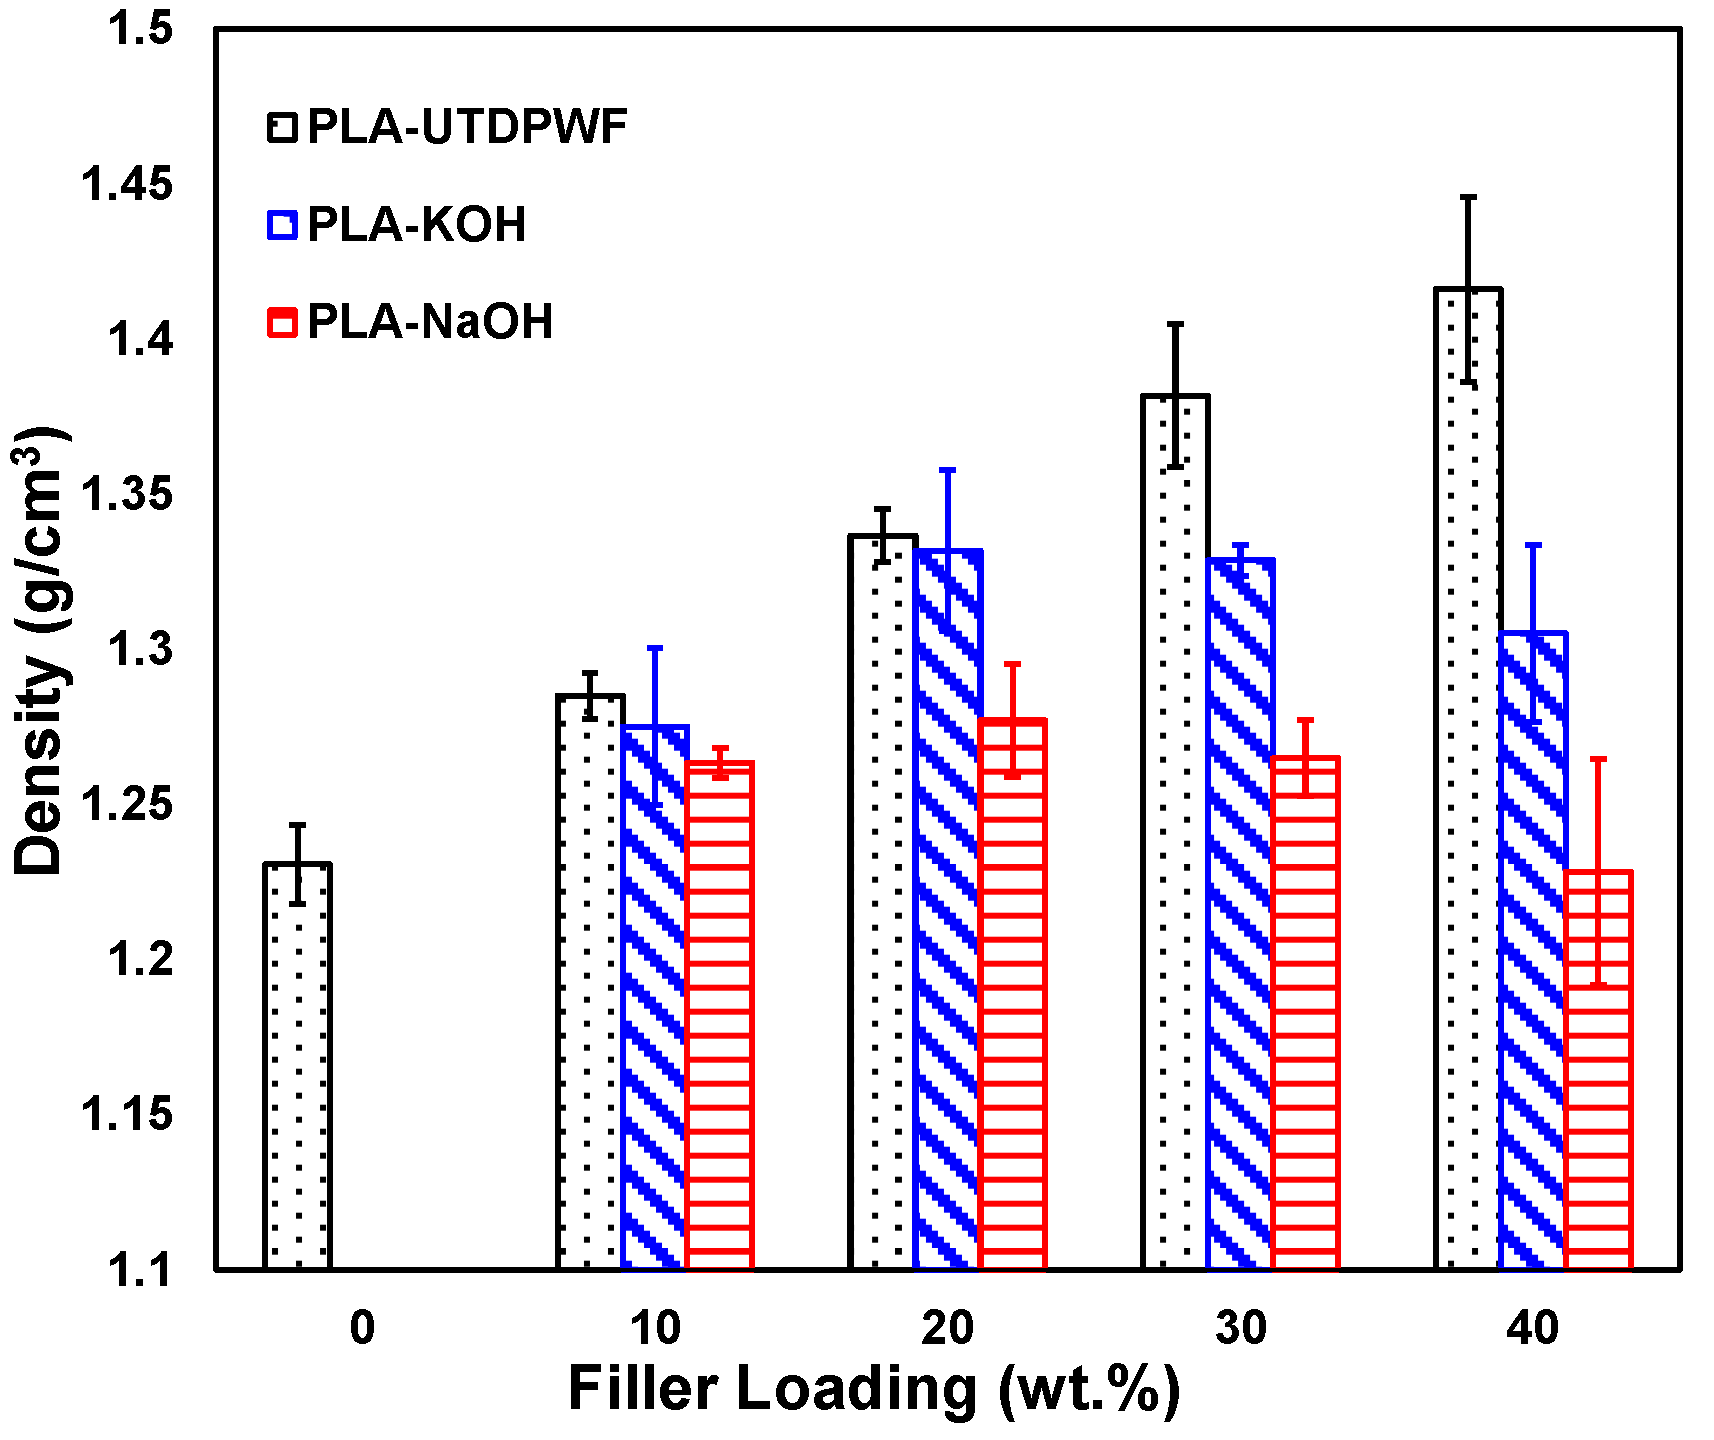
3.3. Density
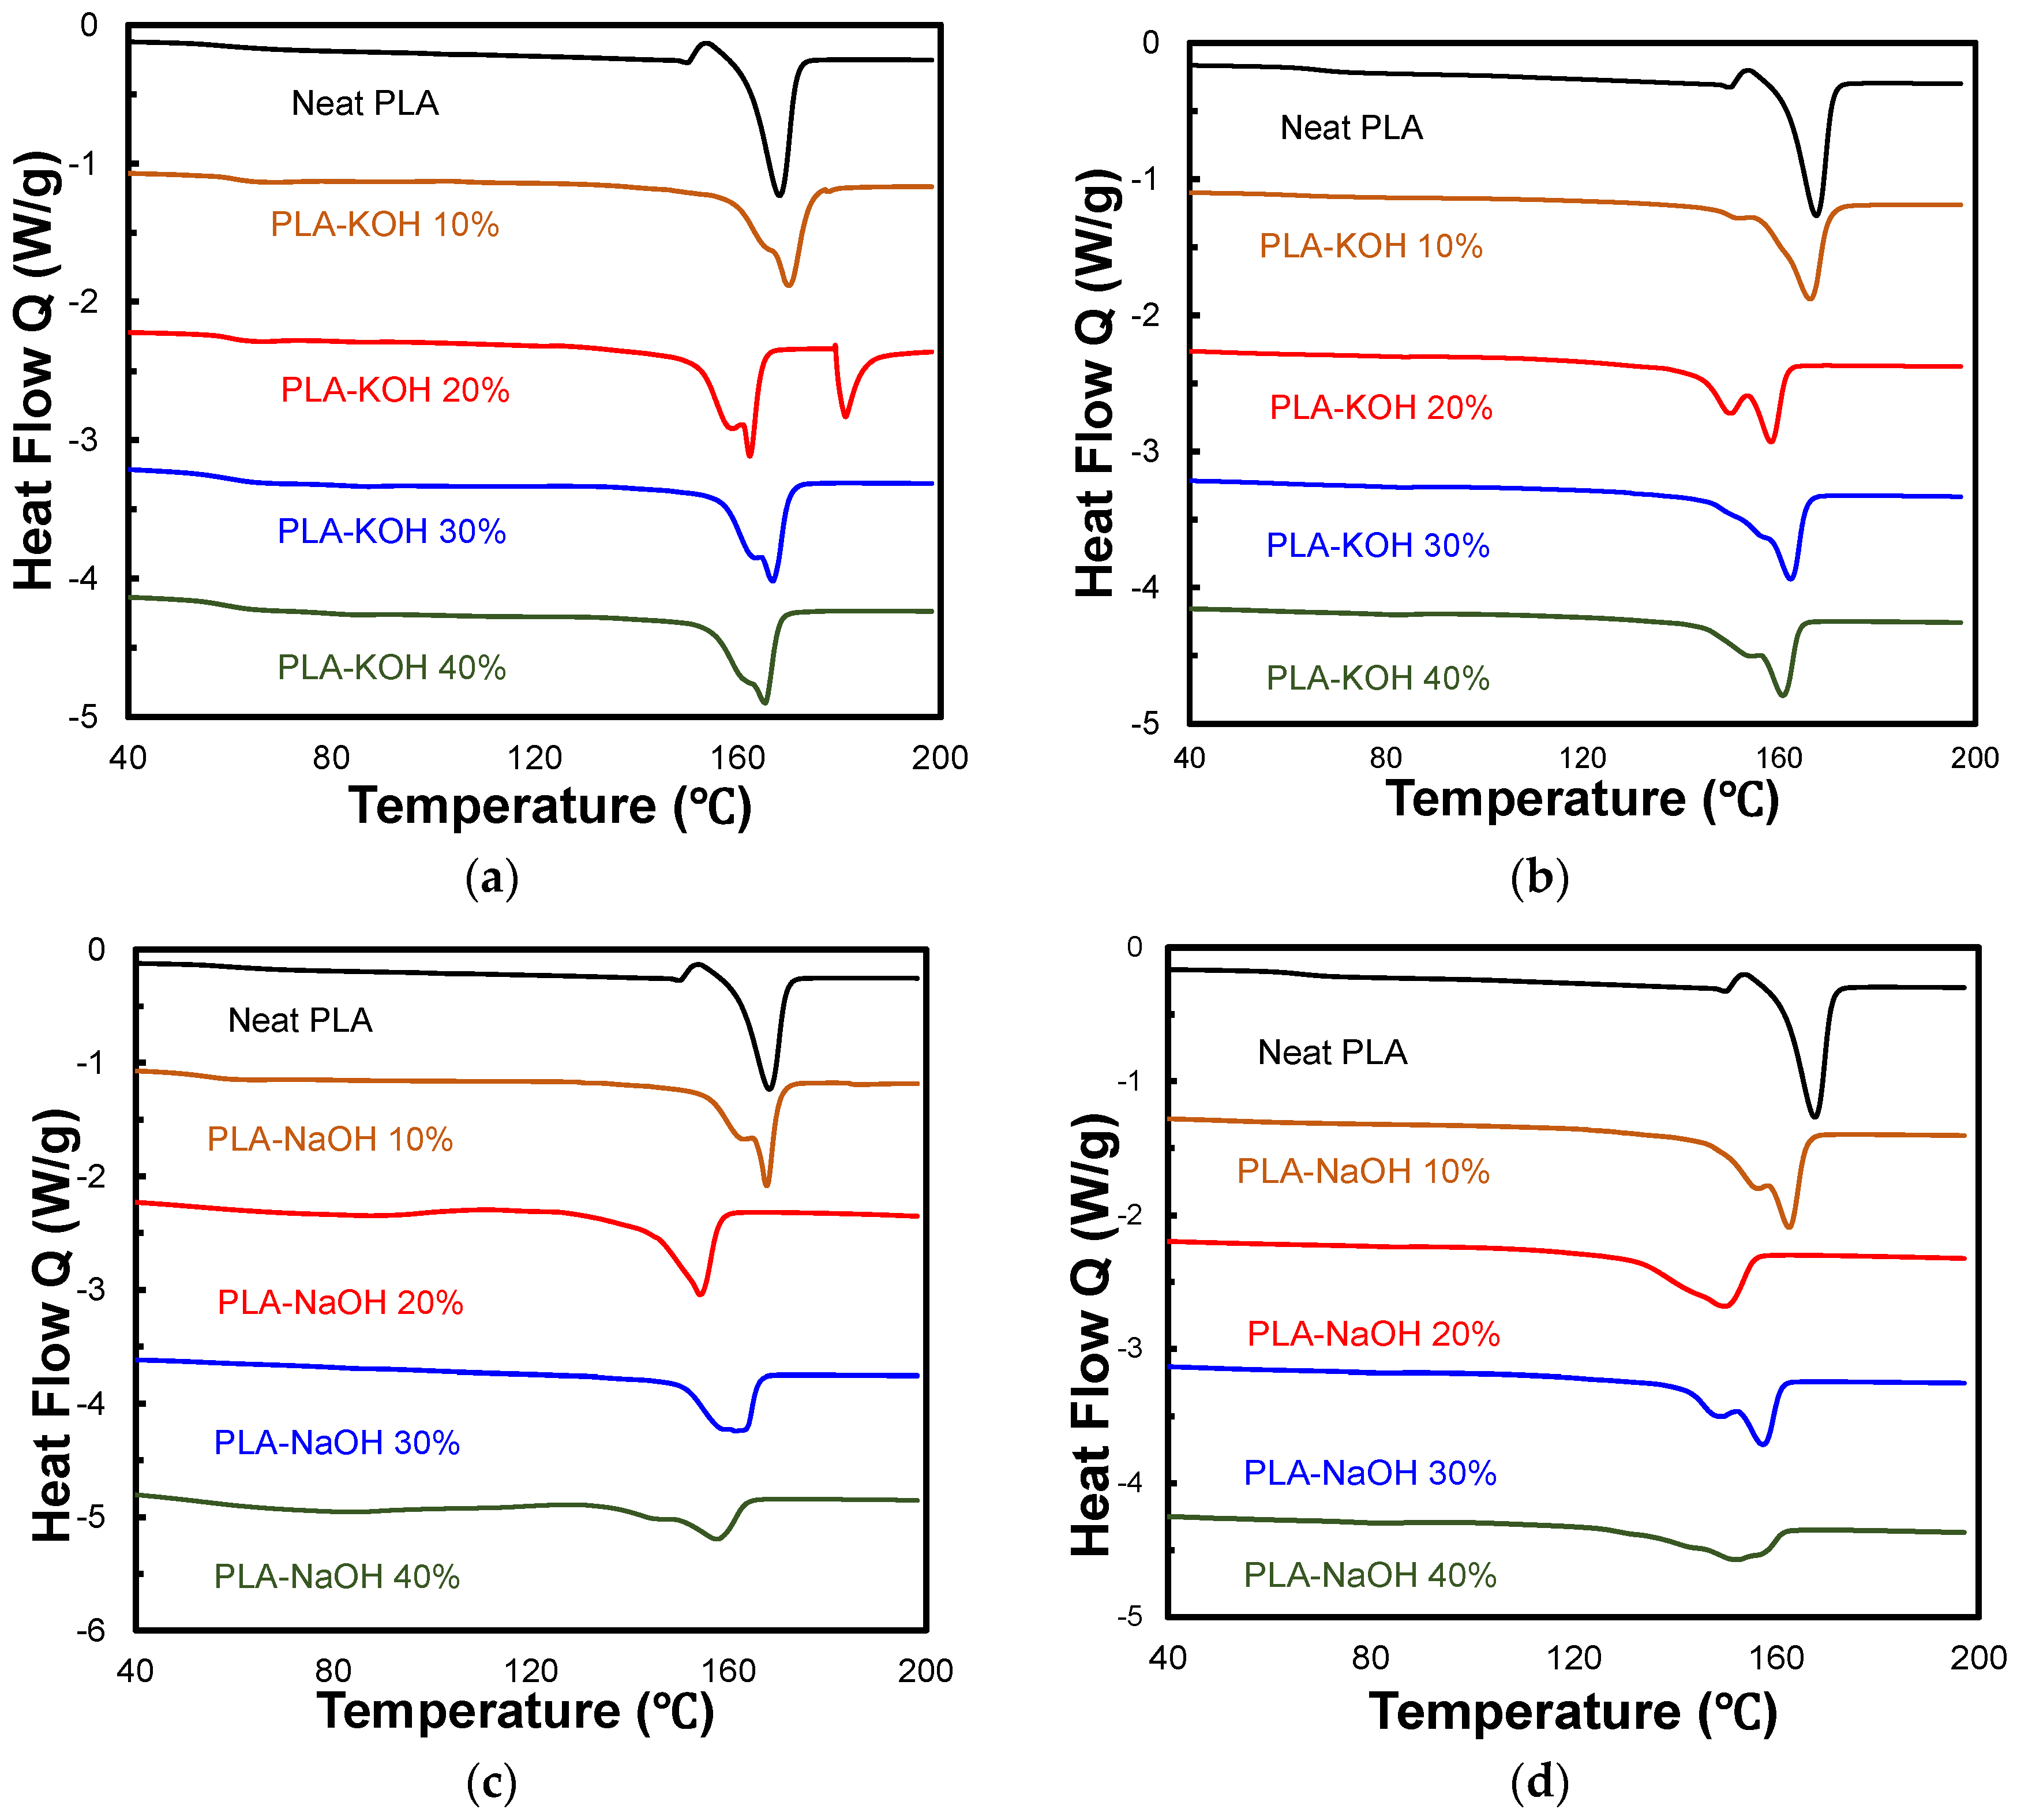
3.4. DSC Analysis
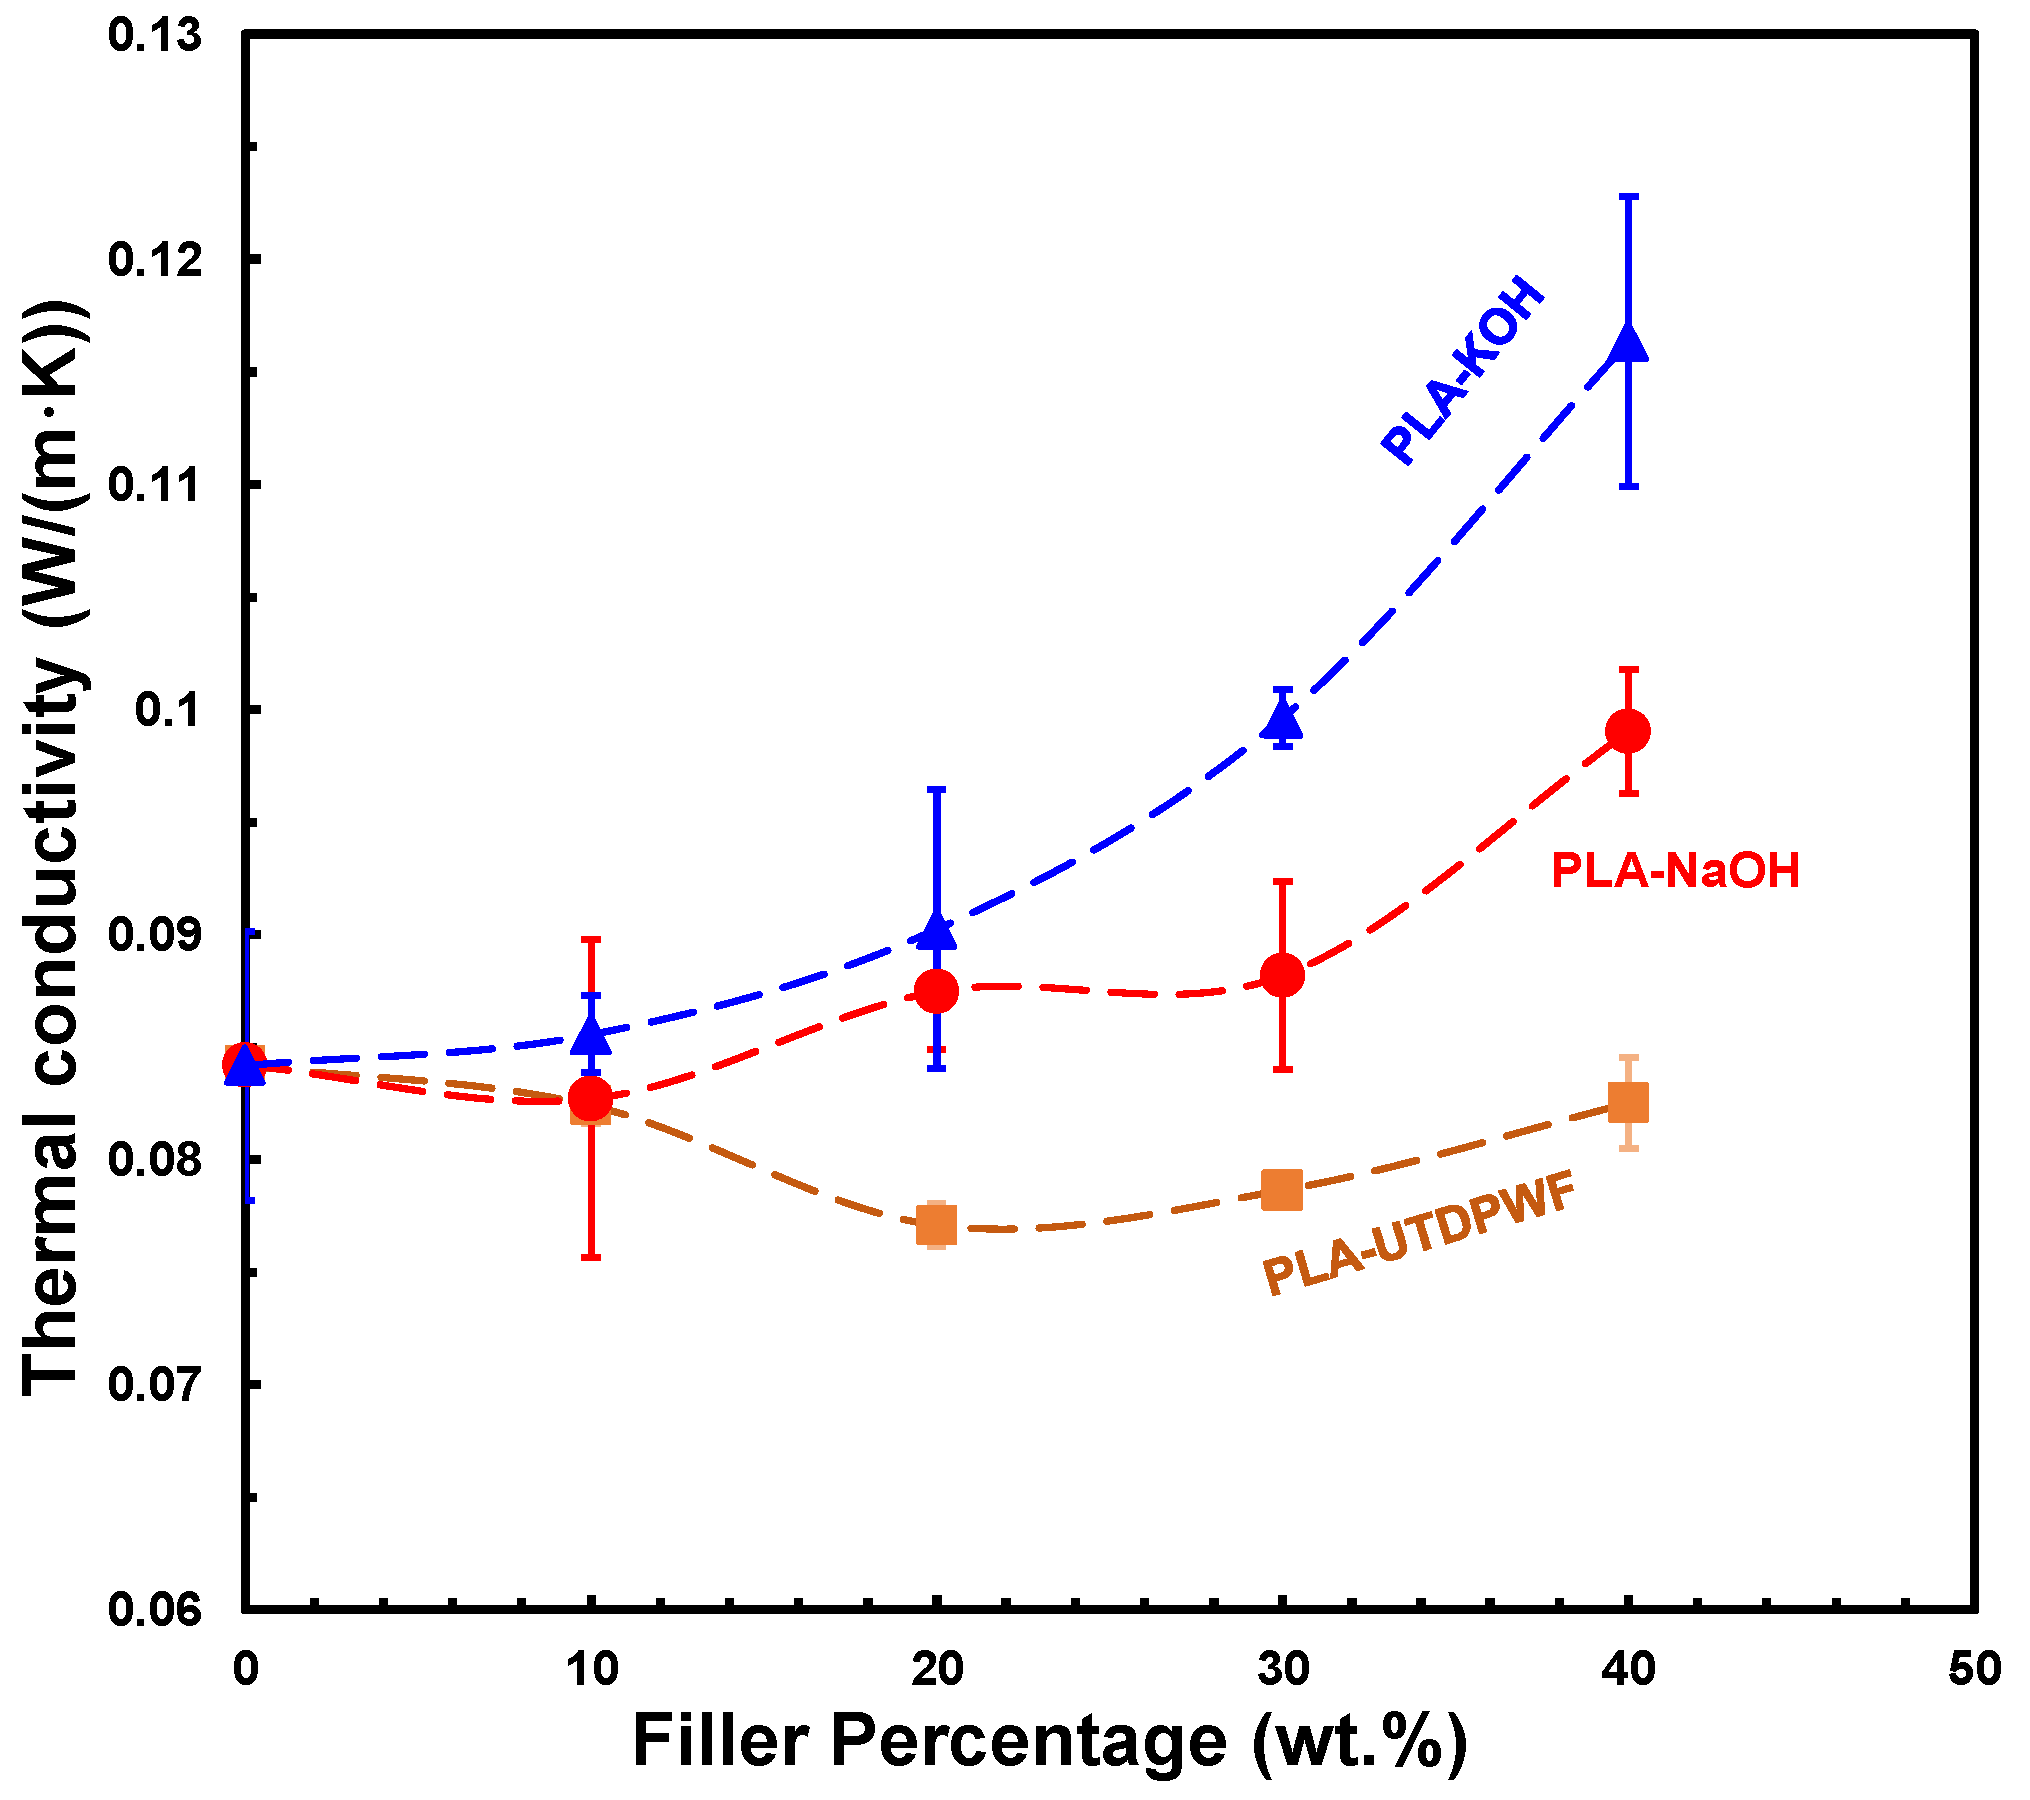
3.5. Thermal Conductivity
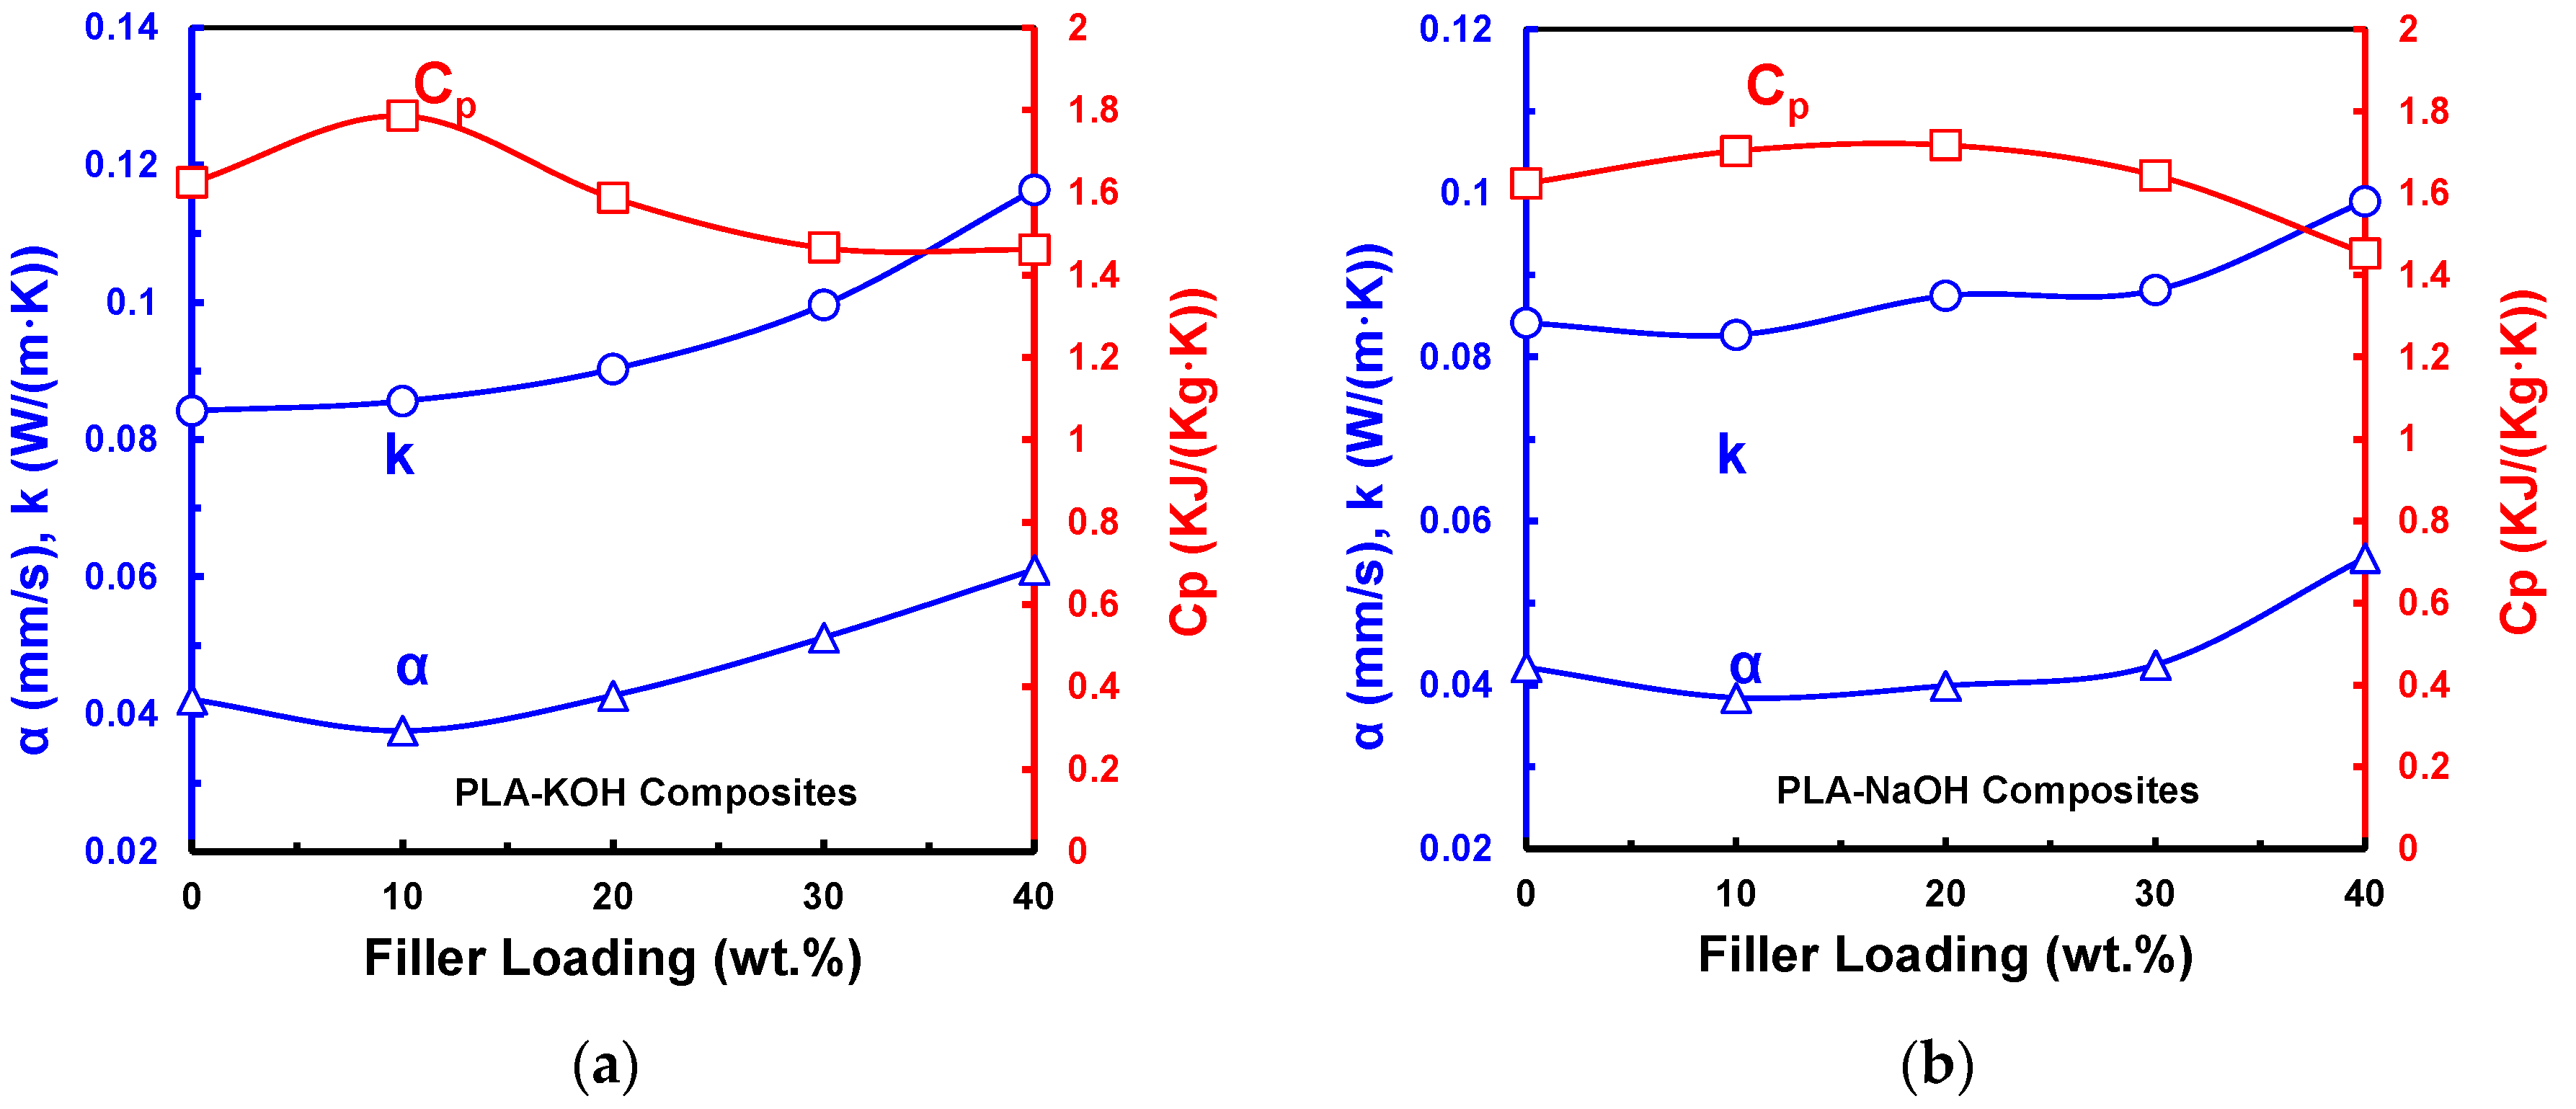
3.6. Specific Heat Capacity () and Thermal Diffusivity ()
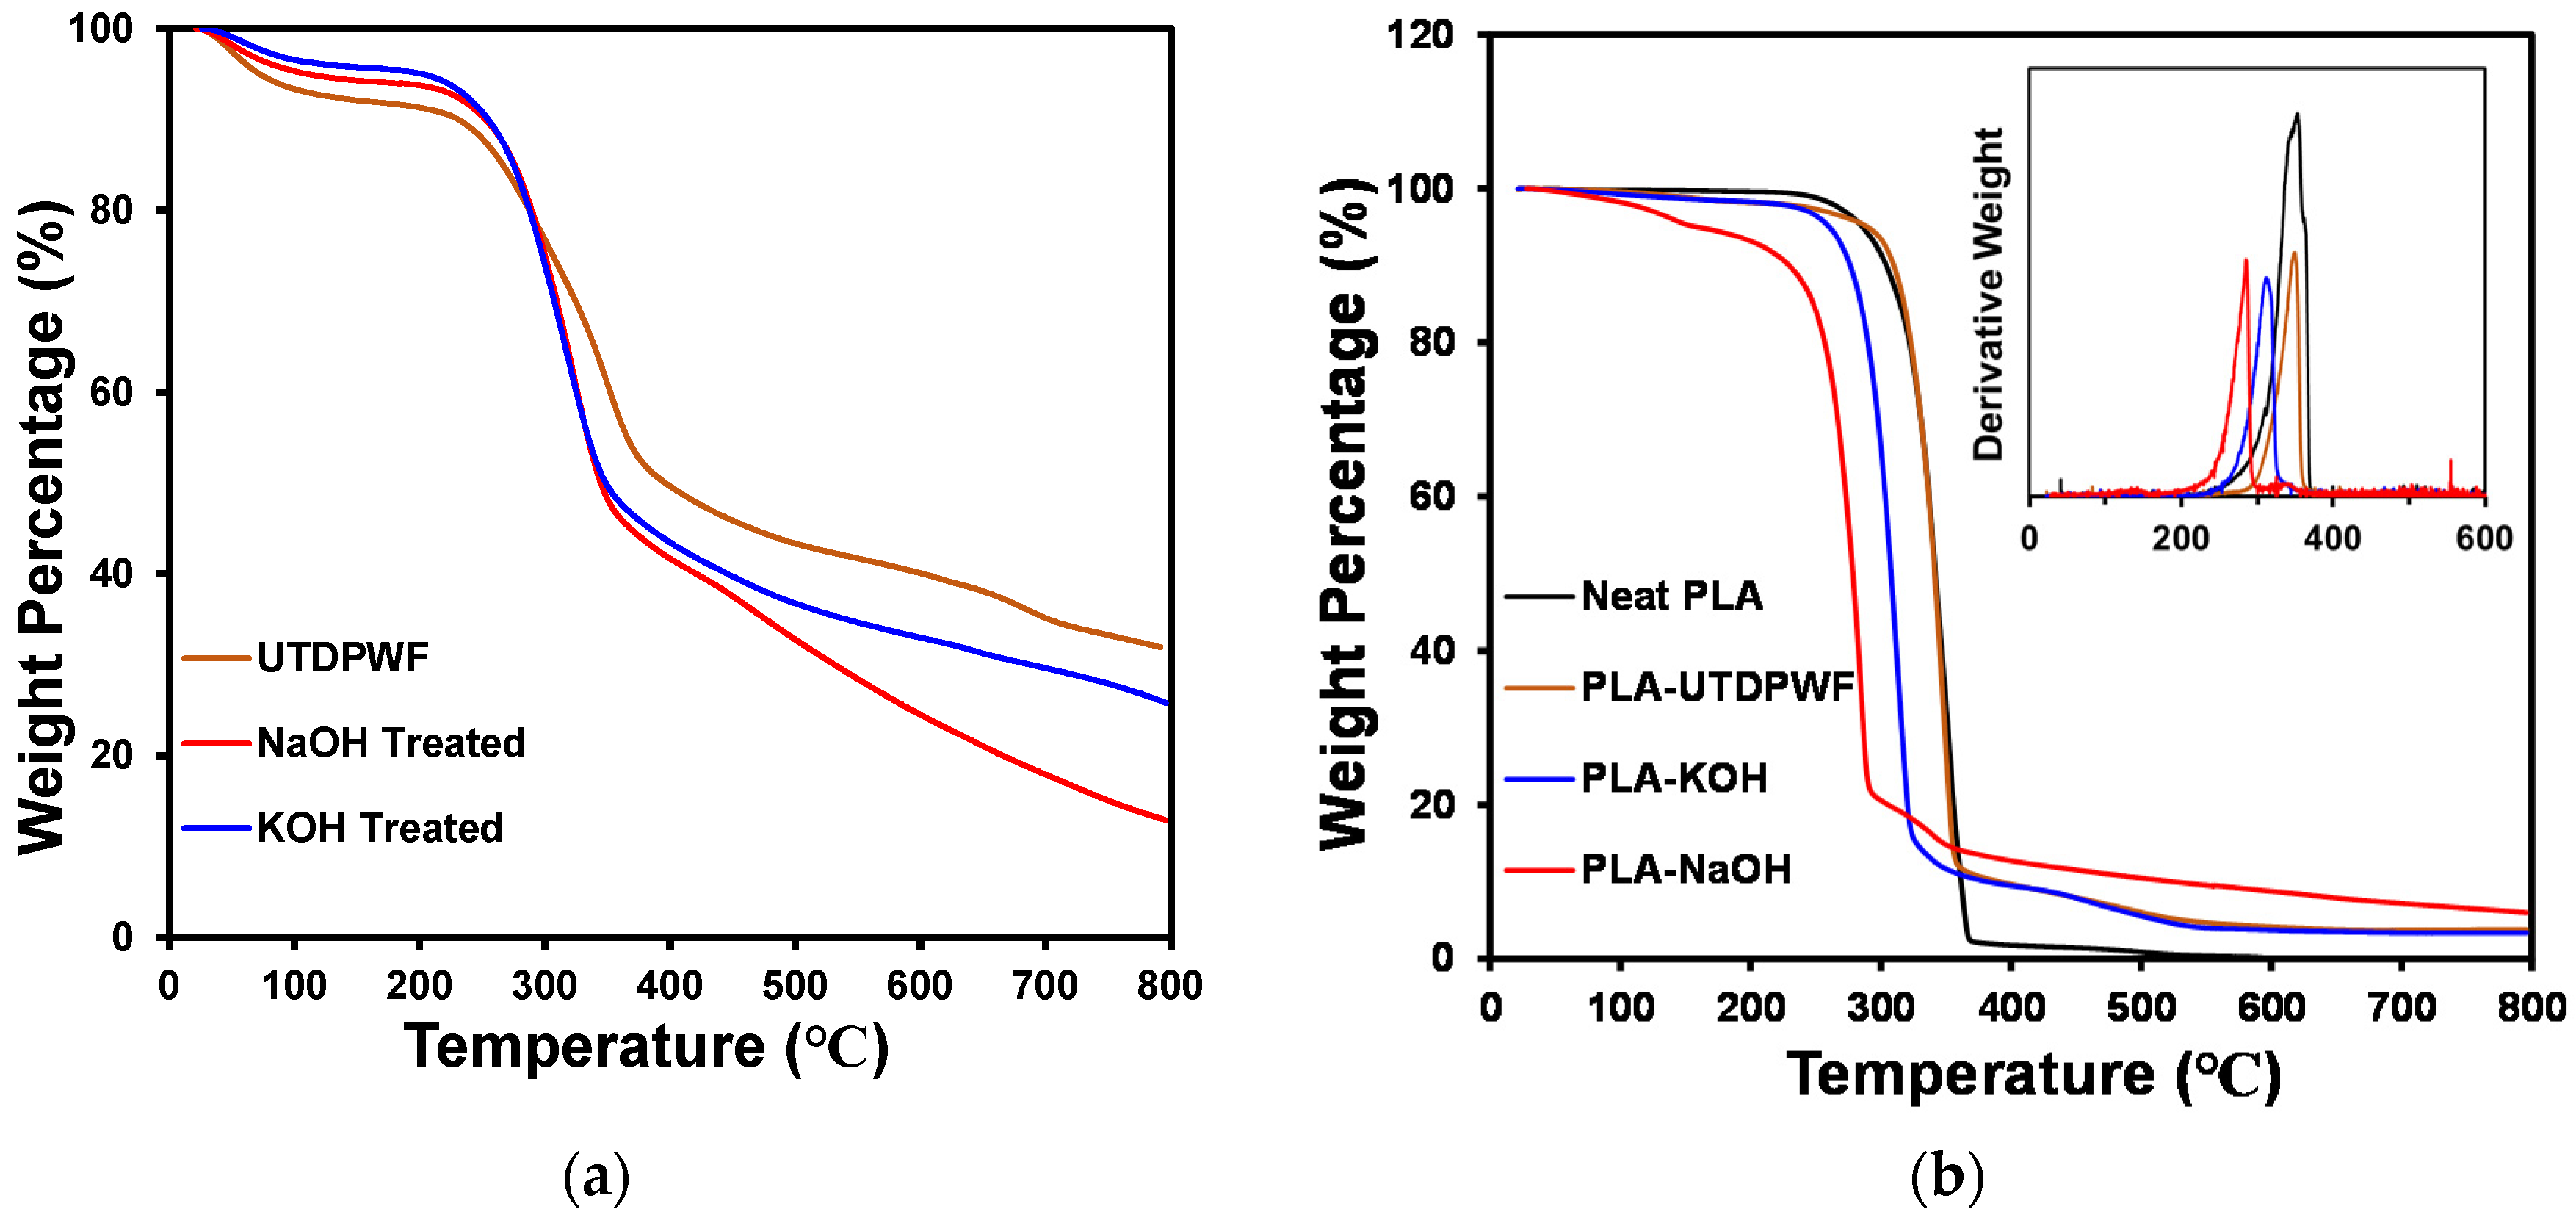
3.7. Thermogravimetric Analysis (TGA)
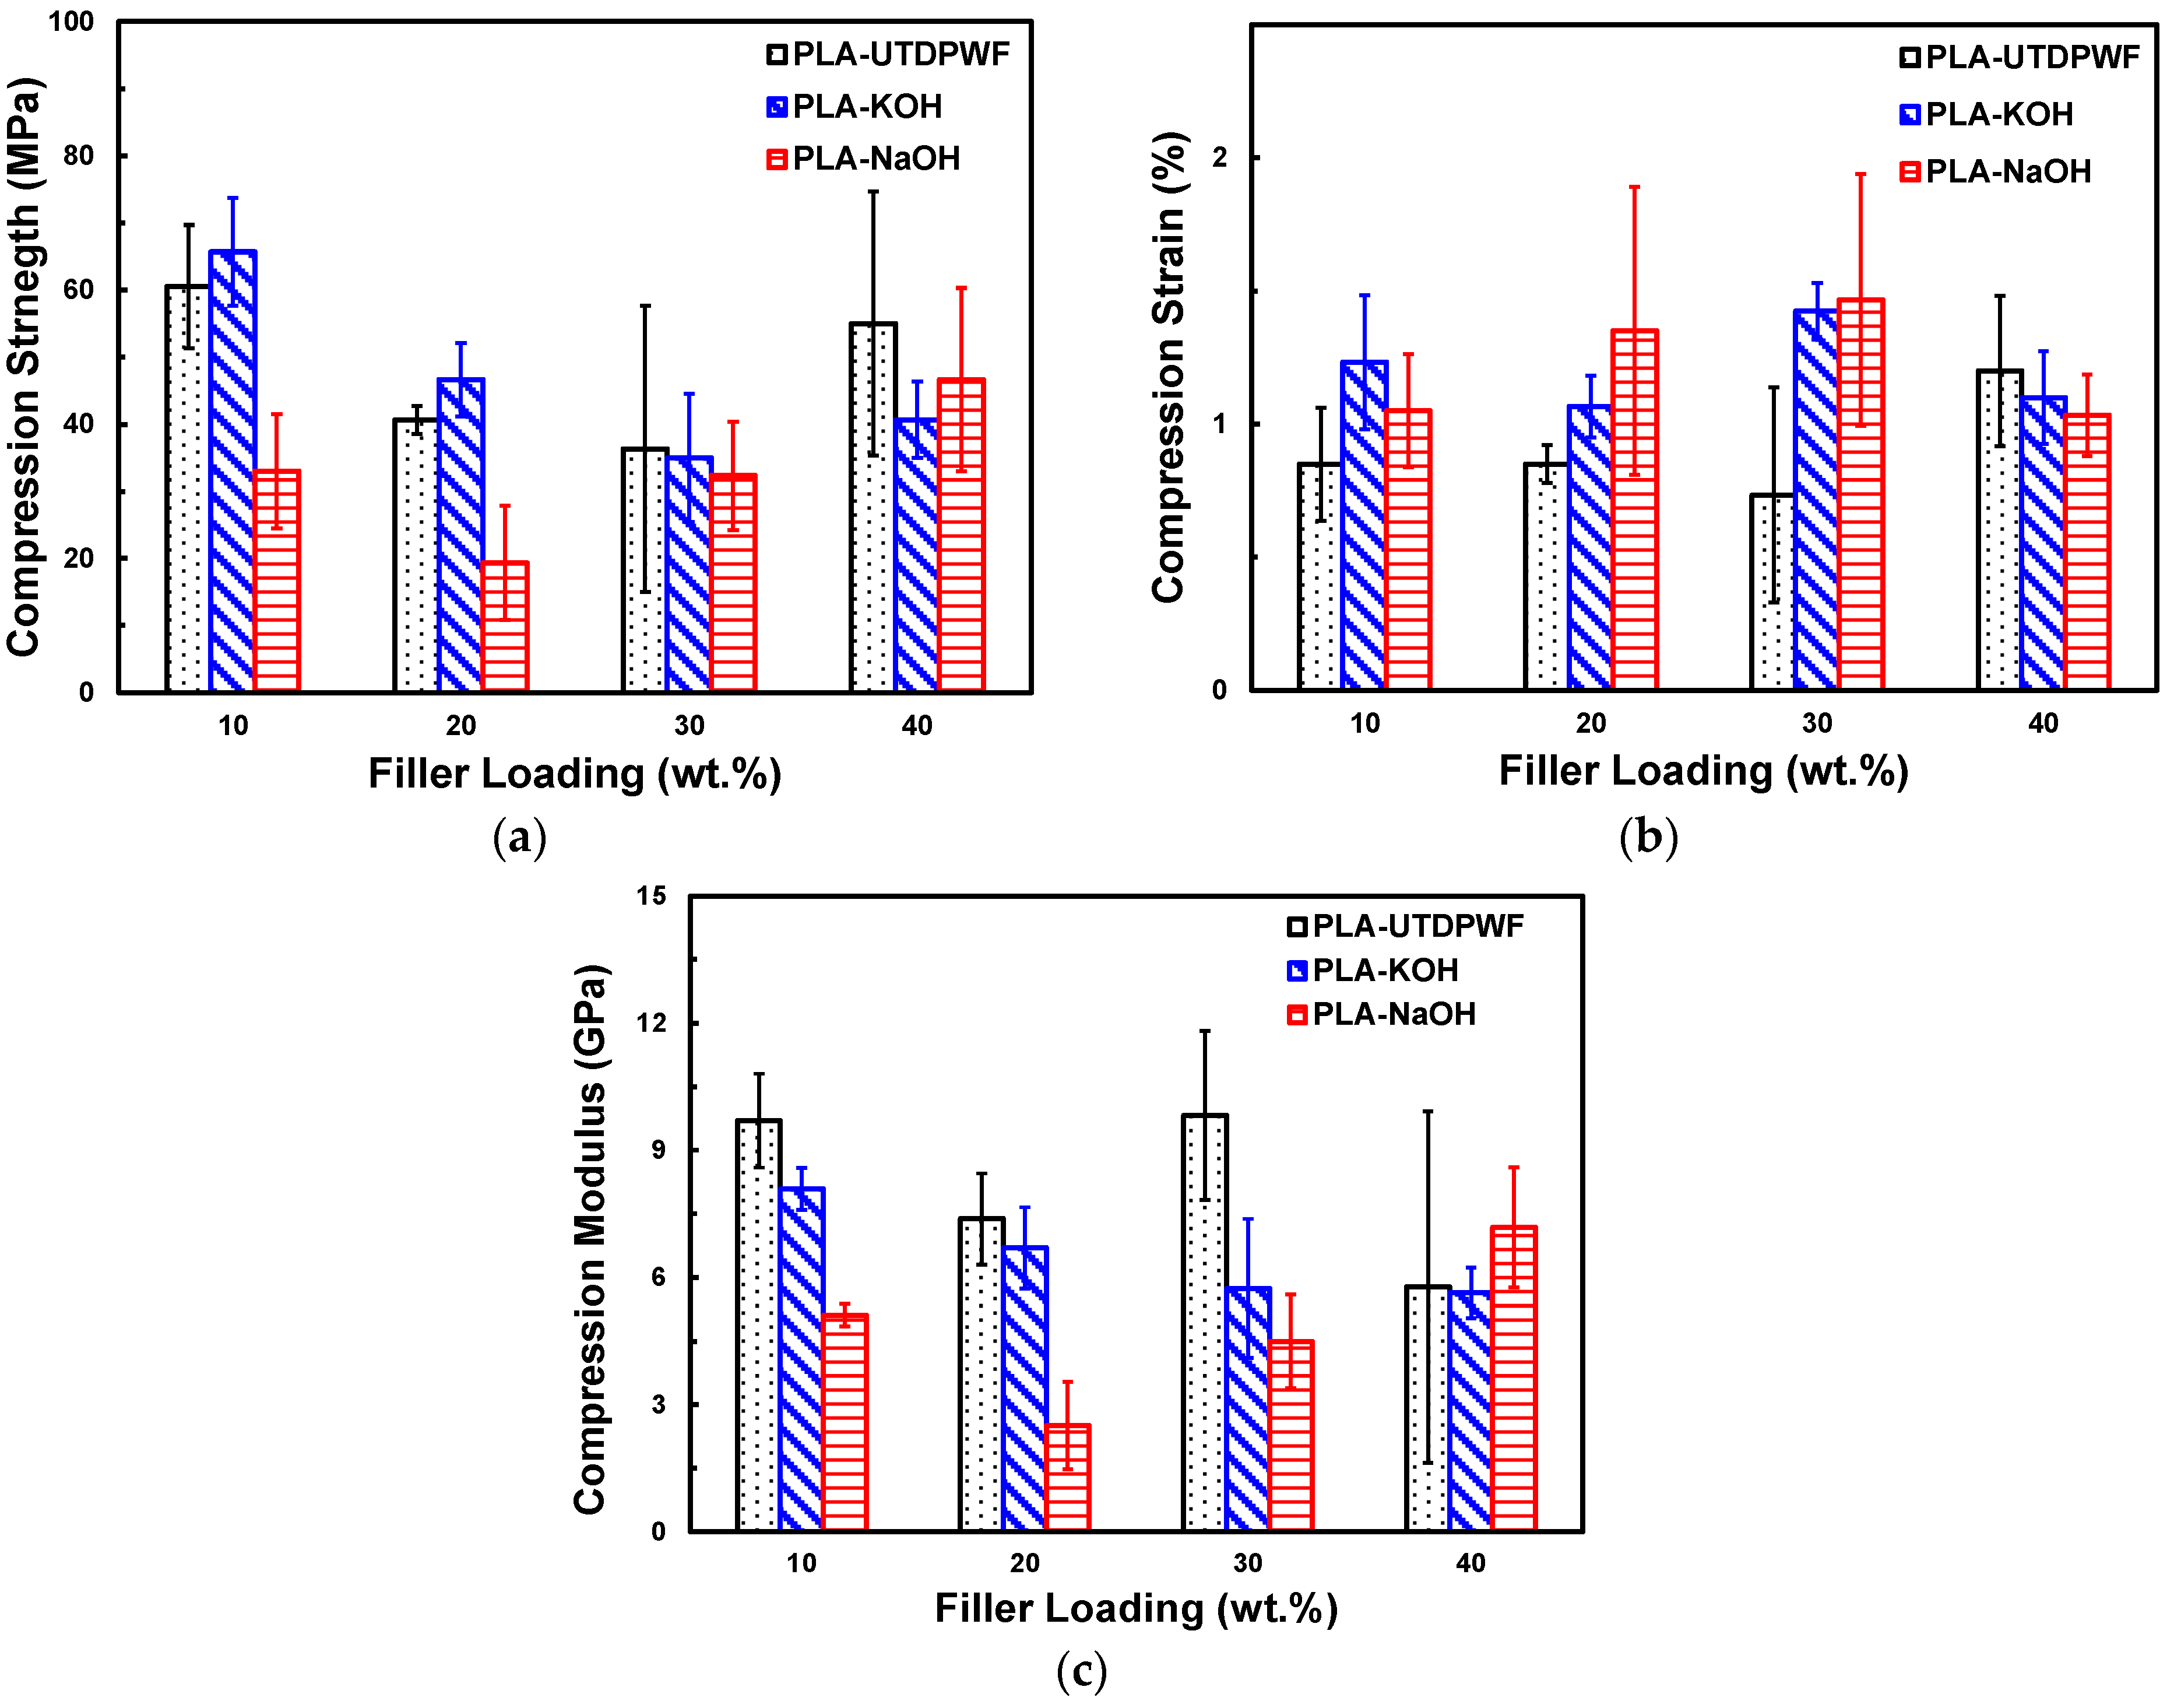
3.8. Compression Properties
4. Conclusions
Author Contributions
Funding
Institutional Review Board Statement
Informed Consent Statement
Data Availability Statement
Conflicts of Interest
References
- Himeur, Y.; Ghanem, K.; Alsalemi, A.; Bensaali, F.; Amira, A. Artificial Intelligence Based Anomaly Detection of Energy Consumption in Buildings: A Review, Current Trends and New Perspectives. Appl. Energy 2021, 287, 116601. [Google Scholar] [CrossRef]
- Li, Z.; Lin, B.; Zheng, S.; Liu, Y.; Wang, Z.; Dai, J. A Review of Operational Energy Consumption Calculation Method for Urban Buildings. Build. Simul. 2020, 13, 739–751. [Google Scholar] [CrossRef]
- Abu-jdayil, B.; Mourad, A.; Hittini, W.; Hassan, M.; Hameedi, S. Traditional, State-of-the-Art and Renewable Thermal Building Insulation Materials: An Overview. Constr. Build. Mater. 2019, 214, 709–735. [Google Scholar] [CrossRef]
- Khatoon, H.; Iqbal, S.; Irfan, M.; Darda, A.; Rawat, N.K. A Review on the Production, Properties and Applications of Non-Isocyanate Polyurethane: A Greener Perspective. Prog. Org. Coat. 2021, 154, 106124. [Google Scholar] [CrossRef]
- Bakar, Z.A.; Rahman, I.A.; Ithnin, A.; Mohamad, N.N.; Senik, N.S. Lung Function in Healthcare Workers Exposed to Fibrous Glass Dust from the Synthetic Fiberglass Cast Materials. J. Crit. Rev. 2020, 7, 2147–2158. [Google Scholar] [CrossRef]
- Sattler, T.; Pomberger, R.; Schimek, J.; Vollprecht, D. Mineral Wool Waste in Austria, Associated Health Aspects and Recycling Options. Detritus 2020, 9, 174–180. [Google Scholar] [CrossRef] [Green Version]
- La Rosa, A.D.; Recca, A.; Gagliano, A.; Summerscales, J.; Latteri, A.; Cozzo, G.; Cicala, G. Environmental Impacts and Thermal Insulation Performance of Innovative Composite Solutions for Building Applications. Constr. Build. Mater. 2014, 55, 406–414. [Google Scholar] [CrossRef]
- Fernandes, E.M.; Correlo, V.M.; Chagas, J.A.M.; Mano, J.F.; Reis, R.L. Properties of New Cork–Polymer Composites: Advantages and Drawbacks as Compared with Commercially Available Fibreboard Materials. Compos. Struct. 2011, 93, 3120–3129. [Google Scholar] [CrossRef] [Green Version]
- George, A.; Sanjay, M.R.; Srisuk, R.; Parameswaranpillai, J.; Siengchin, S. A Comprehensive Review on Chemical Properties and Applications of Biopolymers and Their Composites. Int. J. Biol. Macromol. 2020, 154, 329–338. [Google Scholar] [CrossRef]
- McKeown, P.; Jones, M.D. The Chemical Recycling of PLA: A Review. Sustain. Chem. 2020, 1, 1–22. [Google Scholar] [CrossRef]
- de Souza, A.G.; Barbosa, R.F.S.; Rosa, D.S. Nanocellulose from Industrial and Agricultural Waste for Further Use in PLA Composites. J. Polym. Environ. 2020, 28, 1851–1868. [Google Scholar] [CrossRef]
- Ozyhar, T.; Baradel, F.; Zoppe, J. Effect of Functional Mineral Additive on Processability and Material Properties of Wood-Fiber Reinforced Poly(Lactic Acid) (PLA) Composites. Compos. Part A Appl. Sci. Manuf. 2020, 132, 105827. [Google Scholar] [CrossRef]
- Brounstein, Z.; Yeager, C.M.; Labouriau, A. Development of Antimicrobial PLA Composites for Fused Filament Fabrication. Polymers 2021, 13, 580. [Google Scholar] [CrossRef]
- Kuciel, S.; Mazur, K.; Hebda, M. The Influence of Wood and Basalt Fibres on Mechanical, Thermal and Hydrothermal Properties of PLA Composites. J. Polym. Environ. 2020, 28, 1204–1215. [Google Scholar] [CrossRef] [Green Version]
- Sanivada, U.K.; Mármol, G.; Brito, F.P.; Fangueiro, R. PLA Composites Reinforced with Flax and Jute Fibers—A Review of Recent Trends, Processing Parameters and Mechanical Properties. Polymers 2020, 12, 2373. [Google Scholar] [CrossRef] [PubMed]
- Barkhad, M.S.; Abu-Jdayil, B.; Mourad, A.H.I.; Iqbal, M.Z. Thermal Insulation and Mechanical Properties of Polylactic Acid (PLA) at Different Processing Conditions. Polymers 2020, 12, 2091. [Google Scholar] [CrossRef] [PubMed]
- Barkhad, M.S.; Abu-Jdayil, B.; Iqbal, M.Z.; Mourad, A.H.I. Thermal Insulation Using Biodegradable Poly(Lactic Acid)/Date Pit Composites. Constr. Build. Mater. 2020, 261, 120533. [Google Scholar] [CrossRef]
- Abu-Jdayil, B.; Barkhad, M.S.; Mourad, A.-H.I.; Iqbal, M.Z. Date Palm Wood Waste-Based Composites for Green Thermal Insulation Boards. J. Build. Eng. 2021, 43, 103224. [Google Scholar] [CrossRef]
- Cantero, G.; Arbelaiz, A.; Llano-Ponte, R.; Mondragon, I. Effects of Fibre Treatment on Wettability and Mechanical Behaviour of Flax/Polypropylene Composites. Compos. Sci. Technol. 2003, 63, 1247–1254. [Google Scholar] [CrossRef]
- Bisanda, E.T.N.; Ansell, M.P. The Effect of Silane Treatment on the Mechanical and Physical Properties of Sisal-Epoxy Composites. Compos. Sci. Technol. 1991, 41, 165–178. [Google Scholar] [CrossRef]
- Sreenivasan, V.S.; Ravindran, D.; Manikandan, V.; Narayanasamy, R. Influence of Fibre Treatments on Mechanical Properties of Short Sansevieria Cylindrica / Polyester Composites. J. Mater. 2012, 37, 111–121. [Google Scholar] [CrossRef]
- Zhang, H.; Cui, Y.; Zhang, Z. Chemical Treatment of Wood Fiber and Its Reinforced Unsaturated Polyester Composites. J. Vinyl Addit. Technol. 2013, 19, 18–24. [Google Scholar] [CrossRef]
- Kabir, M.M.; Wang, H.; Lau, K.T.; Cardona, F. Chemical Treatments on Plant-Based Natural Fibre Reinforced Polymer Composites: An Overview. Compos. Part B 2012, 43, 2883–2892. [Google Scholar] [CrossRef]
- Asumani, O.M.L.; Reid, R.G.; Paskaramoorthy, R. The Effects of Alkali-Silane Treatment on the Tensile and Flexural Properties of Short Fibre Non-Woven Kenaf Reinforced Polypropylene Composites. Compos. Part A Appl. Sci. Manuf. 2012, 43, 1431–1440. [Google Scholar] [CrossRef]
- Li, X.; Tabil, L.G.; Panigrahi, S. Chemical Treatments of Natural Fiber for Use in Natural Fiber-Reinforced Composites: A Review. J. Polym. Environ. 2007, 15, 25–33. [Google Scholar] [CrossRef]
- Bachtiar, D.; Sapuan, S.M.; Hamdan, M.M. The Effect of Alkaline Treatment on Tensile Properties of Sugar Palm Fibre Reinforced Epoxy Composites. Mater. Des. 2008, 29, 1285–1290. [Google Scholar] [CrossRef]
- Alvarez, V.A.; Ruscekaite, R.A.; Vázquez, A. Mechanical Properties and Water Absorption Behavior of Composites Made from a Biodegradable Matrix and Alkaline-Treated Sisal Fibers. J. Compos. Mater. 2003, 37, 1575–1588. [Google Scholar] [CrossRef]
- Norul Izani, M.A.; Paridah, M.T.; Anwar, U.M.K.; Mohd Nor, M.Y.; H’ng, P.S. Effects of fiber treatment on morphology, tensile and thermogravimetric analysis of oil palm empty fruit bunches fibers. Compos. Part B Eng. 2013, 45, 1251–1257. [Google Scholar] [CrossRef] [Green Version]
- Guo, R.; Ren, Z.; Bi, H.; Xu, M.; Cai, L. Electrical and Thermal Conductivity of Polylactic Acid (PLA)-Based Biocomposites by Incorporation of Nano-Graphite Fabricated with Fused Deposition Modeling. Polymers 2019, 11, 549. [Google Scholar] [CrossRef] [Green Version]
- IR Spectrum Table & Chart|Sigma-Aldrich. Available online: https://www.sigmaaldrich.com/technical-documents/articles/biology/ir-spectrum-table.html (accessed on 7 December 2020).
- Rout, A.K.; Kar, J.; Jesthi, D.K.; Sutar, A.K. Effect of Surface Treatment on the Physical, Chemical, and Mechanical Properties of Palm Tree Leaf Stalk Fibers. BioResources 2016, 11, 4432–4445. [Google Scholar] [CrossRef] [Green Version]
- Chapala, P.P.; Bermeshev, M.V.; Starannikova, L.E.; Shantarovich, V.P.; Gavrilova, N.N.; Yampolskii, Y.P.; Finkelshtein, E.S. Gas-Transport Properties of Novel Composites Based on Addition Poly(3-Trimethylsilyltricyclononene-7) and Substituted Cyclodextrines. Polym. Compos. 2015, 36, 1029–1038. [Google Scholar] [CrossRef]
- Wellen, R.M.R. Effect of Polystyrene on Poly(Ethylene Terephthalate) Crystallization. Mater. Res. 2014, 17, 1620–1627. [Google Scholar] [CrossRef] [Green Version]
- Osugi, R.; Takagi, H.; Liu, K.; Gennai, Y. Thermal Conductivity Behavior of Natural Fiber-Reinforced Composites. In Proceedings of the Asian Pacific Conference for Materials and Mechanics, Yokohama, Japan, 13–16 November 2009; pp. 2–4. [Google Scholar]
- Bioki, H.A.; Mirbagheri, Z.A.; Tabbakh, F.; Mirjalili, G. Effect of Crystallinity and Irradiation on Thermal Properties and Specific Heat Capacity of LDPE & LDPE/EVA. Appl. Radiat. Isot. 2012, 70, 1–5. [Google Scholar] [CrossRef]
- Balogun, O.P.; Omotoyinbo, J.A.; Alaneme, K.K.; Oladele, I.O. The Effect Of Chemical Treatment on Tensile Properties of Soil Retted Entada Mannii Fibres. Am. J. Eng. Res. 2015, 4, 168–175. [Google Scholar]
- Chikhi, M.; Agoudjil, B.; Boudenne, A.; Gherabli, A. Experimental Investigation of New Biocomposite with Low Cost for Thermal Insulation. Energy Build. 2013, 66, 267–273. [Google Scholar] [CrossRef]
- Hernández-Olivares, F.; Bollati, M.R.; Del Rio, M.; Parga-Landa, B. Development of Cork–Gypsum Composites for Building Applications. Constr. Build. Mater. 1999, 13, 179–186. [Google Scholar] [CrossRef]
- Stevulova, N.; Kidalova, L.; Junak, J.; Cigasova, J.; Terpakova, E. Effect of Hemp Shive Sizes on Mechanical Properties of Lightweight Fibrous Composites. Procedia Eng. 2012, 42, 496–500. [Google Scholar] [CrossRef] [Green Version]
- Khedari, J.; Suttisonk, B.; Pratinthong, N.; Hirunlabh, J. New Lightweight Composite Construction Materials with Low Thermal Conductivity. Cem. Concr. Compos. 2001, 23, 65–70. [Google Scholar] [CrossRef]
- Schiavoni, S.; D’Alessandro, F.; Bianchi, F.; Asdrubali, F. Insulation Materials for the Building Sector: A Review and Comparative Analysis. Renew. Sustain. Energy Rev. 2016, 62, 988–1011. [Google Scholar] [CrossRef]
- Tiskatine, R.; Bougdour, N.; Oaddi, R.; Gourdo, L.; Rahib, Y.; Bouzit, S.; Bazgaou, A.; Bouirden, L.; Ihlal, A.; Aharoune, A. Thermo-Physical Analysis of Low-Cost Ecological Composites for Building Construction. J. Build. Eng. 2018, 20, 762–775. [Google Scholar] [CrossRef]
- Amiandamhen, S.O.; Meincken, M.; Tyhoda, L. Natural Fibre Modification and Its Influence on Fibre-Matrix Interfacial Properties in Biocomposite Materials. Fibers Polym. 2020, 21, 677–689. [Google Scholar] [CrossRef] [Green Version]
- Hittini, W.; Abu-Jdayil, B.; Mourad, A.H. Development of Date Pit–Polystyrene Thermoplastic Heat Insulator Material: Mechanical Properties. J. Thermoplast. Compos. Mater. 2021, 34, 472–489. [Google Scholar] [CrossRef]
- Fiore, V.; Di Bella, G.; Valenza, A. Effect of Sheep Wool Fibers on Thermal Insulation and Mechanical Properties of Cement-Based Composites. J. Nat. Fibers 2020, 17, 1532–1543. [Google Scholar] [CrossRef]


| DWF wt.% | |||||||
|---|---|---|---|---|---|---|---|
| 0 | 60.72 | 168.23 | 168.36 | 37.28 | 34.77 | 39.79 | 37.11 |
| 10 | 62.07 | 170.12 | 166.96 | 39.71 | 38.77 | 47.09 | 45.97 |
| 20 | 60.76 | 162.36 | 159.11 | 40.29 | 32.36 | 53.75 | 43.16 |
| 30 | 58.52 | 166.78 | 162.98 | 38.79 | 33.77 | 59.14 | 51.48 |
| 40 | 58.55 | 165.33 | 161.53 | 34.56 | 28.54 | 61.47 | 50.77 |
| DWF wt.% | |||||||
|---|---|---|---|---|---|---|---|
| 0 | 60.72 | 168.23 | 168.36 | 37.28 | 34.77 | 39.79 | 37.11 |
| 10 | 54.06 | 167.37 | 162.97 | 43.64 | 43.48 | 51.75 | 51.56 |
| 20 | 54.76 | 154.07 | 150.48 | 45.42 | 32.52 | 60.59 | 43.38 |
| 30 | 161.56 | 158.07 | 37.84 | 30.24 | 57.69 | 46.10 | |
| 40 | 157.82 | 153.09 | 29.16 | 23.19 | 51.86 | 41.24 |
| Composites/Filler | T5 (°C) * | T50 (°C) ** | Tmax (°C) | Overall Weight Loss (%) |
|---|---|---|---|---|
| Neat PLA | 285.78 | 342.0 | 353.76 | 100 |
| PLA-UTDPWF | 290 | 341.41 | 351.0 | 96.25 |
| PLA-KOH | 260.49 | 308.14 | 314.4 | 96.58 |
| PLA-NaOH | 159.0 | 278.47 | 286.4 | 94.0 |
| UTDPWF | 72.27 | 396.16 | 354.32 | 68.0 |
| KOH Treated | 202.27 | 348.7 | 322.78 | 74.0 |
| NaOH Treated | 110.77 | 344.61 | 327.54 | 87.0 |
Publisher’s Note: MDPI stays neutral with regard to jurisdictional claims in published maps and institutional affiliations. |
© 2022 by the authors. Licensee MDPI, Basel, Switzerland. This article is an open access article distributed under the terms and conditions of the Creative Commons Attribution (CC BY) license (https://creativecommons.org/licenses/by/4.0/).
Share and Cite
Al Abdallah, H.; Abu-Jdayil, B.; Iqbal, M.Z. The Effect of Alkaline Treatment on Poly(lactic acid)/Date Palm Wood Green Composites for Thermal Insulation. Polymers 2022, 14, 1143. https://doi.org/10.3390/polym14061143
Al Abdallah H, Abu-Jdayil B, Iqbal MZ. The Effect of Alkaline Treatment on Poly(lactic acid)/Date Palm Wood Green Composites for Thermal Insulation. Polymers. 2022; 14(6):1143. https://doi.org/10.3390/polym14061143
Chicago/Turabian StyleAl Abdallah, Hyder, Basim Abu-Jdayil, and Muhammad Z. Iqbal. 2022. "The Effect of Alkaline Treatment on Poly(lactic acid)/Date Palm Wood Green Composites for Thermal Insulation" Polymers 14, no. 6: 1143. https://doi.org/10.3390/polym14061143
APA StyleAl Abdallah, H., Abu-Jdayil, B., & Iqbal, M. Z. (2022). The Effect of Alkaline Treatment on Poly(lactic acid)/Date Palm Wood Green Composites for Thermal Insulation. Polymers, 14(6), 1143. https://doi.org/10.3390/polym14061143