


Thermal Stability of Polycaprolactone Grafted Densely with Maleic Anhydride Analysed Using the Coats–Redfern Equation

 , ,
, ,  and
and
Abstract
1. Introduction
2. Materials and Methods
2.1. Materials
2.2. Synthesis of PCL-g-MA
2.3. Characterization
2.3.1. Fourier Transform Infrared Spectroscopy (FTIR)
2.3.2. X-Ray Photoelectron Spectroscopy (XPS)
2.3.3. Determination of Grafting Ratio
2.3.4. Field Emission Scanning Electron Microscope (FESEM)
2.3.5. Contact Angle Measurement
2.3.6. Thermal Property Measurement (TGA/DTG/DSC)
2.3.7. The Coats–Redfern Equation [51]
3. Results and Discussion
3.1. Infrared Spectroscopy (FTIR)
3.2. XPS
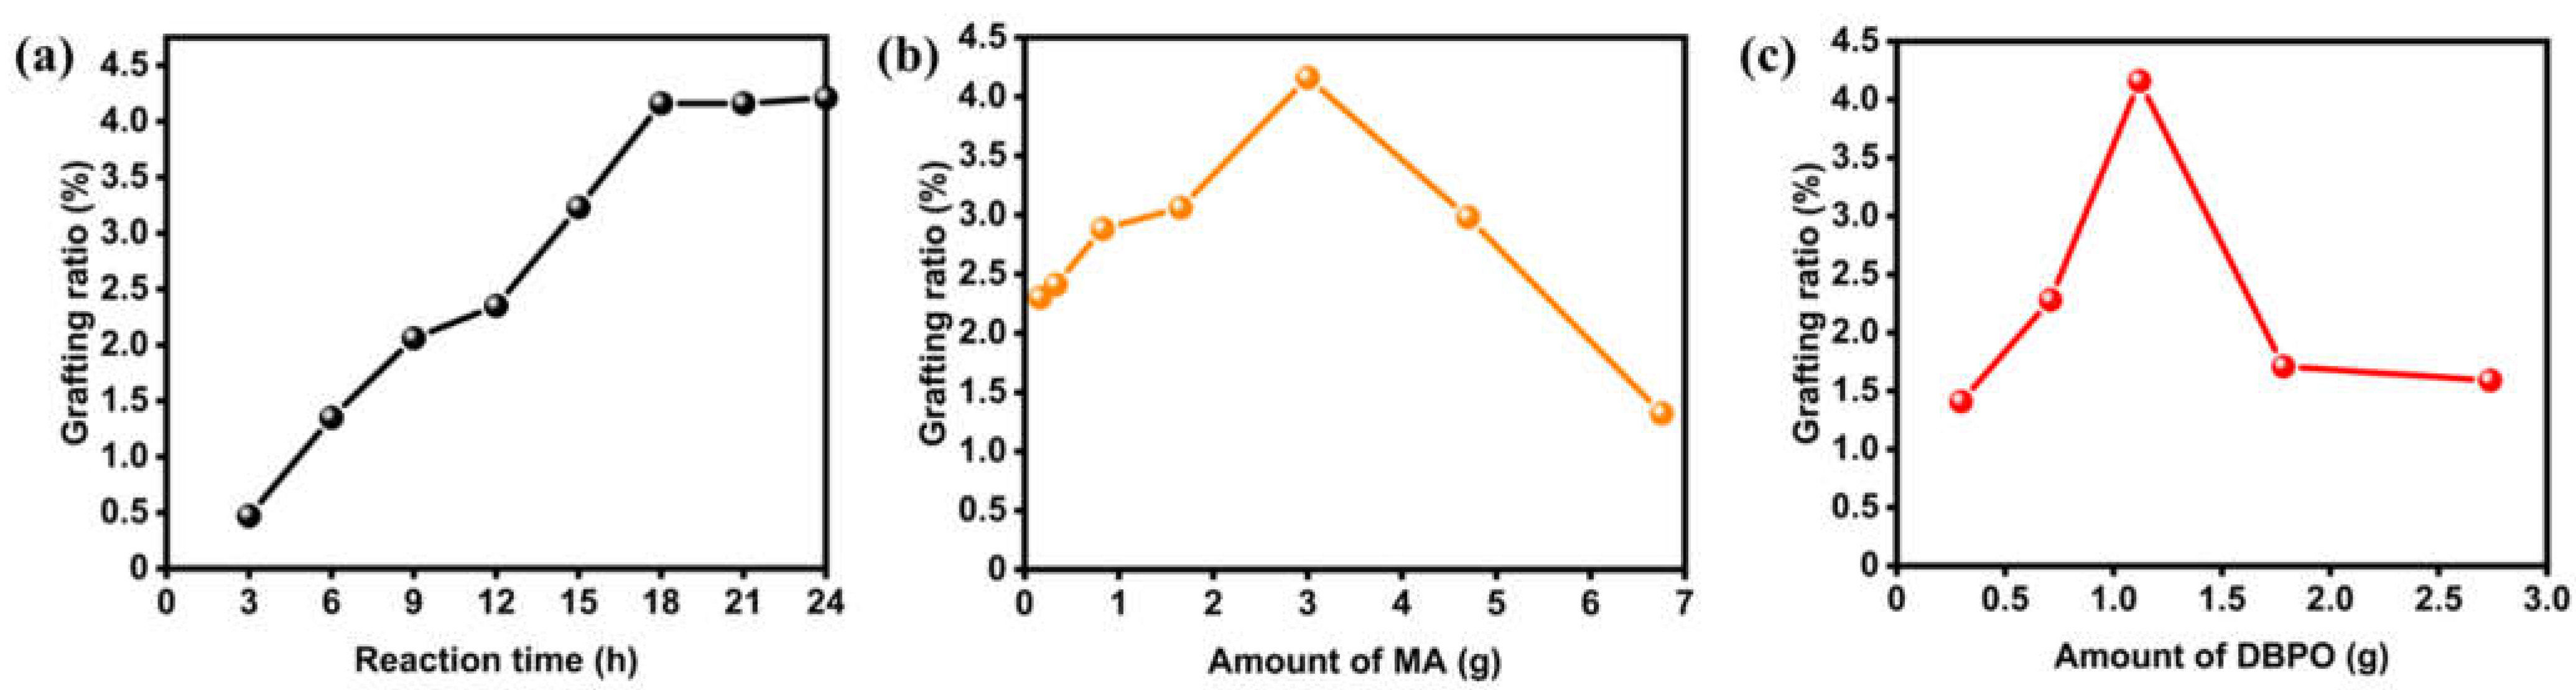
3.3. Determination of Grafting Ratio
3.4. Morphological Observation
3.5. DSC
3.6. Theoretical Analysis Using the Coats–Redfern Method
4. Conclusions
Supplementary Materials
Author Contributions
Funding
Institutional Review Board Statement
Data Availability Statement
Acknowledgments
Conflicts of Interest
References
- Geyer, R.; Jambeck, J.R.; Law, K.L. Production, use, and fate of all plastics ever made. Sci. Adv. 2017, 3, e1700782. [Google Scholar] [CrossRef] [PubMed]
- Haque, M.; Errico, M.; Gentile, G.; Avella, M.; Pracella, M. Functionalization and compatibilization of poly(ε-caprolactone) composites with cellulose microfibres. Macromol. Mater. Eng. 2012, 297, 985–993. [Google Scholar] [CrossRef]
- Chen, Y.; Awasthi, A.K.; Wei, F.; Tan, Q.; Li, J. Single-use plastics: Production, usage, disposal, and adverse impacts. Sci. Total Environ. 2021, 752, 141772. [Google Scholar] [CrossRef] [PubMed]
- Andrady, A.L.; Neal, M.A. Applications and societal benefits of plastics. Philos. Trans. R. Soc. Lond. B Biol. Sci. 2009, 364, 1977–1984. [Google Scholar] [CrossRef] [PubMed]
- MacDiarmid, A.G. “Synthetic Metals”: A Novel Role for Organic Polymers (Nobel Lecture). Angew. Chem. Int. Ed. 2001, 40, 2581–2590. [Google Scholar] [CrossRef]
- Sengwa, R.J.; Choudhary, S.; Dhatarwal, P. Investigation of alumina nanofiller impact on the structural and dielectric properties of PEO/PMMA blend matrix-based polymer nanocomposites. Adv. Compos. Mater. 2019, 2, 162–175. [Google Scholar] [CrossRef]
- Diaz Silvarrey, L.S.; Phan, A.N. Kinetic study of municipal plastic waste. Int. J. Hydrogen Energy 2016, 41, 16352–16364. [Google Scholar] [CrossRef]
- Barnes, S.J. Out of sight, out of mind: Plastic waste exports, psychological distance and consumer plastic purchasing. Glob. Environ. Change 2019, 58, 101943. [Google Scholar] [CrossRef]
- Brebu, M. Environmental Degradation of Plastic Composites with Natural Fillers—A Review. Polymers 2020, 12, 166. [Google Scholar] [CrossRef]
- Cox, K.D.; Covernton, G.A.; Davies, H.L.; Dower, J.F.; Juanes, F.; Dudas, S.E. Human Consumption of Microplastics. Environ. Sci. Technol. 2019, 53, 7068–7074. [Google Scholar] [CrossRef]
- Filho, W.L.; Havea, P.H.; Balogun, A.-L.; Boenecke, J.; Maharaj, A.A.; Ha’apio, M.; Hemstock, S.L. Plastic debris on Pacific Islands: Ecological and health implications. Sci. Total Environ. 2019, 670, 181–187. [Google Scholar] [CrossRef]
- Steensgaard, I.M.; Syberg, K.; Rist, S.; Hartmann, N.B.; Boldrin, A.; Hansen, S.F. From macro- to microplastics—Analysis of EU regulation along the life cycle of plastic bags. Environ. Pollut. 2017, 224, 289–299. [Google Scholar] [CrossRef]
- Jambeck, J.R.; Geyer, R.; Wilcox, C.; Siegler, T.R.; Perryman, M.; Andrady, A.; Narayan, R.; Law, K.L. Plastic waste inputs from land into the ocean. Science 2015, 347, 768–771. [Google Scholar] [CrossRef]
- Comanita, E.-D.; Hlihor, R.M.; Ghinea, C.; Gavrilescu, M. Occurrence of Plastic Waste in the Environment: Ecological and Health Risks. Environ. Eng. Manag. J. 2016, 15, 675–685. [Google Scholar] [CrossRef]
- Ghodrat, M.; Abascall Alonso, J.; Hagare, D.; Yang, R.; Samali, B. Economic feasibility of energy recovery from waste plastic using pyrolysis technology: An Australian perspective. Int. J. Environ. Sci. Technol. 2019, 16, 3721–3734. [Google Scholar] [CrossRef]
- Hatti-Kaul, R.; Nilsson, L.J.; Zhang, B.; Rehnberg, N.; Lundmark, S. Designing Biobased Recyclable Polymers for Plastics. Trends Biotechnol. 2020, 38, 50–67. [Google Scholar] [CrossRef]
- Ennis, R. Plastigone, a new time controlled photodegradable plastic mulch film. Proc. Natl. Agr. Plast. Congr. 1987, 20, 83–90. [Google Scholar]
- Moharir, R.V.; Kumar, S. Challenges associated with plastic waste disposal and allied microbial routes for its effective degradation: A comprehensive review. J. Clean. Prod. 2019, 208, 65–76. [Google Scholar] [CrossRef]
- Goldberg, D. A review of the biodegradability and utility of poly (caprolactone). J. Environ. Polym. Degrad. 1995, 3, 61–67. [Google Scholar] [CrossRef]
- Sudesh, K.; Iwata, T. Sustainability of Biobased and Biodegradable Plastics. CLEAN Soil Air Water 2008, 36, 433–442. [Google Scholar] [CrossRef]
- Ganesh Kumar, A.; Anjana, K.; Hinduja, M.; Sujitha, K.; Dharani, G. Review on plastic wastes in marine environment—Biodegradation and biotechnological solutions. Mar. Pollut. Bull. 2020, 150, 110733. [Google Scholar]
- Ohnishi, S.; Fujii, M.; Fujita, T.; Matsumoto, T.; Dong, L.; Akiyama, H.; Dong, H. Comparative analysis of recycling industry development in Japan following the Eco-Town program for eco-industrial development. J. Clean. Prod. 2016, 114, 95–102. [Google Scholar] [CrossRef]
- Zhang, L.; Xu, Z. Towards minimization of secondary wastes: Element recycling to achieve future complete resource recycling of electronic wastes. Waste Manag. 2019, 96, 175–180. [Google Scholar] [CrossRef]
- Rai, P.; Mehrotra, S.; Priya, S.; Gnansounou, E.; Sharma, S.K. Recent advances in the sustainable design and applications of biodegradable polymers. Bioresour. Technol. 2021, 325, 124739. [Google Scholar] [CrossRef]
- Perrin, D.E.; English, J.P. Handbook of Biodegradable Polymers; Hardwood Academic Publishers Imprint: Amsterdam, The Netherlands, 1998. [Google Scholar]
- Dash, T.K.; Konkimalla, V.B. Polymeric Modification and Its Implication in Drug Delivery: Poly-ε-caprolactone (PCL) as a Model Polymer. Mol. Pharm. 2012, 9, 2365–2379. [Google Scholar] [CrossRef]
- Grossen, P.; Witzigmann, D.; Sieber, S.; Huwyler, J. PEG-PCL-based nanomedicines: A biodegradable drug delivery system and its application. J. Control. Release 2017, 260, 46–60. [Google Scholar] [CrossRef]
- Rai, B.; Teoh, S.H.; Hutmacher, D.W.; Cao, T.; Ho, K.H. Novel PCL-based honeycomb scaffolds as drug delivery systems for rhBMP-2. Biomaterials 2005, 26, 3739–3748. [Google Scholar] [CrossRef]
- Holländer, J.; Genina, N.; Jukarainen, H.; Khajeheian, M.; Rosling, A.; Mäkilä, E.; Sandler, N. Three-Dimensional Printed PCL-Based Implantable Prototypes of Medical Devices for Controlled Drug Delivery. J. Pharm. Sci. 2016, 105, 2665–2676. [Google Scholar] [CrossRef]
- Zhang, J.; Zhao, S.; Zhu, M.; Zhu, Y.; Zhang, Y.; Liu, Z.; Zhang, C. 3D-printed magnetic Fe3O4/MBG/PCL composite scaffolds with multifunctionality of bone regeneration, local anticancer drug delivery and hyperthermia. J. Mater. Chem. B 2014, 2, 7583–7595. [Google Scholar] [CrossRef]
- Tous, L.; Ruseckaite, R.A.; Ciannamea, E.M. Sustainable hot-melt adhesives based on soybean protein isolate and polycaprolactone. Ind. Crops Prod. 2019, 135, 153–158. [Google Scholar] [CrossRef]
- Laine, C.; Willberg-Keyriläinen, P.; Ropponen, J.; Liitiä, T. Lignin and lignin derivatives as components in biobased hot melt adhesives. J. Appl. Polym. Sci. 2019, 136, 47983. [Google Scholar] [CrossRef]
- Cheng, H.N.; Ford, C.V.; He, Z. Evaluation of polyblends of cottonseed protein and polycaprolactone plasticized by cottonseed oil. Int. J. Polym. Anal. Charact. 2019, 24, 389–398. [Google Scholar] [CrossRef]
- Sailema-Palate, G.P.; Vidaurre, A.; Campillo-Fernández, A.J.; Castilla-Cortázar, I. A comparative study on Poly (ε-caprolactone) film degradation at extreme pH values. Polym. Degrad. Stab. 2016, 130, 118–125. [Google Scholar] [CrossRef]
- Bartnikowski, M.; Dargaville, T.R.; Ivanovski, S.; Hutmacher, D.W. Degradation mechanisms of polycaprolactone in the context of chemistry, geometry and environment. Prog. Polym. Sci. 2019, 96, 1–20. [Google Scholar] [CrossRef]
- Von Burkersroda, F.; Schedl, L.; Göpferich, A. Why degradable polymers undergo surface erosion or bulk erosion. Biomaterials 2002, 23, 4221–4231. [Google Scholar] [CrossRef]
- Jawaid, M.; Khalil, H.A. Cellulosic/synthetic fibre reinforced polymer hybrid composites: A review. Carbohydr. Polym. 2011, 86, 1–18. [Google Scholar] [CrossRef]
- Chen, S.; Zhang, Z.-L.; Song, F.; Wang, X.-L.; Wang, Y.-Z. Rapid Synthesis of Polymer-Grafted Cellulose Nanofiber Nanocomposite via Surface-Initiated Cu(0)-Mediated Reversible Deactivation Radical Polymerization. Macromolecules 2021, 54, 7409–7420. [Google Scholar] [CrossRef]
- Pracella, M.; Haque, M.M.-U.; Alvarez, V. Functionalization, Compatibilization and Properties of Polyolefin Composites with Natural Fibers. Polymers 2010, 2, 554–574. [Google Scholar] [CrossRef]
- John, J.; Tang, J.; Yang, Z.; Bhattacharya, M.K. Synthesis and characterization of anhydride-functional polycaprolactone. J. Polym. Sci. Part A 1997, 35, 1139–1148. [Google Scholar] [CrossRef]
- Mani, R.; Bhattacharya, M.; Tang, J. Functionalization of polyesters with maleic anhydride by reactive extrusion. J. Polym. Sci. Part A Polym. Chem. 1999, 37, 1693–1702. [Google Scholar] [CrossRef]
- Gardella, L.; Calabrese, M.; Monticelli, O. PLA maleation: An easy and effective method to modify the properties of PLA/PCL immiscible blends. Colloid Polym. Sci. 2014, 292, 2391–2398. [Google Scholar] [CrossRef]
- Qiu, W.; Hirotsu, T. A New Method to Prepare Maleic Anhydride Grafted Poly(propylene). Macromol. Chem. Phys. 2005, 206, 2470–2482. [Google Scholar] [CrossRef]
- Beyer, G.; Hopmann, C. Reactive Extrusion: Principles and Applications; Wiley-VCH Verlag GmbH& Co.KGaA, Boschstr: Weinheim, Germany, 2018. [Google Scholar]
- Ahmad Thirmizir, M.; Mohd Ishak, Z.; Mat Taib, R.; Rahim, S.; Mohamad Jani, S. Natural weathering of kenaf bast fibre-filled poly (butylene succinate) composites: Effect of fibre loading and compatibiliser addition. J. Polym. Environ. 2011, 19, 263–273. [Google Scholar] [CrossRef]
- Khankrua, R.; Pivsa-Art, S.; Hiroyuki, H.; Suttiruengwong, S. Thermal and Mechanical Properties of Biodegradable Polyester/Silica Nanocomposites. Energy Procedia 2013, 34, 705–713. [Google Scholar] [CrossRef]
- Singh, S.K.; Sawarkar, A.N. Thermal decomposition aspects and kinetics of pyrolysis of garlic stalk. Energy Sources A Recovery Util. Environ. Eff. 2020, 1–11. [Google Scholar] [CrossRef]
- Shih, Y.-F.; Chieh, Y.-C. Thermal Degradation Behavior and Kinetic Analysis of Biodegradable Polymers Using Various Comparative Models, 1. Macromol. Theory Simul. 2007, 16, 101–110. [Google Scholar] [CrossRef]
- Cai, J.; Bi, L. Precision of the Coats and Redfern Method for the Determination of the Activation Energy without Neglecting the Low-Temperature End of the Temperature Integral. Energy Fuels 2008, 22, 2172–2174. [Google Scholar] [CrossRef]
- Ramukutty, S.; Ramachandran, E. Reaction Rate Models for the Thermal Decomposition of Ibuprofen Crystals. J. Cryst. Process Technol. 2014, 4, 71–78. [Google Scholar] [CrossRef]
- Coats, A.W.; Redfern, J. Kinetic parameters from thermogravimetric data. Nature 1964, 201, 68–69. [Google Scholar] [CrossRef]
- Wu, C.-S.; Liao, H.-T. Polycaprolactone-Based Green Renewable Ecocomposites Made from Rice Straw Fiber: Characterization and Assessment of Mechanical and Thermal Properties. Ind. Eng. Chem. Res. 2012, 51, 3329–3337. [Google Scholar] [CrossRef]
- Nakason, C.; Kaesaman, A.; Supasanthitikul, P. The grafting of maleic anhydride onto natural rubber. Polym. Test. 2004, 23, 35–41. [Google Scholar] [CrossRef]
- Ma, Q.; Shi, K.; Su, T.; Wang, Z. Biodegradation of Polycaprolactone (PCL) with Different Molecular Weights by Candida antarctica Lipase. J. Polym. Environ. 2020, 28, 2947–2955. [Google Scholar] [CrossRef]
- Wang, Q.; Ji, C.; Sun, J.; Yao, Q.; Liu, J.; Saeed, R.M.Y.; Zhu, Q. Kinetic thermal behavior of nanocellulose filled polylactic acid filament for fused filament fabrication 3D printing. J. Appl. Polym. Sci. 2020, 137, 48374. [Google Scholar] [CrossRef]
- Salla, J.M.; Morancho, J.M.; Cadenato, A.; Ramis, X. Non-isothermal degradation of a thermoset powder coating in inert and oxidant atmospheres. J. Therm. Anal. Calorim. 2003, 72, 719–728. [Google Scholar] [CrossRef]
- Ramis, X.; Cadenato, A.; Morancho, J.M.; Salla, J.M. Curing of a thermosetting powder coating by means of DMTA, TMA and DSC. Polymer 2003, 44, 2067–2079. [Google Scholar] [CrossRef]
- Ramis, X.; Salla, J.; Cadenato, A.; Morancho, J.M. Simulation of isothermal cure of a powder coating—Non-isothermal DSC experiments. J. Therm. Anal. Calorim. 2003, 72, 707–718. [Google Scholar] [CrossRef]
- Ramis, X.; Cadenato, A.; Salla, J.; Morancho, J.M.; Vallés, A.; Contat, L.; Amparo, R. Thermal Degradation of Polypropylene/starch-based materials with enhanced biodegradability. Polym. Degrad. Stab. 2004, 86, 483–491. [Google Scholar] [CrossRef]
- Barra, G.; Crespo, J.; Bertolino, J.; Soldi, V.; Nunes, P. Maleic Anhydride Grafting on EPDM: Qualitative and Quantitative Determination. J. Braz. Chem. Soc. 1999, 10, 31–34. [Google Scholar] [CrossRef]
- Vilay, V.; Mariatti, M.; Ahmad, Z.; Pasomsouk, K.; Todo, M. Improvement of microstructures and properties of biodegradable PLLA and PCL blends compatibilized with a triblock copolymer. Mater. Sci. Eng. A 2010, 527, 6930–6937. [Google Scholar] [CrossRef]
- Azizi, M.; Azimzadeh, M.; Afzali, M.; Alafzadeh, M.; Mirhosseini, S. Characterization and optimization of using calendula officinalis extract in fabrication of polycaprolactone-gelatin electrospun nanofibers for wound dressing applications. J. Adv. Mater. Process. 2018, 6, 34–46. [Google Scholar]
- Qiu, W.; Endo, T.; Hirotsu, T. A novel technique for preparing of maleic anhydride grafted polyolefins. Eur. Polym. J. 2005, 41, 1979–1984. [Google Scholar] [CrossRef]
- Yang, L.; Zhang, F.; Endo, T.; Hirotsu, T. Microstructure of Maleic Anhydride Grafted Polyethylene by High-Resolution Solution-State NMR and FTIR Spectroscopy. Macromolecules 2003, 36, 4709–4718. [Google Scholar] [CrossRef]
- Permyakova, E.S.; Kiryukhantsev-Korneev, P.V.; Gudz, K.Y.; Konopatsky, A.S.; Polčak, J.; Zhitnyak, I.Y.; Gloushankova, N.A.; Shtansky, D.V.; Manakhov, A.M. Comparison of Different Approaches to Surface Functionalization of Biodegradable Polycaprolactone Scaffolds. Nanomaterials 2019, 9, 1769. [Google Scholar] [CrossRef]
- Kim, J.; Mousa, H.M.; Park, C.H.; Kim, C.S. Enhanced corrosion resistance and biocompatibility of AZ31 Mg alloy using PCL/ZnO NPs via electrospinning. Appl. Surf. Sci. 2017, 396, 249–258. [Google Scholar] [CrossRef]
- Wang, H.; Li, Z.; Hong, K.; Chen, M.; Qiao, Z.; Yuan, Z.; Wang, Z. Property improvement of multi-walled carbon nanotubes/polypropylene composites with high filler loading via interfacial modification. RSC Adv. 2019, 9, 29087–29096. [Google Scholar] [CrossRef]
- Chen, C.; Peng, S.; Fei, B.; Zhuang, Y.; Dong, L.; Feng, Z.; Chen, S.; Xia, H. Synthesis and characterization of maleated poly(3-hydroxybutyrate). J. Appl. Polym. Sci. 2003, 88, 659–668. [Google Scholar] [CrossRef]
- Takamura, M.; Nakamura, T.; Takahashi, T.; Koyama, K. Effect of type of peroxide on cross-linking of poly(l-lactide). Polym. Degrad. Stab. 2008, 93, 1909–1916. [Google Scholar] [CrossRef]
- Bhattacharya, A.; Misra, B.N. Grafting: A versatile means to modify polymers: Techniques, factors and applications. Prog. Polym. Sci. 2004, 29, 767–814. [Google Scholar] [CrossRef]
- Bátori, V.; Lundin, M.; Åkesson, D.; Lennartsson, P.R.; Taherzadeh, M.J.; Zamani, A. The Effect of Glycerol, Sugar, and Maleic Anhydride on Pectin-Cellulose Thin Films Prepared from Orange WasteA. Polymers 2019, 11, 392. [Google Scholar] [CrossRef]
- Leluk, K.; Kozlowski, M. Thermal and mechanical properties of flax-reinforced polycaprolactone composites. Fibers Polym. 2014, 15, 108–116. [Google Scholar] [CrossRef]
- Morais, D.; Siqueira, D.; Bruno Barreto Luna, C.; Araujo, E.; Bezerra, E.; Wellen, R. Grafting Maleic Anhydride onto Polycaprolactone: Influence of processing. Mater. Res. Express 2019, 6, 055315. [Google Scholar] [CrossRef]
- Papageorgiou, D.G.; Roumeli, E.; Terzopoulou, Z.; Tsanaktsis, V.; Chrissafis, K.; Bikiaris, D. Polycaprolactone/multi-wall carbon nanotube nanocomposites prepared by in situ ring opening polymerization: Decomposition profiling using thermogravimetric analysis and analytical pyrolysis–gas chromatography/mass spectrometry. J. Anal. Appl. Pyrolysis 2015, 115, 125–131. [Google Scholar] [CrossRef]
- Ortega-Toro, R.; Santagata, G.; Gomez d’Ayala, G.; Cerruti, P.; Talens Oliag, P.; Chiralt Boix, M.A.; Malinconico, M. Enhancement of interfacial adhesion between starch and grafted poly(ε-caprolactone). Carbohyd. Polym. 2016, 147, 16–27. [Google Scholar] [CrossRef]
- Lopera-Valle, A.; Elias, A. Amine Responsive Poly (lactic acid) (PLA) and Succinic Anhydride (SAh) Graft-Polymer: Synthesis and Characterization. Polymers 2019, 11, 1466. [Google Scholar] [CrossRef]
- Simão, J.A.; Bellani, C.F.; Branciforti, M.C. Thermal properties and crystallinity of PCL/PBSA/cellulose nanocrystals grafted with PCL chains. J. Appl. Polym. Sci. 2017, 134, 44493. [Google Scholar] [CrossRef]
- Wang, G.; Yang, S.; Wei, Z.; Dong, X.; Wang, H.; Qi, M. Facile preparation of poly(ε-caprolactone)/Fe3O4@graphene oxide superparamagnetic nanocomposites. Polym. Bull. 2013, 70, 2359–2371. [Google Scholar] [CrossRef]
- Huang, Y.; Fan, C.; Han, X.; Jiang, X. A TGA-MS investigation of the effect of heating rate and mineral matrix on the pyrolysis of kerogen in oil shale. Oil Shale 2016, 33, 125. [Google Scholar] [CrossRef]
- Wongthong, P.; Nakason, C.; Pan, Q.; Rempel, G.L.; Kiatkamjornwong, S. Modification of deproteinized natural rubber via grafting polymerization with maleic anhydride. Eur. Polym. J. 2013, 49, 4035–4046. [Google Scholar] [CrossRef]
- Zhang, Y.; Fu, Z.; Wang, W.; Ji, G.; Zhao, M.; Li, A. Kinetics, Product Evolution, and Mechanism for the Pyrolysis of Typical Plastic Waste. ACS Sustain. Chem. Eng. 2021, 10, 91–103. [Google Scholar] [CrossRef]
- Da Silva, J.; Alves, J.L.; Galdino, W.; Moreira, R.; José, H.; Sena, R.; Andersen, S. Combustion of pistachio shell: Physicochemical characterization and evaluation of kinetic parameters. Environ. Sci. Pollut. Res. 2018, 25, 21420–21429. [Google Scholar] [CrossRef]
- Fulmer, G.R.; Miller, A.J.M.; Sherden, N.H.; Gottlieb, H.E.; Nudelman, A.; Stoltz, B.M.; Bercaw, J.E.; Goldberg, K.I. NMR Chemical Shifts of Trace Impurities: Common Laboratory Solvents, Organics, and Gases in Deuterated Solvents Relevant to the Organometallic Chemist. Organometallics 2010, 29, 2176–2179. [Google Scholar] [CrossRef]
- Khankrua, R.; Pivsa-Art, S.; Hiroyuki, H.; Suttiruengwong,, S. Grafting of poly (lactic acid) with maleic anhydride using supercritical carbon dioxide. IOP Conf. Ser.: Mater. Sci. Eng. 2015, 87, 12066. [Google Scholar] [CrossRef]


| Sample | Time (h) | Amount of DBPO (g) | Amount of MA (g) |
|---|---|---|---|
| t1 | 3 | 1.120 | 3.000 |
| t2 | 6 | 1.120 | 3.000 |
| t3 | 9 | 1.120 | 3.000 |
| t4 | 12 | 1.120 | 3.000 |
| t5 | 15 | 1.120 | 3.000 |
| t6 | 18 | 1.120 | 3.000 |
| t7 | 21 | 1.120 | 3.000 |
| t8 | 24 | 1.120 | 3.000 |
| Sample | Time (h) | Amount of DBPO (g) | Amount of MA (g) |
|---|---|---|---|
| M1 | 18 | 1.120 | 0.165 |
| M2 | 18 | 1.120 | 0.331 |
| M3 | 18 | 1.120 | 0.827 |
| M4 | 18 | 1.120 | 1.655 |
| M5 (t6) | 18 | 1.120 | 3.000 |
| M6 | 18 | 1.120 | 4.500 |
| M7 | 18 | 1.120 | 6.754 |
| Sample | Time (h) | Amount of DBPO (g) | Amount of MA (g) |
|---|---|---|---|
| B1 | 18 | 0.297 | 3.000 |
| B2 | 18 | 0.709 | 3.000 |
| B3 (t6) | 18 | 1.120 | 3.000 |
| B4 | 18 | 1.784 | 3.000 |
| B5 | 18 | 2.738 | 3.000 |
| Mechanism Model | Differential Form f(α) | Integral Form g(α) |
|---|---|---|
| Order of Reaction | ||
| First order (F1) | 1 − α | −ln(1 − α) |
| Second order (F2) | (1 − α)2 | (1 − α)−1 − 1 |
| Third order (F3) | (1 − α)3 | [(1 − α)−2 − 1]/2 |
| Diffusion Models | ||
| One-dimensional diffusion (D1) | 1/2α | α2 |
| Two-dimensional diffusion (D2) | [−ln(1 − α)]−1 | [(1 − α)ln(1 − α)] + α |
| Three-dimensional diffusion, Jandel (D3) | 3(1 − α)2/3/[2(1 − (1 − α)1/3)] | [1 − (1 − α)1/3]2 |
| Diffusion control, Ginstling–Brounshtein (D4) | 3/2[(1 − α)−1/3 − 1] | 1 − (2α/3) − (1 − α)2/3 |
| Nucleation Growth Models | ||
| Two-dimensional (A2) | 2(1 − α)[-ln(1 − α)]1/2 | [−ln(1 − α)]1/2 |
| Three-dimensional (A3) | 3(1 − α)[-ln(1 − α)]3/2 | [−ln(1 − α)]1/3 |
| Four-dimensional (A4) | 4(1 − α)[-ln(1 − α)3/4 | [−ln(1 − α)]1/4 |
| Geometrical Contraction Model | ||
| One dimension (R1) | 1 | A |
| Two dimensions (R2) | 2(1 − α)]1/2 | 1 − (1 − α)1/2 |
| Three dimensions (R3) | 2(1 − α)]1/2 | 1 − (1 − α)1/3 |
| Experimental Nucleation Models | ||
| Power law (P2) | 2α1/2 | α1/2 |
| Power law (P3) | 3α2/3 | α1/3 |
| Power law (P4) | 4α3/4 | α1/4 |
| Mechanism Models | Heating Rate (°C/min) | |||||
|---|---|---|---|---|---|---|
| 5 | 10 | 15 | 20 | 25 | 30 | |
| Order of Reaction | ||||||
| First order (F1) | 0.8780 | 0.7861 | 0.5476 | 0.3249 | 0.1594 | 0.0849 |
| Second order (F2) | 0.8058 | 0.7271 | 0.7021 | 0.6985 | 0.6826 | 0.7069 |
| Third order (F3) | 0.6923 | 0.5948 | 0.5856 | 0.5562 | 0.5722 | 0.5719 |
| Diffusion Models | ||||||
| One-dimensional diffusion (D1) | 0.9581 | 0.6746 | 0.3735 | 0.1831 | 0.0689 | 0.0293 |
| Two-dimensional diffusion (D2) | 0.8877 | 0.9329 | 0.8959 | 0.9465 | 0.8998 | 0.9338 |
| Three-dimensional diffusion, Jandel (D3) | 0.9200 | 0.8251 | 0.7380 | 0.7189 | 0.6116 | 0.5684 |
| Diffusion control, Ginstling–Brounshtein (D4) | 0.8956 | 0.8368 | 0.8131 | 0.8015 | 0.7905 | 0.7839 |
| Nucleation Growth Models | ||||||
| Two-dimensional (A2) | 0.8800 | 0.8953 | 0.8588 | 0.9038 | 0.8400 | 0.8935 |
| Three-dimensional (A3) | 0.8800 | 0.8953 | 0.8588 | 0.9038 | 0.8400 | 0.8935 |
| Four-dimensional (A4) | 0.8800 | 0.8953 | 0.8588 | 0.9038 | 0.8400 | 0.8935 |
| Geometrical Contraction Model | ||||||
| One dimension (R1) | 0.7936 | 0.8000 | 0.5663 | 0.3236 | 0.1403 | 0.0639 |
| Two dimensions (R2) | 0.9683 | 0.9282 | 0.8875 | 0.8803 | 0.8277 | 0.8037 |
| Three dimensions (R3) | 0.9949 | 0.9888 | 0.9839 | 0.9822 | 0.9747 | 0.9706 |
| Experimental Nucleation Models | ||||||
| Power law (P2) | 0.7936 | 0.8000 | 0.5663 | 0.3236 | 0.1403 | 0.06386 |
| Power law (P3) | 0.7936 | 0.8000 | 0.5663 | 0.3236 | 0.1403 | 0.06386 |
| Power law (P4) | 0.7936 | 0.8000 | 0.5663 | 0.3236 | 0.1403 | 0.06386 |
Publisher’s Note: MDPI stays neutral with regard to jurisdictional claims in published maps and institutional affiliations. |
© 2022 by the authors. Licensee MDPI, Basel, Switzerland. This article is an open access article distributed under the terms and conditions of the Creative Commons Attribution (CC BY) license (https://creativecommons.org/licenses/by/4.0/).
Share and Cite
Thangunpai, K.; Hu, D.; Su, X.; Kajiyama, M.; Neves, M.A.; Enomae, T. Thermal Stability of Polycaprolactone Grafted Densely with Maleic Anhydride Analysed Using the Coats–Redfern Equation. Polymers 2022, 14, 4100. https://doi.org/10.3390/polym14194100
Thangunpai K, Hu D, Su X, Kajiyama M, Neves MA, Enomae T. Thermal Stability of Polycaprolactone Grafted Densely with Maleic Anhydride Analysed Using the Coats–Redfern Equation. Polymers. 2022; 14(19):4100. https://doi.org/10.3390/polym14194100
Chicago/Turabian StyleThangunpai, Kotchaporn, Donghao Hu, Xianlong Su, Mikio Kajiyama, Marcos A. Neves, and Toshiharu Enomae. 2022. "Thermal Stability of Polycaprolactone Grafted Densely with Maleic Anhydride Analysed Using the Coats–Redfern Equation" Polymers 14, no. 19: 4100. https://doi.org/10.3390/polym14194100
APA StyleThangunpai, K., Hu, D., Su, X., Kajiyama, M., Neves, M. A., & Enomae, T. (2022). Thermal Stability of Polycaprolactone Grafted Densely with Maleic Anhydride Analysed Using the Coats–Redfern Equation. Polymers, 14(19), 4100. https://doi.org/10.3390/polym14194100