

Two-Way Shear Resistance of FRP Reinforced-Concrete Slabs: Data and a Comparative Study
 ,
,  ,
,  and
and
Abstract
:1. Introduction
2. Research Significance
3. Simplified Strength Models
3.1. Gardner (1990)
3.2. Japanese Approaches (1997), JSCE
3.3. Elghandour (2000), EG [23]
3.4. Mattys and Taerwe (2000), MT
3.5. Ospina (2003), O
3.6. Zaghloul (2003), Z
3.7. Jacbson (2005), Jb [27]
3.8. ACI (2005), ACI [28]
3.9. Elgamal (2005), E [29]
3.10. Zhang (2006), Zg [30,31]
3.11. Theodorkopoulos and Swamy (2008), TS [32]
3.12. CSA-S806-12 (2012), CSA [33]
3.13. Nguyen and Rovnak (2013), NR [34]
3.14. Hassan, et al. (2017), H [35]
3.15. Kara and Sinani (2017), KS [36]
3.16. Oller, et al. (2018), CCCM [37]
3.17. Hemzah, et al. (2019), Hz [39]
3.18. Elgendy and Elsalakawy (2020), EE [40]
3.19. Ju, et al. (2021), Ju [41]
3.20. Alrudaini (2022), A [42]
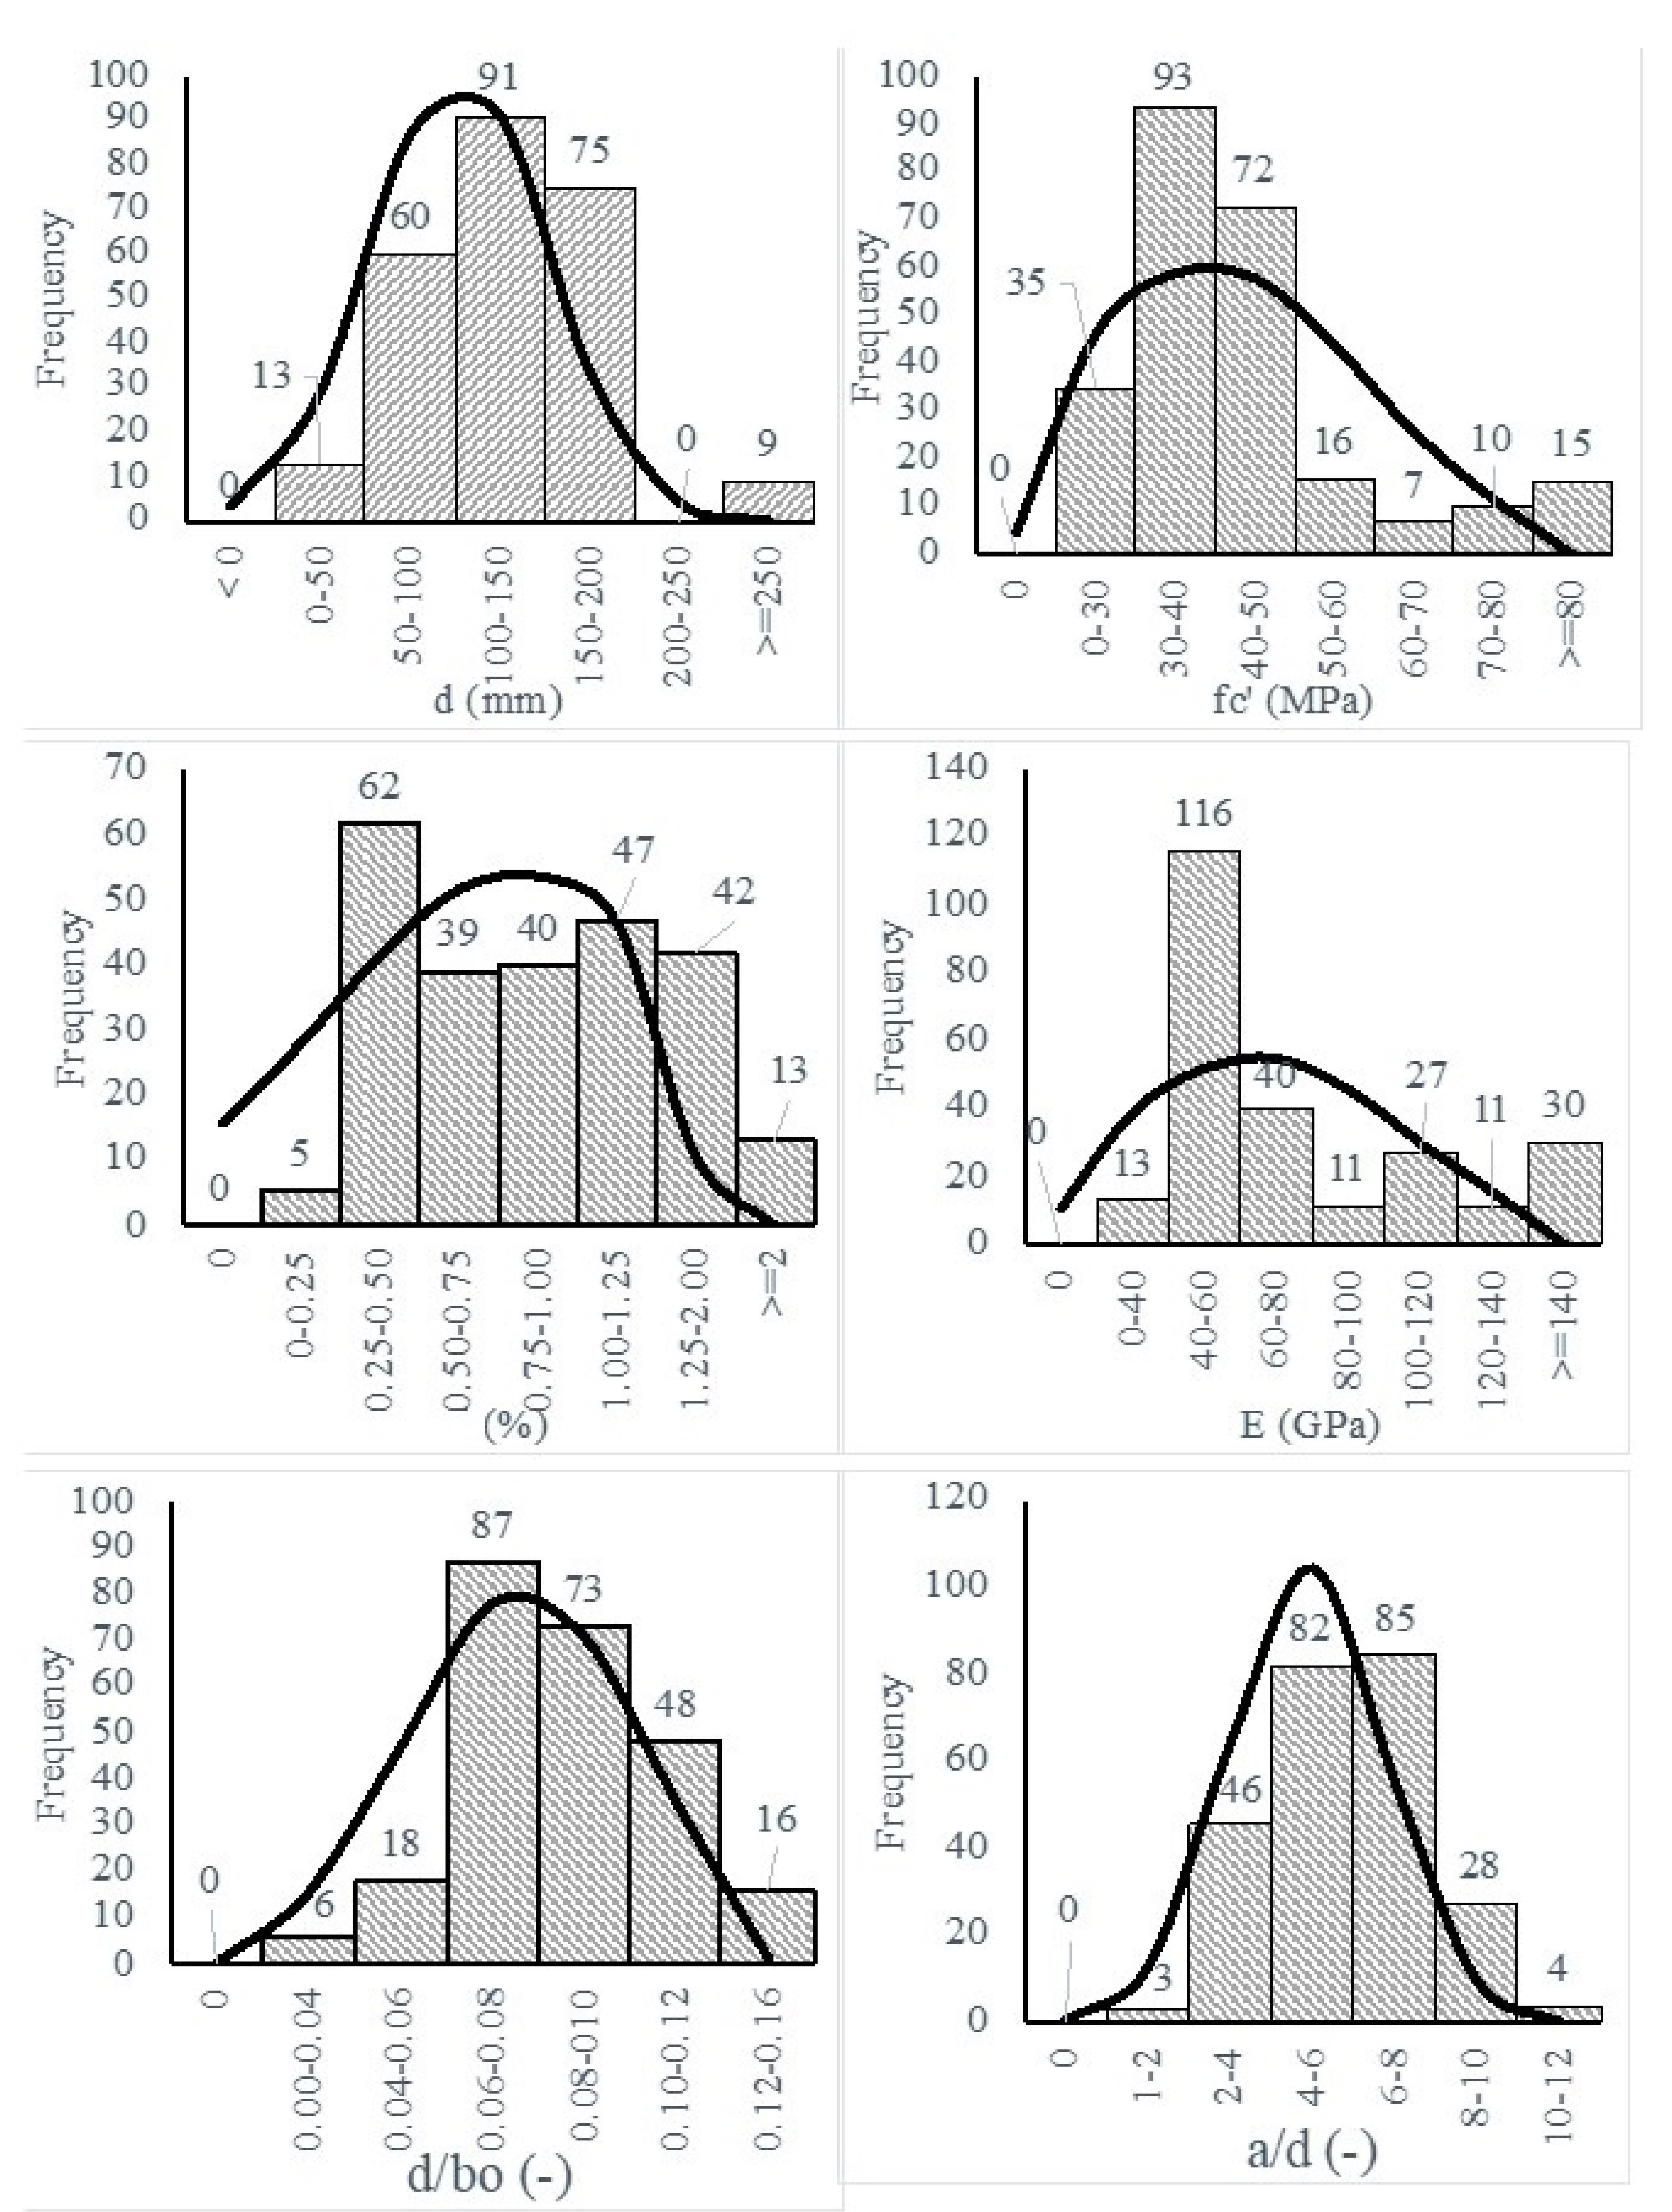
4. Experimental Database Profile
5. Behavior Patterns
6. Pearson Correlation
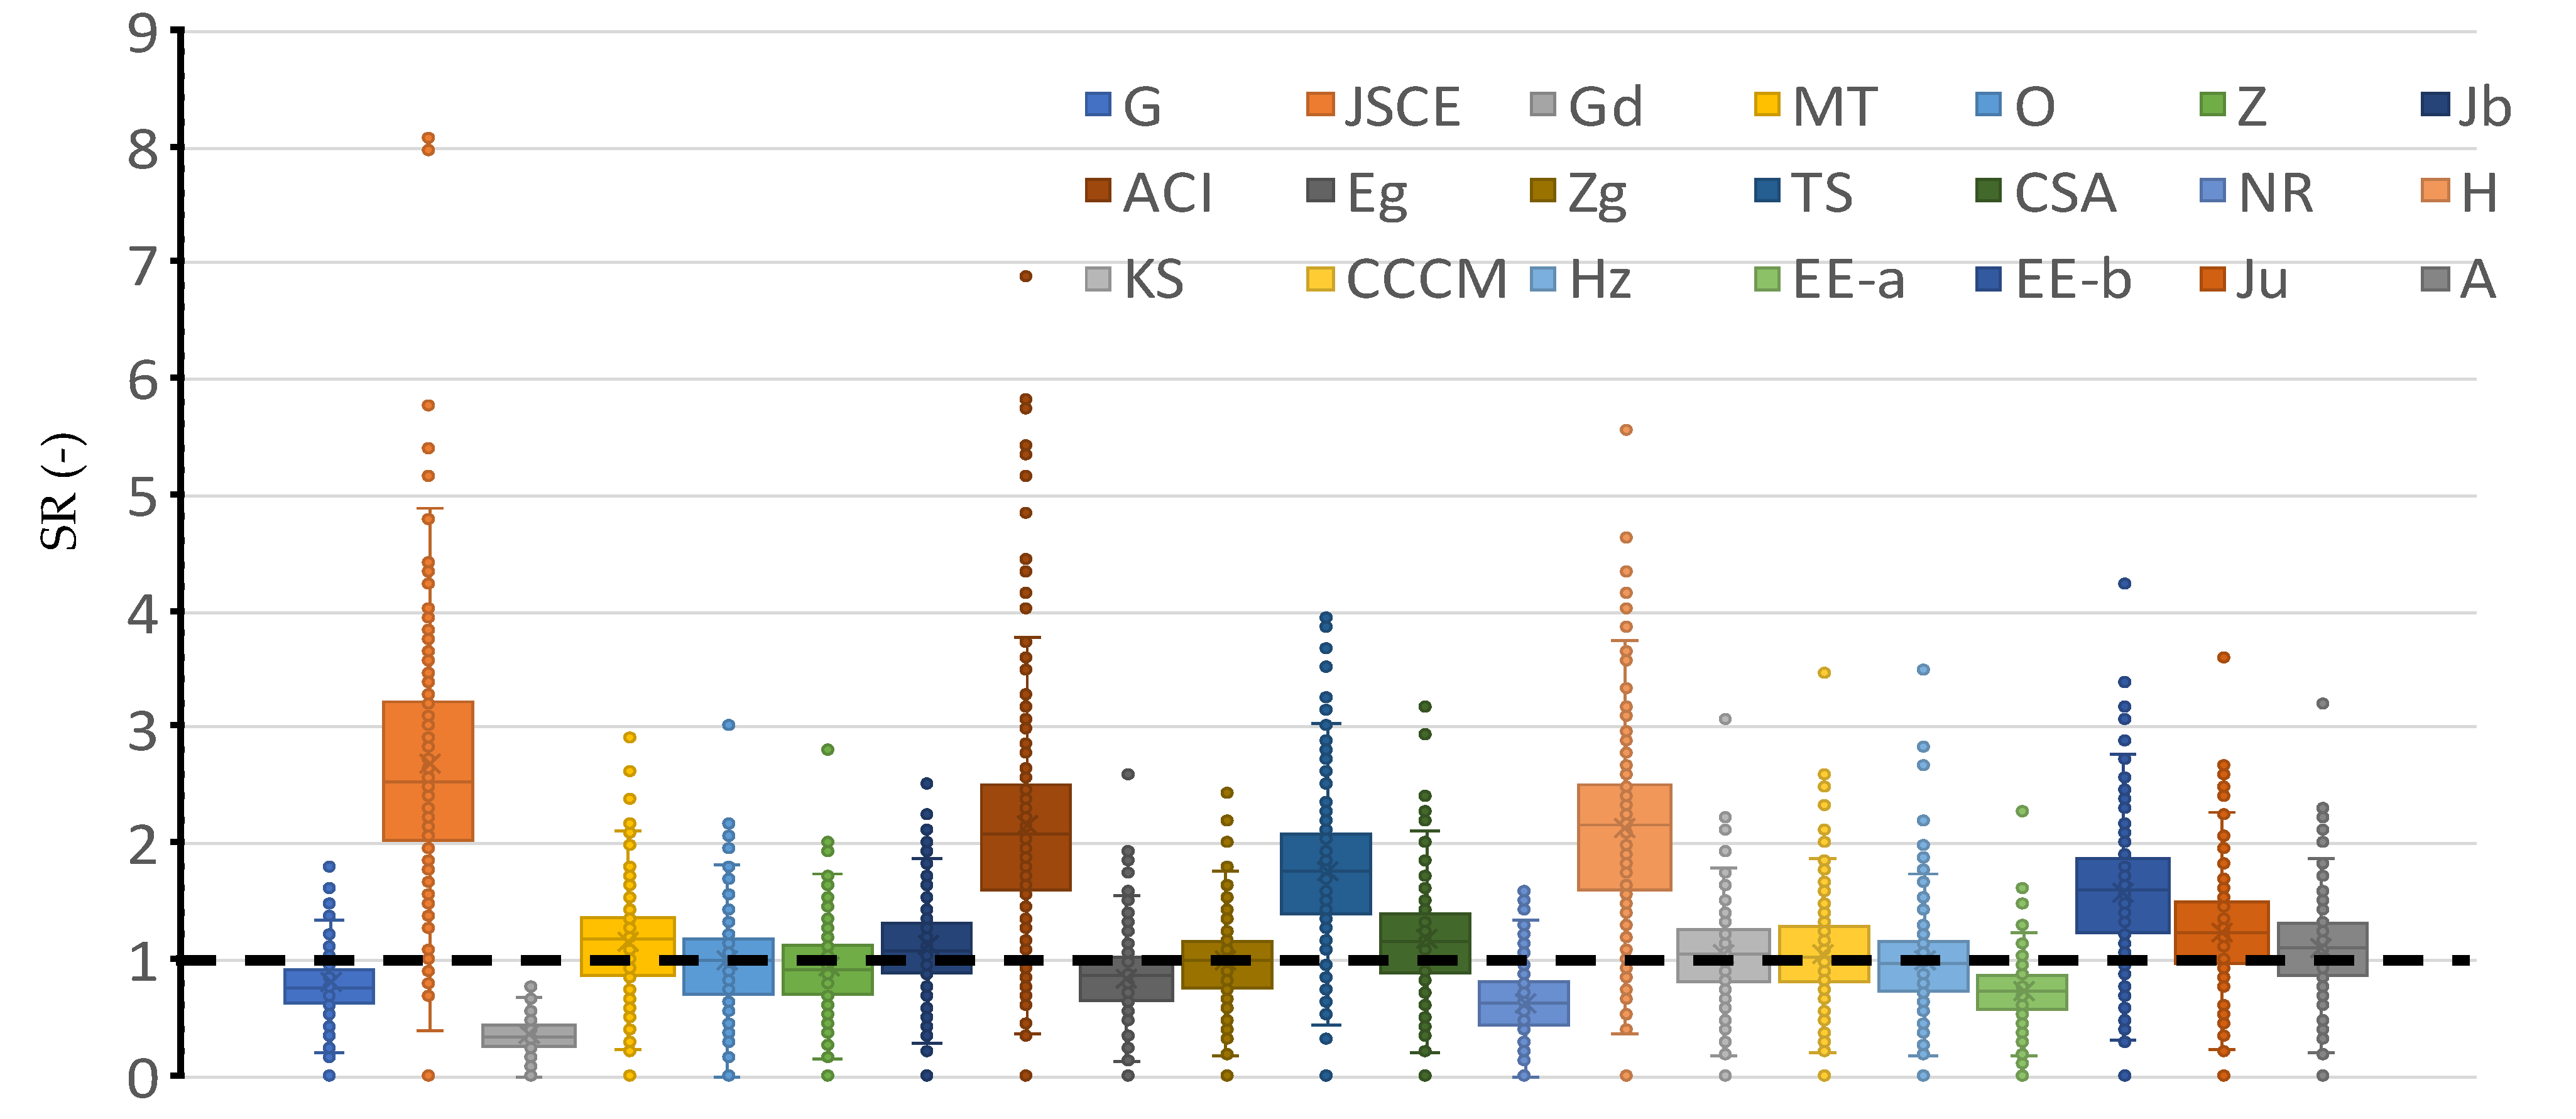
7. Comparison between Selected Models
7.1. Depth
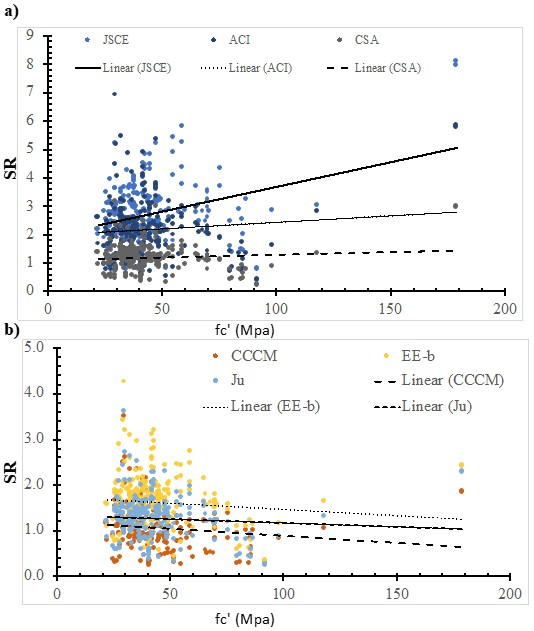
7.2. Concrete Compressive Strength
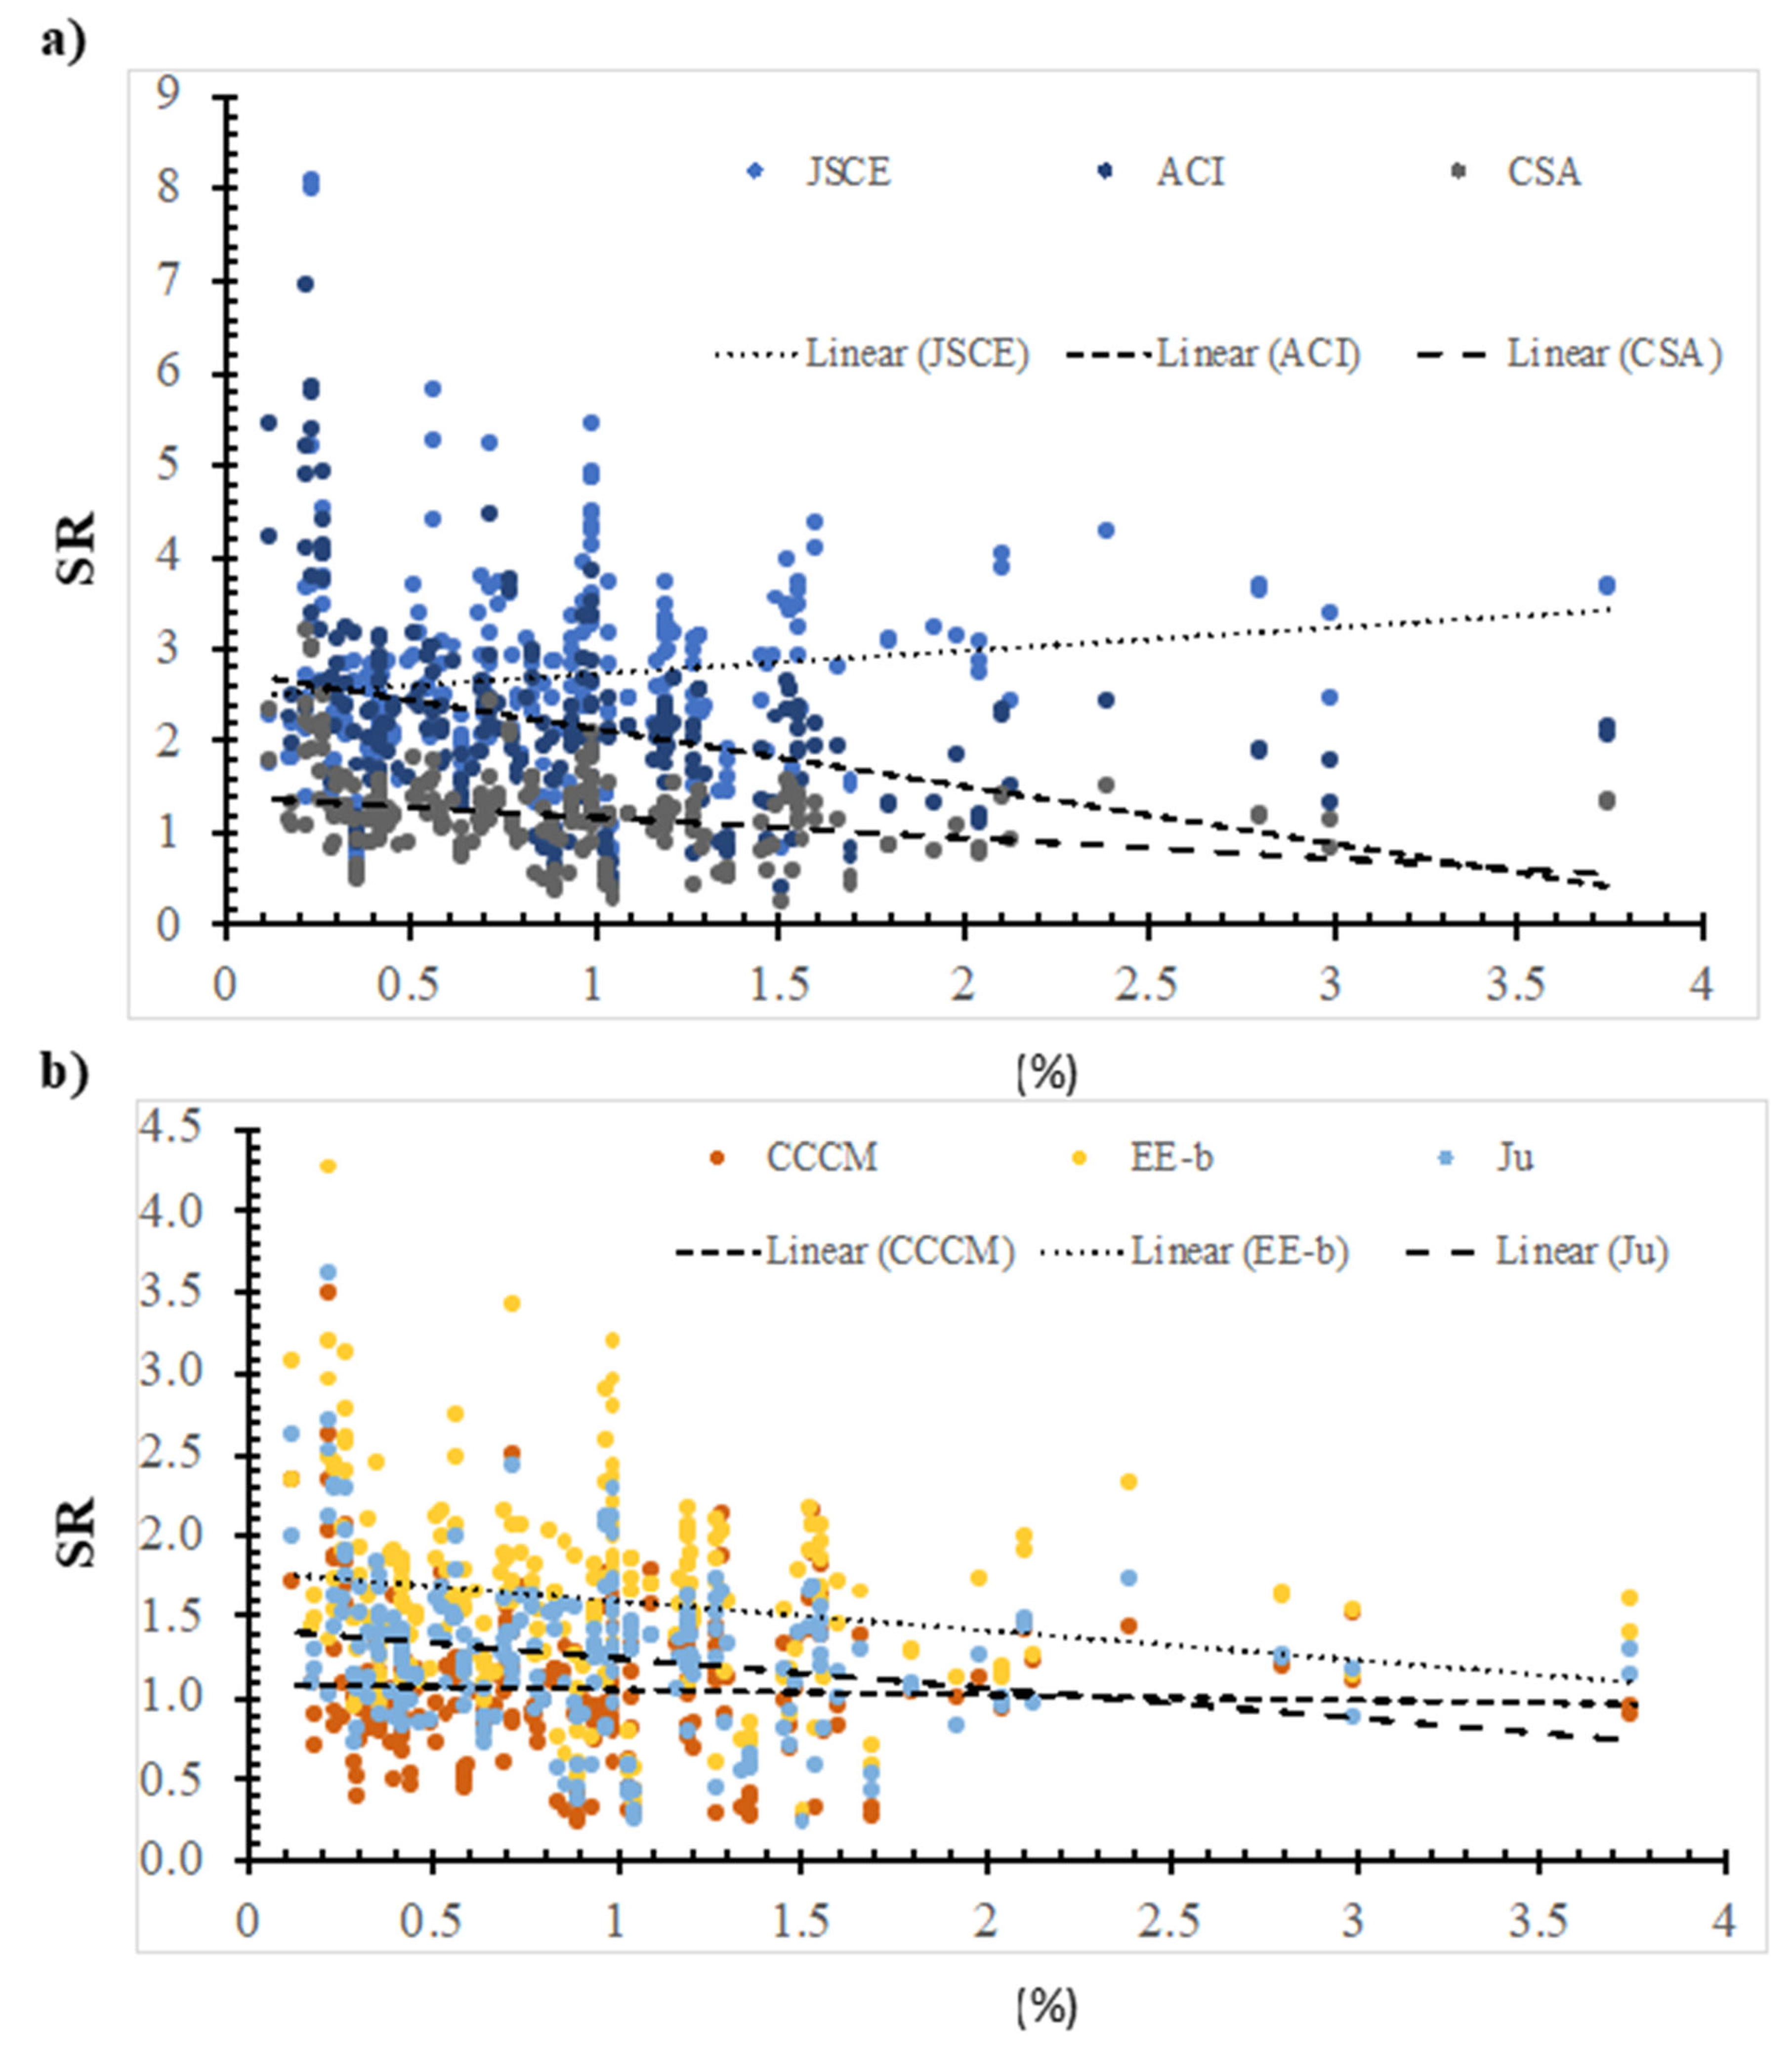
7.3. Flexure Reinforcment Ratio
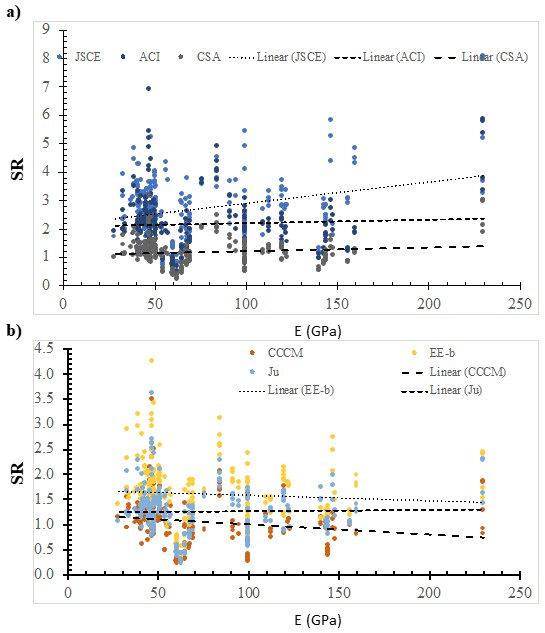
7.4. Young’s Modulus
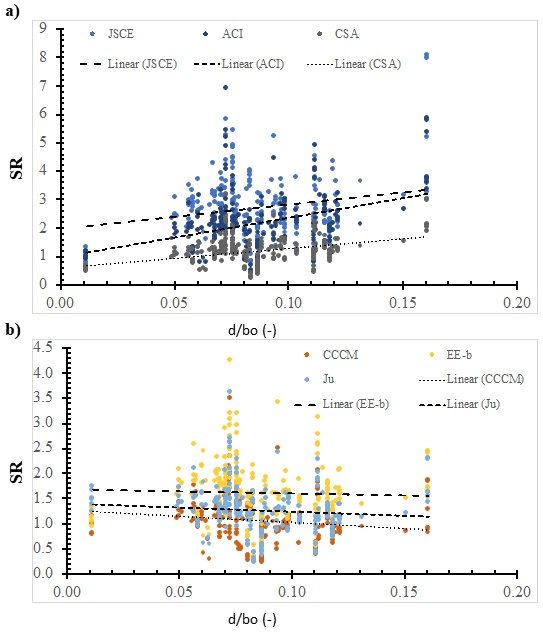
7.5. Depth-to-Control Perimeter Ratio
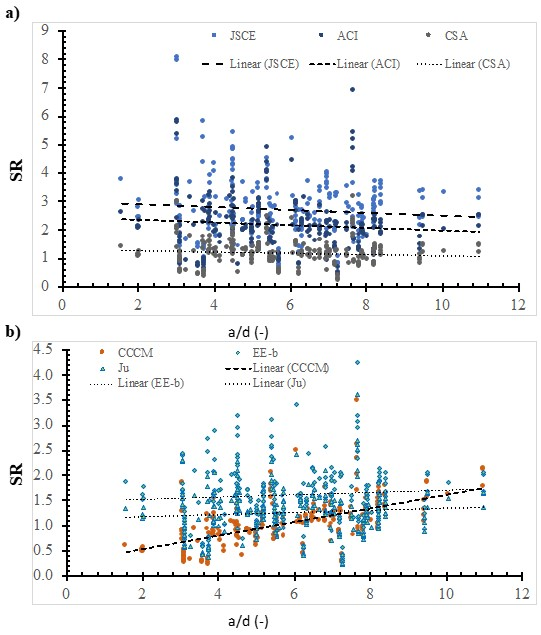
7.6. Shear Span-to-Depth Ratio
8. Future Research
- Experimental testing of high strength slabs with a compressive strength of more than 45 MPa;
- Experimental testing of ultra-high-performance concrete slabs with a compressive strength of more than 100 MPa;
- Experimental testing of non-slender concrete slabs with a shear span-to-depth ratio of less than 2.5;
- Reliability-based analysis for the safety of the design which includes the variability in the loads, the geometry, the material, and the construction;
- A more reliable and consistent mechanically based model that makes physical sense, while being simple in its design.
9. Conclusions
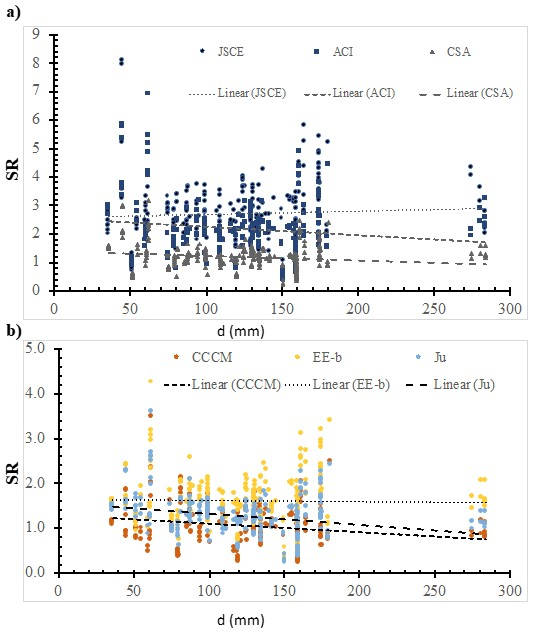
- The JSCE, the ACI, the H models are over-conservative, with an average value of 2.71, 2.18, and 2.16, respectively. The Zg, the EE-b, the Ju, the A models are more consistent with respect to other models, where the coefficient of variation value was 35%, 35%, 36%, and 36%, respectively.
- The ACI model is the least consistent with respect to the size effect, the dowel action, and the depth-to-control perimeter ratio. This could be due to the fact that the ACI model does not consider these factors in the model.
- The EE-b model is the most consistent with respect to size effect, concrete compressive strength, depth-to-control perimeter ratio, and the shear span-to-depth ratio. This is because of it using experimentally observed behavior as well as it being based on mechanical bases.
Author Contributions
Funding
Institutional Review Board Statement
Informed Consent Statement
Data Availability Statement
Conflicts of Interest
References
- Lu, X.; Guan, H.; Sun, H.; Li, Y.; Zuo, L. A preliminary analysis and discussion of the condominium building collapse in surfside. Front. Struct. Civ. Eng. 2021, 15, 1097–1110. [Google Scholar] [CrossRef]
- Deifalla, A. Punching shear strength and deformation for FRP-reinforced concrete slabs without shear reinforcement. Case Stud. Constr. Mater. 2022, 16, e00925. [Google Scholar] [CrossRef]
- Deifalla, A. Strength and Ductility of Lightweight Reinforced Concrete Slabs under Punching Shear. Structures 2020, 27, 2329–2345. [Google Scholar] [CrossRef]
- Deifalla, A. A mechanical model for concrete slabs subjected to combined punching shear and in-plane tensile forces. Eng. Struct. Elsevier 2021, 231, 111787. [Google Scholar] [CrossRef]
- Deifalla, A. A strength and deformation model for prestressed lightweight concrete slabs under two-way shear. Adv. Struct. Eng. 2021, 24, 3144–3155. [Google Scholar] [CrossRef]
- FIB. FRP Reinforcement in RC Structures, Technical Report Prepared by a Working Party of Task Group 9.3: Fib Bulletin 40; FIB: Cham, Switzerland, 2007. [Google Scholar]
- Yooprasertchai, E.; Tiawilai, Y.; Wittayawanitchai, T.; Angsumalee, J.; Joyklad, P.; Hussain, Q. Effect of Shape, Number, and Location of Openings on Punching Shear Capacity of Flat Slabs. Buildings 2021, 11, 484. [Google Scholar] [CrossRef]
- Wu, L.; Huang, T.; Tong, Y.; Liang, S. A Modified Compression Field Theory Based Analytical Model of RC Slab-Column Joint without Punching Shear Reinforcement. Buildings 2022, 12, 226. [Google Scholar] [CrossRef]
- Bywalski, C.; Drzazga, M.; Kamiński, M.; Kaźmierowski, M. A New Proposal for the Shear Strength Prediction of Beams Longitudinally Reinforced with Fiber-Reinforced Polymer Bars. Buildings 2020, 10, 86. [Google Scholar] [CrossRef]
- Ebid, A.; Deifalla, A. Prediction of Shear Strength of FRP Reinforced Beams with and Without Stirrups Using (GP) Technique. Ain Shams Eng. J. Elsevier 2021, 12, 2493–2510. [Google Scholar] [CrossRef]
- Ali, A.H.; Mohamed, H.M.; Chalioris, C.E.; Deifalla, A. Evaluation of the shear design equations of FRP-reinforced concrete beams without shear reinforcement. Eng. Struct. 2021, 235, 112017. [Google Scholar] [CrossRef]
- Hassan, M.M.; Deifalla, A. Evaluating the new CAN/CSA-S806-12 torsion provisions for concrete beams with FRP reinforcements. Mater. Struct. 2015, 49, 2715–2729. [Google Scholar] [CrossRef]
- Deifalla, A. Torsional Behavior of Rectangular and Flanged concrete beams with FRP. J. Struct. Eng. ASCE 2015, 141, 04015068. [Google Scholar] [CrossRef]
- Deifalla, A.; Khali, M.S.; Abdelrahman, A. Simplified Model for the Torsional Strength of Concrete Beams with GFRP Stirrups. Compos. Constr. ASCE 2015, 19, 04014032. [Google Scholar] [CrossRef]
- Deifalla, A.; Hamed, M.; Saleh, A.; Ali, T. Exploring GFRP bars as reinforcement for rectangular and L-shaped beams subjected to significant torsion: An experimental study. Eng. Struct. 2014, 59, 776–786. [Google Scholar] [CrossRef]
- Elmeligy, O.; El-Nemr, A.; Deifalla, A. Reevaluating the Modified Shear Provision of CAN/CSA S806-12 for Concrete Beams Reinforced with FRP Stirrups. In Proceedings of the AEI Conference ASCE, Oklahoma City, OK, USA, 11–13 April 2017. [Google Scholar]
- Deifalla, A. Refining the Torsion Design of Fibered Concrete Beams Reinforced with FRP using Multi-variable Non-linear Regression Analysis for Experimental Results. Eng. Struct. Elsevier 2021, 224, 111394. [Google Scholar] [CrossRef]
- Deifalla, A.F.; Zapris, A.G.; Chalioris, C.E. Multivariable Regression Strength Model for Steel Fiber-Reinforced Concrete Beams under Torsion. Materials 2021, 14, 3889. [Google Scholar] [CrossRef]
- Kuchma, D.; Wei, S.; Sanders, D.; Belarbi, A.; Novak, L. The development of the one-way shear design provisions of ACI 318-19. ACI Struct. J. 2019, 116, 285–296. [Google Scholar] [CrossRef]
- Collins, M.P. Evaluation of Shear Design Procedures for Concrete Structures; A CSA Technical Committee Reinforced Concrete Design Report; Canadian Standards Association: Toronto, ON, Canada, 2001. [Google Scholar]
- Gardner, N.J. Relationship of the punching shear capacity of reinforced concrete slabs with concrete strength. ACI Struct. J. 1990, 87, 66–71. [Google Scholar]
- JSCE. Recommendation for Design and Construction of Concrete Structures Using Continuous Fiber Reinforcing Materials; Machida, A., Ed.; Concrete Engineering Series 23; Japan Society of Civil Engineers: Tokyo, Japan, 1997; p. 325. [Google Scholar]
- El-Ghandour, A.W.; Pilakoutas, K.; Waldron, P. Punching shear behavior of fiber reinforced polymers reinforced concrete flat slabs: Experimental study. J. Compos. Constr. 2003, 7, 258–265. [Google Scholar] [CrossRef]
- Matthys, S.; Taerwe, L. Concrete slabs reinforced with FRP grids. II: Punching resistance. J. Compos. Constr. ASCE 2000, 4, 154–161. [Google Scholar] [CrossRef]
- Ospina, C.E.; Alexander, S.D.B.; Cheng, J.J.R. Punching of two- way slabs with fiber-reinforced polymer reinforcing bars or grids. ACI Struct. J. 2003, 100, 589–598. [Google Scholar]
- Zaghloul, A.; Razaqpur, A. Punching shear behavior of CFRP reinforced concrete flat plates. In Proceedings of the International Conference on Composites in Construction, Sydney, Australia, 22–25 June 2003; Volume 2003, pp. 1–726. [Google Scholar]
- Jacobson, D.A.; Bank, L.C.; Oliva, M.G.; Russel, J.S. Punching Shear Capacity of Double Layer FRP Grid Reinforced Slabs; ACI, Specs Publication. SP: Farmington Hills, MI, USA, 2005; pp. 230–249, 857–876. [Google Scholar]
- ACI 440.1R-15; Guide for the Design and Construction of Concrete Reinforced with FRP Bars (ACI 440.1R-15). ACI: Farmington Hills, MI, USA, 2015.
- El-Gamal, S.; El-Salakawy, E.; Benmokrane, B. Behaviour of Concrete Bridge Deck Slabs Reinforced with Fiber-Reinforced Polymer Bars Under Concentrated Loads. ACI Struct. J. 2005, 102, 727–735. [Google Scholar]
- Zhang, Q. Behaviour of Two-way Slabs Reinforced with CFRP Bars. Master’s Thesis, Memorial University of Newfoundland, St. John’s, NF, Canada, 2006. [Google Scholar]
- Zhang, Q.; Marzouk, H.; Hussein, A. A preliminary study of high-strength concrete two-way slabs reinforced with GFRP bars. In Proceedings of the 33rd CSCE Annual Conference: General Conference and International History Symposium CSCE, Toronto, ON, Canada, 2–4 June 2005. [Google Scholar]
- Theodorakopoulos, D.D.; Swamy, R.N. Analytical model to predict punching shear strength of FRP-reinforced concrete flat slabs. ACI Struct. J. 2007, 104, 257–266. [Google Scholar]
- CAN/CSA S806-12; Design and Construction of Building Structures with Fiber Reinforced Polymers (CAN/CSA S806-12). Canadian Standards Association: Rexdale, ON, Canada, 2012.
- Nguyen-Minh, L.; Rovnak, M. Punching-Shear Resistance of Interior GFRP Reinforced Slab-Column Connection. ASCE J. Compos. Constr. 2013, 17, 2–13. [Google Scholar] [CrossRef]
- Hassan, M.; Fam, A.; Benmokrane, B. A new punching shear design formula for frp-reinforced interior slab-column connections. In Proceedings of the 7th International Conference on Advanced Composite Materials in Bridges and Structures, Vancouver, BC, Canada, 22–24 August 2016. [Google Scholar]
- Kara, I.F.; Sinani, B. Prediction of Punching Shear Capacity of Two-Ways FRP Reinforced Concrete Slabs. Int. J. Bus. Technol. 2017, 5, 57–63. [Google Scholar] [CrossRef]
- Oller, E.; Kotynia, R.; Marí, A. Assessment of the existing formulations to evaluate shear-punching strength in RC slabs with FRP bars without transverse reinforcement. In High Tech Concrete: Where Technology and Engineering Meet; Springer: Cham, Switzerland, 2018. [Google Scholar] [CrossRef]
- Marí, A.; Bairán, J.; Cladera, A.; Oller, E.; Ribas, C. Shear-flexural strength mechanical model for the design and assessment of reinforced concrete beams. Struct. Infrastruct. Eng. 2015, 11, 1399–1419. [Google Scholar] [CrossRef]
- Hemzah, S.A.; Al-Obaidi, S.; Salim, T. Punching Shear Model for Normal and High-Strength Concrete Slabs Reinforced with CFRP or Steel Bars. Jordan J. Civ. Eng. 2019, 13, 250–268. [Google Scholar]
- El-Gendy, M.G.S.; El-Salakawy, E.F. Assessment of Punching Shear Design Models for FRP-RC Slab–Column Connections. J. Compos. Constr. 2020, 24, 04020047. [Google Scholar] [CrossRef]
- Ju, M.; Ju, J.; Sim, J.W. A new formula of punching shear strength for fiber reinforced polymer (FRP) or steel reinforced two-way concrete slabs. Compos. Struct. 2021, 258, 113471. [Google Scholar] [CrossRef]
- Alrudaini, T.M.S. A rational formula to predict punching shear capacity at interior columns connections with RC flat slabs reinforced with either steel or FRP bars but without shear reinforcement. Structures 2022, 37, 56–68. [Google Scholar] [CrossRef]
- Shen, Y.; Sun, J.; Liang, S. Interpretable Machine Learning Models for Punching Shear Strength Estimation of FRP Reinforced Concrete Slabs. Crystals 2022, 12, 259. [Google Scholar] [CrossRef]
- Yooprasertchai, E.; Dithaem, R.; Arnamwong, T.; Sahamitmongkol, R.; Jadekittichoke, J.; Joyklad, P.; Hussain, Q. Remediation of Punching Shear Failure Using Glass Fiber Reinforced Polymer (GFRP) Rods. Polymers 2021, 13, 2369. [Google Scholar] [CrossRef] [PubMed]
- Ahmad, H.S.; Zia, P.; Yu, T.J.; Xie, Y. Punching shear tests of slabs reinforced with 3-dimensional carbon fiber fabric. Concr. Int. 1993, 16, 36–41. [Google Scholar]
- Banthia, N.; Al-Asaly, M.; Ma, S. Behavior of Concrete Slabs Reinforced with Fiber-Reinforced Plastic Grid. ASCE J. Mater. Civ. Eng. 1995, 7, 252–257. [Google Scholar] [CrossRef]
- Bank, L.; Xi, Z. Punching shear behavior of pultruded FRP grating reinforced concrete slabs. In Proceedings of the Non-Metallic (FRP) Reinforcement for Concrete Structures; CRC Press: Boca Raton, FL, USA, 1995; pp. 360–367. [Google Scholar]
- Louka, H.J. Punching Behavior of a Hybrid Reinforced Concrete Bridge Deck. Master’s Thesis, University of Manitoba, Winnipeg, MB, Canada, 1999. [Google Scholar]
- Rahman, A.H.; Kingsley, C.Y.; Kobayashi, K. Service and ultimate load behavior of bridge deck reinforced with carbon FRP grid. J. Compos. Constr. 2000, 4, 16–23. [Google Scholar] [CrossRef]
- Hassan, T.; Abdelrahman, A.; Tadros, G.; Rizkalla, S. Fibre reinforced polymer reinforcing bars for bridge decks. Can. J. Civ. Eng. 2000, 27, 839–849. [Google Scholar] [CrossRef]
- Khanna, O.; Mufti, A.; Bakht, B. Experimental investigation of the role of reinforcement in the strength of concrete deck slabs. Can. J. Civil. Eng. 2000, 27, 475–480. [Google Scholar] [CrossRef]
- Hussein, A.; Rashid, I.; Benmokrane, B. Two-way concrete slabs reinforced with GFRP bars. In Proceedings of the 4th International Conference on Advanced Composite Materials in Bridges and Structures CSCE, Calgary, AB, Canada, 20–23 July 2004. [Google Scholar]
- Tom, E.E. Behavior of Two-Way Slabs Reinforced with GFRP Bars. Master’s Thesis, Memorial University of Newfoundland, St. John’s, NF, Canada, 2007; p. 169. [Google Scholar]
- Zaghloul, A. Punching Shear Strength of Interior and Edge Column Slab Connections in CFRP Rein-forced Flat Plate Structures Transferring Shear and Moment. Ph.D. Thesis, Department of Civil and Environmental Engineering, Carleton University, Ottawa, ON, Canada, 2007. [Google Scholar]
- El-Gamal, S.; El-Salakawy, E.; Benmokrane, B. Influence of reinforcement on the behaviour of concrete bridge deck slabs reinforced with FRP bars. J. Compos. Constr. ASCE 2007, 11, 449–458. [Google Scholar] [CrossRef]
- Zaghloul, E.; Mahmoud, Z.; Salama, T. Punching behavior and strength of two-way concrete slabs reinforced with glass fiber reinforced polymer (GFRP) rebars. In Proceedings of the Structural Composites for Infrastructure Applications, Hurghada, Egypt, 23–28 May 2008. [Google Scholar]
- Lee, J.H.; Yoon, Y.S.; Cook, W.D.; Mitchell, D. Improving punching shear behavior of glass fiber-reinforced polymer rein- forced slabs. ACI Struct. J. 2009, 106, 427–434. [Google Scholar]
- Zhu, H.; Zhang, Y.; Gao, D.; Xiao, Z. Deformation Behavior of Concrete Two-Way Slabs Reinforced with BFRP Bars Subjected to Eccentric Loading. In Proceedings of the CICE 2010: The 5th International Conference on FRP Composites in Civil Engineering, Beijing, China, 27–29 September 2010. [Google Scholar]
- Min, K.H.; Yang, J.M.; Yoo, D.Y.; Yoon, Y.S. Flexural and Punching Performances of FRP and Fiber Reinforced Concrete on Impact Loading. In Proceedings of the CICE 2010–The 5th International Conference on FRP Composites in Civil Engineering, Beijing, China, 27–29 September 2010. [Google Scholar]
- Xiao, Z. Expremental Study on Two-Way Concrete Slab Subjected to Punching Shear. Master’s Thesis, Zhengzhou University, Zhengzhou, China, 2010. [Google Scholar]
- Bouguerra, K.; Ahmed, E.A.; El-Gamal, S.; Benmokrane, B. Testing of full-scale concrete bridge deck slabs reinforced with fiber-reinforced polymer (FRP) bars. Constr. Build. Mater. 2011, 25, 3956–3965. [Google Scholar] [CrossRef]
- Zhu, H.Y.; Wang, J.L. Plastic analysis on punching shear capacity of two-way BFRP rebar reinforced concrete slabs under central concentrated load. J. Zhengzhou Univ. (Eng. Sci.) 2012, 33, 1–5. (In Chinese) [Google Scholar]
- El-gendy, M.; El-Salakawy, E. Punching Shear Behaviour of GFRP-RC Edge Slab-Column Connections. In Proceedings of the 7th International Conference on FRP Composites in Civil Engineering, Vancouver, BC, Canada, 20–22 August 2014; pp. 1–6. [Google Scholar]
- Tharmarajah, G.; Taylor, E.S.; Cleland, J.D.; Robinso, D. Corrosion-resistant FRP reinforcement for bridge deck slabs. In Proceedings of the Institution of Civil Engineers. Bridge Engineering; ICE Publishing: London, UK, 2015; Volume 168, pp. 208–217. [Google Scholar] [CrossRef]
- Mostafa, A. Punching Shear Behavior of GFRP-RC Slab-Column Edge Connections with High Strength Concrete and Shear Reinforcement. Master’s Thesis, Manitoba University, Winnipeg, MB, Canada, 2016; p. 51. [Google Scholar]
- Fareed, E.; Ahmed, E.A.; Benmokrane, B. Experimental Testing WMCAUS IOP Conference Series: Materials Science and Engineering; IOP Publishing: Bristol, UK, 2016; p. 32064. [Google Scholar] [CrossRef]
- Gouda, A.; El-Salakawy, E. Behavior of GFRP-RC Interior Slab-Column Connections with Shear Studs and High-Moment Transfer. J. Compos. Constr. 2016, 20, 04016005. [Google Scholar] [CrossRef]
- Gouda, A.; El-Salakawy, E. Punching Shear Strength of GFRPRC Interior Slab-Column Connections Subjected to Moment Transfer. J. Compos. Constr. ASCE 2016, 20, 04015037. [Google Scholar] [CrossRef]
- Oskouei, A.V.; Kivi, M.P.; Araghi, H.; Bazli, M. Experimental study of the punching behavior of GFRP reinforced lightweight concrete footing. Mater. Struct. 2017, 50, 256. [Google Scholar] [CrossRef]
- Abduljaleel, M.T.; Mahmoud, A.S.; Yousif, A. Experimental investigation of two-way concrete slabs with openings reinforced with glass fiber reinforced polymer bars. J. Eng. Sci. Technol. 2017, 12, 889–912. [Google Scholar]
- Ju, M.; Park, K.; Park, A.C. Punching Shear Behavior of Two-Way Concrete Slabs Reinforced with Glass-Fiber-Reinforced Polymer (GFRP) Bars. Polymers 2018, 10, 893. [Google Scholar] [CrossRef] [Green Version]
- Hussein, A.F.; El-Salakawy, E. Punching Shear Behavior of Glass Fiber-Reinforced Polymer-Reinforced Concrete Slab-Column Interior Connections. ACI Struct. J. 2018, 115, 1075–1088. [Google Scholar] [CrossRef]
- Salama, A.E.; Hassan, M.; Benmokrane, A.B. Effectiveness of Glass Fiber-Reinforced Polymer Stirrups as Shear Reinforcement in Glass Fiber-Reinforced Polymer- Reinforced Concrete Edge Slab-Column Connections. ACI Struct. J. 2019, 116, 165–180. [Google Scholar] [CrossRef]
- Eladawy, B.; Hassan, M.; Benmokrane, B. Experimental Study of Interior Glass Fiber-Reinforced Polymer-Reinforced Concrete Slab-Column Connections under Lateral Cyclic Load. ACI Struct. J. 2019, 116, 165–180. [Google Scholar] [CrossRef]
- Gu, S. Study on The Punching Shear Behavior of FRP Reinforced Concrete Slabs Subjected to Concentric Loading. Master’s Thesis, Zhejiang University of Technology, Zhejiang, China, 2020. [Google Scholar]
- Zhou, X. Expremental Study on the Punching Shear Behavior of Square GFRP Reinforced Concrete Slabs. Master’s Thesis, Zhejiang University of Technology, Zhejiang, China, 2020. [Google Scholar]
- Eladawy, M.; Hassan, M.; Benmokrane, B.; Ferrier, E. Lateral cyclic behavior of interior two-way concrete slab–column connections reinforced with GFRP bars. Eng. Struct. 2020, 209, 109978. [Google Scholar] [CrossRef]
- Huang, Z.; Zhao, Y.; Zhang, J.; Wu, Y. Punching shear behavior of concrete slabs reinforced with CFRP grids. Structures 2020, 26, 617–625. [Google Scholar] [CrossRef]
- Salama, A.E.; Hassan, M.; Benmokrane, B. Punching-Shear Behavior of Glass Fiber-Reinforced Polymer-Reinforced Concrete Edge Column-Slab Connections: Experimental and Analytical Investigations. ACI Struct. J. 2021, 118, 147–160. [Google Scholar]
- AlHamaydeh, M.; Orabi, M.A. Punching Shear Behavior of Synthetic Fiber–Reinforced Self-Consolidating Concrete Flat Slabs with GFRP Bars. J. Compos. Constr. 2021, 25, 04021029. [Google Scholar] [CrossRef]
- Mohmmad, S.H.; Gülsan, M.E.; Çevik, A. Punching shear behaviour of geopolymer concrete two-way slabs reinforced by FRP bars under monotonic and cyclic loadings. Adv. Struct. Eng. 2022, 25, 453–472. [Google Scholar] [CrossRef]
- Shill, S.; Garcez, E.; Al-Ameri, R.; Subhani, M. Performance of Two-Way Concrete Slabs Reinforced with Basalt and Carbon FRP Rebars. J. Compos. Sci. 2022, 6, 74. [Google Scholar] [CrossRef]
- ACI 318-19; Building Code Requirements for Structural Concrete: (ACI 318-19) and Commentary. American Concrete Institute: Farmington Hills, MI, USA, 2019.


| Design Model | Critical Perimeter Location | Size Effect | Dowel Action | Young’s Modulus | Concrete Strength | Control Perimeter-to-Depth Ratio | Compression Zone Depth | Shear Span-to -Depth Ratio |
|---|---|---|---|---|---|---|---|---|
| G | 1.5 d | ------ | ------ | ------ | ------ | |||
| JSCE | 0.5 d | ------ | ------ | |||||
| Gd | 1.5 d | ------ | ------ | ------ | ||||
| MT | 1.5 d | ------ | ------ | ------ | ||||
| O | 1.5 d | ------ | ------ | ------ | ------ | |||
| Z | 0.5 d | ------ | ------ | ------ | ||||
| Jb | 1.5 d | ------ | ------ | ------ | ------ | |||
| ACI | 0.5 d | ------ | ------ | ------ | ------ | ------ | ||
| EG | 0.5 d | ------ | ------ | ------ | ||||
| Zg | 1.5 d | ------ | ------ | ------ | ||||
| TS | 0.5 d | ------ | ------ | ------ | ------ | ------ | ||
| CSA | 0.5 d | ------ | ------ | ------ | ||||
| NR | 0.5 d | ------ | ------ | |||||
| H | 0.5 d | ------ | ------ | |||||
| KS | 1.5 d | ------ | ------ | ------ | ------ | |||
| CCCM | 0.5 d | ------ | ||||||
| Hz | 0.5 d | ------ | ------ | ------ | ------ | |||
| EE-(a) | 0.5 d | ------ | ------ | ------ | ||||
| EE-(b) | 0.5 d | ------ | ------ | |||||
| Ju | 0.5 d | ------ | ------ | ------ | ||||
| A | 0.5 d | ------ | ------ | ------ |
| Year of Study | Specimen Label | A (mm) | B (mm) | b (mm) | c (mm) | d (mm) | fc’ (MPa) | FRP Type | E (GPa) | V (kN) | # | |
|---|---|---|---|---|---|---|---|---|---|---|---|---|
| 1993 | CFRC-SN1 | 690 | 690 | 75 | 75 | 61 | 42.4 | CFRP | 0.95 | 113 | 93 | [45] |
| CFRC-SN2 | 690 | 690 | 75 | 75 | 61 | 44.6 | CFRP | 0.95 | 113 | 78 | ||
| CFRC-SN3 | 690 | 690 | 100 | 100 | 61 | 39 | CFRP | 0.95 | 113 | 96 | ||
| CFRC-SN4 | 690 | 690 | 100 | 100 | 61 | 36.6 | CFRP | 0.95 | 113 | 99 | ||
| 1995 | 1 | 600 | 600 | 100 | 100 | 55 | 41 | CFRP | 0.31 | 100 | 65 | [46] |
| 2 | 600 | 600 | 100 | 100 | 55 | 52.9 | CFRP | 0.31 | 100 | 61 | ||
| 3 | 600 | 600 | 100 | 100 | 55 | 41.5 | CFRP | 0.31 | 100 | 72 | ||
| 1995 | 1 | 1800 | 1500 | 250 | 250 | 76 | 30 | CFRP | 2.05 | 143 | 186 | [47] |
| 2 | 1800 | 1500 | 250 | 250 | 76 | 30 | CFRP | 2.05 | 143 | 179 | ||
| 3 | 1800 | 1500 | 250 | 250 | 76 | 30 | CFRP | 1.81 | 143 | 199 | ||
| 4 | 1800 | 1500 | 250 | 250 | 76 | 30 | CFRP | 2.05 | 156 | 198 | ||
| 5 | 1800 | 1500 | 250 | 250 | 76 | 30 | CFRP | 1.81 | 156 | 201 | ||
| 6 | 1800 | 1500 | 250 | 250 | 76 | 30 | CFRP | 1.49 | 156 | 190 | ||
| 1999 | 1 | 3000 | 1800 | 575 | 225 | 175 | 43 | GFRP | 1 | 41.3 | 500 | [48] |
| 2 | 3000 | 1800 | 575 | 225 | 175 | 43 | GFRP | 1 | 41.3 | 1050 | ||
| 3 | 3000 | 1800 | 575 | 225 | 175 | 43 | GFRP | 1 | 39.3 | 875 | ||
| 4 | 3000 | 1800 | 575 | 225 | 175 | 43 | GFRP | 1 | 39.3 | 1090 | ||
| 5 | 3000 | 1800 | 575 | 225 | 175 | 43 | GFRP | 1 | 39.3 | 1180 | ||
| C1 | 3000 | 1800 | 575 | 225 | 175 | 55 | CFRP | 1 | 100 | 1000 | ||
| C2 | 3000 | 1800 | 575 | 225 | 175 | 55 | CFRP | 1 | 100 | 1200 | ||
| C3 | 3000 | 1800 | 575 | 225 | 175 | 55 | CFRP | 1 | 100 | 1328 | ||
| H2 | 3000 | 1800 | 575 | 225 | 175 | 45 | Hybrid | 1 | 160 | 1055 | ||
| H4 | 3000 | 1800 | 575 | 225 | 175 | 45 | Hybrid | 1 | 160 | 1096 | ||
| H5 | 3000 | 1800 | 575 | 225 | 175 | 45 | Hybrid | 1 | 160 | 1183 | ||
| 2000 | C1 | 1000 | 1000 | 150 | 150 | 96 | 37.3 | CFRP | 0.27 | 91.8 | 181 | [24] |
| C1’ | 1000 | 1000 | 230 | 230 | 95 | 35.7 | CFRP | 0.27 | 91.8 | 189 | ||
| C2 | 1000 | 1000 | 150 | 150 | 95 | 36.3 | CFRP | 1.05 | 95 | 255 | ||
| C2’ | 1000 | 1000 | 230 | 230 | 95 | 36.3 | CFRP | 1.05 | 95 | 273 | ||
| C3 | 1000 | 1000 | 150 | 150 | 126 | 33.8 | CFRP | 0.52 | 92 | 347 | ||
| C3’ | 1000 | 1000 | 230 | 230 | 126 | 34.3 | CFRP | 0.52 | 92 | 343 | ||
| CS | 1000 | 1000 | 150 | 150 | 95 | 32.6 | CFRP | 0.19 | 148 | 142 | ||
| CS’ | 1000 | 1000 | 230 | 230 | 95 | 33.2 | CFRP | 0.19 | 148 | 150 | ||
| H1 | 1000 | 1000 | 150 | 150 | 95 | 118 | HFRP | 0.62 | 37.3 | 207 | ||
| H2 | 1000 | 1000 | 150 | 150 | 89 | 35.8 | HFRP | 3.76 | 40.7 | 231 | ||
| H2’ | 1000 | 1000 | 80 | 80 | 89 | 35.9 | HFRP | 3.76 | 40.7 | 171 | ||
| H3 | 1000 | 1000 | 150 | 150 | 122 | 32.1 | HFRP | 1.22 | 44.8 | 237 | ||
| H3’ | 1000 | 1000 | 80 | 80 | 122 | 32.1 | HFRP | 1.22 | 44.8 | 217 | ||
| 2000 | 1 | 2000 | 2500 | 250 | 150 | 162 | 42 | GFRP | 0.28 | 85 | 622 | [49] |
| 2 | 2000 | 2500 | 250 | 150 | 162 | 42 | GFRP | 0.28 | 85 | 698 | ||
| 3 | 2000 | 2500 | 250 | 150 | 162 | 42 | GFRP | 0.28 | 85 | 575 | ||
| 4 | 2000 | 2500 | 250 | 150 | 162 | 42 | GFRP | 0.28 | 85 | 534 | ||
| 5 | 2000 | 2500 | 250 | 150 | 162 | 42 | GFRP | 0.28 | 85 | 584 | ||
| 2000 | 1 | 1800 | 3000 | 575 | 225 | 165 | 59 | CFRP | 0.57 | 147 | 1000 | [50] |
| 2 | 1800 | 3000 | 575 | 225 | 165 | 59 | CFRP | 0.57 | 147 | 1200 | ||
| 3 | 1800 | 3000 | 575 | 225 | 165 | 59 | CFRP | 0.57 | 147 | 1328 | ||
| 2000 | 1 | 2000 | 4000 | 500 | 250 | 138 | 35 | GFRP | 2.4 | 42 | 756 | [51] |
| 2003 | SG1 | 2000 | 2000 | 200 | 200 | 142 | 33.3 | GFRP | 0.22 | 45 | 170 | [23] |
| SC1 | 2000 | 2000 | 200 | 200 | 142 | 34.7 | CFRP | 0.18 | 110 | 229 | ||
| SG2 | 2000 | 2000 | 200 | 200 | 142 | 46.6 | GFRP | 0.47 | 45 | 271 | ||
| SG3 | 2000 | 2000 | 200 | 200 | 142 | 30.3 | GFRP | 0.47 | 45 | 237 | ||
| SC2 | 2000 | 2000 | 200 | 200 | 142 | 29.6 | CFRP | 0.43 | 110 | 317 | ||
| 2003 | GFR-1 | 2150 | 2150 | 250 | 250 | 120 | 29.5 | GFRP | 0.73 | 34 | 217 | [25] |
| GFR-2 | 2150 | 2150 | 250 | 250 | 120 | 28.9 | GFRP | 1.46 | 34 | 260 | ||
| NEF-1 | 2150 | 2150 | 250 | 250 | 120 | 37.5 | GFRP | 0.87 | 28.4 | 206 | ||
| 2003 | ZJF5 | 1760 | 1760 | 250 | 250 | 75 | 45 | CFRP- | 1 | 100 | 234 | [26] |
| 2004 | G-S1 | 1830 | 1830 | 250 | 250 | 100 | 40 | GFRP | 1.18 | 42 | 249 | [52] |
| G-S2 | 1830 | 1830 | 250 | 250 | 100 | 35 | GFRP | 1.05 | 42 | 218 | ||
| G-S3 | 1830 | 1830 | 250 | 250 | 100 | 29 | GFRP | 1.67 | 42 | 240 | ||
| G-S4 | 1830 | 1830 | 250 | 250 | 100 | 26 | GFRP | 0.95 | 42 | 210 | ||
| 2005 | 1 | 2300 | 2000 | 635 | 250 | 175 | 27.6 | GFRP | 0.98 | 33 | 537 | [27] |
| 2 | 2300 | 2000 | 635 | 250 | 175 | 27.6 | GFRP | 0.98 | 33 | 536 | ||
| 3 | 2300 | 2000 | 635 | 250 | 175 | 27.6 | GFRP | 0.95 | 33 | 531 | ||
| 7 | 2000 | 2000 | 635 | 250 | 175 | 27.6 | GFRP | 0.98 | 33 | 721 | ||
| 8 | 2000 | 2000 | 635 | 250 | 175 | 27.6 | GFRP | 0.98 | 33 | 897 | ||
| 2005 | G-S1 | 3000 | 2500 | 600 | 250 | 159 | 49.6 | GFRP | 1 | 44.6 | 740 | [29] |
| G-S2 | 3000 | 2500 | 600 | 250 | 159 | 44.3 | GFRP | 1.99 | 38.5 | 712 | ||
| G-S3 | 3000 | 2500 | 600 | 250 | 159 | 49.2 | GFRP | 1.21 | 46.5 | 732 | ||
| C-S1 | 3000 | 2500 | 600 | 250 | 165 | 49.6 | CFRP | 0.35 | 122.5 | 674 | ||
| C-S2 | 3000 | 2500 | 600 | 250 | 165 | 44.3 | CFRP | 0.69 | 122.5 | 799 | ||
| 2005 | GS2 | 1830 | 1830 | 250 | 250 | 100 | 35 | GFRP | 1.05 | 42 | 218 | [31] |
| GSHS | 1830 | 1830 | 250 | 250 | 100 | 71 | GFRP | 1.18 | 42 | 275 | ||
| 2006 | CS1 | 1900 | 1900 | 250 | 250 | 100 | 31 | CFRP | 0.41 | 120 | 251 | [30] |
| CS2 | 1900 | 1900 | 250 | 250 | 100 | 33 | CFRP | 0.54 | 120 | 293 | ||
| CS3 | 1900 | 1900 | 250 | 250 | 100 | 25.7 | CFRP | 0.75 | 120 | 285 | ||
| CSHD1 | 1900 | 1900 | 250 | 250 | 100 | 35.9 | CFRP | 0.54 | 120 | 325 | ||
| CSHD2 | 1900 | 1900 | 250 | 250 | 100 | 38.6 | CFRP | 0.75 | 120 | 360 | ||
| CSHS1 | 1900 | 1900 | 250 | 250 | 150 | 85.6 | CFRP | 0.36 | 120 | 399 | ||
| CHSHS2 | 1900 | 1900 | 250 | 250 | 150 | 98.3 | CFRP | 0.5 | 120 | 446 | ||
| 2007 | 1 | 1900 | 1900 | 250 | 250 | 110 | 70 | GFRP | 1 | 41 | 282 | [53] |
| 2 | 1900 | 1900 | 250 | 250 | 110 | 70 | GFRP | 1.2 | 41 | 319 | ||
| 3 | 1900 | 1900 | 250 | 250 | 110 | 70 | GFRP | 1.5 | 41 | 384 | ||
| 4 | 1900 | 1900 | 250 | 250 | 160 | 70 | GFRP | 1.2 | 41 | 589 | ||
| 5 | 1900 | 1900 | 250 | 250 | 145 | 70 | GFRP | 1.2 | 41 | 487 | ||
| 6 | 1900 | 1900 | 250 | 250 | 135 | 70 | GFRP | 1.2 | 41 | 437 | ||
| 2007 | ZJEF1 | 1760 | 1000 | 250 | 250 | 120 | 25 | CFRP | 1.37 | 100 | 188 | [54] |
| ZJEF2 | 1760 | 1000 | 250 | 250 | 120 | 27 | CFRP | 0.94 | 100 | 156 | ||
| ZJEF3 | 1760 | 1000 | 250 | 250 | 120 | 55 | CFRP | 1.37 | 100 | 211 | ||
| ZJEF5 | 1760 | 1000 | 250 | 250 | 81 | 28 | CFRP | 1.37 | 100 | 97 | ||
| ZJEF7 | 1760 | 1000 | 450 | 250 | 120 | 26 | CFRP | 1.37 | 100 | 196 | ||
| ZJF8 | 1760 | 1760 | 350 | 250 | 101 | 28 | CFRP | 1.48 | 100 | 178 | ||
| ZJF9 | 1760 | 1760 | 250 | 250 | 100 | 57.6 | CFRP | 1.48 | 100 | 272 | ||
| 2007 | G-S4 | 3000 | 2500 | 600 | 250 | 156 | 44.1 | GFRP | 1.2 | 44.5 | 707 | [55] |
| G-S5 | 3000 | 2500 | 600 | 250 | 156 | 44.1 | GFRP | 1.2 | 44.5 | 735 | ||
| 2008 | F1 | 1200 | 1200 | 200 | 200 | 82 | 37.4 | GFRP | 1.1 | 46 | 165 | [56] |
| F2 | 1200 | 1200 | 200 | 200 | 112 | 33 | GFRP | 0.81 | 46 | 170 | ||
| F3 | 1200 | 1200 | 200 | 200 | 82 | 38.2 | GFRP | 1.29 | 46 | 210 | ||
| F4 | 1200 | 1200 | 200 | 200 | 82 | 39.7 | GFRP | 1.54 | 46 | 230 | ||
| 2009 | GFU1 | 2300 | 2300 | 225 | 225 | 110 | 36.3 | GFRP | 1.17 | 48.2 | 222 | [57] |
| GFB2 | 2300 | 2300 | 225 | 225 | 110 | 36.3 | GFRP | 2.14 | 48.2 | 246 | ||
| GFB3 | 2300 | 2300 | 225 | 225 | 110 | 36.3 | GFRP | 3 | 48.2 | 248 | ||
| GFBF3 | 2300 | 2300 | 225 | 225 | 110 | 33.8 | GFRP | 3 | 48.2 | 330 | ||
| 2010 | S3 | 1500 | 1500 | 150 | 150 | 135 | 33.5 | BFRP | 0.29 | 100 | 145 | [58] |
| S4 | 1500 | 1500 | 150 | 150 | 135 | 35.6 | BFRP | 0.55 | 100 | 275 | ||
| S5 | 1500 | 1500 | 150 | 150 | 135 | 32.8 | BFRP | 0.42 | 100 | 235 | ||
| S6 | 1500 | 1500 | 150 | 150 | 135 | 32.5 | BFRP | 0.42 | 100 | 225 | ||
| S7 | 1500 | 1500 | 150 | 150 | 135 | 22.6 | BFRP | 0.42 | 100 | 170 | ||
| S8 | 1500 | 1500 | 150 | 150 | 135 | 41.8 | BFRP | 0.42 | 100 | 235 | ||
| S9 | 1500 | 1500 | 150 | 150 | 135 | 40.6 | BFRP | 0.42 | 100 | 200 | ||
| 2010 | NC-G-45 | 300 | 300 | 25 | 25 | 45 | 47.8 | GFRP | 0.78 | 76 | 44 | [59] |
| NC-G-0/90 | 300 | 300 | 25 | 25 | 45 | 47.8 | GFRP | 0.78 | 76 | 45 | ||
| NC-C-45 | 300 | 300 | 25 | 25 | 45 | 47.8 | CFRP | 0.24 | 230 | 39 | ||
| NC-C-0/90 | 300 | 300 | 25 | 25 | 45 | 47.8 | CFRP | 0.24 | 230 | 45 | ||
| SFRC-C-45 | 300 | 300 | 25 | 25 | 45 | 47.8 | CFRP | 0.24 | 230 | 63 | ||
| UHPC-C-45 | 300 | 300 | 25 | 25 | 45 | 179 | CFRP | 0.24 | 230 | 97 | ||
| UHPC-C-0/90 | 300 | 300 | 25 | 25 | 45 | 179 | CFRP | 0.24 | 230 | 98 | ||
| 2010 | A | 1500 | 1500 | 150 | 150 | 130 | 22.16 | GFRP | 0.42 | 45.6 | 176 | [60] |
| B-2 | 1500 | 1500 | 150 | 150 | 130 | 32.46 | GFRP | 0.42 | 45.6 | 209 | ||
| B-3 | 1500 | 1500 | 150 | 150 | 130 | 32.4 | GFRP | 0.55 | 45.6 | 245 | ||
| B-4 | 1500 | 1500 | 150 | 150 | 130 | 32.8 | GFRP | 0.29 | 45.6 | 167 | ||
| B-5 | 1500 | 1500 | 150 | 150 | 130 | 33.2 | GFRP | 0.42 | 45.6 | 217 | ||
| B-6 | 1500 | 1500 | 150 | 150 | 130 | 28.32 | GFRP | 0.42 | 45.6 | 222 | ||
| B-7 | 1500 | 1500 | 150 | 150 | 130 | 46.05 | GFRP | 0.42 | 45.6 | 253 | ||
| 2011 | G200n | 3000 | 2500 | 600 | 250 | 155 | 49.1 | GFRP | 1.20 | 43 | 732 | [61] |
| G175N | 3000 | 2000 | 600 | 250 | 135 | 35.2 | GFRP | 1.20 | 43 | 484 | ||
| G150N | 3000 | 2000 | 600 | 250 | 110 | 35.2 | GFRP | 1.20 | 43 | 362 | ||
| G175h | 3000 | 2000 | 600 | 250 | 135 | 64.8 | GFRP | 1.20 | 43 | 704 | ||
| G175n0.7 | 3000 | 2000 | 600 | 250 | 135 | 53.1 | GFRP | 0.7 | 43 | 549 | ||
| G175n0.35 | 3000 | 2000 | 600 | 250 | 137 | 53.1 | GFRP | 0.35 | 43 | 506 | ||
| C175N | 3000 | 2000 | 600 | 250 | 140 | 40.3 | GFRP | 0.40 | 122 | 530 | ||
| 2012 | A | 1500 | 1500 | 150 | 150 | 130 | 22.2 | GFRP | 0.42 | 45.6 | 176 | [62] |
| B-2 | 1500 | 1500 | 150 | 150 | 130 | 32.5 | GFRP | 0.42 | 45.6 | 209 | ||
| B-3 | 1500 | 1500 | 150 | 150 | 130 | 32.4 | GFRP | 0.55 | 45.6 | 245 | ||
| B-4 | 1500 | 1500 | 150 | 150 | 130 | 32.8 | GFRP | 0.29 | 45.6 | 167 | ||
| C | 1500 | 1500 | 150 | 150 | 130 | 44.4 | GFRP | 0.42 | 45.6 | 252 | ||
| 2013 | GSL-PUNC-0.4 | 2200 | 2200 | 200 | 200 | 130 | 48.8 | GFRP | 0.48 | 48 | 180 | [34] |
| GSL-PUNC-0.5 | 2200 | 2200 | 200 | 200 | 130 | 48.8 | GFRP | 0.68 | 48 | 212 | ||
| GSL-PUNC-0.6 | 2200 | 2200 | 200 | 200 | 130 | 48.8 | GFRP | 0.92 | 48 | 244 | ||
| 2013 | G (0.7) 30/20 | 2500 | 2500 | 300 | 300 | 134 | 34.3 | GFRP | 0.71 | 48.2 | 329 | [35] |
| G (1.6) 30/20 | 2500 | 2500 | 300 | 300 | 131 | 38.6 | GFRP | 1.56 | 48.1 | 431 | ||
| G (1.6) 30/20-H | 2500 | 2500 | 300 | 300 | 131 | 75.8 | GFRP | 1.56 | 57.4 | 547 | ||
| G (1.2) 30/20 | 2500 | 2500 | 300 | 300 | 131 | 37.5 | GFRP | 1.21 | 64.9 | 438 | ||
| G (0.3) 30/35 | 2500 | 2500 | 300 | 300 | 284 | 34.3 | GFRP | 0.34 | 48.2 | 825 | ||
| G (0.7) 30/35 | 2500 | 2500 | 300 | 300 | 284 | 39.4 | GFRP | 0.73 | 48.1 | 1071 | ||
| G (1.6) 30/35 | 2500 | 2500 | 300 | 300 | 275 | 38.2 | GFRP | 1.61 | 56.7 | 1492 | ||
| G (1.6) 30/35-H | 2500 | 2500 | 300 | 300 | 275 | 75.8 | GFRP | 1.61 | 56.7 | 1600 | ||
| G(0.7) 30/20-B | 2500 | 2500 | 300 | 300 | 134 | 38.6 | GFRP | 0.71 | 48.2 | 386 | ||
| G(0.7) 45/20 | 2500 | 2500 | 300 | 300 | 134 | 44.9 | GFRP | 0.71 | 48.2 | 400 | ||
| G (1.6) 45/20-B | 2500 | 2500 | 300 | 300 | 131 | 39.4 | GFRP | 1.56 | 48.1 | 511 | ||
| G (0.3) 30/35-B | 2500 | 2500 | 300 | 300 | 284 | 39.4 | GFRP | 0.34 | 48.2 | 781 | ||
| G (0.7) 30/35-B-2 | 2500 | 2500 | 300 | 300 | 281 | 46.7 | GFRP | 0.73 | 48.1 | 1195 | ||
| G (0.3) 45/35 | 2500 | 2500 | 300 | 300 | 284 | 48.6 | GFRP | 0.34 | 48.2 | 911 | ||
| G (1.6) 30/20-B | 2500 | 2500 | 300 | 300 | 131 | 32.4 | GFRP | 1.56 | 48.1 | 451 | ||
| G (1.6) 45/20 | 2500 | 2500 | 300 | 300 | 131 | 32.4 | GFRP | 1.56 | 48.1 | 504 | ||
| G (0.7) 30/35-B-1 | 2500 | 2500 | 300 | 300 | 181 | 29.6 | GFRP | 0.73 | 48.1 | 1027 | ||
| G(0.3) 45/35-B | 2500 | 2500 | 300 | 300 | 284 | 32.4 | GFRP | 0.34 | 48.2 | 1020 | ||
| G (0.7) 45/35 | 2500 | 2500 | 300 | 300 | 281 | 29.6 | GFRP | 0.73 | 48.1 | 1248 | ||
| 2015 | GSC-0.9-XX-0.4 | 2800 | 1500 | 300 | 300 | 160 | 41 | GFRP | 0.9 | 60.505 | 251 | [63] |
| GSC-1.35-XX-0.4 | 2800 | 1500 | 300 | 300 | 160 | 41 | GFRP | 1.35 | 60.505 | 268 | ||
| GSC-1.8-XX-0.4 | 2800 | 1500 | 300 | 300 | 160 | 41 | GFRP | 1.7 | 60.505 | 277 | ||
| GSC-0.9-XX-0.2 | 2800 | 1500 | 300 | 300 | 160 | 41 | GFRP | 0.85 | 60.505 | 239 | ||
| GSC-0.9-XX-0.3 | 2800 | 1500 | 300 | 300 | 160 | 41 | GFRP | 0.9 | 60.505 | 159 | ||
| GRD-0.9-XX-0.4 | 2800 | 1500 | 300 | 300 | 160 | 41 | GFRP | 0.9 | 59.877 | 191 | ||
| 2015 | G-0.6%-12-125 T&B | 1425 | 500 | 500 | 25 | 119 | 68.1 | GFRP | 0.6 | 67.4 | 344 | [64] |
| G-0.6%-16-300 T&B | 1425 | 500 | 500 | 25 | 117 | 65.7 | GFRP | 0.6 | 67.4 | 365 | ||
| B-0.6%-12-125 T&B | 1425 | 500 | 500 | 25 | 119 | 69.3 | BFRP | 0.6 | 54 | 300 | ||
| B-0.6%-16-300 T&B | 1425 | 500 | 500 | 25 | 117 | 66.1 | BFRP | 0.6 | 54 | 295 | ||
| 2016 | GSC-0.9-XX-0.4 | 2600 | 1450 | 300 | 300 | 160 | 81 | GFRP | 0.87 | 60.505 | 251 | [65] |
| GSC-1.35-XX-0.5 | 2600 | 1450 | 300 | 300 | 160 | 85 | GFRP | 1.28 | 60.505 | 272 | ||
| GSC-1.8-XX-0.4 | 2600 | 1450 | 300 | 300 | 160 | 80 | GFRP | 1.7 | 60.505 | 288 | ||
| 2016 | S2-B | 3000 | 2000 | 600 | 250 | 160 | 48.81 | BFRP | 0.8 | 69.3 | 548 | [66] |
| S3-B | 3000 | 2000 | 600 | 250 | 160 | 42.2 | BFRP | 0.79 | 69.3 | 665 | ||
| S4-B | 3000 | 2000 | 600 | 250 | 160 | 42.2 | BFRP | 0.8 | 69.3 | 566 | ||
| S5-B | 3000 | 2000 | 600 | 250 | 160 | 47.9 | BFRP | 1.2 | 69.3 | 716 | ||
| S6-B | 3000 | 2000 | 600 | 250 | 160 | 47.9 | BFRP | 0.4 | 69.3 | 576 | ||
| S7-B | 3000 | 2000 | 600 | 250 | 160 | 47.9 | BFRP | 0.4 | 69.3 | 436 | ||
| 2016 | GN-0.65 | 2600 | 2600 | 300 | 300 | 160 | 42 | GFRP | 0.65 | 69.3 | 363 | [67] |
| GN-0.98 | 2600 | 2600 | 300 | 300 | 160 | 38 | GFRP | 0.98 | 68 | 378 | ||
| GN-1.30 | 2600 | 2600 | 300 | 300 | 160 | 39 | GFRP | 1.3 | 68 | 425 | ||
| GH-0.65 | 2600 | 2600 | 300 | 300 | 160 | 70 | GFRP | 0.65 | 68 | 380 | ||
| G-00-XX | 2800 | 2800 | 300 | 300 | 160 | 38 | GFRP | 0.65 | 68 | 421 | [68] | |
| 2016 | G-15-XX | 2800 | 2800 | 300 | 300 | 160 | 42 | GFRP | 0.65 | 68 | 363 | |
| G-30-XX | 2800 | 2800 | 300 | 300 | 160 | 42 | GFRP | 0.65 | 68 | 296 | ||
| R-15-XX | 2800 | 2800 | 300 | 300 | 160 | 40 | GFRP | 0.65 | 68 | 320 | ||
| 2017 | NW59 | 800 | 800 | 250 | 250 | 176 | 59 | GFRP | 0.703 | 68 | 719 | [69] |
| 2017 | SG1 | 1100 | 1100 | 150 | 150 | 62 | 29.8 | GFRP | 0.22 | 47 | 136 | [70] |
| SO1 | 1100 | 1100 | 150 | 150 | 62 | 37.3 | GFRP | 0.13 | 47 | 68 | ||
| SO2 | 1100 | 1100 | 150 | 150 | 62 | 32.6 | GFRP | 0.13 | 47 | 85 | ||
| SO3 | 1100 | 1100 | 150 | 150 | 62 | 30.5 | GFRP | 0.22 | 47 | 80 | ||
| SO4 | 1100 | 1100 | 150 | 150 | 62 | 35.4 | GFRP | 0.22 | 47 | 100 | ||
| SO5 | 1100 | 1100 | 150 | 150 | 62 | 30.1 | GFRP | 0.22 | 47 | 102 | ||
| 2018 | GFS1 | 3000 | 2200 | 200 | 200 | 180 | 36.7 | GFRP | 1.57 | 47 | 410 | [71] |
| GFS2 | 3000 | 2200 | 200 | 200 | 180 | 36.7 | GFRP | 1.2 | 47 | 360 | ||
| GFS3 | 3000 | 2200 | 200 | 200 | 180 | 36.7 | GFRP | 0.79 | 47 | 370 | ||
| 2018 | H-1.0-XX | 2800 | 2800 | 300 | 300 | 160 | 80 | GFRP | 0.98 | 65 | 461 | [72] |
| H-1.5-XX | 2800 | 2800 | 300 | 300 | 160 | 84 | GFRP | 1.46 | 65 | 541 | ||
| H-2.0-XX | 2800 | 2800 | 300 | 300 | 160 | 87 | GFRP | 1.93 | 65 | 604 | ||
| 2019 | C-F-S-10-4 | 600 | 600 | 100 | 100 | 80 | 51 | CFRP | 0.3 | 144 | 103 | [39] |
| C-F-S-10-6 | 600 | 600 | 100 | 100 | 80 | 52 | CFRP | 0.45 | 144 | 127 | ||
| S-F-D-10-4 | 600 | 600 | 100 | 100 | 80 | 46 | CFRP | 0.6 | 144 | 112 | ||
| S-F-D-10-6 | 600 | 600 | 100 | 100 | 80 | 60 | CFRP | 0.9 | 144 | 129 | ||
| S-F-S-10-4 | 600 | 600 | 100 | 100 | 80 | 52 | CFRP | 0.3 | 144 | 79 | ||
| S-F-S-10-6 | 600 | 600 | 100 | 100 | 80 | 48 | CFRP | 0.45 | 144 | 107 | ||
| S-F-S-7.5-4 | 600 | 600 | 100 | 100 | 60 | 49 | CFRP | 0.41 | 144 | 57 | ||
| S-F-S-7.5-6 | 600 | 600 | 100 | 100 | 60 | 49 | CFRP | 0.61 | 144 | 79 | ||
| 2019 | G | 2500 | 1350 | 300 | 300 | 160 | 41.4 | GFRP | 1.55 | 65 | 314 | [73] |
| 2019 | G1 (1.06) | 2500 | 2500 | 300 | 300 | 151 | 52 | GFRP | 1.06 | 62.6 | 140 | [74] |
| G2 (1.51) | 2500 | 2500 | 300 | 300 | 151 | 92 | GFRP | 1.51 | 62.6 | 140 | ||
| G3(1.06)-SL | 2500 | 2500 | 300 | 300 | 151 | 45 | GFRP | 1.06 | 62.6 | 180 | ||
| 2020 | A30-1 | 1500 | 1500 | 300 | 300 | 88 | 27.4 | GFRP | 1.28 | 51.1 | 191 | [75] |
| A30-2 | 1500 | 1500 | 300 | 300 | 108 | 27.3 | GFRP | 1.05 | 51.1 | 289 | ||
| A30-3 | 1500 | 1500 | 300 | 300 | 138 | 26.2 | GFRP | 0.82 | 51.1 | 413 | ||
| A30-4 | 1500 | 1500 | 350 | 350 | 86 | 26.8 | GFRP | 1.31 | 51.1 | 209 | ||
| A40-1 | 1500 | 1500 | 350 | 350 | 88 | 28.2 | GFRP | 1.28 | 51.1 | 232 | ||
| A40-2 | 1500 | 1500 | 350 | 350 | 88 | 26.4 | GFRP | 0.89 | 51.1 | 221 | ||
| A40-3 | 1500 | 1500 | 300 | 300 | 88 | 28.6 | GFRP | 1.28 | 51.1 | 236 | ||
| A50-1 | 1500 | 1500 | 300 | 300 | 88 | 29.2 | GFRP | 1.28 | 51.1 | 253 | ||
| A50-2 | 1500 | 1500 | 300 | 300 | 90 | 32.2 | GFRP | 0.87 | 54.1 | 237 | ||
| A50-3 | 1500 | 1500 | 350 | 350 | 88 | 26.7 | GFRP | 1.28 | 51.1 | 280 | ||
| 2020 | S40-1 | 1500 | 1500 | 300 | 300 | 88 | 32.3 | GFRP | 0.98 | 51.1 | 314 | [76] |
| S50-1 | 1500 | 1500 | 300 | 300 | 86 | 43.2 | GFRP | 0.7 | 54.4 | 187 | ||
| 2020 | G4(1.06)-H | 2500 | 2500 | 300 | 300 | 151 | 92 | GFRP | 1.06 | 62.6 | 134 | [77] |
| 2020 | F1 | 1600 | 1600 | 200 | 200 | 125 | 24.97 | CFRP | 0.89 | 123 | 262 | [78] |
| 2021 | G-N-0.3 | 2500 | 1300 | 300 | 300 | 160 | 37.1 | GFRP | 1.04 | 65 | 260 | [79] |
| G-H-0.3 | 3000 | 2200 | 200 | 200 | 160 | 85.8 | GFRP | 1.04 | 65 | 306 | ||
| G-N-0.6 | 3000 | 2200 | 200 | 200 | 160 | 38.8 | GFRP | 1.04 | 65 | 178 | ||
| G-H-0.6 | 3000 | 2200 | 200 | 200 | 160 | 86 | GFRP | 1.04 | 65 | 213 | ||
| 2021 | 0F-605 | 2000 | 2000 | 250 | 250 | 125 | 38.2 | GFRP | 2.81 | 50.6 | 463 | [80] |
| 0F-80F | 2000 | 2000 | 250 | 250 | 125 | 38.2 | GFRP | 2.11 | 50.6 | 486 | ||
| 0F-1105 | 2000 | 2000 | 250 | 250 | 125 | 38.2 | GFRP | 1.53 | 50.6 | 436 | ||
| 1.25F-60S | 2000 | 2000 | 250 | 250 | 125 | 38.2 | GFRP | 2.81 | 50.6 | 455 | ||
| 1.25F-80S | 2000 | 2000 | 250 | 250 | 125 | 38.2 | GFRP | 2.11 | 50.6 | 506 | ||
| 1.25F-110S | 2000 | 2000 | 250 | 250 | 125 | 38.2 | GFRP | 1.53 | 50.6 | 498 | ||
| 2022 | SA1 | 500 | 500 | 55 | 55 | 36 | 45 | BFRP | 0.84 | 50 | 30 | [81] |
| SA2 | 500 | 500 | 55 | 55 | 36 | 45 | GFRP | 0.84 | 42 | 28 | ||
| SA4 | 500 | 500 | 55 | 55 | 36 | 45 | BFRP | 0.56 | 50 | 26 | ||
| SA5 | 500 | 500 | 55 | 55 | 36 | 45 | GFRP | 0.56 | 42 | 24 | ||
| SA7 | 500 | 500 | 55 | 55 | 36 | 65 | BFRP | 0.84 | 50 | 35 | ||
| SA0 | 500 | 500 | 55 | 55 | 36 | 45 | BFRP | 0.84 | 50 | 28 | ||
| 2022 | CFRP1 | 1670 | 1670 | 1075 | 1075 | 52 | 29.62 | CFRP | 0.36 | 140 | 169 | [82] |
| CFRP2 | 1670 | 1670 | 1075 | 1075 | 52 | 34.59 | CFRP | 0.36 | 140 | 178 | ||
| CFRP3 | 1670 | 1670 | 1075 | 1075 | 52 | 34.59 | CFRP | 0.36 | 140 | 208 | ||
| BFRP1 | 1670 | 1670 | 1075 | 1075 | 52 | 29.62 | BFRP | 0.36 | 55 | 103 | ||
| BFRP2 | 1670 | 1670 | 1075 | 1075 | 52 | 34.59 | BFRP | 0.36 | 55 | 120 | ||
| BFRP3 | 1670 | 1670 | 1075 | 1075 | 52 | 34.59 | BFRP | 0.36 | 55 | 144 | ||
| Minimum | 300 | 300 | 25 | 25 | 36 | 22.16 | 0.13 | 28.4 | 24.34 | |||
| Maximum | 3000 | 4000 | 1075 | 1075 | 284 | 179 | 3.76 | 230 | 1600 | |||
| Mean | 1915 | 1715 | 303 | 235 | 125 | 44 | 1 | 75 | 372 | |||
| Variation | 40% | 39% | 66% | 65% | 40% | 44% | 64% | 55% | 82% |
| Design Model | R2 | RMSE | MAE | Mean | C.O.V. | Lower 95% | Maximum | Minimum |
|---|---|---|---|---|---|---|---|---|
| G | 0.67 | 205 | 144 | 0.82 | 0.38 | 0.78 | 1.85 | 0.15 |
| JSCE | 0.69 | 337 | 238 | 2.71 | 0.38 | 2.58 | 8.08 | 0.69 |
| Gd | 0.69 | 776 | 653 | 0.36 | 0.37 | 0.34 | 0.78 | 0.08 |
| MT | 0.69 | 183 | 121 | 1.18 | 0.36 | 1.13 | 2.92 | 0.23 |
| O | 0.71 | 170 | 110 | 1.00 | 0.38 | 0.95 | 3.01 | 0.18 |
| Z | 0.67 | 200 | 126 | 0.94 | 0.38 | 0.90 | 2.81 | 0.16 |
| Jb | 0.67 | 182 | 110 | 1.15 | 0.38 | 1.10 | 2.59 | 0.21 |
| ACI | 0.69 | 272 | 194 | 2.18 | 0.45 | 2.06 | 6.90 | 0.36 |
| Eg | 0.68 | 222 | 137 | 0.86 | 0.37 | 0.82 | 2.59 | 0.13 |
| Zg | 0.70 | 166 | 106 | 1.00 | 0.35 | 0.96 | 2.43 | 0.19 |
| TS | 0.70 | 255 | 176 | 1.78 | 0.36 | 1.70 | 3.96 | 0.33 |
| CSA | 0.72 | 165 | 110 | 1.19 | 0.40 | 1.13 | 3.17 | 0.21 |
| NR | 0.56 | 360 | 252 | 0.63 | 0.45 | 0.60 | 1.60 | 0.14 |
| H | 0.70 | 290 | 203 | 2.16 | 0.36 | 2.07 | 5.56 | 0.40 |
| KS | 0.71 | 163 | 103 | 1.07 | 0.37 | 1.02 | 3.07 | 0.19 |
| CCCM | 0.67 | 198 | 126 | 1.06 | 0.44 | 1.00 | 3.48 | 0.22 |
| Hz | 0.72 | 164 | 105 | 1.00 | 0.45 | 0.95 | 3.54 | 0.19 |
| EE-a | 0.67 | 305 | 195 | 0.74 | 0.38 | 0.70 | 2.27 | 0.11 |
| EE-b | 0.70 | 233 | 160 | 1.61 | 0.35 | 1.54 | 4.24 | 0.30 |
| Ju | 0.70 | 173 | 117 | 1.26 | 0.36 | 1.20 | 3.60 | 0.22 |
| A | 0.71 | 163 | 106 | 1.13 | 0.36 | 1.07 | 3.21 | 0.20 |
Publisher’s Note: MDPI stays neutral with regard to jurisdictional claims in published maps and institutional affiliations. |
© 2022 by the authors. Licensee MDPI, Basel, Switzerland. This article is an open access article distributed under the terms and conditions of the Creative Commons Attribution (CC BY) license (https://creativecommons.org/licenses/by/4.0/).
Share and Cite
Aslam, F.; AbdelMongy, M.; Alzara, M.; Ibrahim, T.; Deifalla, A.F.; Yosri, A.M. Two-Way Shear Resistance of FRP Reinforced-Concrete Slabs: Data and a Comparative Study. Polymers 2022, 14, 3799. https://doi.org/10.3390/polym14183799
Aslam F, AbdelMongy M, Alzara M, Ibrahim T, Deifalla AF, Yosri AM. Two-Way Shear Resistance of FRP Reinforced-Concrete Slabs: Data and a Comparative Study. Polymers. 2022; 14(18):3799. https://doi.org/10.3390/polym14183799
Chicago/Turabian StyleAslam, Fahid, Mohamed AbdelMongy, Majed Alzara, Taha Ibrahim, Ahmed Farouk Deifalla, and Ahmed M. Yosri. 2022. "Two-Way Shear Resistance of FRP Reinforced-Concrete Slabs: Data and a Comparative Study" Polymers 14, no. 18: 3799. https://doi.org/10.3390/polym14183799
APA StyleAslam, F., AbdelMongy, M., Alzara, M., Ibrahim, T., Deifalla, A. F., & Yosri, A. M. (2022). Two-Way Shear Resistance of FRP Reinforced-Concrete Slabs: Data and a Comparative Study. Polymers, 14(18), 3799. https://doi.org/10.3390/polym14183799