
Cluster Size of Amylopectin and Nanosized Amylopectin Fragments Characterized by Pyrene Excimer Formation


Abstract
:1. Introduction
2. Materials and Methods
3. Results
3.1. Size of Amylopectin and of the Nanosized Amylopectin Fragments
3.2. Lifetime of the Pyrenyl Label as a Function of [NAF(56)]
3.3. Intraparticle Interaction
3.4. Finite Array of Helices
4. Discussion
5. Conclusions
Supplementary Materials
Author Contributions
Funding
Conflicts of Interest
References
- Delcour, J.A.; Bruneel, C.; Derde, L.J.; Gomand, S.V.; Pareyt, B.; Putseys, J.A.; Wilderjans, E.; Lamberts, L. Fate of Starch in Food Processing: From Raw Materials to Final Food Products. Ann. Rev. Food Sci. Technol. 2010, 1, 87–111. [Google Scholar] [CrossRef] [PubMed]
- Khlestkin, V.K.; Peltek, S.E.; Kolchanov, N.A. Review of Direct Chemical and Biochemical Transformations of Starch. Carbohydr. Polym. 2018, 181, 460–476. [Google Scholar] [CrossRef] [PubMed]
- Li, H.; Gilbert, R.G. Starch Molecular Structure: The Basis for an Improved Understanding of Cooked Rice Structure. Carbohydr. Polym. 2018, 195, 9–17. [Google Scholar] [CrossRef] [PubMed]
- Miculescu, F.; Maidaniuc, A.; Voicu, S.I.; Thakur, V.K.; Stan, G.E.; Ciocan, L.T. Progress in Hydroxyapatite—Starch Based Sustainable Biomaterials for Biomedical Bone Substitution Applications. ACS Sustain. Chem. Eng. 2017, 5, 8491–8512. [Google Scholar] [CrossRef]
- Le Corre, D.; Bras, J.; Dufresne, A. Starch Nanoparticles: A Review. Biomacromolecules 2010, 11, 1139–1153. [Google Scholar] [CrossRef]
- Tetlow, I.J.; Bertoft, E. A Review of Starch Biosynthesis in Relation to the Building Block-Backbone Model. Int. J. Mol. Sci. 2020, 21, 7011. [Google Scholar] [CrossRef]
- Nakamura, Y.; Kainuma, K. On The Cluster Structure of Amylopectin. Plant Mol. Biol. 2022, 108, 291–306. [Google Scholar] [CrossRef]
- French, D. Fine Structure of Starch and its Relationship to the Organization of Starch Granule. J. Jpn. Soc. Starch Sci. 1972, 19, 8–25. [Google Scholar] [CrossRef]
- Nikuni, Z. Studies on Starch Granules. Starch/Stärke 1978, 30, 105–111. [Google Scholar] [CrossRef]
- Bertoft, E. On the nature of categories of chains in amylopectin and their connection to the super helix model. Carbohydr. Polym. 2004, 57, 211–224. [Google Scholar] [CrossRef]
- Pérez, S.; Bertoft, E. The Molecular Structures of Starch Components and their Contributions to the Architecture of Starch Granules: A Comprehensive Review. Starch/Stärke 2010, 62, 389–420. [Google Scholar] [CrossRef]
- Bertoft, E. On the Building Block and Backbone Concepts of Amylopectin Structure. Cereal Chem. 2013, 90, 294–311. [Google Scholar] [CrossRef]
- Bertoft, E.; Koch, K.; Åman, P. Building Block Organisation of Clusters in Amylopectin from Different Structural Types. Int. J. Biol. Macromol. 2012, 50, 1212–1223. [Google Scholar] [CrossRef] [PubMed]
- Bertoft, E. Partial Characterization of Amylopectin Alpha-Dextrins. Carbohydr. Res. 1989, 189, 181–193. [Google Scholar] [CrossRef]
- Bertoft, E.; Zhu, Q.; Andtfolf, H.; Jungner, M. Structural Heterogeneity in Waxy-Rice Starch. Carbohydr. Res. 1999, 38, 349–359. [Google Scholar] [CrossRef]
- Bertoft, E. Composition of Building Blocks in Clusters from Potato Amylopectin. Carbohydr. Polym. 2007, 70, 123–136. [Google Scholar] [CrossRef]
- Beeren, S.R.; Hindsgaul, O. Nature’s Dendrimer: Characterizing Amylopectin as a Multivalent Host. Angew. Chem. Int. Ed. 2013, 52, 11265–11268. [Google Scholar] [CrossRef] [PubMed]
- Gous, P.W.; Fox, G.P. Review: Amylopectin Synthesis and Hydrolysis—Understanding Isoamylase and Limit Dextrinase and their Impact on Starch Structure on Barley (Hordeum vulgare) Quality. Trends Food Sci. Technol. 2017, 62, 23–32. [Google Scholar] [CrossRef]
- Vilaplana, F.; Gilbert, R.G. Characterization of Branched Polysaccharides Using Multiple-Detection Size Separation Techniques. J. Sep. Sci. 2010, 33, 3537–3554. [Google Scholar] [CrossRef]
- Tuukkanen, A.T.; Spilotros, A.; Svergun, D.I. Progress in Small-Angle Scattering from Biological Solutions at High-Brilliance Synchrotron. IUCrJ 2017, 4, 518–528. [Google Scholar] [CrossRef]
- Stryer, L.; Haugland, R.P. Energy Transfer: A Spectroscopic Ruler. Proc. Natl. Acad. Sci. USA 1967, 58, 719–726. [Google Scholar] [CrossRef] [PubMed]
- Lakowicz, J.R. Principles of Fluorescence Spectroscopy, 3rd ed.; Springer: Singapore, 2006. [Google Scholar]
- Birks, J.B. Photophysics of Aromatic Molecules; Wiley: New York, NY, USA, 1970; p. 301. [Google Scholar]
- Winnik, M.A. End-to-End Cyclization of Polymer Chains. Acc. Chem. Res. 1985, 18, 73–79. [Google Scholar] [CrossRef]
- Duhamel, J. Polymer Chain Dynamics in Solution Probed with a Fluorescence Blob Model. Acc. Chem. Res. 2006, 39, 953–960. [Google Scholar] [CrossRef] [PubMed]
- Duhamel, J. New Insights in the Study of Pyrene Excimer Fluorescence to Characterize Macromolecules and their Supramolecular Assemblies in Solution. Langmuir 2012, 28, 6527–6538. [Google Scholar] [CrossRef] [PubMed]
- Hall, T.; Whitton, G.; Casier, R.; Gauthier, M.; Duhamel, J. Arborescent Poly(L-glutamic acid)s as Standards to Study the Dense Interior of Polypeptide Mesoglobules by Pyrene Excimer Fluorescence. Macromolecules 2018, 51, 7914–7923. [Google Scholar] [CrossRef]
- Casier, R.; Duhamel, J. The Effect of Structure on Polypeptide Blobs: A Model Study Using Poly(L-Lysine). Langmuir 2020, 36, 7980–7990. [Google Scholar] [CrossRef]
- Li, L.; Kim, D.; Zhai, X.; Duhamel, J. A Pyrene Excimer Fluorescence (PEF) Study of the Interior of Amylopectin in Dilute Solution. Macromolecules 2020, 53, 6850–6860. [Google Scholar] [CrossRef]
- Li, L.; Duhamel, J. Interior of Amylopectin and Nanosized Amylopectin Fragments Probed by Viscometry, Dynamic Light Scattering, and Pyrene Excimer Formation. Polymers 2020, 12, 2649. [Google Scholar] [CrossRef]
- Li, L.; Duhamel, J. Conformation of Pyrene-Labeled Amylose in DMSO Characterized with the Fluorescence Blob Model. Macromolecules 2016, 49, 7965–7974. [Google Scholar] [CrossRef]
- Press, W.H.; Flanery, B.P.; Tenkolsky, S.A.; Vetterling, W.T. Numerical Recipes in Fortran: The Art of Scientific Computing; Cambridge University Press: Cambridge, UK; New York, NY, USA, 1992; pp. 523–528. [Google Scholar]
- Ma, X.; Jian, R.; Chang, P.R.; Yu, J. Fabrication and Characterization of Citric Acid-Modified Starch Nanoparticles/Plasticized-Starch Composites. Biomacromolecules 2008, 9, 3314–3320. [Google Scholar] [CrossRef]
- Haaj, S.B.; Magnin, A.; Pétrier, C.; Boufi, S. Starch Nanoparticles Formation via High Power Sonication. Carbohydr. Polym. 2013, 92, 1625–1632. [Google Scholar] [CrossRef] [PubMed]
- Haaj, S.B.; Thielemans, W.; Magnin, A.; Boufi, S. Starch Nanocrystals and Starch Nanoparticles from Waxy Maize as Nanoreinforcement: A Comparative Study. Carbohydr. Polym. 2016, 143, 310–317. [Google Scholar] [CrossRef]
- Rostamabadi, H.; Falsafi, S.R.; Jafari, S.M. Starch-Based Nanocarriers as Cutting-Edge Natural Cargos for Nutraceutical Delivery. Trends Food Sci. Technol. 2019, 88, 397–415. [Google Scholar] [CrossRef]
- Kim, D.; Amos, R.; Gauthier, M.; Duhamel, J. Application of Pyrene Fluorescence to the Characterization of Hydrophobically Modified Starch Nanoparticles. Langmuir 2018, 34, 8611–8621. [Google Scholar] [CrossRef] [PubMed]
- Kim, D.; Amos, R.C.; Gauthier, M.; Duhamel, J. Assemblies of Hydrophobically Modified Starch Nanoparticles Probed by Surface Tension and Pyrene Fluorescence. In ACS Symposium Series-Molecular Assemblies: Characterization and Applications; Nagarajan, R., Ed.; American Chemical Society: Washington, DC, USA, 2020; Chapter 5; pp. 61–75. [Google Scholar]
- Thurn, A.; Burchard, W. Heterogeneity in Branching of Amylopectin. Carbohydr. Polym. 1985, 5, 441–460. [Google Scholar] [CrossRef]
- Gallant, D.J.; Bouchet, B.; Baldwin, P.M. Microscopy of Starch: Evidence of a New Level of Granule Organization. Carbohydr. Polym. 1997, 32, 177–191. [Google Scholar] [CrossRef]
- Bertoft, E. Investigation of the Fine Structure of Alpha-Dextrins Derived from Amylopectin and their Relation to the Structure of Waxy-Maize Starch. Carbohydr. Res. 1991, 212, 229–244. [Google Scholar] [CrossRef]
- Finch, P.; Sebesta, D. The Amylase of Pseudomonas Stutzeri as a Probe of the Structure of Amylopectin. Carbohydr. Res. 1992, 227, c1–c4. [Google Scholar] [CrossRef]
- Gérard, C.; Planchot, V.; Colonna, P.; Bertoft, E. Relationship between Branching Density and Crystalline Structure of A- and B-Type Maize Mutant Starches. Carbohydr. Res. 2000, 326, 130–144. [Google Scholar] [CrossRef]
- Hizukuri, S. Polymodel Distribution of the Chain Lengths of Amylopectins, and its Significance. Carbohydr. Res. 1986, 147, 342–347. [Google Scholar] [CrossRef]
- Inouch, N.; Glover, D.V.; Fuwa, H. Chain Length Distribution of Amylopectins of Several Single Mutants and the Normal Counterpart, and Sugary-1 Phytoglycogen in Maize (Zea mays L.). Starch/Stärke 1987, 39, 259–266. [Google Scholar] [CrossRef]
- Xie, G.; Martinez, M.R.; Olzewski, M.; Sheiko, S.; Matyjaszewski, K. Molecular Bottlebrushes as Novel Materials. Biomacromolecules 2019, 20, 27–54. [Google Scholar] [CrossRef] [PubMed]
- Li, Z.; Tang, M.; Liang, S.; Zhang, M.; Biesold, G.M.; He, Y.; Hao, S.-M.; Choi, W.; Liu, Y.; Peng, J.; et al. Bottlebrush Polymers: From Controlled Synthesis, Self-Assembly, Properties to Applications. Prog. Polym. Sci. 2021, 116, 101387. [Google Scholar] [CrossRef]
- Wang, D.; Jin, Y.; Zhu, X.; Yan, D. Synthesis and Applications of Strimuli-Responsive Hyperbranched Polymers. Prog. Polym. Sci. 2017, 64, 114–153. [Google Scholar] [CrossRef]
- Bhat, S.I.; Ahmadi, Y.; Ahmad, S. Recent Advances in Structural Modifications of Hyperbranched Polymers and their Applications. Ind. Eng. Chem. 2018, 57, 10754–10785. [Google Scholar] [CrossRef]

 ) Py(4.2)-amylopectin, (
  ) Py(6.7)-NAF(56), (
  ) Py(5.8)-NAF(20), (
  ) Py(5.8)-NAF(8), and (
  ) Py(5.5)-amylose.
) Py(4.2)-amylopectin, ( ) Py(6.7)-NAF(56), ( ) Py(5.8)-NAF(20), ( ) Py(5.8)-NAF(8), and ( ) Py(5.5)-amylose.
) Py(5.5)-amylose.
) Py(4.2)-amylopectin, ( ) Py(6.7)-NAF(56), ( ) Py(5.8)-NAF(20), ( ) Py(5.8)-NAF(8), and ( ) Py(5.5)-amylose. ) side, (
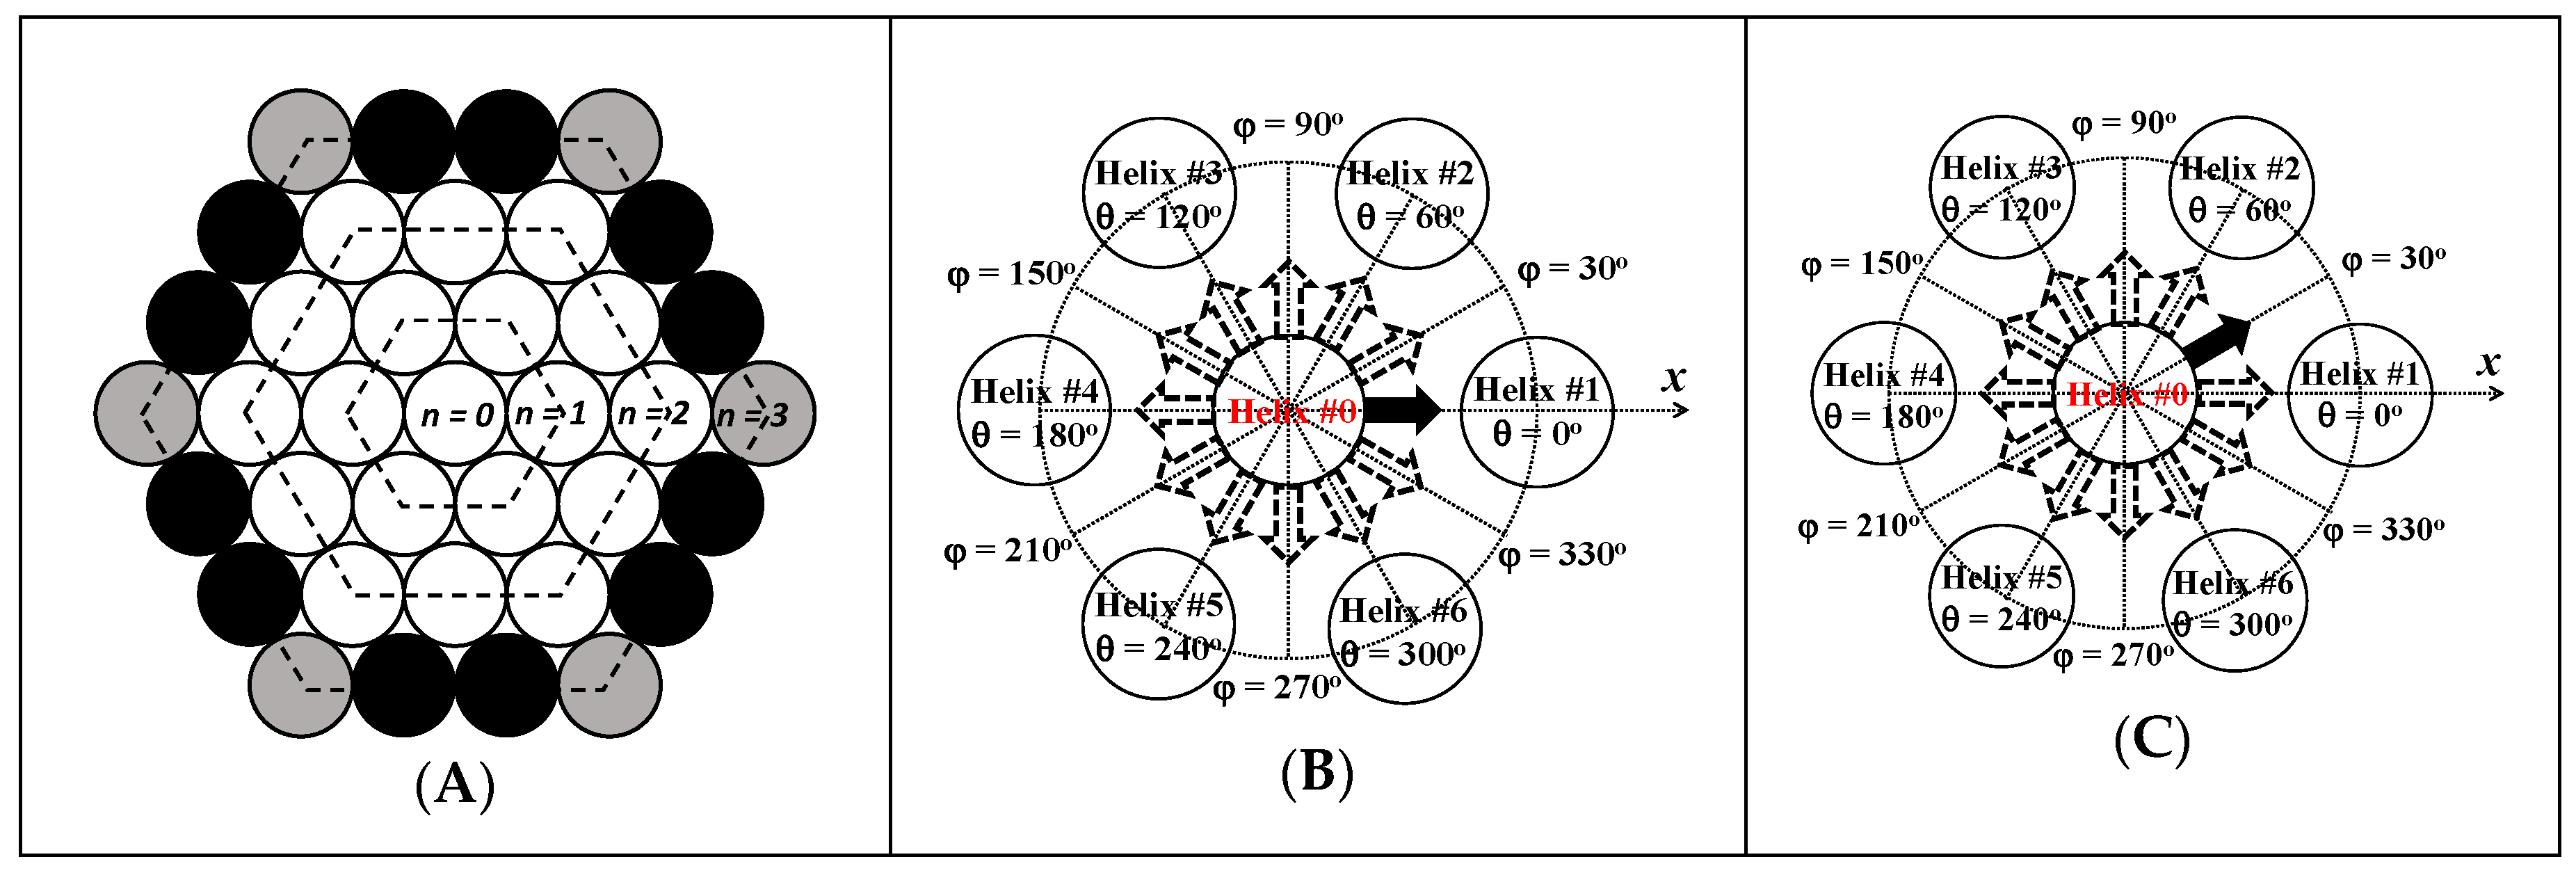
  ) corner, and (
  ) internal. The two configurations of pyrenyl labels considered in this study with the reference pyrenyl shown as a black arrow on the central Helix #0 located at (B) φ = 0° and (C) φ = 30° in a cluster of seven helices.
) side, ( ) corner, and ( ) internal. The two configurations of pyrenyl labels considered in this study with the reference pyrenyl shown as a black arrow on the central Helix #0 located at (B) φ = 0° and (C) φ = 30° in a cluster of seven helices.
) internal. The two configurations of pyrenyl labels considered in this study with the reference pyrenyl shown as a black arrow on the central Helix #0 located at (B) φ = 0° and (C) φ = 30° in a cluster of seven helices.
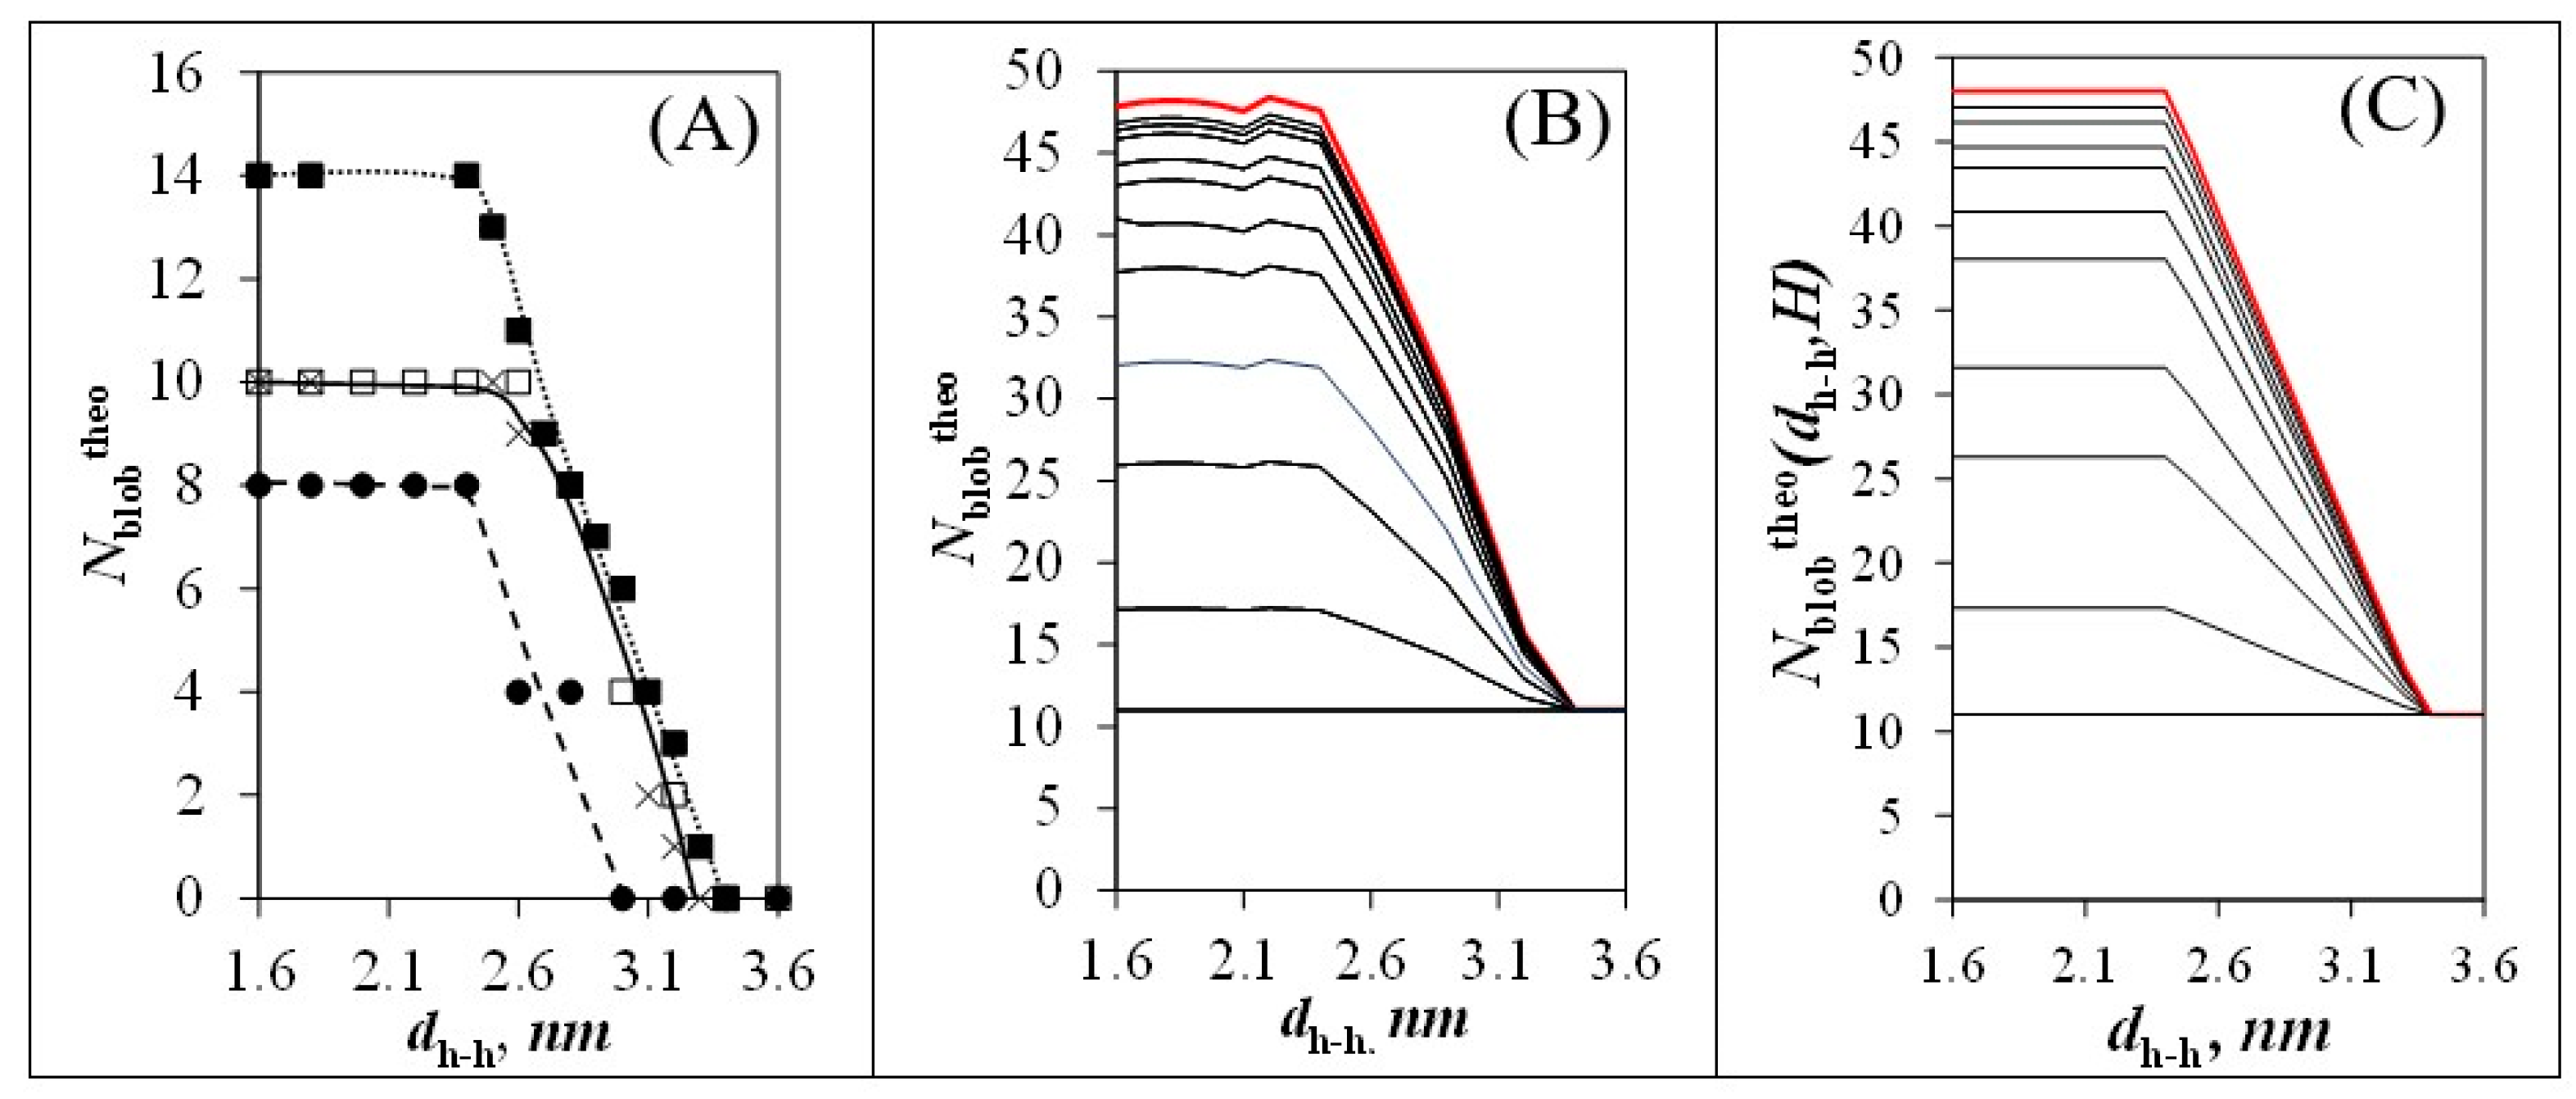
) side, ( ) corner, and ( ) internal. The two configurations of pyrenyl labels considered in this study with the reference pyrenyl shown as a black arrow on the central Helix #0 located at (B) φ = 0° and (C) φ = 30° in a cluster of seven helices. ) 0° and ( ) 60° and when φ equals 30° and θ equals ( ) 60° and (×) 120° (see Figure 3B,C). (B) Plot of Nblobtheo with arrays constituted of different total numbers (Htotal) of helices. From bottom to top: H = 1, 2, 4, 7, 19, 37, 169, 547, 1027, and ∞. (C) Plot of Nblobtheo(dh-h,H) after parametrization according to Equations (5)–(7) for the same arrays of helices as in (B).
) 0° and ( ) 60° and when φ equals 30° and θ equals ( ) 60° and (×) 120° (see Figure 3B,C). (B) Plot of Nblobtheo with arrays constituted of different total numbers (Htotal) of helices. From bottom to top: H = 1, 2, 4, 7, 19, 37, 169, 547, 1027, and ∞. (C) Plot of Nblobtheo(dh-h,H) after parametrization according to Equations (5)–(7) for the same arrays of helices as in (B).
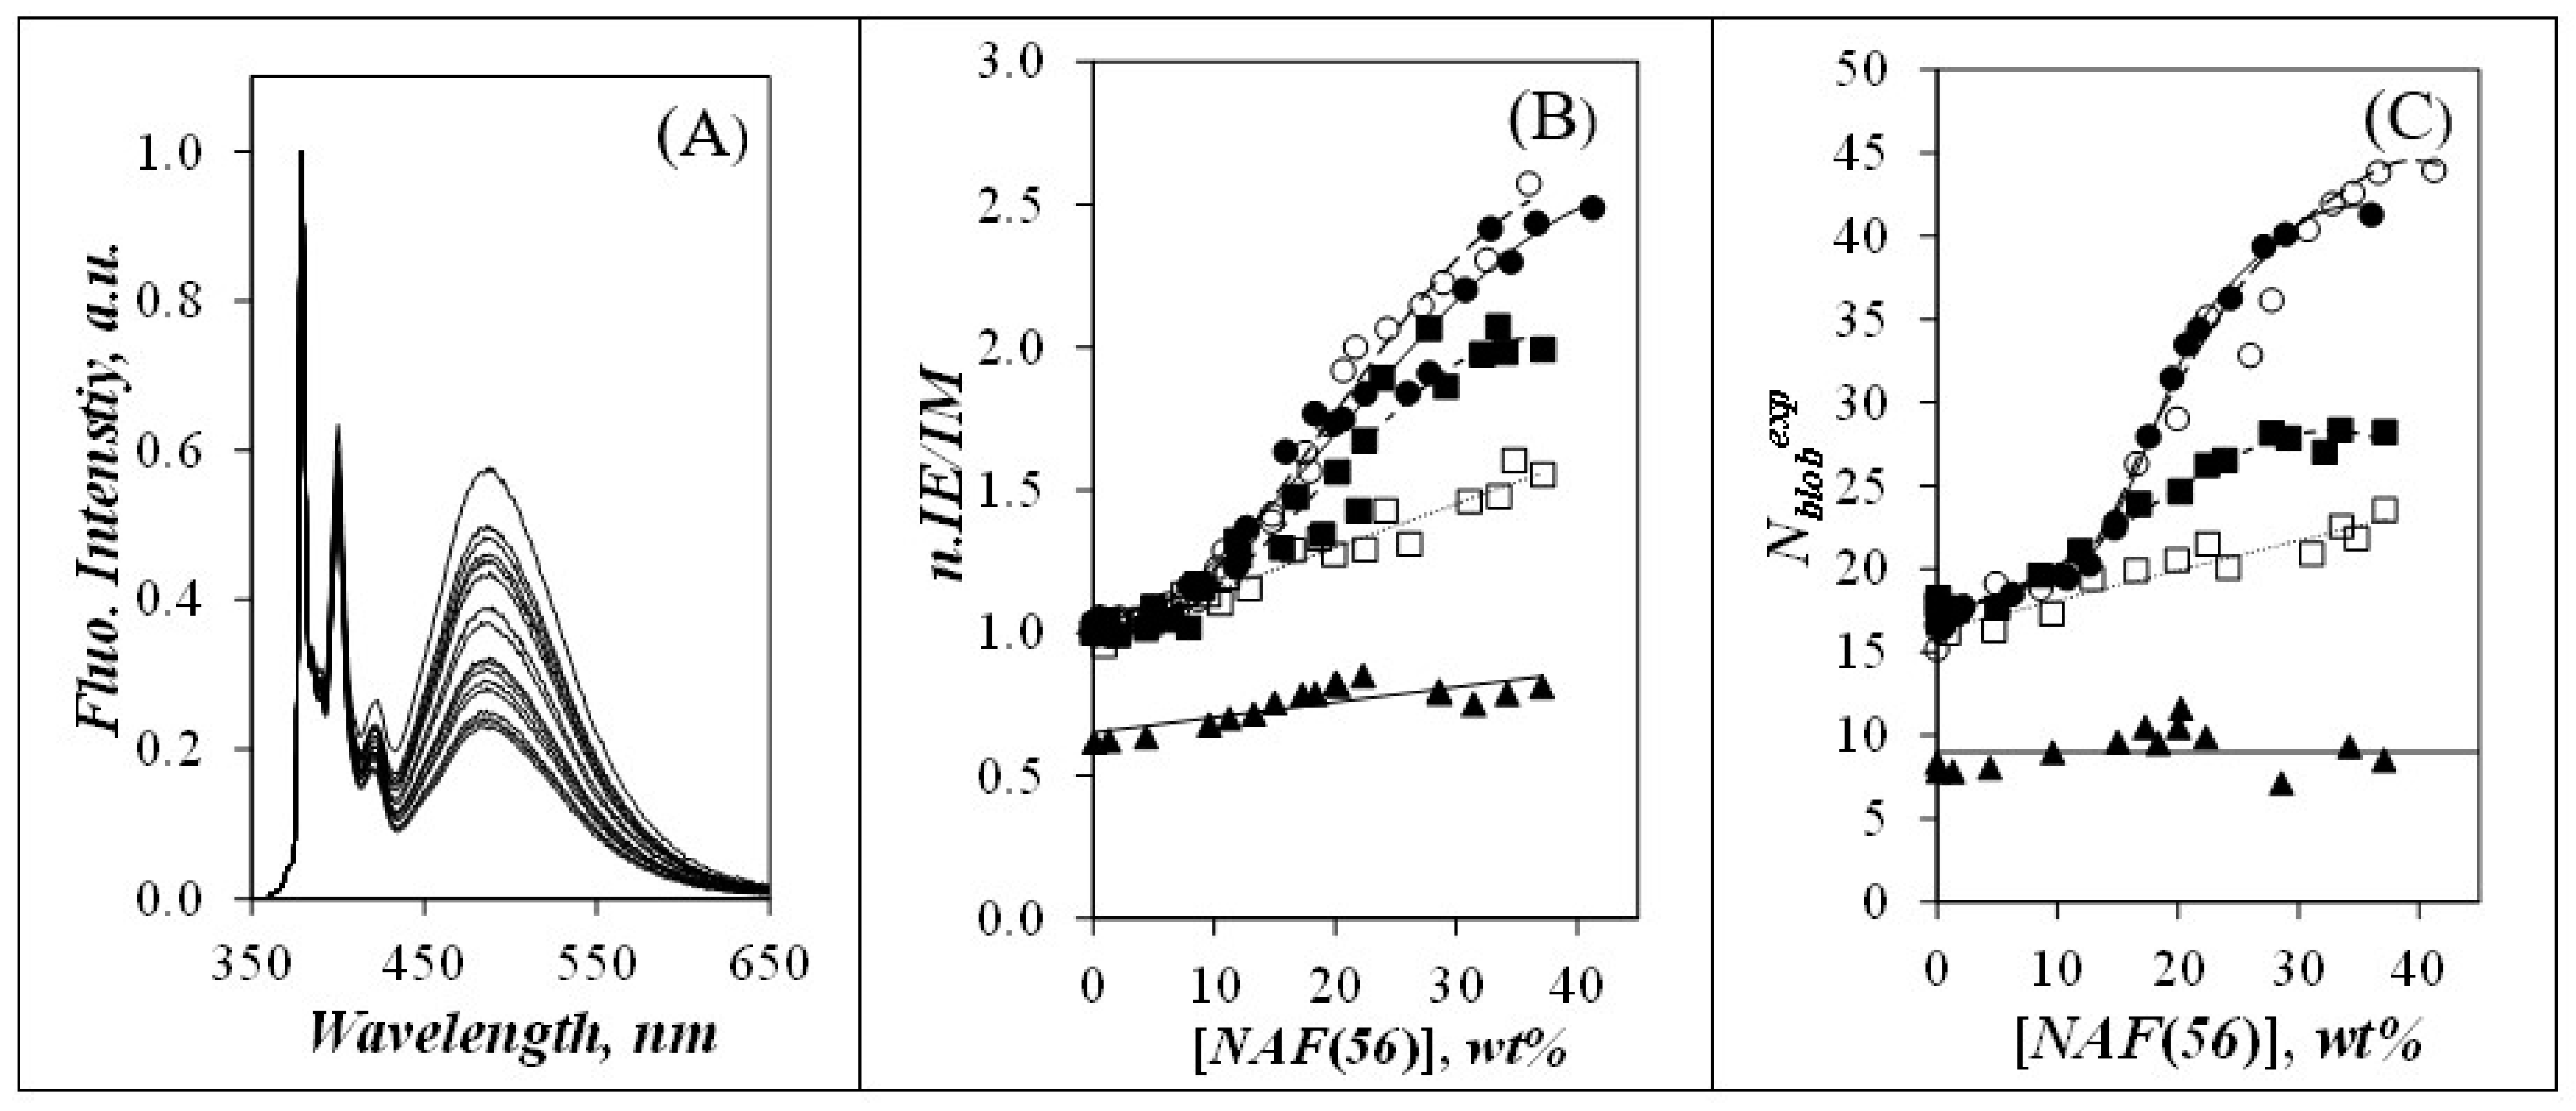
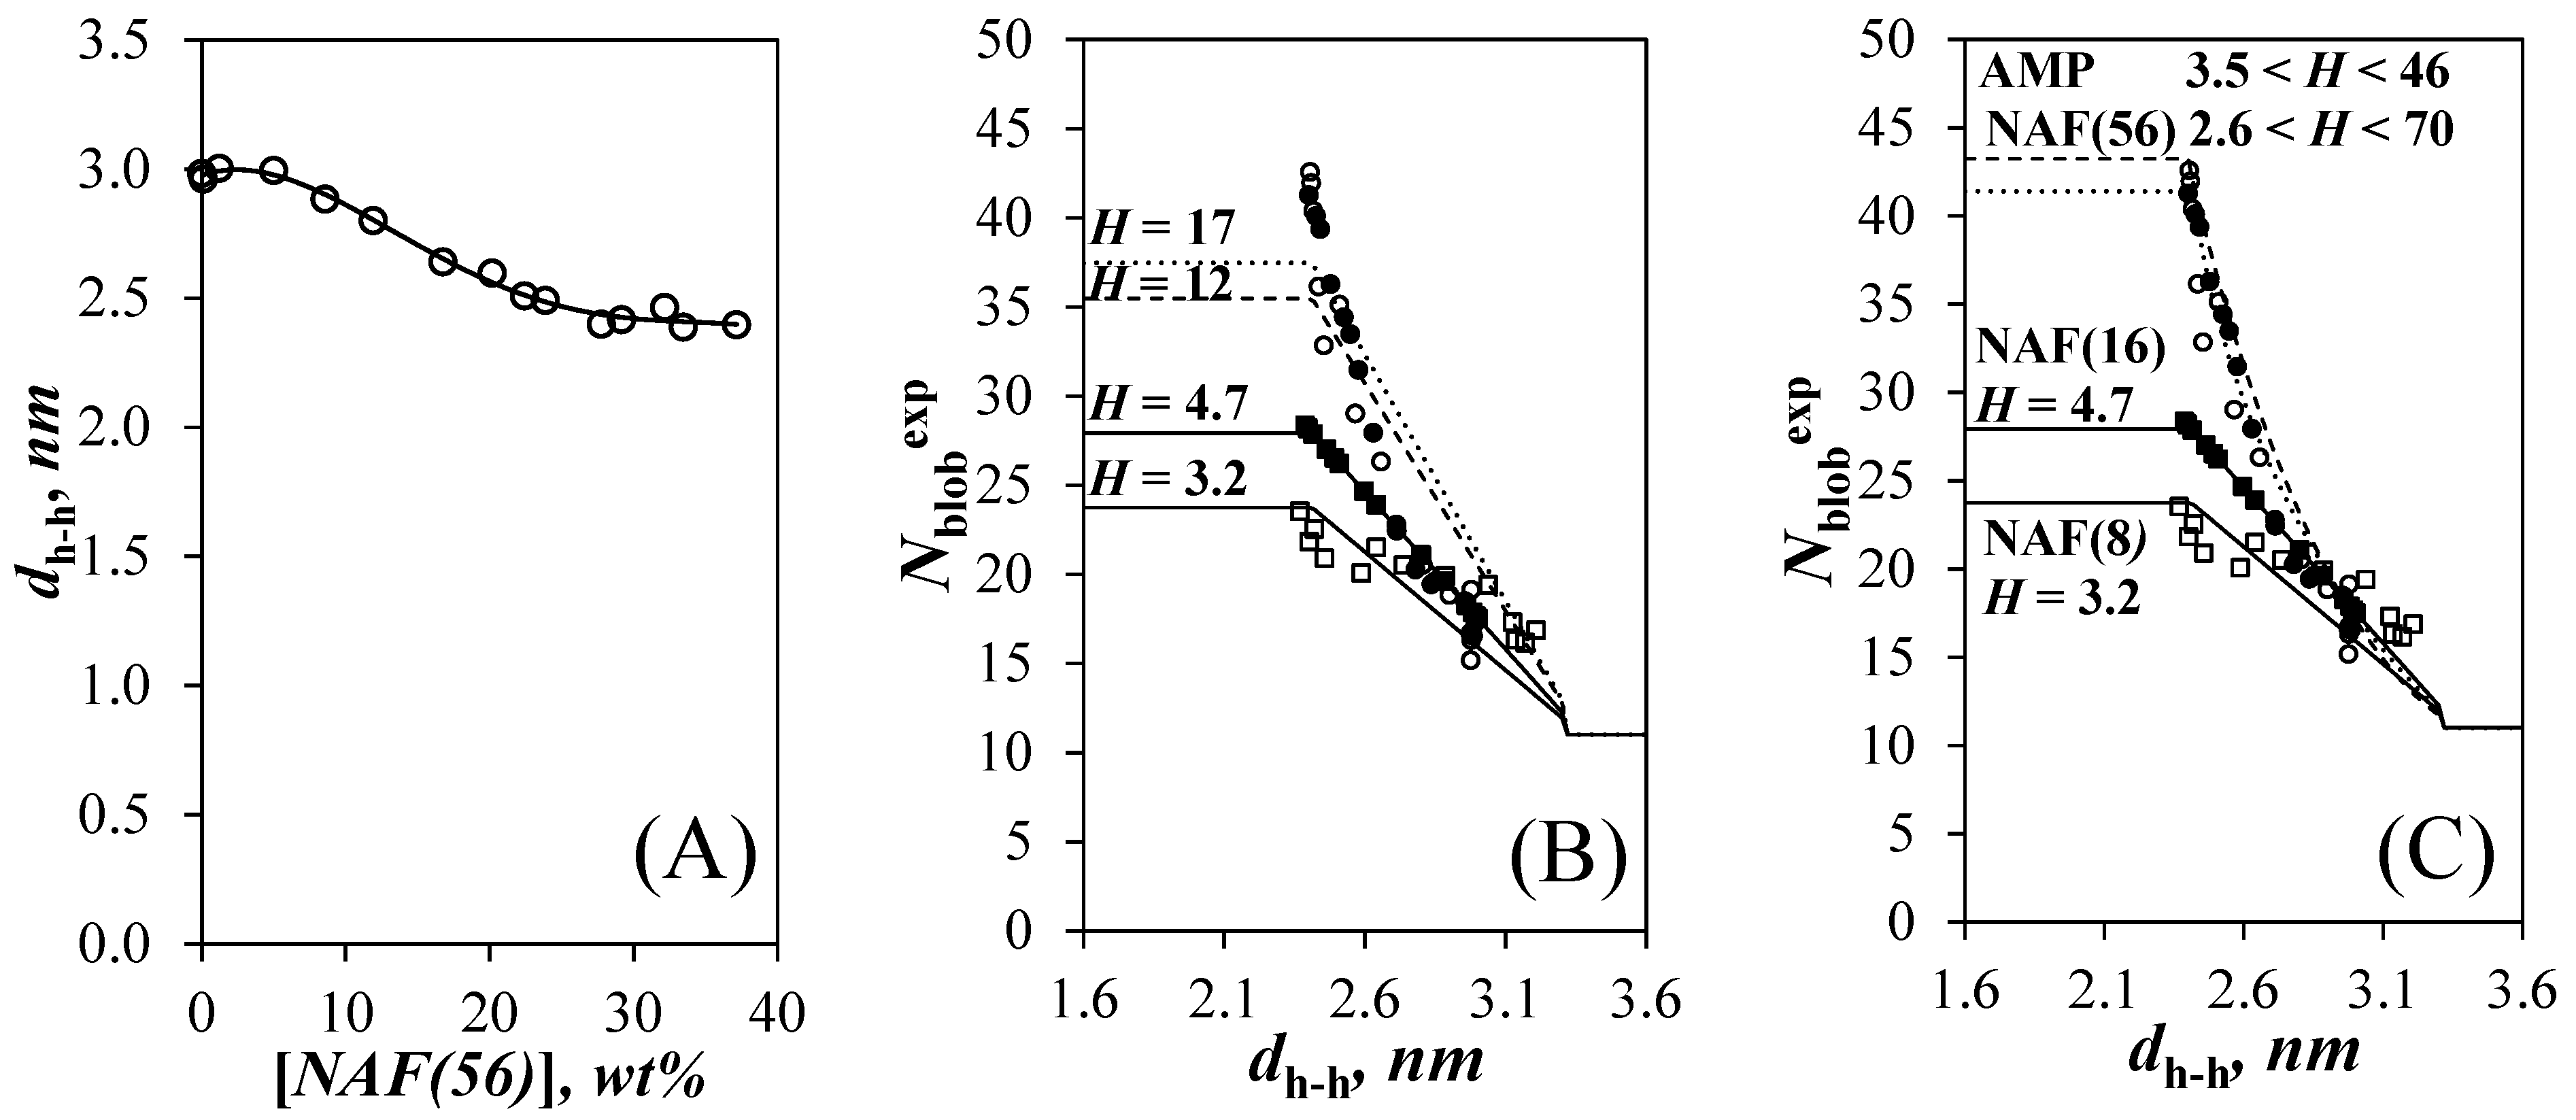
) 0° and ( ) 60° and when φ equals 30° and θ equals ( ) 60° and (×) 120° (see Figure 3B,C). (B) Plot of Nblobtheo with arrays constituted of different total numbers (Htotal) of helices. From bottom to top: H = 1, 2, 4, 7, 19, 37, 169, 547, 1027, and ∞. (C) Plot of Nblobtheo(dh-h,H) after parametrization according to Equations (5)–(7) for the same arrays of helices as in (B). ) Py(4.2)-amylopectin, ( ) Py(6.7)-NAF(56), ( ) Py(5.8)-NAF(20), ( ) Py(5.8)-NAF(8), and ( ) Py(5.5)-amylose for arrays with (B) a fixed number and (C) variable number of helices for the Py(6.7)-NAF(56) and Py(4.2)-amylopectin samples.
) Py(4.2)-amylopectin, ( ) Py(6.7)-NAF(56), ( ) Py(5.8)-NAF(20), ( ) Py(5.8)-NAF(8), and ( ) Py(5.5)-amylose for arrays with (B) a fixed number and (C) variable number of helices for the Py(6.7)-NAF(56) and Py(4.2)-amylopectin samples.
) Py(4.2)-amylopectin, ( ) Py(6.7)-NAF(56), ( ) Py(5.8)-NAF(20), ( ) Py(5.8)-NAF(8), and ( ) Py(5.5)-amylose for arrays with (B) a fixed number and (C) variable number of helices for the Py(6.7)-NAF(56) and Py(4.2)-amylopectin samples.
 ) Py(4.2)-amylopectin and ( ) Py(6.7)-NAF(56).

| Sample | Dh (nm) a | [η] b (mL/g) | Mv (g/mol) c |
|---|---|---|---|
| Amylopectin | 227 | 122.5 | 7.2 × 10⁷ |
| NAF(56) | 56 | 61 | 2.3 × 10⁶ |
| NAF(20) | 20 | 40 | 1.6 × 10⁵ |
| NAF(8) | 8 | 23 | 1.8 × 10⁴ |
| Name (No. Adjacent Helices) | Arrangement | Expressions of Nblobtheo for Different Arrays of Helices |
|---|---|---|
| Single (1) |  | |
| Vertex (2) |  | |
| Corner (3) |  | |
| Side (4) |  | |
| Quasi-Internal (5) |  | |
| Internal (6) |  |
Publisher’s Note: MDPI stays neutral with regard to jurisdictional claims in published maps and institutional affiliations. |
© 2022 by the authors. Licensee MDPI, Basel, Switzerland. This article is an open access article distributed under the terms and conditions of the Creative Commons Attribution (CC BY) license (https://creativecommons.org/licenses/by/4.0/).
Share and Cite
Kim, D.; Duhamel, J. Cluster Size of Amylopectin and Nanosized Amylopectin Fragments Characterized by Pyrene Excimer Formation. Polymers 2022, 14, 3418. https://doi.org/10.3390/polym14163418
Kim D, Duhamel J. Cluster Size of Amylopectin and Nanosized Amylopectin Fragments Characterized by Pyrene Excimer Formation. Polymers. 2022; 14(16):3418. https://doi.org/10.3390/polym14163418
Chicago/Turabian StyleKim, Damin, and Jean Duhamel. 2022. "Cluster Size of Amylopectin and Nanosized Amylopectin Fragments Characterized by Pyrene Excimer Formation" Polymers 14, no. 16: 3418. https://doi.org/10.3390/polym14163418
APA StyleKim, D., & Duhamel, J. (2022). Cluster Size of Amylopectin and Nanosized Amylopectin Fragments Characterized by Pyrene Excimer Formation. Polymers, 14(16), 3418. https://doi.org/10.3390/polym14163418