Article

Characterization and Bioactivity of Polysaccharides Separated through a (Sequential) Biorefinery Process from Fucus spiralis Brown Macroalgae

1
Department of Environmental Engineering and Management, Faculty of Chemical Engineering and Environmental Protection, “Gheorghe Asachi” Technical University of Iasi, 73 Prof. D. Mangeron Bldv., 700050 Iasi, Romania
2
VTRS Laboratory, Faculty of Sciences, University of El Oued, B.P. 789, El Oued 39000, Algeria
*
Author to whom correspondence should be addressed.
Polymers 2022, 14(19), 4106; https://doi.org/10.3390/polym14194106
Submission received: 11 July 2022 / Revised: 12 September 2022 / Accepted: 23 September 2022 / Published: 30 September 2022

Abstract

:
Marine macroalgae biomass is a valuable renewable resource that can be used for the development of bioeconomy through the valorisation of valuable compounds. The aim of the current study is separate macroalgal polysaccharides with bioactive properties from brown macroalgae Fucus spiralis based on a designed biocascading biorefinery approach. Thus, we applied an integrated processing method for the separation of fucoidan and alginate, in addition to characterization through IR spectroscopy and 1H NMR. The bioactivity potential (antioxidant activity using superoxide anion and DPPH radical scavenging analysis) of the two polysaccharides was evaluated, together with DNA binding studies performed though voltametric techniques and electronic spectroscopy titration. In terms of results, functional groups S=O (1226 cm−1), N=S=O (1136 cm−1) and C-O-SO3 (1024 cm−1), which are characteristic of fucoidan, were identified in the first polysaccharidic extract, whereas guluronic units (G) (1017 cm−1) and mannuronic units (M) (872 and 812 cm−1) confirmed the separation of alginate. The DNA binding studies of the isolated polysaccharides revealed an electrostatic and an intercalation interaction of DNA with fucoidan and alginate, respectively. Both antioxidant activity assays revealed improved antioxidant activity for both fucoidan and alginate compared to the standard α-tocopherol.

1. Introduction

Marine macroalgae, also known as “seaweeds”, represent a promising biomass that can address future trends and industry demand, as well as various sustainability issues. Marine macroalgae have been recognized as an alternative for the production of renewable energy, bio-based products and bioactive molecules, owing to their remarkable regeneration properties and high photosynthetic efficiency, as well as the lack of land requirements for growth [1,2,3,4]. Yields in terms of growth potential of seaweeds are around 20 t per hectare per year [5]. Furthermore, the valorisation of invasive marine macroalgae could provide additional advantages through processing [6], whereas others are suitable for cocultivation with fish species in an integrated multitrophic aquaculture system (IMTA), where they play a bioremediation role [7]. The chemical composition of the marine macroalgae, including the bioactivity of valuable compounds, depends on the harvesting season, the algae species and the environmental conditions [8]. Furthermore, the separation method has a significant influence on the final chemical structure of the targeted compounds [9].
Processing of marine macroalgae through a biorefinery approach could enable the generation of cost-effective products and a sustainable valorisation with minimal waste or even the fulfilment of the zero-waste concept [10,11,12,13]. The amount of easily degradable carbohydrates in macroalgae typically ranges between 25 and 60% dry wt [5]. The lack of or minimal amount of lignin in macroalgae facilitates separation of carbohydrates compared with terrestrial biomass [14]. Therefore, their chemical composition makes marine macroalgae suitable for generation of fermentation products, such as bioethanol, methane, biohydrogen, bio-oil and biodiesel [5], as well as valuable bioactive molecules.
Brown macroalgae have been traditionally used as food and medicine in Asian countries. Globally, they are mainly applied as feed and crop fertilizer, owing to their high ash and mineral content [14,15]. Additionally, this biomass is highly complex in its chemical structure and includes valuable bioactive metabolites, some of which are unique in the natural world. Polysaccharides represent the main constituent of the cell wall of marine macroalgae and have important bioactive properties. Fucoidan, as well as some polyphenols, from brown algae can be used for the production of pharmaceuticals, nutraceuticals and cosmetics, owing to their high bioactivity potential [16,17,18]. Alginate, a macroalgal hydrocolloid, is mainly used in food, pharmaceutical and medical applications, as well as in textile and paper production [19,20,21]. Furthermore, its gelling and thickening properties have been increasingly exploited to generate innovative biofilms and hydrogels [22,23]. The separation of bioactive compounds is recommended to be performed in the initial steps of the biorefining process in order to ensure the feasibility of the process [24,25].
Fucus spiralis, which belongs to the order Fucales, is an edible and perennial brown macroalga common throughout the temperate regions of the northern hemisphere [26,27] occupying the littoral to sublittoral areas of rocky coasts [28]. Its chemical composition includes proteins with antioxidant properties and angiotensin-converting enzyme (ACE) inhibitory activity [29]; polyphenols, such as phlorotannins with antioxidant activity [30,31,32]; and anti-inflammatory properties [33]; as well as polysaccharides with anticoagulant [34], anticancer [35,36] and antioxidant activity [37].
Sequential processes applied to date for biorefining of brown algae biomass have consisted of the coproduction of bioactive compounds and/or biofuel, mostly from species of the genera Laminaria [15,21,38,39,40,41], Sargassum [13,42,43], Macrocystis [44,45], Ascophyllum [15] and Ecklonia [44,46].
The purpose of this work is (i) to design and perform an integrated valorisation of Fucus spiralis biomass, applying soft or green processes for the separation of high-value molecules; and for the targeted compounds, (ii) the evaluation of biological potential through DNA binding studies (an electrochemical DNA interaction study and an electronic spectroscopy DNA interaction assay) and antioxidant activity studies (an superoxide anion radical interaction study and a DPPH assay). To the best of our knowledge, no studies have been conducted on a biorefinery approach for F. spiralis macroalgae, and no evidence of the bioactive properties of the targeted molecules have been reported to date.
Therefore, in the current study, we highlight a pathway that can be applied in order to process brown macroalgae Fucus spiralis through a biorefinery approach, in addition to reporting the bioactive properties of the obtained biocompounds.

2. Materials and Methods

Fucus spiralis algae were collected during the winter season in the Viana do Castelo area, on the northern coast of Portugal. The biomass was washed with tap water, followed by a few washes with distilled water in order to eliminate impurities, sand and epiphytes. Algal biomass was further prepared by drying in an oven at 50 °C for 24 h. The dried algae were ground into particles with a size ≤ 0.5 cm and kept in a desiccator in sealed bags.
All reagents and solvents were of analytical grade and were used without further purification. Dimethyl sulfoxide (DMSO) and ethanol (HPLC-grade; Sigma-Aldrich, St. Louis, MO, USA) were used as solvents in voltametric and spectroscopic assays, whereas tetrabutylammonium tetra-fluoroborate (Bu4NBF4) (electrochemical grade 99%; Sigma-Aldrich) was used as a supporting electrolyte. Research-grade nitrogen and oxygen gases (99.99%) were provided by Linde Gas Algérie.

2.1. Methods of Extraction

2.1.1. Extracts Containing Polyphenols

Polyphenols were extracted with 70% ethanol as solvent in a batch sonication system (Elmasonic 120 (H), Lauda Konigshofen, Germany; power, 80–320 W; frequency, 35 kHz), using a solid to liquid ratio of 1:10 at 40 °C, with an extraction time of 45 min [47]. The crude extract was filtered, and the residual biomass was dried at 40 °C and directly used for further extraction steps. The final filtered extract containing polyphenols is hereafter abbreviated as E1.

2.1.2. Extracts Containing Polysaccharides

The two main macroalgal polysaccharides, fucoidan and alginate, were sequentially extracted from the obtained residue after the separation of polyphenols by adapting a protocol reported by Yuan and Macquarrie [48]. First, fucoidan was extracted using HCl 0.1 M as solvent, with a solid/liquid ratio of 1:10, at 40 °C, with a 20 min extraction time.
The alginate was isolated using a cost-effective and soft separation method with 4% Na2CO3 solution. Both extracts were filtered and precipitated with a 1:1 v/v ethanol:extract ratio. The residual biomass and the filtered extracts were washed with distilled water and dried at 40 °C. The final extracts are hereafter abbreviated as E2 (fucoidan) and E3 (alginate).

2.2. Chemical Characterization of Extracts

In order to determine the total polyphenolic content (TPC), E1 analysed according to the Folin–Ciocalteu method and quantified in mg gallic acid equivalents per gram of biomass (mg GAE g−1) [49].
We evaluated the total reducing sugar content in the supernatant produced after the separation and filtration of the E2 and E3 extracts, as well as in the wastewater resulting from the purification processes. The concentration of the reducing sugars was determined following the method described by the IUPAC [50], using an Avanta UV-VIS GBS spectrophotometer at 540 nm.
Elemental analysis was carried out using the Pregl method [51] for carbon and hydrogen, the Kjeldahl method [52] for nitrogen and the Schöniger method [53,54] for sulphur, with all results expressed in percentage.
The FTIR spectra were obtained in duplicate using an IRAffinity-1 Shimadzu FTIR instrument in the wavenumber range of 400–4000 cm−1.
Proton nuclear magnetic resonance (1H NMR) spectra were recorded by a Bruker Avance DRX 400 MHz spectrometer using deuterated water as solvent and tetramethylsilane as internal reference. Chemical shifts are reported in parts per million (ppm) relative to the residual peak of the deuterated water used as solvent. For the preparation of samples, 5 mg each of dry extracts E2 and E3 was dissolved in 800 μL of D2O.

2.3. Determination of Extract Bioactivity

2.3.1. DNA Binding Studies

Double-stranded DNA (ds. DNA) was extracted from chicken blood using a nuclear cell lysis method [55]. Absorption spectroscopy and the molar absorption coefficient value of 6600 M−1·cm−1 at 260 nm were used to determine the concentration of DNA [56]. The obtained ratio of absorbance of A260/A280 in the DNA sample was 1.97, reflecting the purity of extracted ds. DNA, which was apparently free from proteins. All stock solutions were used within 5 days after preparation and stored at 4 °C until use.
Voltametric assays were performed using a PGZ301 voltammeter running on VoltaMaster 4 V 7.08 software, (Radiometer Analytical SAS, Lyon, France). The concentration of the supporting electrolyte was kept at 0.1 M. Nitrogen gas was bubbled through the solution to avoid any interference from air. Experiments were carried out in a 12 mL three-electrode electrochemical cell containing a platinum disk (Pt) working electrode with a geometric area of 0.013 cm2, a platinum wire as counter (auxiliary) electrode and an Hg/Hg2Cl2 paste-covered wire as reference electrode.
As a complementary method to the voltammetry techniques, electronic spectroscopy titration was performed to study the binding affinity of E2 and E3 with DNA in buffer phosphate solution (KH2PO4/K2HPO4) at pH = 7.2. The absorption spectra of a fixed amount of 2 mg of E2 and 6 mg of E3 were recorded in the absence and presence of a gradually increasing concentration of DNA stock solution. Absorption spectra measurements were conducted on a UV-Vis spectrometer, (Shimadzu 1800, Japan).

2.3.2. Superoxide Anion Radical Assay

Cyclic voltammetry measurements were performed on a platinum electrode at 100 mV·s−1 using a PGZ301 voltammeter running on VoltaMaster 4 V 7.08 software (Radiometer Analytical SAS, France).
In order to obtain kinetic curves and to calculate the IC50 values, the O2.- radical-scavenging activity was plotted based on Equation (1) against varying compound concentrations [57,58,59]. The antioxidant capacity of E2 and E3 was expressed as IC50. The IC50 value was defined as the concentration (mg/mL) of samples that inhibited the formation of O2.- radicals by 50%.
%   r a d i c a l   s c a v e n g i n g   a c t i v i t y =   i p a 0 i p a i p a 0 × 100  
where ipa0 and ipa are the anodic peak current densities of the superoxide anion radical in the absence and presence of E2 and E3, respectively.

2.3.3. DPPH (2,2-Diphenyl-1-picrylhydrazyl) Assay

Spectrophotometric experiments were performed to measure the antioxidant activity of E2 and E3 samples using DPPH free radical. Experiments were carried out by adding gradually increasing concentrations of E2 in DMF (5 mg/mL) or E3 (5 mg/mL) to a 2.1 mM DMF solution of DPPH. Absorbance at 524 nm was measured after 30 min of incubation in the dark. Finally, Equation (1) was applied to calculate % inhibition of DPPH. In order to obtain kinetic curves and to calculate the IC50 values, DPPH radical-scavenging was plotted against varying compound concentrations. The antioxidant capacity of E2 and E3 was expressed as IC50.

3. Results

3.1. Biomass Proximate and Ultimate Analyses

Prior to designing a biorefinery approach with the goal of recovering valuable molecules, the feedstock (Fucus spiralis macroalgae) was subjected to proximate and ultimate analyses; the chemical composition is listed in Table 1. The Fucus spiralis ash content is similar to the values reported in the literature for other algae species: an ash content of 21.0 ± 0.2% dw and 28.0 ± 0.2% dw for Laminaria digitata and 25.0 ± 0.2% dw and 26.5 ± 0.7% dw for Fucus spiralis [60]. Furthermore, [61] we determined an ash percentage of 31.0 ± 0.1% dw for untreated Laminaria digitata, whereas the washed alga generated a value of 7.9 ± 0.1% dw.
The among of reducing sugars detected in Fucus spiralis biomass was 16.3%. Lower limits of 9.71 ± 0.03% dw [62] and 10–11% dw [28] were reported, as well as higher concentrations [63]. With respect to the amount of proteins amount, the percentage obtained in the current study for Fucus spiralis is close to values registered in the case of Fucus vesiculosus, i.e., 12.99% dw [64] or 11% dw [28].

3.2. A Biorefinery Approach for Fucus spiralis Macroalgal Biomass Processing

Based on the chemical characterization of the feedstock and available studies concerning sequential separation of macroalgal compounds [39,44,48,65], a biorefinery flow sheet for Fucus spiralis biomass was designed (Figure 1). All solvents and methods were selected taking into consideration cost effectiveness and circular economy. Thus, a sustainable, efficient and minimal-waste approach was considered. The primary biorefinery step was designed to obtain easily extractible valuable molecules, such as polyphenols and saccharides.
The sequence starts with green light sonication (Figure 1) in order to separate the polyphenols. This step could also act as a pretreatment to make the biomass more suitable for the following extraction steps. Polyphenol separation in the initial biorefinery step is recommended in order to avoid the contamination of further extracted molecules [46,66,67]. Furthermore, Fucus is among the brown macroalgae genera with the highest percentage of polyphenolic compounds (1–14% dw) [31]. Usually, polyphenol separation from marine macroalgae is performed using formaldehyde as, as polyphenols have tight chemical bonds with macroalgal polysaccharides [68,69]. However, formaldehyde is known to be a carcinogenic solvent. Therefore, polyphenol extraction was performed with ethanol (70%), considering the positive yields it provides, GRAS recognition (Generally recognized as safe) and low cost [70,71]. Polyphenols were extracted in a batch sonication system using a 1/10 solid/liquid ratio at 40 °C, with an extraction time of 45 min.
For the extraction of fucoidan, hydrochloric acid was selected as solvent, as it has shown satisfactory results in extracting fucoidan in single processing or even in sequential extractions from brown algae [48]. After washing the algal residue in distilled water, alginate is the next compound to be extracted using sodium carbonate [19,44]. A low temperature was chosen in order to avoid the degradation of the targeted metabolites [28,67]. Fucoidan and alginate must be separated sequentially; otherwise, both molecules would be separated in the same extract following the degradation of the algal cell wall [72].
The Fucus spiralis solid residue generated as waste after the separation of bioactive molecules was designated as a biosorbent for a cascade of sorption/desorption cycles. Several studies have dealt with the use of macroalgae to uptake pollutants from wastewater due to their effectiveness in the removal of low concentrations and relatively low cost in comparison to conventional adsorbents [73,74,75,76,77]. The literature has proven that brown macroalgae are very good biosorbents and are more effective in the removal of harmful pollutants than red and green algae [78,79]. In most previous studies, including research using Fucus spiralis [73], researchers used the entire algal biomass as biosorbent, whereas few studies involved biosorption tests with seaweed waste. Examples include the use of red algae waste generated from agar extraction to adsorb Cu+2, Pb+2 and Cd+2 [80,81,82] and the application of dealginated brown macroalgae waste [83,84]. Residues derived from brown macroalgae Laminaria digitata and green macroalgae Ulva lactuca were used as biosorbent for Ce+3, Pb+2, Cu+2 and Ni+2 [85]. However, only our team has reported satisfactory biosorption results with Fucus spiralis waste [75].
Considering all these aspects, the designed biorefinery approach was regarded to be a viable option for the processing of Fucus spiralis biomass and was therefore applied in the current study.

3.3. Extract Characterization

3.3.1. Yield and Chemical Characterization of Polyphenolic Extract (E1)

The Fucus spiralis polyphenol extract E1 registered a total polyphenolic content (TPC) of 3.4 ± 0.0 mg GAE g−1. This value is lower than those obtained in [86] for Laminaria digitata (37.66 ± 0.00 mg GAE g−1 dry seaweed) and Laminaria saccharina (66.75 ± 3.72 mg GAE g−1 dry seaweed) collected from Northern Ireland but comparable to those generated for conventional polyphenol separation from Laminaria japonica (38.47 ± 0.88 GAE mg/100 g dry seaweed), Lessonia trabeculate (49.80 ± 5.68 GAE mg/100 g dry seaweed) and Ascophyllum nodosum (51.47 ± 3.28 GAE mg/100 g dry seaweed) [87]. The geographic areas in which the algae originated, as well as the time of collection and pretreatment processes, could explain these differences. The polyphenol extraction yield obtained from Fucus spiralis was 14.0% dry seaweed.

3.3.2. Yield and Chemical Characterization of Fucoidan Extract (E2)

Fucoidan is an anionic heteropolysaccharide with a linear structure [88]. Fucoidan from Fucus spiralis was obtained after the separation of polyphenols with a yield (1.35 ± 0.1% dry seaweed) similar to values reported for brown macroalgae through conventional methods [46] and green methods [36]. The algal polymer extracted from brown species Sargassum crispifolium with 80% carbohydrate content by conventional isolation method and using distilled water as solvent generated a yield value of 1.50% dry basis [89]. Using a much higher extraction time (8 h), fucoidan was separated from Sargassum mcclurei, Sargassum polycystum and Turbinara ornata using CaCl2 2%, with yields between 2.10 and 2.75% dried seaweed [90]. However, a separation method that increases the extraction yield is not necessarily favourable for structural integrity, purity and bioactive properties of the extracts [46].
In terms of chemical composition, elemental analysis of the E2 extract (Table 2) indicates the presence of sulphur, which pinpoints the fucoidan compound, as well as a high level of carbon (32.1%). Elemental assays in Fucus serratus and Fucus vesiculosus identified lower carbon values (21–28%) [91]. The amount of sulphur is much lower than that obtained from Fucus vesiculosus (9–12%) [34]. The H% content of the obtained fucoidan is similar to the values reported for other brown macroalgae: 4.77% for Fucus vesiculosus, 4.78% for Fucus serratus [92], 4.64% for Laminaria japonica [93] and 4.99% for Undaria pinnatifida [94]. Moreover, a 3.47% hydrogen content reported for fucoidan standard [95].
E2 was also subjected to FTIR characterisation (Figure 2). The spectra indicate the presence of carboxyl and carbonyl groups according to the peak registered at 1718 cm−1 [96]. Furthermore, an intense peak highlights the presence of the sulphate functional groups (S=O) characteristic of fucoidan at a wavelength of 1226 cm−1 [34,97]. Two additional groups, one characteristic of sulphonamides, i.e., N=S=O [98], and one associated with C-O-SO3, were observed at 1136 cm−1 and at 1024 cm−1, respectively. Groups containing sulphur (S) play an important role in determining the bioactive properties of fucoidan [67]. The sulphate functional group of marine macroalgae polysaccharides is associated with the antiviral properties of these compounds [88]. The peak at 1535 cm−1 indicates the presence of an N-H protein group in the structure of the amide II. The peak identified at 1408 cm−1 was assigned to the C-N group of amide III, whereas that identified at 1613 cm−1 was assigned to the C=O functional group of amide I or to the functional groups of uronic acids [98]. Additionally, wavelengths 812 and 886 cm−1 were associated with units of mannuronic acid in the structure of alginate [97,99], which indicates that a complete separation of fucoidan could not be achieved.
The NMR spectrum (Figure 3) of E2 highlights the chemical structures of fucoidan. The peak at 5.337 ppm was assigned to α3-linked 2-mono-O-sulfated-L-fucopyranose residues [100]. Another characteristic structure, -α-L-fucose, was identified through the intense signal at 4.8 ppm. The several intense peaks at 3.68-3.88 ppm were attributed to 4-linked 2-mono-O-sulfated L-fucopyranose residues [100], whereas the peak at 3.37 ppm was associated with ß-d-xylose [98]. Finally, the signal at 1.26 was assigned to the C6 methyl proton group of L-fucopyranose [100,101].
Only traces of mono- or oligosaccharides in the supernatant and in the residual wash waters obtained from the separation of fucoidan extract were determined. Considering that the acid extraction of fucoidan may also remove any remaining polyphenols [102], the TPC of the supernatant was analysed. The obtained result, 1.68 mg GAE g−1, indicates that following fucoidan extraction, a high polyphenolic content is still released equal to more than half of the total polyphenolic content initially separated initially UAE. Some studies have associated the antioxidant activity of fucoidan extracts with the presence of polyphenolic impurities [37].

3.3.3. Yield and Chemical Characterization of Alginate Extract (E3)

Alginate is the third targeted bioproduct and was separated with a yield of 47.0 ± 1.0% dry seaweed. This value is significantly higher than the alginate yield obtained from Fucus vesiculosus (16.2 ± 3.2% w/w) [103]. In a study on Durvillaea potatorum an alginate yield of 36.55% w/w was reported [104]. Other authors reported a 21.06% w/w yield for alginate separated from Laminaria japonica using Na2CO3 2% for 5 h at 60 °C [41], and a similar value was reported for Ecklonia radiata using Na2CO3 0.2 M for 120 min at 45 °C [46].
In terms of chemical composition, the elemental analysis of E3 (Table 2) shows similar carbon and hydrogen percentage values to those reported in the literature [105]. The amount of sulphur is lower than the alginate fraction from Sargassum fusiforme (12.5%) [106]. The presence of sulphur in the composition of the alginate extract can be beneficial for bioactive properties, but it also indicates fucoidan residues.
Alginate is a marine polysaccharide found in macroalgae, as well as other marine organisms. Its structure comprises homogenous or heterogenous disposition of β-D-mannuronic acid (M) and α-L-guluronic acid (G) [107]. Spectral analysis of E3 (Figure 4) identified the presence of guluronic units (G) at 1017 cm−1 [96,97,99] and mannuronic units (M) at 872 and 812 cm−1 [97,99], confirming the isolation of alginate. The presence of uronic acids is also indicated by the functional groups identified at 1598 and 1397 cm−1. Furthermore, sulphate (characteristic of fucoidan) was observed at 1159 and 1248 cm−1 [97], suggesting that the extraction was not completely selective.
The 1H NMR spectrum of E3 representing the uronic acid sequence is depicted in Figure 5. The peak at 5.03 ppm was associated with H1 of α-l-guluronic acid [106,108]. The presence of M units in the extract was indicated through an intense peak at 4.62 ppm, which was assigned to β-d-mannuronic acid residues [106,108]. Resonance signals of G units were also identified by peaks at 4.45 and 4.3 ppm [109].
In the supernatant resulting after E3 separation, a total polyphenolic content (TPC) of 0.18 mg GAE g−1 was determined. The presence of polyphenols is due to the use of ethanol, which facilitates the release of residual aromatic fractions from the cell wall of the macroalgae [19].

3.4. Assessment of Targeted Molecule Bioactivity

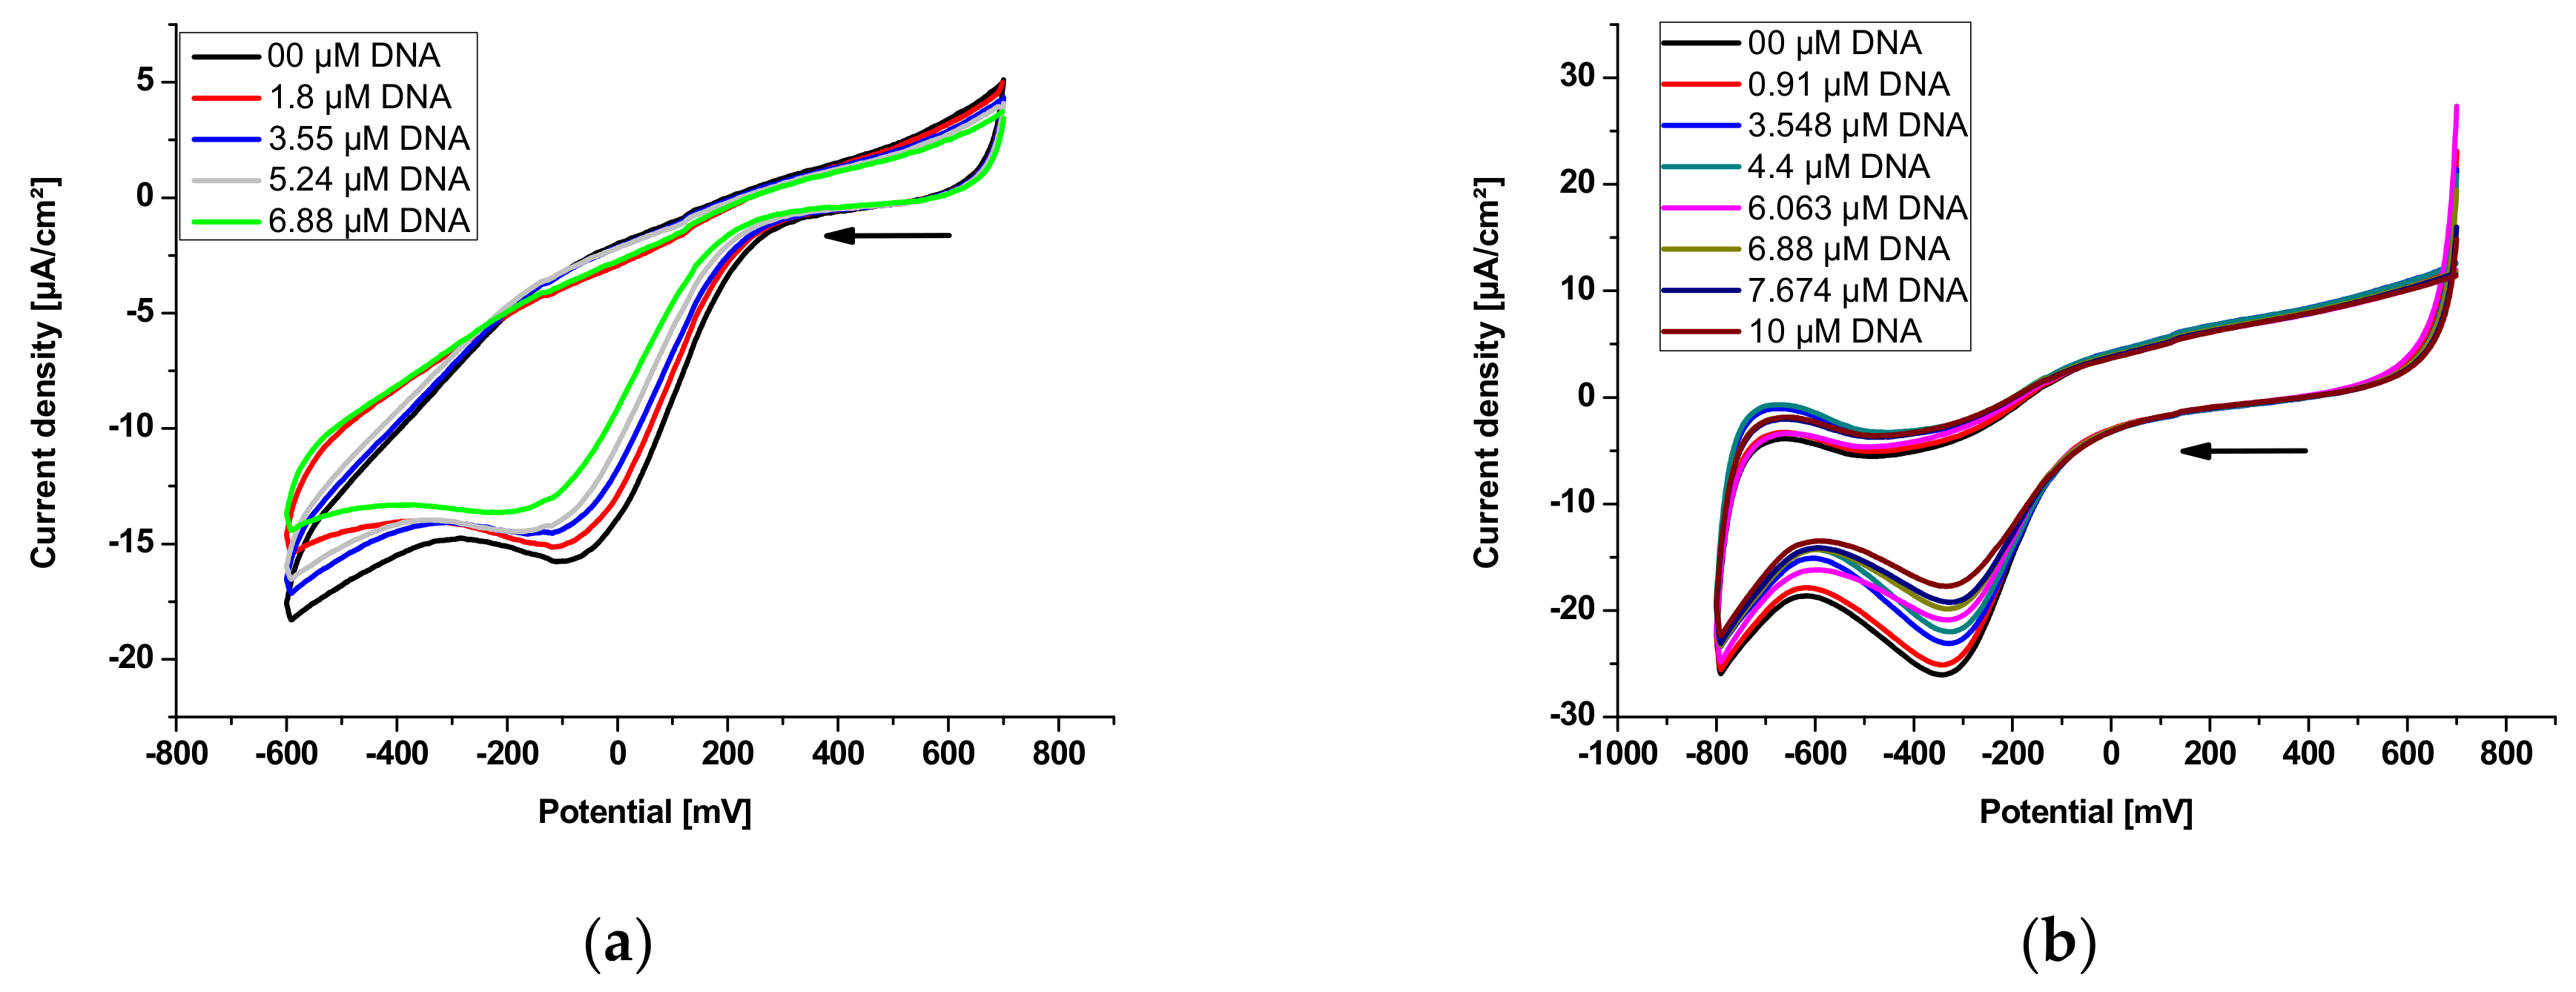
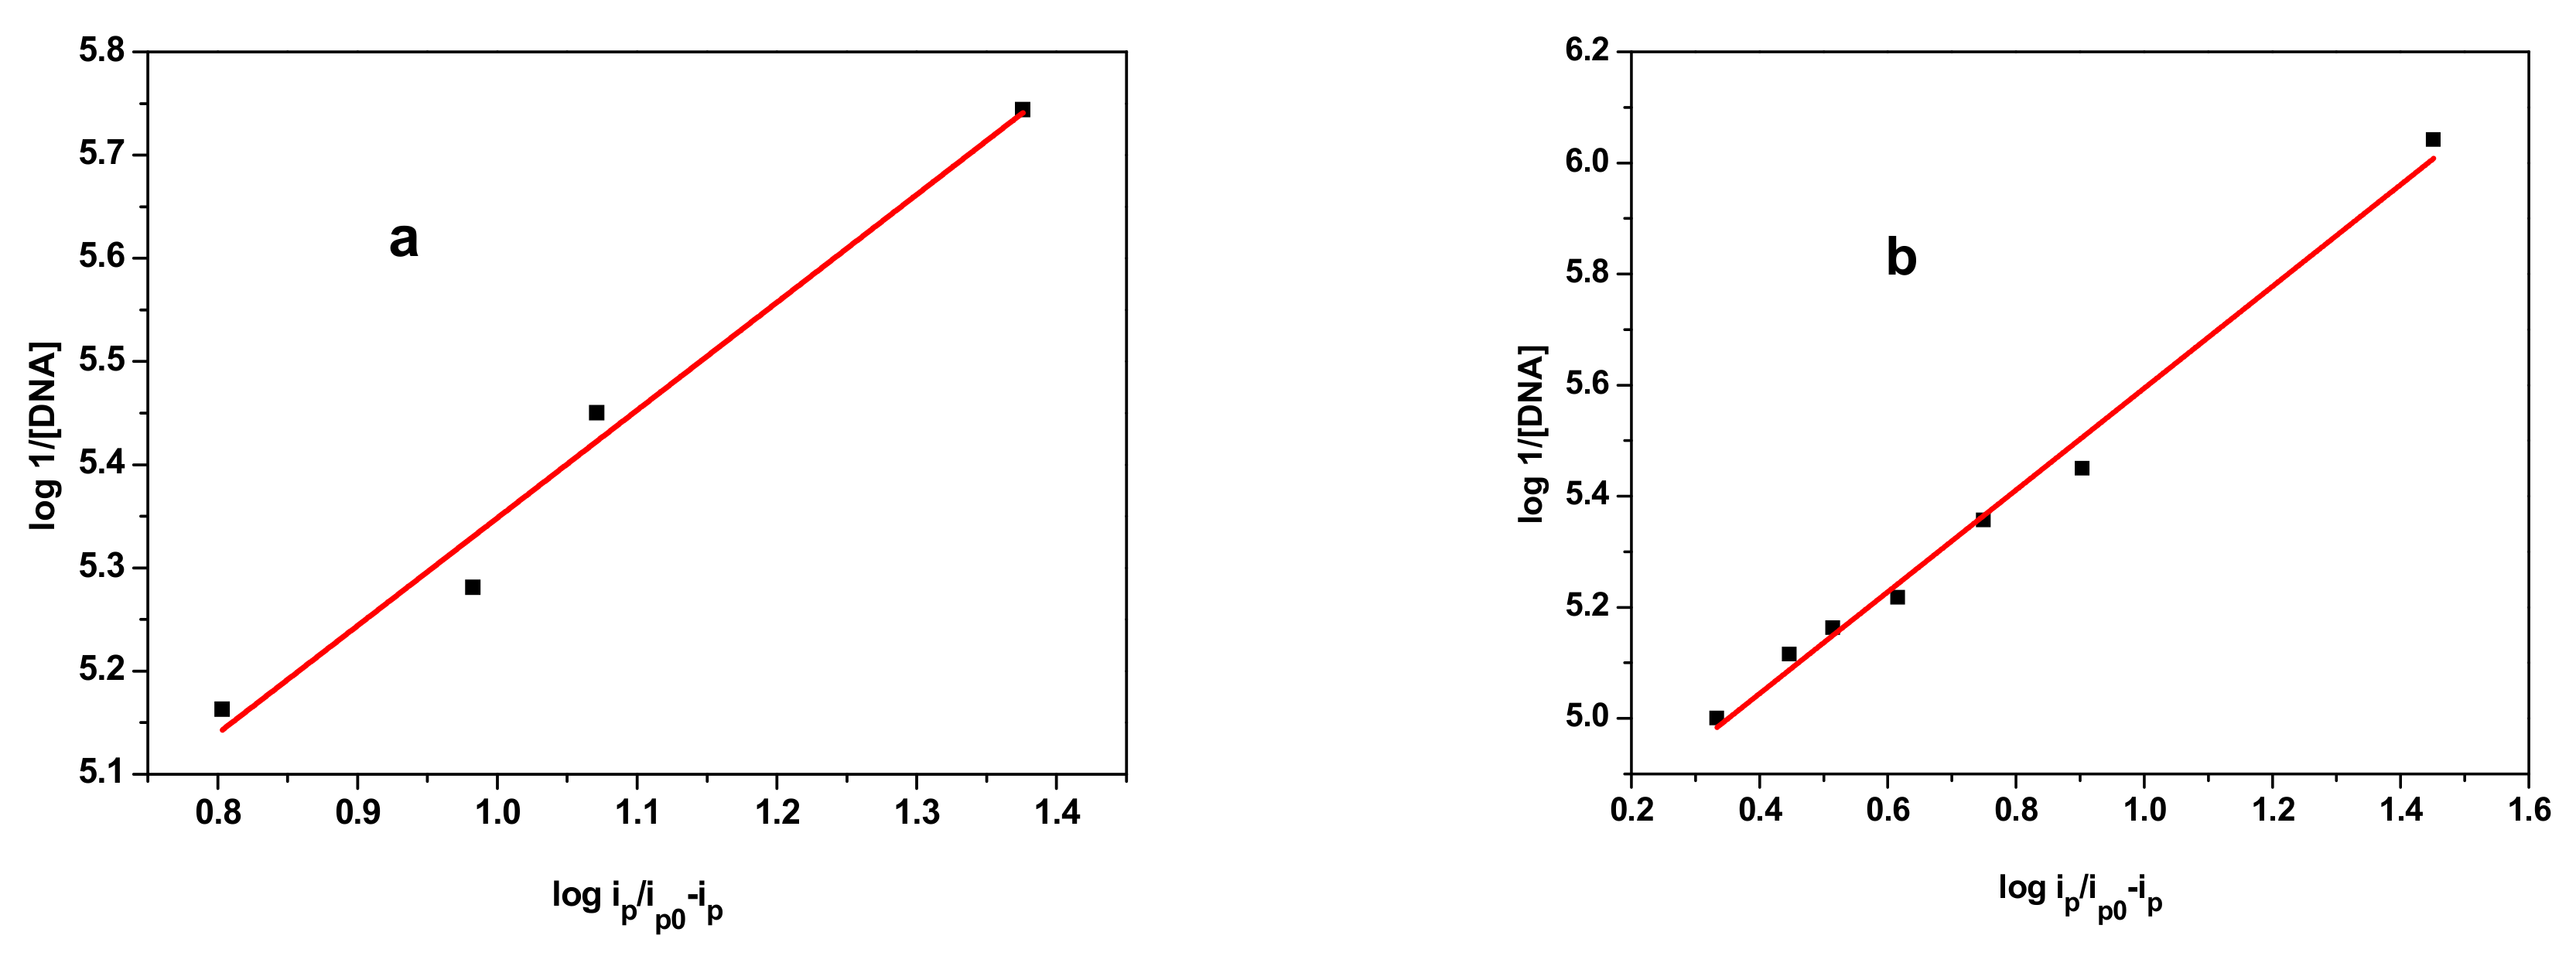
3.4.1. Electrochemical DNA Binding Study

In the absence of DNA, the voltammograms of compounds E2 and E3 in a phosphate-buffered solution (KH2PO4/K2HPO4) show a cathodic peak potential at −94 and −342 mV, respectively. On the other hand, in the presence of a concentration of 6.88 µM of DNA, the peak potential of E2 was shifted to a more negative value of −173 mV, with an apparently negative shift of −79 mV, whereas the peak potential of E3 was shifted to a more positive value of −335 mV, with an apparently positive shift of +7 mV (Figure 6). These results indicate that E2 interacts with DNA via an electrostatic mode [55,56], whereas the obvious positive shifts of peak potentials of E3 indicate that the interaction mode may be intercalation between E3 and DNA. The voltammograms also show a drop in the cathodic peak current densities, which can be attributed to slow diffusion of the formed DNA-E2 and DNA-E3 adducts.
The negative shift in the cathodic peak potential that occurred as a result of the addition of DNA to E2 was caused by the electrostatic interaction of the anionic drug with the DNA backbone [56,110]; therefore, the obvious negative peak potential shift (cathodic shift) in the CV behaviour of E2 with the addition of DNA can be attributed to the electrostatic interaction (H-bonding) between E2 and DNA. This negative peak potential shift further indicates that E2 residue is easier to reduce in the presence of a negative DNA environment. However, the positive shift observed in the cathodic peak potential caused by the addition of DNA to E3 can be explained by the intercalation interaction mode between E3 and DNA. This positive shift further indicates that the formed adduct DNA-E3 is electrochemically more stable than E3.
The binding constant of the interactions of E2 and E3 with DNA can be calculated based on the decrease in the cathodic peak current density of DNA-E2 and DNA-E3 adducts relative to free E2 and E3, respectively, using the following Equation (2) [111]:
log 1 D N A = log K b + l o g i p i p 0 i p
where [DNA] is the DNA concentration (M); Kb represents the binding constant (M−1); and ip0 and ip denote the cathodic peak current density of the free and DNA-bound compound (μA·cm−2), respectively.
The plot of log 1/[DNA] versus log ip/ip0ip should afford a straight line with a ‘y’ intercept equal to the logarithm of binding constant Kb. To obtain the plot log1/[DNA] versus log ip/ip0ip, voltammograms of E2 and E3 were obtained in the absence and presence of an increasing concentration of DNA (Figure 7).
The plot of log 1/[DNA] versus log ip/ip0 – ip is shown in Figure 8, which is a straight line with a ‘y’ intercept equal to the logarithm of binding constant Kb.
The values of binding constants obtained from the regression of Figure 8 are tabulated in Table 3.
The binding free energy change was calculated using the following Equation (3) [112]:
Δ G = R T ln K b
where ∆G is the binding free energy in KJ·mol−1, R is the gas constant (8.32 J·mol−1·K−1) and T is the absolute temperature (298 K). Values are also listed in Table 3.
The order of the magnitude of binding site size (s) in terms of the base pair of DNA can provide information about the interaction of small molecules with DNA. The binding site size(s) can be calculated according to the following Equation (4) [113]:
C b C f = K b f r e e   b a s e   p a i r s s
where s represents the binding site size in terms of the base pair, Kb is the binding constant, Cf is the concentration of free compound and Cb represents the concentration of DNA-bound compound.
Considering the concentration of DNA in terms of nucleotide phosphate (NP), the concentration of the DNA base pair is expressed as [DNA]/2, so Equation (5) can be expressed as:
C b C f = K b D N A 2 s
The Cb/Cf ratio is equal to (ip0ip)/ip [114], which are the values of the experimental peak current densities.
The obtained values of binding site size for both samples are summarized in Table 4. The low value of the binding site size of E2 further indicates the electrostatic interaction of E2 with DNA. In addition, the relatively higher value of the binding site size of E3 confirms the intercalation interaction of E3 with DNA.
The diffusion coefficient is a parameter that further confirms the interaction of E2 or E3 with DNA; free E2 or E3 diffuses more rapidly in solution than their adducts, E2-DNA or E3-DNA. The diffusion coefficients of the free and DNA-bound forms of E2 and E3 were determined using the Randles–Sevcik Equation (6) [115].
i = 2.69 × 10 5 n 3 2 A C D 1 2 v 1 2
where n is the number of electrons per species reaction, C is the bulk concentration (mol·cm−3) of the electroactive species, D is the diffusion coefficient (cm2/s) and v is the scan rate (V/s).
The plots of v versus ip are displayed in Figure 9, whereas the diffusion coefficient values are presented in Table 5. The diffusion coefficients of the DNA-E2 and DNA-E3 adducts are lower than those for the free E2 and E3 samples, indicating the formation of a high-molecular-weight complex that diffuses slowly toward the electrode.

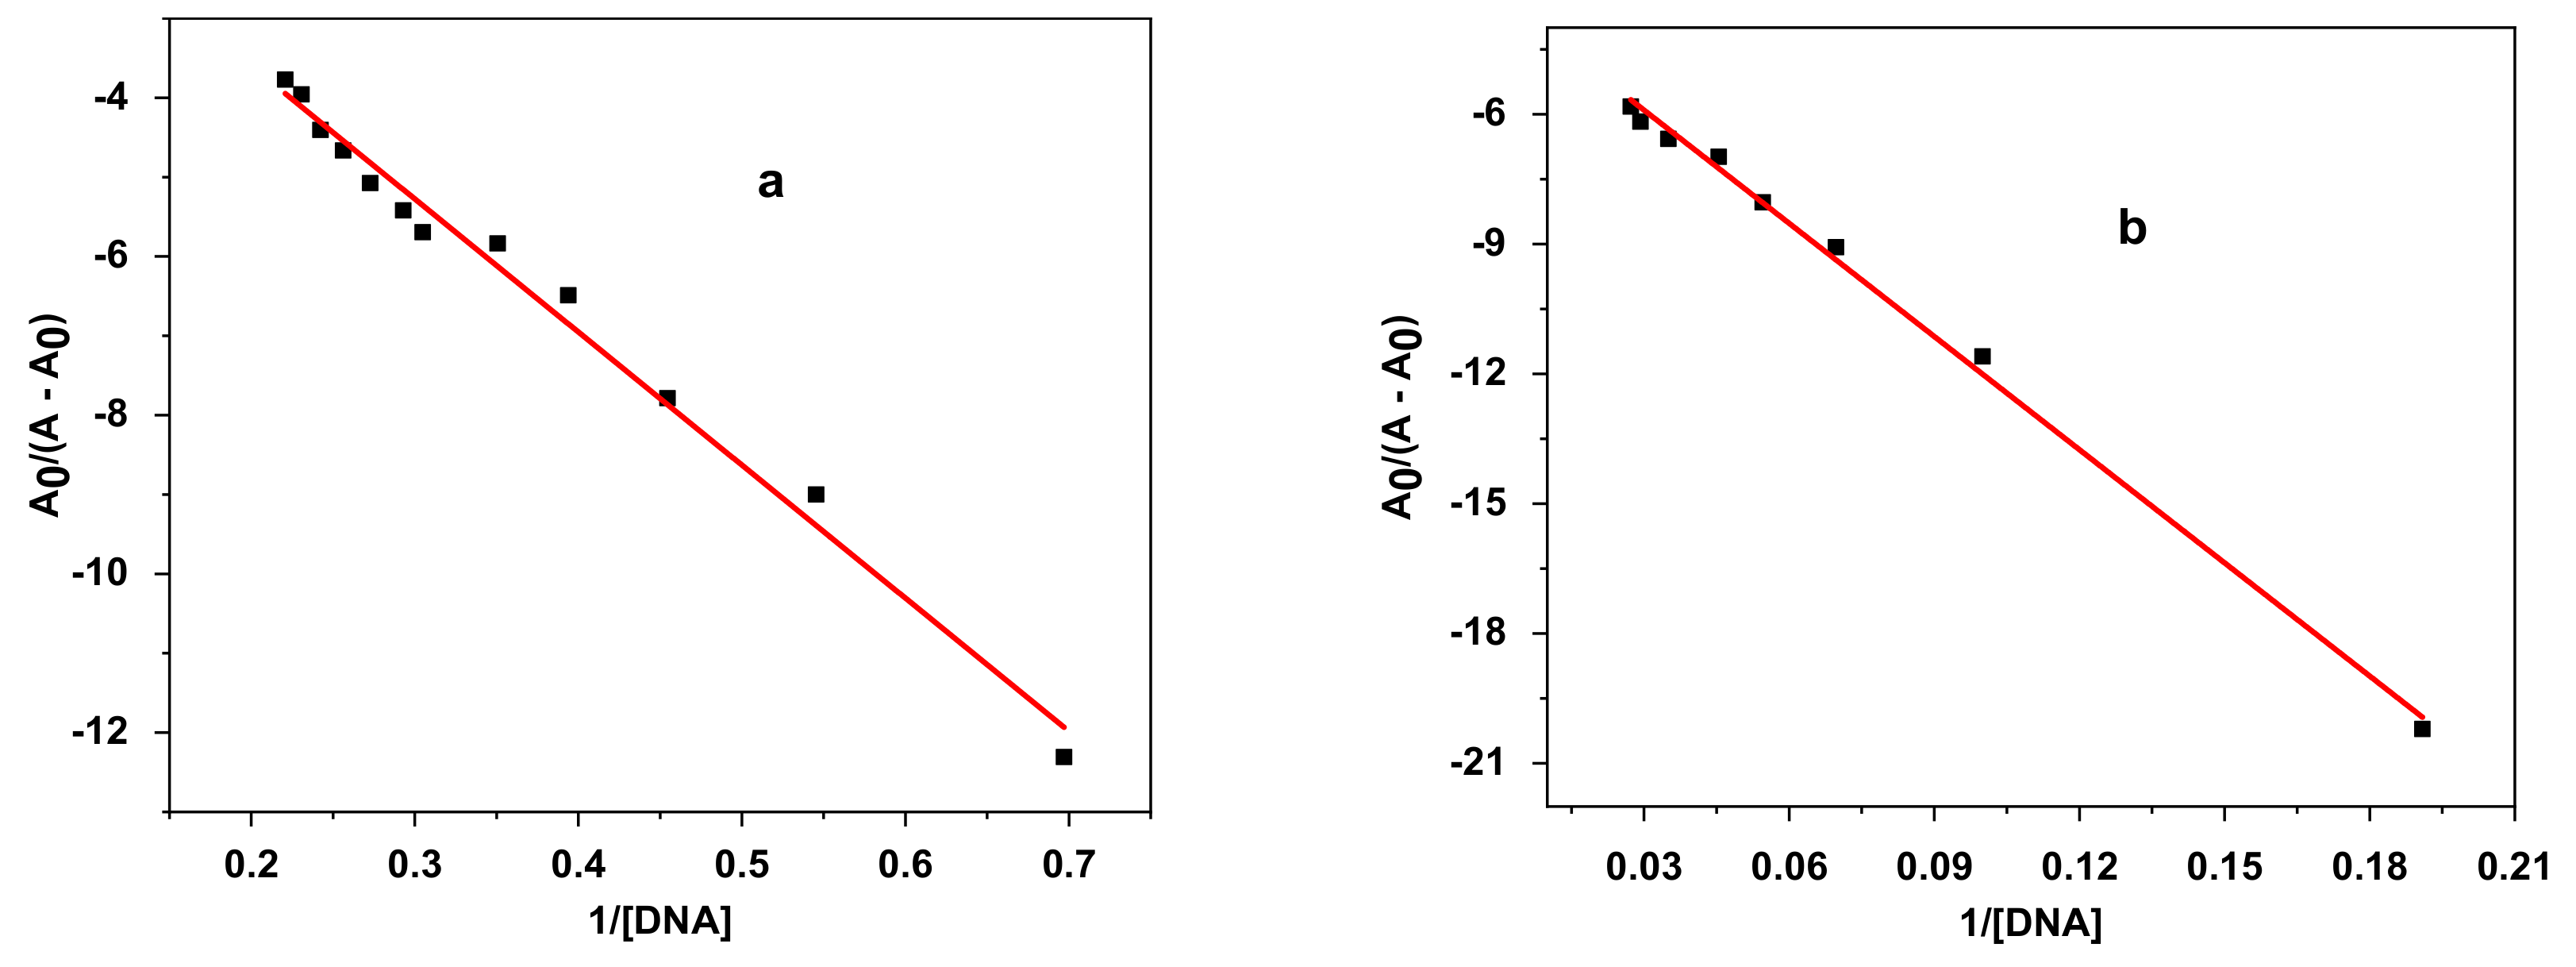
3.4.2. Electronic Spectroscopy DNA Binding Study

The absorption spectra of E2 and E3 in the absence and presence of a gradually increasing concentration of DNA stock solution are shown in Figure 10. In the ultraviolet region, E2 has one absorption peak at 281 nm (Figure 10a), and E3 also displays one peak at 268 nm (Figure 10b).
Upon addition of DNA, a significant hypochromicity was observed without any noticeable shift in the position of the maximum absorption peak, clearly indicating the formation of the adducts E2-DNA and E3-DNA, with hypochromicity further suggesting the groove-binding property of E2 and E3 compounds with respect to the double-stranded DNA [116].
Absorbance values were changed by increasing DNA concentration to evaluate the binding constant using the following Equation (7), [117]:
A 0 A A 0 = ε G ε H G ε G + ε G ε H G ε G 1 K b D N A
where [DNA] is the DNA concentration; Kb is the binding constant; A0 and A are the absorbance of E2 and E3, respectively, in the absence and presence of DNA; and εG and εH-G are their extinction coefficients, respectively.
The binding constant (Kb) is obtained from the intercept to slope ratio of the plot of A0/(A – A0) versus 1/[DNA] (Figure 11). The binding free-energy change was calculated using Equation (4). Values for both binding constant and free energy are listed in Table 6.
The values of the binding free energy and binding constant obtained from cyclic voltammetry (Table 3) and electronic spectroscopy (Table 6) are in agreement.

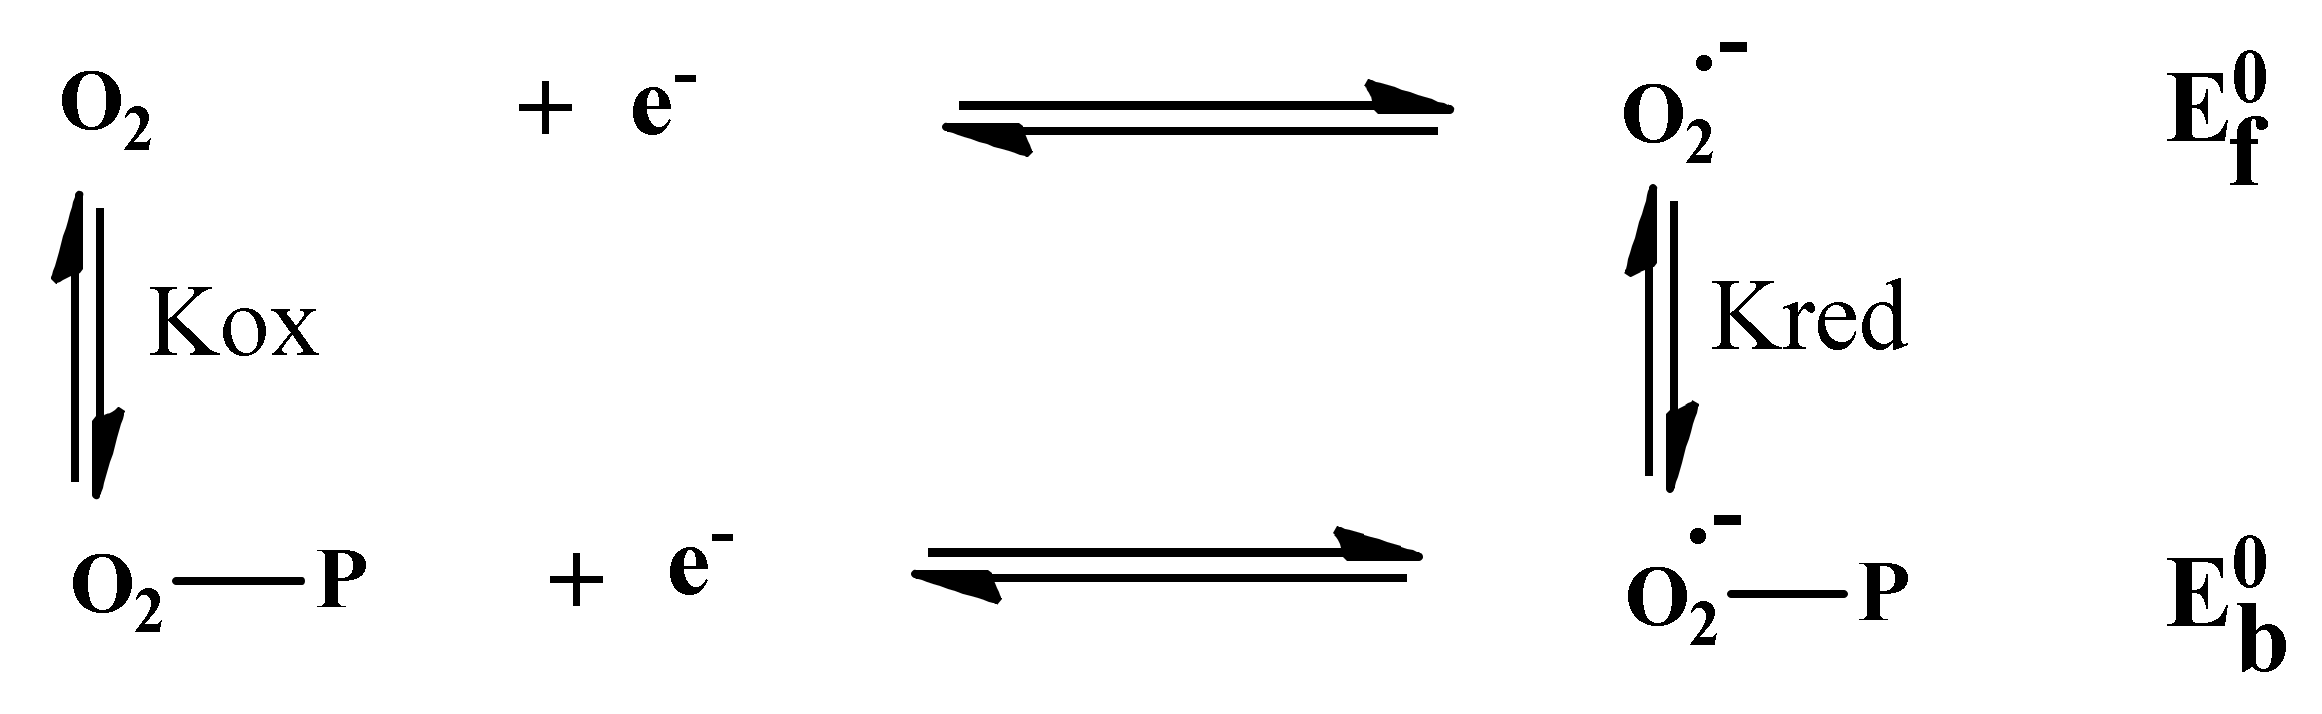
3.4.3. Superoxide Anion Radical Assay

The one-electron reduction in molecular oxygen generates the superoxide anion radical; this reactive oxygen species causes cell degradation and leads to aging and various diseases [118]. Antioxidants of various natures play a major role in the prevention of these occurrences. Figure 12 shows the decrease in the anodic peak potential of the voltammograms of the radical O2.- in the presences of varying concentrations of E2 and E3.
The equations obtained from the linear calibration graph in the studied concentration range for E2, E3 and α-tocopherol are summarized in Table 7 (where y represents the value of the anodic peak current density of O2.-, and x represents the value of the sample concentrations, expressed as mg/mL). All the tests were performed in triplicate, and the graph was plotted according to the averages of three observations. The obtained results indicate that the O2.- radical-scavenging activity of E2 is slightly higher than that E3, and both are higher than that of the standard antioxidant α-tocopherol.
In the presence of E2 and E3, the anodic peak potentials of the redox couple O2/O2.- were shifted to more negative potentials. This shift was associated with a significant decrease in anodic peak current density. The significant drop in anodic peak current density can be assigned to the decrease in O2.- concentration due to the formation of slowly diffusing E2-O2.- and E3-O2.- complexes. Typical CV behaviour of O2.- in DMSO/0.1 M Bu4NBF4 in the potential window of 0.0 to −1.4 V at a Pt electrode in the presence of E2 (a) and E3 (b) is shown in Figure 13.
The free O2/O2.- redox couple exhibits one oxidation peak at −0.6764 V and one reduction peak at −0.8411 V. Figure 14 also shows the effect of the addition of E2 and E3 to a solution of O2.- in DMSO/0.1M Bu4NBF4 on the oxidation peak current density of the O2/O2.- couple. The decrease in the anodic peak current density caused by the addition of E2 or E3 can be explained by the reaction of O2.- with E2 and E3 [119]. This decrease can be used to calculate the binding constant, whereas the shift in peak potential values can be exploited to determine the mode of interaction [120,121].
The addition of varying concentrations of E2 or E3 in DMSO to a solution of DMSO saturated with commercial oxygen provokes a remarkable decrease in the peak current density (Figure 13). The substantial diminution in peak current density can be attributed to the decrease in free O2/O2.- radical concentration due to the formation of E2-O2.- or E3-O2.- product. The gradual decrease in peak current density of the O2/O2.- redox couple by increasing E2 or E3 concentrations can be exploited to calculate the binding constant by applying the following Equation (8) [122]:
l o g 1 C = l o g K b + l o g i p a i p a 0 i p a  
where iPa0 and iPa are the peak currents of the superoxide anion radical in the absence and presence of E2 and E3, respectively; whereas C is the concentration of E2 or E3. As C is not known, this term was replaced by the volume of the added E2 or E3V).
The volume of the solution containing O2.- is fixed; thus, the addition of volume increments of E2 or E3 is proportional to the addition of an increased number of moles (i.e., concentration) of the compounds. Binding free energy in this case can be calculated using the following Equation (9) [119]:
l o g 1 Δ V = l o g   K b + l o g i p a i p a 0 i p a
In Equation (9), ΔV represents the added volume of E2 or E3 (mL); Kb refers to the binding constant; and iPa0 and iPa are the anodic peak current densities in the absence and presence of E2 or E3, respectively.
The binding free-energy change was calculated using Equation (4). The values of binding constant and binding free energy are summarized in Table 8.
The addition of 0.6 mL of E2 or 0.5 mL of E3 has caused a slight shift in peak potential ΔE0 in the negative direction in association with a remarkable decrease in anodic peak current density due to the scavenging activity of the added compounds [123] (Figure 13). The significant drop in anodic peak current density can be assigned to the decrease in O2.- radical concentration due to the formation of E2-O2.- or E3-O2.- complexes. The peak potential shift of the O2/O2.- redox couple in the negative direction in the presence of E2 or E3 indicates that the oxidation of O2.- occurs more easily in the presence of E2 or E3 because its oxidized form, O2, is less strongly attached to E2 or E3 than its reduced form, O2.. For such a system, where both forms of the O2/O2.- redox couple interact with E2 or E3, Figure 14 can be applied [114].
The application of the Nernst relation to the process presented in Figure 14 leads to Equation (10) [124]:
Δ E 0 = E b 0 E f 0 = E 0 ( O 2 . P ) E 0 ( O 2 . ) = 0.059   l o g K r e d K o x
where E f 0 and E b 0 are the formal potentials of the O2/O2.- couple in the free and bound forms, respectively.
The ratio of the binding constants is calculated by replacing ΔE0 from Table 9 in Equation (10).
The obtained ratios of the binding constants indicate that the reaction of E2 with O2.- is twice as strong as that of E3 with O2.-, which explains the high antioxidant activity of E2. Furthermore, values of the ratio of the binding constants indicate that the interaction of the reduced form (O2.-) of the couple O2/O2.- with E2 or E3 is always stronger than that of the oxidized form (O2).

3.4.4. DPPH (2,2-Diphenyl-1-picrylhydrazyl) Assay

The antioxidant activity of the macroalgae extracts was also evaluated using DPPH. The equations obtained from the linear calibration graph in the studied concentration range for E2 and E3 samples and α-tocopherol are summarized in Table 10 (where y represents the value of the absorbance of DPPH, and x represents the value of sample concentrations, expressed as mg/mL). All tests were performed in triplicate, and the graph was plotted with the averages of three observations.
The obtained results presented in Table 10 indicate that the DPPH radical-scavenging activity of E2 is slightly higher than that of E3, with both approximately equivalent to that of the standard antioxidant α-tocopherol.
The independence of absorbance upon addition of the gradually increasing concentration of E2 and E3 to a DPPH solution is presented in Figure 15. The figure clearly shows a decrease in absorbance following the addition of the studied compounds.
The change in absorbance values by increasing E2 and E3 concentration was used to evaluate the intrinsic binding constant by employing Equation (11), [125].
A 0 A A 0 = ε G ε H G ε G + ε G ε H G ε G 1 K b [ P ]
where [P] is the E2 or E3 concentration; Kb is the binding constant; A0 and A are the absorbance values of DPPH in the absence and presence of E2 or E3, respectively; and εG and εH-G are their extinction coefficients, respectively. The constant Kb is obtained from the intercept-to-slope ratio of the plot of A0/(A − A0) versus 1/[P] (Figure 16).
The binding free-energy change was calculated using Equation (4), and the values are presented in Table 11.
Values of binding free energy listed in the previous table are very close to each other, which may indicate that the studied compounds bind to DPPH in the same manner via their nitrogen atoms.

4. Conclusions

In this study, we highlighted a biorefinery approach applied for the first time, at lab scale, to Fucus spiralis biomass, with the aim of generating high-value compounds with bioactive properties.
Chemical characterization showed the presence of the targeted algal polysaccharides in the obtained extracts through the identification of S=O (1226 cm−1), N=S=O (1136 cm−1) and C-O-SO3 (1024 cm−1) groups characteristic to fucoidan, guluronic, (G) (1017 cm−1) and mannuronic units (M) (872 and 812 cm−1) specific to the alginate compound.
Cyclic voltammetry and electronic spectroscopy were performed in order to determine the DNA binding affinity and antioxidant activity of E2 (fucoidan) and E3 (alginate) extracts. A comparison of the binding constant and free-energy values of the generated adducts indicated consistency in the generated results with respect to the interaction of fucoidan and alginate with DNA.
Both polysaccharides demonstrated antioxidant activity, with fucoidan having a slightly higher effect than alginate in both DPPH and O2.- radical assays. In DPPH assays, the registered IC50 values of E2 and E3 were 4.49 ± 0.21 and 4.83 ± 0.34 mg/mL, respectively. However, in O2.- assays, the obtained IC50 values were 0.13 ± 0.04 mg/mL for fucoidan and 0.19 ± 0.06 mg/mL for alginate. Both assays revealed higher antioxidant activity than that of the control antioxidant, α-tocopherol.

Author Contributions

Conceptualization, I.V. and T.L.; methodology, T.L. and E.L.; software, C.F. and E.L.; validation, I.V., T.L. and V.I.P.; formal analysis, C.F. and E.L.; investigation, C.F. and E.L.; resources, I.V., V.I.P. and T.L.; data curation, C.F. and E.L.; writing—original draft preparation, C.F.; writing—review and editing, I.V., T.L. and V.I.P.; visualization, C.F. and E.L.; supervision, I.V.; project administration, I.V.; funding acquisition, I.V. All authors have read and agreed to the published version of the manuscript.

Funding

This research was funded by Ministry of National Education of Romania and “Gheorghe Asachi” Technical University of Iasi.

Institutional Review Board Statement

Not applicable.

Informed Consent Statement

Not applicable.

Data Availability Statement

Not applicable.

Acknowledgments

Gratitude is due to Luminita Marin and Manuela Iftime from Petru Poni Institute of Macromolecular Chemistry Iasi, Romania, for their support with the NMR and elemental analyses.

Conflicts of Interest

The authors declare no conflict of interest.

References

  1. Konda, N.V.S.N.M.; Singh, S.; Simmons, B.A.; Klein-Marcuschamer, D. An Investigation on the Economic Feasibility of Macroalgae as a Potential Feedstock for Biorefineries. Bioenergy Res. 2015, 8, 1046–1056. [Google Scholar] [CrossRef]
  2. Lehahn, Y.; Ingle, K.N.; Golberg, A. Global potential of offshore and shallow waters macroalgal biorefineries to provide for food, chemicals and energy: Feasibility and sustainability. Algal Res. 2016, 17, 150–160. [Google Scholar] [CrossRef]
  3. Kawai, S.; Murata, K. Biofuel production based on carbohydrates from both brown and red macroalgae: Recent developments in key biotechnologies. Int. J. Mol. Sci. 2016, 17, 145. [Google Scholar] [CrossRef]
  4. Ryu, H.J.; Oh, K.K. Combined De-Algination Process as a Fractionation Strategy for Valorization of Brown Macroalga Saccharina japonica. Appl. Biochem. Biotechnol. 2017, 182, 238–249. [Google Scholar] [CrossRef]
  5. Sudhakar, K.; Mamat, R.; Samykano, M.; Azmi, W.H.; Ishak, W.F.W.; Yusaf, T. An overview of marine macroalgae as bioresource. Renew. Sustain. Energy Rev. 2018, 91, 165–179. [Google Scholar] [CrossRef]
  6. Pinteus, S.; Lemos, M.F.L.; Alves, C.; Neugebauer, A.; Silva, J.; Thomas, O.P.; Botana, L.M.; Gaspar, H.; Pedrosa, R. Marine invasive macroalgae: Turning a real threat into a major opportunity—The biotechnological potential of Sargassum muticum and Asparagopsis armata. Algal Res. 2018, 34, 217–234. [Google Scholar] [CrossRef]
  7. Marinho, G.; Nunes, C.; Sousa-Pinto, I.; Pereira, R.; Rema, P.; Valente, L.M.P. The IMTA-cultivated Chlorophyta Ulva spp. as a sustainable ingredient in Nile tilapia (Oreochromis niloticus) diets. J. Appl. Phycol. 2013, 25, 1359–1367. [Google Scholar] [CrossRef]
  8. Apostolova, E.; Lukova, P.; Baldzhieva, A.; Katsarov, P.; Nikolova, M.; Iliev, I.; Peychev, L.; Trica, B.; Oancea, F.; Delattre, C.; et al. Immunomodulatory and Anti-inflamatory effects of Fucoidan: A Review. Polymers 2020, 12, 2388. [Google Scholar] [CrossRef]
  9. Bodea, I.M.; Cătunescu, G.M.; Pop, C.R.; Fiț, N.I.; David, A.P.; Dudescu, M.C.; Stănilă, A.; Rotar, A.M.; Beteg, F.I. Antimicrobial Properties of Bacterial Cellulose Films Enriched with Bioactive Herbal Extracts Obtained by Microwave-Assisted Extraction. Polymers 2022, 14, 1435. [Google Scholar] [CrossRef]
  10. Schiener, P.; Atack, T.; Wareing, R.A.; Kelly, M.S.; Hughes, A.D. The by-products from marine biofuels as a feed source for the aquaculture industry: A novel example of the biorefinery approach. Biomass Convers. Biorefin. 2016, 6, 281–287. [Google Scholar] [CrossRef]
  11. Balina, K.; Romagnoli, F.; Blumberga, D. Seaweed biorefinery concept for sustainable use of marine resources. Energy Procedia 2017, 128, 504–511. [Google Scholar] [CrossRef]
  12. Assacute, L.; Romagnoli, F.; Cappelli, A.; Ciocci, C. Algae-based biorefinery concept: An LCI analysis for a theoretical plant. Energy Procedia 2018, 147, 15–24. [Google Scholar] [CrossRef]
  13. Offei, F.; Mensah, M.; Kemausuor, F.; Thygesen, A. A biorefinery approach to bioethanol and bioelectricity co-production from tropical seaweeds. J. Appl. Phycol. 2019, 31, 3899–3913. [Google Scholar] [CrossRef]
  14. Cesário, M.T.; da Fonseca, M.M.R.; Marques, M.M.; de Almeida, M.C.M.D. Marine algal carbohydrates as carbon sources for the production of biochemicals and biomaterials. Biotechnol. Adv. 2018, 36, 798–817. [Google Scholar] [CrossRef]
  15. Tedesco, S.; Stokes, J. Valorisation to biogas of macroalgal waste streams: A circular approach to bioproducts and bioenergy in Ireland. Chem. Pap. 2017, 71, 721–728. [Google Scholar] [CrossRef]
  16. Sanjeewa, K.K.A.; Kim, E.A.; Son, K.T.; Jeon, Y.J. Bioactive properties and potentials cosmeceutical applications of phlorotannins isolated from brown seaweeds: A review. J. Photochem. Photobiol. B Biol. 2016, 162, 100–105. [Google Scholar] [CrossRef]
  17. Barbosa, M.; Lopes, G.; Andrade, P.B.; Valentão, P. Bioprospecting of brown seaweeds for biotechnological applications: Phlorotannin actions in inflammation and allergy network. Trends Food Sci. Technol. 2019, 86, 153–171. [Google Scholar] [CrossRef]
  18. Arunagiri, V.; Tsai, H.C.; Darge, H.F.; Hanurry, E.Y.; Lee, C.Y.; Lai, J.Y.; Wu, S.Y. Enhanced cellular uptake in an electrostatically interacting fucoidan–l-arginine fiber complex. Polymers 2021, 13, 1795. [Google Scholar] [CrossRef]
  19. Mazumder, A.; Holdt, S.L.; De Francisci, D.; Alvarado-Morales, M.; Mishra, H.N.; Angelidaki, I. Extraction of alginate from Sargassum muticum: Process optimization and study of its functional activities. J. Appl. Phycol. 2016, 28, 3625–3634. [Google Scholar] [CrossRef]
  20. Gimpel, J.A.; Ravanal, M.C.; Salazar, O.; Lienqueo, M.E. Saccharification of brown macroalgae using an arsenal of recombinant alginate lyases: Potential application in the biorefinery process. J. Microbiol. Biotechnol. 2018, 28, 1671–1682. [Google Scholar] [CrossRef] [Green Version]
  21. Osman, M.M.M.; Shao, X.; Zhao, D.; Basheer, A.K.; Jin, H.; Zhang, Y. Methane production from alginate-extracted and non-extracted waste of Laminaria japonica: Anaerobic mono- and synergetic co-digestion effects on yield. Sustainability 2019, 11, 1269. [Google Scholar] [CrossRef]
  22. Peptu, C.A.; Băcăiță, E.S.; Logigan, C.L.S.; Luțcanu, M.; Agop, M. Hydrogels based on alginates and carboxymethyl cellulose with modulated drug release—An experimental and theoretical study. Polymers 2021, 13, 4461. [Google Scholar] [CrossRef] [PubMed]
  23. Gorroñogoitia, I.; Urtaza, U.; Zubiarrain-Laserna, A.; Alonso-Varona, A.; Zaldua, A.M. A Study of the Printability of Alginate-Based Bioinks by 3D Bioprinting for Articular Cartilage Tissue Engineering. Polymers 2022, 14, 354. [Google Scholar] [CrossRef] [PubMed]
  24. Volf, I.; Popa, V. Biomass as Renewable Raw Material to Obtain Bioproducts of High-Tech Value; Elsevier: Amsterdam, The Netherlands, 2018; ISBN 9780444637741. [Google Scholar]
  25. Pérez-Larrán, P.; Torres, M.D.; Flórez-Fernández, N.; Balboa, E.M.; Moure, A.; Domínguez, H. Green technologies for cascade extraction of Sargassum muticum bioactives. J. Appl. Phycol. 2019, 31, 2481–2495. [Google Scholar] [CrossRef]
  26. Ramos, E.; Puente, A.; Juanes, J.A.; Neto, J.M.; Pedersen, A.; Bartsch, I.; Scanlan, C.; Wilkes, R.; Van den Bergh, E.; Ar Gall, E.; et al. Biological validation of physical coastal waters classification along the NE Atlantic region based on rocky macroalgae distribution. Estuar. Coast. Shelf Sci. 2014, 147, 103–112. [Google Scholar] [CrossRef]
  27. Rinne, H.; Salovius-Laurén, S. The status of brown macroalgae Fucus spp. and its relation to environmental variation in the Finnish marine area, northern Baltic Sea. Ambio 2020, 49, 118–129. [Google Scholar] [CrossRef]
  28. Catarino, M.D.; Silva, A.M.S.; Cardoso, S.M. Phycochemical constituents and biological activities of Fucus spp. Mar. Drugs 2018, 16, 249. [Google Scholar] [CrossRef]
  29. Paiva, L.; Lima, E.; Neto, A.I.; Baptista, J. Angiotensin I-converting enzyme (ACE) inhibitory activity, antioxidant properties, phenolic content and amino acid profiles of Fucus spiralis L. Protein hydrolysate fractions. Mar. Drugs 2017, 15, 311. [Google Scholar] [CrossRef]
  30. Pinteus, S.; Silva, J.; Alves, C.; Horta, A.; Thomas, O.P.; Pedrosa, R. Antioxidant and cytoprotective activities of Fucus spiralis seaweed on a human cell in vitro model. Int. J. Mol. Sci. 2017, 18, 292. [Google Scholar] [CrossRef]
  31. Agregán, R.; Munekata, P.; Franco, D.; Carballo, J.; Barba, F.; Lorenzo, J. Antioxidant Potential of Extracts Obtained from Macro-(Ascophyllum nodosum, Fucus vesiculosus and Bifurcaria bifurcata) and Micro-Algae (Chlorella vulgaris and Spirulina platensis) Assisted by Ultrasound. Medicines 2018, 5, 33. [Google Scholar] [CrossRef] [Green Version]
  32. Hermund, D.B.; Plaza, M.; Turner, C.; Jónsdóttir, R.; Kristinsson, H.G.; Jacobsen, C.; Nielsen, K.F. Structure dependent antioxidant capacity of phlorotannins from Icelandic Fucus vesiculosus by UHPLC-DAD-ECD-QTOFMS. Food Chem. 2018, 240, 904–909. [Google Scholar] [CrossRef] [PubMed]
  33. Barbosa, M.; Lopes, G.; Ferreres, F.; Andrade, P.B.; Pereira, D.M.; Gil-Izquierdo, Á.; Valentão, P. Phlorotannin extracts from Fucales: Marine polyphenols as bioregulators engaged in inflammation-related mediators and enzymes. Algal Res. 2017, 28, 1–8. [Google Scholar] [CrossRef]
  34. Zayed, A.; Muffler, K.; Hahn, T.; Rupp, S.; Finkelmeier, D.; Burger-Kentischer, A.; Ulber, R. Physicochemical and biological characterization of fucoidan from Fucus vesiculosus purified by dye affinity chromatography. Mar. Drugs 2016, 14, 79. [Google Scholar] [CrossRef] [PubMed]
  35. Anastyuk, S.D.; Shevchenko, N.M.; Ermakova, S.P.; Vishchuk, O.S.; Nazarenko, E.L.; Dmitrenok, P.S.; Zvyagintseva, T.N. Anticancer activity in vitro of a fucoidan from the brown alga Fucus evanescens and its low-molecular fragments, structurally characterized by tandem mass-spectrometry. Carbohydr. Polym. 2012, 87, 186–194. [Google Scholar] [CrossRef] [PubMed]
  36. Hmelkov, A.B.; Zvyagintseva, T.N.; Shevchenko, N.M.; Rasin, A.B.; Ermakova, S.P. Ultrasound-assisted extraction of polysaccharides from brown alga Fucus evanescens. Structure and biological activity of the new fucoidan fractions. J. Appl. Phycol. 2018, 30, 2039–2046. [Google Scholar] [CrossRef]
  37. Imbs, T.I.; Skriptsova, A.V.; Zvyagintseva, T.N. Antioxidant activity of fucose-containing sulfated polysaccharides obtained from Fucus evanescens by different extraction methods. J. Appl. Phycol. 2015, 27, 545–553. [Google Scholar] [CrossRef]
  38. Alvarado-Morales, M.; Gunnarsson, I.B.; Fotidis, I.A.; Vasilakou, E.; Lyberatos, G.; Angelidaki, I. Laminaria digitata as a potential carbon source for succinic acid and bioenergy production in a biorefinery perspective. Algal Res. 2015, 9, 126–132. [Google Scholar] [CrossRef]
  39. Kostas, E.T.; White, D.A.; Cook, D.J. Development of a bio-refinery process for the production of speciality chemical, biofuel and bioactive compounds from Laminaria digitata. Algal Res. 2017, 28, 211–219. [Google Scholar] [CrossRef]
  40. Garcia-Vaquero, M.; O’Doherty, J.V.; Tiwari, B.K.; Sweeney, T.; Rajauria, G. Enhancing the extraction of polysaccharides and antioxidants from macroalgae using sequential hydrothermal-assisted extraction followed by ultrasound and thermal technologies. Mar. Drugs 2019, 17, 457. [Google Scholar] [CrossRef]
  41. Kim, G.Y.; Seo, Y.H.; Kim, I.; Han, J.I. Co-production of biodiesel and alginate from Laminaria japonica. Sci. Total Environ. 2019, 673, 750–755. [Google Scholar] [CrossRef]
  42. Balboa, E.M.; Moure, A.; Domínguez, H. Valorization of Sargassum muticum biomass according to the biorefinery concept. Mar. Drugs 2015, 13, 3745–3760. [Google Scholar] [CrossRef] [PubMed]
  43. Ardalan, Y.; Jazini, M.; Karimi, K. Sargassum angustifolium brown macroalga as a high potential substrate for alginate and ethanol production with minimal nutrient requirement. Algal Res. 2018, 36, 29–36. [Google Scholar] [CrossRef]
  44. Lorbeer, A.J.; Charoensiddhi, S.; Lahnstein, J.; Lars, C.; Franco, C.M.M.; Bulone, V.; Zhang, W. Sequential extraction and characterization of fucoidans and alginates from Ecklonia radiata, Macrocystis pyrifera, Durvillaea potatorum, and Seirococcus axillaris. J. Appl. Phycol. 2017, 29, 1515–1526. [Google Scholar] [CrossRef]
  45. Leyton, A.; Lienqueo, M.E.; Shene, C. Macrocystis pyrifera: Substrate for the production of bioactive compounds. J. Appl. Phycol. 2020, 32, 2335–2341. [Google Scholar] [CrossRef]
  46. Lorbeer, A.J.; Lahnstein, J.; Bulone, V.; Nguyen, T.; Zhang, W. Multiple-response optimization of the acidic treatment of the brown alga Ecklonia radiata for the sequential extraction of fucoidan and alginate. Bioresour. Technol. 2015, 197, 302–309. [Google Scholar] [CrossRef]
  47. Lazar, L.; Talmaciu, A.I.; Volf, I.; Popa, V.I. Kinetic modeling of the ultrasound-assisted extraction of polyphenols from Picea abies bark. Ultrason. Sonochem. 2016, 32, 191–197. [Google Scholar] [CrossRef]
  48. Yuan, Y.; Macquarrie, D.J. Microwave assisted step-by-step process for the production of fucoidan, alginate sodium, sugars and biochar from Ascophyllum nodosum through a biorefinery concept. Bioresour. Technol. 2015, 198, 819–827. [Google Scholar] [CrossRef]
  49. Singleton, V.L.; Orthofer, R.; Lamuela-Raventós, R.M. Analysis of total phenols and other oxidation substrates and antioxidants by means of Folin-Ciocalteu Reagent. Methods Enzymol. 1999, 299, 152–178. [Google Scholar] [CrossRef]
  50. Ghose, T.K. Measurement of cellulase activities. Int. Union Pure Appl. Chem. 1987, 59, 257–268. [Google Scholar] [CrossRef]
  51. Pregl, F. Die Quantitative Organische Mikroanalyse; Spinger: Berlin/Heidelberg, Germany, 1930. [Google Scholar] [CrossRef]
  52. Kjeldahl, J. Neue Methode zur Bestimmung des Stickstoffs in organischen Körpern. Z. Anal. Chem. 1883, 22, 366–382. [Google Scholar] [CrossRef]
  53. Schöniger, W. Eine mikroanalytisehe Sehnellbestimmung von Halogen in organischen Substanzen. Mikrochim. Acta 1955, 43, 123–129. [Google Scholar] [CrossRef]
  54. Schöniger, W. Die mikroanalytische Schnellbestimmung von Halogenen und Schwefel in organischen Verbindungen. Mikrochim. Acta 1956, 44, 869–876. [Google Scholar] [CrossRef]
  55. Oleksi, A.; Blanco, A.G.; Boer, R.; Usón, I.; Aymamí, J.; Rodger, A.; Hannon, M.J.; Coll, M. Molecular recognition of a three-way DNA junction by a metallosupramolecular helicate. Angew. Chem.-Int. Ed. 2006, 45, 1227–1231. [Google Scholar] [CrossRef] [PubMed]
  56. Shah, A.; Zaheer, M.; Qureshi, R.; Akhter, Z.; Faizan Nazar, M. Voltammetric and spectroscopic investigations of 4-nitrophenylferrocene interacting with DNA. Spectrochim. Acta—Part A Mol. Biomol. Spectrosc. 2010, 75, 1082–1087. [Google Scholar] [CrossRef] [PubMed]
  57. Molyneux, P. The Use of the Stable Free Radical Diphenylpicryl-hydrazyl (DPPH) for Estimating Antioxidant Activity. Songklanakarin J. Sci. Technol. 2004, 26, 211–219. [Google Scholar] [CrossRef]
  58. Brand-Williams, W.; Cuvelier, M.E.; Berset, C. Use of a free radical method to evaluate antioxidant activity. LWT—Food Sci. Technol. 1995, 28, 25–30. [Google Scholar] [CrossRef]
  59. Antolovich, M.; Prenzler, P.D.; Patsalides, E.; McDonald, S.; Robards, K. Methods for testing antioxidant activity. Analyst 2002, 127, 183–198. [Google Scholar] [CrossRef]
  60. Peinado, I.; Girón, J.; Koutsidis, G.; Ames, J.M. Chemical composition, antioxidant activity and sensory evaluation of five different species of brown edible seaweeds. Food Res. Int. 2014, 66, 36–44. [Google Scholar] [CrossRef]
  61. Manns, D.; Deutschle, A.L.; Saake, B.; Meyer, A.S. Methodology for quantitative determination of the carbohydrate composition of brown seaweeds (Laminariaceae). RSC Adv. 2014, 4, 25736–25746. [Google Scholar] [CrossRef] [Green Version]
  62. Paiva, L.; Lima, E.; Patarra, R.F.; Neto, A.I.; Baptista, J. Edible Azorean macroalgae as source of rich nutrients with impact on human health. Food Chem. 2014, 164, 128–135. [Google Scholar] [CrossRef]
  63. Jung, K.A.; Lim, S.R.; Kim, Y.; Park, J.M. Potentials of macroalgae as feedstocks for biorefinery. Bioresour. Technol. 2013, 135, 182–190. [Google Scholar] [CrossRef] [PubMed]
  64. Lorenzo, J.M.; Agregán, R.; Munekata, P.E.S.; Franco, D.; Carballo, J.; Şahin, S.; Lacomba, R.; Barba, F.J. Proximate composition and nutritional value of three macroalgae: Ascophyllum nodosum, Fucus vesiculosus and Bifurcaria bifurcata. Mar. Drugs 2017, 15, 360. [Google Scholar] [CrossRef] [PubMed]
  65. Hou, X.; Hansen, J.H.; Bjerre, A.B. Integrated bioethanol and protein production from brown seaweed Laminaria digitata. Bioresour. Technol. 2015, 197, 310–317. [Google Scholar] [CrossRef]
  66. Bruton, T.; Lyons, H.; Lerat, Y.; Stanley, M.; Rasmussen, M.B. A Review of the Potential of Marine Algae as a Source of Biofuel in Ireland. Sustain. Energy. 2009, pp. 1–88. Available online: https://www.researchgate.net/publication/309185965_A_review_of_the_potential_of_Marine_Algae_as_a_Source_of_Biofuel_in_Ireland_Sustainable_Energy (accessed on 10 July 2022).
  67. Hahn, T.; Lang, S.; Ulber, R.; Muffler, K. Novel procedures for the extraction of fucoidan from brown algae. Process Biochem. 2012, 47, 1691–1698. [Google Scholar] [CrossRef]
  68. Jothisaraswathi, S.; Babu, B.; Rengasamy, R. Seasonal studies on alginate and its composition II: Turbinaria conoides (J. Ag.) Kütz. (Fucales, Phaeophyceae). J. Appl. Phycol. 2006, 18, 161–166. [Google Scholar] [CrossRef]
  69. Fernando, I.P.S.; Kim, D.; Nah, J.W.; Jeon, Y.J. Advances in functionalizing fucoidans and alginates (bio)polymers by structural modifications: A review. Chem. Eng. J. 2019, 355, 33–48. [Google Scholar] [CrossRef]
  70. Vian, M.; Breil, C.; Vernes, L.; Chaabani, E.; Chemat, F. Green solvents for sample preparation in analytical chemistry. Curr. Opin. Green Sustain. Chem. 2017, 5, 44–48. [Google Scholar] [CrossRef]
  71. Pimentel-Moral, S.; Borrás-Linares, I.; Lozano-Sánchez, J.; Alañón, M.E.; Arráez-Román, D.; Segura-Carretero, A. Pressurized GRAS solvents for the green extraction of phenolic compounds from Hibiscus sabdariffa calyces. Food Res. Int. 2020, 137, 109466. [Google Scholar] [CrossRef]
  72. Yuan, Y.; Macquarrie, D. Microwave assisted extraction of sulfated polysaccharides (fucoidan) from Ascophyllum nodosum and its antioxidant activity. Carbohydr. Polym. 2015, 129, 101–107. [Google Scholar] [CrossRef]
  73. Freitas, O.M.M.; Martins, R.J.E.; Delerue-Matos, C.M.; Boaventura, R.A.R. Removal of Cd(II), Zn(II) and Pb(II) from aqueous solutions by brown marine macro algae: Kinetic modelling. J. Hazard. Mater. 2008, 153, 493–501. [Google Scholar] [CrossRef]
  74. Ungureanu, G.; Santos, S.; Boaventura, R.; Botelho, C. Arsenic and antimony in water and wastewater: Overview of removal techniques with special reference to latest advances in adsorption. J. Environ. Manag. 2015, 151, 326–342. [Google Scholar] [CrossRef] [PubMed]
  75. Filote, C.; Volf, I.; Santos, S.C.R.; Botelho, C.M.S. Bioadsorptive removal of Pb(II) from aqueous solution by the biorefinery waste of Fucus spiralis. Sci. Total Environ. 2019, 648, 1201–1209. [Google Scholar] [CrossRef] [PubMed]
  76. Filote, C.; Ungureanu, G.; Boaventura, R.; Santos, S.; Volf, I.; Botelho, C. Green macroalgae from the Romanian coast of Black Sea: Physico-chemical characterization and future perspectives on their use as metal anions biosorbents. Process Saf. Environ. Prot. 2017, 108, 34–43. [Google Scholar] [CrossRef]
  77. Santos, S.; Ungureanu, G.; Boaventura, R.; Botelho, C. Selenium contaminated waters: An overview of analytical methods, treatment options and recent advances in sorption methods. Sci. Total Environ. 2015, 521–522, 246–260. [Google Scholar] [CrossRef]
  78. Romera, E.; González, F.; Ballester, A.; Blázquez, M.L.; Muñoz, J.A. Biosorption of heavy metals by Fucus spiralis. Bioresour. Technol. 2008, 99, 4684–4693. [Google Scholar] [CrossRef]
  79. Mazur, L.P.; Cechinel, M.A.P.; de Souza, S.M.A.G.U.; Boaventura, R.A.R.; Vilar, V.J.P. Brown marine macroalgae as natural cation exchangers for toxic metal removal from industrial wastewaters: A review. J. Environ. Manag. 2018, 223, 215–253. [Google Scholar] [CrossRef]
  80. Vilar, V.J.P.; Botelho, C.M.S.; Boaventura, R.A.R. Equilibrium and kinetic modelling of Cd(II) biosorption by algae Gelidium and agar extraction algal waste. Water Res. 2006, 40, 291–302. [Google Scholar] [CrossRef]
  81. Vilar, V.J.P.; Botelho, C.M.S.; Boaventura, R.A.R. Kinetics and equilibrium modelling of lead uptake by algae Gelidium and algal waste from agar extraction industry. J. Hazard. Mater. 2007, 143, 396–408. [Google Scholar] [CrossRef]
  82. Vilar, V.J.P.; Botelho, C.M.S.; Boaventura, R.A.R. Copper removal by algae Gelidium, agar extraction algal waste and granulated algal waste: Kinetics and equilibrium. Bioresour. Technol. 2008, 99, 750–762. [Google Scholar] [CrossRef]
  83. Romero-Gonzalez, M.E.; Williams, C.J.; Gardiner, P.H.E. Study of the mechanisms of cadmium biosorption by dealginated seaweed waste. Environ. Sci. Technol. 2001, 35, 3025–3030. [Google Scholar] [CrossRef]
  84. Romero-González, M.E.; Williams, C.J.; Gardiner, P.H.E.; Gurman, S.J.; Habesh, S. Spectroscopic studies of the biosorption of gold(III) by dealginated seaweed waste. Environ. Sci. Technol. 2003, 37, 4163–4169. [Google Scholar] [CrossRef] [PubMed]
  85. Masri, M.A.; Jurkowski, W.; Shaigani, P.; Haack, M.; Mehlmer, N.; Brück, T. A waste-free, microbial oil centered cyclic bio-refinery approach based on flexible macroalgae biomass. Appl. Energy 2018, 224, 1–12. [Google Scholar] [CrossRef]
  86. Cox, S.; Abu-Ghannam, N.; Gupta, S. An assessment of the antioxidant and antimicrobial activity of six species of edible Irish seaweeds. Int. Food Res. J. 2010, 17, 205–220. [Google Scholar] [CrossRef]
  87. Yuan, Y.; Zhang, J.; Fan, J.; Clark, J.; Shen, P.; Li, Y.; Zhang, C. Microwave assisted extraction of phenolic compounds from four economic brown macroalgae species and evaluation of their antioxidant activities and inhibitory effects on α-amylase, α-glucosidase, pancreatic lipase and tyrosinase. Food Res. Int. 2018, 113, 288–297. [Google Scholar] [CrossRef] [PubMed]
  88. Akbari, A.; Bigham, A.; Rahimkhoei, V.; Sharifi, S.; Jabbari, E. Antiviral Polymers: A Review. Polymers 2022, 14, 1634. [Google Scholar] [CrossRef] [PubMed]
  89. Hsiao, W.; Hong, Y.; Tsai, Y.; Lee, Y.; Patel, A.K.; Guo, H.; Kuo, C.; Huang, C. Extraction, Biochemical Characterization, and Health Effects of Native and Degraded Fucoidans from Sargassum crispifolium. Polymers 2022, 14, 1812. [Google Scholar] [CrossRef]
  90. Thuy, T.T.T.; Ly, B.M.; Van, T.T.T.; Van Quang, N.; Tu, H.C.; Zheng, Y.; Seguin-Devaux, C.; Mi, B.; Ai, U. Anti-HIV activity of fucoidans from three brown seaweed species. Carbohydr. Polym. 2015, 115, 122–128. [Google Scholar] [CrossRef]
  91. Fletcher, H.R.; Biller, P.; Ross, A.B.; Adams, J.M.M. The seasonal variation of fucoidan within three species of brown macroalgae. Algal Res. 2017, 22, 79–86. [Google Scholar] [CrossRef]
  92. Ross, A.; Jones, J.; Kubacki, M.; Bridgeman, T. Classification of macroalgae as fuel and its thermochemical behaviour. Bioresour. Technol. 2008, 99, 6494–6504. [Google Scholar] [CrossRef]
  93. Yu, L.J.; Wang, S.; Jiang, X.M.; Wang, N.; Zhang, C.Q. Thermal analysis studies on combustion characteristics of seaweed. J. Anal. Calorim. 2008, 93, 611–617. [Google Scholar] [CrossRef]
  94. Bae, Y.J.; Ryu, C.; Jeon, J.-K.; Park, J.; Suh, D.J.; Suh, Y.-W.; Chang, D.; Park, Y.-K. The characteristics of bio-oil produced from the pyrolysis of three marine macroalgae. Bioresour. Technol. 2011, 102, 3512–3520. [Google Scholar] [CrossRef] [PubMed]
  95. Saravana, P.S.; Cho, Y.J.; Park, Y.B.; Woo, H.C.; Chun, B.S. Structural, antioxidant, and emulsifying activities of fucoidan from Saccharina japonica using pressurized liquid extraction. Carbohydr. Polym. 2016, 153, 518–525. [Google Scholar] [CrossRef] [PubMed]
  96. Sellimi, S.; Younes, I.; Ayed, H.B.; Maalej, H.; Montero, V.; Rinaudo, M.; Dahia, M.; Mechichi, T.; Hajji, M.; Nasri, M. Structural, physicochemical and antioxidant properties of sodium alginate isolated from a Tunisian brown seaweed. Int. J. Biol. Macromol. 2015, 72, 1358–1367. [Google Scholar] [CrossRef]
  97. Balboa, E.M.; Rivas, S.; Moure, A.; Domínguez, H.; Parajó, J.C. Simultaneous extraction and depolymerization of fucoidan from Sargassum muticum in aqueous media. Mar. Drugs 2013, 11, 4612–4627. [Google Scholar] [CrossRef] [PubMed]
  98. Palanisamy, S.; Vinosha, M.; Marudhupandi, T.; Rajasekar, P.; Prabhu, N.M. Isolation of fucoidan from Sargassum polycystum brown algae: Structural characterization, in vitro antioxidant and anticancer activity. Int. J. Biol. Macromol. 2017, 102, 405–412. [Google Scholar] [CrossRef] [PubMed]
  99. Khajouei, R.A.; Keramat, J.; Hamdami, N.; Ursu, A.V.; Delattre, C.; Laroche, C.; Gardarin, C.; Lecerf, D.; Desbrières, J.; Djelveh, G.; et al. Extraction and characterization of an alginate from the Iranian brown seaweed Nizimuddinia zanardini. Int. J. Biol. Macromol. 2018, 118, 1073–1081. [Google Scholar] [CrossRef]
  100. Ale, M.T.; Maruyama, H.; Tamauchi, H.; Mikkelsen, J.D.; Meyer, A.S. Fucose-containing sulfated polysaccharides from brown seaweeds inhibit proliferation of melanoma cells and induce apoptosis by activation of caspase-3 in vitro. Mar. Drugs 2011, 9, 2605–2621. [Google Scholar] [CrossRef]
  101. Synytsya, A.; Kim, W.J.; Kim, S.M.; Pohl, R.; Synytsya, A.; Kvasnička, F.; Čopíková, J.; Il Park, Y. Structure and antitumour activity of fucoidan isolated from sporophyll of Korean brown seaweed Undaria pinnatifida. Carbohydr. Polym. 2010, 81, 41–48. [Google Scholar] [CrossRef]
  102. Hernández-Carmona, G.; McHugh, D.J.; Arvizu-Higuera, D.L.; Rodríguez-Montesinos, Y.E. Pilot plant scale extraction of alginate from Macrocystis pyrifera. 1. Effect of pre-extraction treatments on yield and quality of alginate. J. Appl. Phycol. 1999, 10, 507–513. [Google Scholar] [CrossRef]
  103. Rioux, L.E.; Turgeon, S.L.; Beaulieu, M. Characterization of polysaccharides extracted from brown seaweeds. Carbohydr. Polym. 2007, 69, 530–537. [Google Scholar] [CrossRef]
  104. Abraham, R.E.; Su, P.; Puri, M.; Raston, C.L.; Zhang, W. Optimisation of biorefinery production of alginate, fucoidan and laminarin from brown seaweed Durvillaea potatorum. Algal Res. 2019, 38, 101389. [Google Scholar] [CrossRef]
  105. Rowbotham, J.S.; Dyer, P.W.; Greenwell, H.C.; Selby, D.; Theodorou, M.K. Copper(II)-mediated thermolysis of alginates: A model kinetic study on the influence of metal ions in the thermochemical processing of macroalgae. Interface Focus 2013, 3, 20120046. [Google Scholar] [CrossRef]
  106. Cong, Q.; Xiao, F.; Liao, W.; Dong, Q.; Ding, K. Structure and biological activities of an alginate from Sargassum fusiforme, and its sulfated derivative. Int. J. Biol. Macromol. 2014, 69, 252–259. [Google Scholar] [CrossRef]
  107. Elbayomi, S.M.; Wang, H.; Tamer, T.M.; You, Y. Enhancement of antioxidant and hydrophobic properties of alginate via aromatic derivatization: Preparation, characterization, and evaluation. Polymers 2021, 13, 2575. [Google Scholar] [CrossRef]
  108. Kok, J.M.L.; Wong, C.L. Physicochemical properties of edible alginate film from Malaysian Sargassum polycystum C. Agardh. Sustain. Chem. Pharm. 2018, 9, 87–94. [Google Scholar] [CrossRef]
  109. Kinh, C.; Kinh, C.D.; Thien, T.V.; Hoa, T.T.; Khieu, D.Q. Interpretation of 1H-NMR spectrum of alginate by 1H-1H TOCSY and COSY spectrum. Vietnam J. Chem. 2007, 45, 772–775. [Google Scholar]
  110. Jamil, M.; Ali, A.; Badshah, A.; Ahmad, I.; Zubair, M.; Kemal, S.; Irshad, M. Spectrochimica Acta Part A: Molecular and Biomolecular Spectroscopy Naked Eye DNA detection: Synthesis, characterization and DNA binding studies of a novel azo-guanidine. Spectrochim. Acta Part A Mol. Biomol. Spectrosc. 2013, 105, 165–170. [Google Scholar] [CrossRef]
  111. Zhao, G.; Zhu, J.; Zhang, J.; Chen, H. Voltammetric studies of the interaction of methylene blue with DNA by means of β-cyclodextrin. Anal. Chim. Acta 1999, 394, 337–344. [Google Scholar] [CrossRef]
  112. Atkins, P.; de Paula, J. Physical Chemistry; Macmillan: New York, NY, USA, 2006; Volume 78, ISBN 9780716787594. [Google Scholar]
  113. Aslanoǧlu, M.; Öge, N. Voltammetric, UV absorption and viscometric studies of the interaction of norepinephrine with DNA. Turk. J. Chem. 2005, 29, 477–485. [Google Scholar]
  114. Aslanoglu, M.; Ayne, G. Voltammetric studies of the interaction of quinacrine with DNA. Anal. Bioanal. Chem. 2004, 380, 658–663. [Google Scholar] [CrossRef]
  115. Husain, M.A.; Sarwar, T.; Rehman, S.U.; Ishqi, H.M.; Tabish, M. Ibuprofen causes photocleavage through ROS generation and intercalates with DNA: A combined biophysical and molecular docking approach. Phys. Chem. Chem. Phys. 2015, 17, 13837–13850. [Google Scholar] [CrossRef] [PubMed]
  116. Shahabadi, N.; Kashanian, S.; Mahdavi, M.; Sourinejad, N. DNA interaction and DNA cleavage studies of a new platinum(II) complex containing aliphatic and aromatic dinitrogen ligands. Bioinorg. Chem. Appl. 2011, 2011, 525794. [Google Scholar] [CrossRef] [PubMed]
  117. Houlton, A.; Isaac, C.J.; Gibson, A.E.; Horrocks, B.R.; Clegg, W.; Elsegood, M.R.J. Synthesis, structure and redox properties of ferrocenylmethyl-nucleobases. J. Chem. Soc. Dalton Trans. 1999, 18, 3229–3234. [Google Scholar] [CrossRef]
  118. Benabdesselam, S.; Lanez, T. Evaluation of total antioxidant capacity and free radicals scavenging of 2 and 4-Nitrophenylferrocene by electrochemical and chemical assays. J. Chem. Pharm. Res. 2015, 7, 825–831. [Google Scholar]
  119. Ahmed, S.; Shakeel, F. Voltammetric determination of antioxidant character in Berberis lycium Royel, Zanthoxylum armatum and Morus nigra Linn plants. Pak. J. Pharm. Sci. 2012, 25, 501–507. [Google Scholar]
  120. Ahmed, S.; Shakeel, F. Antioxidant activity coefficient, mechanism, and kinetics of different derivatives of flavones and flavanones towards superoxide radical. Czech J. Food Sci. 2012, 30, 153–163. [Google Scholar] [CrossRef]
  121. Lanez, T.; Hemmami, H. Antioxidant Activities of N-ferrocenylmethyl-2- and -3-nitroaniline and Determination of their Binding Parameters with Superoxide Anion Radicals. Curr. Pharm. Anal. 2017, 13, 110–116. [Google Scholar] [CrossRef]
  122. Ozsoz, M.; Erdem, A.; Kara, P.; Kerman, K.; Ozkan, D. Electrochemical Biosensor for the Detection of Interaction Between Arsenic Trioxide and DNA Base on Guanine Signal. Electroanalysis 2003, 15, 613–619. [Google Scholar] [CrossRef]
  123. Lu, X.; Zhu, K.; Zhang, M.; Liu, H.; Kang, J. Voltammetric studies of the interaction of transition-metal complexes with DNA. J. Biochem. Biophys. Methods 2002, 52, 189–200. [Google Scholar] [CrossRef]
  124. Paleček, E. Past, present and future of nucleic acids electrochemistry. Talanta 2002, 56, 809–819. [Google Scholar] [CrossRef]
  125. Brett, C.M.A.; Brett, A.M.O. Electrochemistry. Principles, Methods and Applications. Electrochim. Acta 1994, 39, 853–854. [Google Scholar]
Figure 1. The biorefinery flow sheet designed for Fucus spiralis biomass.
Polymers 14 04106 g001
Figure 2. FTIR spectrum of fucoidan extract separated from Fucus spiralis biomass.
Polymers 14 04106 g002
Figure 3. NMR spectrum of fucoidan extract separated from Fucus spiralis biomass.
Polymers 14 04106 g003
Figure 4. FTIR spectrum of alginate extract separated from Fucus spiralis biomass.
Polymers 14 04106 g004
Figure 5. NMR spectrum of alginate extract separated from Fucus spiralis biomass.
Polymers 14 04106 g005
Figure 6. Cyclic voltammograms of polysaccharidic extract in 12 mL of 0.1 M phosphate-buffered solution (KH2PO4/K2HPO4, pH = 7.2) recorded at 0.1 V s−1 potential sweep rate on a platinum disk electrode at 298 K in the absence and presence of 6.88 µM DNA with supporting electrolyte 0.1 M Bu4NBF4: (a) extract E2 (65 mg); (b) extract E3 (60 mg).
Polymers 14 04106 g006
Figure 7. Cyclic voltammograms of polysaccharidic extracts in 12 mL of 0.1 M phosphate-buffered solution (KH2PO4/K2HPO4, pH = 7.2) recorded at a 0.1 Vs−1 potential sweep rate on a platinum disk electrode at 298 K in the absence and presence of an increasing concentration of DNA with supporting electrolyte 0.1 M Bu4NBF4: (a) E2 (65 mg); (b) E3 (60 mg).
Polymers 14 04106 g007
Figure 8. Plots of log (1/1 − (ip/ip0)) versus log 1/[DNA] used to calculate the binding constants of the E2 and E3 samples with DNA: (a) E2; (b) E3.
Polymers 14 04106 g008
Figure 9. Plots of v versus ip used to calculate the coefficient diffusion of the free and E2- and E3-bound DNA: (a) E2; (b) E3.
Polymers 14 04106 g009
Figure 10. UV-visible absorption spectra of polysaccharidic extracts in the presence of increasing concentrations of DNA in 0.1 M phosphate-buffered solution (KH2PO4/K2HPO4) at pH = 7.2 and 298 K: (a) 2 mg of E2; (b) 6 mg of E3.
Polymers 14 04106 g010
Figure 11. Plots of A0/(AA0) versus 1/[DNA] used to calculate the binding constants of algal polysaccharidic extracts with DNA: (a) E2 and (b) E3.
Polymers 14 04106 g011
Figure 12. Cyclic voltammograms of oxygen-saturated DMSO/0.1 M Bu4NBF4 on a Pt electrode in the absence and presence of varying concentrations of algal polysaccharidic extracts at a scan rate 100 mV/s: (a) E2; (b) E3.
Polymers 14 04106 g012
Figure 13. Cyclic voltammograms of O2.- on a polished Pt electrode in the absence (black line) and presence of algal polysaccharidic extracts in DMSO solution with supporting electrolyte 0.1 M Bu4NBF4 at 100 mV·s−1: (a) 0.6 mL of E2; (b) 0.5 mL of E3.
Polymers 14 04106 g013
Figure 14. Redox process of the free and E-bound O2/O2.- redox couple, where E represents E2 or E3.
Polymers 14 04106 g014
Figure 15. UV-visible absorption spectra of a solution of DPPH (2 mg) in 10 mL acetonitrile in the presence of increasing concentrations of polysaccharidic extracts in acetonitrile at 298 K: (a) E2; (b) E3.
Polymers 14 04106 g015
Figure 16. Plots of A0/(AA0) versus 1/[P] used to calculate the binding constants of algal compounds with DPPH: (a) E2; (b) E3.
Polymers 14 04106 g016
Table 1. Chemical characteristics of main Fucus spiralis biomass.
Property ValueUnitValue
Proximate analysis
Moisture contentwt% (dry)11.5 ± 0.7
Ash contentwt% (dry)22.5 ± 0.9
Ultimate analysis
Carbonwt% (dry)36.6 ± 0.6
Hydrogenwt% (dry)3.9 ± 0.1
Nitrogenwt% (dry)1.1 ± 0.1
Sulphurwt% (dry)0.5 ± 0.1
Carbohydrate analysis
Reducing sugarswt% (dry)16.3 ± 0.7
Protein characterization
Protein contentwt% (dry)5.7 ± 0.5
Nitrogen-to-protein
conversion factor
-6.25
Table 2. Elemental analysis (CHNS) of fucoidan and alginate extracts isolated from Fucus spiralis biomass.
ElementFucoidanAlginate
C %32.1 ± 0.431.4 ± 0.6
H %4.0 ± 0.15.2 ± 0.3
S %0.4 ± 0.00.3 ± 0.0
N %ND3.2 ± 0.2
Table 3. Binding constants and binding free-energy values for the interactions of E2 and E3 with DNA based on CV data presented in Figure 8.
SampleEquationR2K (M−1)−ΔG (KJ·mol−1)
E2y = 1.0445x + 4.30390.9722.01 × 10424.57
E3y = 0.9162x + 4.67820.9894.77 × 10426.71
Table 4. Values of binding site size obtained using the plot of Cb/Cf versus (DNA).
AdductEquationR2s
DNA-E2y = 0.02193x − 8.287 × 10−50.8280.02
DNA-E3y = 0.0486x − 0.0270.9870.12
Table 5. Diffusion coefficient values of the free and DNA-bound forms of E2 and E3.
CompoundEquationR2D (cm2/s)
E2y = −1.29665x − 4.164040.9381.161 × 10−7
DNA-E2y = −1.31838 x + 0.026490.9680.721 × 10−7
E3y = −2.9437x + 1.37830.9727.086 × 10−9
DNA-E3y = −2.6593 x + 8.18740.9925.783 × 10−9
Table 6. Binding constants and binding free energy values for the interaction of algae polysaccharidic extracts with DNA from the UV data shown in Figure 6: E2 and E3.
SampleEquationR2K (M−1)−ΔG (KJ·mol−1)
E2y = −16.76582x – 0.246160.9861.47 × 10423.79
E3y = −87.1888x – 3.29140.9983.78 × 10426.13
Table 7. IC50 values (mg/mL) obtained using O2.- radical-scavenging activity.
SampleEquationR2IC50
E2y = 3.21057x + 0.083970.9180.13 ± 0.04
E3y = 2.3336x + 0.06580.9840.19 ± 0.06
α-tocopheroly = 15.99x + 1.370.9503.04 ± 0.30
Table 8. Binding constant values for E2 and E3 with O2.- from CV data at T = 298 K.
CompoundEquationR2K (L−1)−ΔG (KJ·mol−1)
E2-O2.-y = 0.96108x + 3.026830.9781.06 × 10317.28
E3-O2.-y = 1.28666x + 2.556320.8910.36 × 10314.59
Table 9. Electrochemical data of free and O2.--bound forms of E2 and E3 used to calculate ratio of binding constants.
CompoundEpa (V)Epc (V)E0 (V) E b 0     E f 0   ( V ) Kred/Kox
E2−0.6764−0.8411−0.758750.0676514.01
E2-O2.-−0.6018−0.7804−0.6911
E3−0.6575−0.8411−0.74930.050957.03
E3-O2.-−0.6018−0.7949−0.69835
Table 10. IC50 values (mg/mL) obtained using DPPH radical-scavenging activity.
Sample EquationR2IC50
E2y = 0.114x − 0.01230.9974.49 ± 0.21
E3y = 0.1051x − 0.00810.9984.83 ± 0.34
α-tocopheroly =1.5646x + 29.0930.9964.81 ± 0.32
Table 11. Binding constant and binding free-energy values for E2 and E3 with DPPH from UV data at 298 K.
AdductEquationR2K (M−1)−ΔG (KJ·mol−1)
E2-DPPHy = −53,219.85x − 2.772670.95752.19.80
E3-DPPHy = −65,276.482x − 3.51190.99953.89.88
Publisher’s Note: MDPI stays neutral with regard to jurisdictional claims in published maps and institutional affiliations.

