
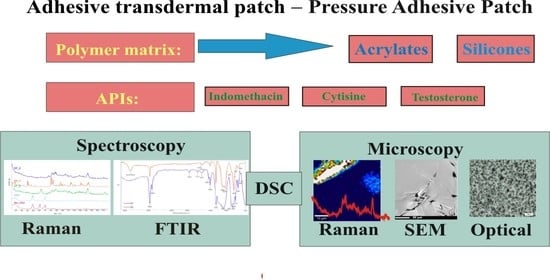
Microscopic and Spectroscopic Imaging and Thermal Analysis of Acrylates, Silicones and Active Pharmaceutical Ingredients in Adhesive Transdermal Patches

 , , and
Abstract
:
1. Introduction
2. Materials and Methods
2.1. Materials
2.2. Preparation of the Patches
2.3. Raman Spectroscopy and Confocal Raman Microscopy
2.4. Scanning Electron Microscopy (SEM) and Optical Microscopy
2.5. Fourier Transform Infrared Spectroscopy (FTIR)
2.6. Differential Scanning Calorimetry (DSC)
3. Results
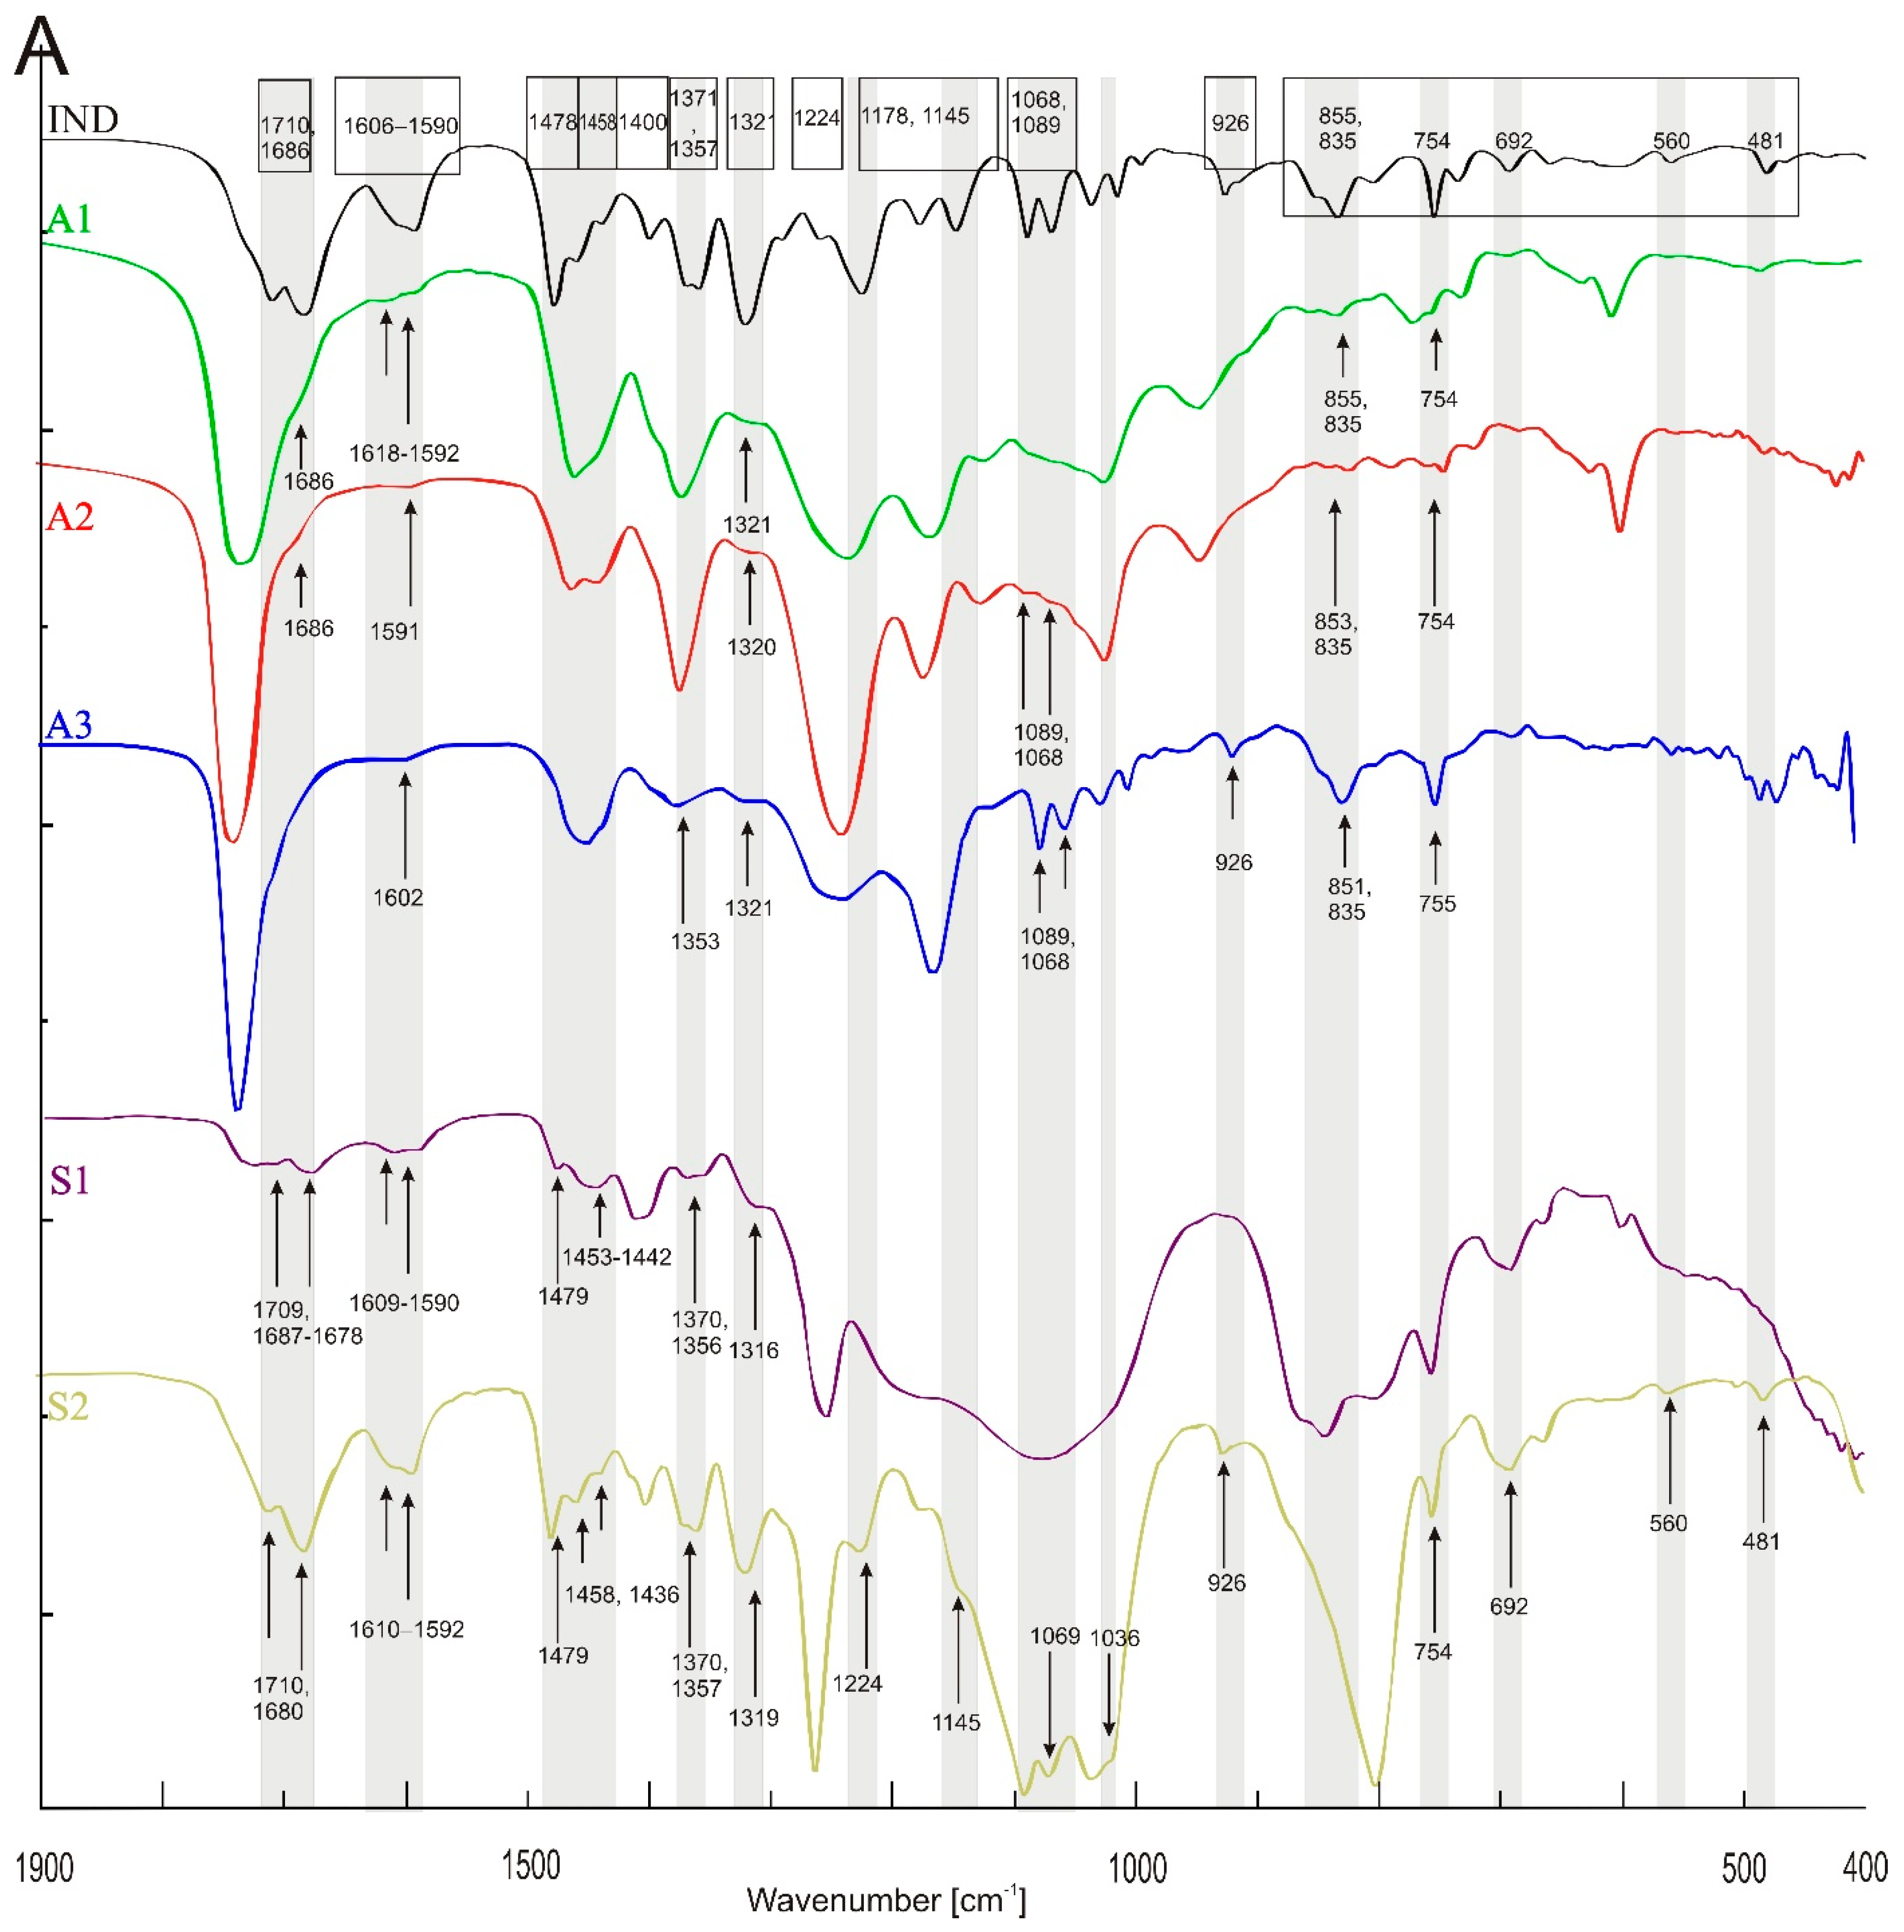
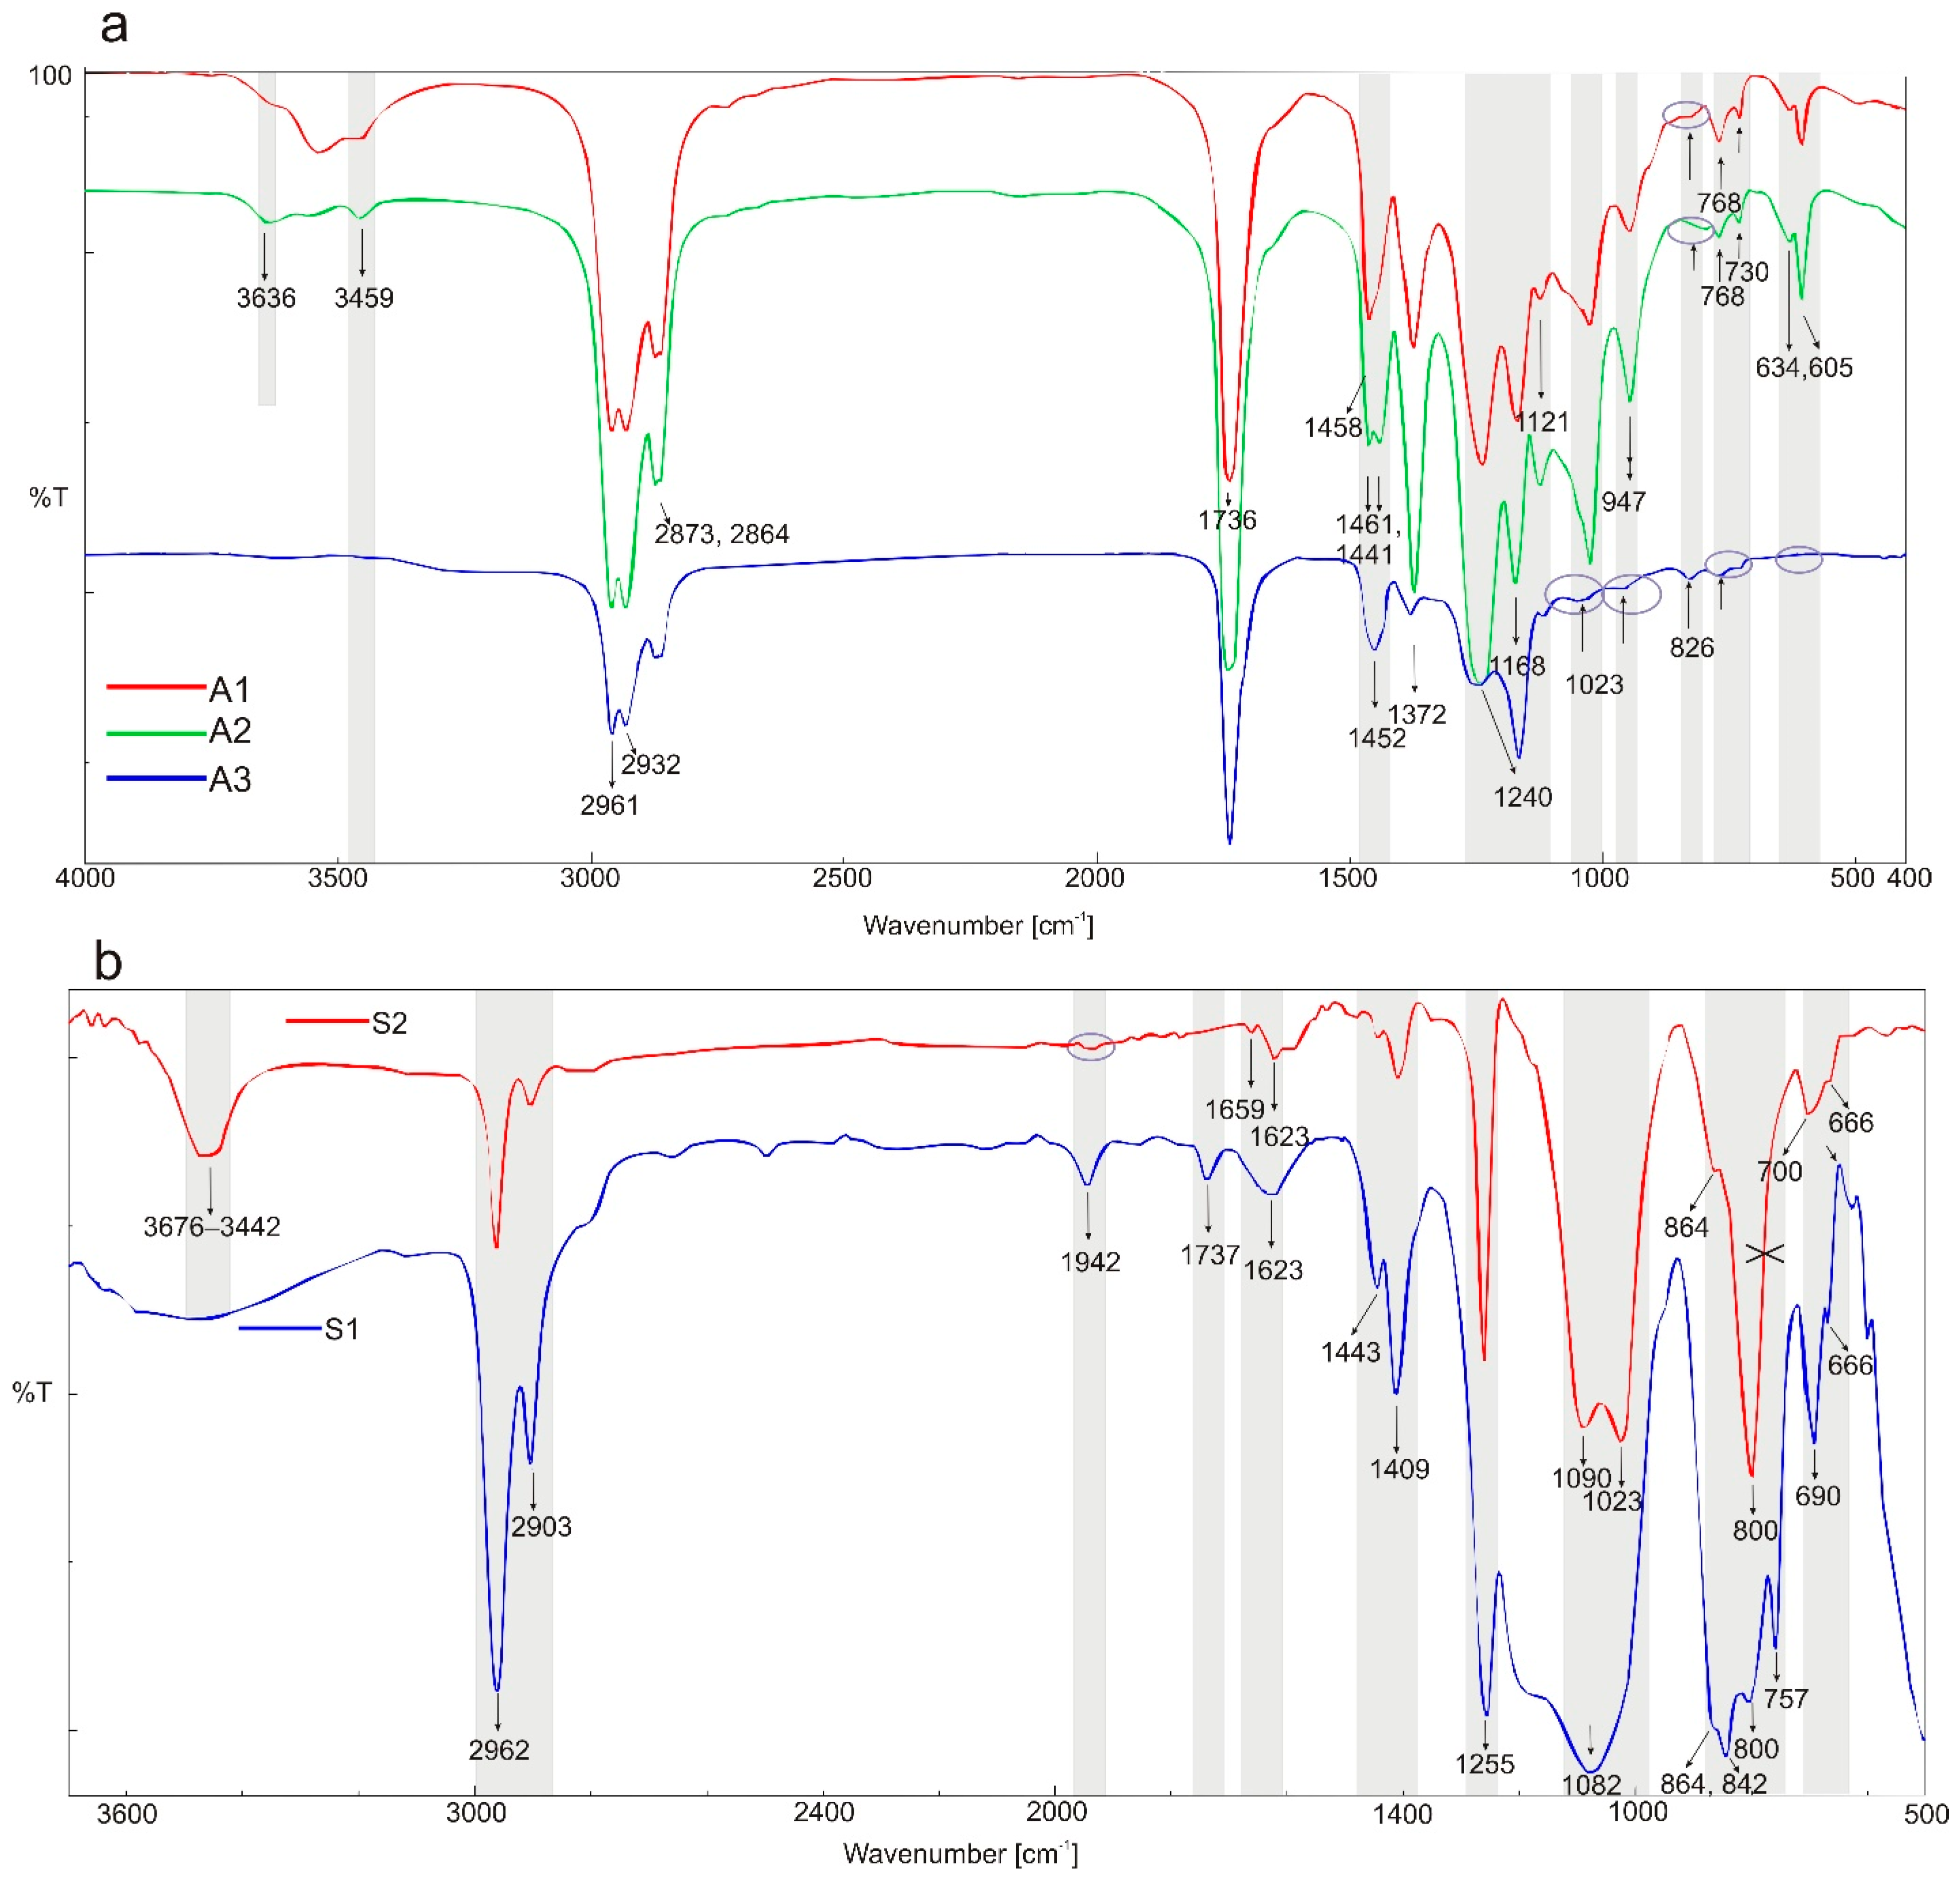
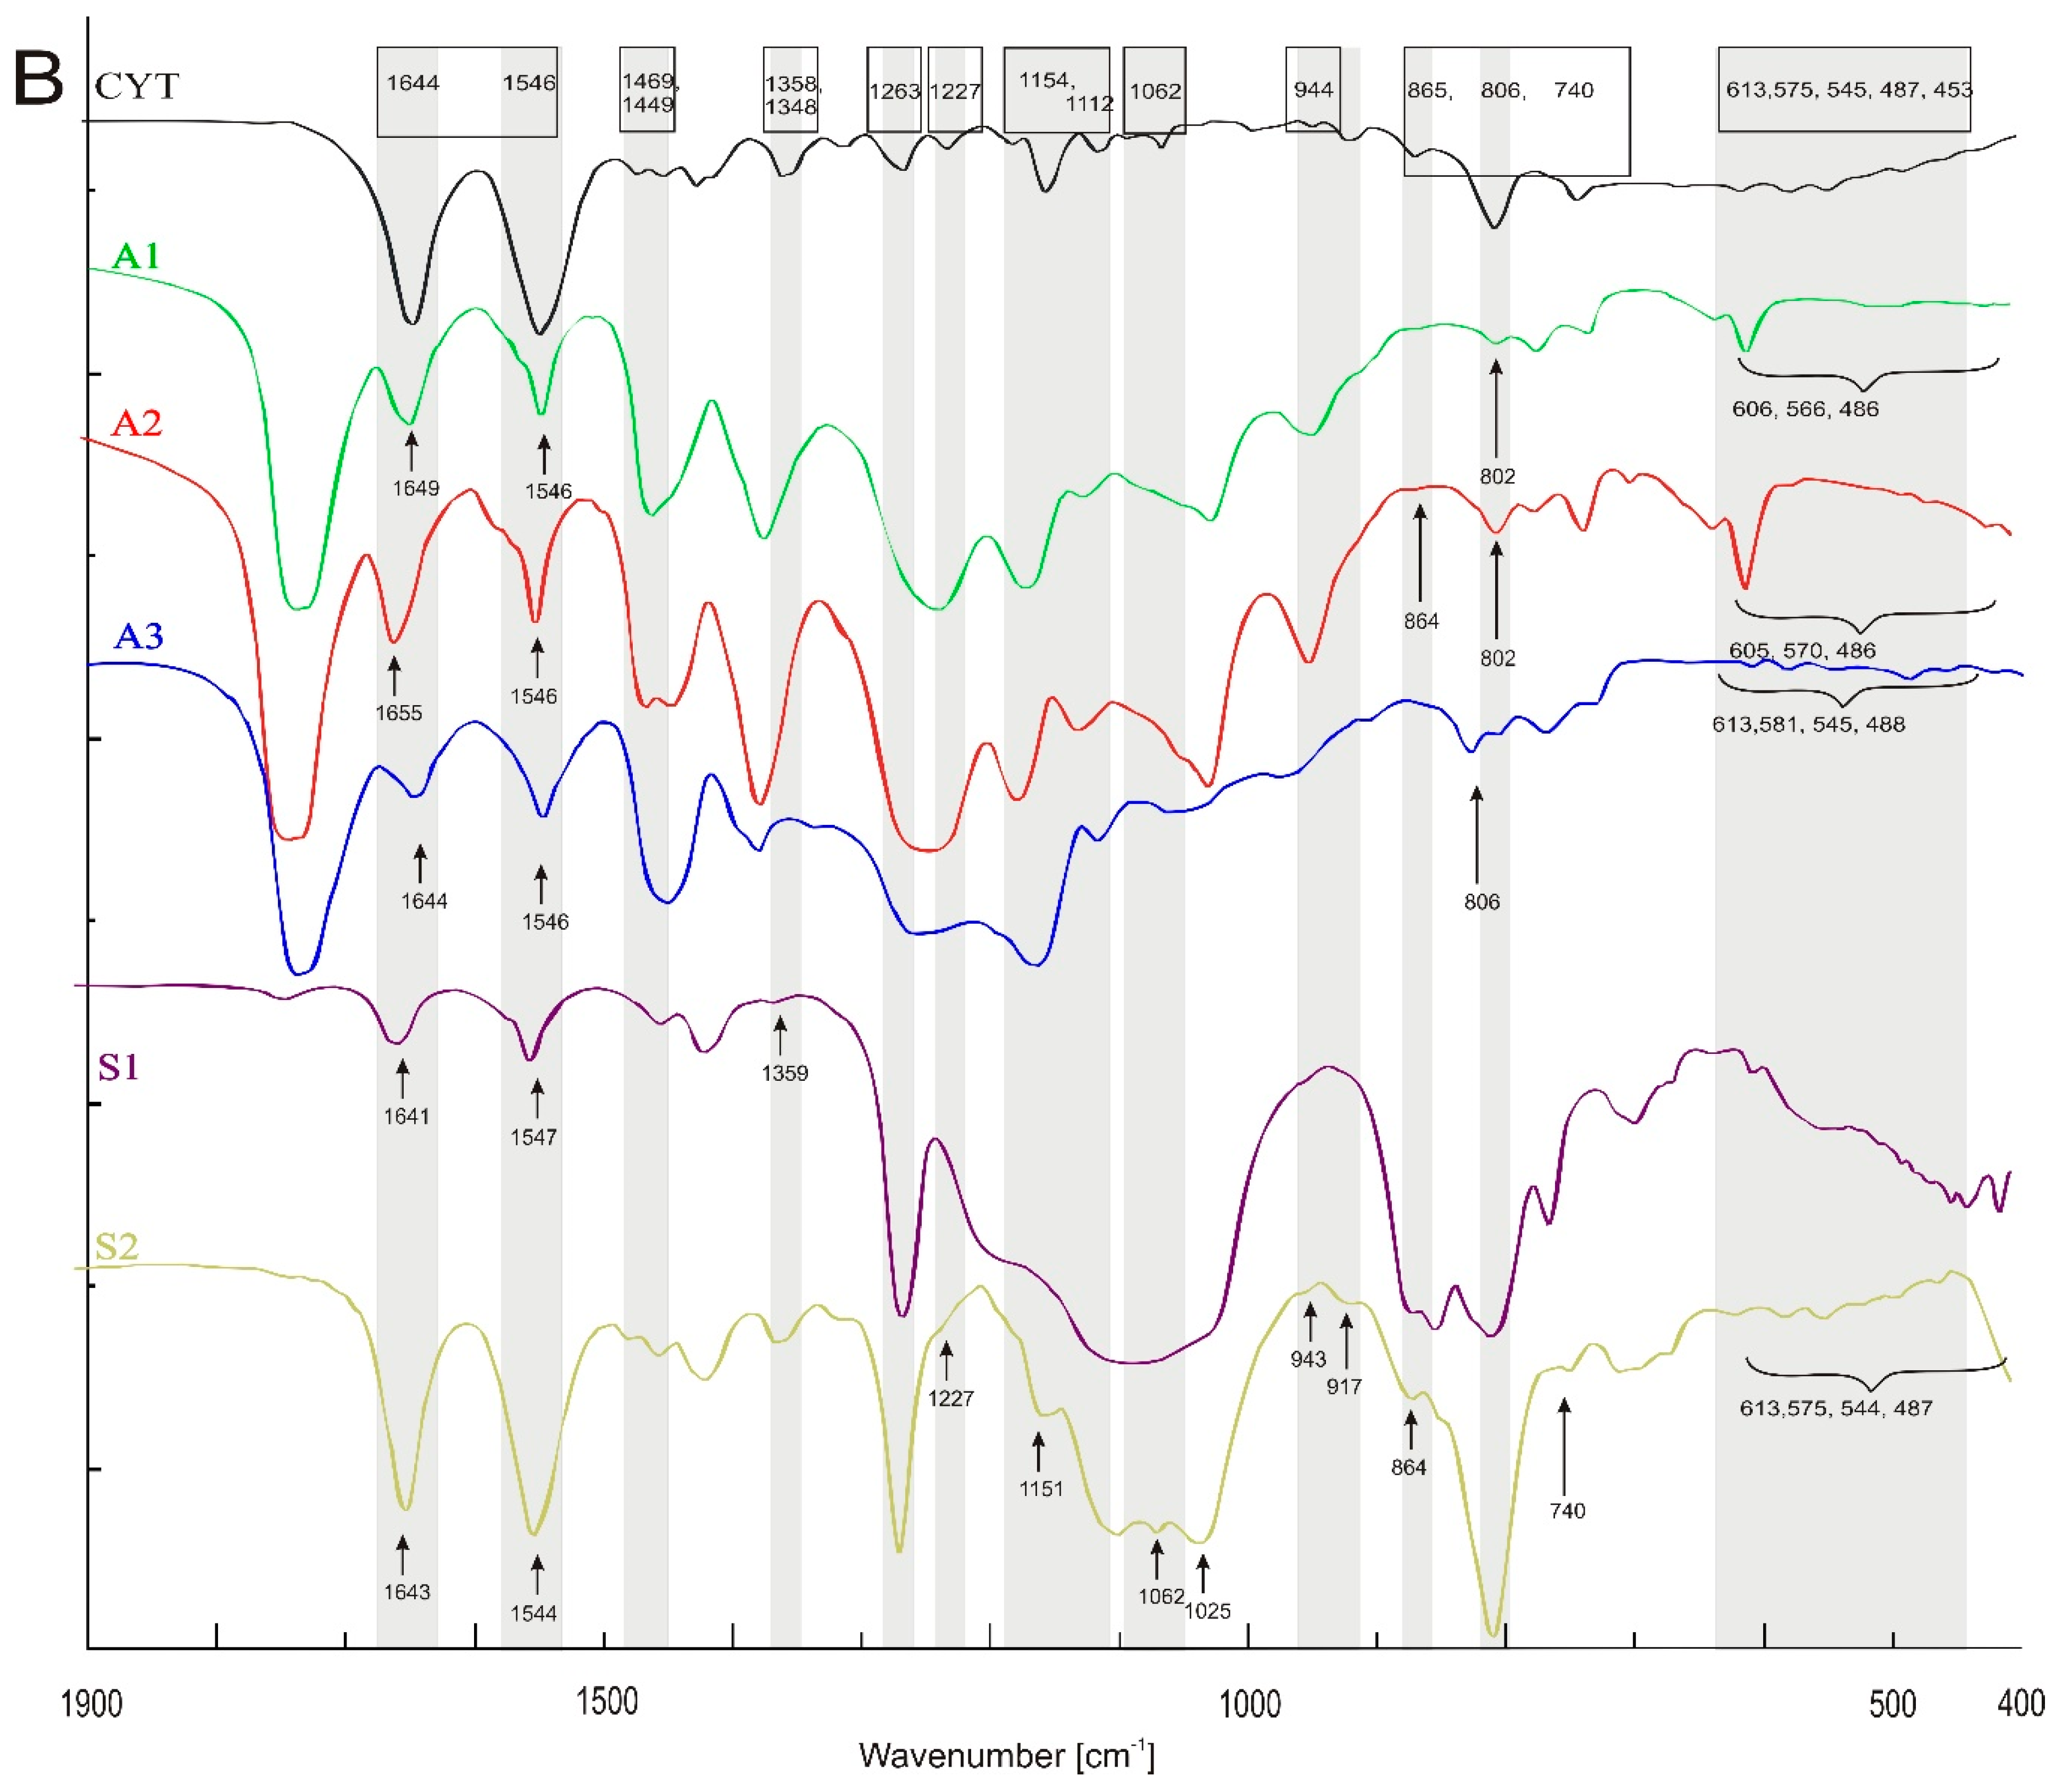
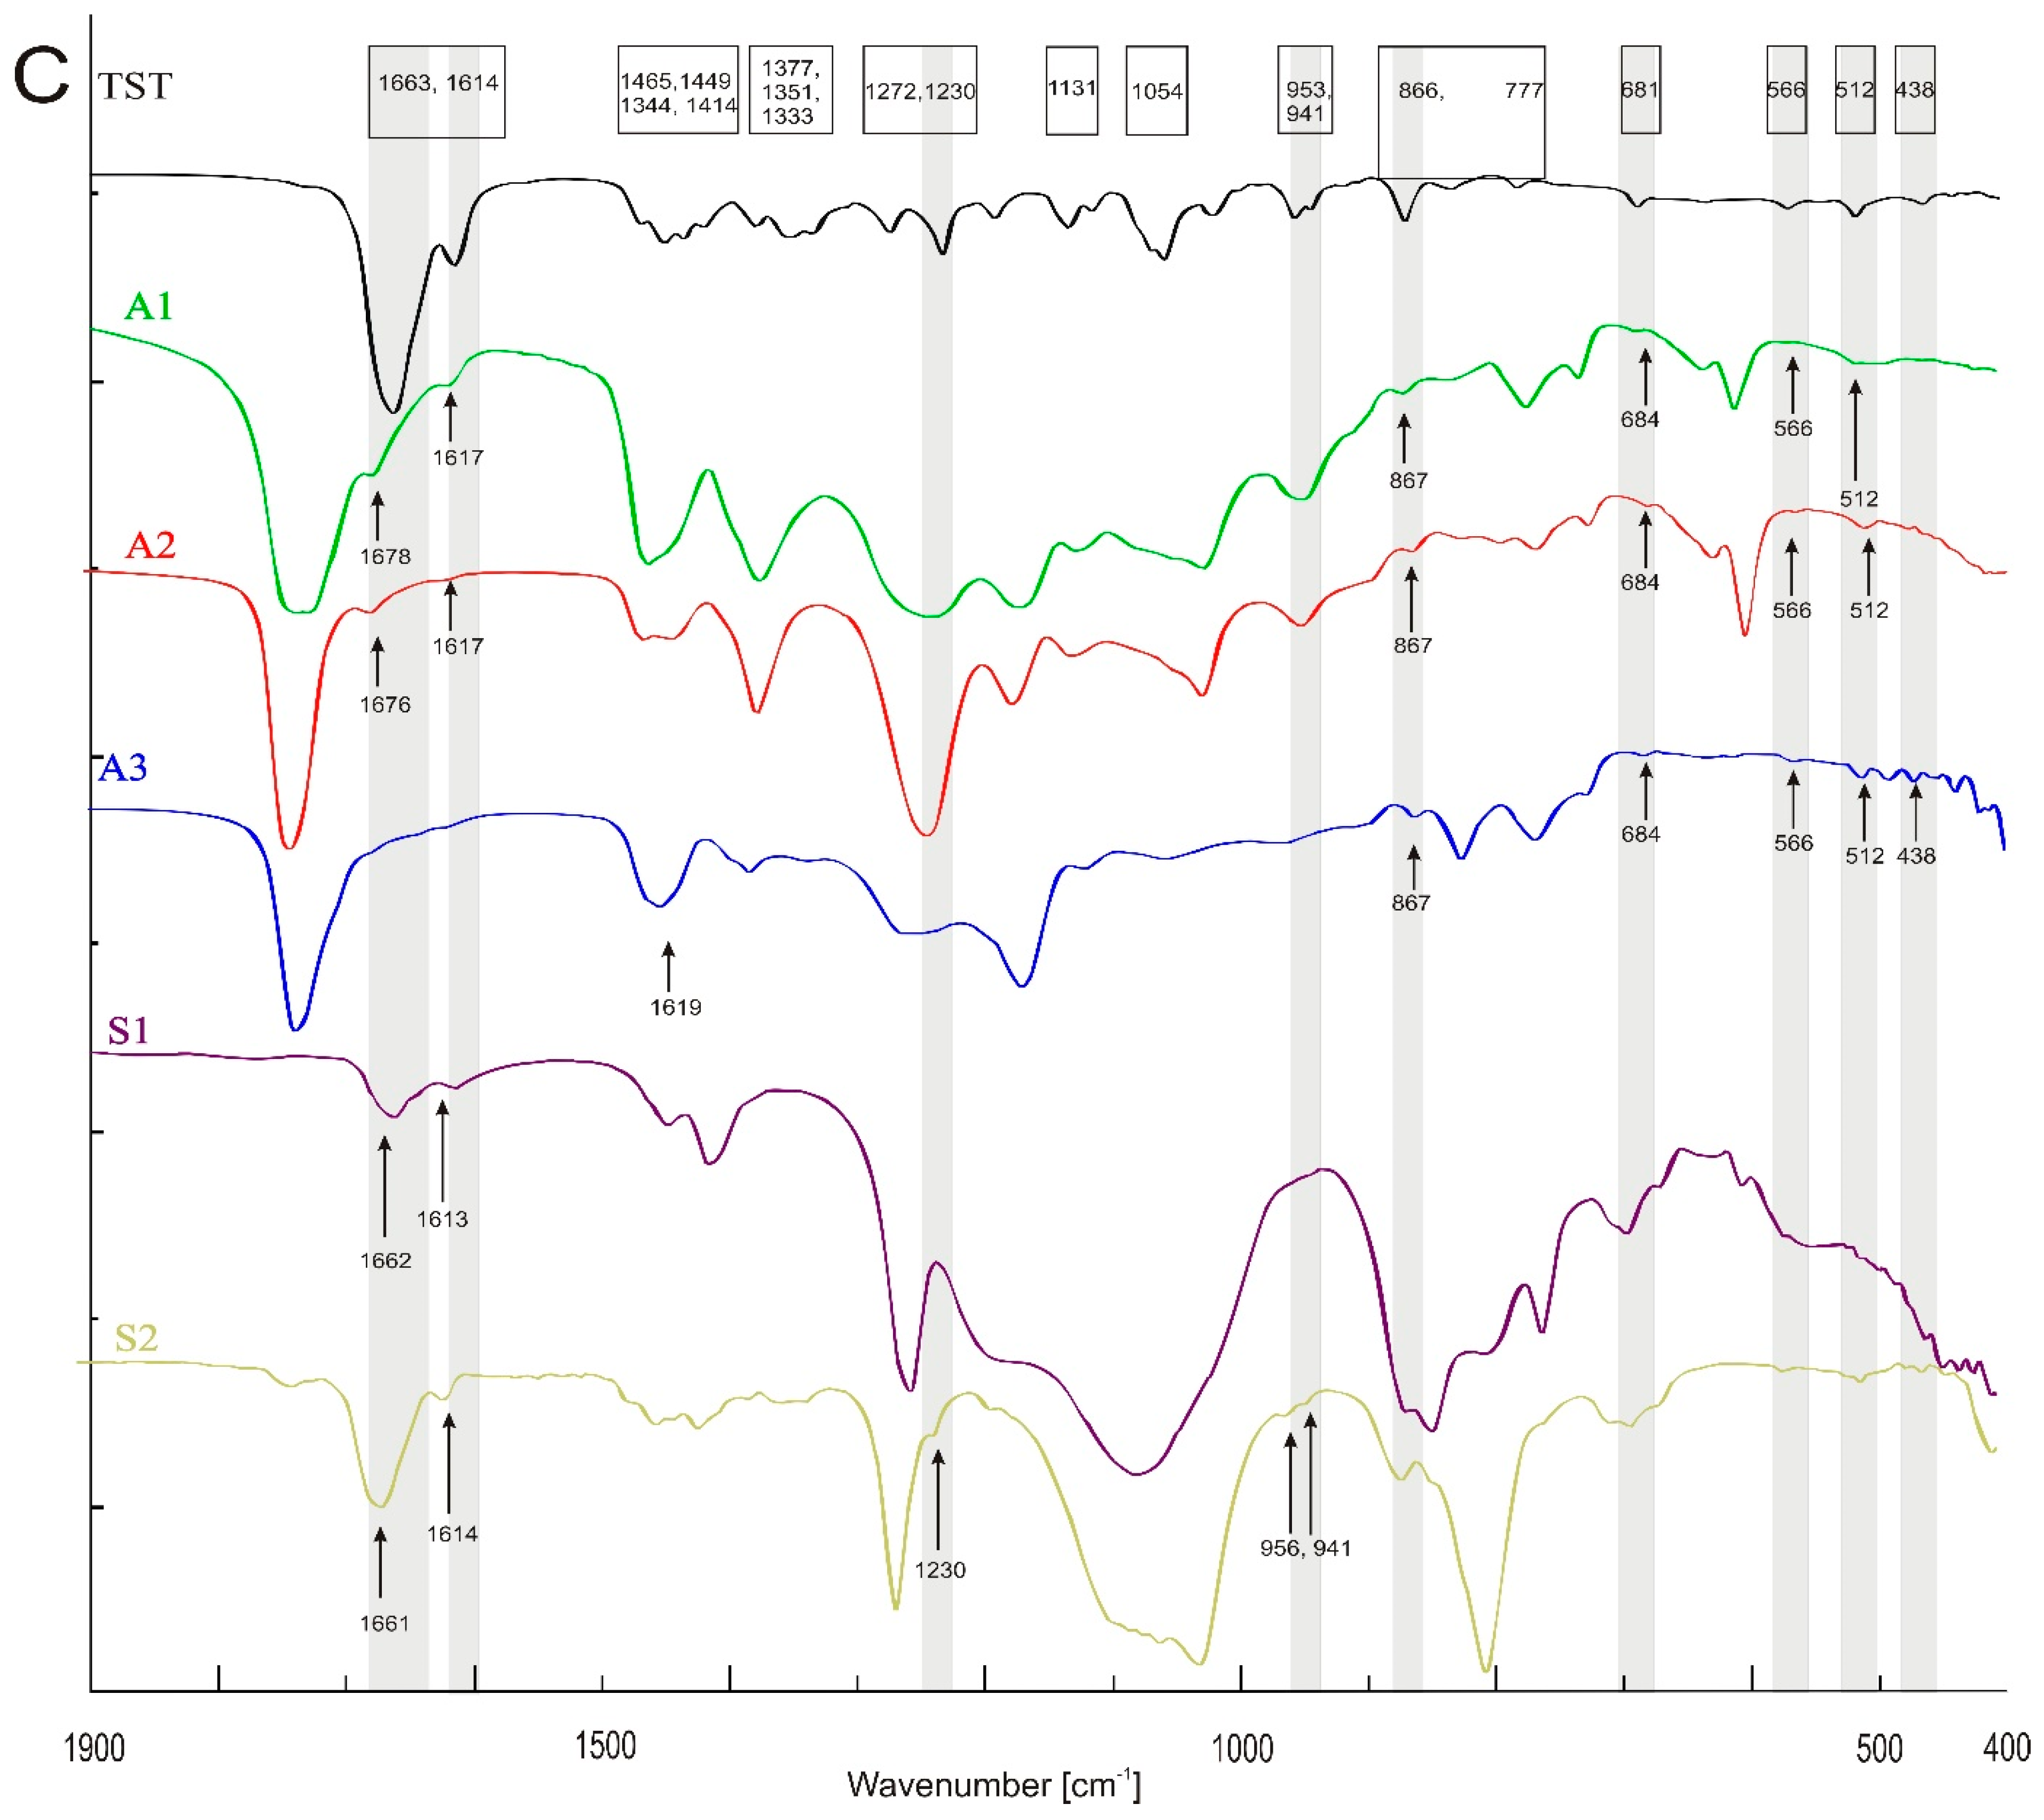
3.1. FTIR Spectroscopy
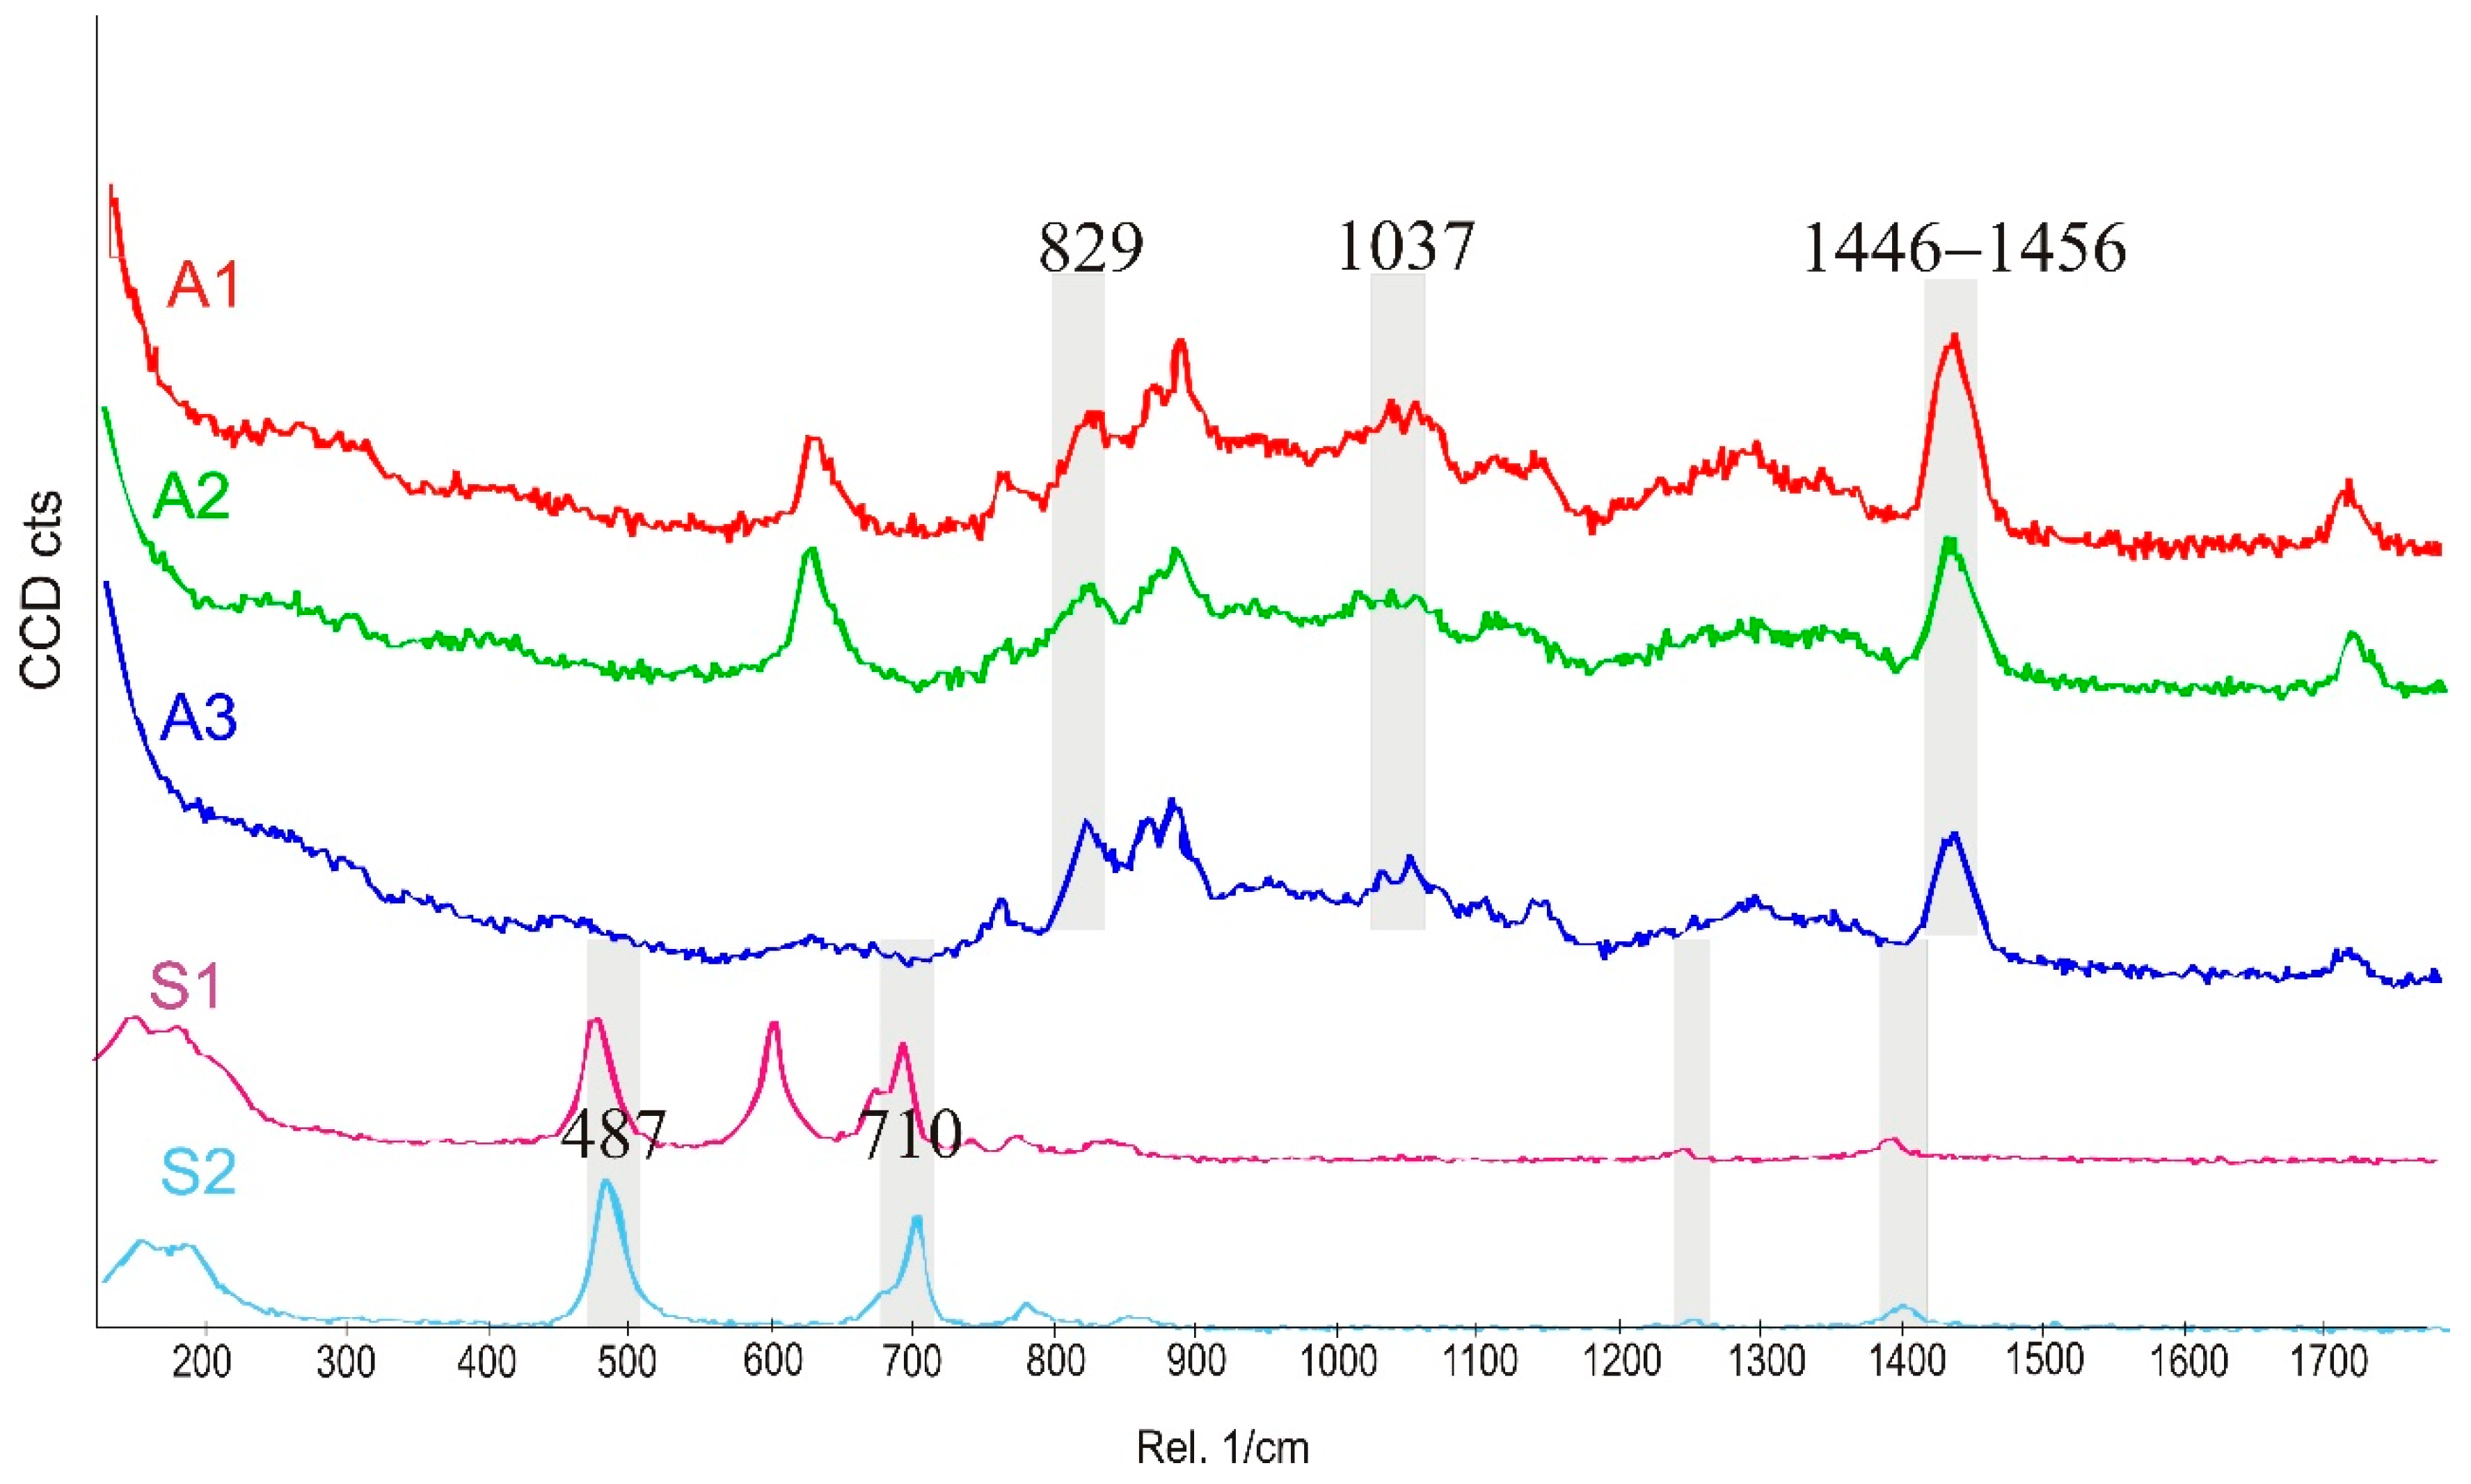
3.2. Raman Spectroscopy
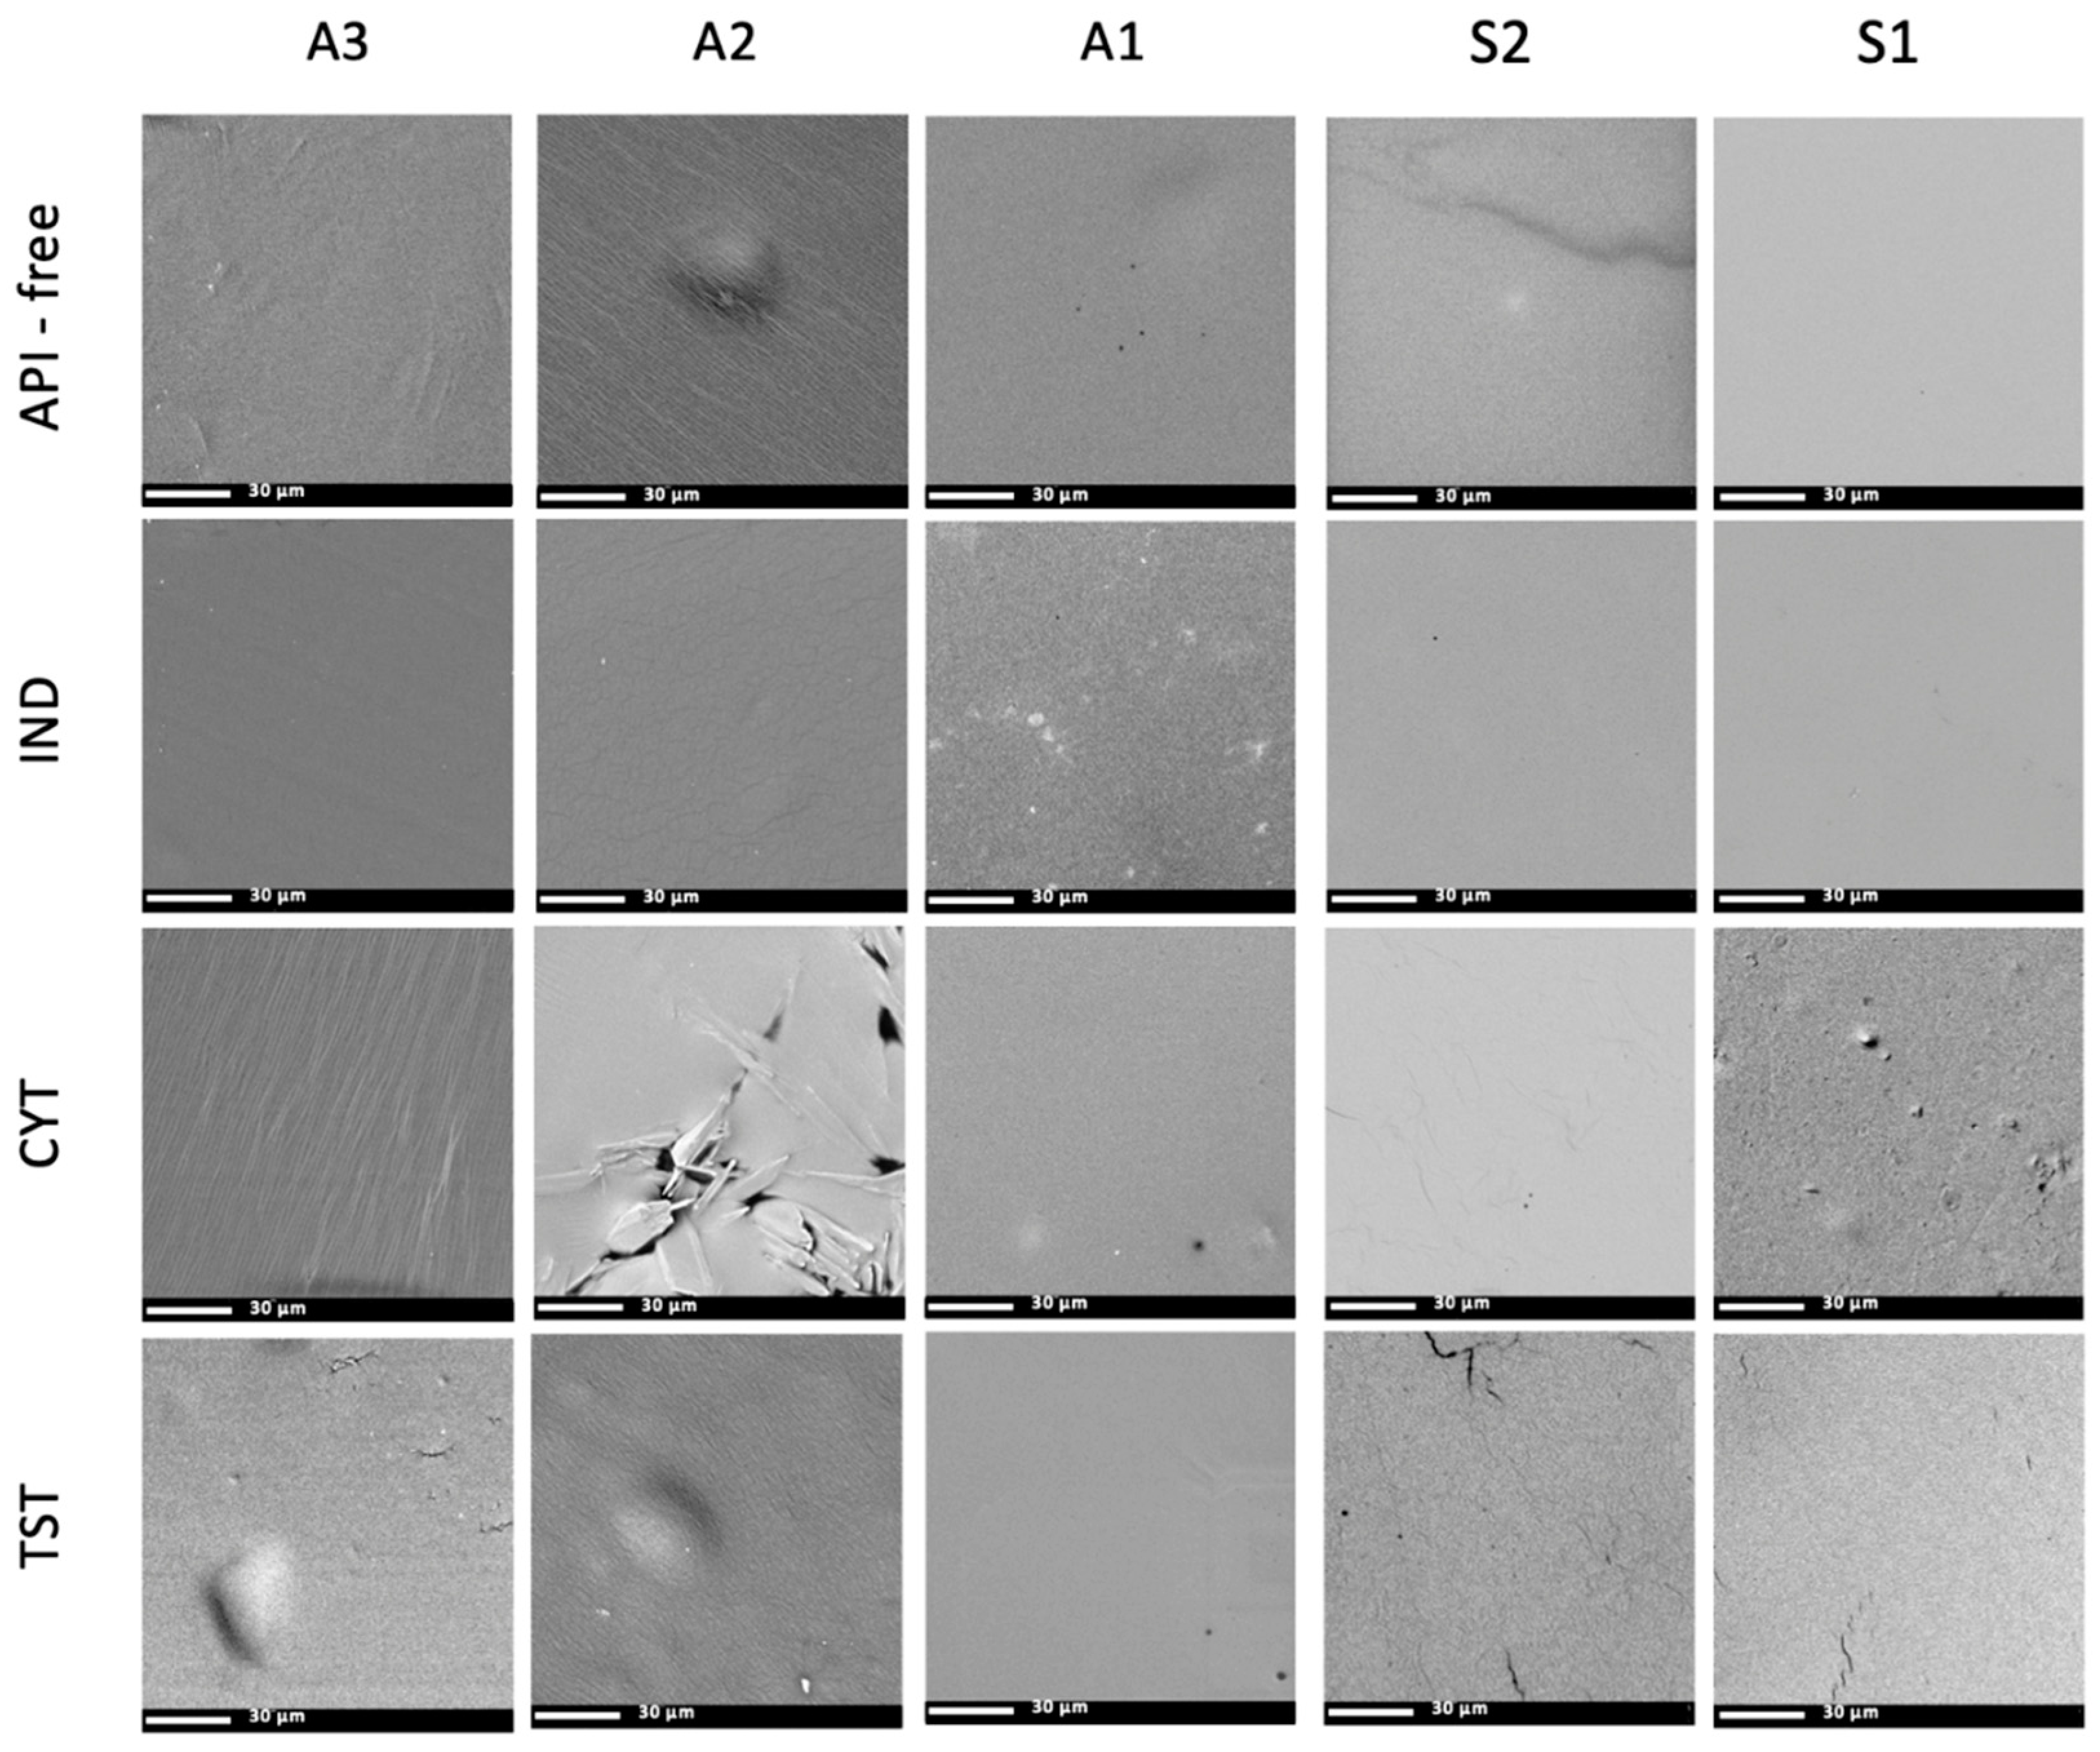
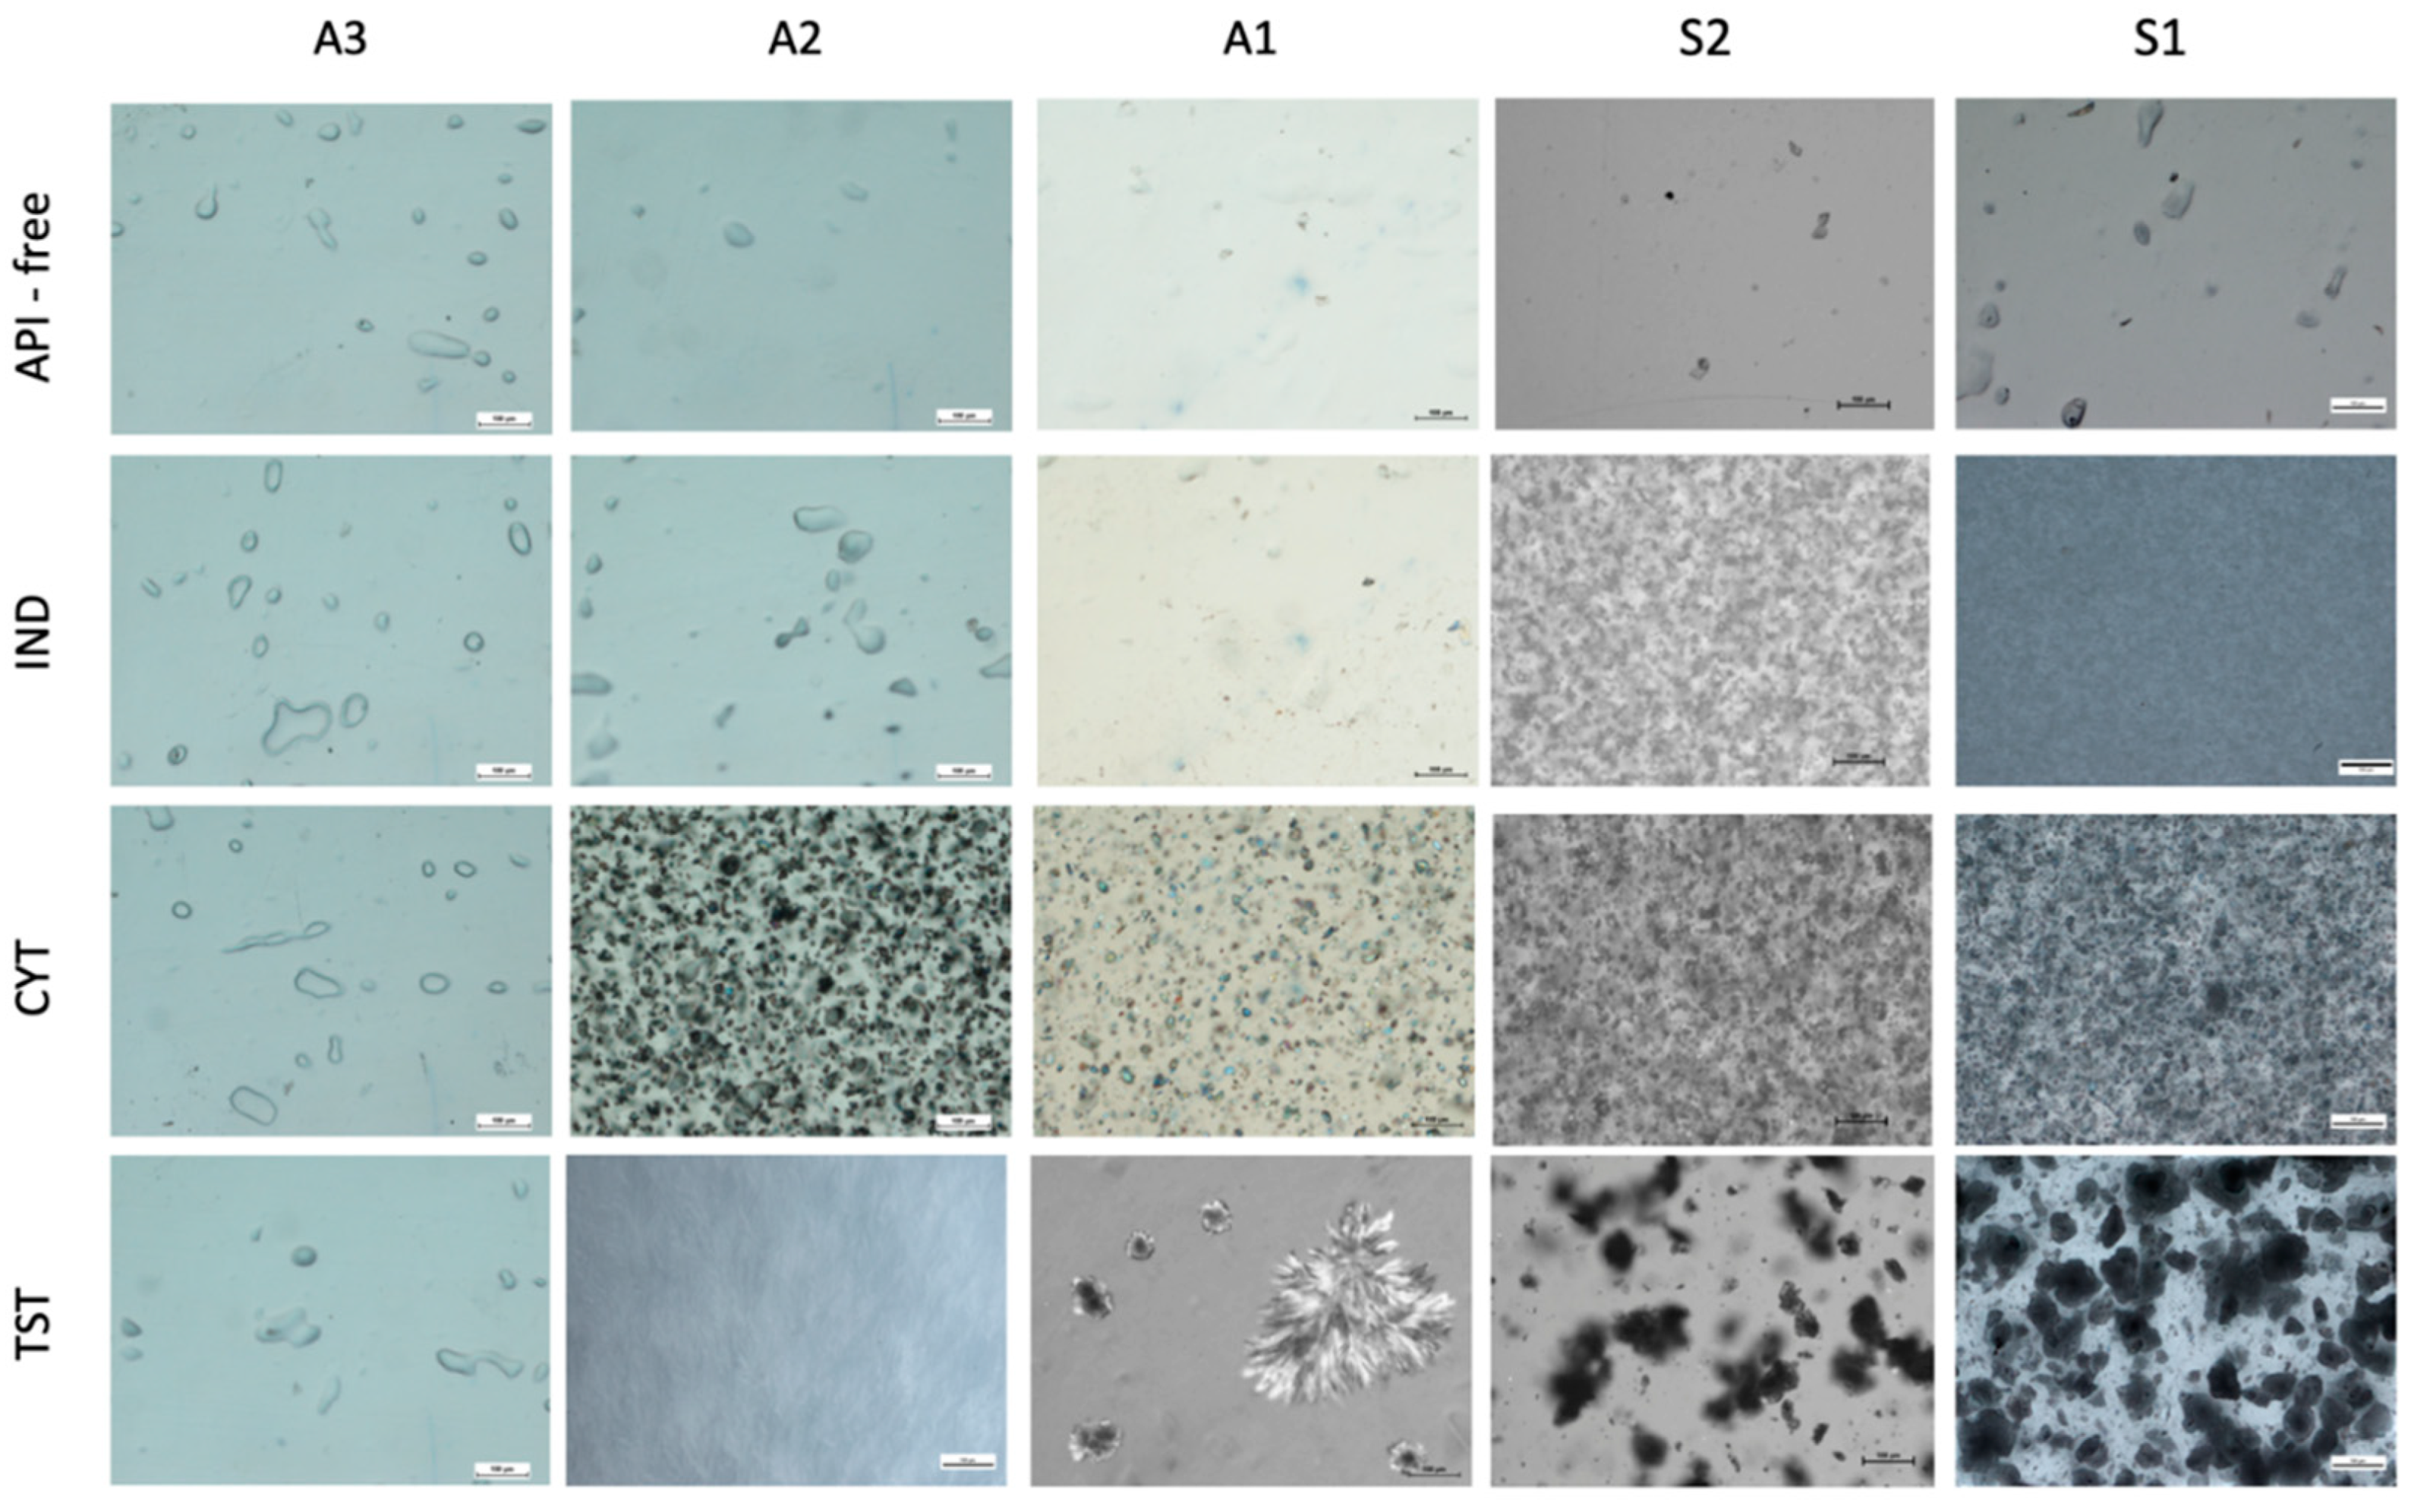
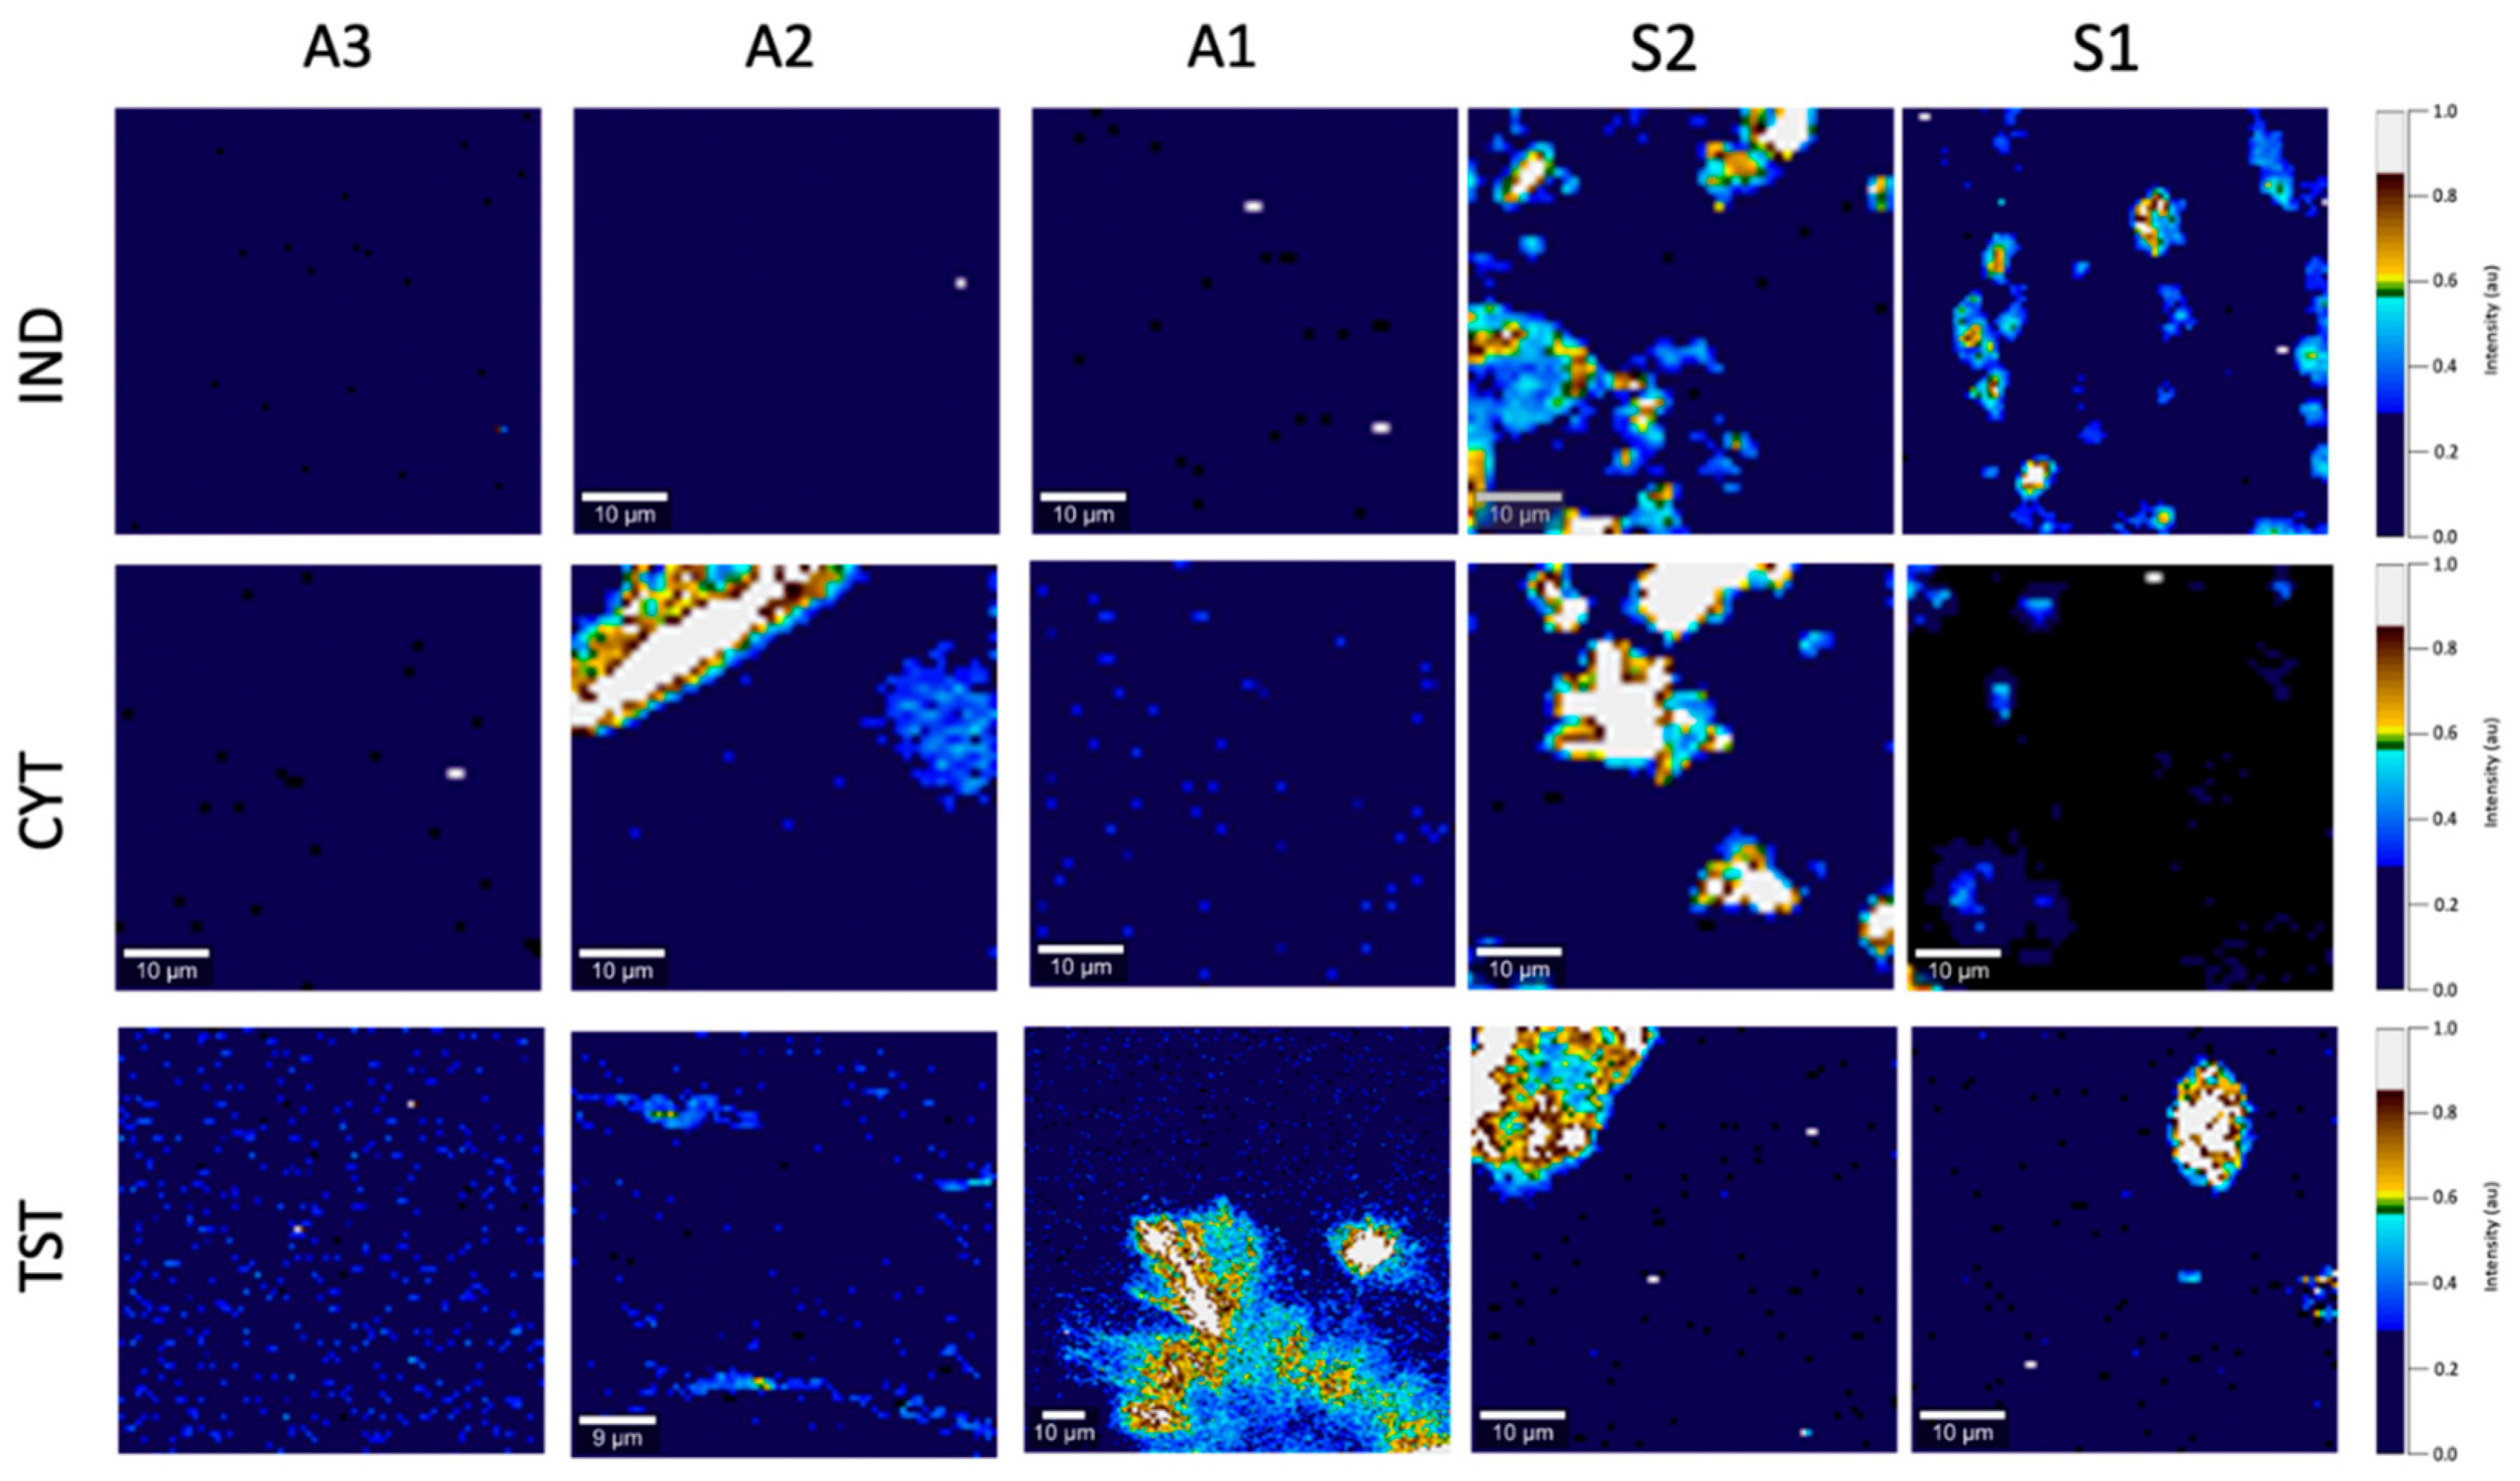
3.3. Optical Microscopy, the SEM and Raman Mapping
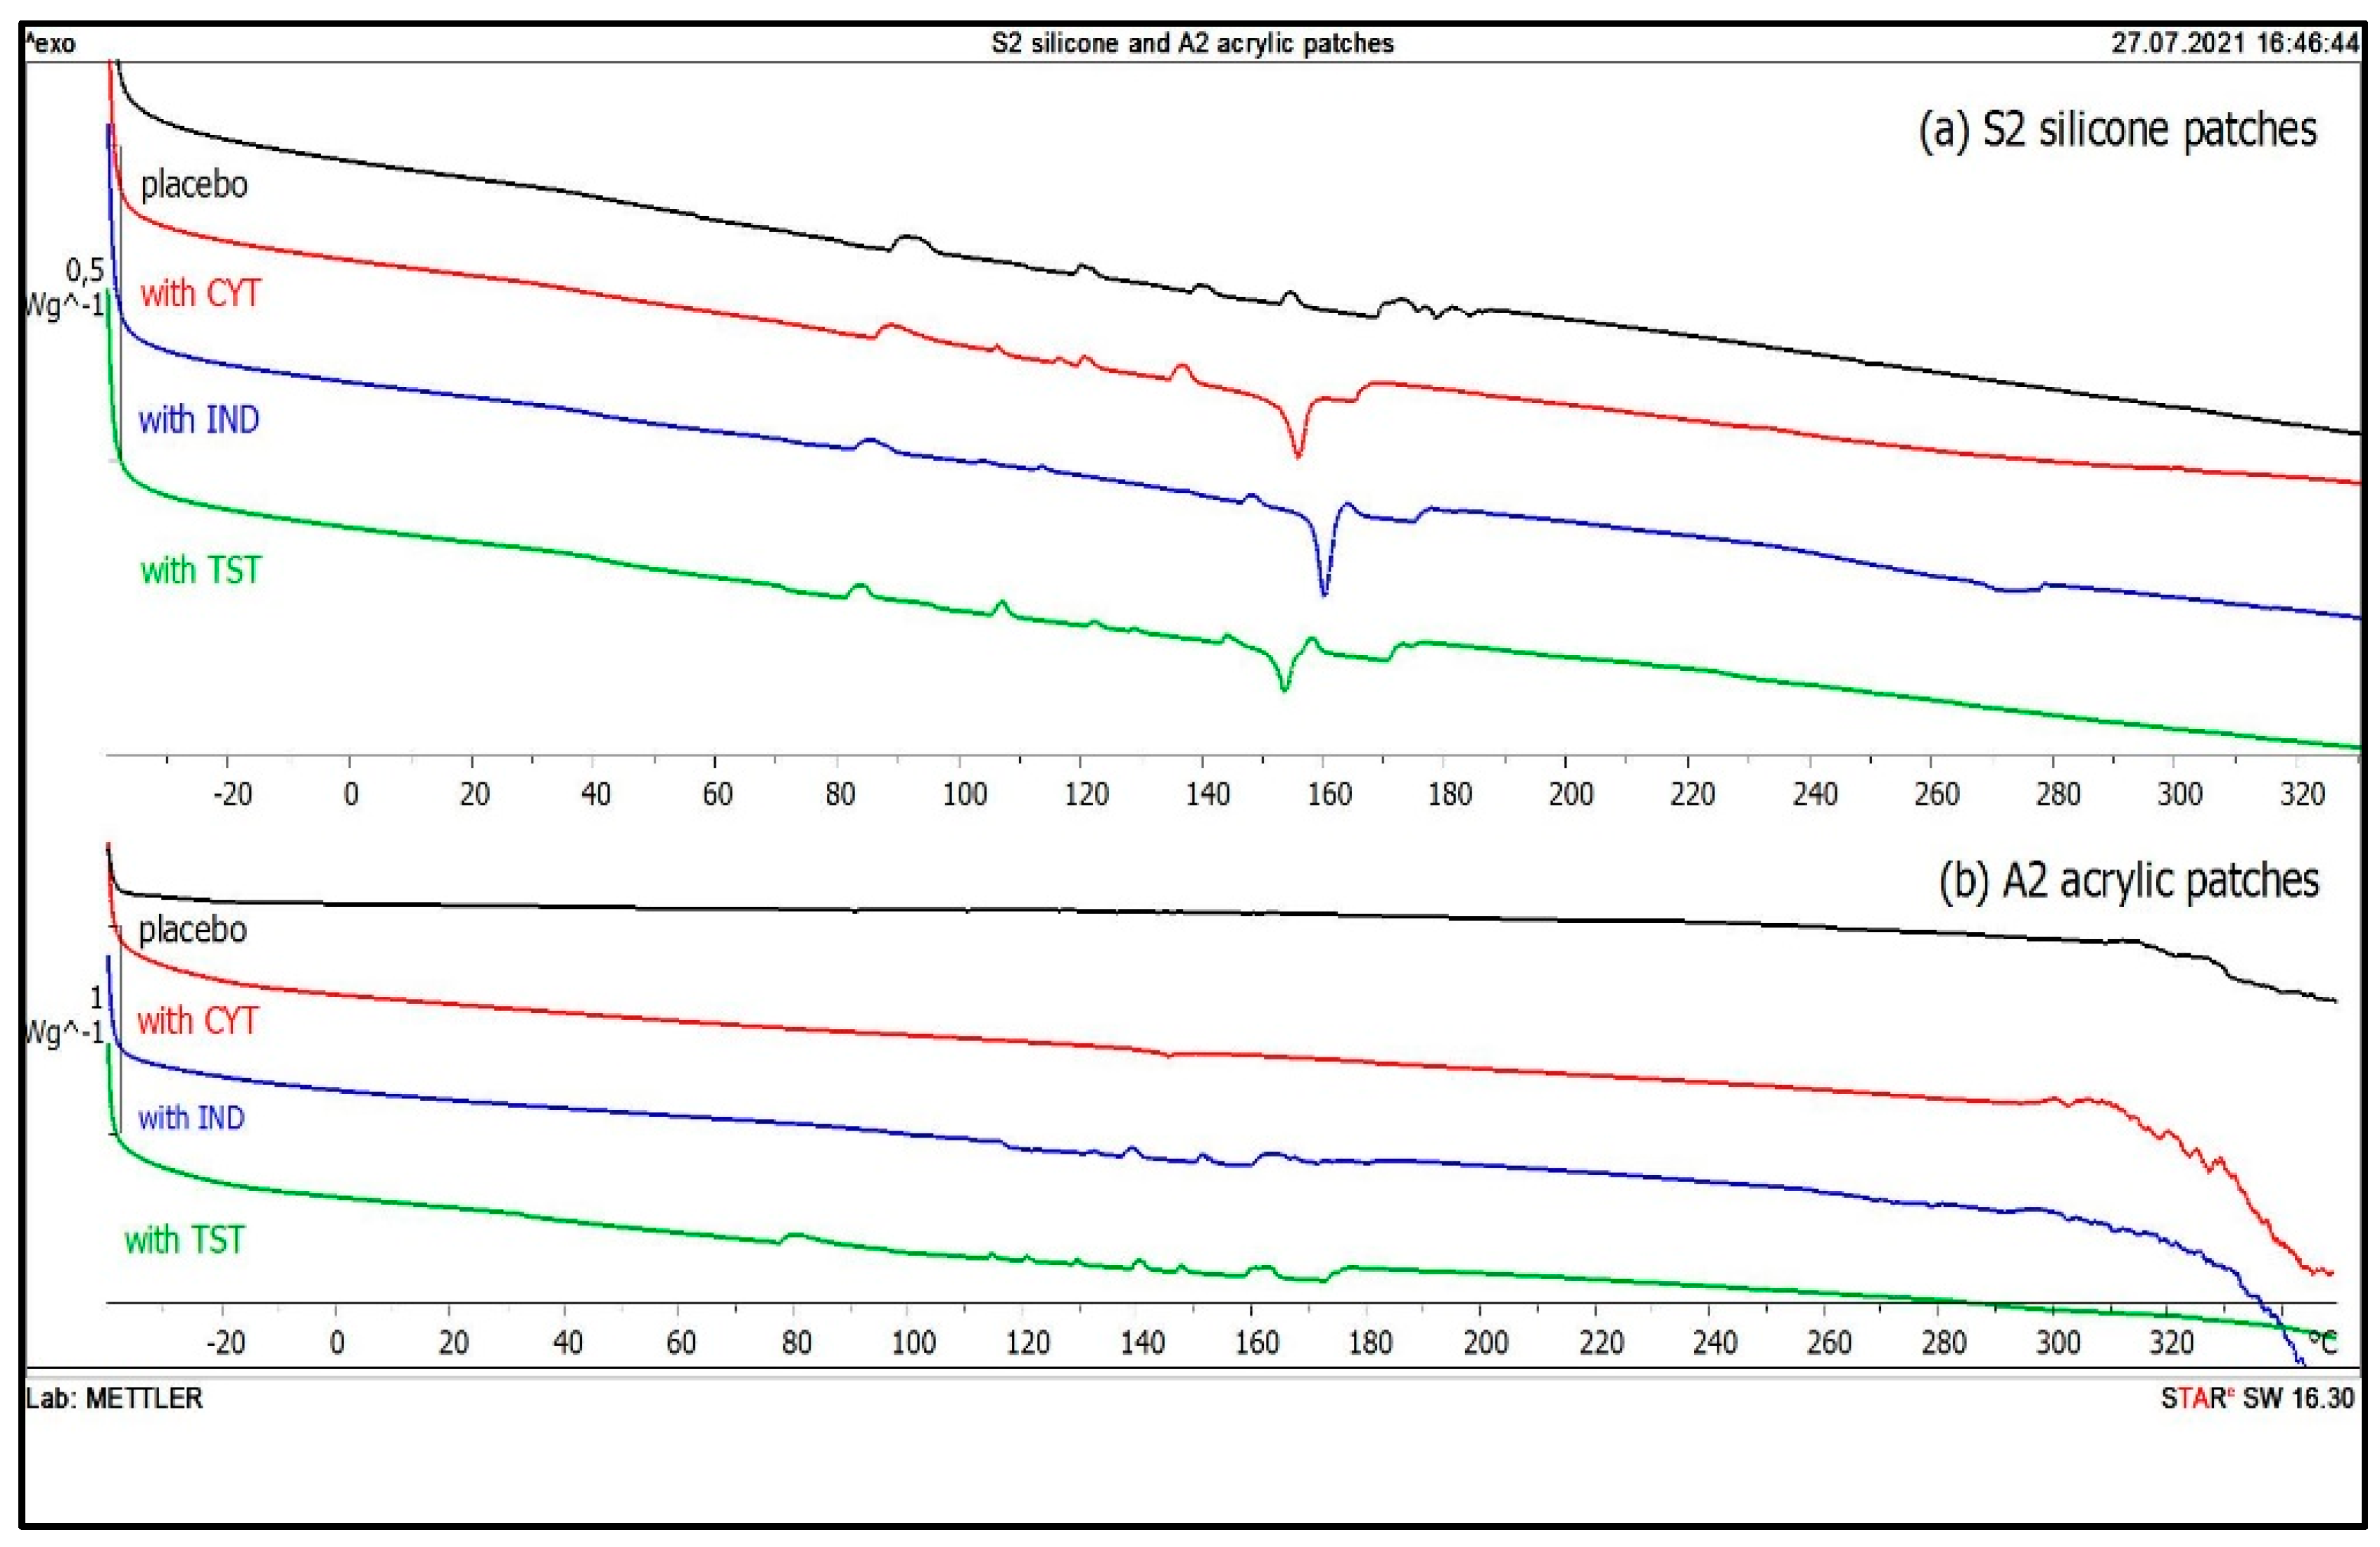
3.4. DSC
4. Discussion
4.1. Silicone Patches
4.2. Acrylic Patches
5. Conclusions
Supplementary Materials
Author Contributions
Funding
Institutional Review Board Statement
Informed Consent Statement
Data Availability Statement
Acknowledgments
Conflicts of Interest
References
- Pastore, M.N.; Kalia, Y.N.; Horstmann, M.; Roberts, M.S. Transdermal patches: History, development and pharmacology. Br. J. Pharmacol. 2015, 172, 2179–2209. [Google Scholar] [CrossRef] [PubMed] [Green Version]
- Davis, D.A.; Martins, P.P.; Zamloot, M.S.; Kucera, S.A.; Williams, R.O.; Smyth, H.D.; Warnken, Z.N. Complex drug delivery systems: Controlling transdermal permeation rates with multiple active pharmaceutical ingredients. AAPS PharmSciTech 2020, 21, 1–11. [Google Scholar] [CrossRef] [PubMed]
- Cilurzo, F.; Gennari, C.G.M.; Minghetti, P. Adhesive properties: A critical issue in transdermal patch development. Expert Opin. Drug Deliv. 2012, 9, 33–45. [Google Scholar] [CrossRef] [PubMed]
- Dasht Bozorg, B.; Banga, A.K. Effect of different pressure-sensitive adhesives on performance parameters of matrix-type transdermal delivery systems. Pharmaceutics 2020, 12, 209. [Google Scholar] [CrossRef] [Green Version]
- Haq, A.; Chandler, M.; Michniak-Kohn, B. Solubility-physicochemical-thermodynamic theory of penetration enhancer mechanism of action. Int. J. Pharm. 2020, 575, 118920. [Google Scholar] [CrossRef] [PubMed]
- Siepmann, J.; Peppas, N.A. Higuchi equation: Derivation, applications, use and misuse. Int. J. Pharm. 2011, 418, 6–12. [Google Scholar] [CrossRef] [PubMed]
- Knopp, M.M.; Gannon, N.; Porsch, I.; Rask, M.B.; Olesen, N.E.; Langguth, P.; Holm, R.; Rades, T. A Promising New Method to Estimate Drug-Polymer Solubility at Room Temperature. J. Pharm. Sci. 2016, 105, 2621–2624. [Google Scholar] [CrossRef] [PubMed] [Green Version]
- Kim, E.S.; Song, D.B.; Choi, K.H.; Lee, J.H.; Suh, D.H.; Choi, W.J. Robust and recoverable dual cross-linking networks in pressure-sensitive adhesives. J. Polym. Sci. 2020, 58, 3358–3369. [Google Scholar] [CrossRef]
- Chadha, R.; Bhandari, S. Drug-excipient compatibility screening-role of thermoanalytical and spectroscopic techniques. J. Pharm. Biomed. Anal. 2014, 87, 82–97. [Google Scholar] [CrossRef]
- Hassan, S.; Adam, F.; Bakar, M.A.; Mudalip, S.A. Evaluation of solvents’ effect on solubility, intermolecular interaction energies and habit of ascorbic acid crystals. J. Saudi Chem. Soc. 2019, 23, 239–248. [Google Scholar] [CrossRef]
- Medarević, D.; Djuriš, J.; Barmpalexis, P.; Kachrimanis, K.; Ibrić, S. Analytical and computational methods for the estimation of drug-polymer solubility and miscibility in solid dispersions development. Pharmaceutics 2019, 11, 372. [Google Scholar] [CrossRef] [PubMed] [Green Version]
- Mikolaszek, B.; Kazlauske, J.; Larsson, A.; Sznitowska, M. Controlled Drug Release by the Pore Structure in Polydimethylsiloxane Transdermal Patches. Polymers 2020, 12, 1520. [Google Scholar] [CrossRef]
- Kumar, A.; Singh, P.; Nanda, A. Hot stage microscopy and its applications in pharmaceutical characterization. Appl. Microsc. 2020, 50, 12. [Google Scholar] [CrossRef] [PubMed]
- Available online: https://www.dupont.com/liveo/wearable-medical-devices-skin-contact-devices.html (accessed on 1 July 2022).
- Czech, Z.; Kurzawa, R. Acrylic pressure-sensitive adhesive for transdermal drug delivery systems. J. Appl. Polym. Sci. 2007, 106, 2398–2404. [Google Scholar] [CrossRef]
- Benedek, I.; Feldstein, M.M. (Eds.) Handbook of Pressure-Sensitive Adhesives and Products: Three Volume Set; CRC Press: Boca Raton, FL, USA, 2009. [Google Scholar]
- MedicinesComplete Database, Martindale Complete Drug Reference. Available online: https://www.medicinescomplete.com (accessed on 1 July 2022).
- Available online: https://www.henkel-adhesives.com/content/dam/uai/AIH/master/images/drug-delivery-polymers/durotak-gelva-production-guide-US-4pager-160920.pdf (accessed on 1 July 2022).
- Ramírez-Hernández, A.; Aguilar-Flores, C.; Aparicio-Saguilán, A. Fingerprint analysis of FTIR spectra of polymers containing vinyl acetate. Dyna 2019, 86, 198–205. [Google Scholar] [CrossRef] [Green Version]
- Parhi, R.; Padilam, S. In vitro permeation and stability studies on developed drug-in-adhesive transdermal patch of simvastatin. Bull. Fac. Pharm. Cairo Univ. 2018, 56, 26–33. [Google Scholar] [CrossRef]
- Minaeva, V.A.; Minaev, B.F.; Hovorun, D.N. Vibrational spectra of the steroid hormones, estradiol and estriol, calculated by density functional theory. The role of low-frequency vibrations. Ukr. Biokhim. Zh. 2008, 80, 82–95. [Google Scholar]
- Available online: https://www.sigmaaldrich.com/PL/pl/technical-documents/technical-article/analytical-chemistry/photometry-and-reflectometry/ir-spectrum-table (accessed on 1 July 2022).
- Lee, D.C.; Webb, M.L. Pharmaceutical Analysis; CRC Press: Boca Raton, FL, USA, 2003; pp. 254–259. [Google Scholar]
- Xu, T.; Yilmaz, H.; Willett, D.R.; Strasinger, C.; Rodriguez, J.D.; Keire, D.A.; Wokovich, A.M. Raman mapping of fentanyl transdermal delivery systems with off-label modifications. Analyst 2020, 145, 953–962. [Google Scholar] [CrossRef]
- Available online: https://pubchem.ncbi.nlm.nih.gov/ (accessed on 1 July 2022).
- Benedek, I.; Heymans, L.J. Pressure-Sensitive Adhesives and Applications; Marcel Dekker, Inc.: New York, NJ, USA, 1996; p. 145. [Google Scholar]
- Kunst, A.; Geoffrey, L. Effect of residual solvent in polymer adhesive matrix on release and skin permeation of scopolamine. Int. J. Pharm. 2015, 491, 42–48. [Google Scholar] [CrossRef]
- Kann, B.; Windbergs, M. Chemical imaging of drug delivery systems with structured surfaces—A combined analytical approach of confocal Raman microscopy and optical profilometry. AAPS J. 2013, 15, 505–510. [Google Scholar] [CrossRef] [Green Version]
- Jirapornchai, S.; Siripornpinyo, P.; Chaiprasit, S. Formulation, Characterization, and In Vitro Evaluation of Transdermal Patches for Inhibiting Crystallization of Mefenamic Acid. J. Drug Deliv. 2017, 1–7. [Google Scholar] [CrossRef] [Green Version]
- Jain, P.; Banga, A.K. Induction and Inhibition of Crystallization in Drug-in-Adhesive-Type Transdermal Patches. Pharm. Res. 2013, 30, 562–571. [Google Scholar] [CrossRef] [PubMed]
- Alhijjaj, M.; Yassin, S.; Reading, M.; Axel Zeitler, J.; Belton, P.; Qi, S. Characterization of Heterogeneity and Spatial Distribution of Phases in Complex Solid Dispersions by Thermal Analysis by Structural Characterization and X-ray Micro Computed Tomography. Pharm. Res. 2017, 34, 971–989. [Google Scholar] [CrossRef] [PubMed] [Green Version]
- Rouf Akram, M.; Ahmad, M.; Abrar, A.; Sarfraz, R.M.; Mahmood, A. Formulation design and development of matrix diffusion controlled transdermal drug delivery of glimepiride. Drug Des. Dev. Ther. 2018, 12, 349–364. [Google Scholar] [CrossRef] [Green Version]
- Budd, P.M.; McKeown, N.B.; Fritsch, D. Free volume and intrinsic microporosity in polymers. J. Mater. Chem. 2005, 15, 1977–1986. [Google Scholar] [CrossRef]
- Liu, C.; Hui, M.; Quan, P.; Fang, L. Drug in adhesive patch of palonosetron: Effect of pressure sensitive adhesive on drug skin permeation and in vitro-in vivo correlation. Int. J. Pharm. 2016, 511, 1088–1097. [Google Scholar] [CrossRef] [PubMed]
- Siepmann, F.; Le Brun, V.; Siepmann, J. Drugs acting as plasticizers in polymeric systems: A quantitative treatment. J. Control. Release 2006, 115, 298–306. [Google Scholar] [CrossRef] [PubMed]


| PSA Type | Acrylate | Silicone | |||
|---|---|---|---|---|---|
| Symbol | A1 | A2 | A3 | S1 | S2 |
| Brand name | DuroTak® 387-2287 | DuroTak® 87-4098 | DuroTak® 87-2852 | Bio-PSA MD7-4502 | Soft Skin Adhesive MG 7-9850 |
| Film formation | Solvent evaporation | Polymerization | |||
| Structure and chemical name | 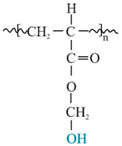 Acrylate-vinylacetate | 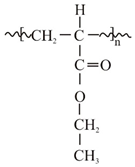 Acrylate-vinylacetate |  Acrylic acid | 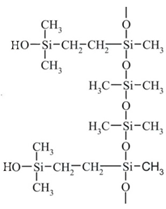 | |
| Additives | Vinyl acetate | Vinyl acetate | Crosslinker | No data | Crosslinker |
| Solvent | Ethyl acetate | Ethyl acetate | Ethyl acetate, n-heptan, isopropanol, toluen, acetylacetone | Ethyl acetate | -- |
| Content of solids (%) | 50.5 | 38.5 | 33.5 | 60–65 | 100 |
| Viscosity * (mPa*s) | 18,000 | 6500 | 2500 | 1500 | 2900 ** |
| Indomethacin (IND) | Cytisine (CYT) | Testosterone (TST) | |
|---|---|---|---|
| Chemical formula | C19H16ClNO4 | C11H14N2O | C19H28O2 |
| log P/clog P | 3.4–4.25 | 0.6–1.06 | 2.99–3.37 |
| Molecular weight (g/mol) | 357.8 | 190.2 | 288.4 |
| Melting point Tm (°C) | 158–162 | 152–153 | 155 |
| Polymorphism | α, β, γ, δ, new forms: ε, ζ, η | No data | 4 polymorphic forms |
| Solubility in water (mg/mL) | 0.0024 (pH dependent) | 8.14 | 0.0333 |
| Particle size * (µm) | 3.1 ± 2.6 | 6.6 ± 3.9 | 5.8 ± 2.6 |
| (a) | |||||||||||
| Chemical Bond | IND  | Acrylates | Silicones | ||||||||
| A1 | A1 + API | A2 | A2 + API | A3 | A3 + API | S1 | S1 + API | S2 | S2 + API | ||
| O-H intermolecular bonded | - | 3538, 3459 | 3541, 3454 | - | - | 3448 | 3541, 3454 | 3485 | 3349 | 3474 | - |
| C-H (CH2) stretching alkane | 3088, 2993, 2960, 2933, 2833 | 2956, 2927, 2875–2859 | 2956, 2927, 2875–2859 | - | - | 2956, 2927, 2867 | 2956, 2927, 2856 | 2961, 2902 | 2961, 2902 | - | 3088 |
| C=O stretching vinylphenyl ester | - | 1738 | - | - | - | 1735 | - | 1737 | 1728 | - | - |
| Asymmetric acid −C=O ketone | 1709 | - | - | - | - | - | - | - | 1709 | - | 1710 |
| (benzoilo)-C=O amide | 1685, 1590 1611–1593 | - | 1686, 1618–1592 | - | 1686, 1591 | - | 1602 | 1644, 1632, 1622 | 1687–1678, 1609–1590 | - | 1680, 1610–1592 |
| C-H bending alkane methyl group | - | 1462 | 1459–1414 | 1463, 1435 | - | 1465–1448 | 1454 | - | - | - | - |
| −C=C- | 1478, 1458, 1437 | - | - | - | - | - | - | 1442 | 1479, 1453–1442 | 1443 | 1479, 1458, 1436 |
| C-H (CH3) | 1400 | - | - | - | - | - | - | 1414 | 1413–1401 | 1409 | 1411 |
| O-H bending alcohol | 1371,1357 | 1373 | 1373 | 1373 | - | 1380 | 1378–1353 | - | 1370, 1356 | - | 1370, 1357 |
| −C-O- acidic group | 1321 | - | 1321 | - | 1320 | - | 1321 | - | 1316 | - | 1319 |
| −C-O-C- | 1292, 1261, 1224 | 1238 | - | 1237 | - | 1260–1238 | 1258 | 1254 | 1254 | 1260 | 1260, 1224 |
| −C-N- or/and C-O stretching ester | 1178, 1148 | - | - | - | - | - | - | - | - | 1180 | 1175 |
| - | 1166 | - | 1166 | - | 1164 | 1164 | - | - | - | 1145 | |
| O-H alcohol | - | 1123 | 1123 | 1123 | - | 1116 | 116 | - | - | - | - |
| −C- Cl- | 1089, 1067 | - | 1086, 1068 | - | 1089, 1069 | small 1079, broad 1043 | 1089, 1069 | 1076 | 1076 | 1093 | 1088, 1069 |
| −C-O-C- | 1036, 1015 | - | - | - | - | 1035 | 1035, 1015 | - | - | - | 1036 |
| C-O stretching primary alcohol | - | 1023 | 1023 | 1023 | - | - | - | - | - | 1024 | 1018 |
| C-O vinyl acetate | 995 | - | - | - | - | - | - | - | - | - | - |
| 968 | 944 | - | 945 | 945 | broad 964 | - | - | - | - | - | |
| −C-H- | 926, 803, 692 | - | - | - | - | - | 926 | 946, 692 | 926, 692 | 660 | 926, 692, 662, 483 |
| strong C-H bending | - | - | 835 | - | 835 | - | 835 | - | - | - | - |
| −C-Cl- and strong C-H bending | 854, 833, 734 | - | 856, 803 | 800 | 853, 800 | - | 853 | 864, 842, 803 | 864, 842, 803 | 865, 800 | 866, 846, 800 |
| C-H bending | 754, 733 | 768, 728 | 755, 728 | 770 | 770, 754 | 772 | 770, 755 | 757 | 757 | - | 754, 560, 481 |
| (b) | |||||||||||
| Chemical bond | CYT 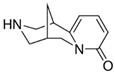 | Acrylates | Silicones | ||||||||
| A1 | A1 + API | A2 | A2 + API | A3 | A3 + API | S1 | S1 + API | S2 | S2 + API | ||
| ν (N-H) intermolecular bonded/O-H | 3420 | 3533, 3450 | 3533, 3449 | 3628, 3542, 3454 | 3628, 3542, 3454 | 3448 | 3450 | 3485 | 3349 | 3473 | 3405 |
| C-H (CH2) stretching alkane | 2944, 2736 | 2960, 2927, 2875, 2857 | 2960, 2927, 2875, 2857 | 2953, 2935, 2879, 2863 | 2953, 2935, 2879, 2863 | 2956, 2927, 2867 | 2956, 2927, 2867, 2736 | 2961, 2902 | 2961, 2902 | 2964, 2902 | 2964, 2902 |
| C=O stretching vinyl/phenyl ether | - | 1737 | 1737–1726 | 1745–1725 | 1745–1725 | 1737 | 1737–1726 | 1736, 1625 | - | - | - |
| N-C=O | 1644 | - | 1649 | - | 1655 | - | 1644 | 1648 | 1641 | - | 1643 |
| −C=C- cyclic alkene | 1546 | - | 1546 | - | 1546 | - | 1546 | 1547 | 1547 | - | 1544 |
| C-H bending alkane methyl group | 1469, 1449, 1425, 1410 | 1460 | 1460 | 1462 | 1462 | 1465–1448 | 1465–1448 | 1447 | 1447 | 1442 | 1446, 1470 |
| O-H bending alcohol | - | 1380 | 1380 | 1372 | 1372 | 1380 | 1380 | 1411 | - | - | - |
| −C-N- stretching | 1358, 1348 | - | - | - | - | - | - | - | 1360 | - | 1357 |
| C-O stretching ester | - | - | - | - | - | - | - | - | - | - | 1307 |
| −C-O-C stretching vinyl ether/−C-N- | 1263, 1229 | 1236 | 1236 | 1255–1229 | 1255–1229 | 1260–1238 | 1260–1238 | 1259 | 1259 | 1262 | 1262, 1227 |
| C-N stretching amine | 1166, 1154, 1114 | 1167 | 1168 | 1171 | 1171 | 1164, 1116 | 1164, 1116 | - | - | - | 1151 |
| C-O stretching ester | - | 1123 | 1123 | 1123 | 1123 | 1117 | 1117 | - | - | - | - |
| C-O stretching ester or C-N | 1061 | 1025 | 1025 | 1023 | 1023 | Small broad 1062–1026 | 1065–1027 | 1078 | 1078 | 1092, 1024 | 1092, 1062, 1025 |
| C-O- | 992 | - | - | 944 | 944 | Broad 964 | 978 | 947 | - | - | 943 |
| −C=C- | 944, 805, 740 | 947, 728 | 947, 802, 728 | 794, 770, 727 | 770, 731, 802 | - | 806, 729 | 803, 757 | 803, 757 | 799 | 799, 740 |
| −C-H bending | 916, 865, 827 | 827 | 827 | - | 864 | 863, 827 | 865, 827 | 865, 690 | 865, 690 | 864 | 917, 864 |
| -C=C- | 613, 577, 543, 488 | 629, 606 | 606, 566, 486 | 605, 496 | 605, 570, 486 | 491 | 613, 581, 545, 488 | 599 | 599 | 662 | 662, 613, 575, 544, 487 |
| (c) | |||||||||||
| Chemical bond | TST 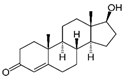 | Acrylates | Silicones | ||||||||
| A1 | A1 + API | A2 | A2 + API | A3 | A3 + API | S1 | S1 + API | S2 | S2 + API | ||
| ν (O-H) intermolecular bonded | 3411 | 3533, 3450 | 3533, 3449 | 3628, 3542, 3454 | 3628, 3542, 3454 | 3454 | 3454 | 3485 | 3610–3250 | 3473 | 3428 |
| C-H (CH2) stretching alkane | 2940, 2871 | 2960, 2927, 2875, 2857 | 2960, 2927, 2875, 2857 | 2953, 2935, 2879, 2863 | 2953, 2935, 2879, 2863 | 2958, 2933, 2876 | 2956, 2927, 2867, 2736 | 2961, 2902 | 2961, 2902 | 2964, 2902 | 2964, 2902 |
| C=O stretching vinyl/phenyl ether | 1662 | 1737, 1678 | 1743–1725, 1678 | 1745–1725 | 1738, 1676 | 1737 | 1737 | 1853, 1736, 1619 | 1853, 1768, 1662 | - | 1661 |
| −C=C- cyclic alkene | 1614 | - | 1617 | - | 1617 | - | 1619 | - | 1613 | - | 1614 |
| C-H bending alkane methyl group | 1467, 1449, 1433, 1417 | 1460 | 1460 | 1462, 1437 | 1462, 1437 | 1452 | 1465–1448 | 1444 | 1447 | 1442 | 1446 |
| O-H bending alcohol | 1375 | 1373 | 1373 | 1372 | 1372 | 1378 | 1378 | 1412 | 1412 | 1412 | 1416 |
| −C-H- stretching | 1351, 1333 | - | - | - | - | 1334 | 1334 | - | - | 1378, 1350, 1330 | 1375, 1350, 1331 |
| −C-O-C stretching vinyl ether/−C-N- | 1272, 1230, 1131, 1056 | 1238 | 1244 | 1255–1229 | 1239 | 1260–1234 | 1260–1234 | 1254 | 1254 | 1259 | 1259–1230 |
| C-O stretching ester | 1189, 1113 | 1169, 1122 | 1169, 1122 | 1171, 1124 | 1171, 1124 | 1165, 1116 | 1116 | 1189 | 1189 | - | - |
| −C=C- cyclic alkene | 1018, 953, 941, 866, 831 | 1023, 827 | 1023, 867, 830 | 1024, 827 | 1024, 867 | 1051, 828, | 1051, 867, 828 | 1076, 843 | 1076, 843 | 1089, 1024 | 1054, 1023 |
| C-O- | 956, 941 | 945 | 945 | 944 | 944 | Broad 964 | 978 | 948 | - | - | 956, 941 |
| −C-H bending | 778 | 769, 729 | 769, 729 | 770, 728 | 770, 728 | 769, 729 | 769, 739 | 867, 690, 799, 757 | 867, 690, 799, 757 | 926, 864, 797, 702 | 864, 797, 702 |
| −C=C- | 684 | 630, 605 | 684, 630, 605 | 697, 630, 605 | 684, 630, 605 | 694 | 684 | 690, 599, | 690, 599, | 685 | 685 |
| −C-C- | 566, 512, 459, 438 | 491 | 512, 566 | - | 512, 566 | 568, 443 | 566, 512, 438 | - | - | - | - |
| (a) | |||||||||||
| Chemical bond | CYT | Acrylates | Silicones | ||||||||
| A3 | A3 + API | A1 | A1 + API | A2 | A2 + API | S1 | S1 + API | S2 | S2 + API | ||
| C=O stretching vinyl/phenyl ether | - | 1731 | - | 1733 | - | 1734 | - | - | - | - | - |
| N-C=O | 1644 | - | - | - | - | - | 1644 | - | - | - | |
| −C=C- cyclic alkene | 1540, 1561 | - | - | - | 1543 | - | 1540, 1561 | - | 1546 | - | 1561, 1541 |
| C-H bending alkane methyl group | 1419, 1468 | 1450 | 1457 | 1449 | 1460 | 1445 | 1419, 1468 | - | 1470, 1445 | 1407 | 1468 |
| O-H bending alcohol | - | 1312 | 1380 | 1200–1380 | 1311 | 1200–1380 | - | 1412 | 1416 | - | 1415 |
| −C-N- stretching | 1344 | 1250–1400 | 1358 | 1200–1380 | 1274 | 1200–1380 | 1344 | - | - | - | - |
| -C-O-C stretching vinyl ether/−C-N- | 1263, 1223, 1207 | - | 1218 | 1200–1380 | 1210 | 1200–1380 | 1263, 1223, 1207 | 1257 | 1266, 1226, 1207 | 1262 | 1262, 1223, 1210 |
| C-N stretching amine | 1153 | 1154 | 1165, 1151 | 1146 | 1159, 1142 | - | 1153 | - | 1152 | - | 1155 |
| C-O stretching ester | 1110 | - | - | 1115 | 1107 | 1123 | 1110 | - | 1110, | - | - |
| C-O stretching ester or C-N | 1011, 1035, 1056, 1077, 1092 | 1060 | 1035 | 1041, 1061 | 1094, 1080, 1062, 1042, 1015 | 1061, 1020 | 1011, 1035, 1056, 1077, 1092 | - | 1087, 1057, 1039, 1011 | - | 1094, 1078, 1056, 1036, 1014 |
| C-O- | 992 | - | 978 | - | 983 | - | 992 | - | - | - | 978 |
| −C=C- | 977, 735 | 890, 772 | 806 | - | 797, 741, 717, 739 | 895, 877 | 977, 735 | 790, 709, | 978 | 793 | 793 |
| −C-H bending | 905, 860, 818 | 875, 832 | 838 | 821, 891 | 908, 868, 821, | 830 | 905, 860, 818 | 854 | 908, | 865 | 905, 864, 818, 790, 737, |
| −C=C- | 716, 655, 613, 574, 539, 511, 485, 455, 376, 352 | - | 454, 525 | 625, 766 | 659, 616, 578, 540, 489, 455, 381, 357 | 630, 430–330 | 716, 655, 613, 577, 539, 511, 485, 455, 376, 352 | 691, 613, 486 | 714, 656, 615, 575, 485, 377 | 707,688, 488 | 715, 614, 575, 539, 488, 378, 354 |
| (b) | |||||||||||
| Chemical bond | IND | Acrylates | Silicones | ||||||||
| A3 | A3 + API | A1 | A1 + API | A2 | A2 + API | S1 | S1 + API | S2 | S2 + API | ||
| C=O stretching vinyl/phenyl ester | - | 1731 | - | - | - | 1731 | 1731 | - | 1728 | - | - |
| Asymmetric acid -C=O ketone | 1698 | - | - | - | - | - | - | - | 1697 | - | 1699 |
| (benzoilo) −C=O amide | 1620, 1589 | - | - | - | - | - | 1586 | - | 1619, 1587 | - | 1619, 1589 |
| C-H bending alkane methyl group | 1467 | 1450 | 1456 | 1457 | 1447 | 1446 | 1443 | - | - | - | 1469 |
| −C=C- | 1438 | - | - | 1434 | - | - | - | - | 1438 | - | 1439 |
| C-H (CH3) | 1396 | - | - | - | - | - | - | 1409 | 1410 | 1410 | 1394 |
| O-H bending alcohol | 1360 | - | 1358 | 1357 | 1359 | 1380–1240 | 1355 | - | 1360 | - | 1360 |
| −C-O- acidic group | 1311 | - | 1327 | 1327 | 1306 | 1310 | 1310 | - | 1310 | - | 1310 |
| -C-O-C- | 1263, 1221 | - | 1220 | 1217 | - | - | 1223 | 1265 | 1265, 1220 | 1265 | 1265, 1222 |
| −C-N- or/and C-O stretching ester | 1172 | 1160 | 1150 | - | - | - | - | - | 1170 | - | 1173 |
| 1145 | 1149 | - | 1164, 1149 | 1148 | - | - | - | 1145 | - | 1148 | |
| O-H alcohol | - | 1114 | - | - | - | 1116, 1120 | 1125 | - | - | - | - |
| -C-Cl- | 1068, 1087 | 1062 | - | - | 1060 | 1064, 1045 | 1064, 1045, 1086 | - | 1088 | - | 1089, 1069 |
| −C-O-C- | 1023 | 1045 | 1040 | 1033 | - | 1022 | 1022 | - | 1022 | - | 1023 |
| C-O stretching primary alcohol | - | 997 | 997 | - | - | - | - | - | - | - | 1018 |
| C-O vinyl acetate | 966 | 940–980 | 970 | 997, 972 | - | - | - | - | 966 | - | 967 |
| −C-H- | 926, 907 | - | 926 | 939, 897 | - | - | - | - | 908 | - | 907 |
| strong C-H bending | - | 879, 896 | 835, 896 | 840, 896 | 892 | 892 | 892 | - | - | - | - |
| −C-Cl- strong C-H bending | 840 | 829 | 807 | 805, 838 | 827 | 830 | 830 | 870–840 | 839 | 864 | 841 |
| C-H bending | 756, 738, 701, 630, 399, 271 | 772 | 736, 399 | 526, 452, 395 | 734, 628 | 633 | 630, 698, 737 | 786 754, 706, 687, 614, 490 | 755, 738, 700, 615, 487, 431, 411, 397, 271 | 790, 708, 490 | 756, 738, 700, 630, 617, 490, 432, 413, 397, 275 |
| (c) | |||||||||||
| Chemical bond | TST | Acrylates | Silicones | ||||||||
| A3 | A3 + API | A1 | A1 + API | A2 | A2 + API | S1 | S1 + API | S2 | S2 + API | ||
| C=O stretching vinyl/phenyl ether | - | 1735 | - | 1731 | - | 1734 | 1731 | - | - | - | - |
| −C=C- cyclic alkene | 1654 | - | - | - | 1663 | - | 1664 | - | 1655 | - | 1652 |
| C-H bending alkane methyl group | 1610 | - | 1611 | - | 1613 | - | 1612 | - | 1612 | - | 1611 |
| O-H bending alcohol | 1450 | 1454 | - | 1446 | 1446 | 1446 | 1447 | - | - | - | 1446 |
| −C-O-C stretching vinyl ether/-C-N- | 1349 | - | - | - | - | - | - | 1409 | 1410 | 1411 | - |
| C-O stretching ester | - | - | - | 1347 | 1326 | - | - | - | 1330 | - | 1331 |
| −C=C- cyclic alkene | - | 1310 | - | 1308 | - | 1308 | - | - | - | - | 1310 |
| C-O- | 1281, 1233 | - | - | 1238 | 1233 | - | 1231 | 1261 | 1283, 1232 | 1263 | 1280, 1233 |
| −C-H bending −C=C- | 1205, 1192 | 1159 | - | - | - | - | 1195 | - | 1151 | - | 1151 |
| 1134 | - | - | 1143 | 1153 | 1120 | 1129 | - | 1131 | - | 1131 | |
| −C-C- | 1113 | 1117 | - | 1118 | 1115 | - | - | - | - | - | - |
| C-O stretching | 1091, 1032 | 1047 | - | 1062 | - | 1063, 1020 | 1061, 1020, 1086 | - | - | - | 1091 |
| C=C bending | 998, 949, 912, 901, 868 | 966 | - | 892, 873, 826, | 999, 949, 903, 870, 939 | 892 | 1001, 946, 894, | - | 997, 947, 902, 869 | - | 998, 948, 902, 867 |
| C-H bending | 839, 746, 717, 681, 662, 541 | 896, 879, 835, 771 | - | 766, 628 | 748, 720, 684, 635, 544 | 831, 765, 631 | 829 | 852, 788, 707, 614, 487 | 837, 746 | 863, 790, 709, 490 | 837, 745, 712, 683 |
| Placebo Patch | IND | CYT | TST | |
|---|---|---|---|---|
| Melting temperature Tm (°C) | ||||
| Pure API | 160.9 | 156.1 | 154.4 | |
| A1, A2, A3 | n.d. | n.d. | n.d. | |
| S1 | 160.0 | 151.0 | 152.7 | |
| S2 | 160.1 | 155.9 | 153.4 | |
| Glass transition temperature Tg (°C) | ||||
| A1 | −26.0 | −25.7 | −26.7 | −27.8 |
| A2 | −13.8 | −17.6 | −17.9 | −15.3 |
| A3 | −14.3 | −18.1 | −17.6 | −19.6 |
Publisher’s Note: MDPI stays neutral with regard to jurisdictional claims in published maps and institutional affiliations. |
© 2022 by the authors. Licensee MDPI, Basel, Switzerland. This article is an open access article distributed under the terms and conditions of the Creative Commons Attribution (CC BY) license (https://creativecommons.org/licenses/by/4.0/).
Share and Cite
Mikolaszek, B.; Jamrógiewicz, M.; Mojsiewicz-Pieńkowska, K.; Sznitowska, M. Microscopic and Spectroscopic Imaging and Thermal Analysis of Acrylates, Silicones and Active Pharmaceutical Ingredients in Adhesive Transdermal Patches. Polymers 2022, 14, 2888. https://doi.org/10.3390/polym14142888
Mikolaszek B, Jamrógiewicz M, Mojsiewicz-Pieńkowska K, Sznitowska M. Microscopic and Spectroscopic Imaging and Thermal Analysis of Acrylates, Silicones and Active Pharmaceutical Ingredients in Adhesive Transdermal Patches. Polymers. 2022; 14(14):2888. https://doi.org/10.3390/polym14142888
Chicago/Turabian StyleMikolaszek, Barbara, Marzena Jamrógiewicz, Krystyna Mojsiewicz-Pieńkowska, and Małgorzata Sznitowska. 2022. "Microscopic and Spectroscopic Imaging and Thermal Analysis of Acrylates, Silicones and Active Pharmaceutical Ingredients in Adhesive Transdermal Patches" Polymers 14, no. 14: 2888. https://doi.org/10.3390/polym14142888
APA StyleMikolaszek, B., Jamrógiewicz, M., Mojsiewicz-Pieńkowska, K., & Sznitowska, M. (2022). Microscopic and Spectroscopic Imaging and Thermal Analysis of Acrylates, Silicones and Active Pharmaceutical Ingredients in Adhesive Transdermal Patches. Polymers, 14(14), 2888. https://doi.org/10.3390/polym14142888