
Chitin Nanocrystal Hydrophobicity Adjustment by Fatty Acid Esterification for Improved Polylactic Acid Nanocomposites

 , ,
, ,  and
and 
Abstract
:
1. Introduction
2. Materials and Methods
2.1. Materials
2.2. Sample Preparation
2.2.1. Chitin Nanocrystals Preparation
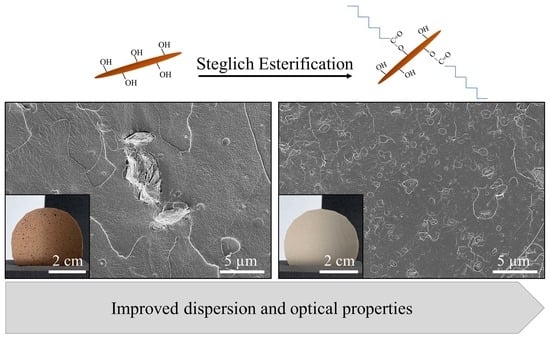
2.2.2. Surface Acetylation
2.3. Nanocomposite Production
2.4. Nanoparticle Characterization
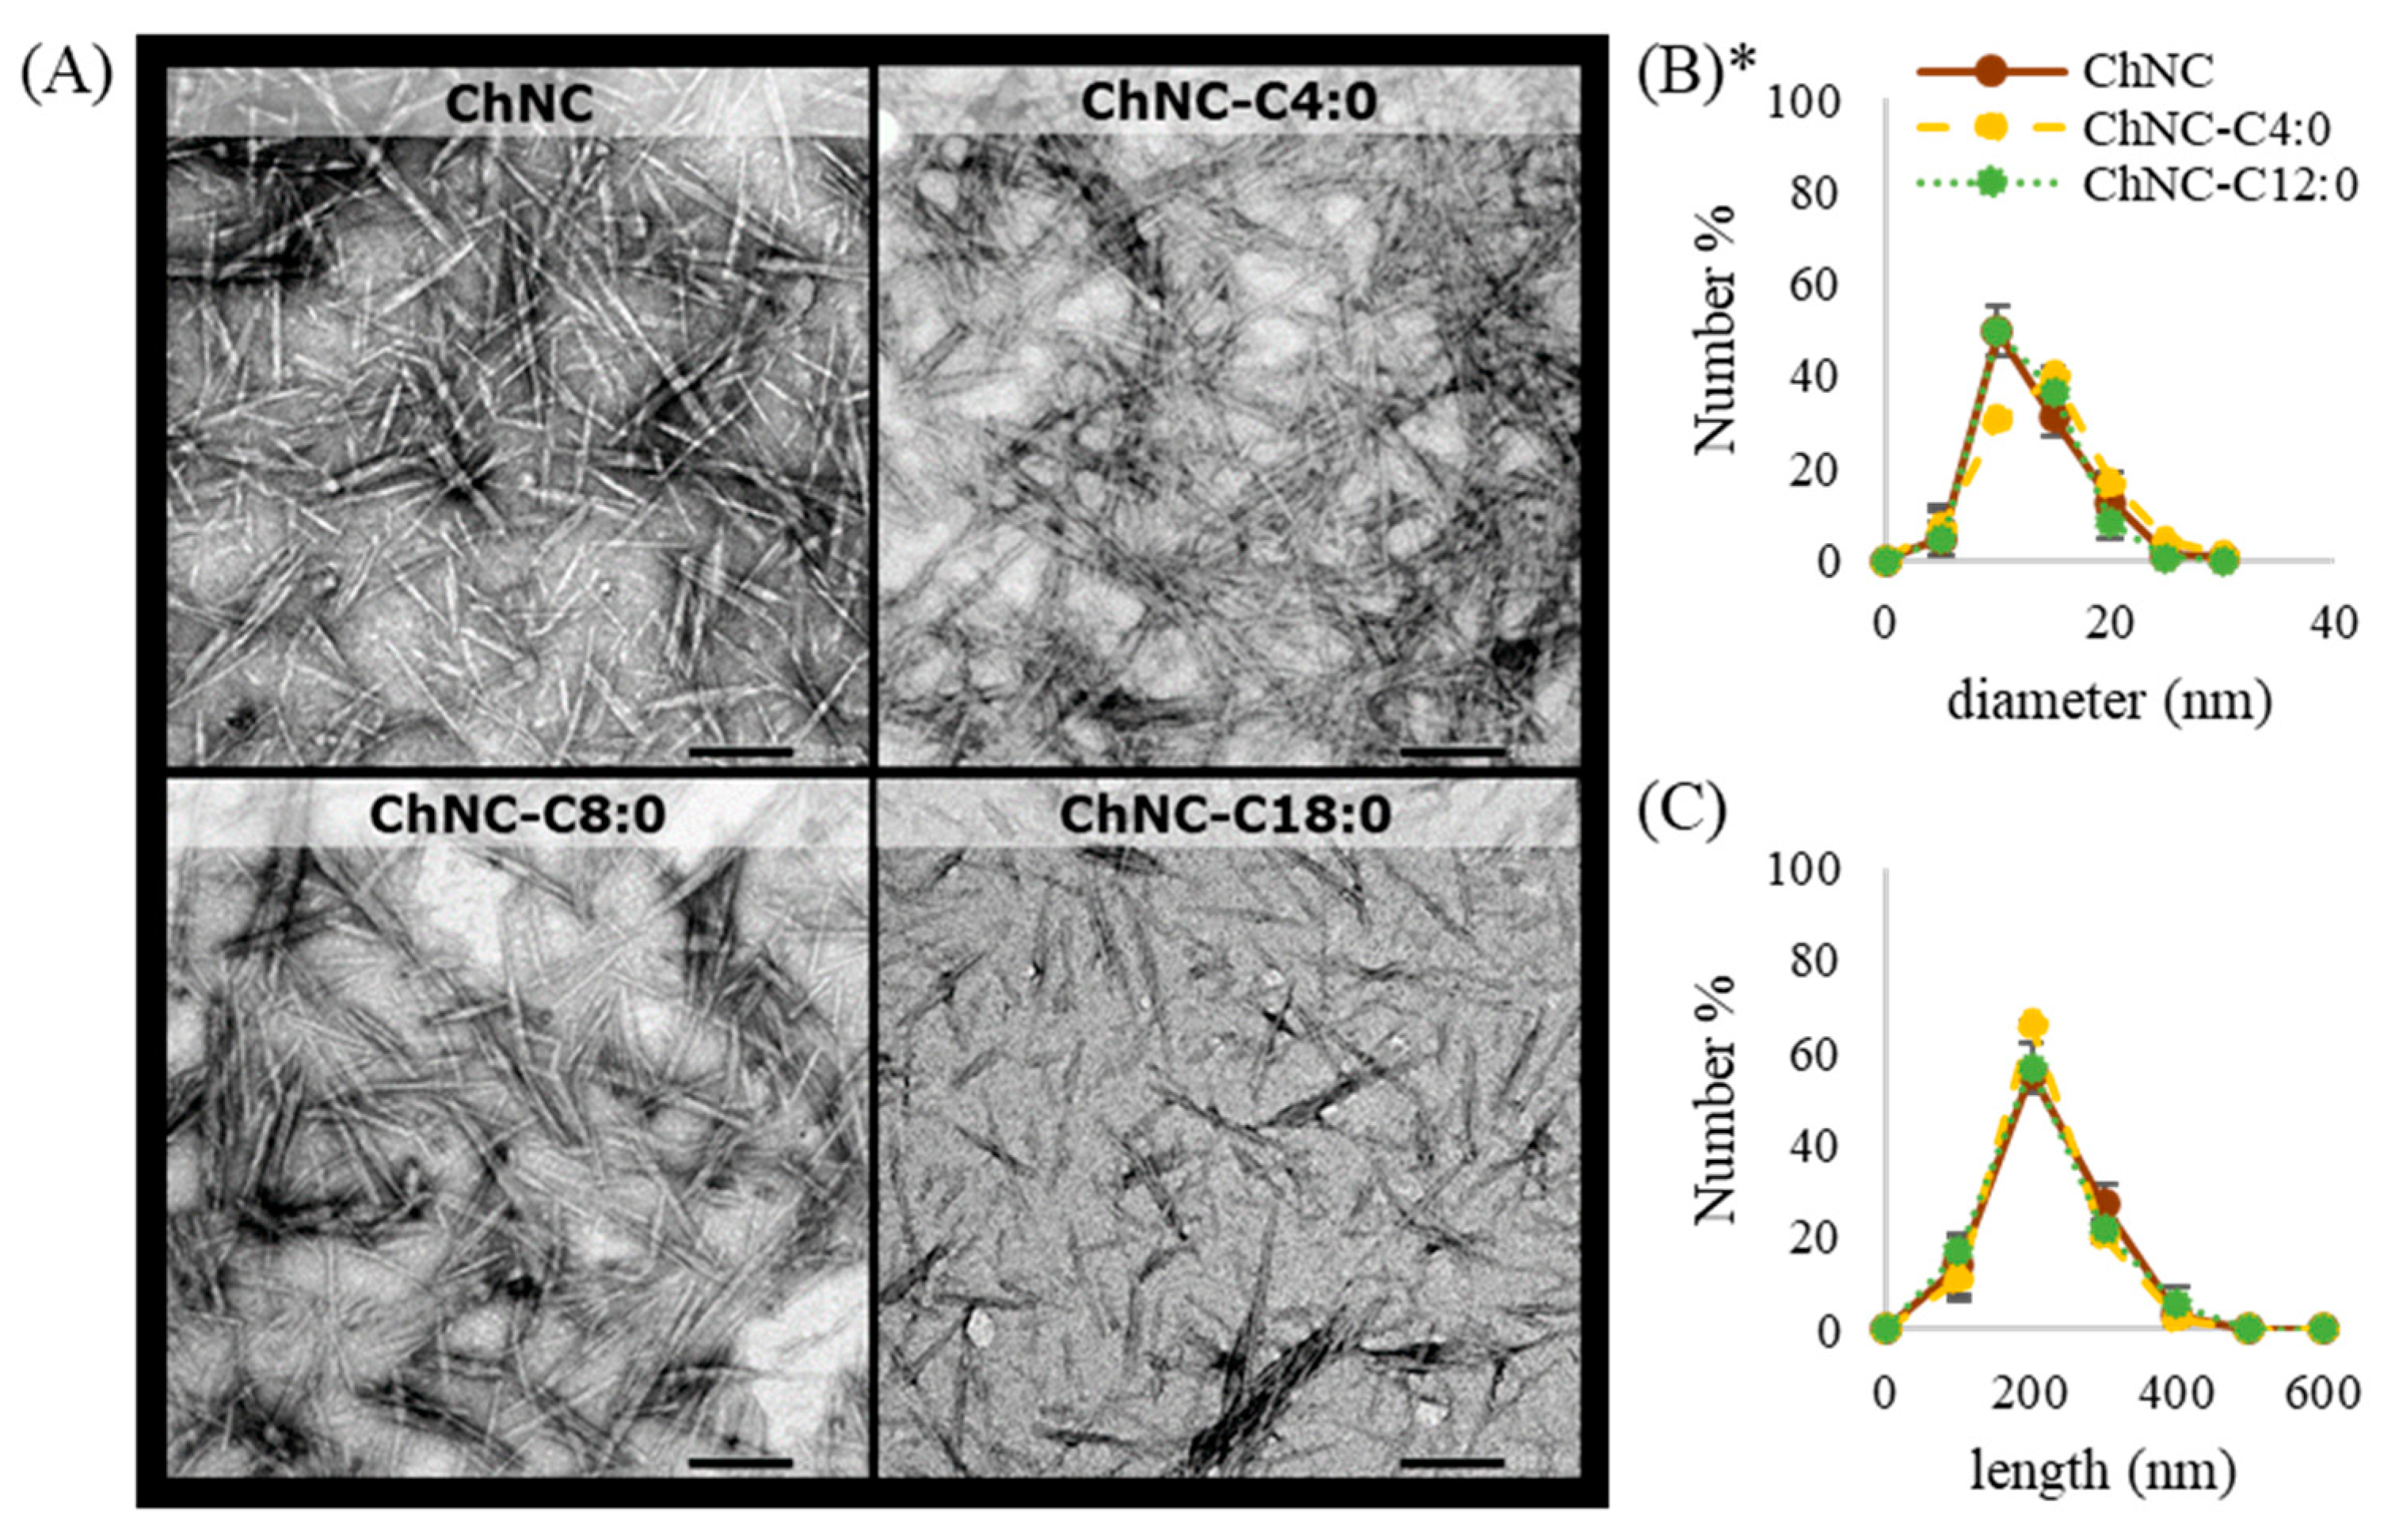
2.4.1. TEM
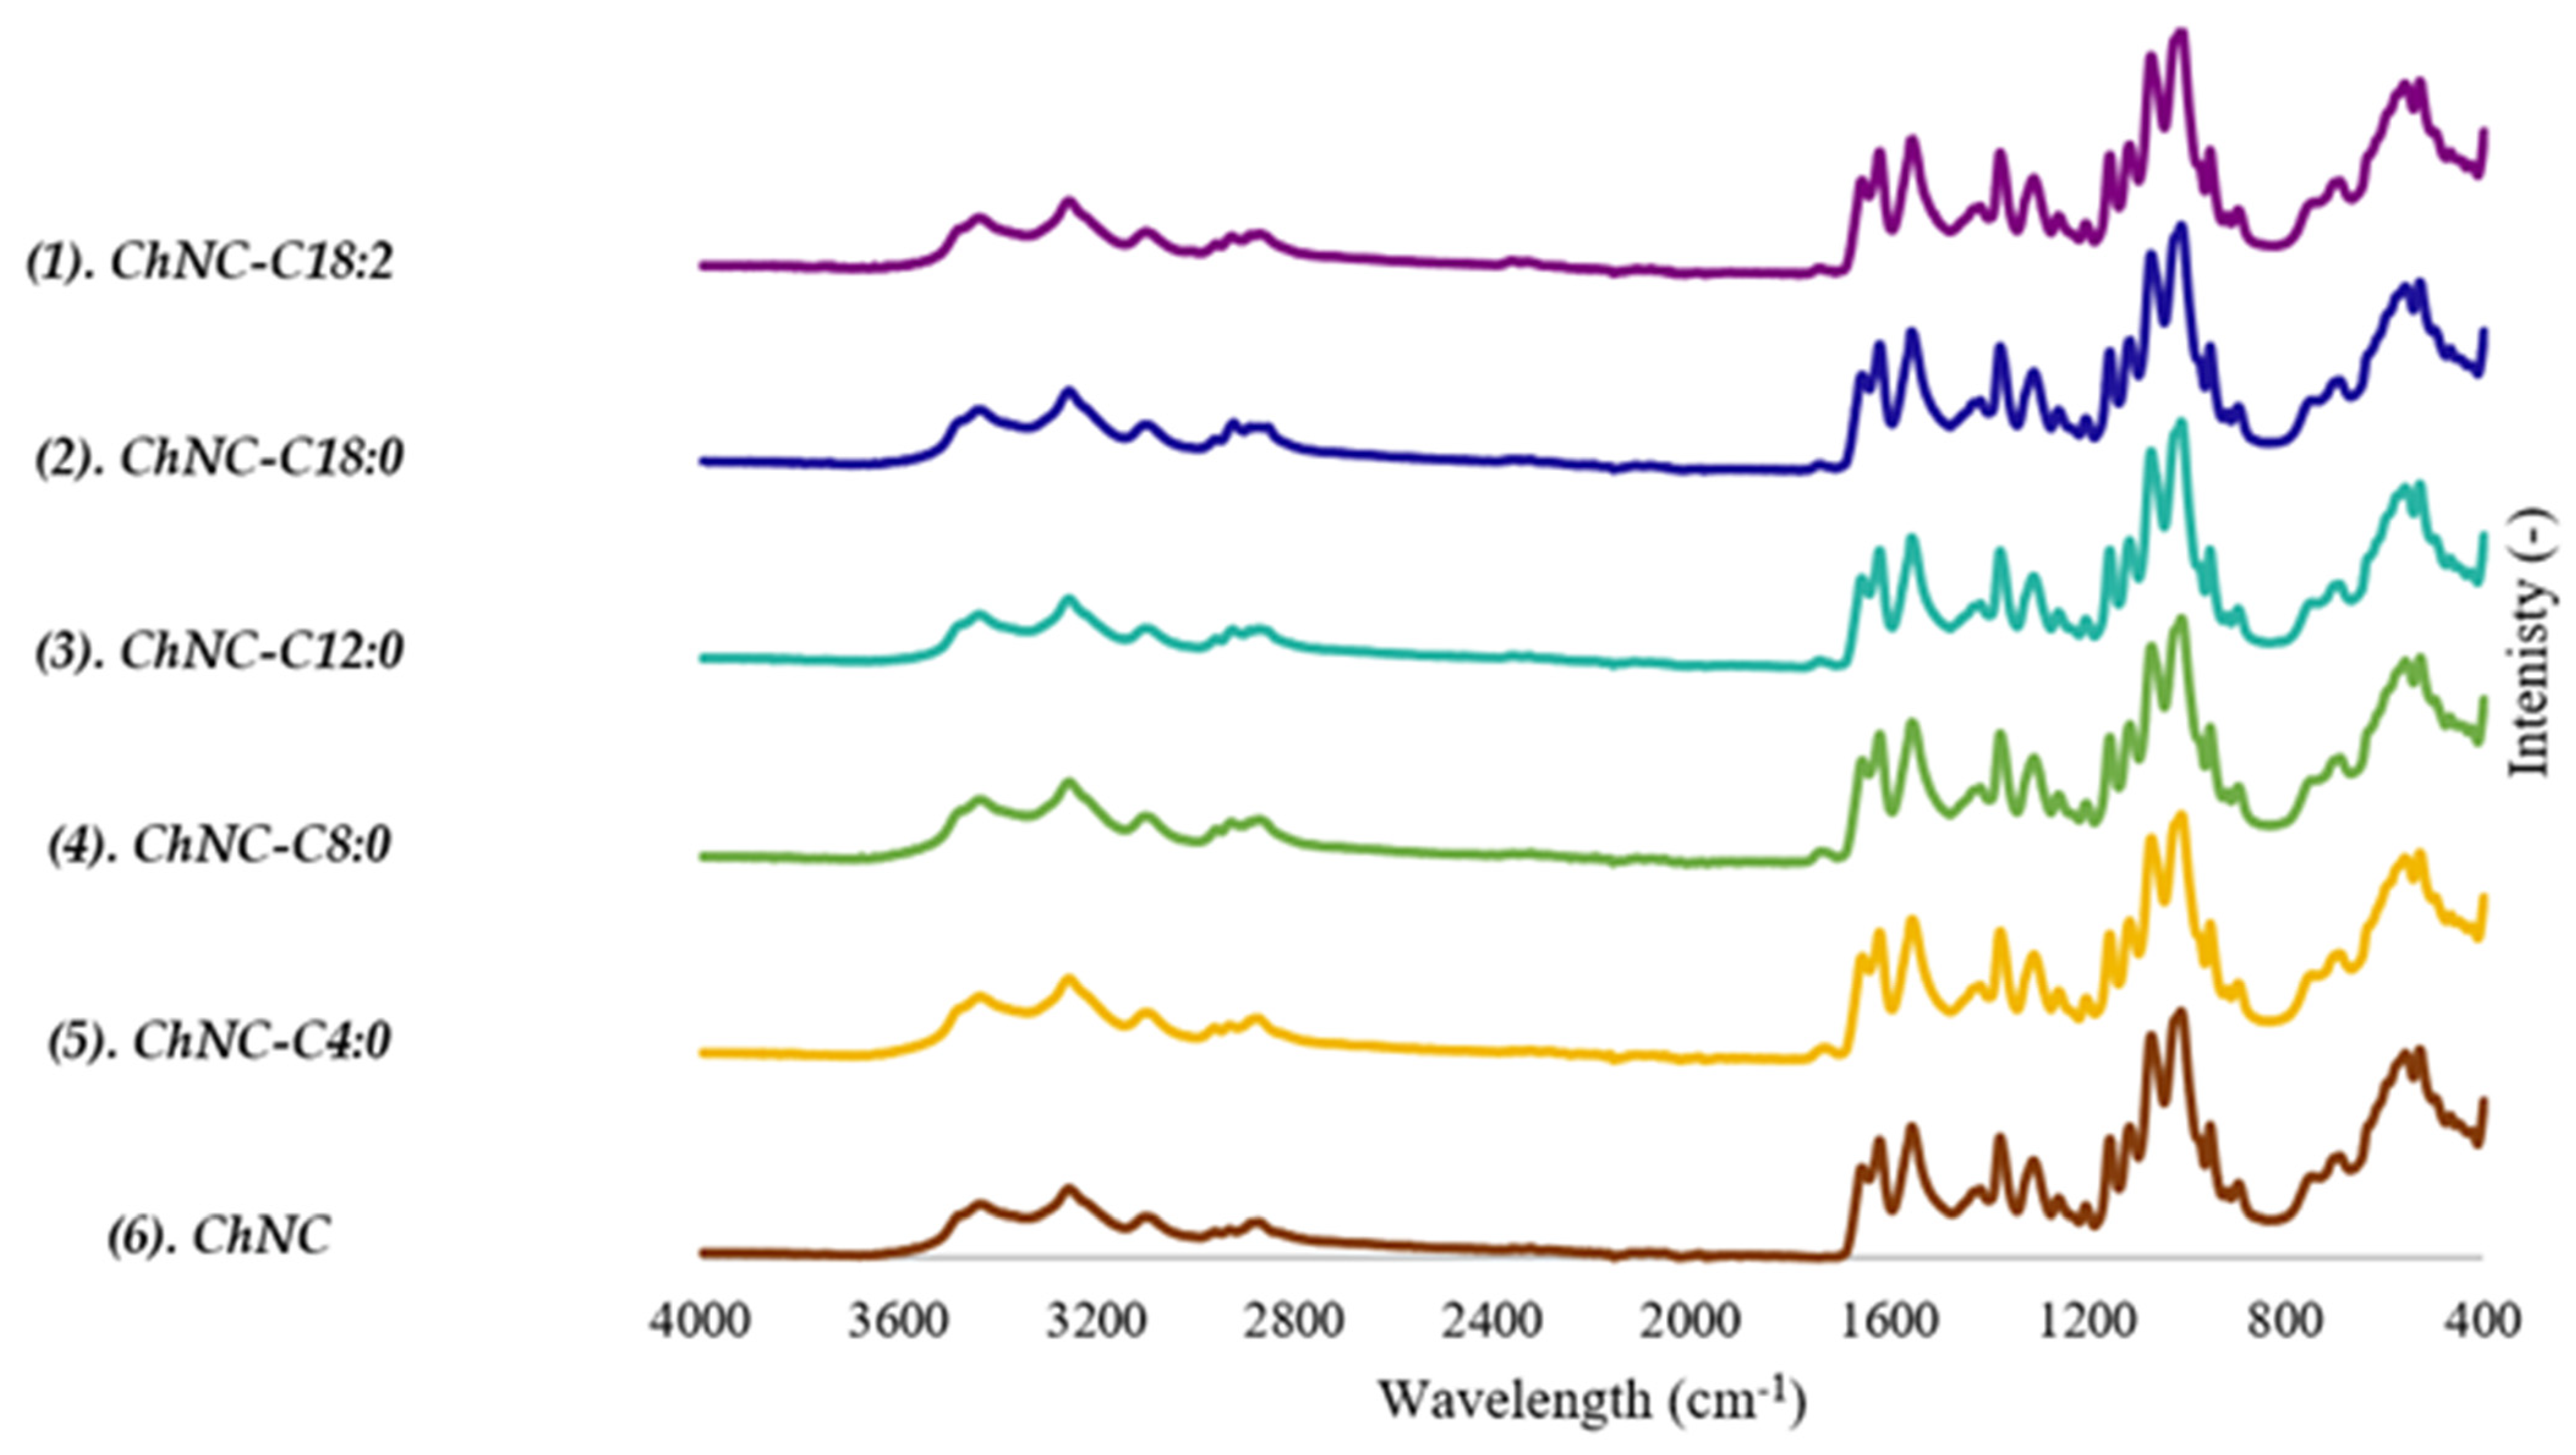
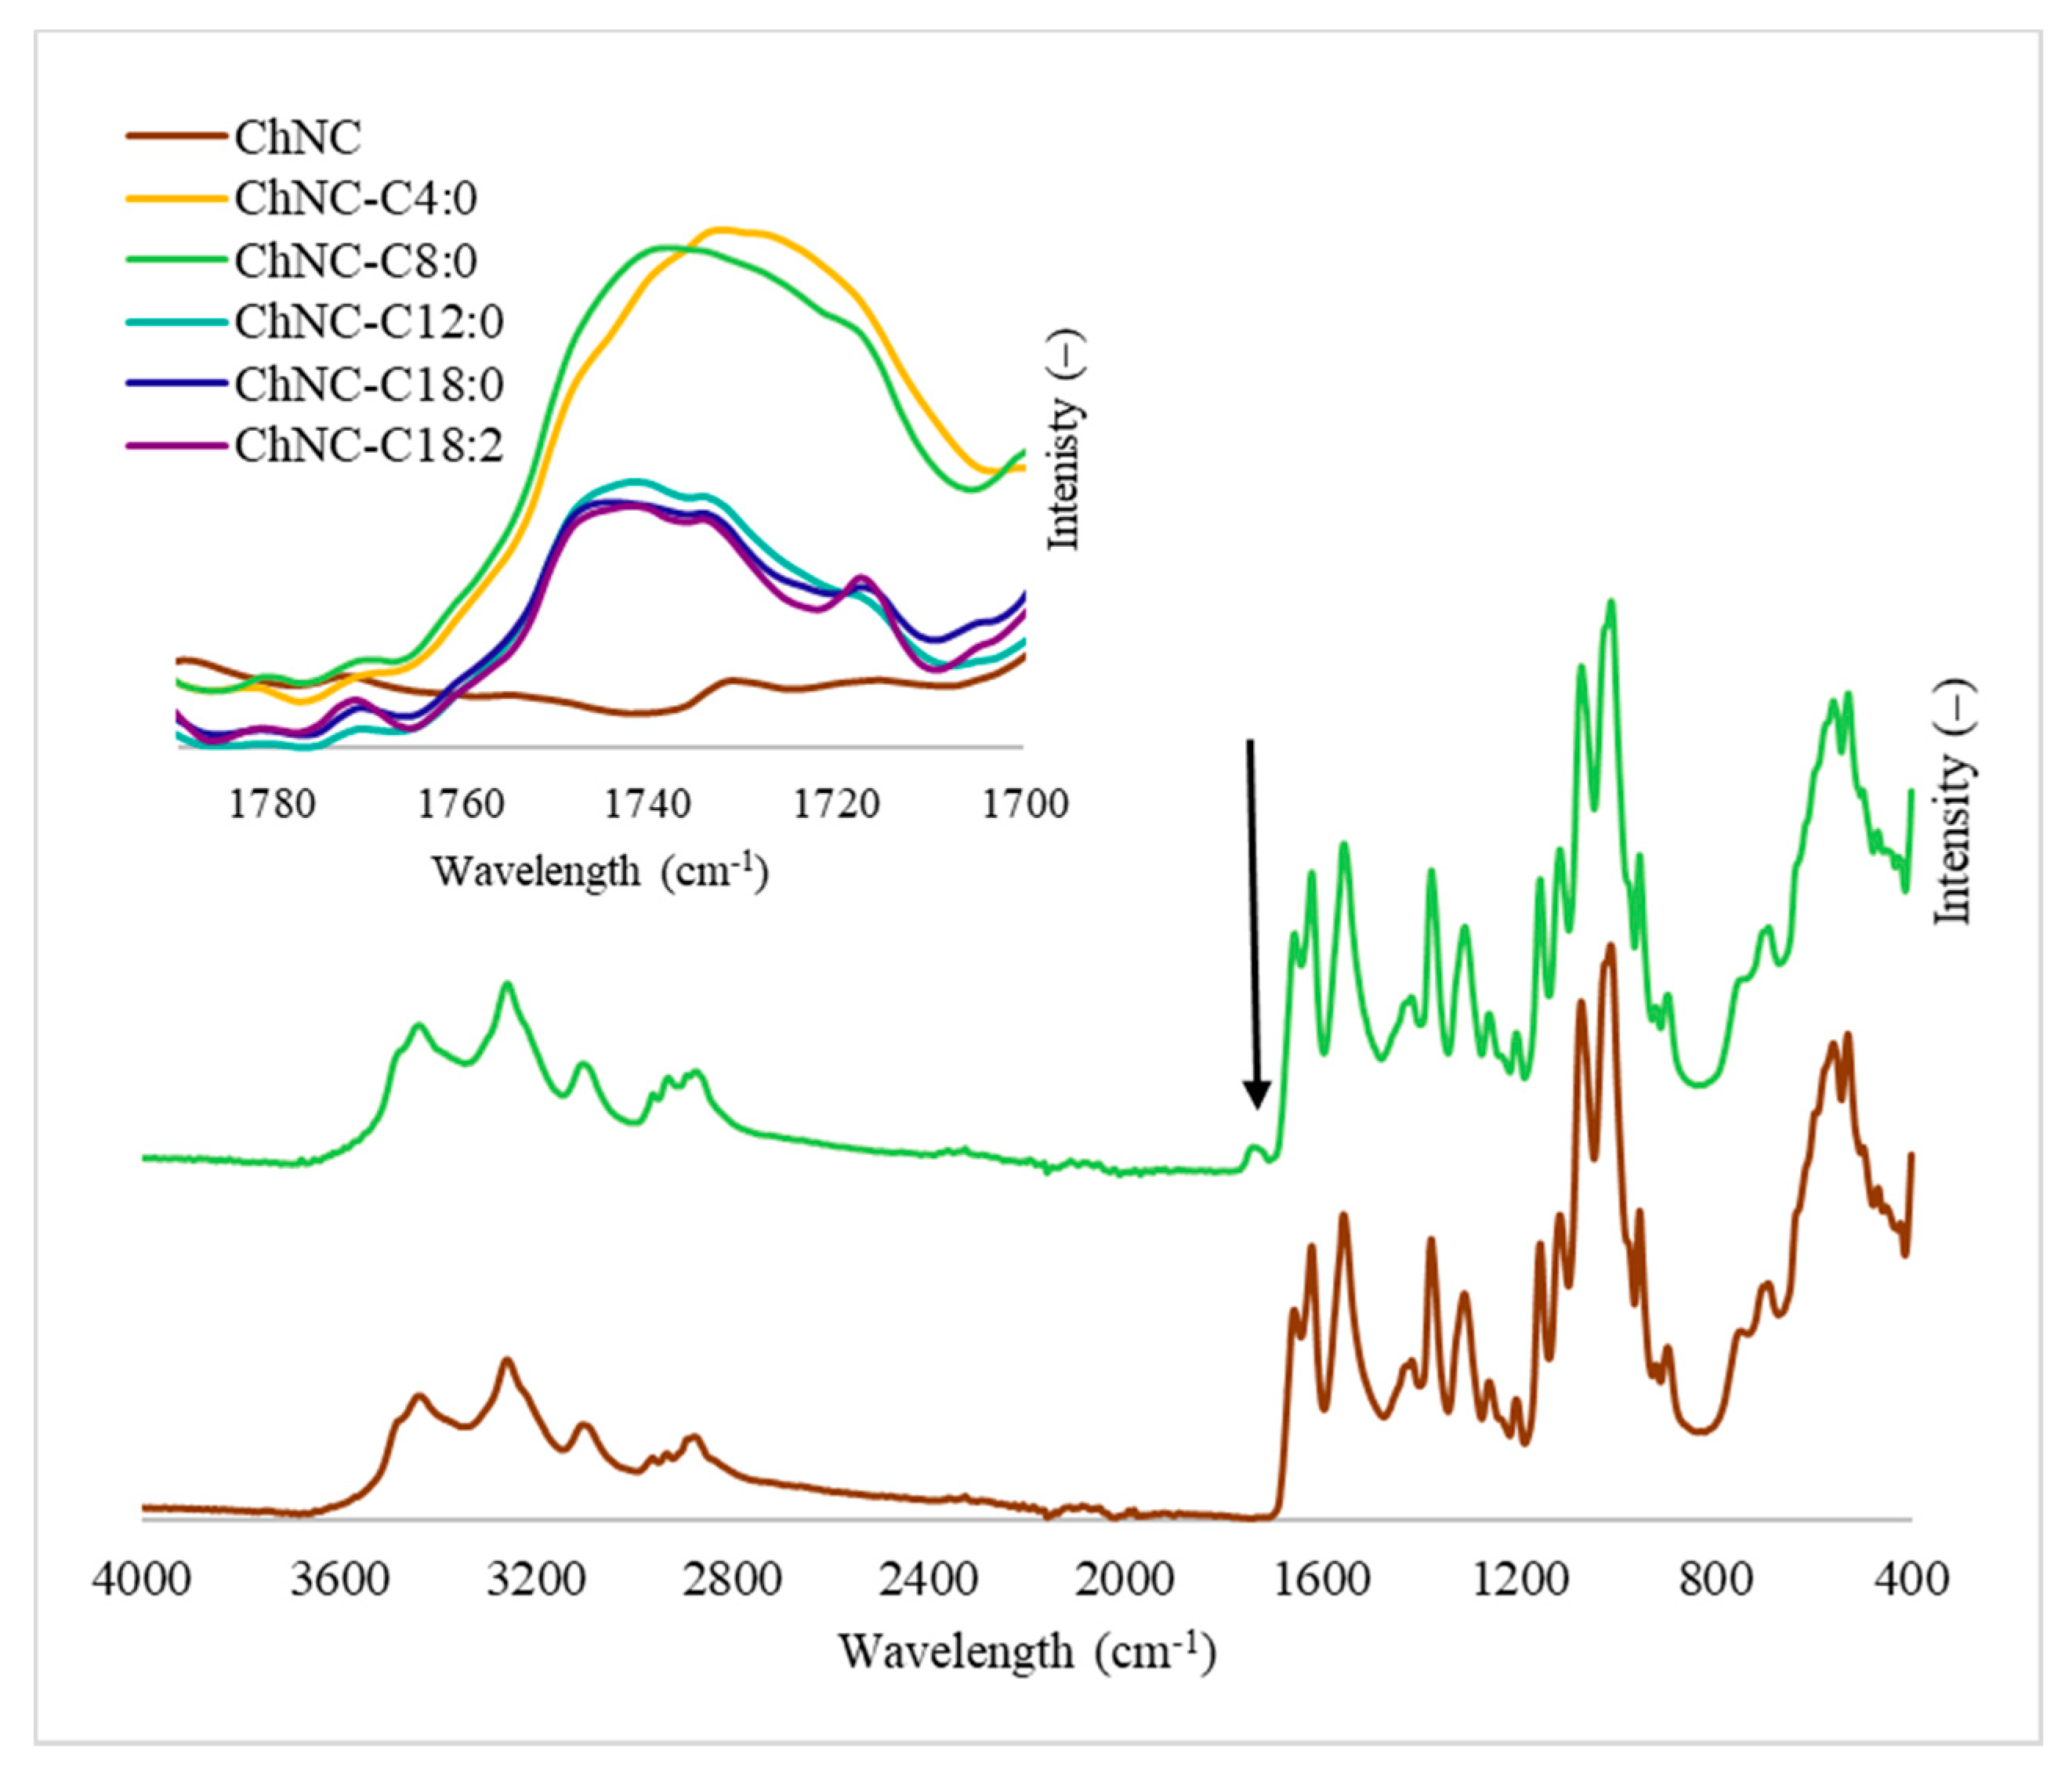
2.4.2. FTIR
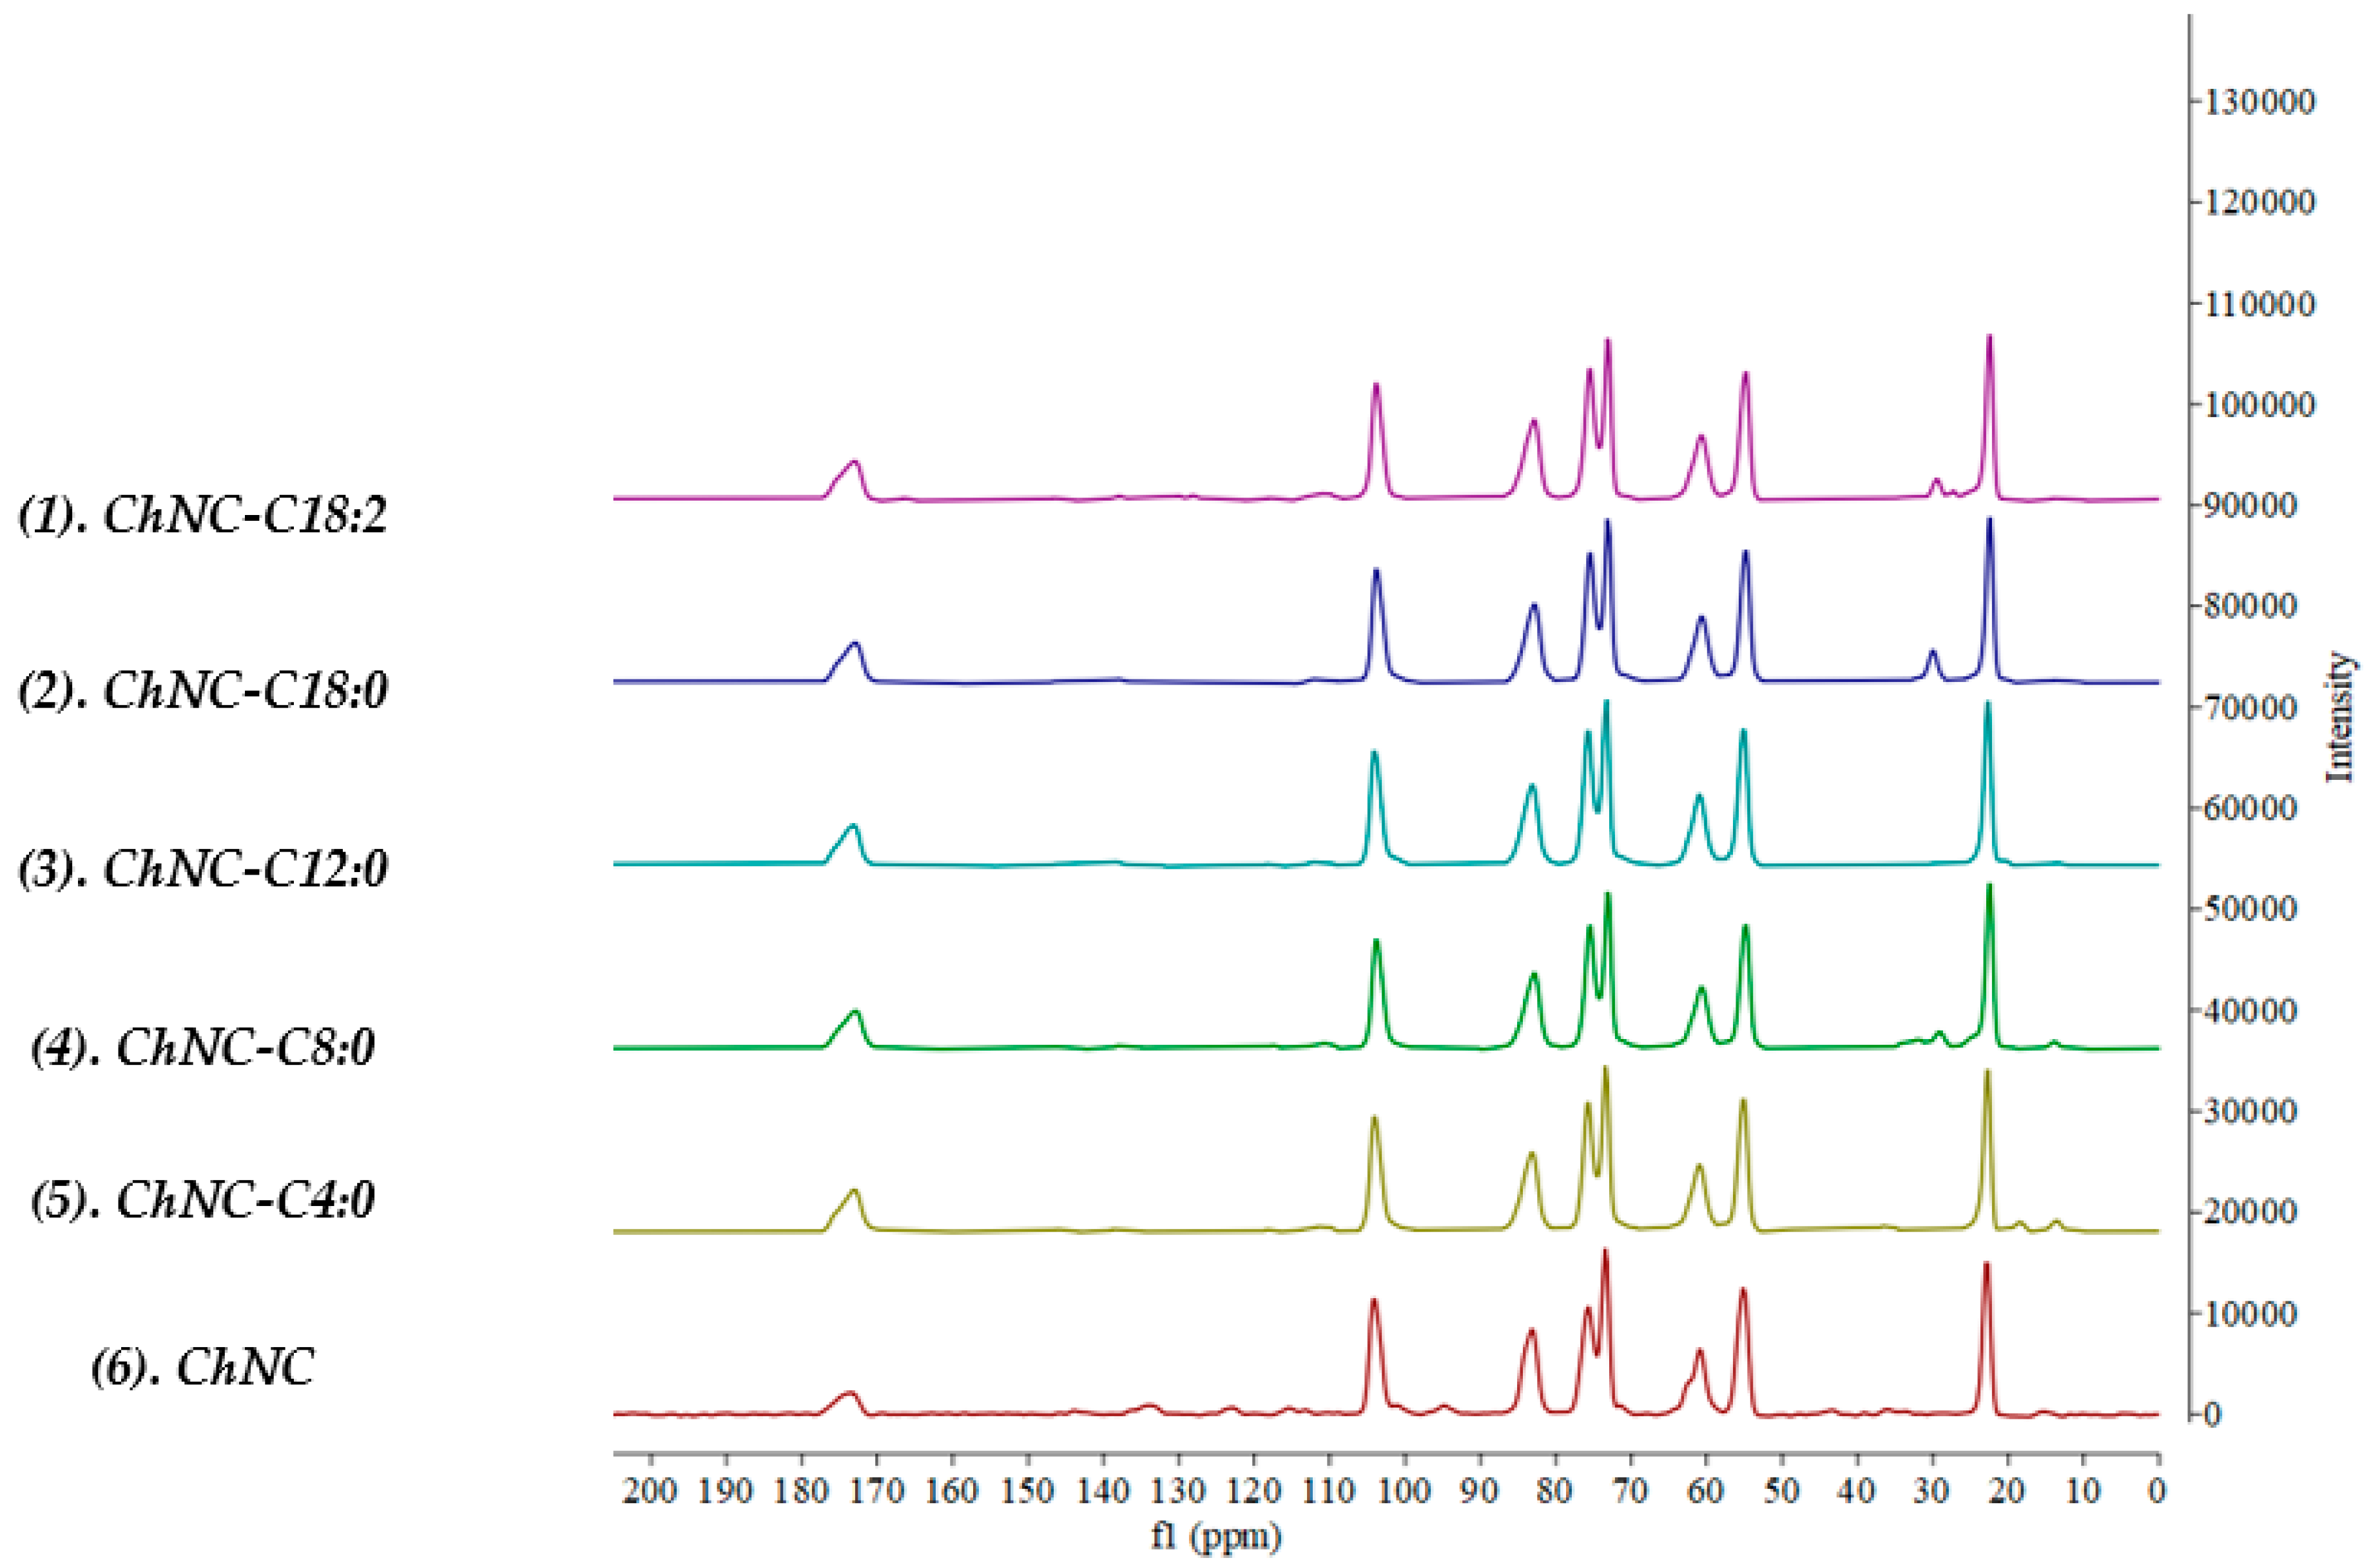
2.4.3. Solid-State 13C NMR
2.4.4. GC-FID
2.4.5. ζ-Potential
2.5. Nanocomposite Characterization
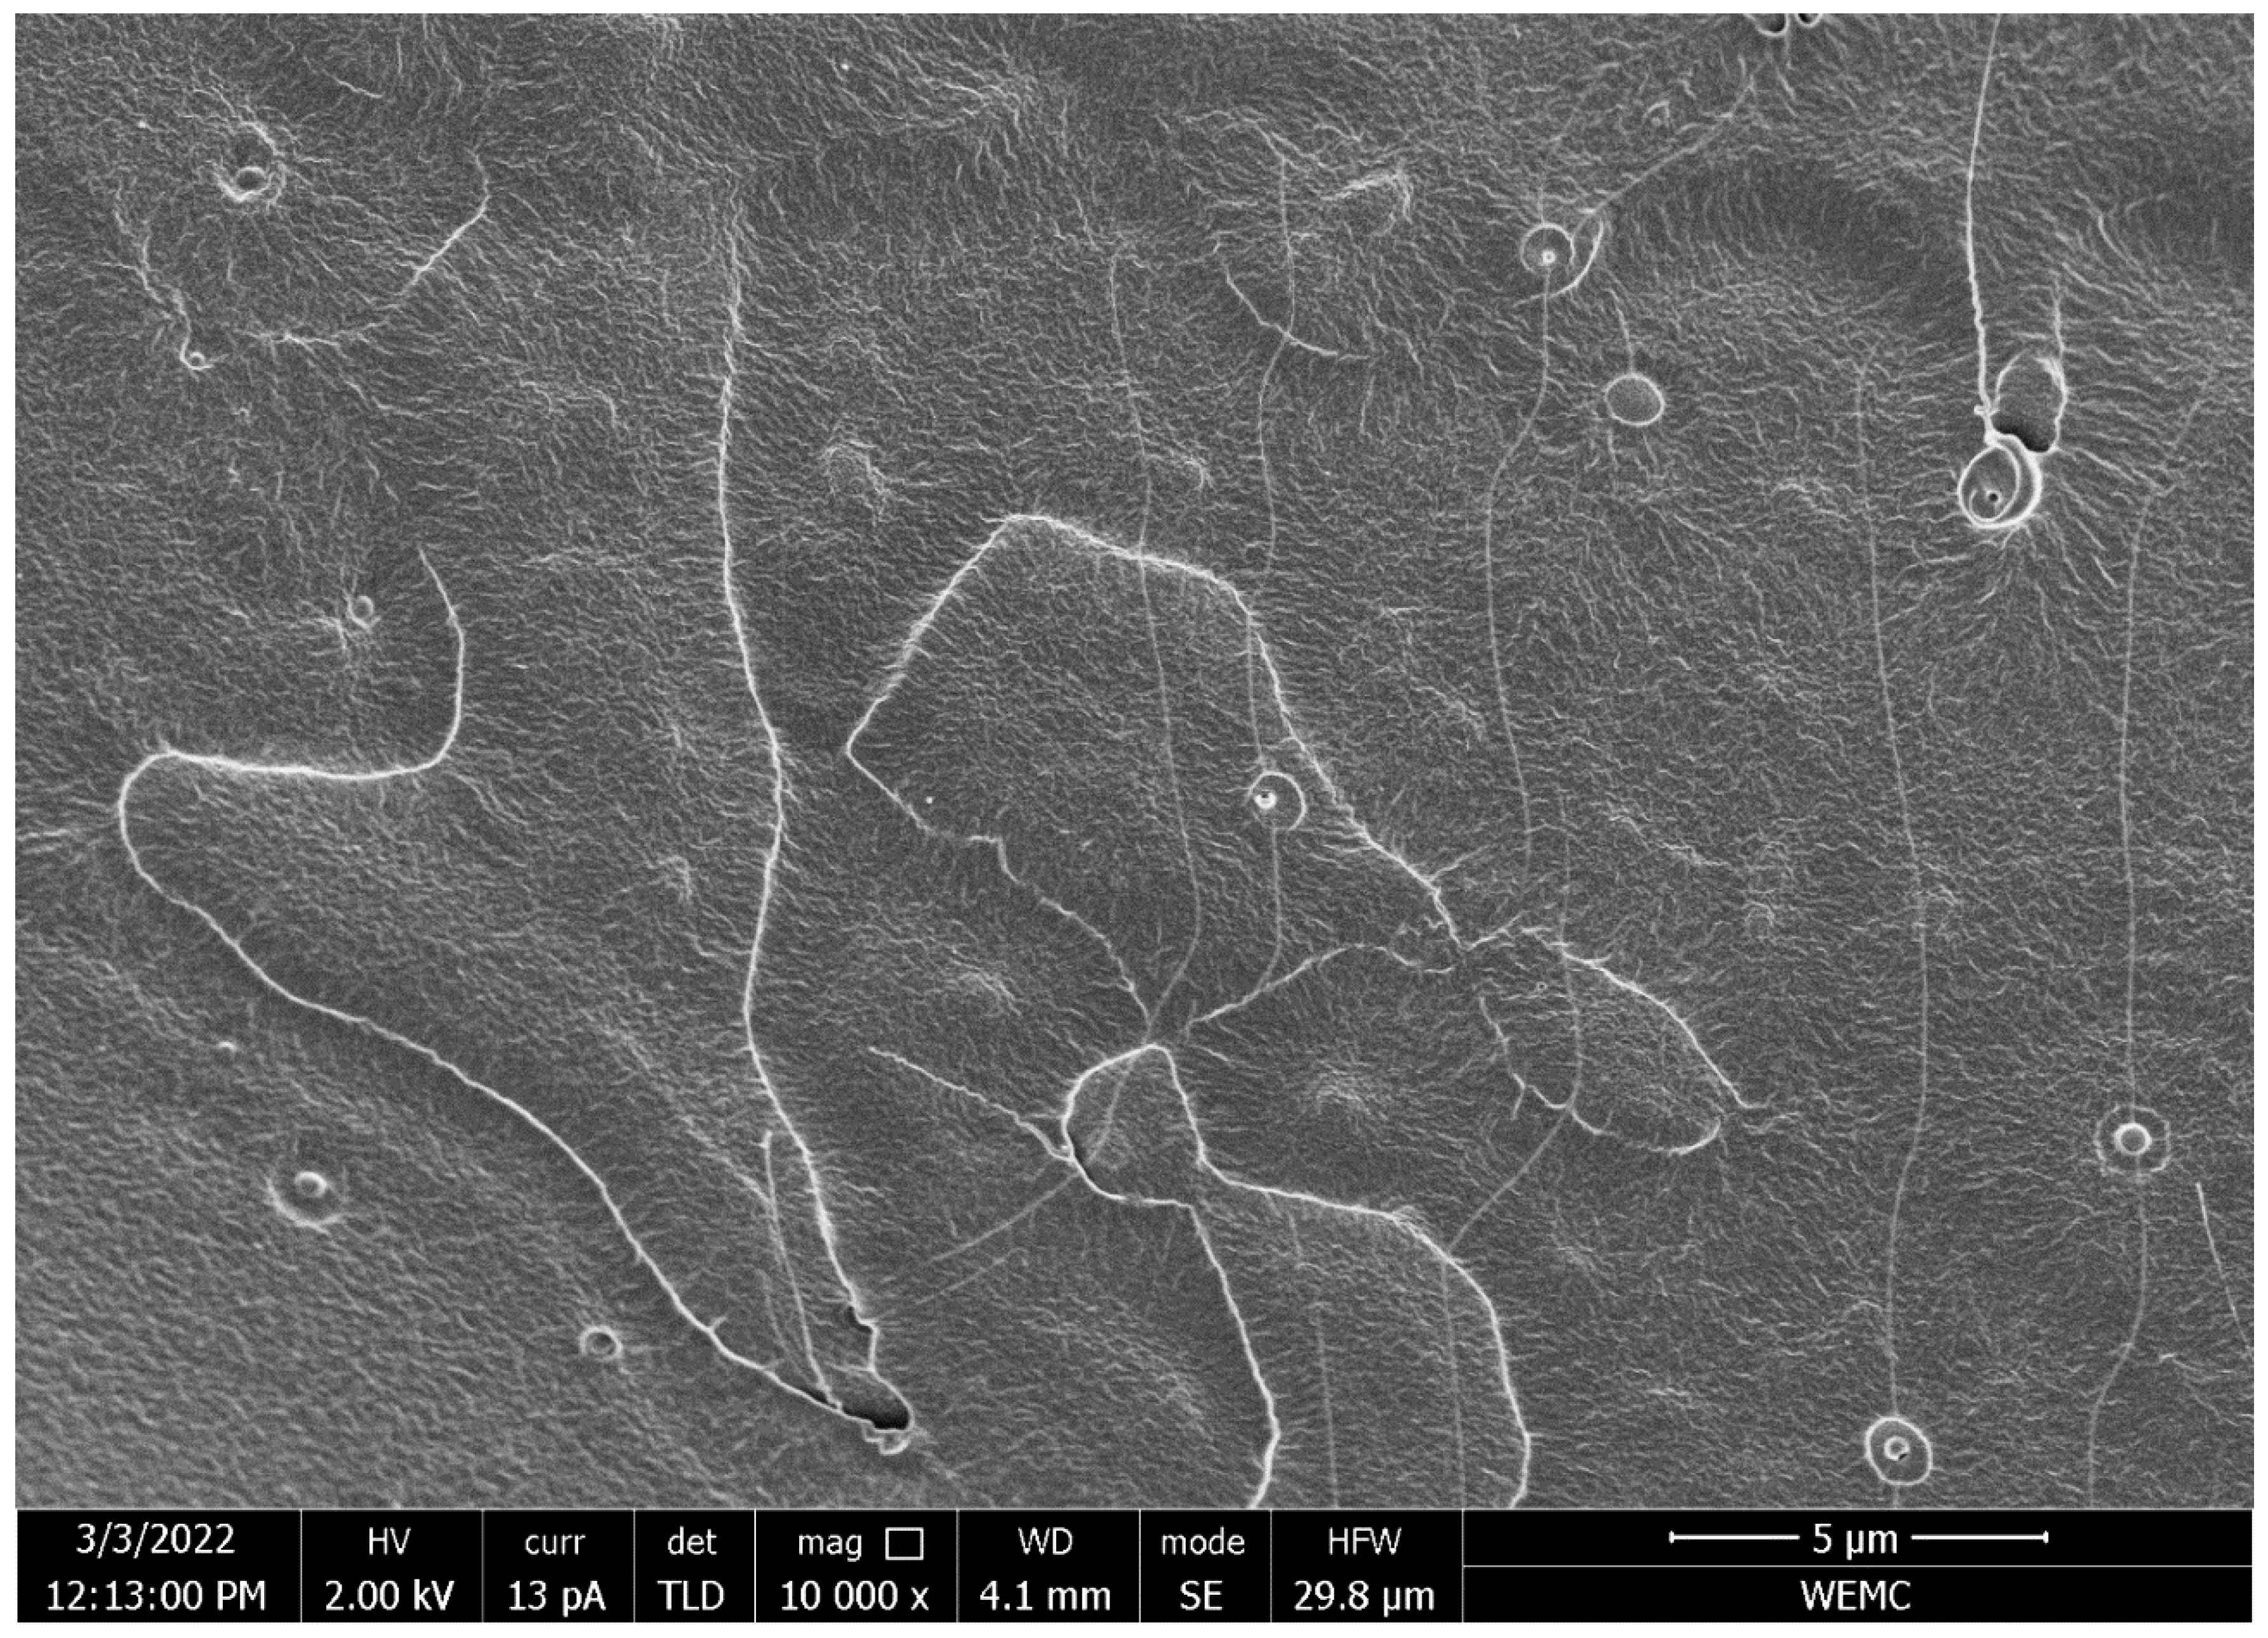
2.5.1. Scanning Electron Microscopy
2.5.2. Color analysis
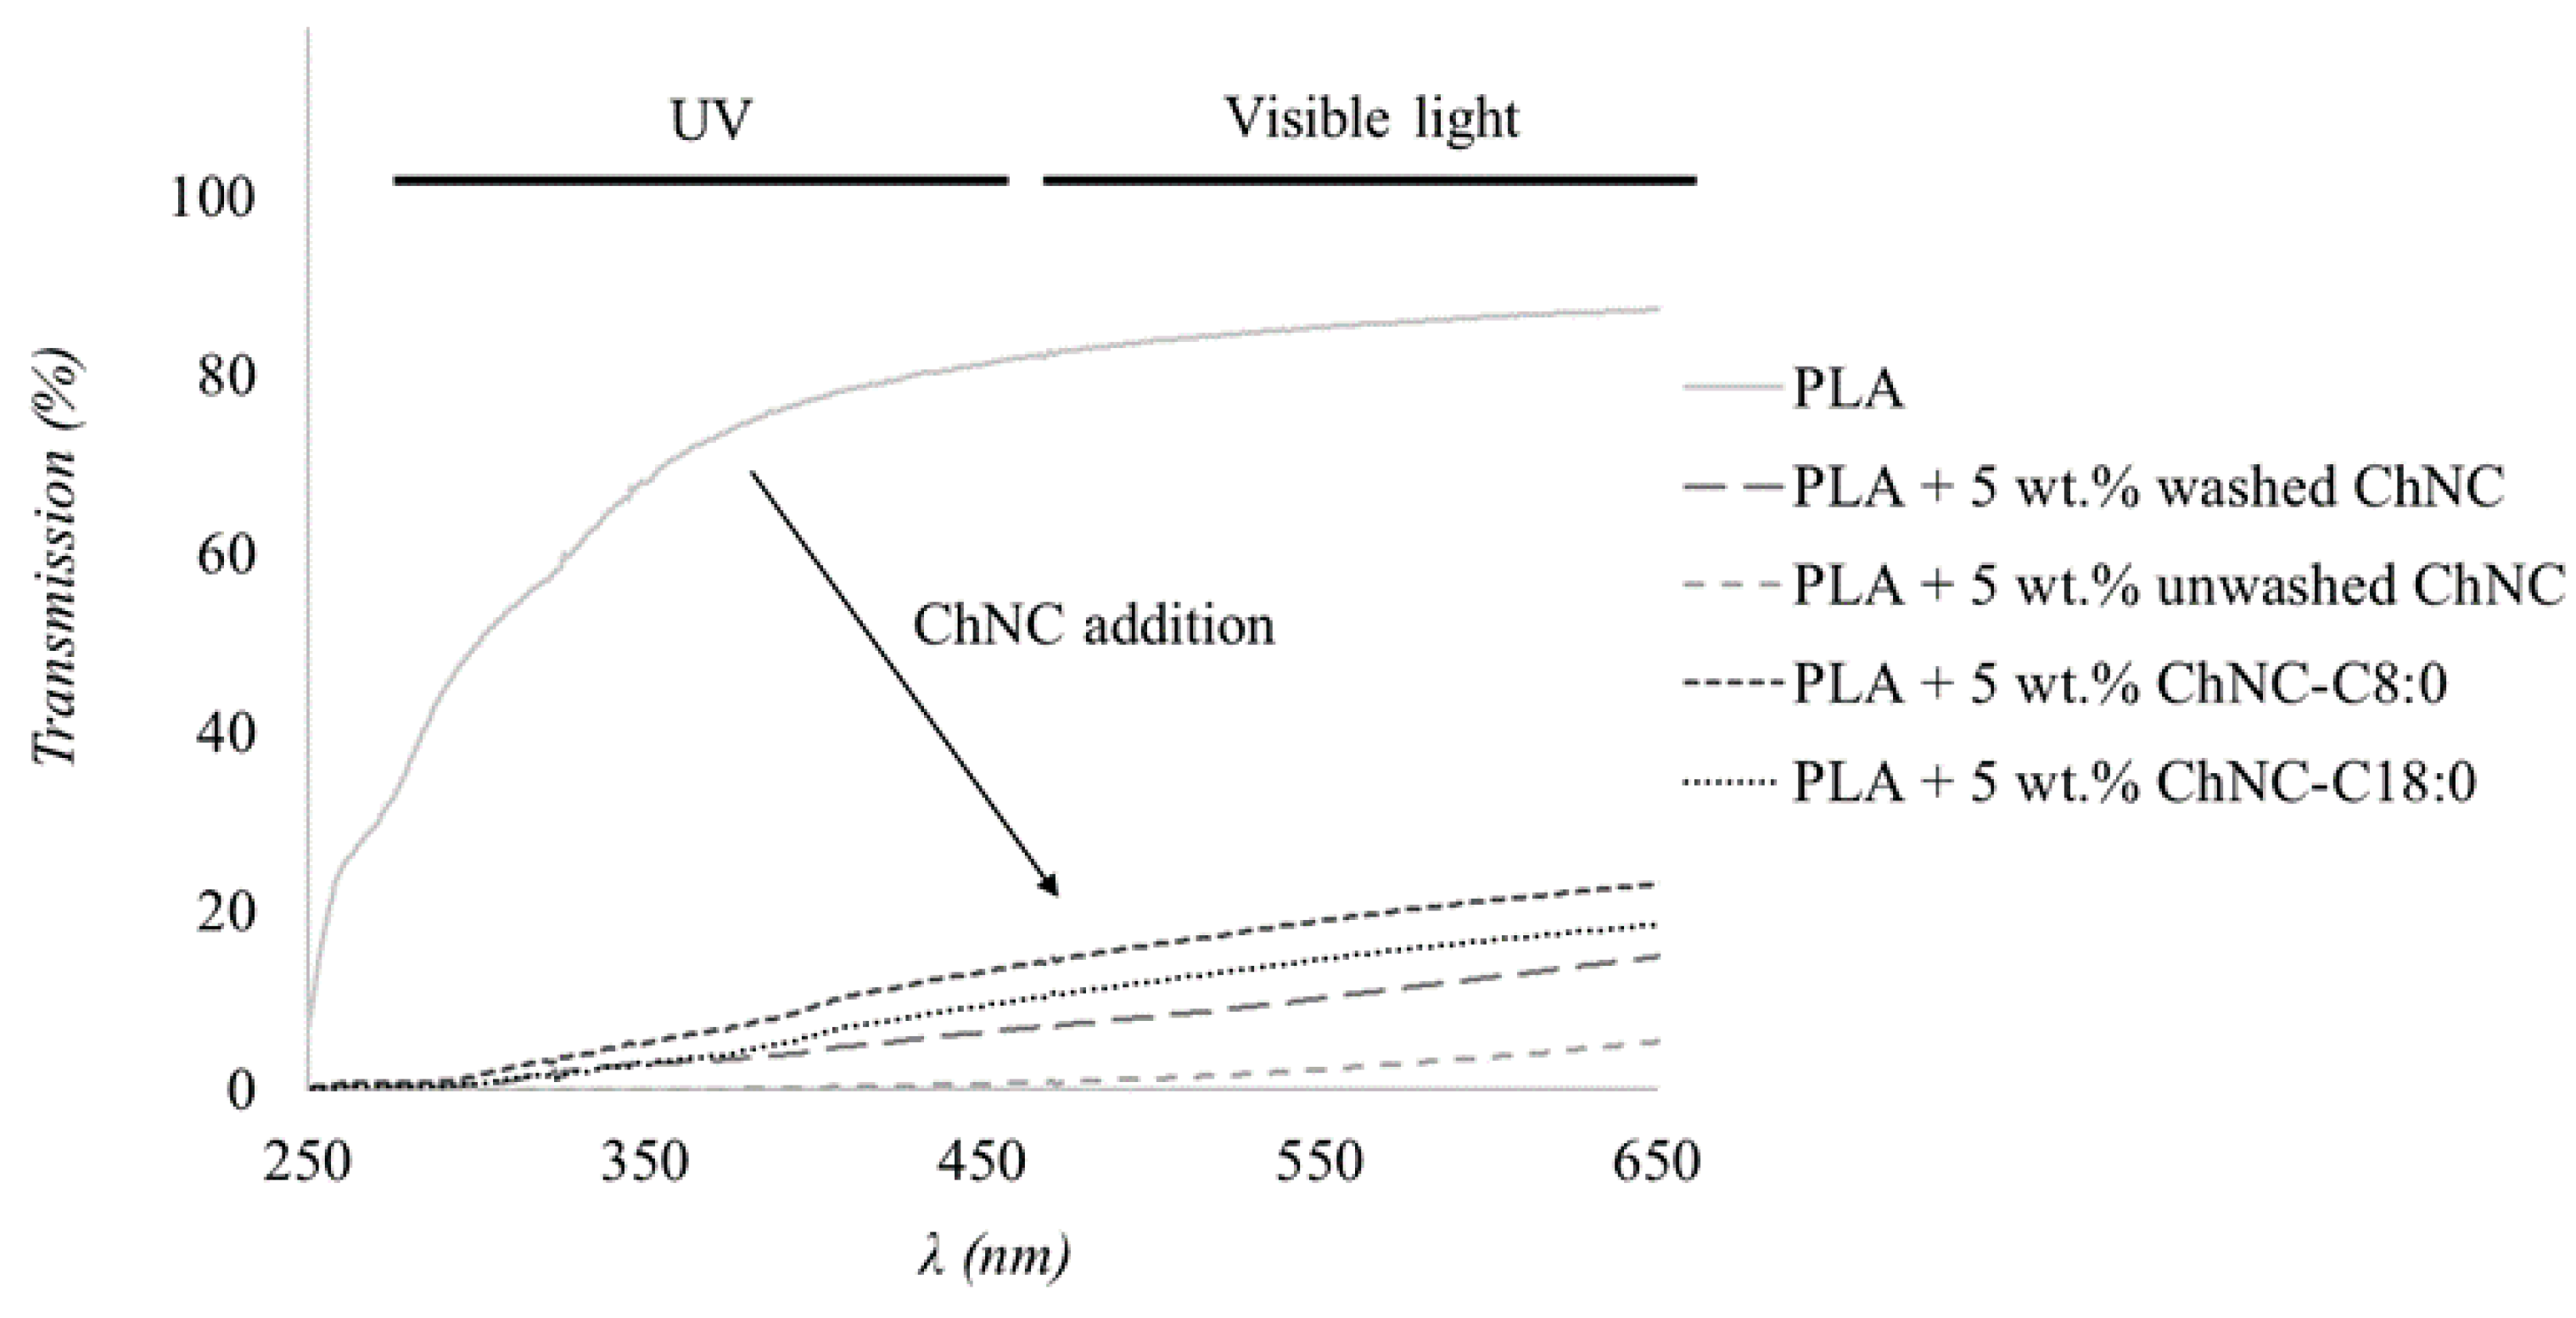
2.5.3. Spectroscopy
2.5.4. Barrier Properties
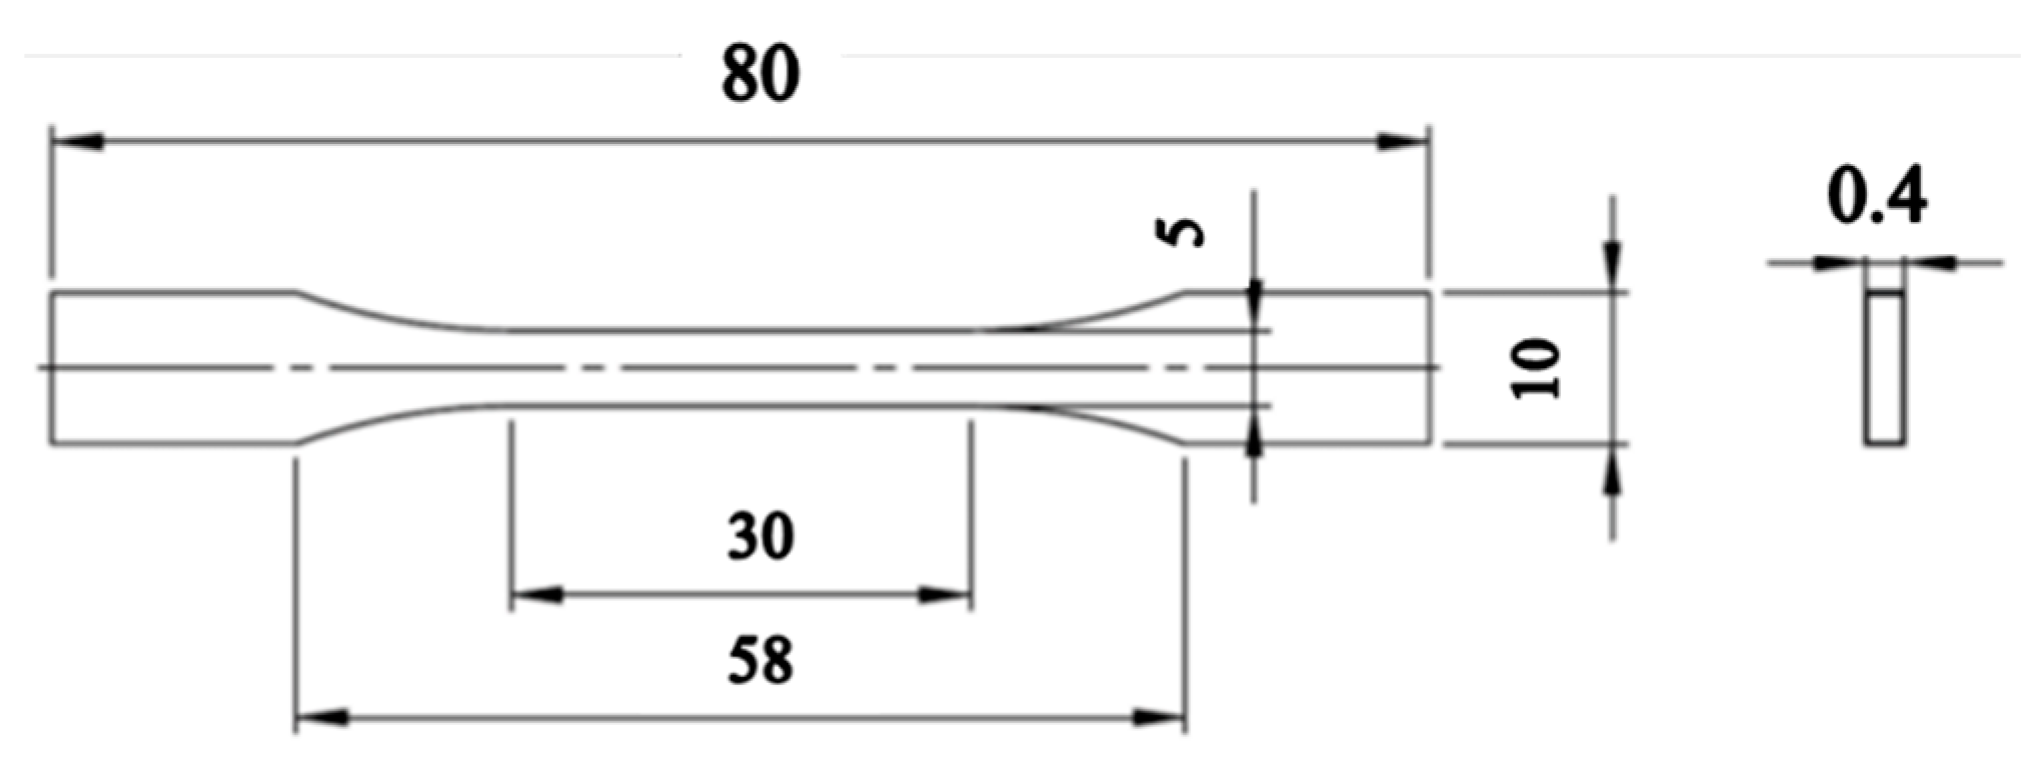
2.5.5. Mechanical Properties
3. Results and Discussion
3.1. Nanoparticle Characterization
3.1.1. Morphology and Size of (Modified) ChNC
3.1.2. Degree of Substitution, Degree of Acetylation, and ζ-Potential
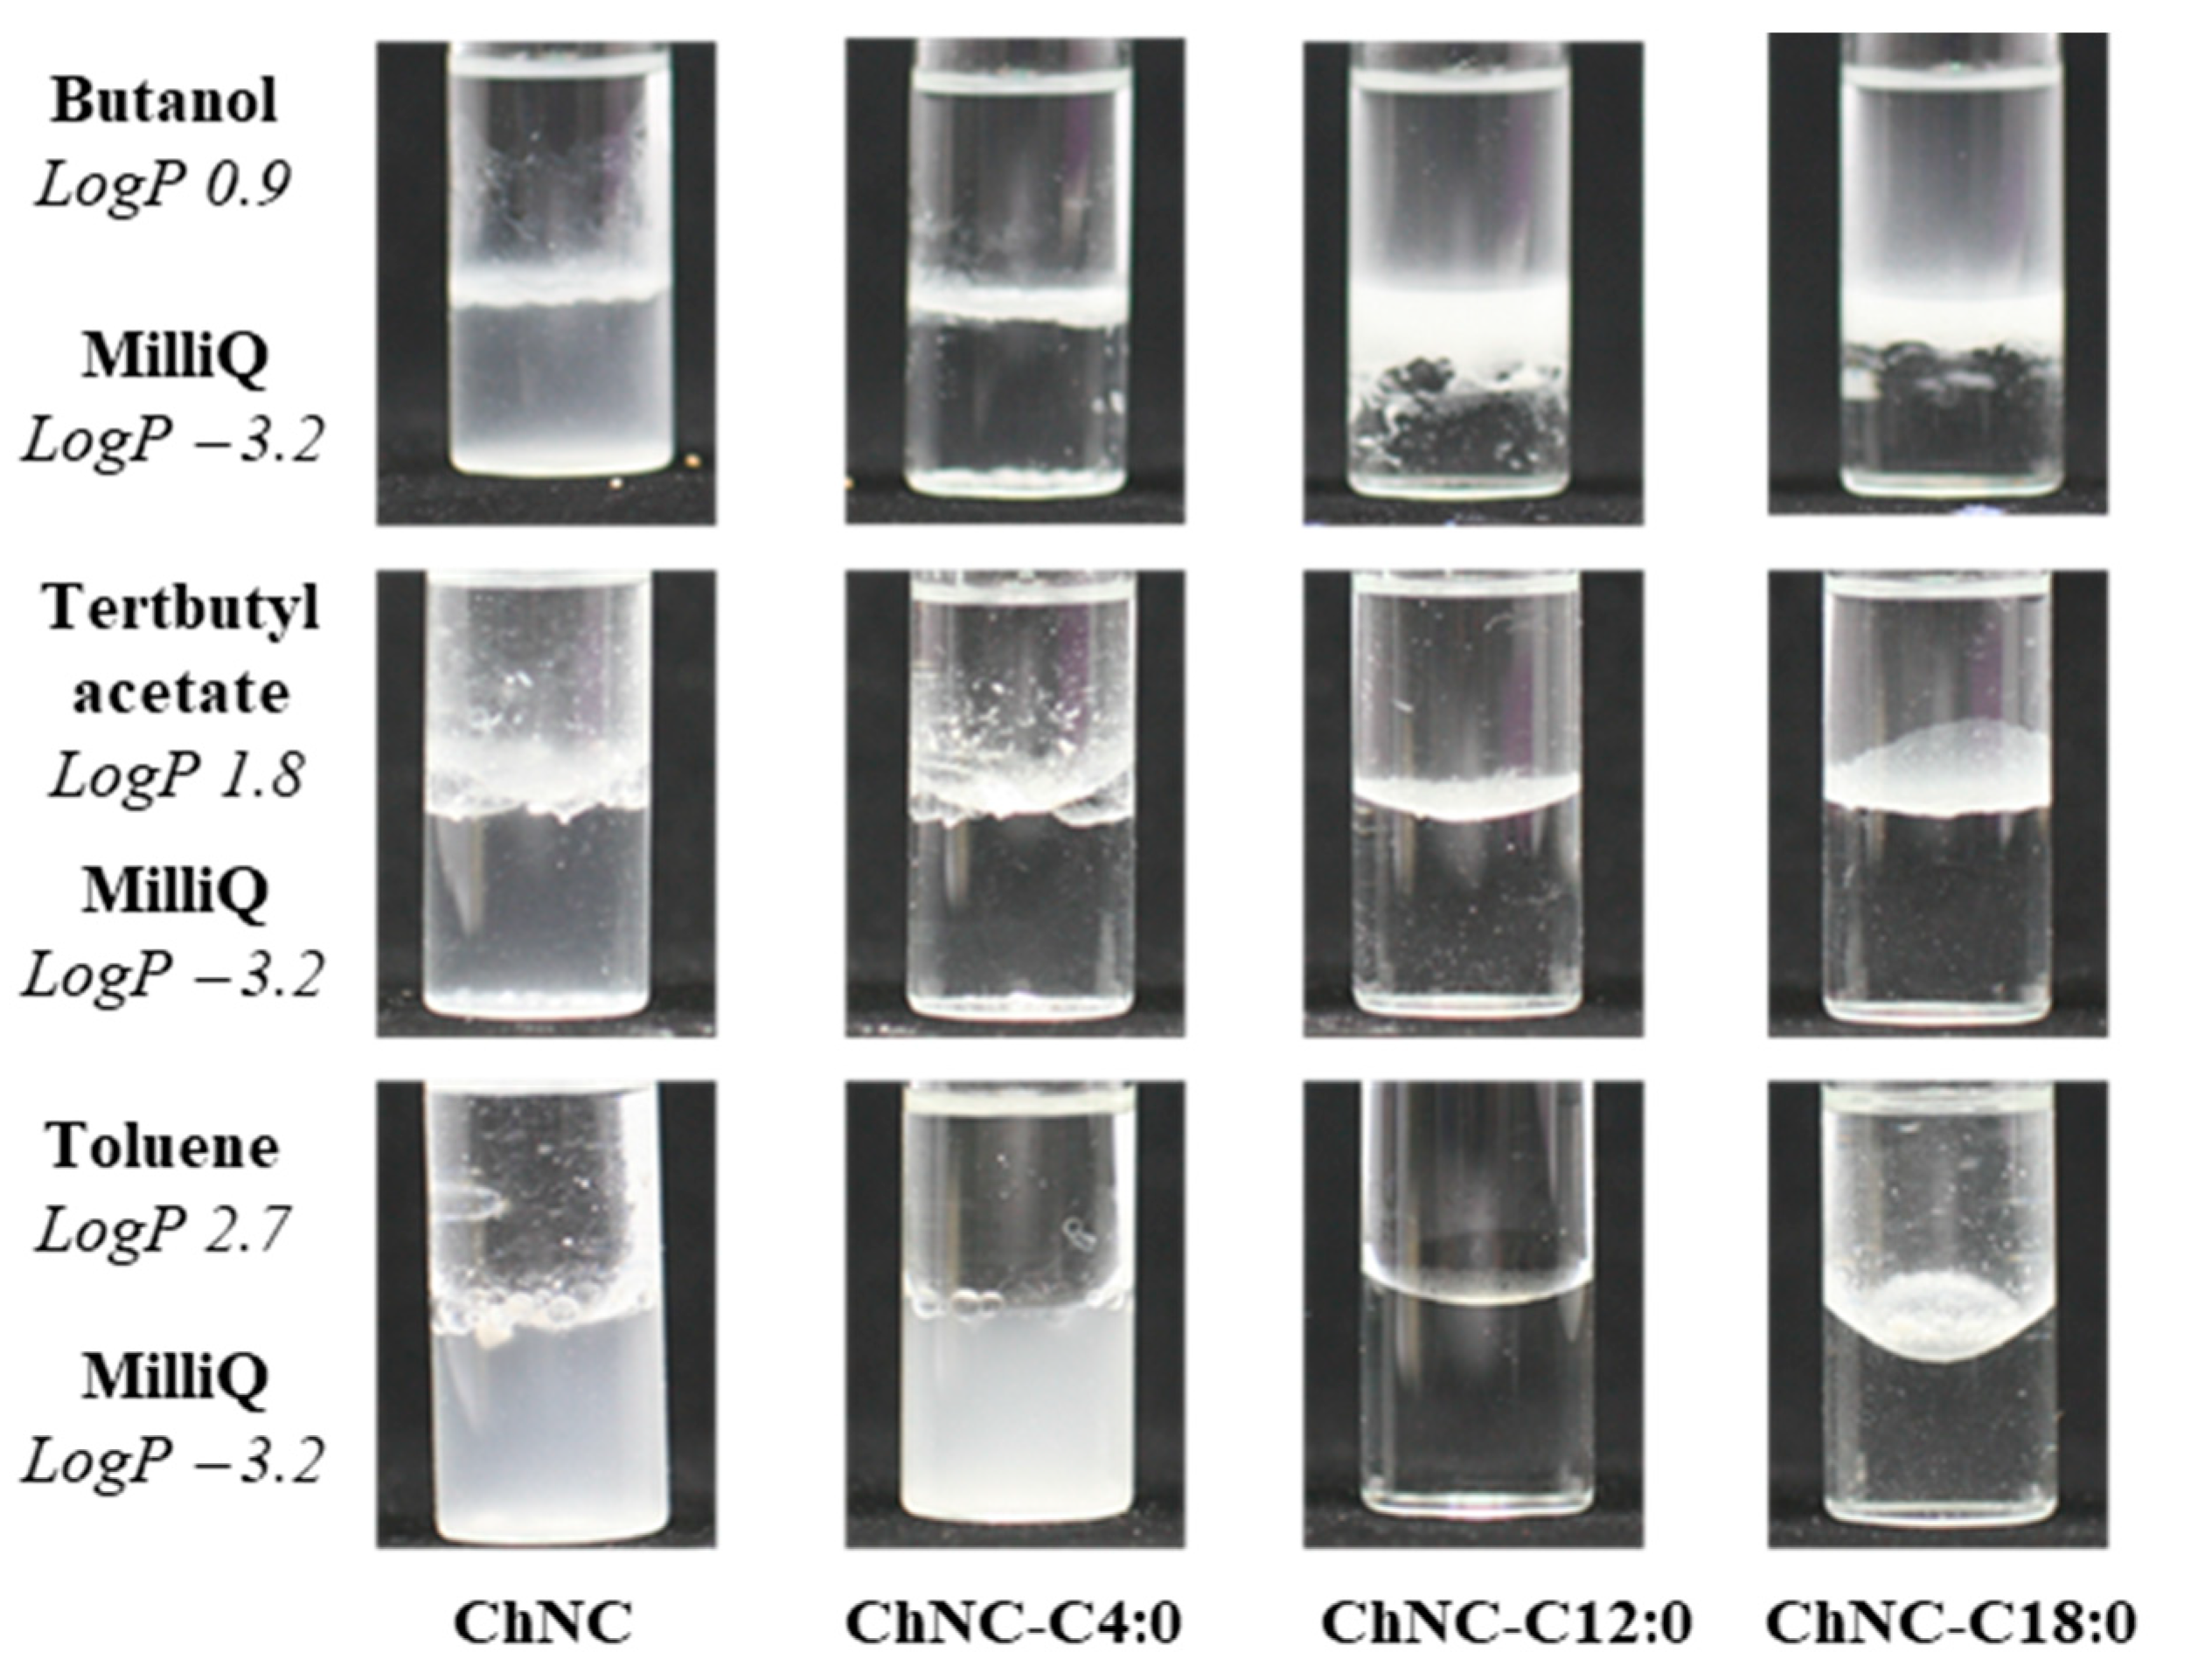
3.1.3. Wettability Test
3.2. Nanocomposite Characterization
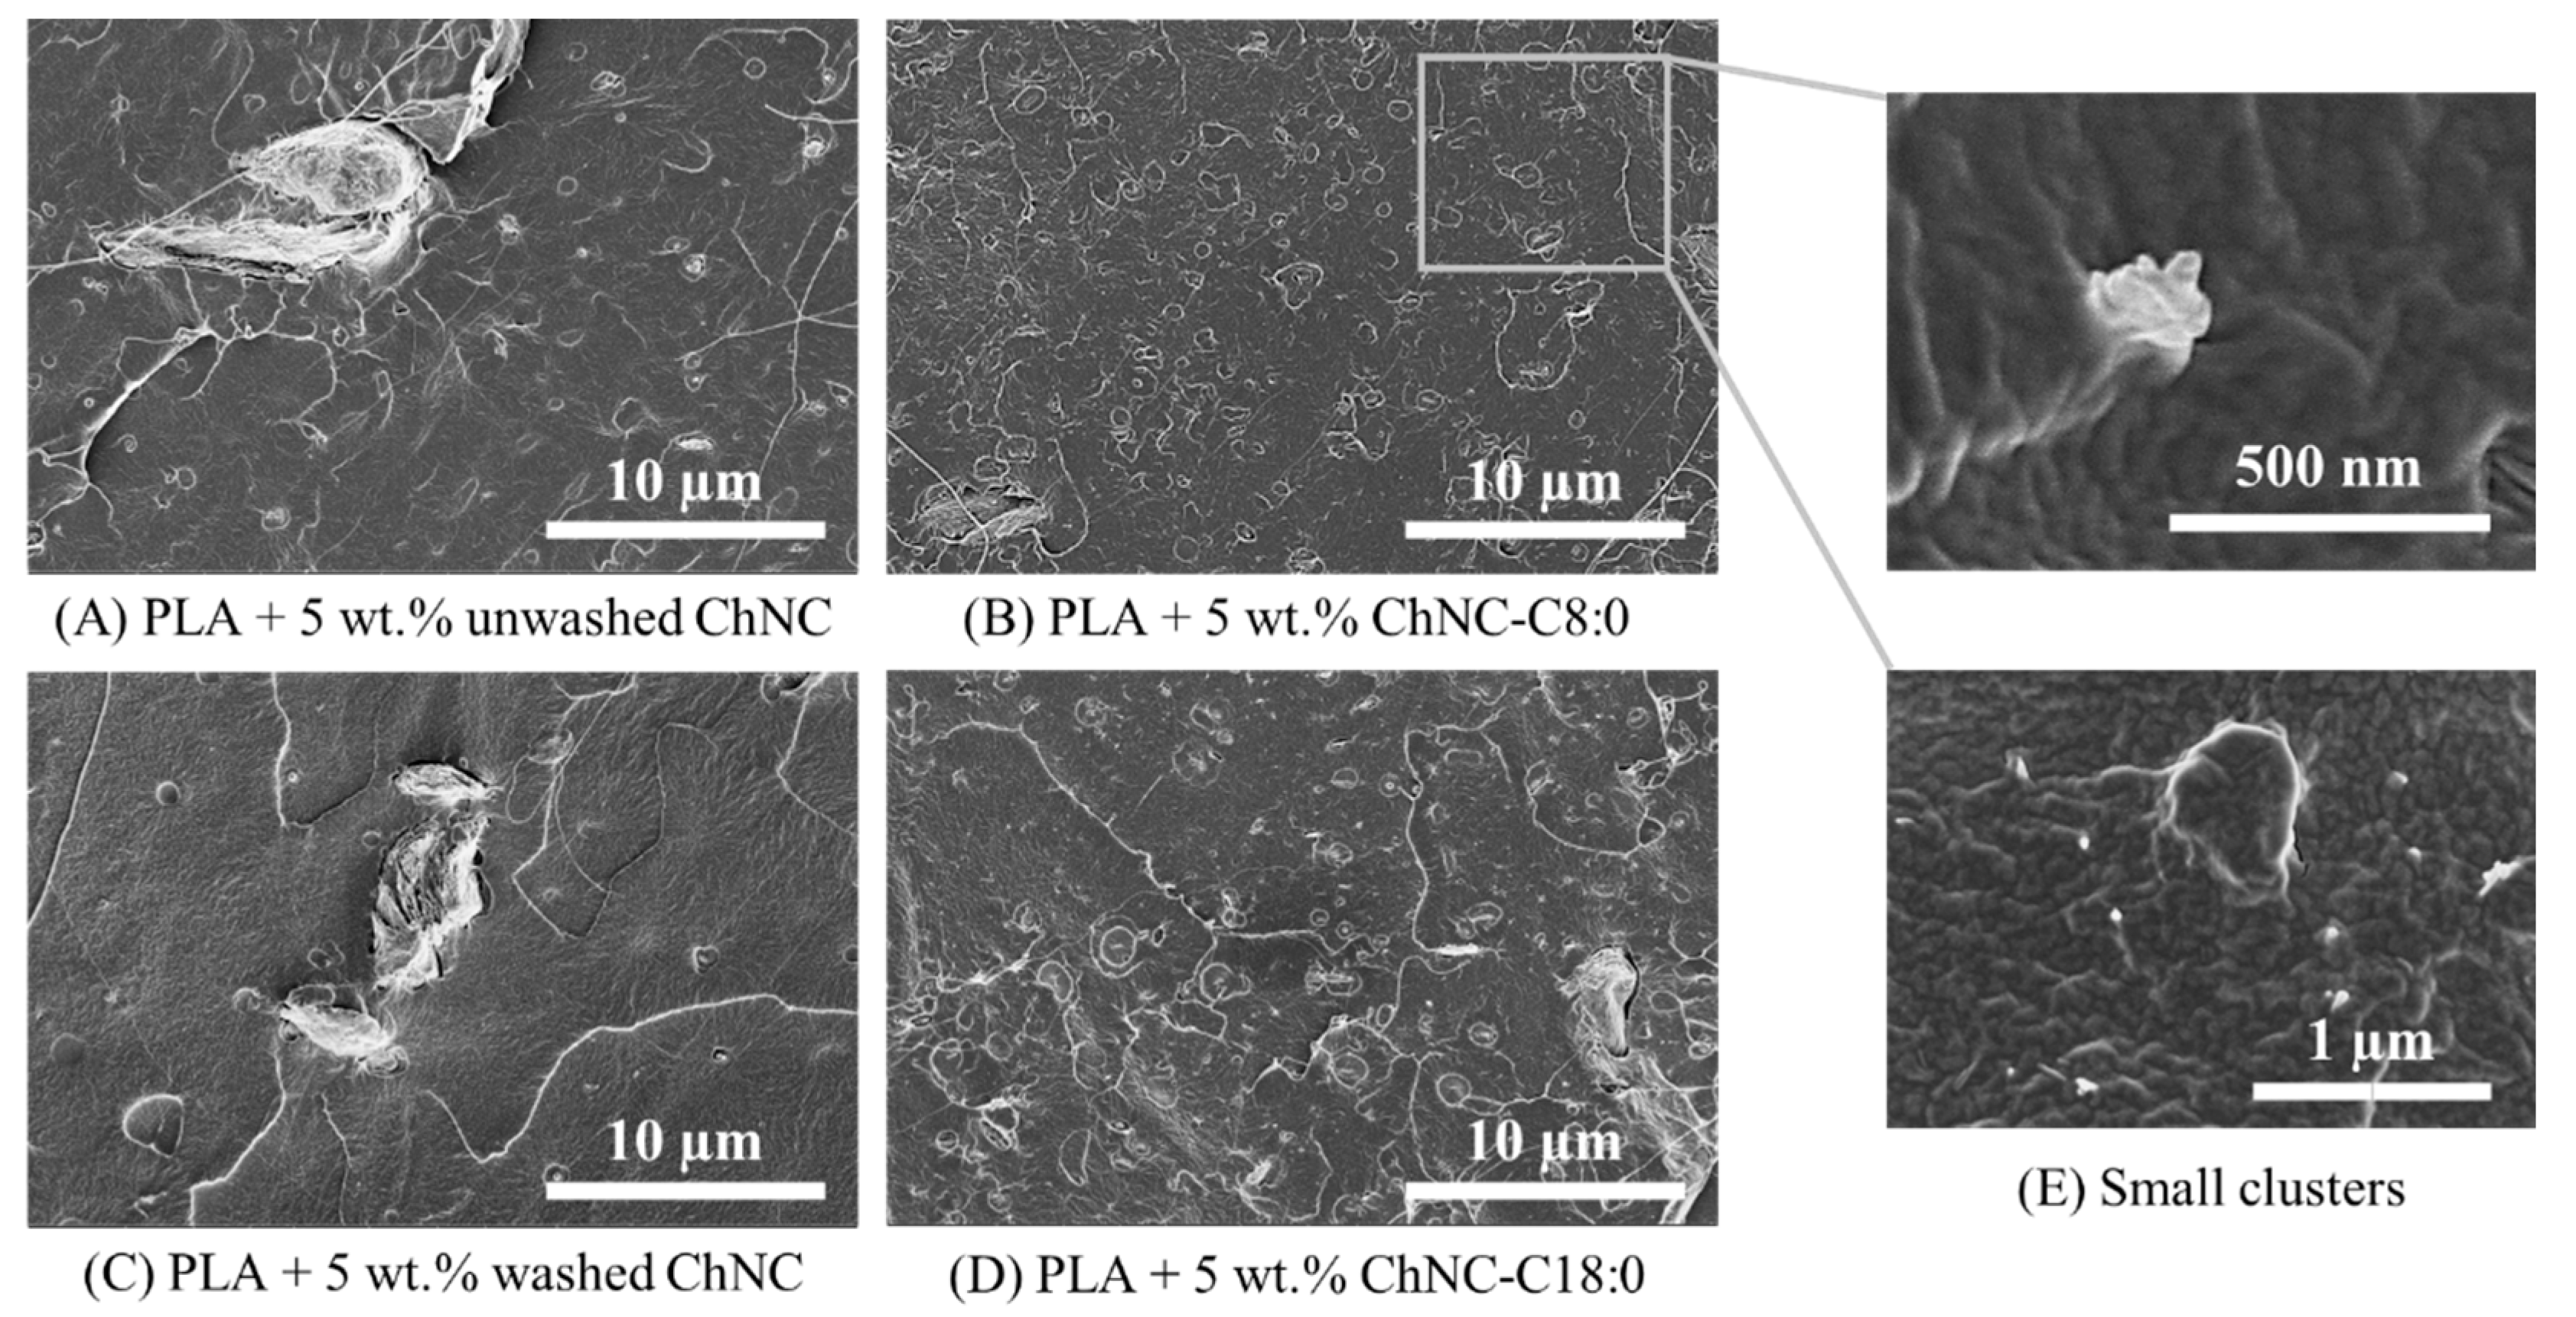
3.2.1. Nanocrystal Dispersion in the PLA Matrix
3.2.2. Barrier Properties
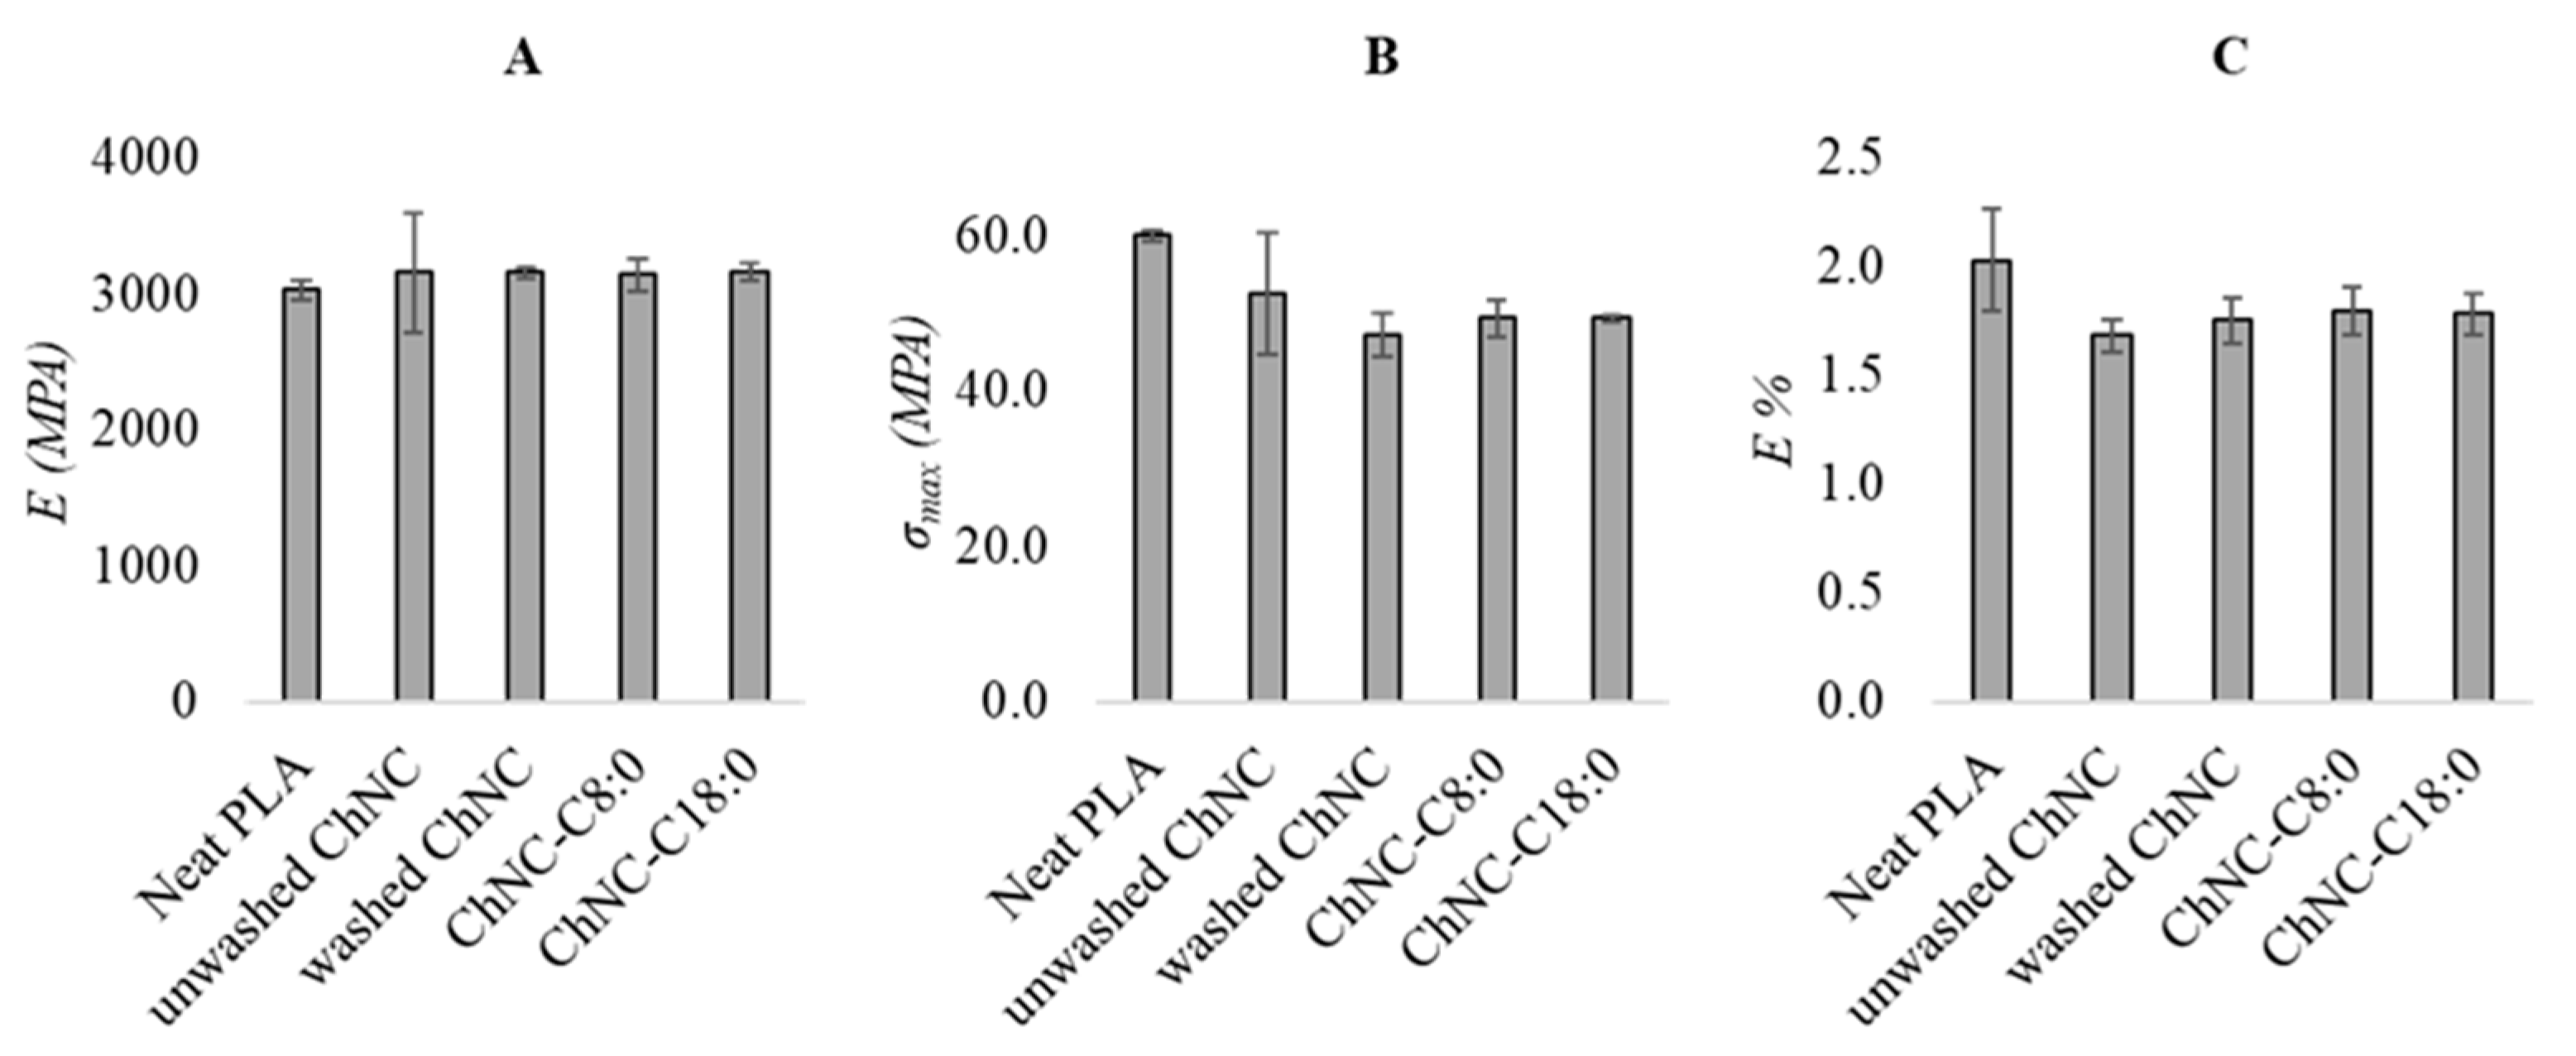
3.2.3. Mechanical Properties
4. Conclusions
Author Contributions
Funding
Institutional Review Board Statement
Informed Consent Statement
Data Availability Statement
Acknowledgments
Conflicts of Interest
Appendix A
References
- van den Oever, M.; Molenveld, K.; van der Zee, M.; Bos, H. Bio-Based and Biodegradable Plastics–Facts and Figures. In Focus on Food Packaging in the Netherlands; Wageningen Food & Biobased Research: Wageningen, The Netherlands, 2017; ISBN 9789463431217. [Google Scholar]
- Madhavan Nampoothiri, K.; Nair, N.R.; John, R.P. An Overview of the Recent Developments in Polylactide (PLA) Research. Bioresour. Technol. 2010, 101, 8493–8501. [Google Scholar] [CrossRef] [PubMed]
- Yanat, M.; Schroën, K. Preparation Methods and Applications of Chitosan Nanoparticles; with an Outlook toward Reinforcement of Biodegradable Packaging. React. Funct. Polym. 2021, 161, 104849. [Google Scholar] [CrossRef]
- Ma, P.; Siddiqui, N.A.; Marom, G.; Kim, J. Composites: Part A Dispersion and Functionalization of Carbon Nanotubes for Polymer-Based Nanocomposites: A Review. Compos. Part. A 2010, 41, 1345–1367. [Google Scholar] [CrossRef]
- Li, B.; Zhong, W.-H. Review on Polymer/Graphite Nanoplatelet Nanocomposites. J. Mater. Sci. 2011, 46, 5595–5614. [Google Scholar] [CrossRef]
- Oksman, K.; Aitomäki, Y.; Mathew, A.P.; Siqueira, G.; Zhou, Q.; Butylina, S.; Tanpichai, S.; Zhou, X.; Hooshmand, S. Review of the Recent Developments in Cellulose Nanocomposite Processing. Compos. Part A Appl. Sci. Manuf. 2016, 83, 2–18. [Google Scholar] [CrossRef] [Green Version]
- Müller, K.; Bugnicourt, E.; Latorre, M.; Jorda, M.; Echegoyen Sanz, Y.; Lagaron, J.; Miesbauer, O.; Bianchin, A.; Hankin, S.; Bölz, U.; et al. Review on the Processing and Properties of Polymer Nanocomposites and Nanocoatings and Their Applications in the Packaging, Automotive and Solar Energy Fields. Nanomaterials 2017, 7, 74. [Google Scholar] [CrossRef] [Green Version]
- Vasile, C. Polymeric Nanocomposites and Nanocoatings for Food Packaging: A Review. Materials 2018, 11, 1834. [Google Scholar] [CrossRef] [Green Version]
- Scaffaro, R.; Botta, L.; Lopresti, F.; Maio, A.; Sutera, F. Polysaccharide Nanocrystals as Fillers for PLA Based Nanocomposites. Cellulose 2017, 24, 447–478. [Google Scholar] [CrossRef]
- Armentano, I.; Bitinis, N.; Fortunati, E.; Mattioli, S.; Rescignano, N.; Verdejo, R.; Lopez-Manchado, M.A.; Kenny, J.M. Multifunctional Nanostructured PLA Materials for Packaging and Tissue Engineering. Prog. Polym. Sci. 2013, 38, 1720–1747. [Google Scholar] [CrossRef] [Green Version]
- Salaberria, A.M.; Diaz, R.H.; Labidi, J.; Fernandes, S.C.M. Role of Chitin Nanocrystals and Nanofibers on Physical, Mechanical and Functional Properties in Thermoplastic Starch Films. Food Hydrocoll. 2015, 46, 93–102. [Google Scholar] [CrossRef]
- Ifuku, S.; Ikuta, A.; Egusa, M.; Kaminaka, H.; Izawa, H.; Morimoto, M.; Saimoto, H. Preparation of High-Strength Transparent Chitosan Film Reinforced with Surface-Deacetylated Chitin Nanofibers. Carbohydr. Polym. 2013, 98, 1198–1202. [Google Scholar] [CrossRef] [PubMed]
- Pan, C.; Qian, J.; Fan, J.; Guo, H.; Gou, L.; Yang, H.; Liang, C. Preparation Nanoparticle by Ionic Cross-Linked Emulsified Chitosan and Its Antibacterial Activity. Colloids Surfaces A Physicochem. Eng. Asp. 2019, 568, 362–370. [Google Scholar] [CrossRef]
- Rozman, N.A.S.; Yenn, T.W.; Ring, L.C.; Nee, T.W.; Hasanolbasori, M.A.; Abdullah, S.Z. Potential Antimicrobial Applications of Chitosan Nanoparticles (ChNP). J. Microbiol. Biotechnol. 2019, 29, 1009–1013. [Google Scholar] [CrossRef] [PubMed]
- Colijn, I.; Schroën, K. Thermoplastic Bio-Nanocomposites: From Measurement of Fundamental Properties to Practical Application. Adv. Colloid Interface Sci. 2021, 292, 102419. [Google Scholar] [CrossRef] [PubMed]
- Colijn, I.; Fokkink, R.; Schroën, K. Quantification of Energy Input Required for Chitin Nanocrystal Aggregate Size Reduction through Ultrasound. Sci. Rep. 2021, 11, 1–9. [Google Scholar] [CrossRef]
- Zhang, Q.; Wei, S.; Huang, J.; Feng, J.; Chang, P.R. Effect of Surface Acetylated-Chitin Nanocrystals on Structure and Mechanical Properties of Poly(Lactic Acid). J. Appl. Polym. Sci. 2014, 131, 2–9. [Google Scholar] [CrossRef]
- Salaberria, A.M.; Labidi, J.; Fernandes, S.C.M. Different Routes to Turn Chitin into Stunning Nano-Objects. Eur. Polym. J. 2015, 68, 503–515. [Google Scholar] [CrossRef]
- Namazi, H.; Dadkhah, A. Convenient Method for Preparation of Hydrophobically Modified Starch Nanocrystals with Using Fatty Acids. Carbohydr. Polym. 2010, 79, 731–737. [Google Scholar] [CrossRef]
- Broers, L.; van Dongen, S.; de Goederen, V.; Ton, M.; Spaen, J.; Boeriu, C.; Schroën, K. Addition of Chitin Nanoparticles Improves Polylactic Acid Film Properties. Nanotechnol. Adv. Mater. Sci. 2018, 1, 1–8. [Google Scholar]
- Schindelin, J.; Arganda-Carreras, I.; Frise, E.; Kaynig, V.; Longair, M.; Pietzsch, T.; Preibisch, S.; Rueden, C.; Saalfeld, S.; Schmid, B.; et al. Fiji: An Open-Source Platform for Biological-Image Analysis. Nat. Methods 2012, 9, 676–682. [Google Scholar] [CrossRef] [Green Version]
- Shigemasa, Y.; Matsuura, H.; Sashiwa, H.; Saimoto, H. Evaluation of Different Absorbance Ratios from Infrared Spectroscopy for Analyzing the Degree of Deacetylation in Chitin. Int. J. Biol. Macromol. 1996, 18, 237–242. [Google Scholar] [CrossRef]
- Hoppenreijs, L.J.G.; Berton-Carabin, C.C.; Dubbelboer, A.; Hennebelle, M. Evaluation of Oxygen Partial Pressure, Temperature and Stripping of Antioxidants for Accelerated Shelf-Life Testing of Oil Blends Using 1H NMR. Food Res. Int. 2021, 147, 110555. [Google Scholar] [CrossRef] [PubMed]
- Salaberria, A.M.; Diaz, R.H.; Andrés, M.A.; Fernandes, S.C.M.; Labidi, J. The Antifungal Activity of Functionalized Chitin Nanocrystals in Poly (Lactid Acid) Films. Materials 2017, 10, 546. [Google Scholar] [CrossRef] [PubMed] [Green Version]
- Chang, P.R.; Jian, R.; Yu, J.; Ma, X. Starch-Based Composites Reinforced with Novel Chitin Nanoparticles. Carbohydr. Polym. 2010, 80, 420–425. [Google Scholar] [CrossRef]
- Xavier, M. Standardization of Optimum Conditions for the Production of Glucosamine Hydrochloride from Chitin; Central Institute of Fisheries Technology: Kochi, India, 2006. [Google Scholar]
- Arora, A.; Padua, G.W. Review: Nanocomposites in Food Packaging. J. Food Sci. 2010, 75, 43–49. [Google Scholar] [CrossRef]
- Tan, B.; Thomas, N.L. A Review of the Water Barrier Properties of Polymer/Clay and Polymer/Graphene Nanocomposites. J. Memb. Sci. 2016, 514, 595–612. [Google Scholar] [CrossRef] [Green Version]
- De Silva, R.T.; Mantilaka, M.M.M.G.P.G.; Ratnayake, S.P.; Amaratunga, G.A.J.; de Silva, K.M.N. Nano-MgO Reinforced Chitosan Nanocomposites for High Performance Packaging Applications with Improved Mechanical, Thermal and Barrier Properties. Carbohydr. Polym. 2017, 157, 739–747. [Google Scholar] [CrossRef]
- Herrera, N.; Roch, H.; Salaberria, A.M.; Pino-Orellana, M.A.; Labidi, J.; Fernandes, S.C.M.; Radic, D.; Leiva, A.; Oksman, K. Functionalized Blown Films of Plasticized Polylactic Acid/Chitin Nanocomposite: Preparation and Characterization. Mater. Des. 2016, 92, 846–852. [Google Scholar] [CrossRef]


| Chemical Shift C7 or C1′ | Area Compared to C1 | |
|---|---|---|
| ChNC | 174.9 | 0.35 |
| ChNC-C4:0 | 173.0 | 0.65 |
| ChNC-C8:0 | 172.9 | 0.65 |
| ChNC-C12:0 | 173.1 | 0.62 |
| ChNC-C18:0 | 172.9 | 0.65 |
| ChNC-C18:2 | 173.0 | 0.63 |
| Sample | DS% | DA% | ζ-Potential (mV) |
|---|---|---|---|
| ChNC | (⎼) | 74.5 | 35.3 ± 0.5 |
| ChNC-C4:0 | 2.6 ± 0.2 | 78.4 | 33.9 ± 0.6 |
| ChNC-C8:0 | 3.9 ± 0.0 | 78.5 | 34.7 ± 0.3 |
| ChNC-C12:0 | 2.2 ± 0.1 | 71.3 | 35.0 ± 1.0 |
| ChNC-C18:0 | 1.7 ± 0.0 | 60.7 | 35.7 ± 0.5 |
| ChNC-C18:2 | 2.0 ± 0.5 | 62.9 | 34.3 ± 0.2 |
| Sample | WVTR (g/m2.day) * | WVTR Compared to PLA |
|---|---|---|
| PLA | 38.2 ± 2.2 | - |
| PLA + 5 wt.% washed ChNC | 99.7 ± 73.3 | +261.4% |
| PLA + 5 wt.% unwashed ChNC | 35.6 ± 0.9 | −6.7% |
| PLA + 5 wt.% ChNC-C8:0 | 35.6 ± 0.5 | −6.3% |
| PLA + 5 wt.% ChNC-C18:0 | 34.6 ± 2.3 | −9.4% |
Publisher’s Note: MDPI stays neutral with regard to jurisdictional claims in published maps and institutional affiliations. |
© 2022 by the authors. Licensee MDPI, Basel, Switzerland. This article is an open access article distributed under the terms and conditions of the Creative Commons Attribution (CC BY) license (https://creativecommons.org/licenses/by/4.0/).
Share and Cite
Colijn, I.; Yanat, M.; Terhaerdt, G.; Molenveld, K.; Boeriu, C.G.; Schroën, K. Chitin Nanocrystal Hydrophobicity Adjustment by Fatty Acid Esterification for Improved Polylactic Acid Nanocomposites. Polymers 2022, 14, 2619. https://doi.org/10.3390/polym14132619
Colijn I, Yanat M, Terhaerdt G, Molenveld K, Boeriu CG, Schroën K. Chitin Nanocrystal Hydrophobicity Adjustment by Fatty Acid Esterification for Improved Polylactic Acid Nanocomposites. Polymers. 2022; 14(13):2619. https://doi.org/10.3390/polym14132619
Chicago/Turabian StyleColijn, Ivanna, Murat Yanat, Geertje Terhaerdt, Karin Molenveld, Carmen G. Boeriu, and Karin Schroën. 2022. "Chitin Nanocrystal Hydrophobicity Adjustment by Fatty Acid Esterification for Improved Polylactic Acid Nanocomposites" Polymers 14, no. 13: 2619. https://doi.org/10.3390/polym14132619
APA StyleColijn, I., Yanat, M., Terhaerdt, G., Molenveld, K., Boeriu, C. G., & Schroën, K. (2022). Chitin Nanocrystal Hydrophobicity Adjustment by Fatty Acid Esterification for Improved Polylactic Acid Nanocomposites. Polymers, 14(13), 2619. https://doi.org/10.3390/polym14132619