
Modeling of Mechanical Properties of Silica Fume-Based Green Concrete Using Machine Learning Techniques

 , ,
, ,  ,
,  , ,
, ,  and
and 
Abstract
:1. Introduction
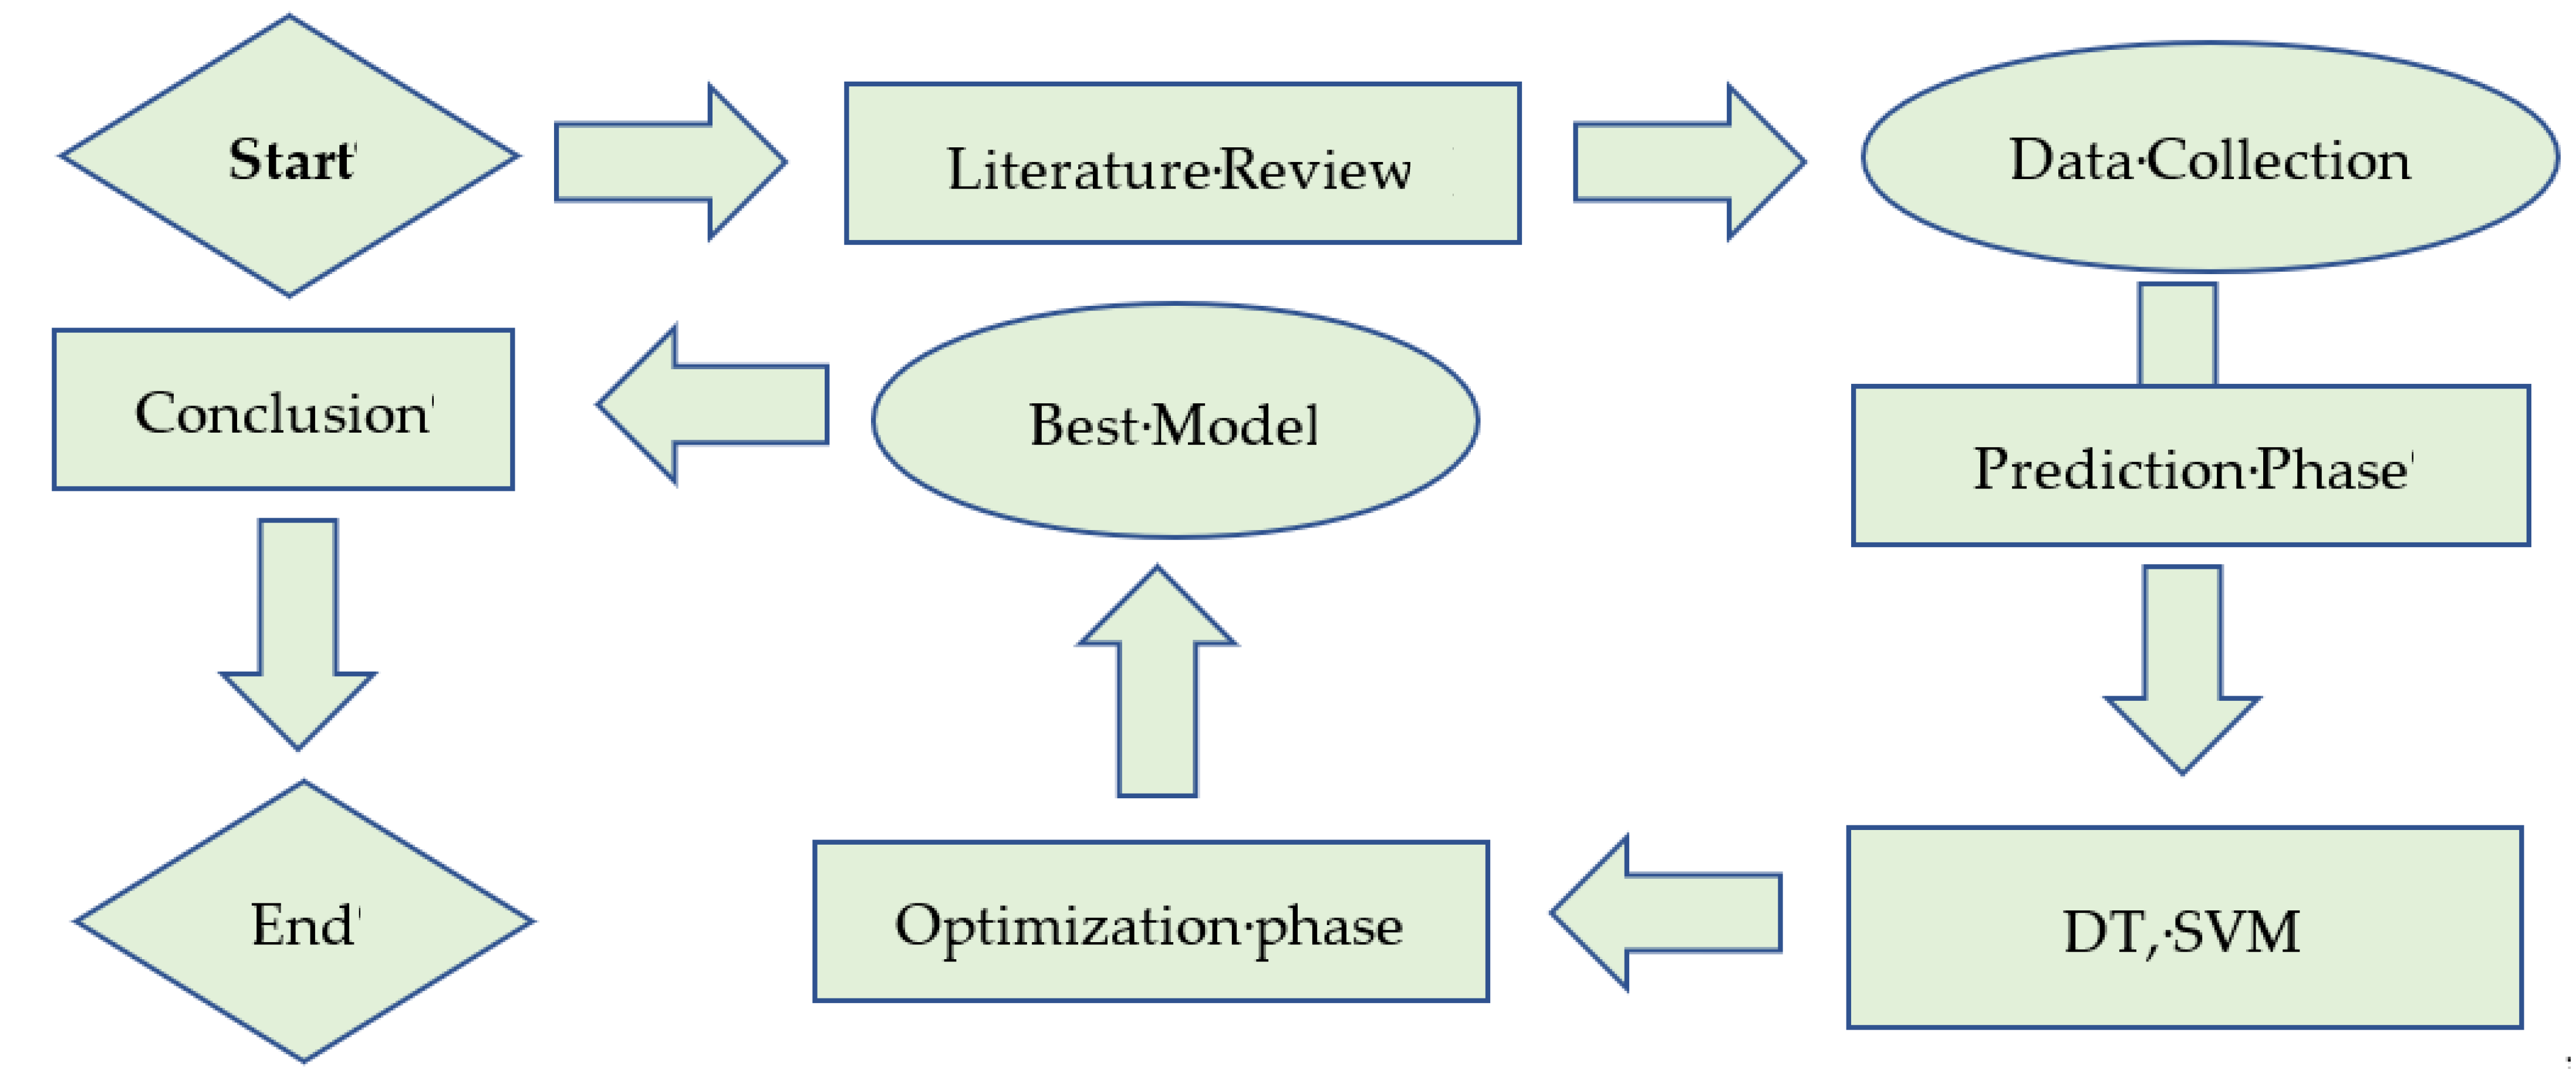
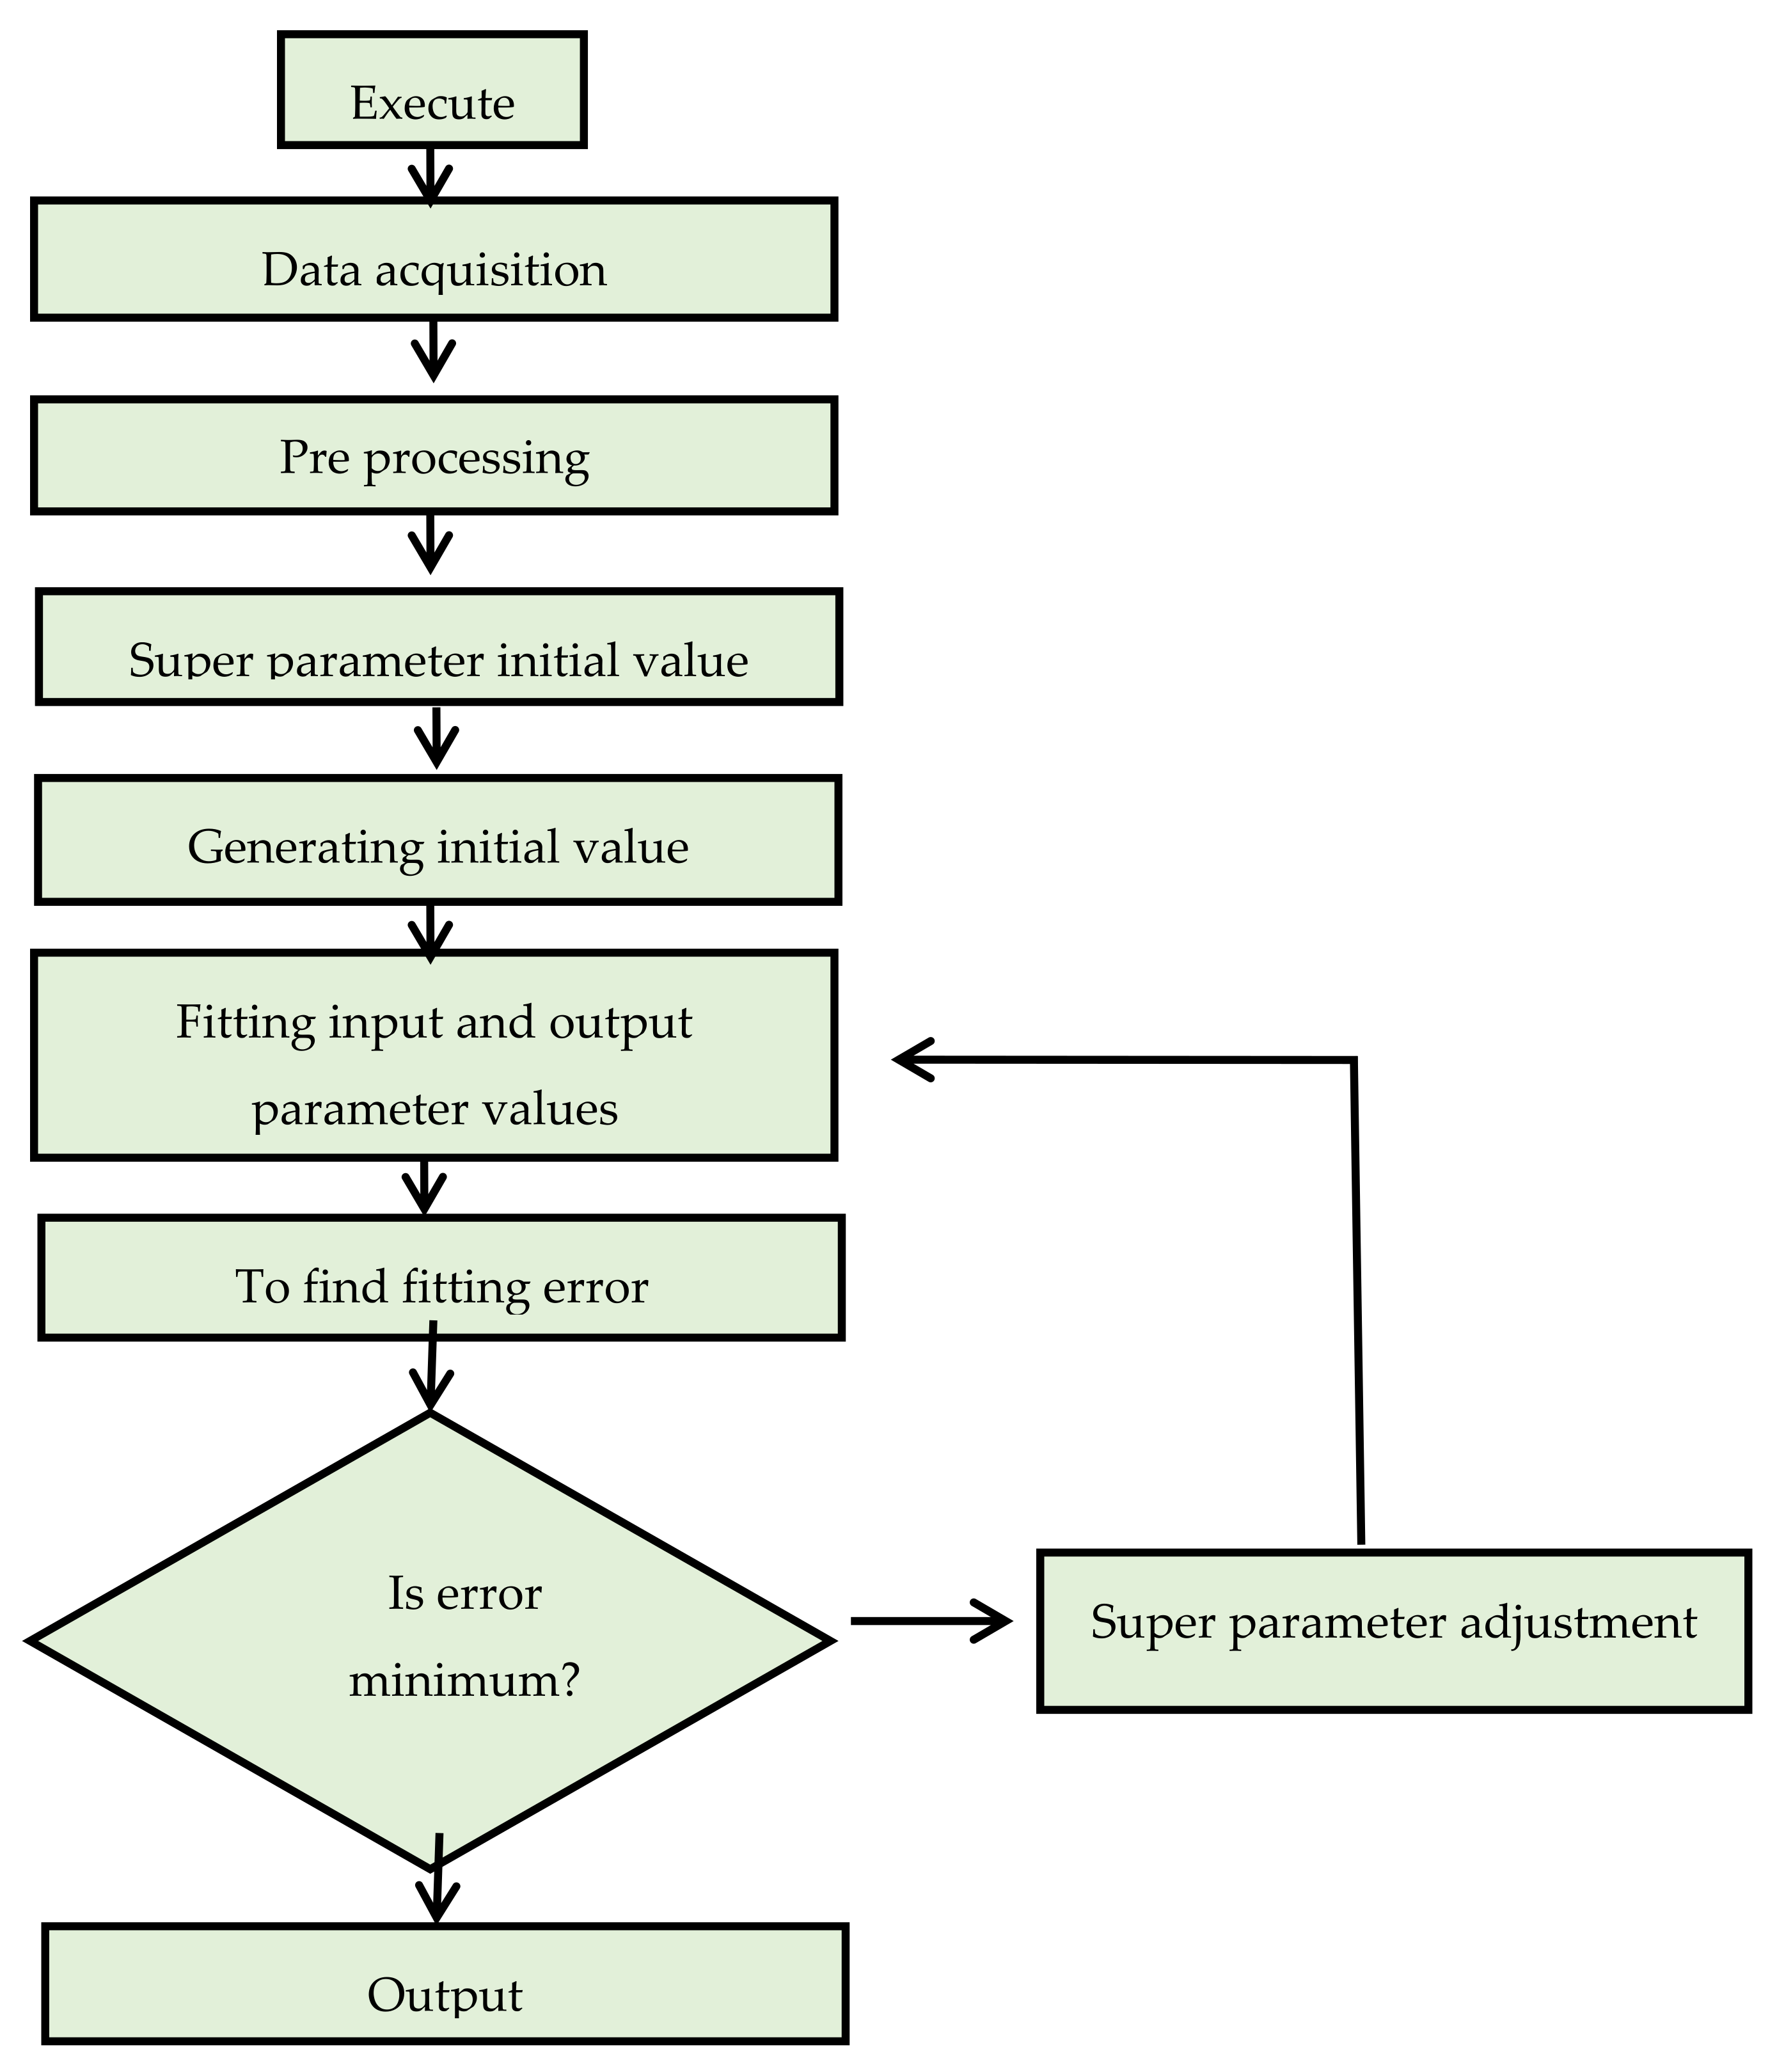
2. Methods and Modeling
2.1. Overview of Artificial Intelligence (AI)
2.2. Machine Learning Algorithms
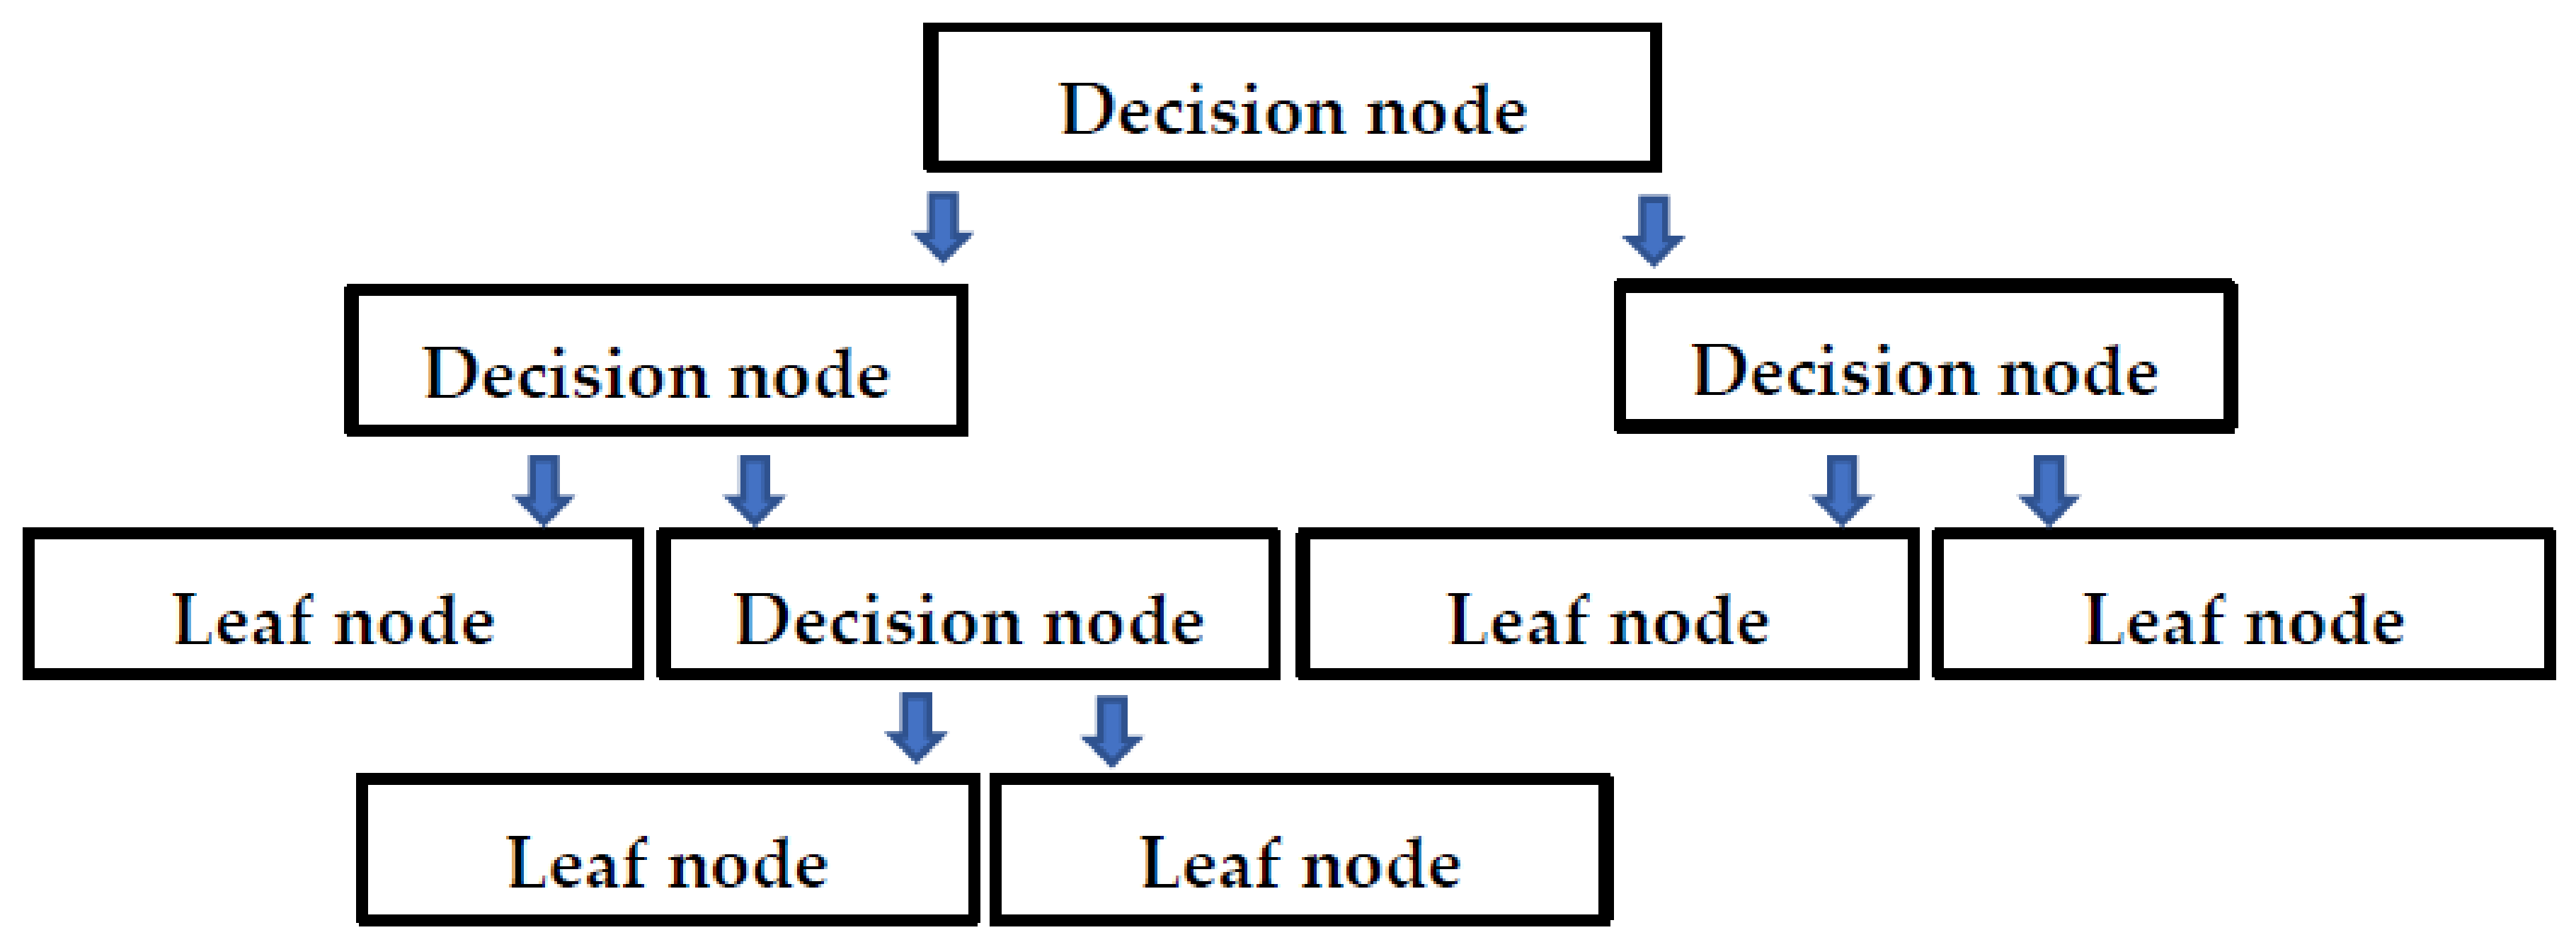
2.2.1. Decision Tree
2.2.2. Support Vector Machine (SVM)
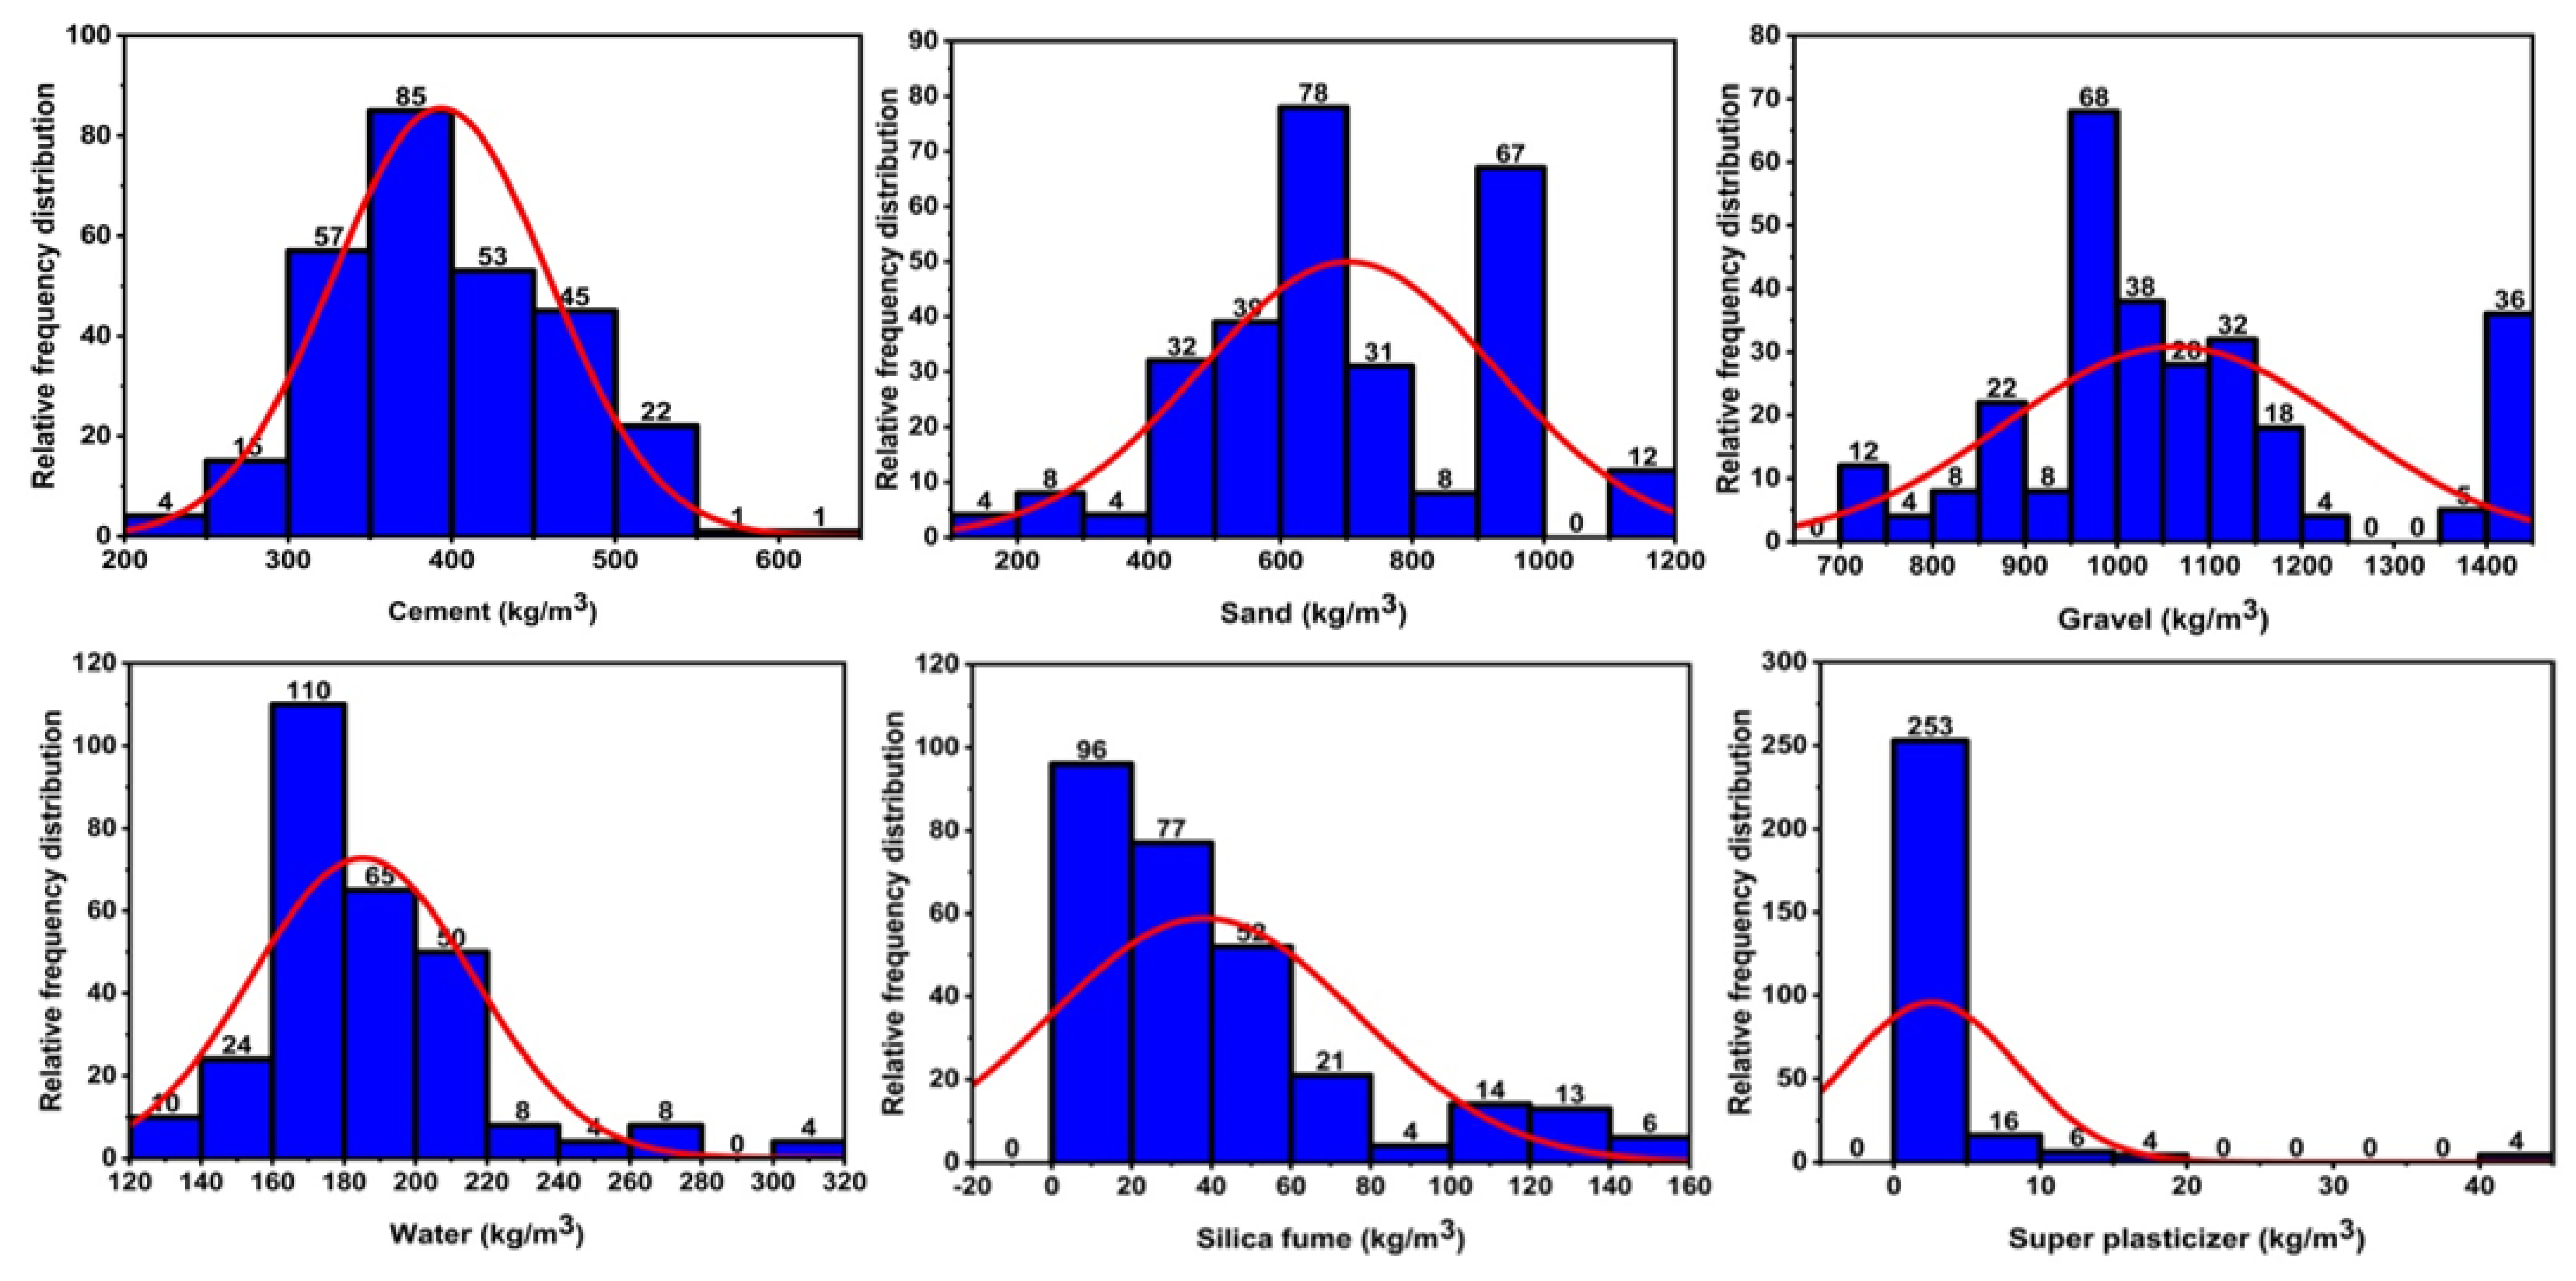
2.3. Modeling Dataset and Model Development

| Parameters | Cement | Fine Aggregate | Coarse Aggregate | Water | Silica Fume | Superplasticizer |
|---|---|---|---|---|---|---|
| Statistical Description | ||||||
| Mean | 393.48 | 702.90 | 1062.41 | 185.15 | 38.25 | 2.56 |
| Std error | 3.92 | 13.44 | 10.88 | 1.84 | 2.27 | 0.35 |
| Median | 383.15 | 653.00 | 1040.00 | 175.00 | 26.25 | 0.00 |
| variance | 4359.48 | 51,138.84 | 33,530.89 | 963.29 | 1469.97 | 34.80 |
| Std. dev | 66.02 | 226.13 | 183.11 | 31.03 | 38.34 | 5.89 |
| Kurtosis | −0.15 | −0.51 | 0.20 | 3.66 | 0.57 | 30.00 |
| Skewness | 0.15 | 0.11 | 0.61 | 1.50 | 1.11 | 4.97 |
| Range | 376.00 | 985.36 | 728.00 | 178.87 | 150.00 | 43.00 |
| Min | 224.00 | 184.63 | 702.00 | 135.00 | 0.00 | 0.00 |
| Max | 600.00 | 1170.00 | 1430.00 | 313.87 | 150.00 | 43.00 |
| Sum | 111,354.90 | 198,941.50 | 300,663.20 | 52,397.59 | 10,827.33 | 726.11 |
| Count | 283 | 283 | 283 | 283 | 283 | 283 |
| Training Dataset | ||||||
| Mean | 393.14 | 697.76 | 1067.67 | 185.80 | 36.78 | 2.65 |
| Std error | 4.41 | 14.67 | 11.94 | 2.15 | 2.56 | 0.42 |
| Median | 382.82 | 653.00 | 1040.00 | 176.00 | 26.25 | 0.00 |
| variance | 4404.11 | 48,659.21 | 32,197.86 | 1045.27 | 1483.09 | 40.60 |
| Std. dev | 66.36 | 220.59 | 179.44 | 32.33 | 38.51 | 6.37 |
| Kurtosis | −0.14 | −0.38 | 0.28 | 3.70 | 0.52 | 27.05 |
| Skewness | 0.13 | 0.11 | 0.65 | 1.57 | 1.11 | 4.83 |
| Range | 376.00 | 985.37 | 728.00 | 178.88 | 150.00 | 43.00 |
| Min | 224.00 | 184.63 | 702.00 | 135.00 | 0.00 | 0.00 |
| Max | 600.00 | 1170.00 | 1430.00 | 313.88 | 150.00 | 43.00 |
| Sum | 88,848.53 | 157,693.90 | 241,294.40 | 41,990.32 | 8313.19 | 599.42 |
| Count | 226 | 226 | 226 | 226 | 226 | 226 |
| Testing Dataset | ||||||
| Mean | 394.85 | 723.64 | 1041.56 | 182.58 | 44.11 | 2.22 |
| Std error | 8.64 | 32.84 | 26.13 | 3.36 | 4.96 | 0.46 |
| Median | 390.00 | 653.00 | 990.00 | 175.00 | 29.62 | 0.00 |
| variance | 4255.64 | 61,470.40 | 38,931.08 | 642.77 | 1399.90 | 11.97 |
| Std. dev | 65.24 | 247.93 | 197.31 | 25.35 | 37.42 | 3.46 |
| Kurtosis | −0.17 | −0.93 | 0.05 | 0.46 | 1.07 | 9.21 |
| Skewness | 0.28 | 0.09 | 0.57 | 0.73 | 1.24 | 2.55 |
| Range | 302.00 | 932.82 | 728.00 | 125.70 | 150.00 | 19.00 |
| Min | 238.00 | 237.19 | 702.00 | 135.20 | 0.00 | 0.00 |
| Max | 540.00 | 1170.00 | 1430.00 | 260.90 | 150.00 | 19.00 |
| Sum | 22,506.35 | 41,247.52 | 59,368.84 | 10,407.28 | 2514.14 | 126.69 |
| Count | 57 | 57 | 57 | 57 | 57 | 57 |
2.4. Models Evaluation Criteria
3. Results and Discussion
3.1. Formulation of Compressive Strength and Split Tensile Strength of SFC
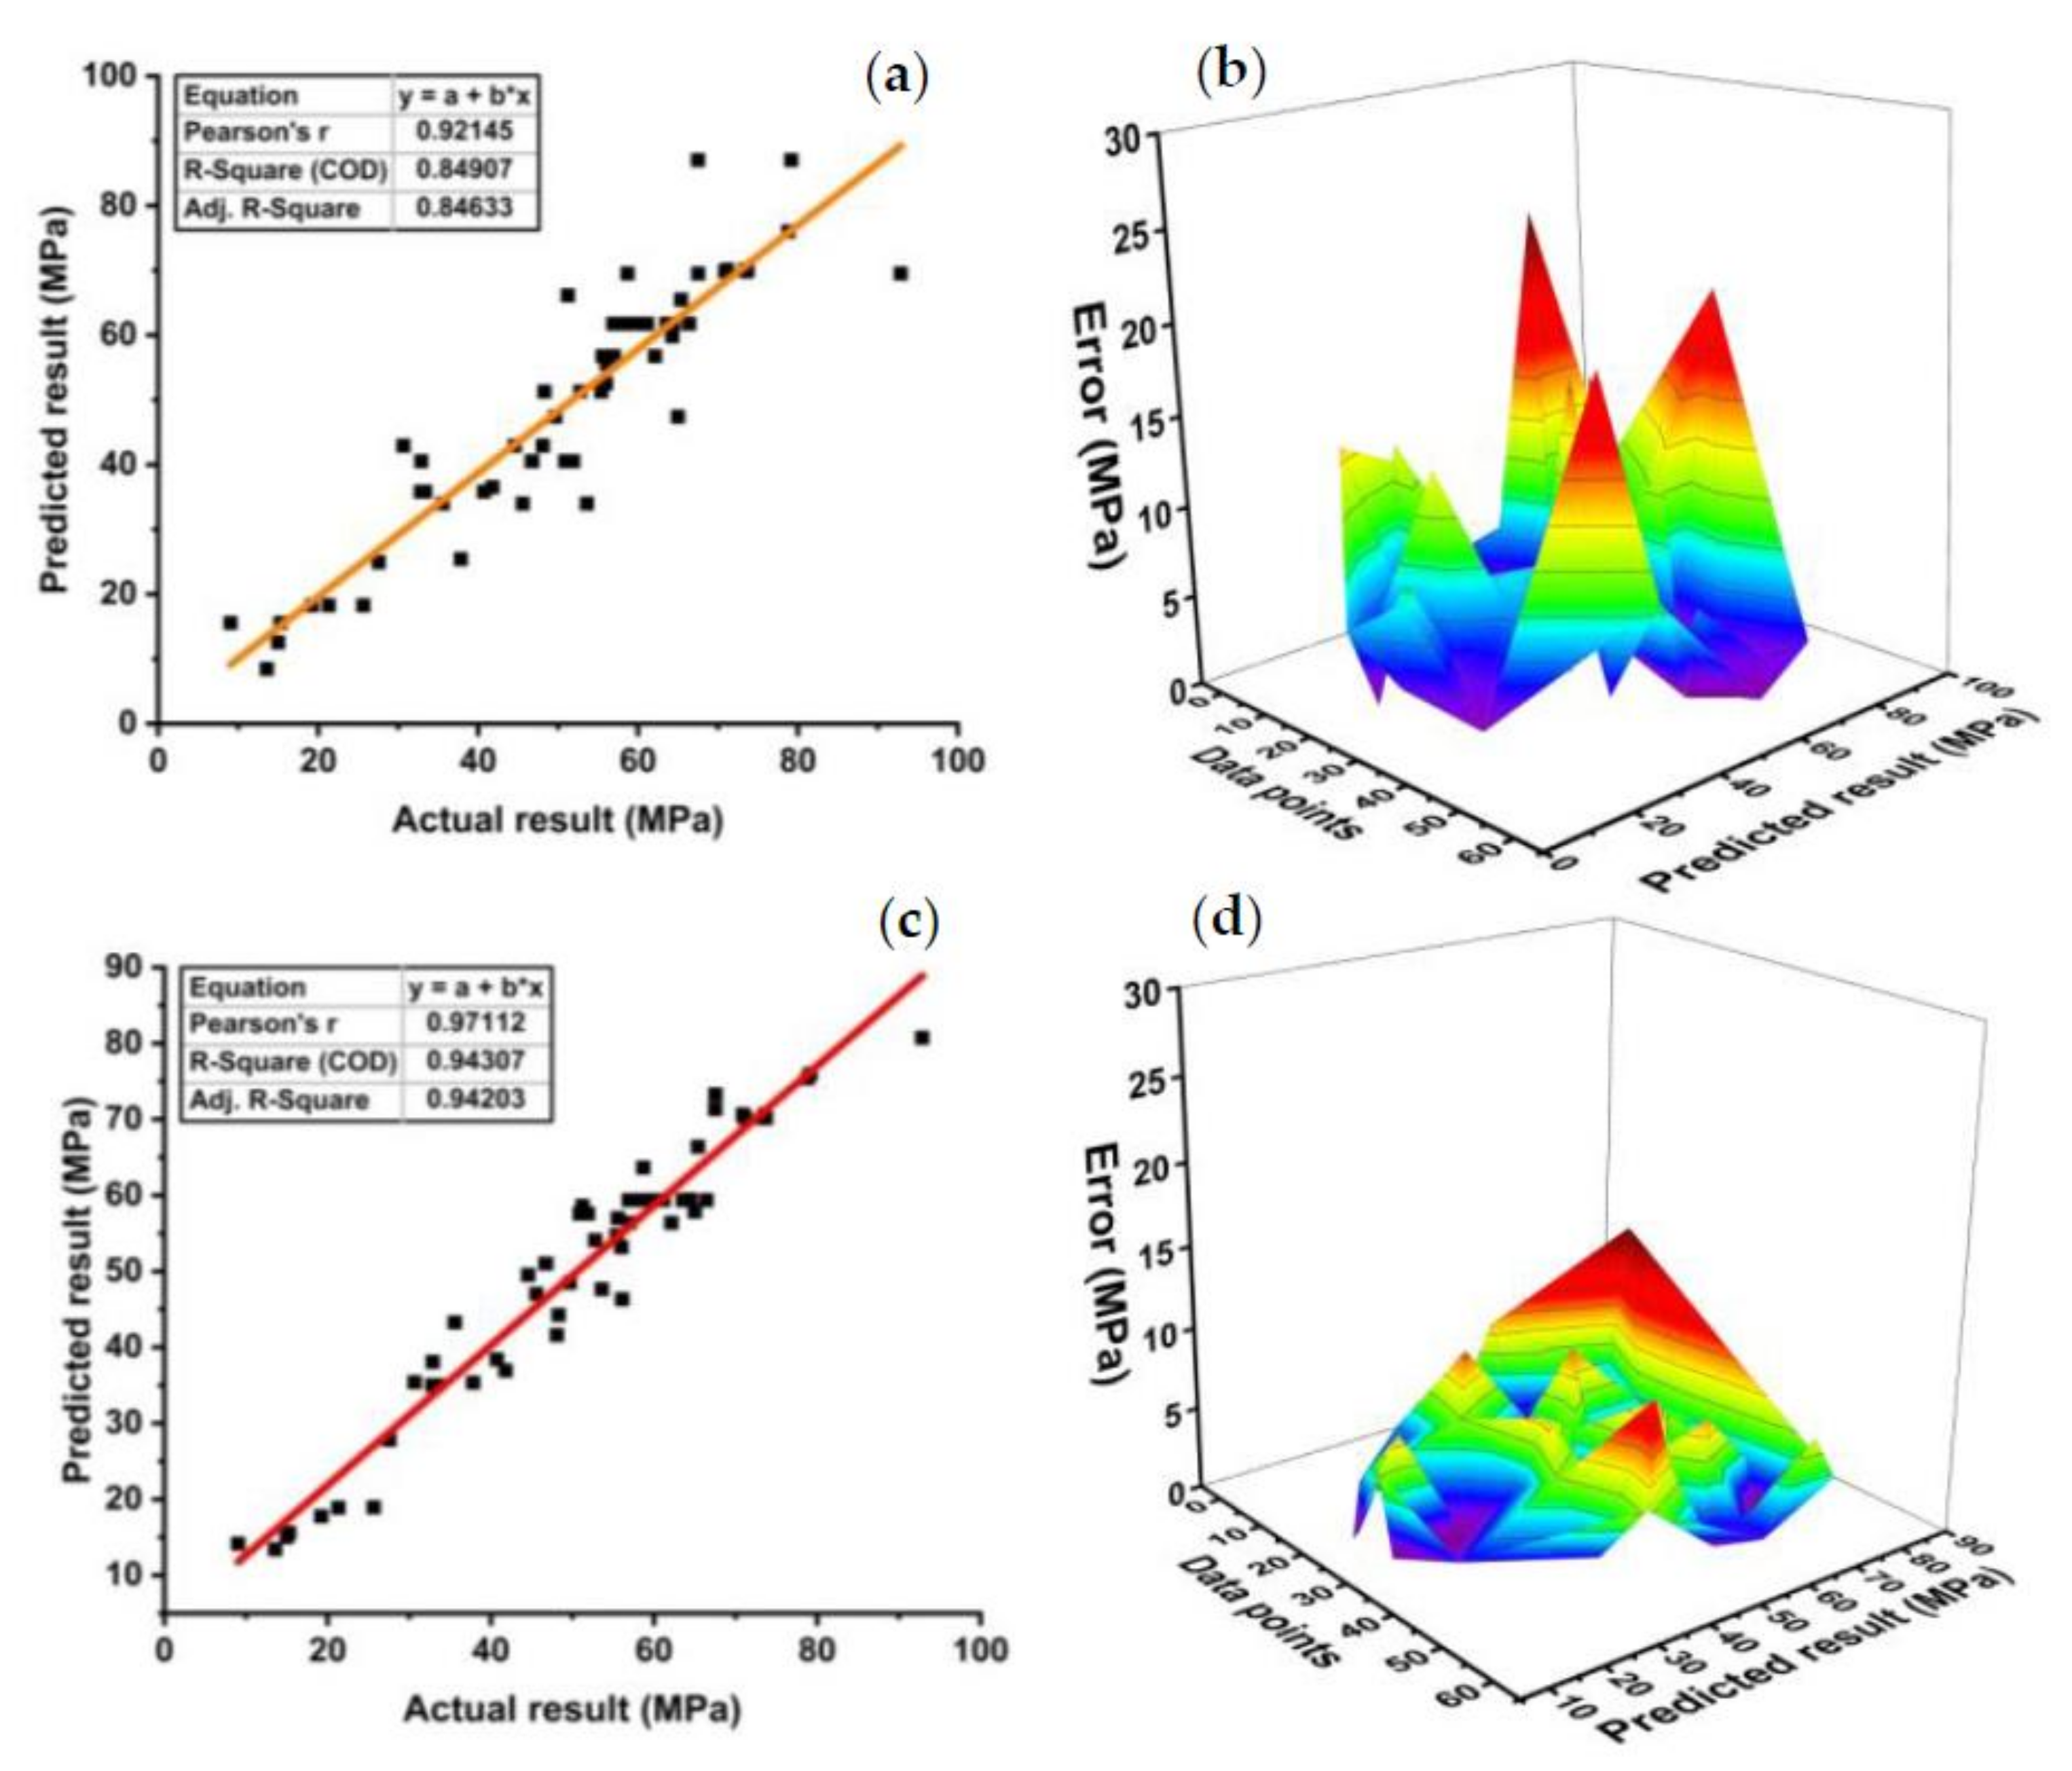
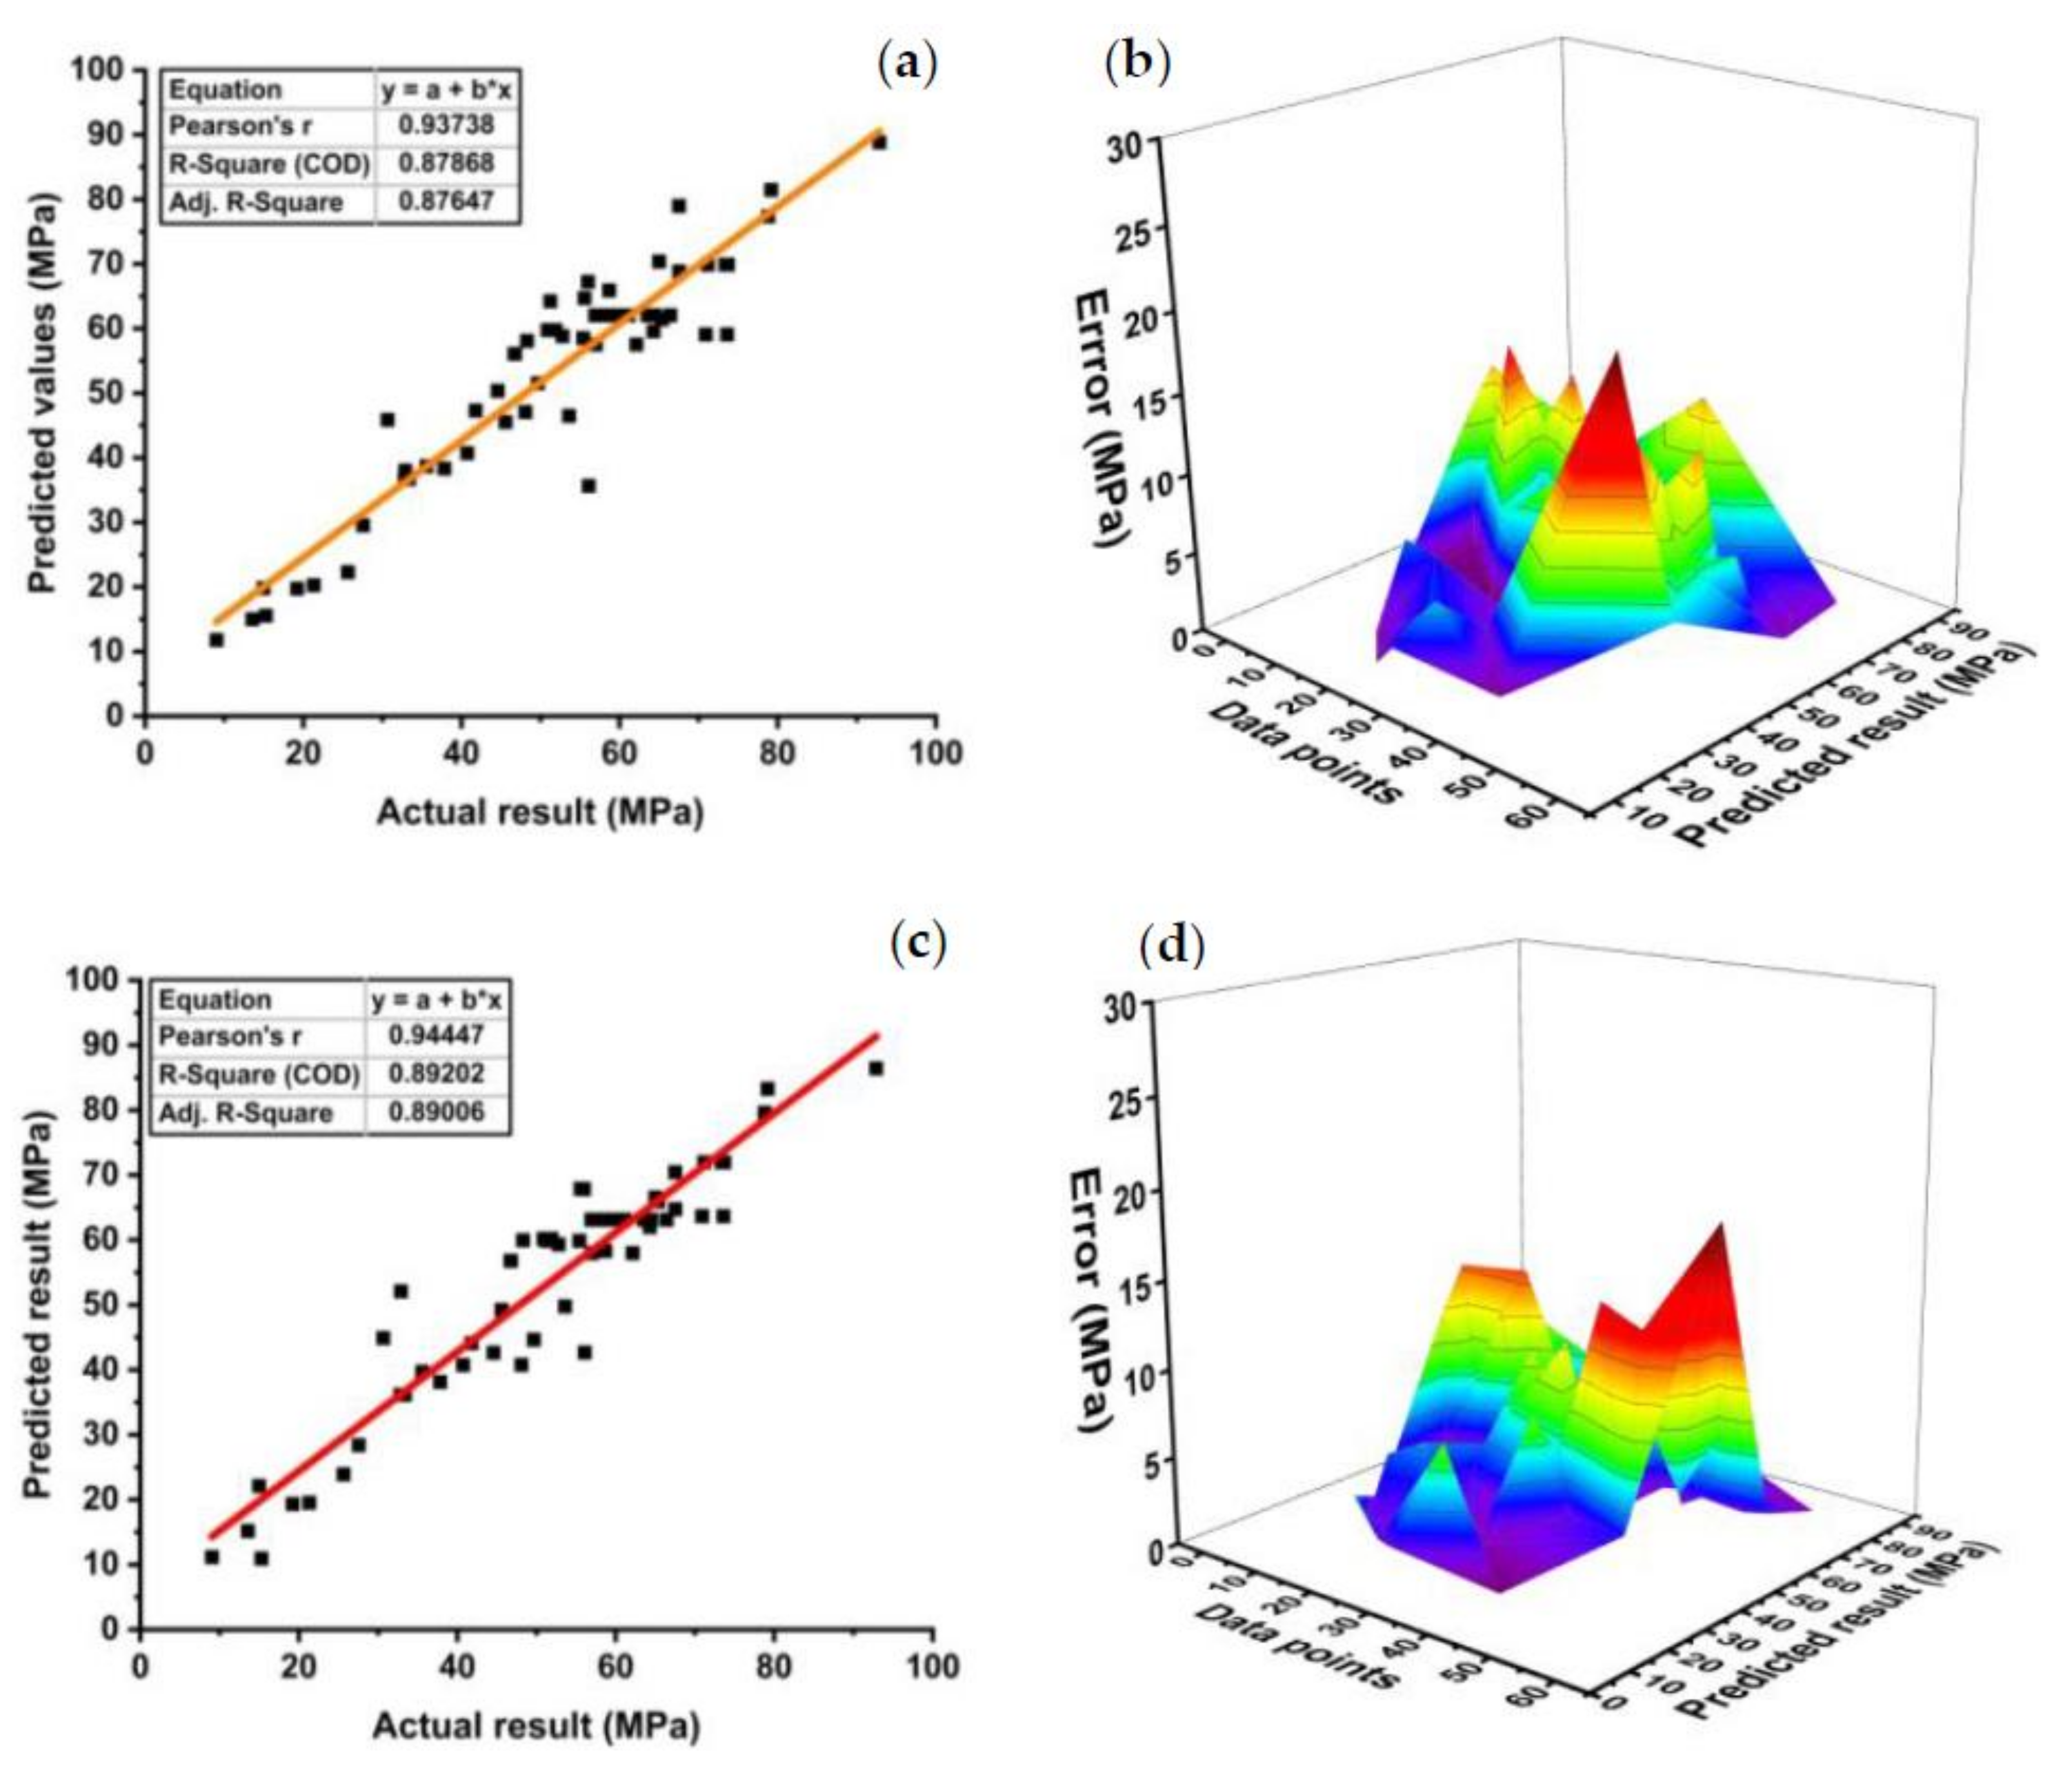
3.1.1. Modeling Outcome of Decision Tree
3.1.2. Model Outcomes of Support Vector Machine (SVM)
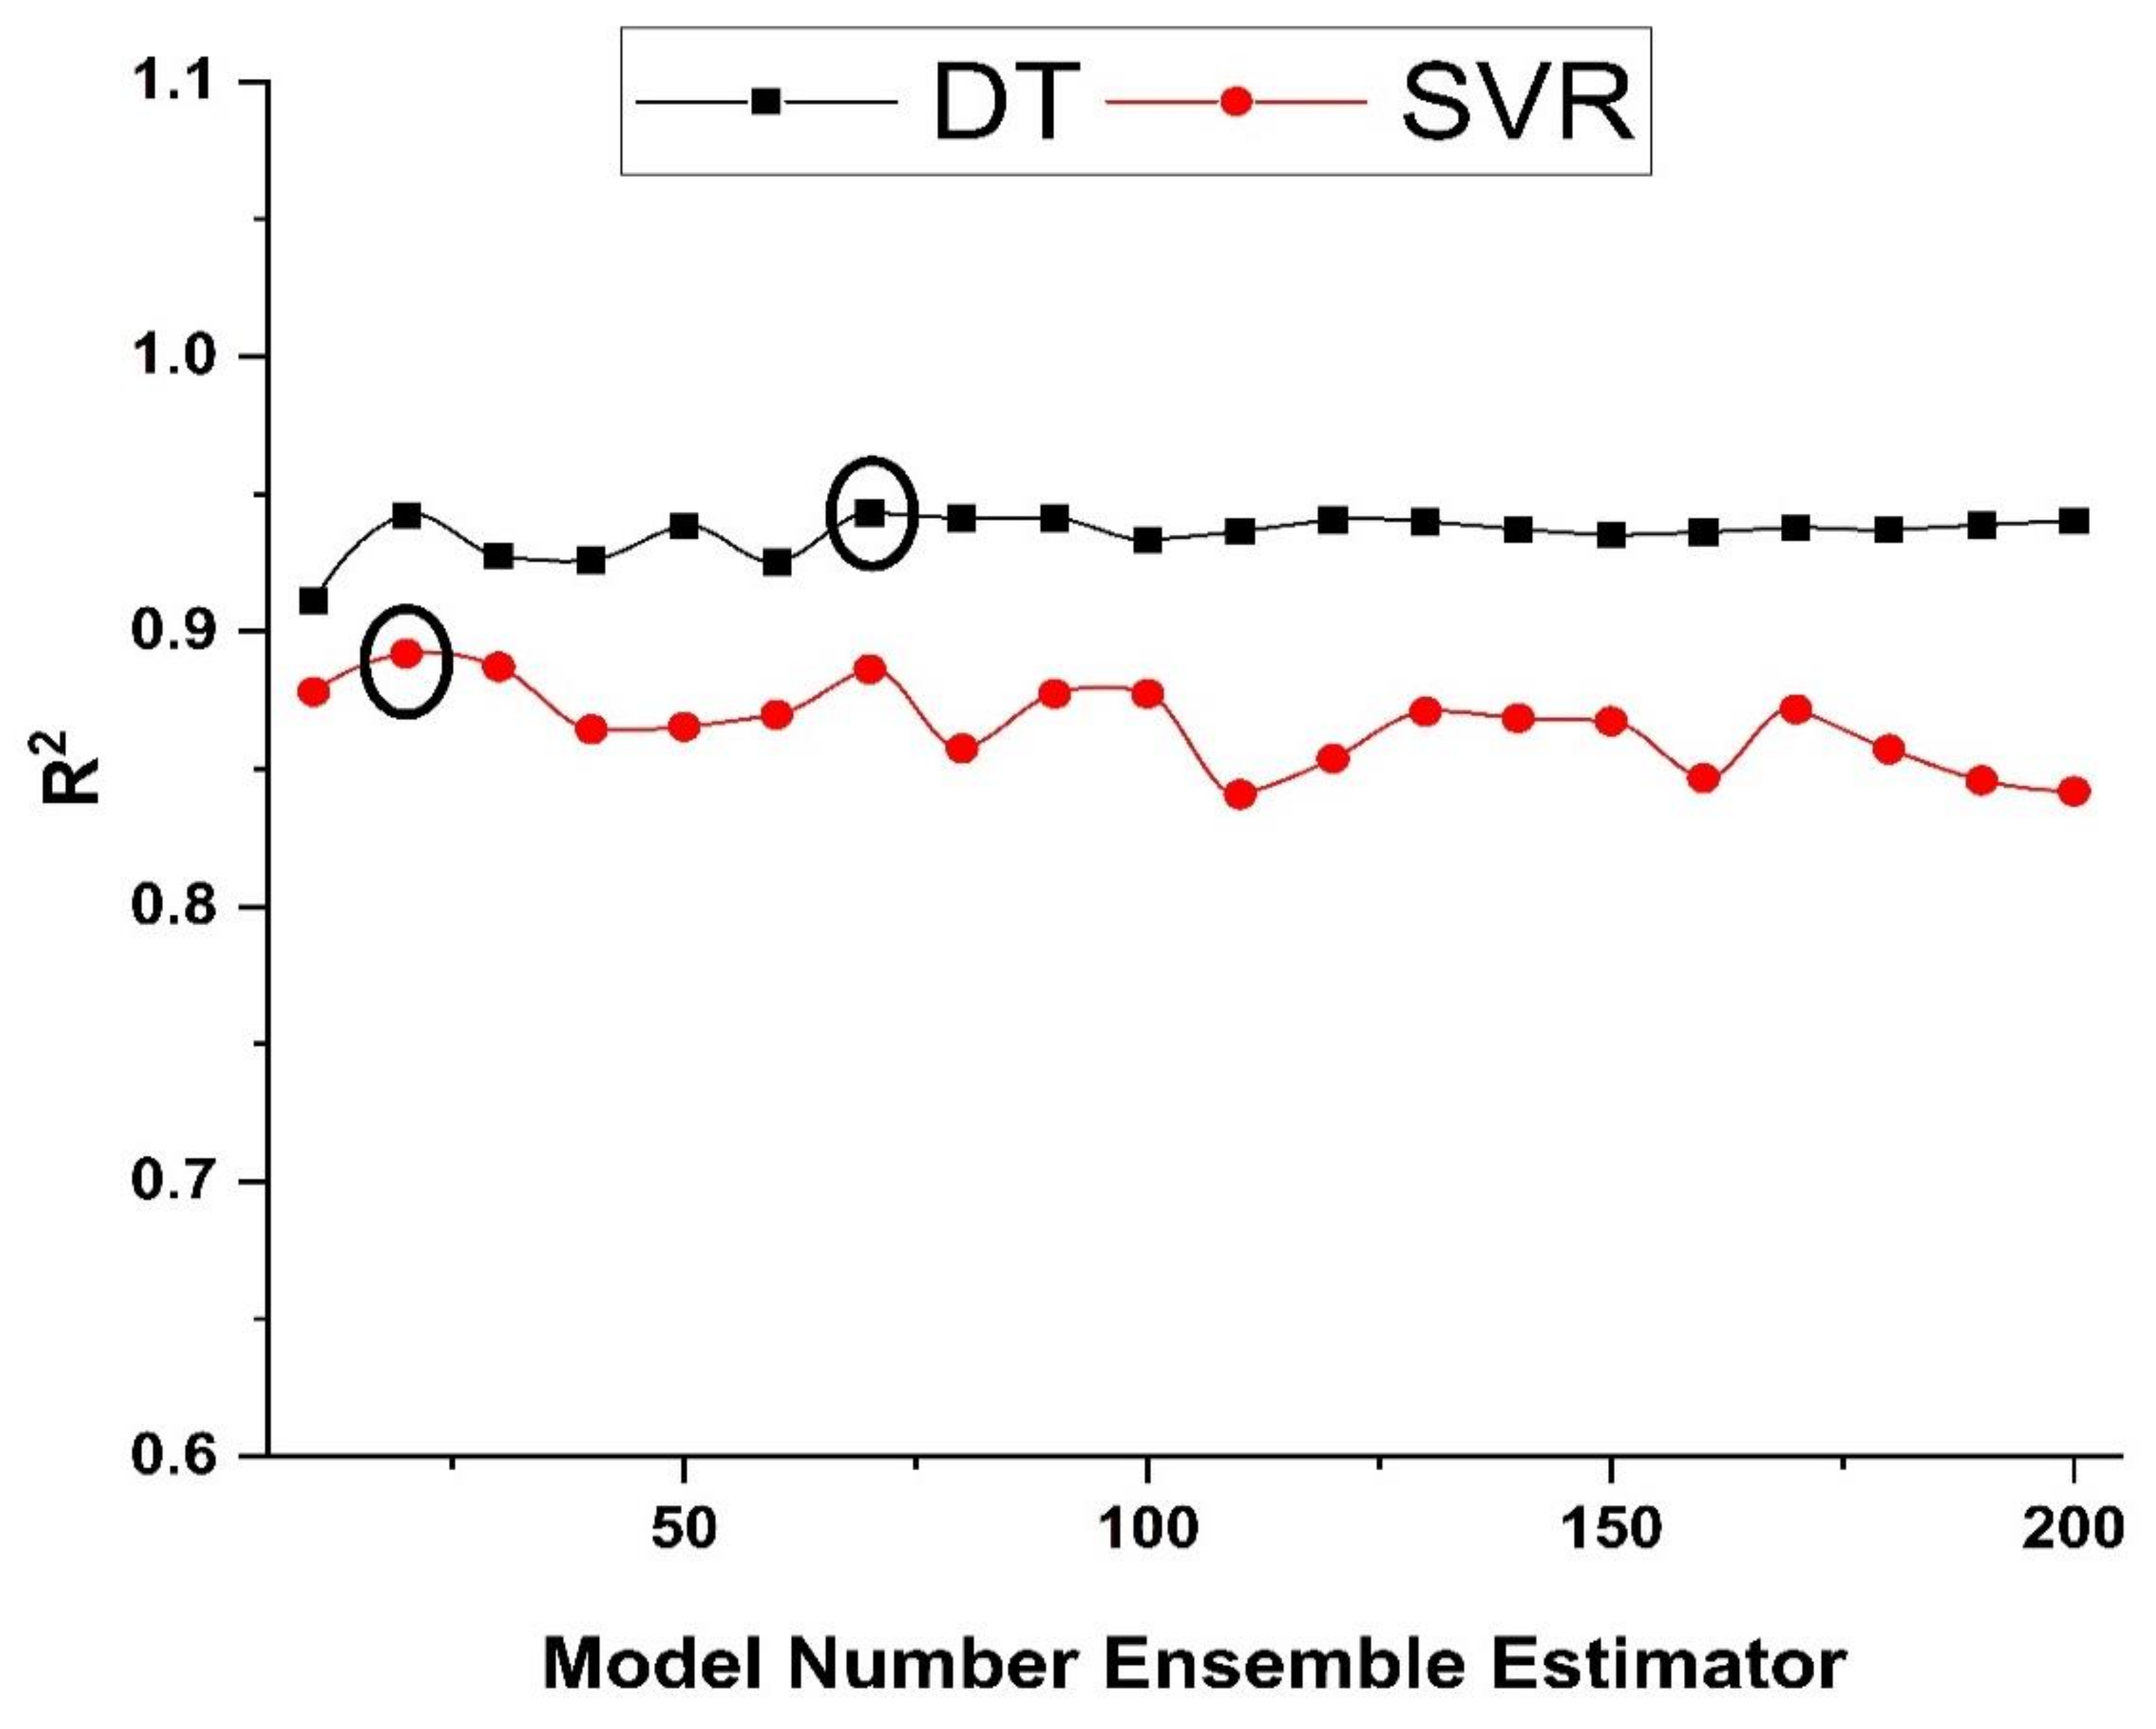
3.2. Comparison between Ensemble Models and GEP Model
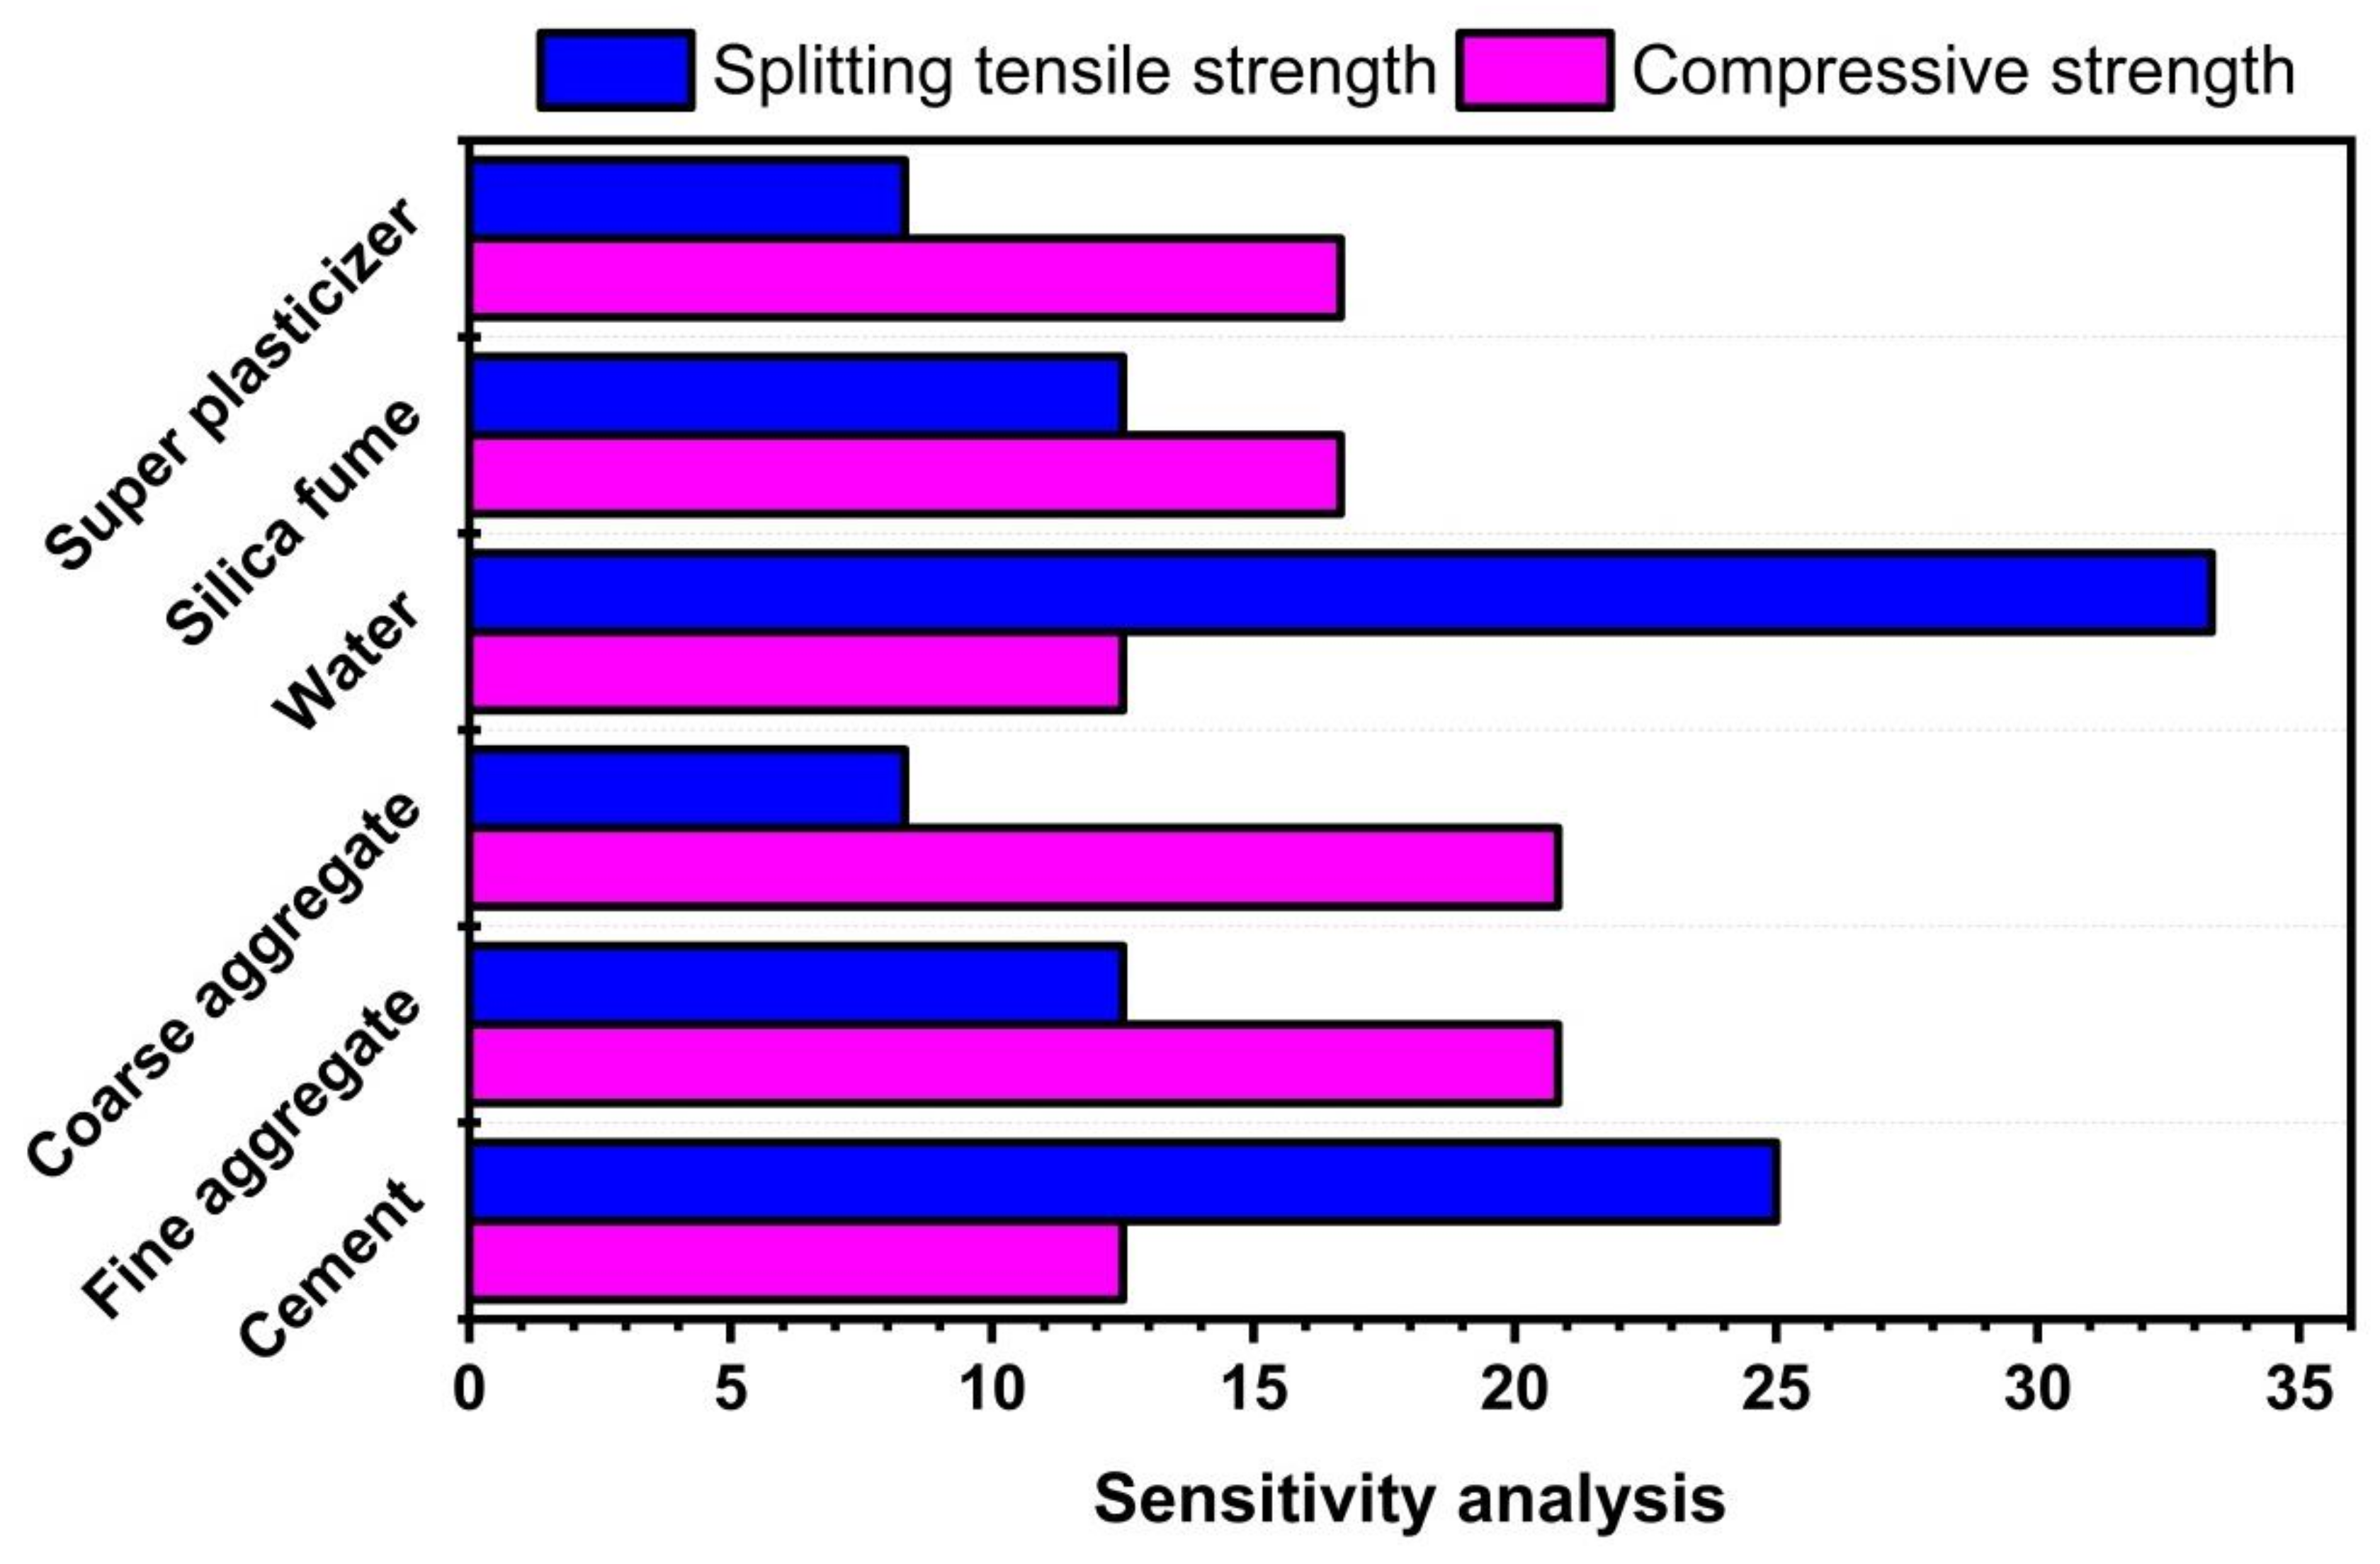
3.3. Sensitivity Analysis
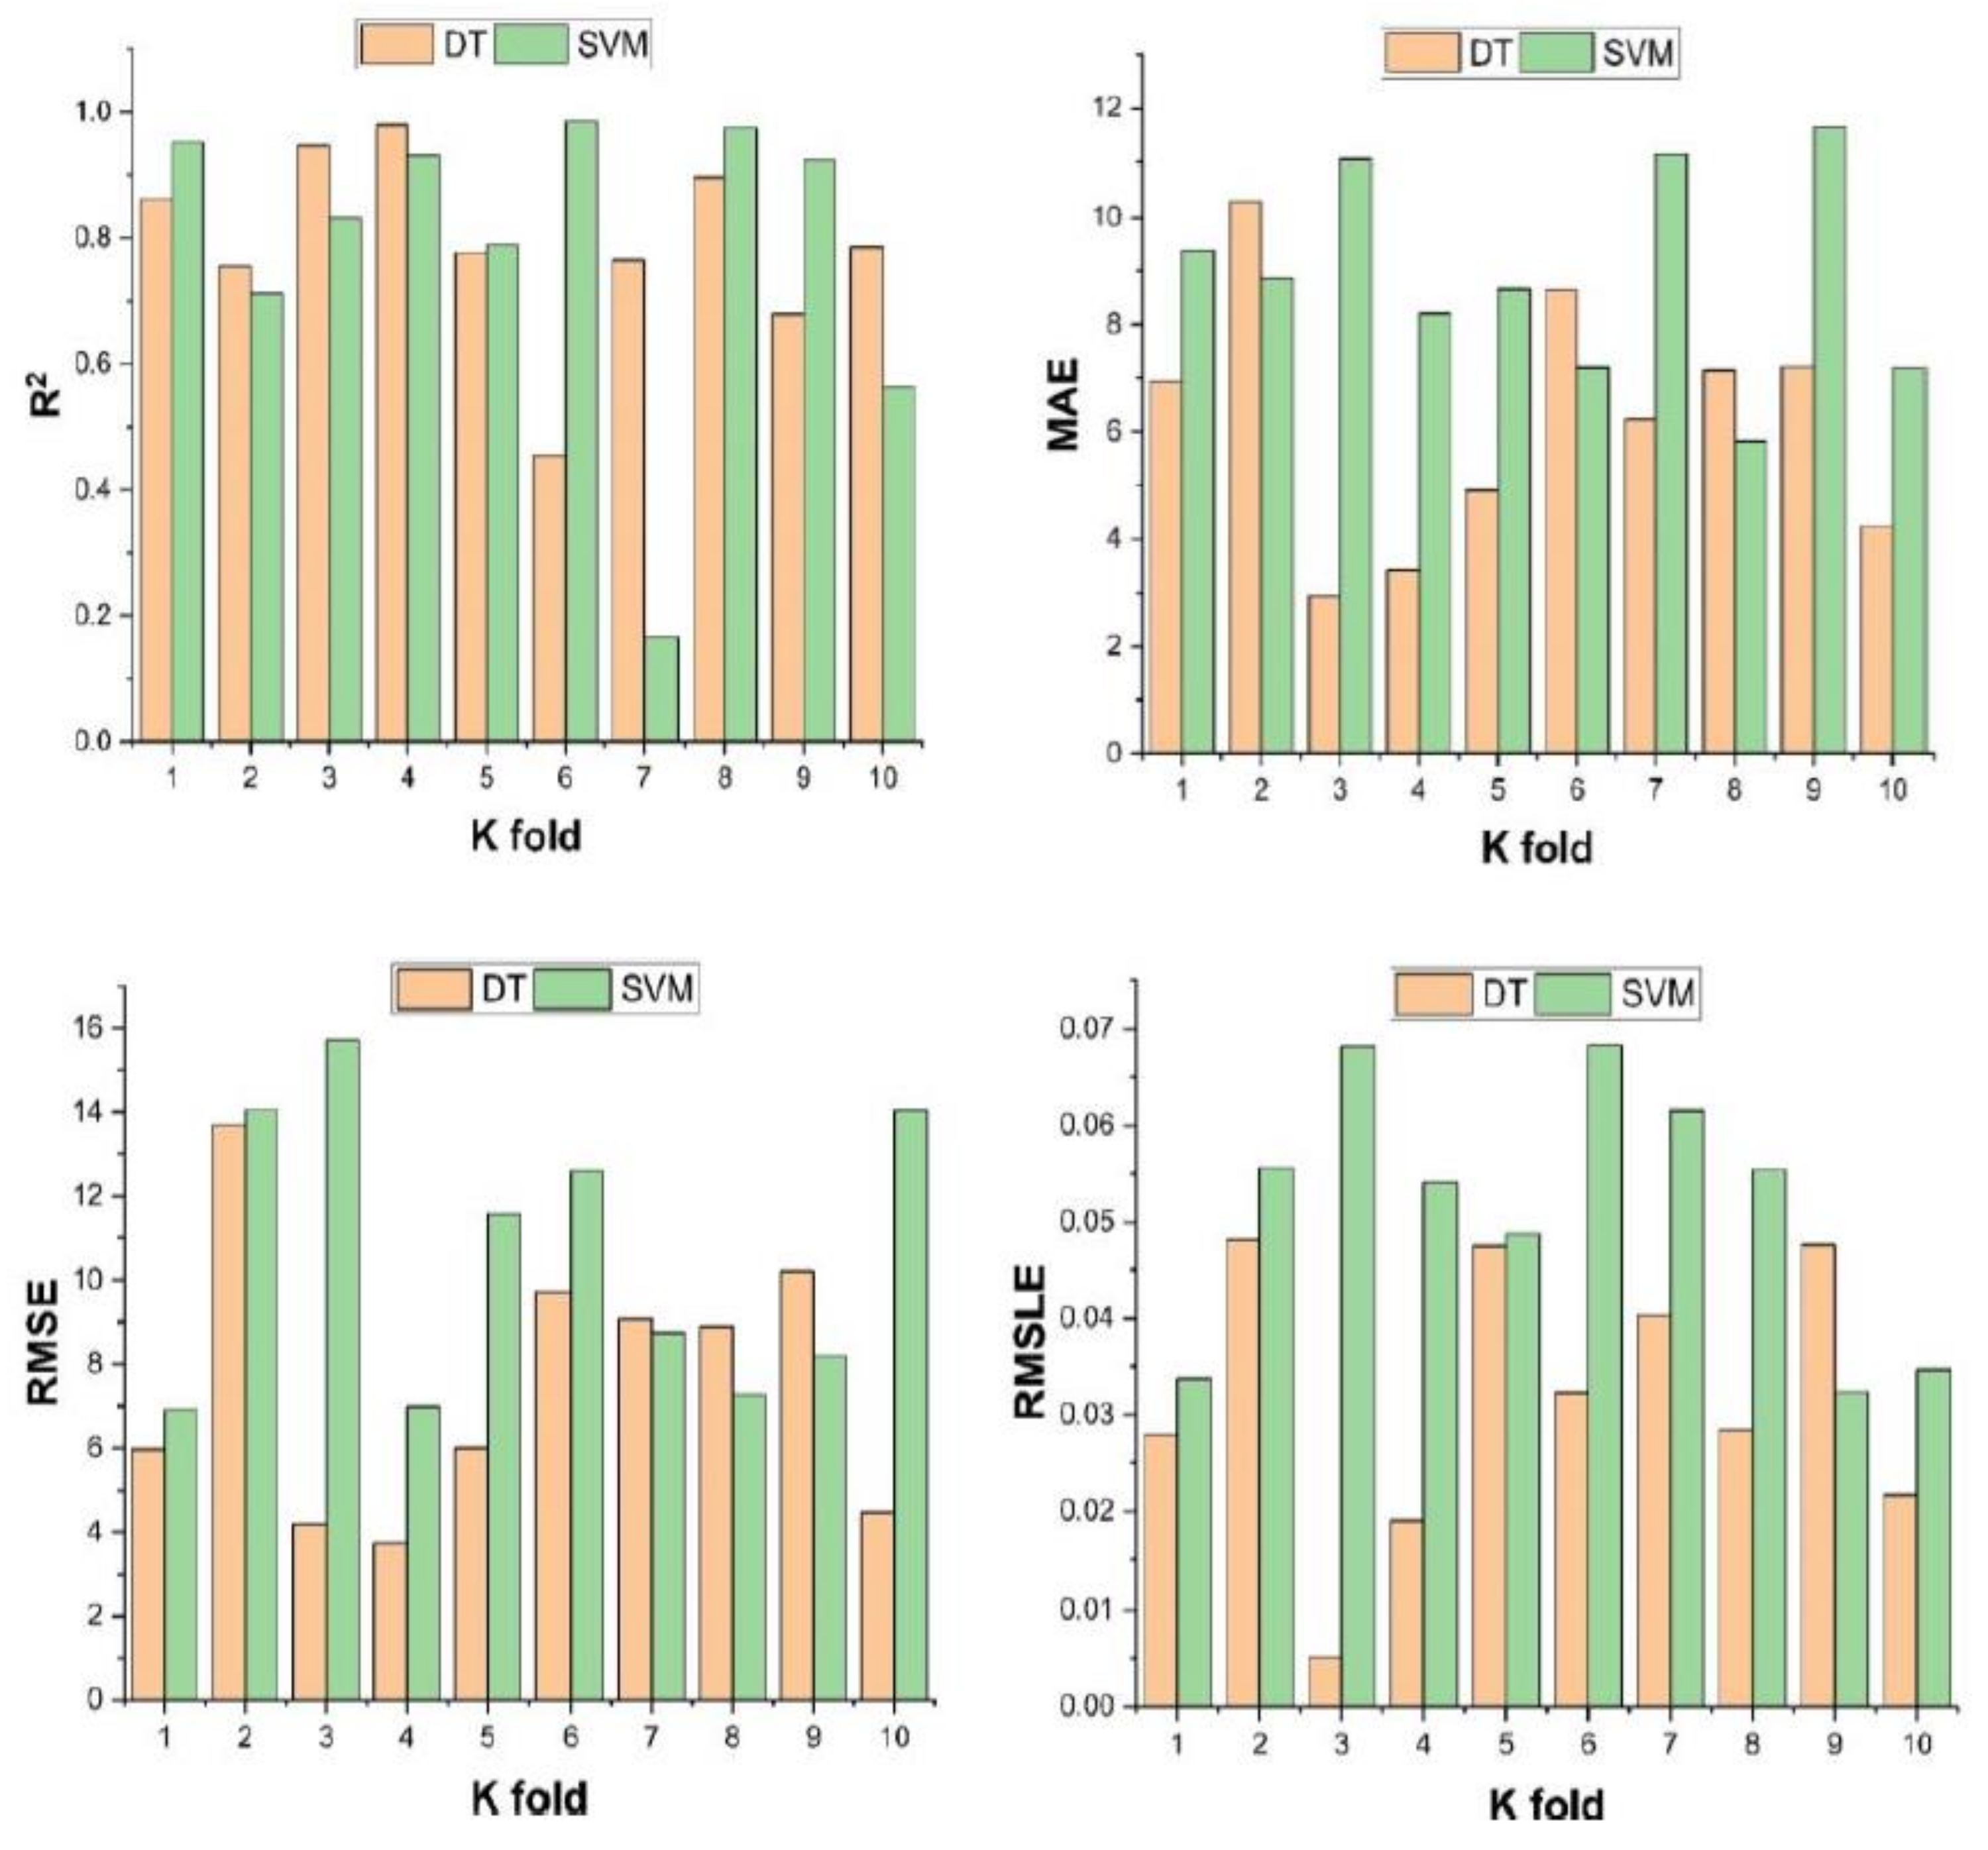
3.4. Cross-Validation
4. Conclusions
- The results of this study indicated that ensemble models have higher accuracy for the prediction of data than individual models.
- After a detailed study, it was observed that among the ensemble models, the DT model showed the most accurate result for compressive strength compared to SVM, with prediction accuracy of 94% for DT and 89% for SVM.
- Different researchers have utilized silica fume in concrete in different percentages to enhance the mechanical properties of concrete. The accurate expressions and models can efficiently increase the utilization of hazardous SF in the concrete on the industrial level in construction practices rather than accumulating it as industrial waste. The replacement of silica fume with cement and determining its optimum percentage in concrete will help promote sustainable development by reducing energy consumption, landfilling, and greenhouse gas emissions.
5. Limitations and Directions for Future Work
Author Contributions
Funding
Data Availability Statement
Conflicts of Interest
References
- Arrigoni, A.; Panesar, D.K.; Duhamel, M.; Opher, T.; Saxe, S.; Posen, I.D.; MacLean, H.L. Life cycle greenhouse gas emissions of concrete containing supplementary cementitious materials: Cut-off vs. substitution. J. Clean. Prod. 2020, 263, 121465. [Google Scholar] [CrossRef]
- Benhelal, E.; Zahedi, G.; Shamsaei, E.; Bahadori, A. Global strategies and potentials to curb CO2 emissions in cement industry. J. Clean. Prod. 2013, 51, 142–161. [Google Scholar] [CrossRef]
- Raheem, A.; Abdulwahab, R.; Kareem, M. Incorporation of metakaolin and nanosilica in blended cement mortar and concrete—A review. J. Clean. Prod. 2021, 290, 125852. [Google Scholar] [CrossRef]
- Farooq, F.; Akbar, A.; Khushnood, R.A.; Muhammad, W.L.B.; Rehman, S.K.U.; Javed, M.F. Experimental Investigation of Hybrid Carbon Nanotubes and Graphite Nanoplatelets on Rheology, Shrinkage, Mechanical, and Microstructure of SCCM. Materials 2020, 13, 230. [Google Scholar] [CrossRef] [Green Version]
- Akbar, A.; Farooq, F.; Shafique, M.; Aslam, F.; Alyousef, R.; Alabduljabbar, H. Sugarcane bagasse ash-based engineered geopolymer mortar incorporating propylene fibers. J. Build. Eng. 2021, 33, 101492. [Google Scholar] [CrossRef]
- Farooq, F.; Ahmed, W.; Akbar, A.; Aslam, F.; Alyousef, R. Predictive modeling for sustainable high-performance concrete from industrial wastes: A comparison and optimization of models using ensemble learners. J. Clean. Prod. 2021, 292, 126032. [Google Scholar] [CrossRef]
- Ali, M.; Abbas, S.; Salah, B.; Akhter, J.; Saleem, W.; Haruna, S.; Room, S.; Abdulkadir, I. Investigating Optimal Confinement Behaviour of Low-Strength Concrete through Quantitative and Analytical Approaches. Materials 2021, 14, 4675. [Google Scholar] [CrossRef]
- Kaish, A.; Odimegwu, T.C.; Zakaria, I.; Abood, M.M. Effects of different industrial waste materials as partial replacement of fine aggregate on strength and microstructure properties of concrete. J. Build. Eng. 2021, 35, 102092. [Google Scholar] [CrossRef]
- Panesar, D.K. Developments in the Formulation and Reinforcement of Concrete. In Waste and Supplementary Cementitious Materials in Concrete; Elsevier Science: Amsterdam, The Netherlands, 2018. [Google Scholar]
- Vishwakarma, V.; Ramachandran, D. Green Concrete mix using solid waste and nanoparticles as alternatives—A review. Constr. Build. Mater. 2018, 162, 96–103. [Google Scholar] [CrossRef]
- Golewski, G.L. Green concrete composite incorporating fly ash with high strength and fracture toughness. J. Clean. Prod. 2018, 172, 218–226. [Google Scholar] [CrossRef]
- Ren, C.; Wang, W.; Yao, Y.; Wu, S.; Yao, X. Complementary use of industrial solid wastes to produce green materials and their role in CO2 reduction. J. Clean. Prod. 2020, 252, 119840. [Google Scholar] [CrossRef]
- Bheel, N.; Ibrahim, M.H.W.; Adesina, A.; Kennedy, C.; Shar, I.A. Mechanical performance of concrete incorporating wheat straw ash as partial replacement of cement. J. Build. Pathol. Rehabil. 2021, 6, 4. [Google Scholar] [CrossRef]
- Paul, A.; Hussain, M. Sustainable Use of GGBS and RHA as a Partial Replacement of Cement in the Stabilization of Indian Peat. Int. J. Geosynth. Ground Eng. 2020, 6, 4. [Google Scholar] [CrossRef]
- Bheel, N.; Adesina, A. Influence of Binary Blend of Corn Cob Ash and Glass Powder as Partial Replacement of Cement in Concrete. Silicon 2021, 13, 1647–1654. [Google Scholar] [CrossRef]
- Garg, R. Effect of zinc oxide nanoparticles on mechanical properties of silica fume-based cement composites. Mater. Today Proc. 2021, 43, 778–783. [Google Scholar] [CrossRef]
- Mehta, A.; Ashish, D.K. Silica fume and waste glass in cement concrete production: A review. J. Build. Eng. 2020, 29, 100888. [Google Scholar] [CrossRef]
- Keerio, M.A.; Abbasi, S.A.; Kumar, A.; Bheel, N.; Rehaman, K.U.; Tashfeen, M. Effect of Silica Fume as Cementitious Material and Waste Glass as Fine Aggregate Replacement Constituent on Selected Properties of Concrete. Silicon 2020, 1–12. [Google Scholar] [CrossRef]
- Liu, T.; Nafees, A.; Khan, S.; Javed, M.F.; Aslam, F.; Alabduljabbar, H.; Xiong, J.-J.; Khan, M.I.; Malik, M. Comparative study of mechanical properties between irradiated and regular plastic waste as a replacement of cement and fine aggregate for manufacturing of green concrete. Ain Shams Eng. J. 2021. [Google Scholar] [CrossRef]
- Shahmansouri, A.A.; Yazdani, M.; Ghanbari, S.; Bengar, H.A.; Jafari, A.; Ghatte, H.F. Artificial neural network model to predict the compressive strength of eco-friendly geopolymer concrete incorporating silica fume and natural zeolite. J. Clean. Prod. 2021, 279, 123697. [Google Scholar] [CrossRef]
- Ali, M.; Room, S.; Khan, M.I.; Masood, F.; Memon, R.A.; Khan, R.; Memon, A.M. Assessment of local earthen bricks in perspective of physical and mechanical properties using Geographical Information System in Peshawar, Pakistan. Structures 2020, 28, 2549–2561. [Google Scholar] [CrossRef]
- Siddique, R.; Jameel, A.; Singh, M.; Barnat-Hunek, D.; Aït-Mokhtar, A.; Belarbi, R.; Rajor, A. Effect of bacteria on strength, permeation characteristics and micro-structure of silica fume concrete. Constr. Build. Mater. 2017, 142, 92–100. [Google Scholar] [CrossRef]
- Golafshani, E.M.; Behnood, A. Estimating the optimal mix design of silica fume concrete using biogeography-based programming. Cem. Concr. Compos. 2019, 96, 95–105. [Google Scholar] [CrossRef]
- Behnood, A.; Golafshani, E.M. Predicting the compressive strength of silica fume concrete using hybrid artificial neural network with multi-objective grey wolves. J. Clean. Prod. 2018, 202, 54–64. [Google Scholar] [CrossRef]
- Jena, S.; Panigrahi, R. Performance evaluation of sustainable geopolymer concrete produced from ferrochrome slag and silica fume. Eur. J. Environ. Civ. Eng. 2021, 1–17. [Google Scholar] [CrossRef]
- Guo, Z.; Jiang, T.; Zhang, J.; Kong, X.; Chen, C.; Lehman, D.E. Mechanical and durability properties of sustainable self-compacting concrete with recycled concrete aggregate and fly ash, slag and silica fume. Constr. Build. Mater. 2020, 231, 117115. [Google Scholar] [CrossRef]
- Sivakrishna, A.; Adesina, A.; Awoyera, P.; Kumar, K.R. Green concrete: A review of recent developments. Mater. Today Proc. 2020, 27, 54–58. [Google Scholar] [CrossRef]
- Barreto, E.D.S.; Stafanato, K.V.; Marvila, M.T.; de Azevedo, A.R.G.; Ali, M.; Pereira, R.M.L.; Monteiro, S.N. Clay Ceramic Waste as Pozzolan Constituent in Cement for Structural Concrete. Materials 2021, 14, 2917. [Google Scholar] [CrossRef]
- de Azevedo, A.R.; Marvila, M.T.; Ali, M.; Khan, M.I.; Masood, F.; Vieira, C.M.F. Effect of the addition and processing of glass polishing waste on the durability of geopolymeric mortars. Case Stud. Constr. Mater. 2021, 15, e00662. [Google Scholar] [CrossRef]
- Samad, S.; Shah, A. Role of binary cement including Supplementary Cementitious Material (SCM), in production of environmentally sustainable concrete: A critical review. Int. J. Sustain. Built Environ. 2017, 6, 663–674. [Google Scholar] [CrossRef]
- Qureshi, M.; Barbhuiya, S. Effects of Silica Fume on the Strength and Durability Properties of Concrete. Age 2016, 3, 28. [Google Scholar]
- Nafees, A.; Javed, M.F.; Musarat, M.A.; Ali, M.; Aslam, F.; Vatin, N.I. FE Modelling and Analysis of Beam Column Joint Using Reactive Powder Concrete. Crystals 2021, 11, 1372. [Google Scholar] [CrossRef]
- Burhan, L.; Ghafor, K.; Mohammed, A. Modeling the effect of silica fume on the compressive, tensile strengths and durability of NSC and HSC in various strength ranges. J. Build. Pathol. Rehabil. 2019, 4, 19. [Google Scholar] [CrossRef]
- Dao, D.V.; Ly, H.B.; Vu, H.L.; Le, T.T.; Pham, B.T. Investigation and Optimization of the C-ANN Structure in Predicting the Compressive Strength of Foamed Concrete. Materials 2020, 13, 1072. [Google Scholar] [CrossRef] [Green Version]
- Abu Yaman, M.; Elaty, M.A.; Taman, M. Predicting the ingredients of self compacting concrete using artificial neural network. Alex. Eng. J. 2017, 56, 523–532. [Google Scholar] [CrossRef]
- Amran, M.; Fediuk, R.; Vatin, N.; Huei Lee, Y.; Murali, G.; Ozbakkaloglu, T.; Klyuev, S.; Alabduljabber, H. Fibre-Reinforced Foamed Concretes: A Review. Materials 2020, 13, 4323. [Google Scholar] [CrossRef]
- Sun, J.; Zhang, J.; Gu, Y.; Huang, Y.; Sun, Y.; Ma, G. Prediction of permeability and unconfined compressive strength of pervious concrete using evolved support vector regression. Constr. Build. Mater. 2019, 207, 440–449. [Google Scholar] [CrossRef]
- Fediuk, R. High-strength fibrous concrete of Russian Far East natural materials. IOP Conference Series: Mater. Sci. Eng. 2016, 116, 012020. [Google Scholar] [CrossRef] [Green Version]
- Javed, M.F.; Amin, M.N.; Shah, M.I.; Khan, K.; Iftikhar, B.; Farooq, F.; Aslam, F.; Alyousef, R.; Alabduljabbar, H. Applications of Gene Expression Programming and Regression Techniques for Estimating Compressive Strength of Bagasse Ash based Concrete. Crystals 2020, 10, 737. [Google Scholar] [CrossRef]
- Khan, M.A.; Zafar, A.; Akbar, A.; Javed, M.; Mosavi, A. Application of Gene Expression Programming (GEP) for the Prediction of Compressive Strength of Geopolymer Concrete. Materials 2021, 14, 1106. [Google Scholar] [CrossRef]
- Khan, M.A.; Memon, S.A.; Farooq, F.; Javed, M.F.; Aslam, F.; Alyousef, R. Compressive Strength of Fly-Ash-Based Geopolymer Concrete by Gene Expression Programming and Random Forest. Adv. Civ. Eng. 2021, 2021, 6618407. [Google Scholar] [CrossRef]
- Gholampour, A.; Gandomi, A.; Ozbakkaloglu, T. New formulations for mechanical properties of recycled aggregate concrete using gene expression programming. Constr. Build. Mater. 2017, 130, 122–145. [Google Scholar] [CrossRef]
- Deng, F.; He, Y.; Zhou, S.; Yu, Y.; Cheng, H.; Wu, X. Compressive strength prediction of recycled concrete based on deep learning. Constr. Build. Mater. 2018, 175, 562–569. [Google Scholar] [CrossRef]
- Jang, K.; Kim, N.; An, Y.-K. Deep learning–based autonomous concrete crack evaluation through hybrid image scanning. Struct. Health Monit. 2018, 18, 1722–1737. [Google Scholar] [CrossRef]
- Liang, X. Image-based post-disaster inspection of reinforced concrete bridge systems using deep learning with Bayesian optimization. Comput. Civ. Infrastruct. Eng. 2018, 34, 415–430. [Google Scholar] [CrossRef]
- Ling, H.; Qian, C.X.; Kang, W.C.; Liang, C.Y.; Chen, H.C. Machine and K-Fold cross validation to predict compressive strength of concrete in marine environment. Constr. Build. Mater. 2019, 206, 355–363. [Google Scholar] [CrossRef]
- Motamedi, S.; Shamshirband, S.; Hashim, R.; Petković, D.; Roy, C. RETRACTED: Estimating unconfined compressive strength of cockle shell–cement–sand mixtures using soft computing methodologies. Eng. Struct. 2015, 98, 49–58. [Google Scholar] [CrossRef]
- Chithra, S.; Kumar, S.S.; Chinnaraju, K.; Ashmita, F.A. A comparative study on the compressive strength prediction models for High Performance Concrete containing nano silica and copper slag using regression analysis and Artificial Neural Networks. Constr. Build. Mater. 2016, 114, 528–535. [Google Scholar] [CrossRef]
- Tanyildizi, H. Prediction of the Strength Properties of Carbon Fiber-Reinforced Lightweight Concrete Exposed to the High Temperature Using Artificial Neural Network and Support Vector Machine. Adv. Civ. Eng. 2018, 2018, 5140610. [Google Scholar] [CrossRef] [Green Version]
- Naderpour, H.; Rafiean, A.H.; Fakharian, P. Compressive strength prediction of environmentally friendly concrete using artificial neural networks. J. Build. Eng. 2018, 16, 213–219. [Google Scholar] [CrossRef]
- Güçlüer, K.; Özbeyaz, A.; Göymen, S.; Günaydın, O. A comparative investigation using machine learning methods for concrete compressive strength estimation. Mater. Today Commun. 2021, 27, 102278. [Google Scholar] [CrossRef]
- Awoyera, P.O.; Kirgiz, M.S.; Viloria, A.; Ovallos-Gazabon, D. Estimating strength properties of geopolymer self-compacting concrete using machine learning techniques. J. Mater. Res. Technol. 2020, 9, 9016–9028. [Google Scholar] [CrossRef]
- Ziolkowski, P.; Niedostatkiewicz, M. Machine Learning Techniques in Concrete Mix Design. Materials 2019, 12, 1256. [Google Scholar] [CrossRef] [PubMed] [Green Version]
- Sun, Y.; Li, G.; Zhang, N.; Chang, Q.; Xu, J.; Zhang, J. Development of ensemble learning models to evaluate the strength of coal-grout materials. Int. J. Min. Sci. Technol. 2021, 31, 153–162. [Google Scholar] [CrossRef]
- Ahmad, A.; Ostrowski, K.; Maślak, M.; Farooq, F.; Mehmood, I.; Nafees, A. Comparative Study of Supervised Machine Learning Algorithms for Predicting the Compressive Strength of Concrete at High Temperature. Materials 2021, 14, 4222. [Google Scholar] [CrossRef] [PubMed]
- Farooq, F.; Amin, M.N.; Khan, K.; Sadiq, M.R.; Javed, M.F.F.; Aslam, F.; Alyousef, R. A Comparative Study of Random Forest and Genetic Engineering Programming for the Prediction of Compressive Strength of High Strength Concrete (HSC). Appl. Sci. 2020, 10, 7330. [Google Scholar] [CrossRef]
- Ahmad, A.; Farooq, F.; Niewiadomski, P.; Ostrowski, K.; Akbar, A.; Aslam, F.; Alyousef, R. Prediction of Compressive Strength of Fly Ash Based Concrete Using Individual and Ensemble Algorithm. Materials 2021, 14, 794. [Google Scholar] [CrossRef] [PubMed]
- Chen, W.; Hong, H.; Li, S.; Shahabi, H.; Wang, Y.; Wang, X.; Bin Ahmad, B. Flood susceptibility modelling using novel hybrid approach of reduced-error pruning trees with bagging and random subspace ensembles. J. Hydrol. 2019, 575, 864–873. [Google Scholar] [CrossRef]
- Omran, B.A.; Chen, Q.; Jin, R. Comparison of Data Mining Techniques for Predicting Compressive Strength of Environmentally Friendly Concrete. J. Comput. Civ. Eng. 2016, 30, 04016029. [Google Scholar] [CrossRef] [Green Version]
- Chopra, P.; Sharma, R.K.; Kumar, M.; Chopra, T. Comparison of Machine Learning Techniques for the Prediction of Compressive Strength of Concrete. Adv. Civ. Eng. 2018, 2018, 1–9. [Google Scholar] [CrossRef] [Green Version]
- Dalvand, A.; Sharbatdar, M.K.; Kheyroddin, A.; Nikui, A. Assessment of statistical variations in experimental impact resistance and mechanical properties of silica fume concrete. Sci. Iran. 2014, 21, 1577–1590. [Google Scholar]
- Bhanja, S.; Sengupta, B. Investigations on the compressive strength of silica fume concrete using statistical methods. Cem. Concr. Res. 2002, 32, 1391–1394. [Google Scholar] [CrossRef]
- Giner, V.; Ivorra, S.; Baeza, F.J.; Zornoza, E.; Ferrer, B. Silica fume admixture effect on the dynamic properties of concrete. Constr. Build. Mater. 2011, 25, 3272–3277. [Google Scholar] [CrossRef]
- Behnood, A.; Verian, K.P.; Modiri-Gharehveran, M. Evaluation of the splitting tensile strength in plain and steel fiber-reinforced concrete based on the compressive strength. Constr. Build. Mater. 2015, 98, 519–529. [Google Scholar] [CrossRef]
- Khan, M.I.; Siddique, R. Utilization of silica fume in concrete: Review of durability properties. Resour. Conserv. Recycl. 2011, 57, 30–35. [Google Scholar] [CrossRef]
- Abdelgader, H.S.; El-Baden, A.S. Effect of Silica Fume on two-stage Concrete Strength. In Proceedings of the IOP Conference Series: Materials Science and Engineering, Riga, Latvia, 30 September–2 October 2015; IOP Publishing: Bristol, UK, 2015; Volume 96, p. 012043. [Google Scholar]
- Esmailpour, M.; Rahmani, K.; Piroti, S. Experimental Evaluation of the Effect of Silica Fume on Compressive, Tensile Strength, Abrasion Resistance, Slump and Impact Test and Water Permability Coefficient of Concrete. J. Appl. Eng. Sci. 2018, 8, 27–36. [Google Scholar] [CrossRef] [Green Version]
- Alexander, M.; Magee, B. Durability performance of concrete containing condensed silica fume. Cem. Concr. Res. 1999, 29, 917–922. [Google Scholar] [CrossRef]
- Almusallam, A.A.; Beshr, H.; Maslehuddin, M.; Al-Amoudi, O.S. Effect of silica fume on the mechanical properties of low quality coarse aggregate concrete. Cem. Concr. Compos. 2004, 26, 891–900. [Google Scholar] [CrossRef]
- Behnood, A.; Ziari, H. Effects of silica fume addition and water to cement ratio on the properties of high-strength concrete after exposure to high temperatures. Cem. Concr. Compos. 2008, 30, 106–112. [Google Scholar] [CrossRef]
- Nili, M.; Afroughsabet, V. Afroughsabet, Combined effect of silica fume and steel fibers on the impact resistance and mechanical properties of concrete. Int. J. Impact Eng. 2010, 37, 879–886. [Google Scholar] [CrossRef] [Green Version]
- Dotto, J.; Abreu, A.; Molin, D.D.; Müller, I. Influence of silica fume addition on concretes physical properties and on corrosion behaviour of reinforcement bars. Cem. Concr. Compos. 2004, 26, 31–39. [Google Scholar] [CrossRef]
- Duval, R.; Kadri, E. Influence of Silica Fume on the Workability and the Compressive Strength of High-Performance Concretes. Cem. Concr. Res. 1998, 28, 533–547. [Google Scholar] [CrossRef]
- Khedr, S.A.; Idriss, A.F. Idriss, Resistance of silica-fume concrete to corrosion-related damage. J. Mater. Civ. Eng. 1995, 7, 102–107. [Google Scholar] [CrossRef]
- Gandomi, A.H.; Roke, D.A. Assessment of artificial neural network and genetic programming as predictive tools. Adv. Eng. Softw. 2015, 88, 63–72. [Google Scholar] [CrossRef]
- Getahun, M.A.; Shitote, S.M.; Gariy, Z.C.A. Artificial neural network based modelling approach for strength prediction of concrete incorporating agricultural and construction wastes. Constr. Build. Mater. 2018, 190, 517–525. [Google Scholar] [CrossRef]
- Tsanas, A.; Xifara, A. Accurate quantitative estimation of energy performance of residential buildings using statistical machine learning tools. Energy Build. 2012, 49, 560–567. [Google Scholar] [CrossRef]
- Xu, Y.; Ahmad, W.; Ahmad, A.; Ostrowski, K.A.; Dudek, M.; Aslam, F.; Joyklad, P. Computation of High-Performance Concrete Compressive Strength Using Standalone and Ensembled Machine Learning Techniques. Materials 2021, 14, 7034. [Google Scholar] [CrossRef] [PubMed]
- Bai, C.; Nguyen, H.; Asteris, P.G.; Nguyen-Thoi, T.; Zhou, J. A refreshing view of soft computing models for predicting the deflection of reinforced concrete beams. Appl. Soft Comput. 2020, 97, 106831. [Google Scholar] [CrossRef]


| S.No | Algorithm Name | Notation | Dataset | Prediction Properties | Year | Waste Material Used | References |
|---|---|---|---|---|---|---|---|
| 1 | Artificial neural network | ANN | 300 | Compressive strength | 2009 | FA | [59] |
| 2 | Artificial neural network | ANN | 80 | Compressive strength | 2011 | FA | [60] |
| 3 | Artificial neural network | ANN | 169 | Compressive strength | 2016 | FA GGBFS SF RHA | [61] |
| 4 | Artificial neural network | ANN | 69 | Compressive strength | 2017 | FA | [34] |
| 5 | Artificial neural network | ANN | 114 | Compressive strength | 2017 | FA | [62] |
| 6 | Adaptive neuro fuzzy inference system | ANFIS | 55 | Compressive strength | 2018 | - | [63] |
| 7 | Random Kitchen Sink Algorithm | RKSA | 40 | V-funnel test J-ring test Slump test Compressive strength | 2018 | FA | [64] |
| 8 | Multivariate adaptive regression spline | M5 MARS | 114 | Compressive strength Slump test L-box test V-funnel test | 2018 | FA | [65] |
| 9 | Artificial neural network | ANN | 205 | Compressive strength | 2019 | FA GGBFS SF RHA | [66] |
| 10 | Random forest | RF | 131 | Compressive strength | 2019 | FA GGBFS SF | [67] |
| 11 | Intelligent rule-based enhanced multiclass support vector machine and fuzzy rules | IREMSVM-FR with RSM | 114 | Compressive strength | 2019 | FA | [68] |
| 12 | Support vector machine | SVM | - | Compressive strength | 2020 | FA | [69] |
| 13 | Multivariate | MV | 21 | Compressive strength | 2020 | Crumb rubber with SF | [70] |
| 14 | Biogeographical-based programming | BBP | 413 | Elastic modulus | SF FA SLAG | [71] | |
| 15 | Support vector machine | SVM | 115 | Slump test L-box test V-funnel test Compressive strength | 2020 | FA | [72] |
| 16 | Adaptive neuro fuzzy inference system | ANFIS with ANN | 7 | Compressive strength | 2020 | POFA | [73] |
| 17 | Data Envelopment Analysis | DEA | 114 | Compressive strength Slump test L-box test V-funnel test | 2021 | FA | [74] |
| Parameters | Abbreviation | Minimum | Maximum |
|---|---|---|---|
| Input Variables | |||
| Binder | C | 224 | 600 |
| Fine aggregate | FA | 184.6 | 1170 |
| Coarse aggregate | CA | 702 | 1430 |
| Water | W | 135 | 313.9 |
| Silica Fume | SF | 0 | 150 |
| Superplasticizer | SP | 0 | 43 |
| Output Variable | |||
| Compressive strength | fc’ | 5.66 | 95.9 |
| Assessment Criteria | Range | Accurate Model |
|---|---|---|
| MAE | (0, ∞) | the smaller the better |
| RMSE | (0, ∞) | the smaller the better |
| MSLE | (0, ∞) | the smaller the better |
| R2 value | (0,1) | the bigger the better |
| Approaches Employed | Output Parameter | Machine Learning Methods | Ensemble Models | Optimum Estimator | R Value |
|---|---|---|---|---|---|
| Individual algorithms | Compressive Strength | Decision tree | - | - | 0.85 |
| Support vector machine | - | - | 0.88 | ||
| Ensemble boosting | Compressive strength | Decision tree—Adaboost | (10, 20, 30, …, 200) | 70 | 0.94 |
| Support vector machine—Adaboost | (10, 20, 30, …, 200) | 20 | 0.89 |
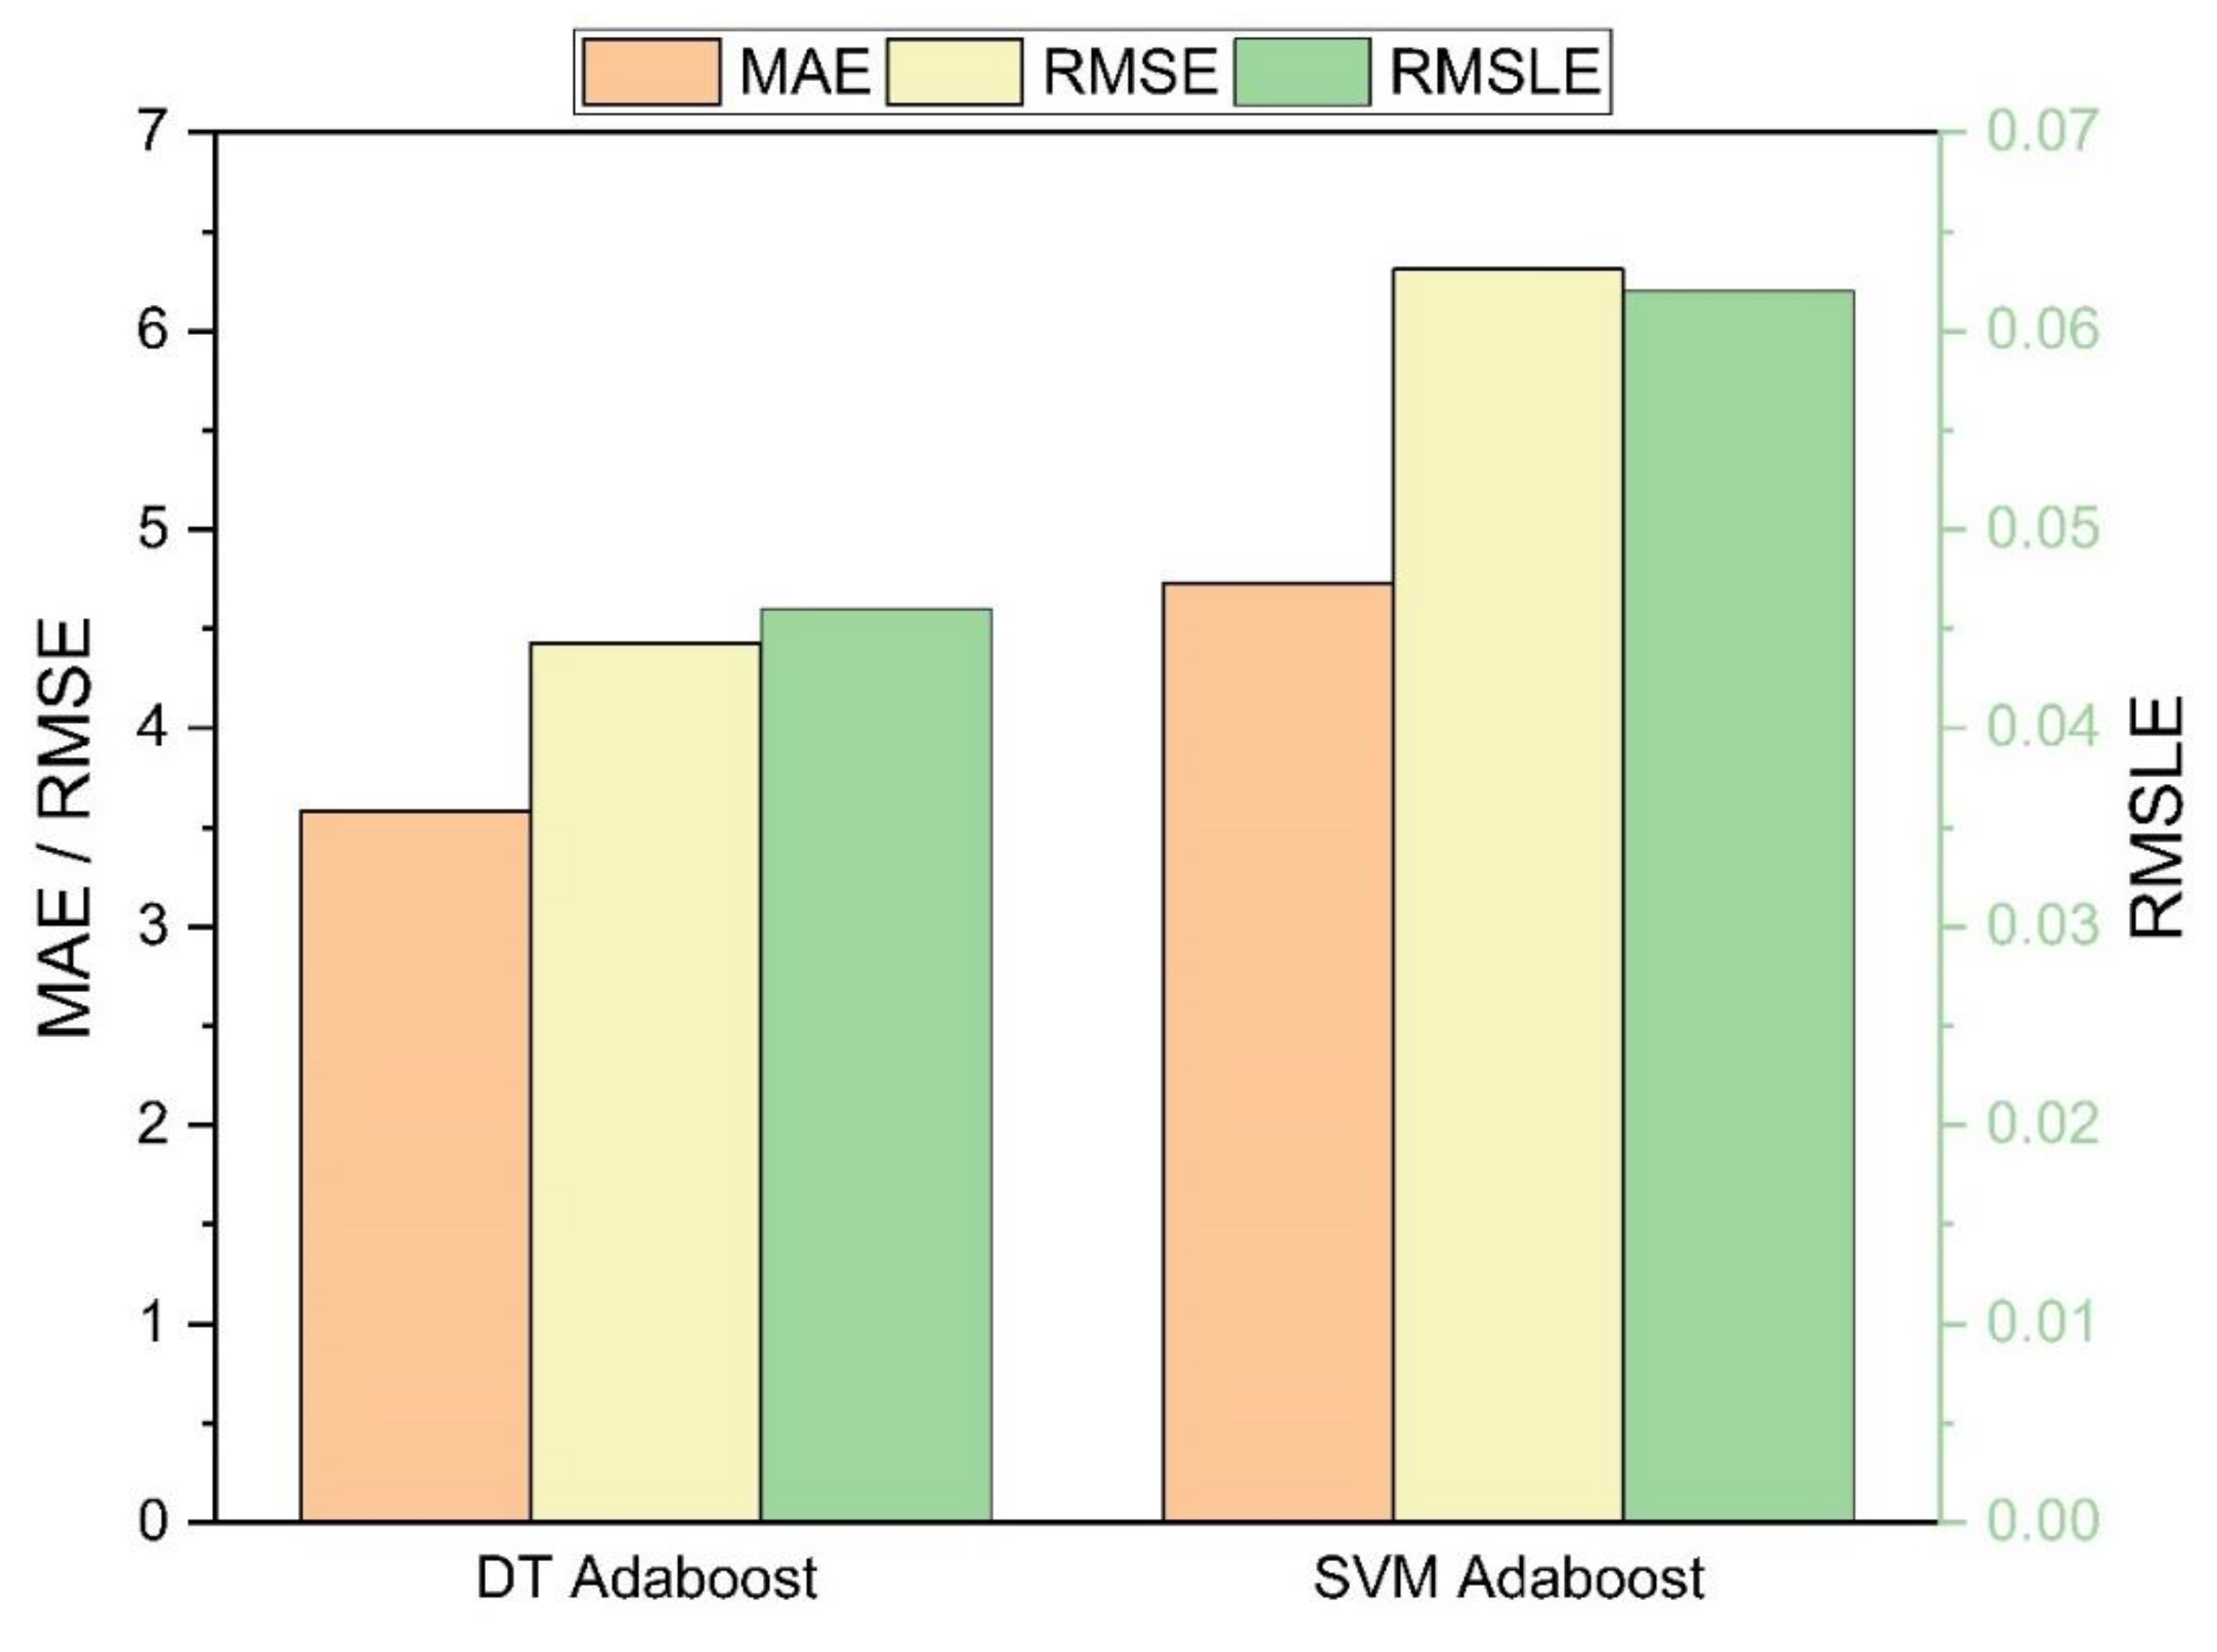
| Models | MAE | RMSE | RMSLE | R2 Value |
|---|---|---|---|---|
| Decision Tree Values | ||||
| Compressive strength | 3.58 | 4.43 | 0.046 | 0.94 |
| SVM | ||||
| Compressive strength | 4.73 | 6.31 | 0.062 | 0.89 |
Publisher’s Note: MDPI stays neutral with regard to jurisdictional claims in published maps and institutional affiliations. |
© 2021 by the authors. Licensee MDPI, Basel, Switzerland. This article is an open access article distributed under the terms and conditions of the Creative Commons Attribution (CC BY) license (https://creativecommons.org/licenses/by/4.0/).
Share and Cite
Nafees, A.; Amin, M.N.; Khan, K.; Nazir, K.; Ali, M.; Javed, M.F.; Aslam, F.; Musarat, M.A.; Vatin, N.I. Modeling of Mechanical Properties of Silica Fume-Based Green Concrete Using Machine Learning Techniques. Polymers 2022, 14, 30. https://doi.org/10.3390/polym14010030
Nafees A, Amin MN, Khan K, Nazir K, Ali M, Javed MF, Aslam F, Musarat MA, Vatin NI. Modeling of Mechanical Properties of Silica Fume-Based Green Concrete Using Machine Learning Techniques. Polymers. 2022; 14(1):30. https://doi.org/10.3390/polym14010030
Chicago/Turabian StyleNafees, Afnan, Muhammad Nasir Amin, Kaffayatullah Khan, Kashif Nazir, Mujahid Ali, Muhammad Faisal Javed, Fahid Aslam, Muhammad Ali Musarat, and Nikolai Ivanovich Vatin. 2022. "Modeling of Mechanical Properties of Silica Fume-Based Green Concrete Using Machine Learning Techniques" Polymers 14, no. 1: 30. https://doi.org/10.3390/polym14010030
APA StyleNafees, A., Amin, M. N., Khan, K., Nazir, K., Ali, M., Javed, M. F., Aslam, F., Musarat, M. A., & Vatin, N. I. (2022). Modeling of Mechanical Properties of Silica Fume-Based Green Concrete Using Machine Learning Techniques. Polymers, 14(1), 30. https://doi.org/10.3390/polym14010030