
Influence of Gamma Irradiation on Electric Cables Models: Study of Additive Effects by Mid-Infrared Spectroscopy

 , ,
, , 
Abstract
1. Introduction
2. Materials and Methods
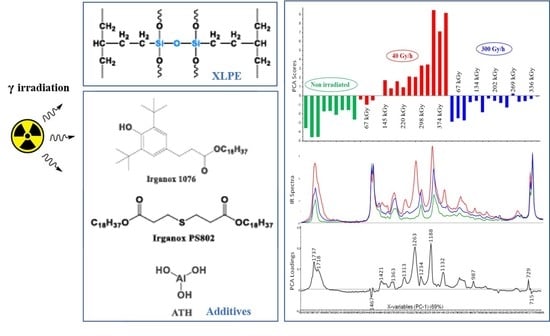
2.1. Samples
2.2. Mid-Infrared Spectroscopy
2.3. Differential Scanning Calorimetry (DSC) under O2 (Oxidative Induction Time (OIT) Measurements)
2.4. Irradiation
2.5. Chemometrics
2.5.1. Curve Resolution Method (SIMPLISMA)
2.5.2. Principal Component Analysis (PCA)
2.5.3. Data Treatments
2.5.4. Software
3. Results
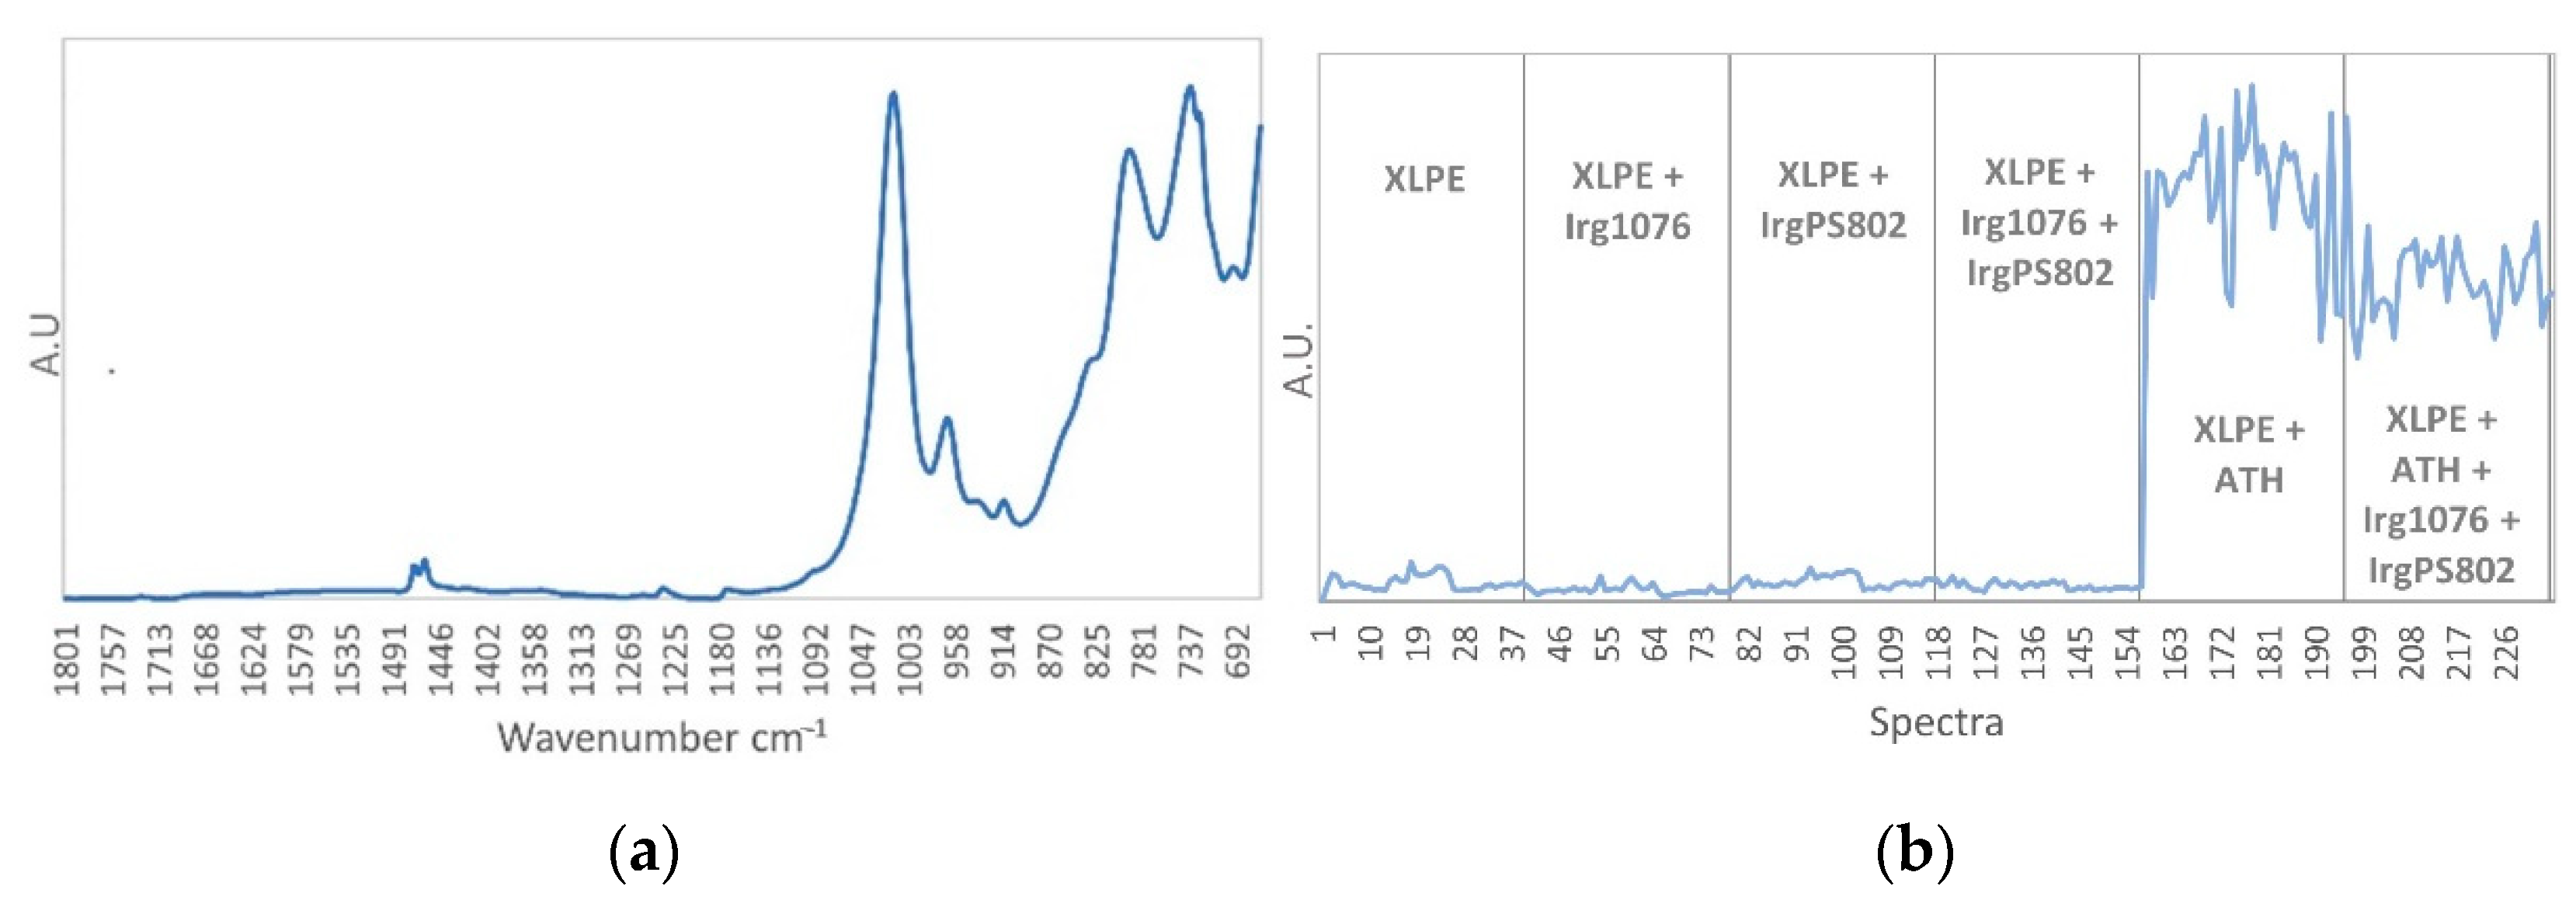
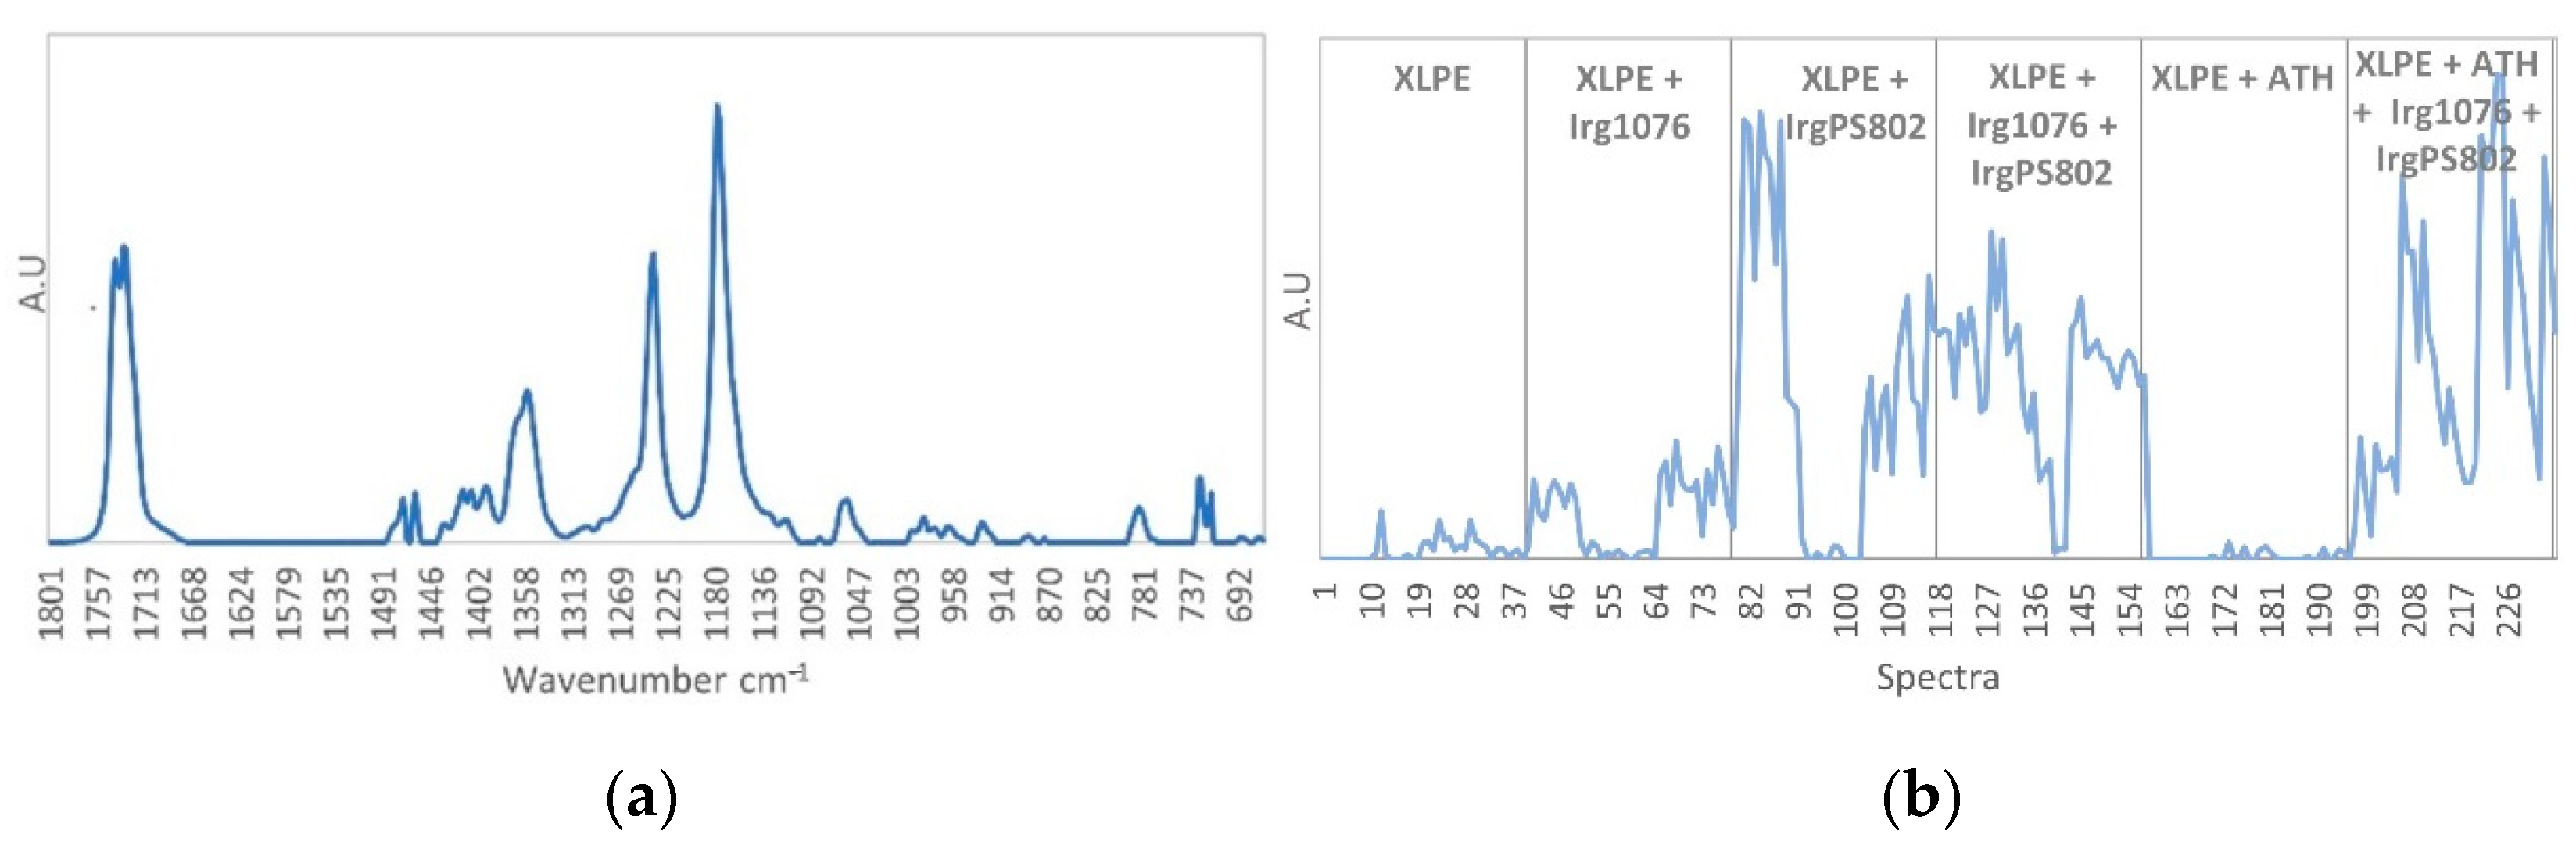
3.1. Characterization of Unaged Samples by Mid-Infrared Spectroscopy Subsection
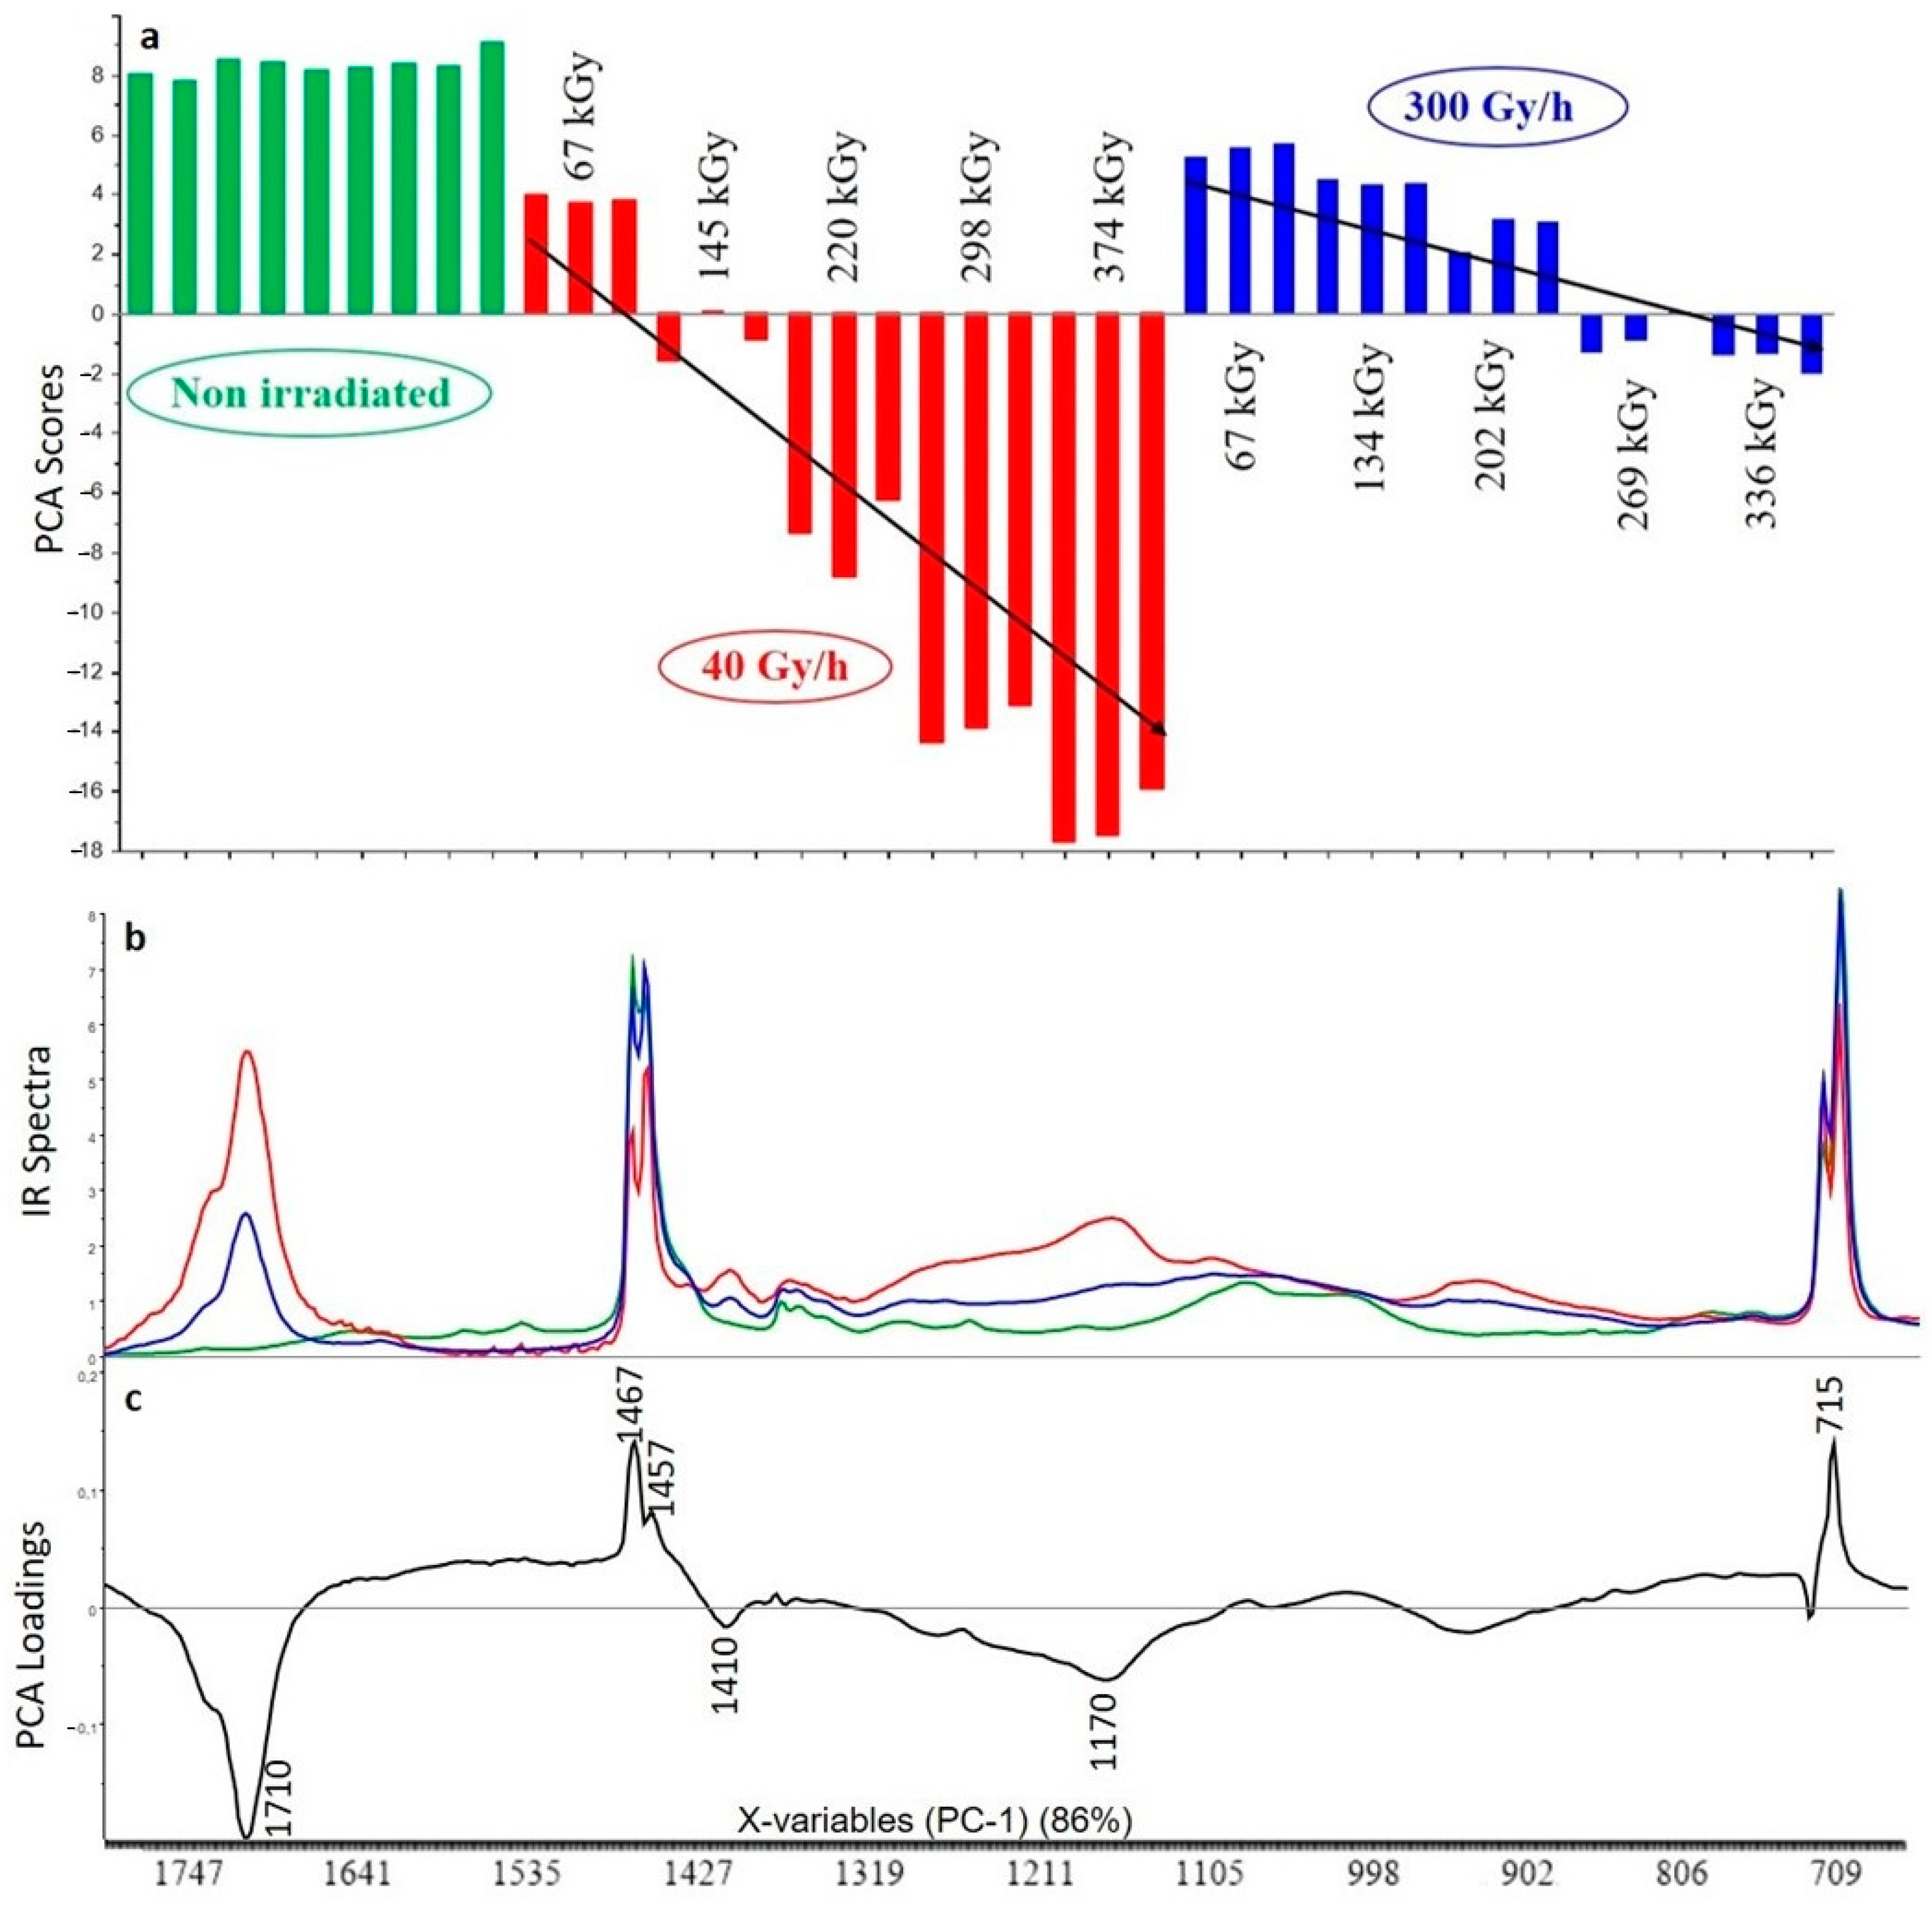
3.2. Principal Component Analysis (PCA) on Fourier Transform Infrared (FTIR) Spectra Impact of Irradiation
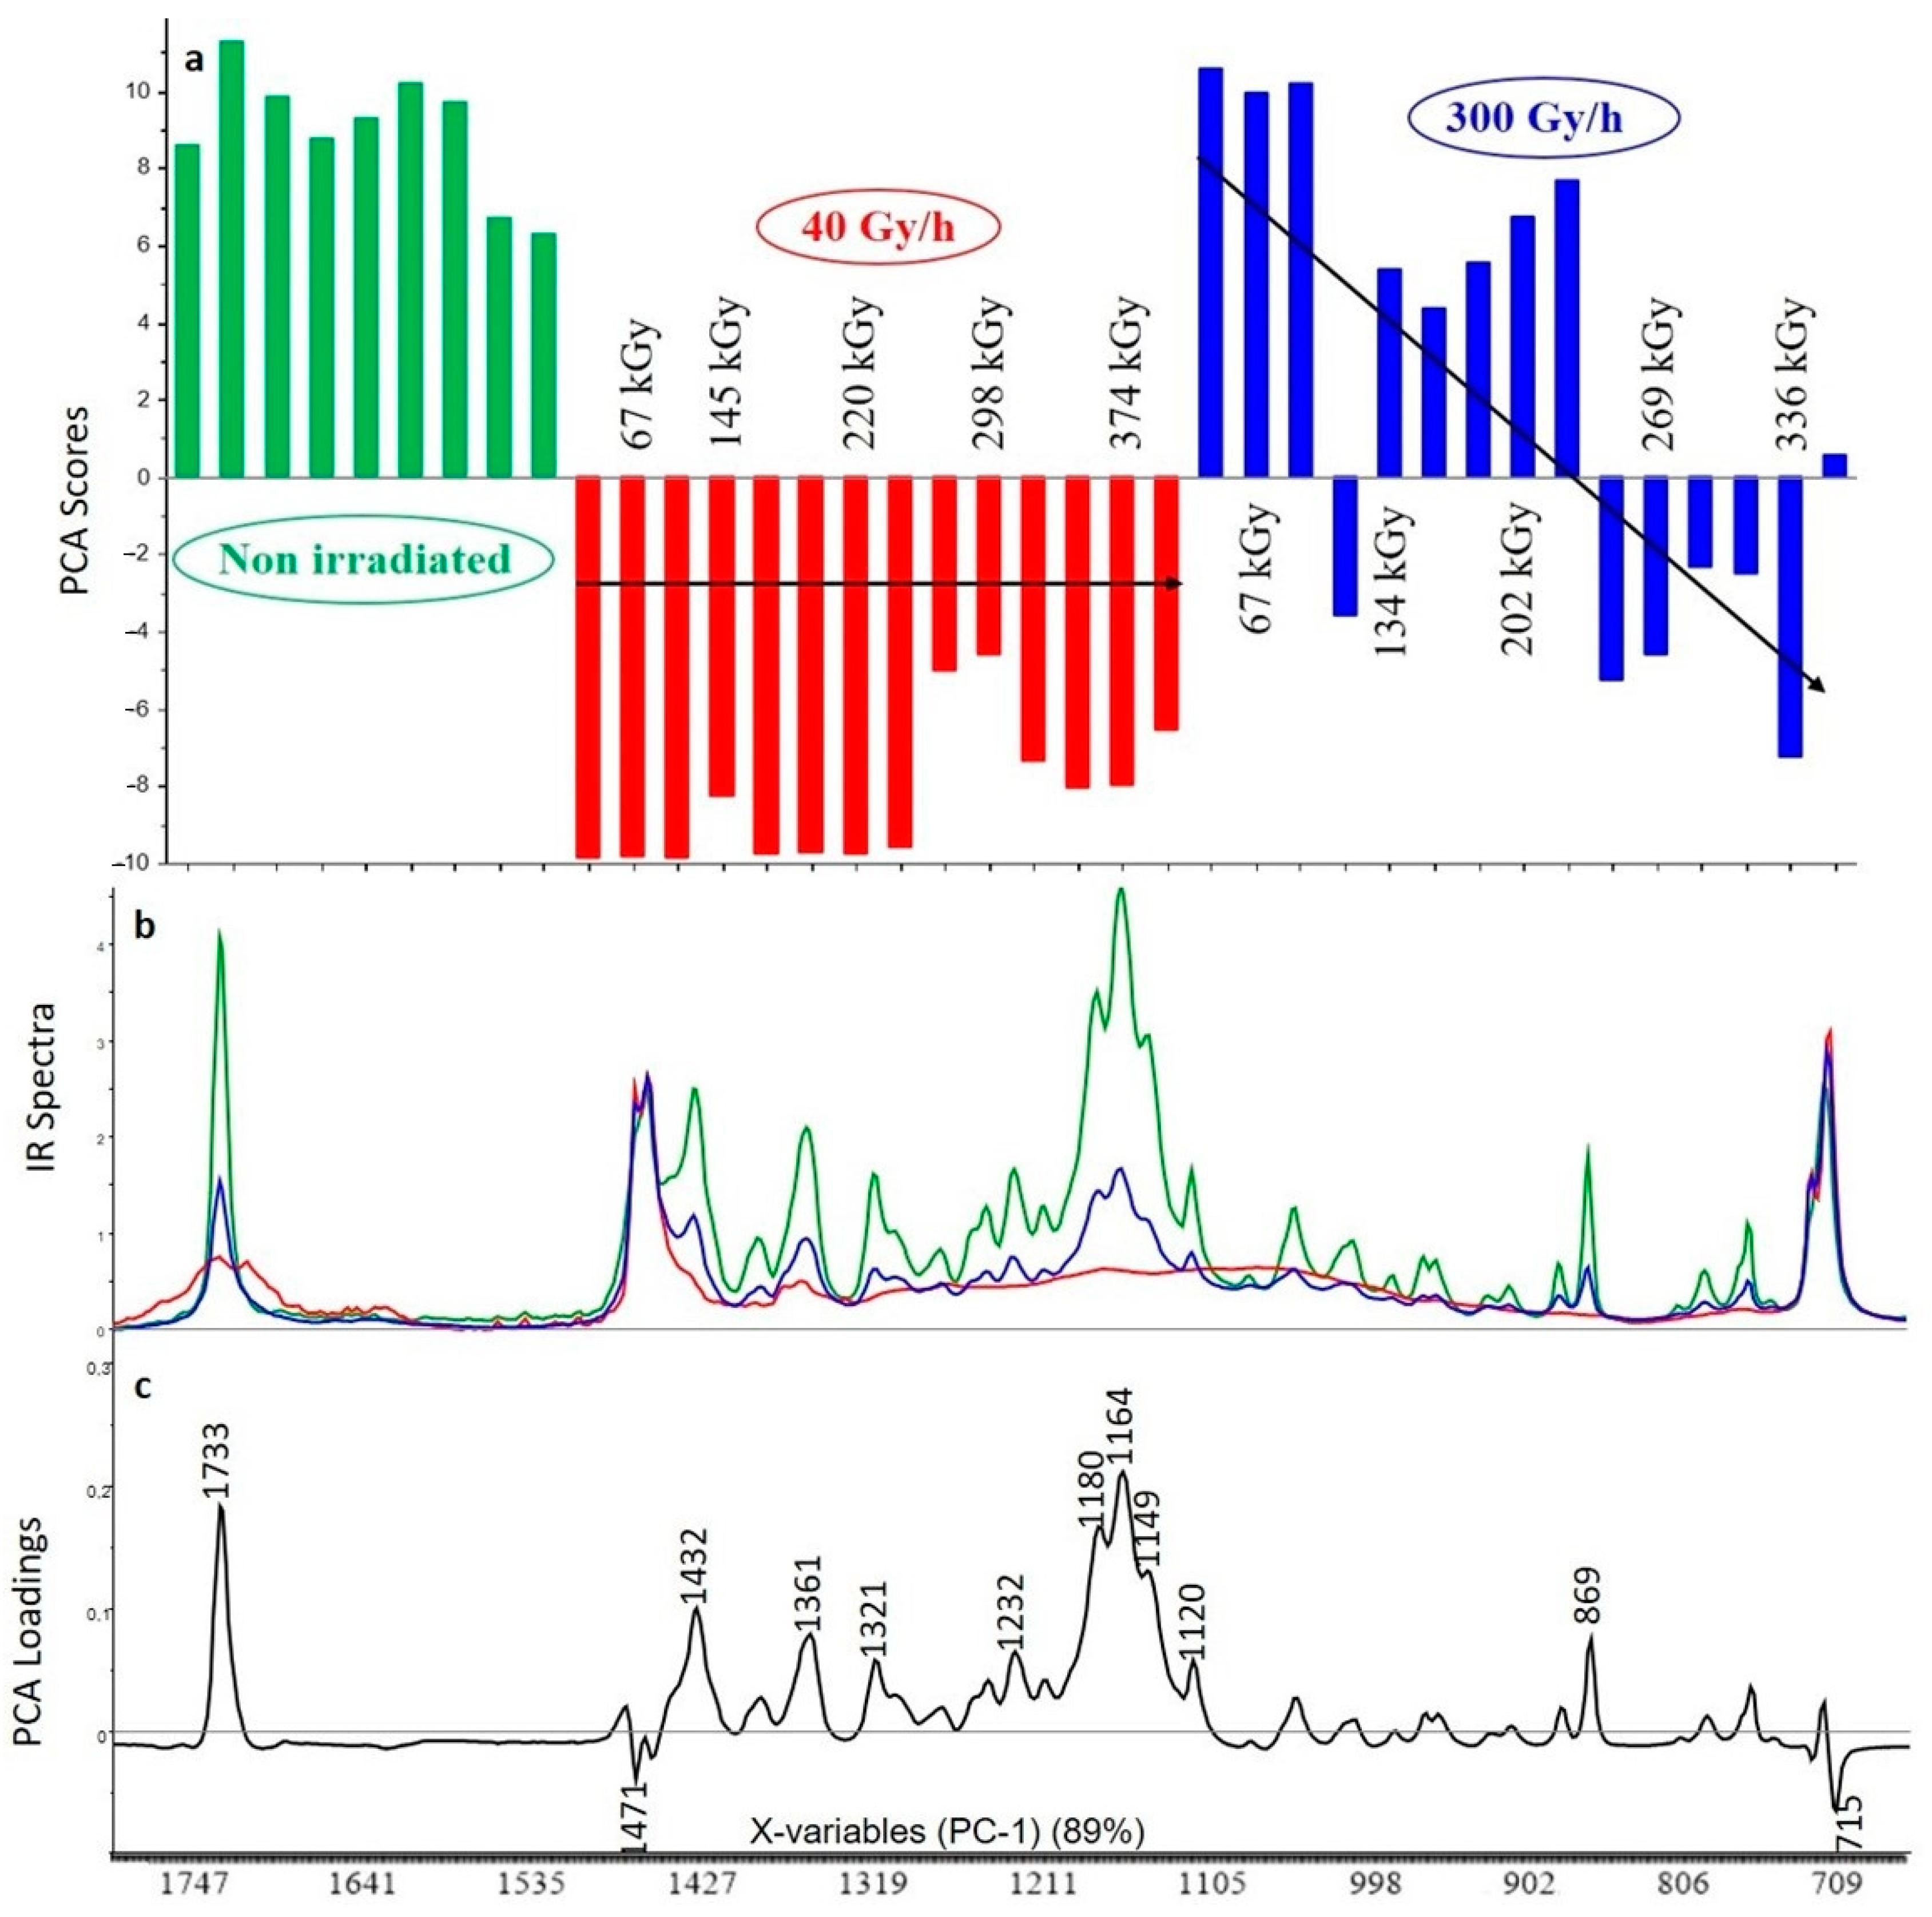
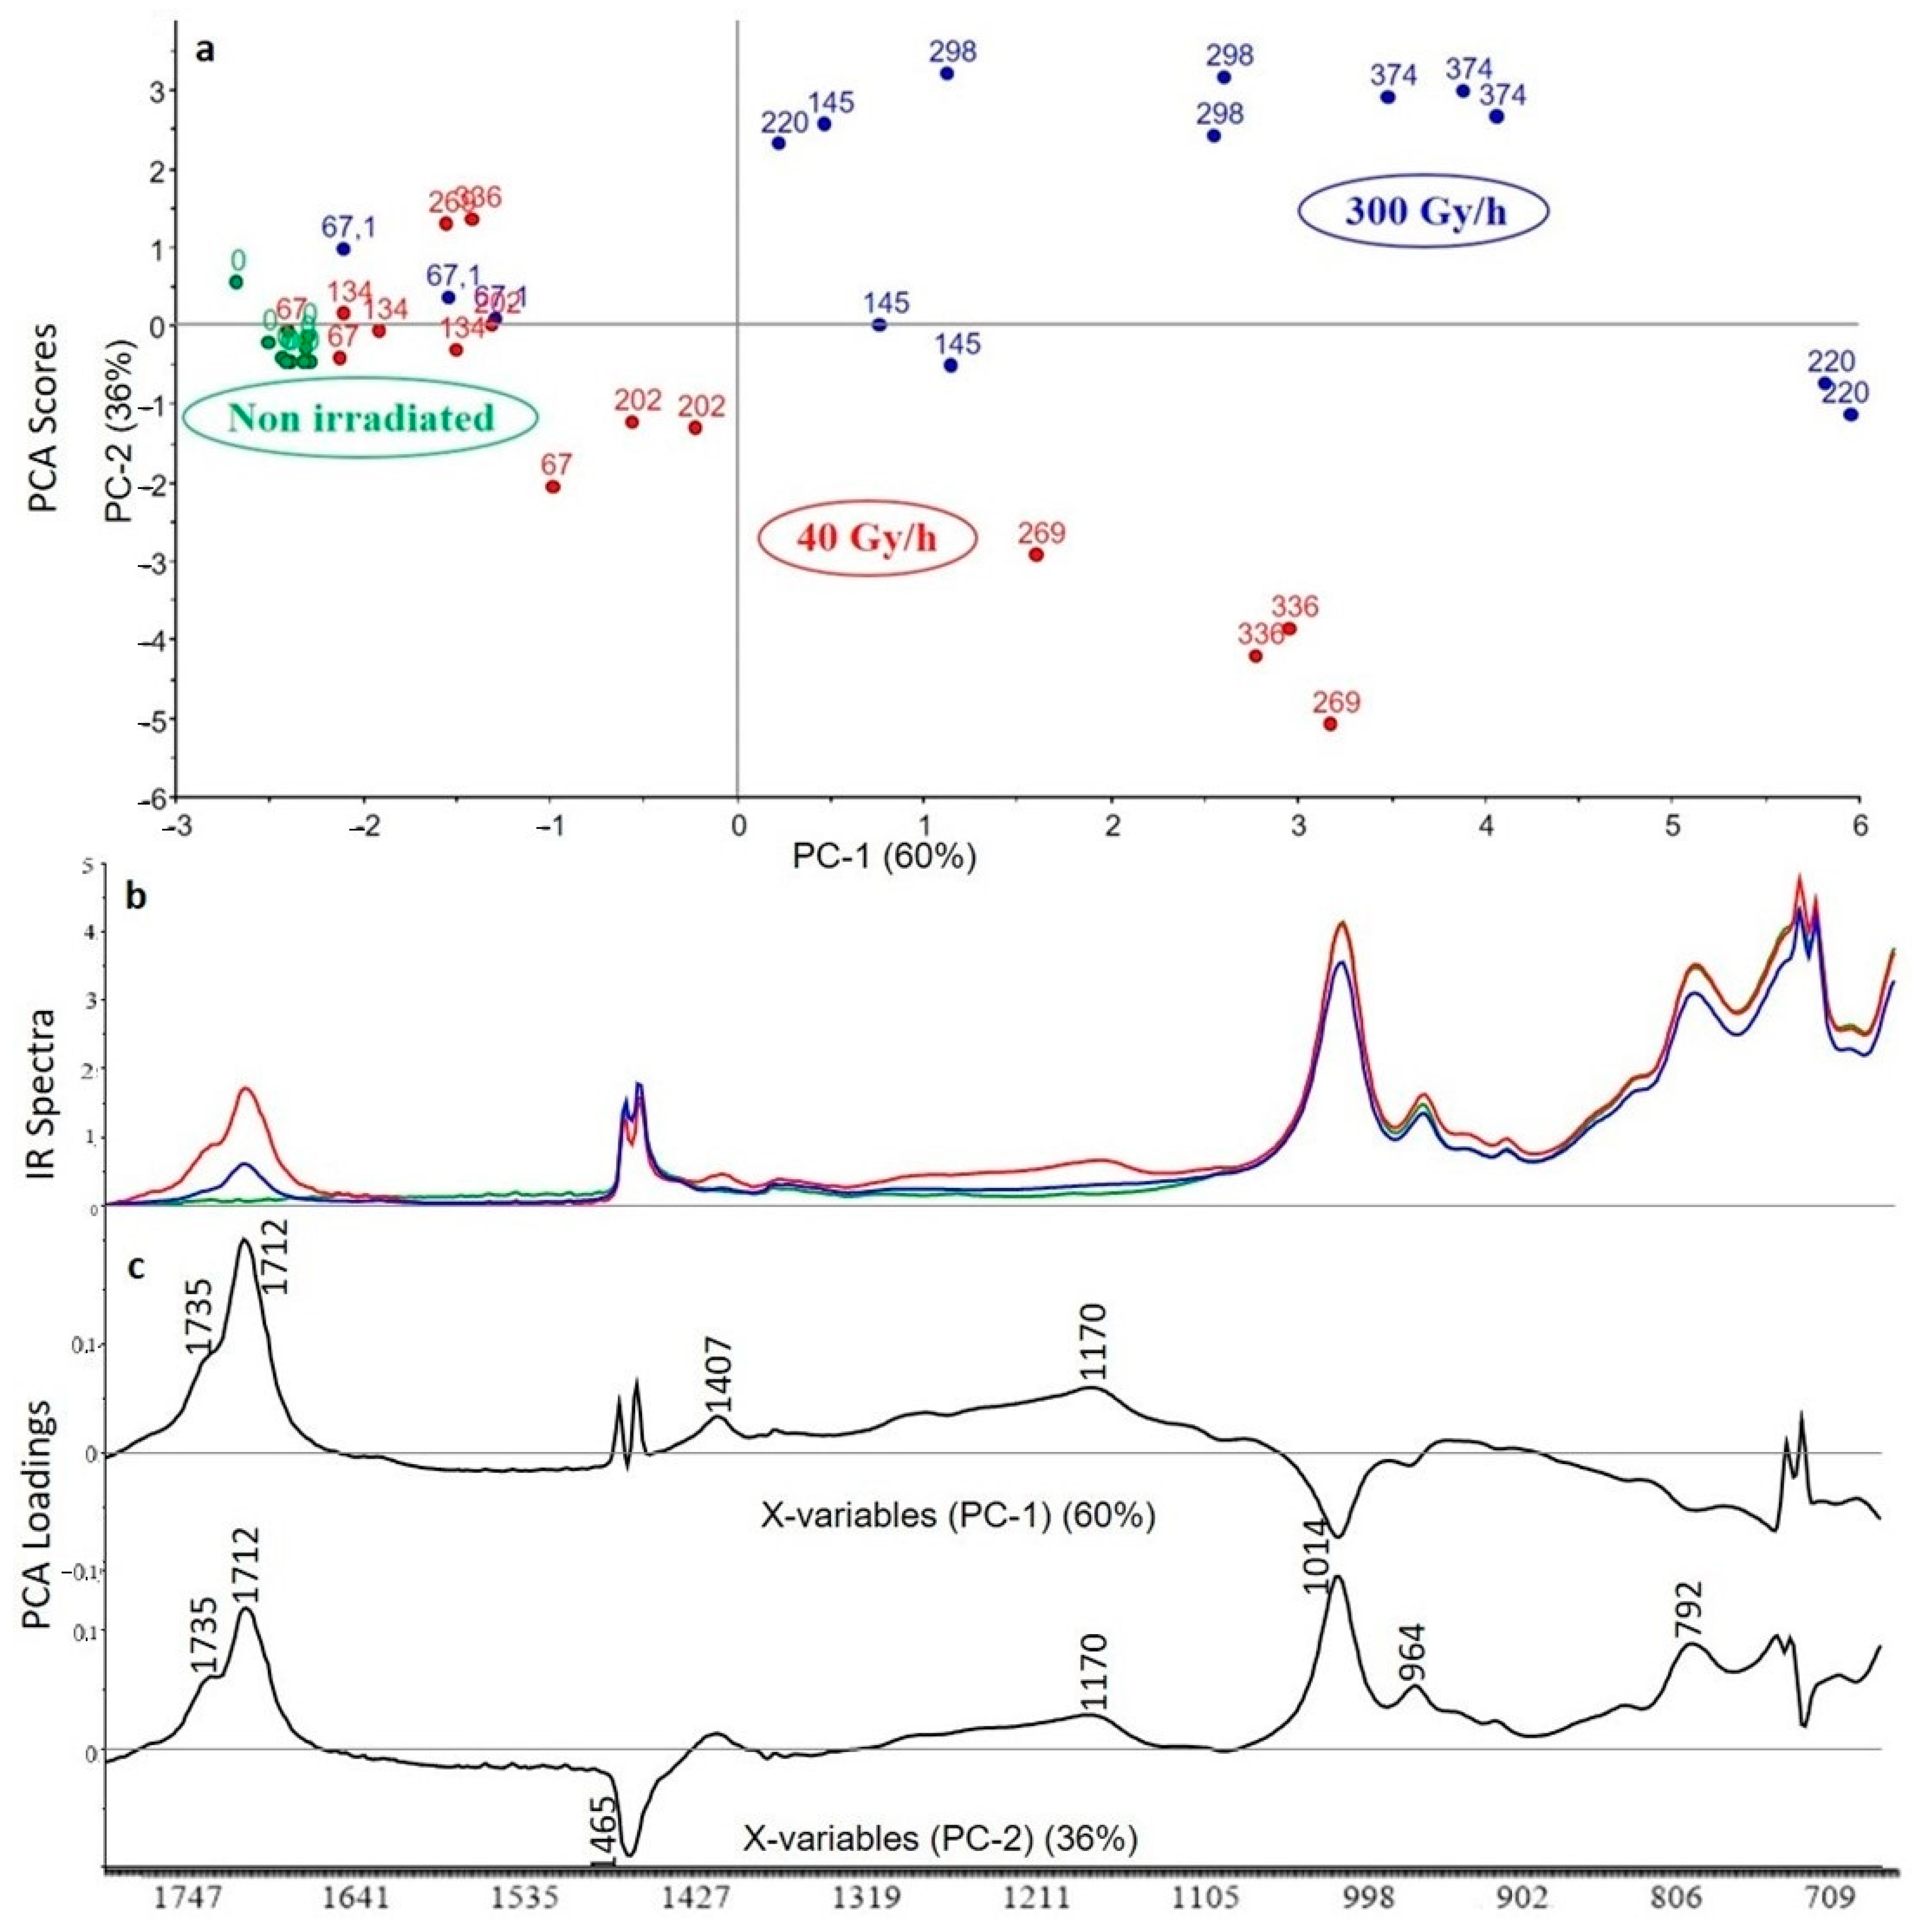
3.2.1. Crosslinked Polyethylene (XLPE) without Additive
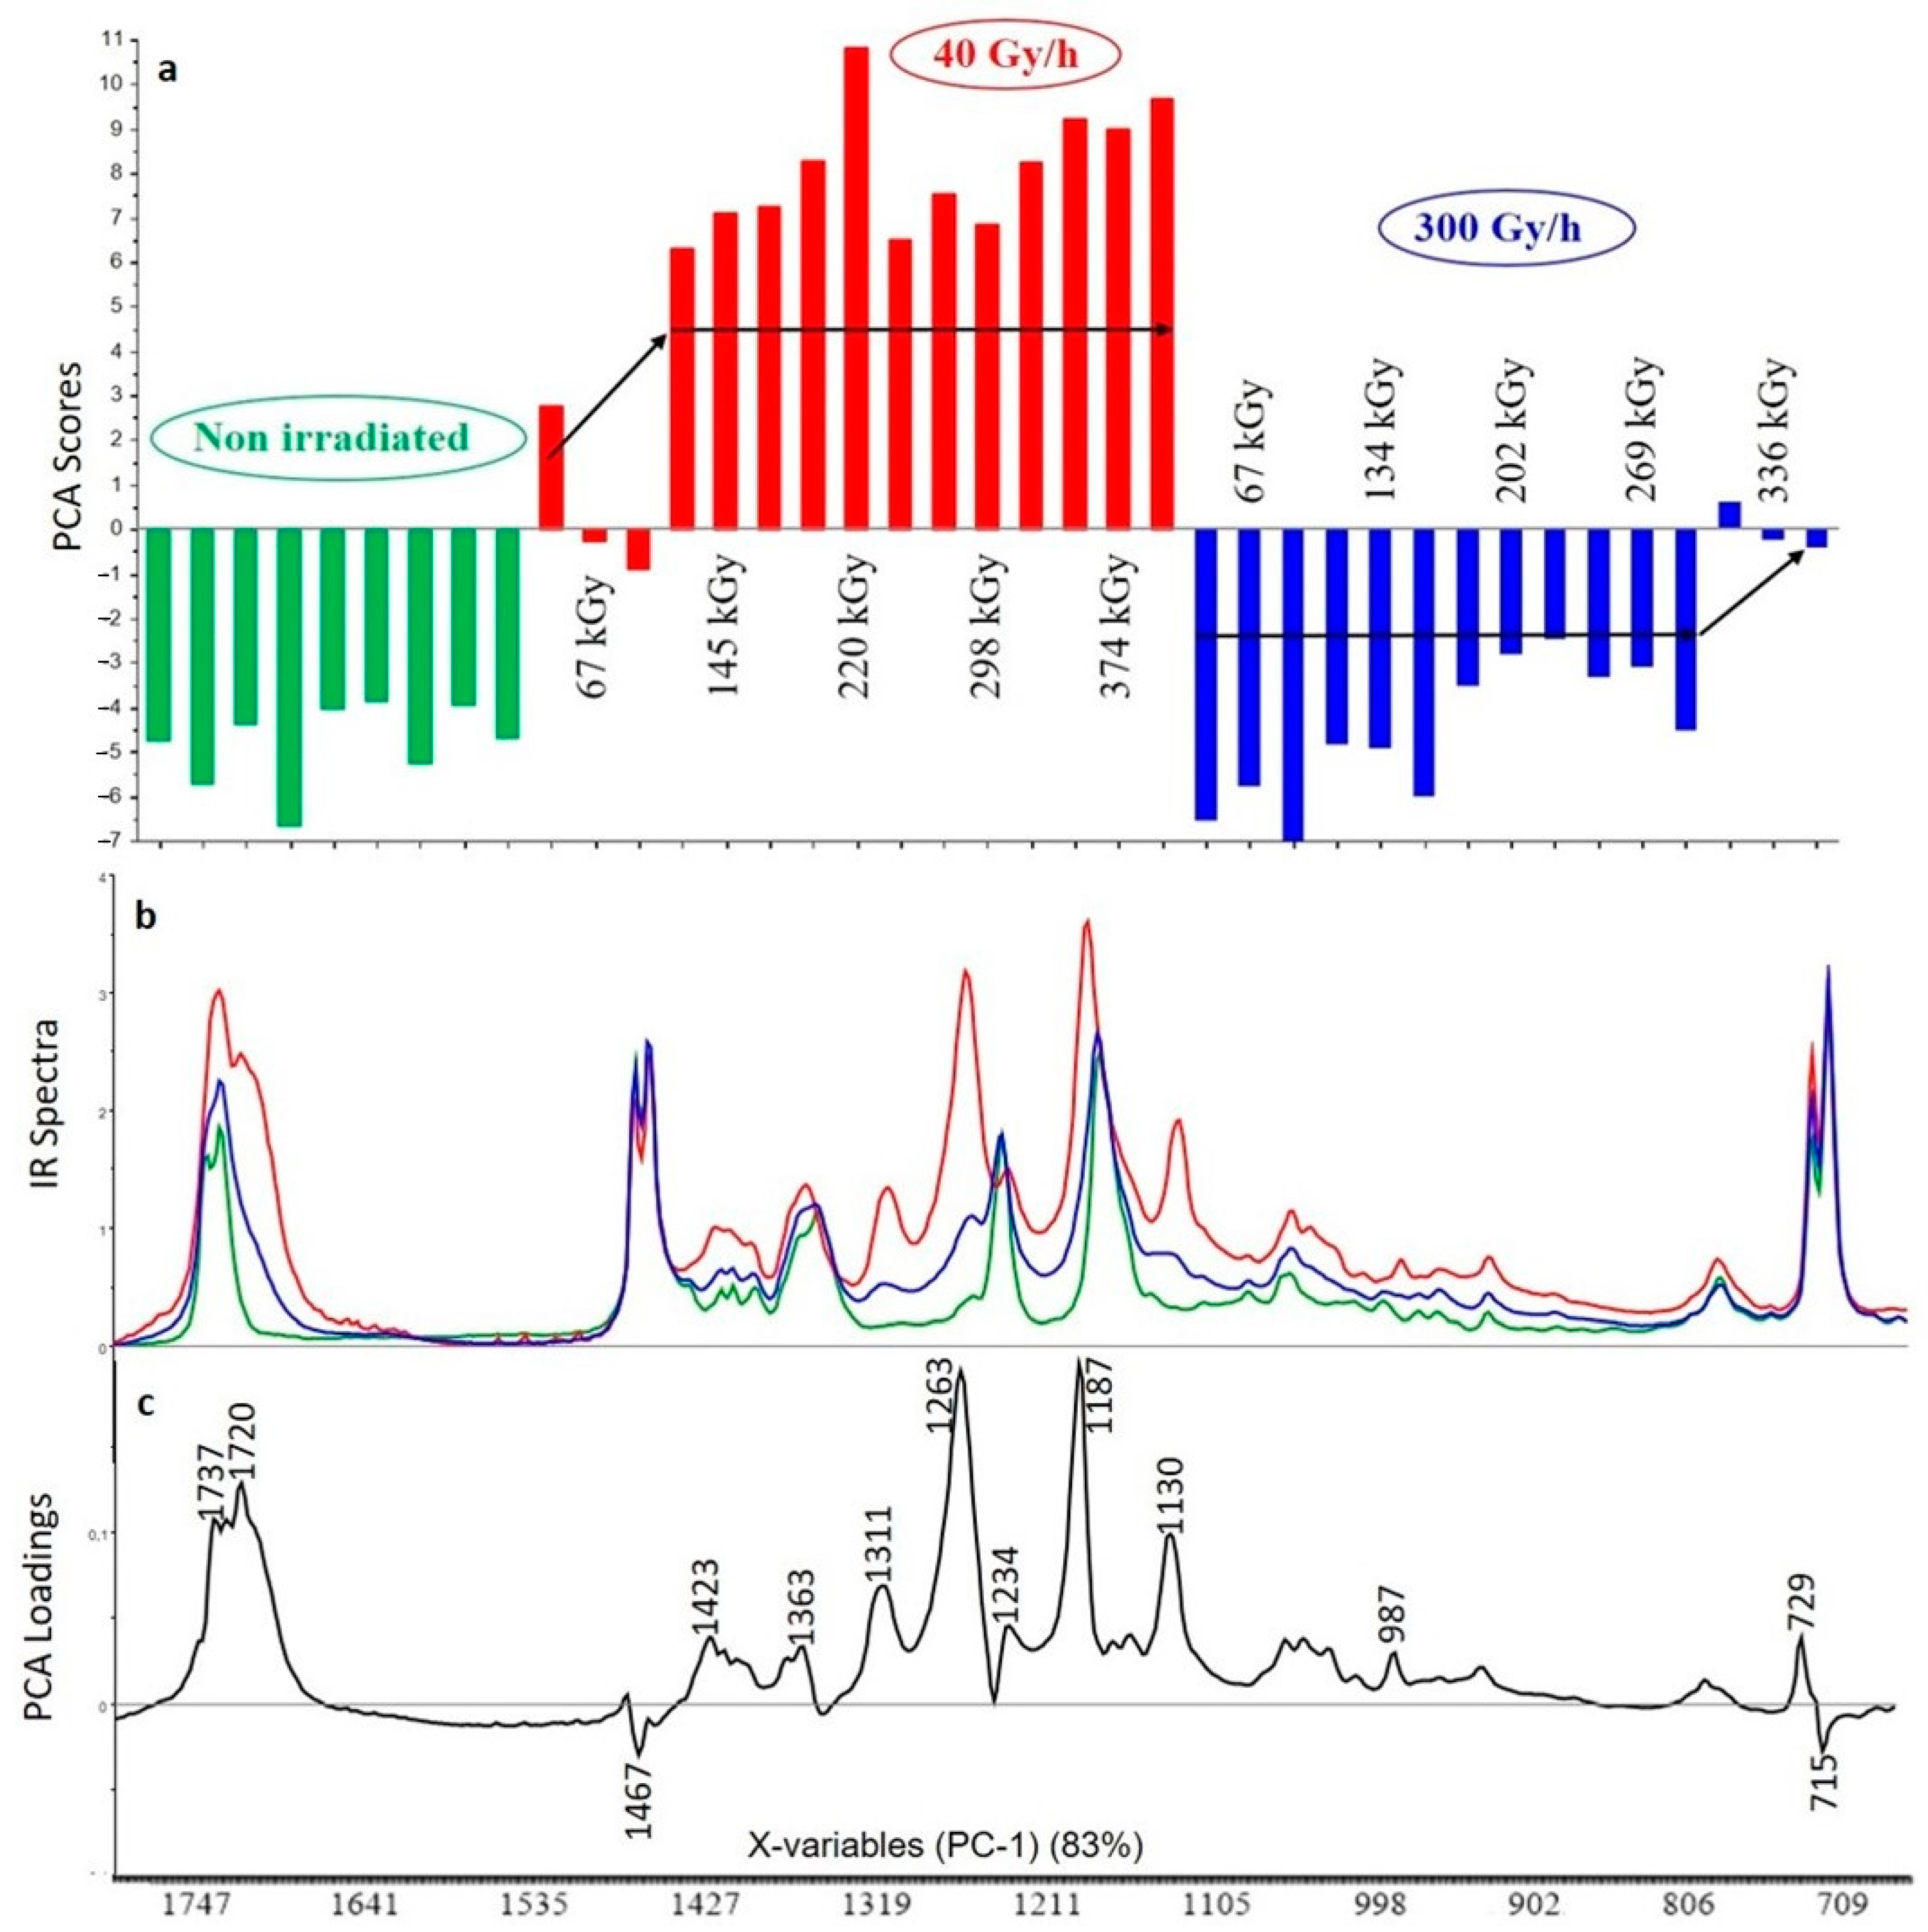
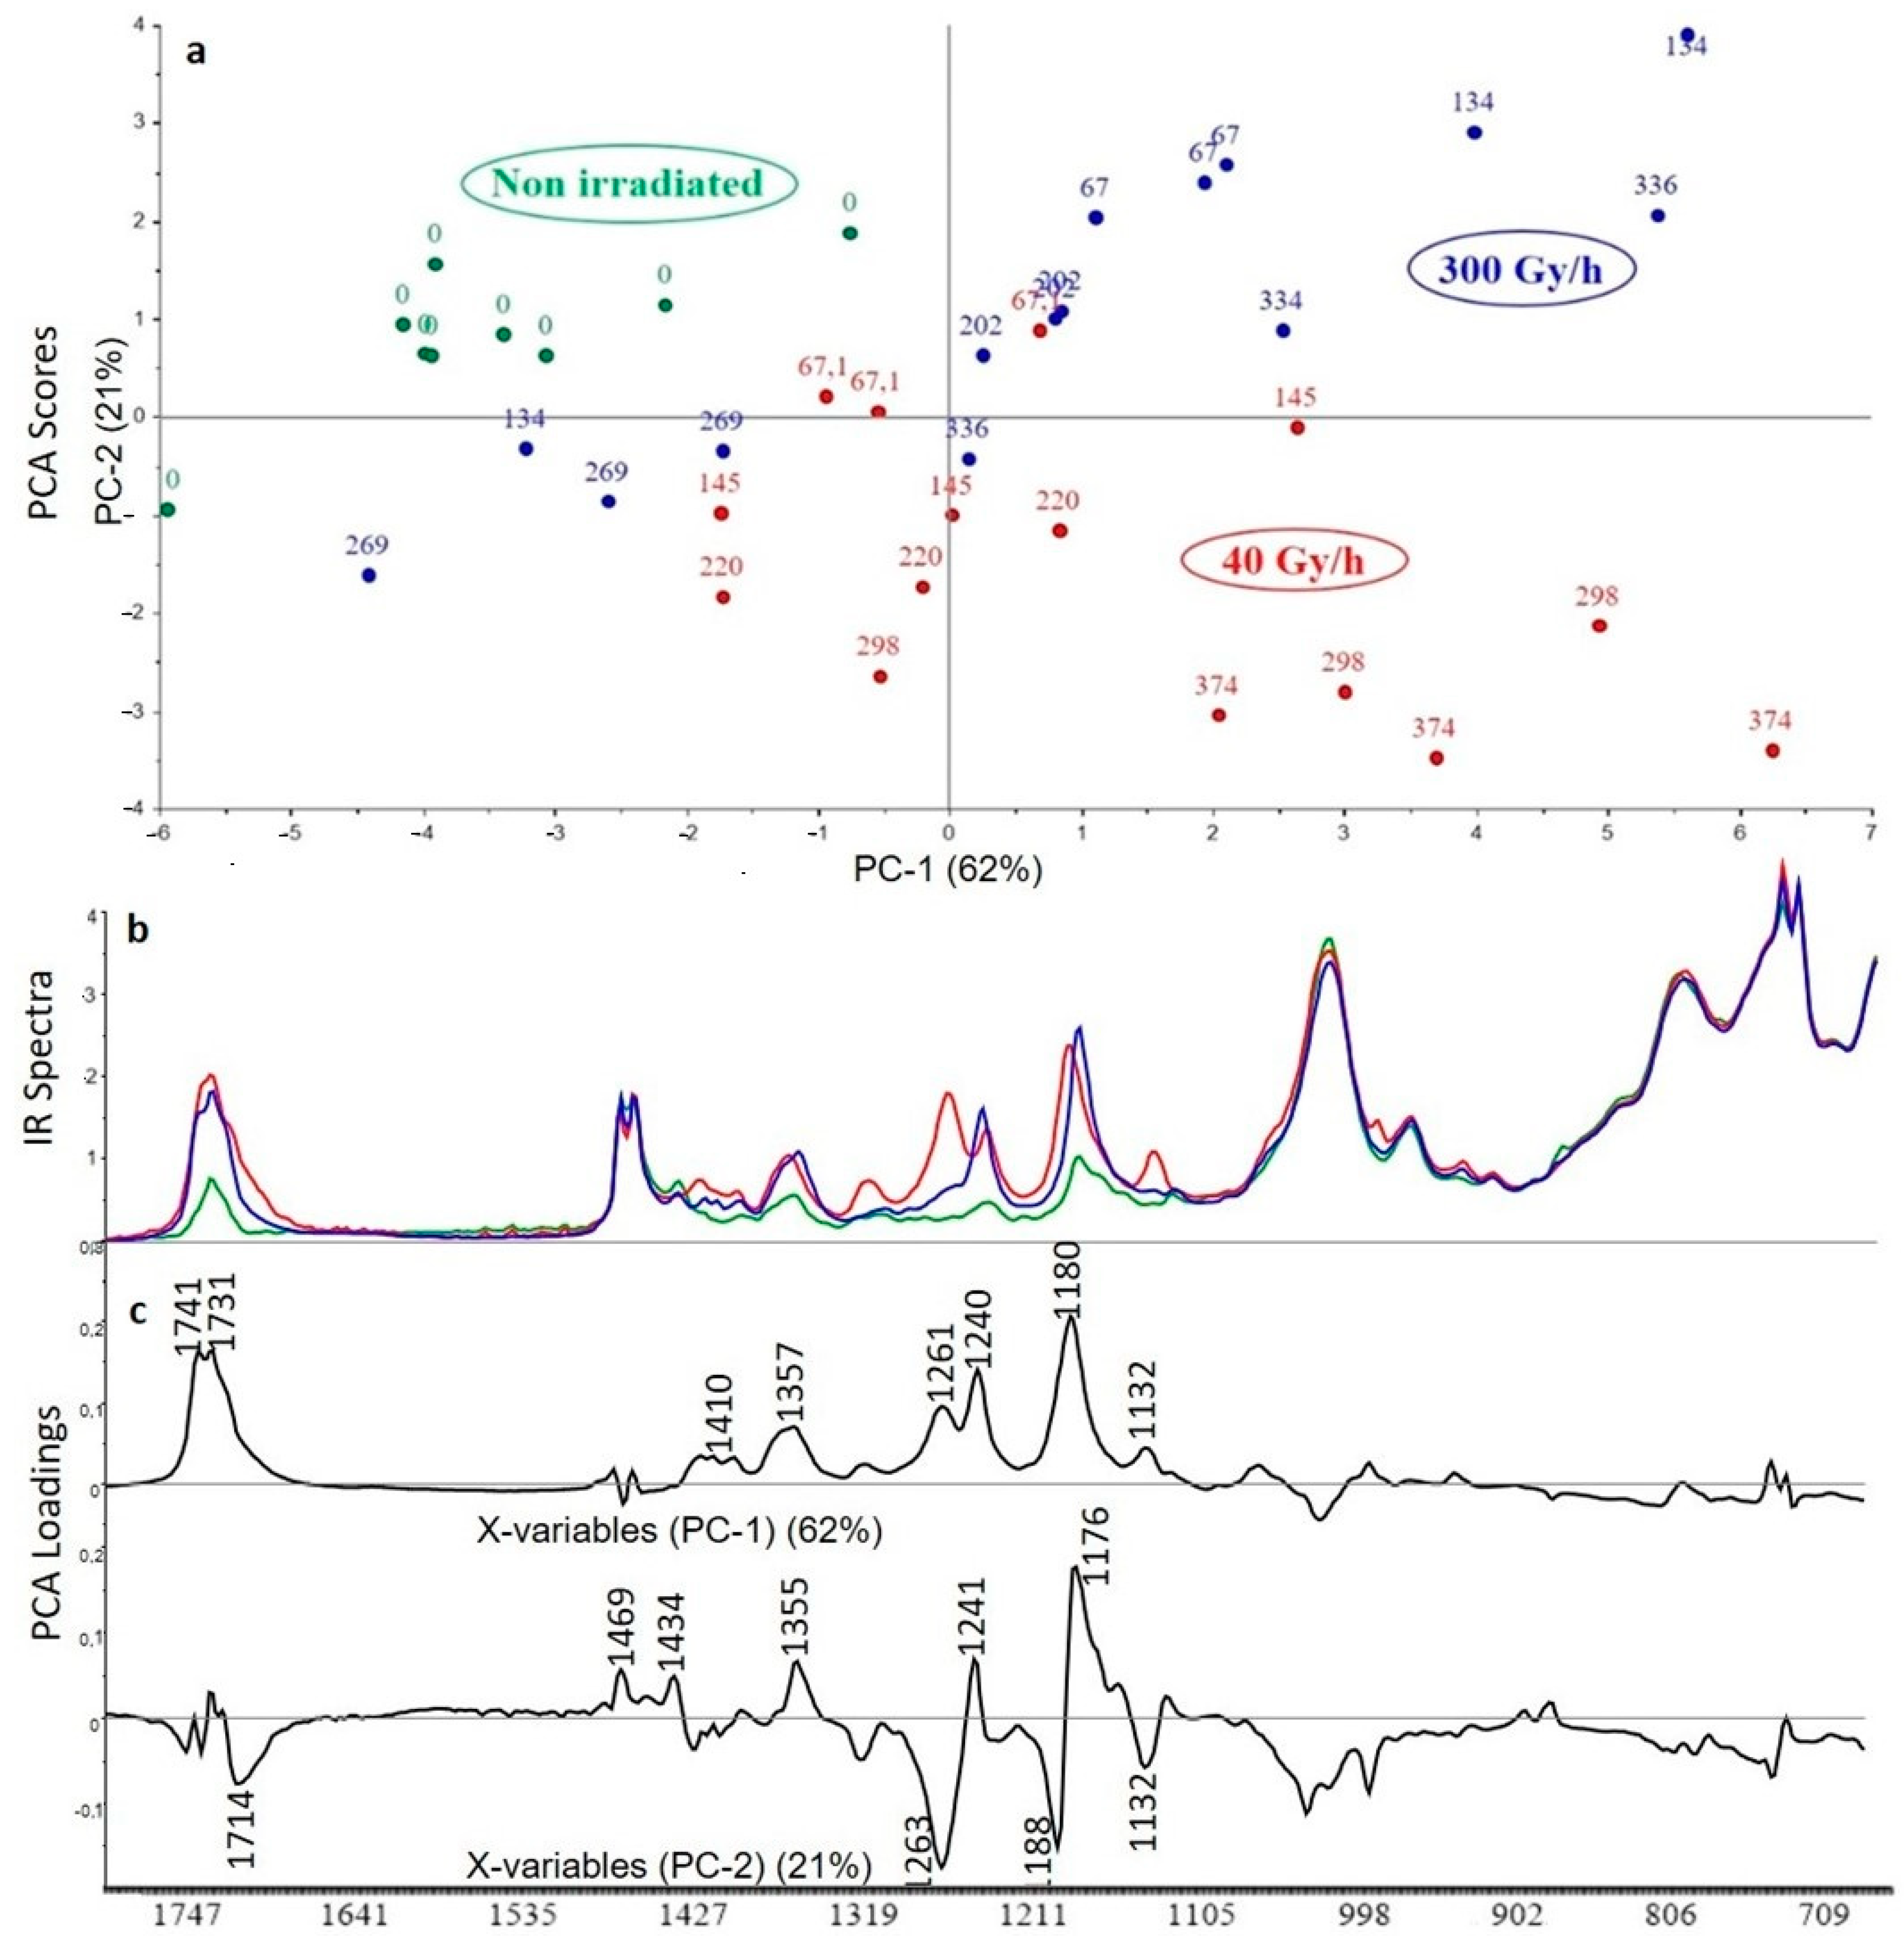
3.2.2. XLPE (99% w/w) with Irganox 1076 (1% w/w)
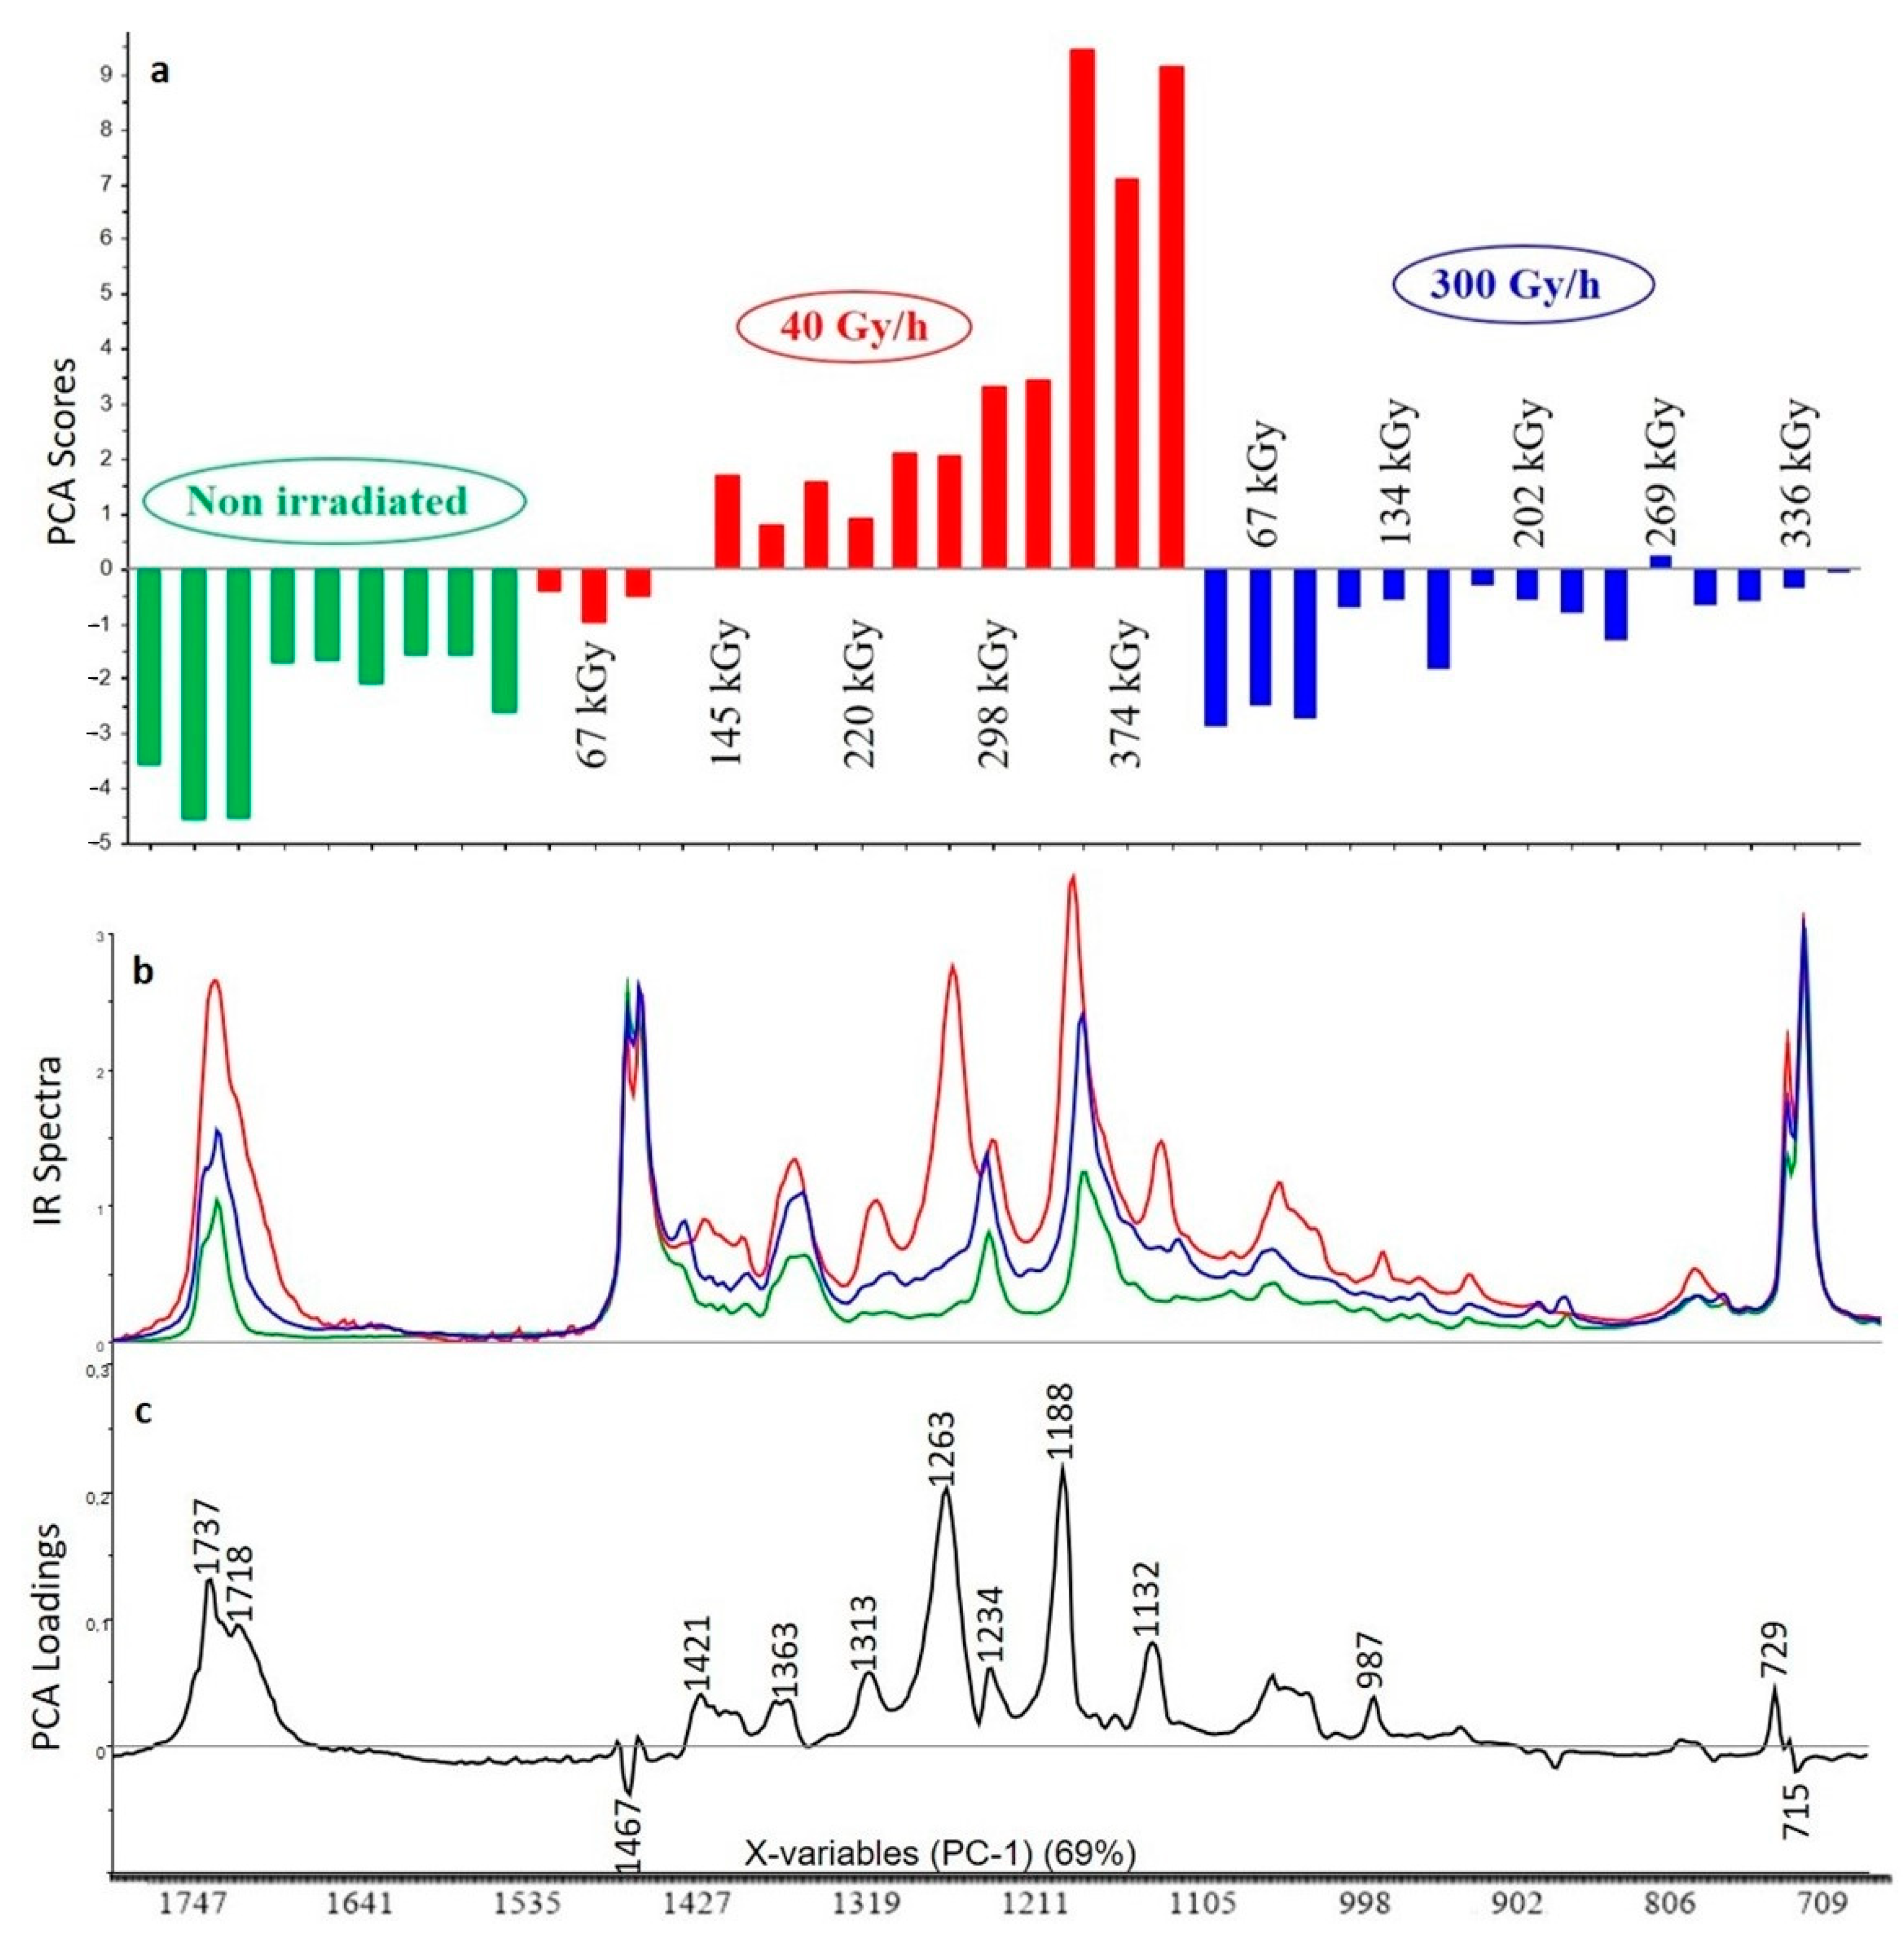
3.2.3. XLPE (99% w/w) with Irganox PS802 (1% w/w)
3.2.4. XLPE (98% w/w) with Irganox 1076 (1% w/w) and Irganox PS802 (1% w/w)
3.2.5. XLPE (67% w/w) with ATH (33% w/w)
3.2.6. XLPE (65.8% w/w) with ATH (32.8% w/w), Irganox 1076 (0.7% w/w) and Irganox PS802 (0.7% w/w)
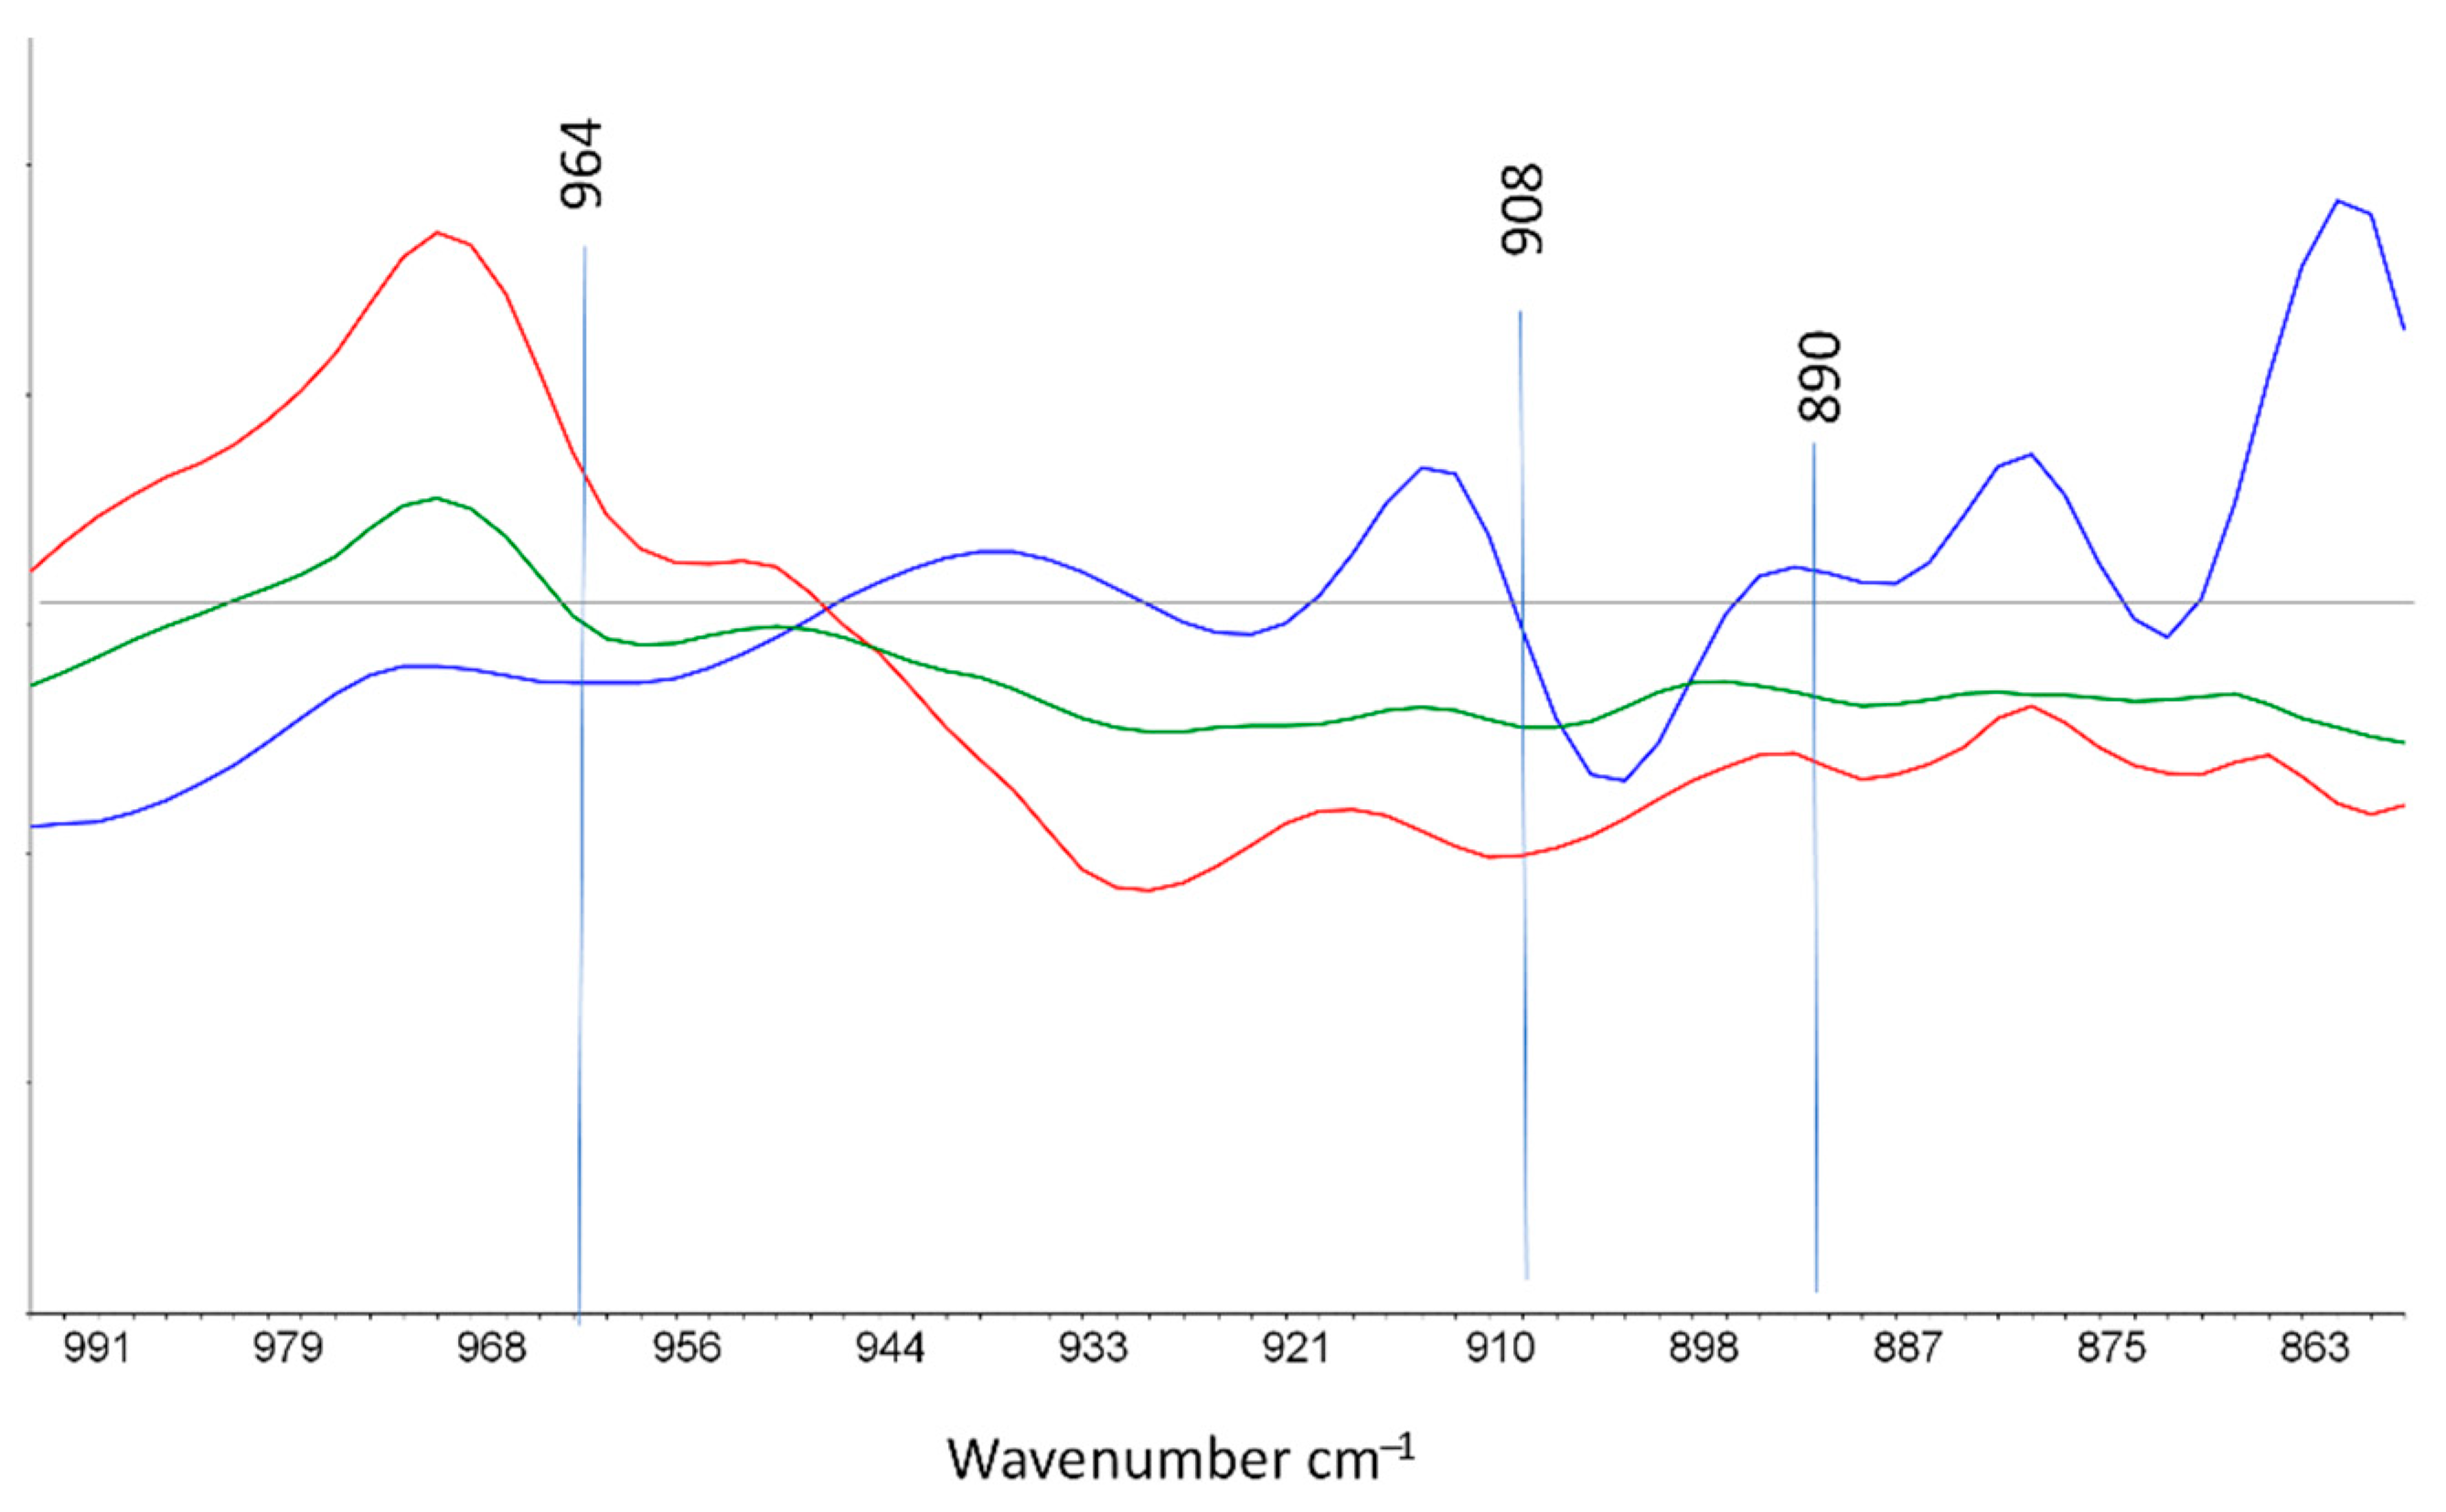
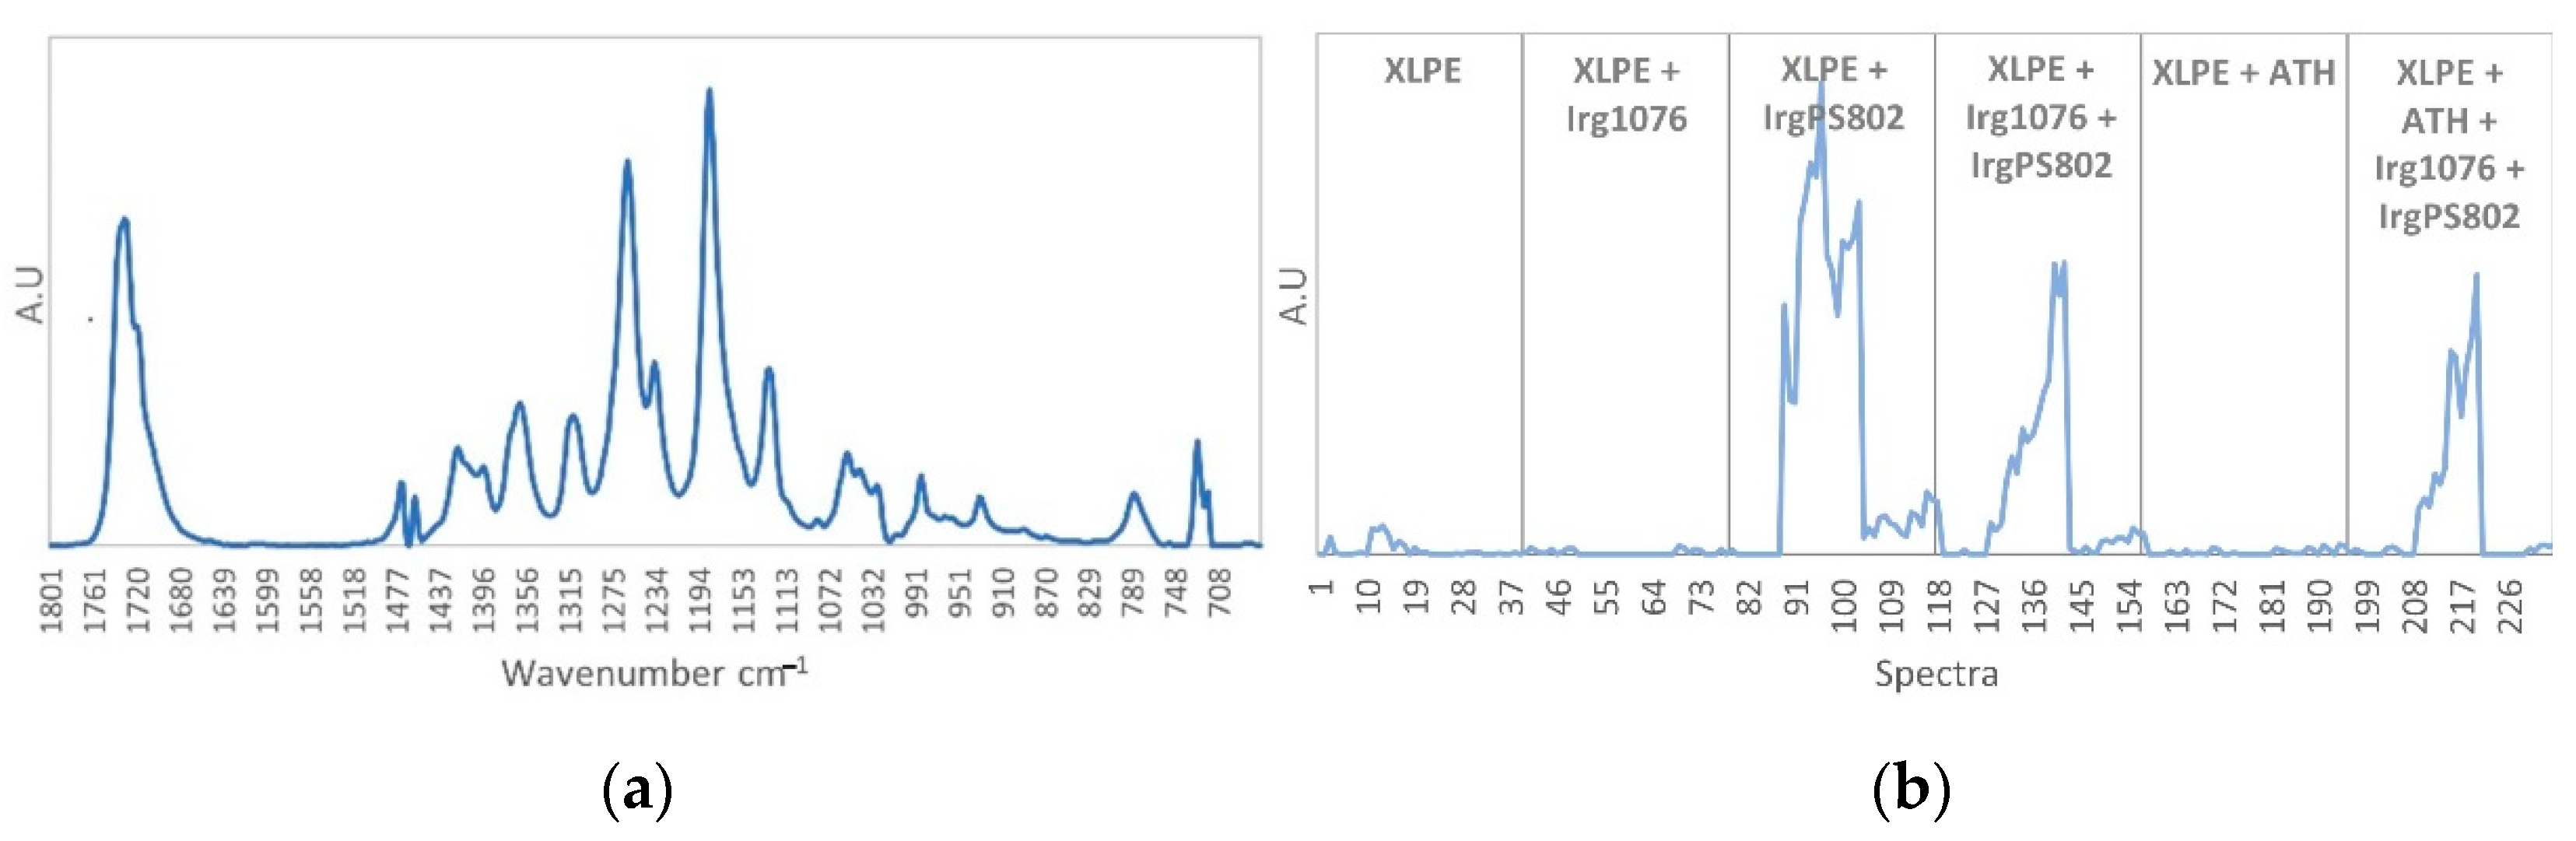
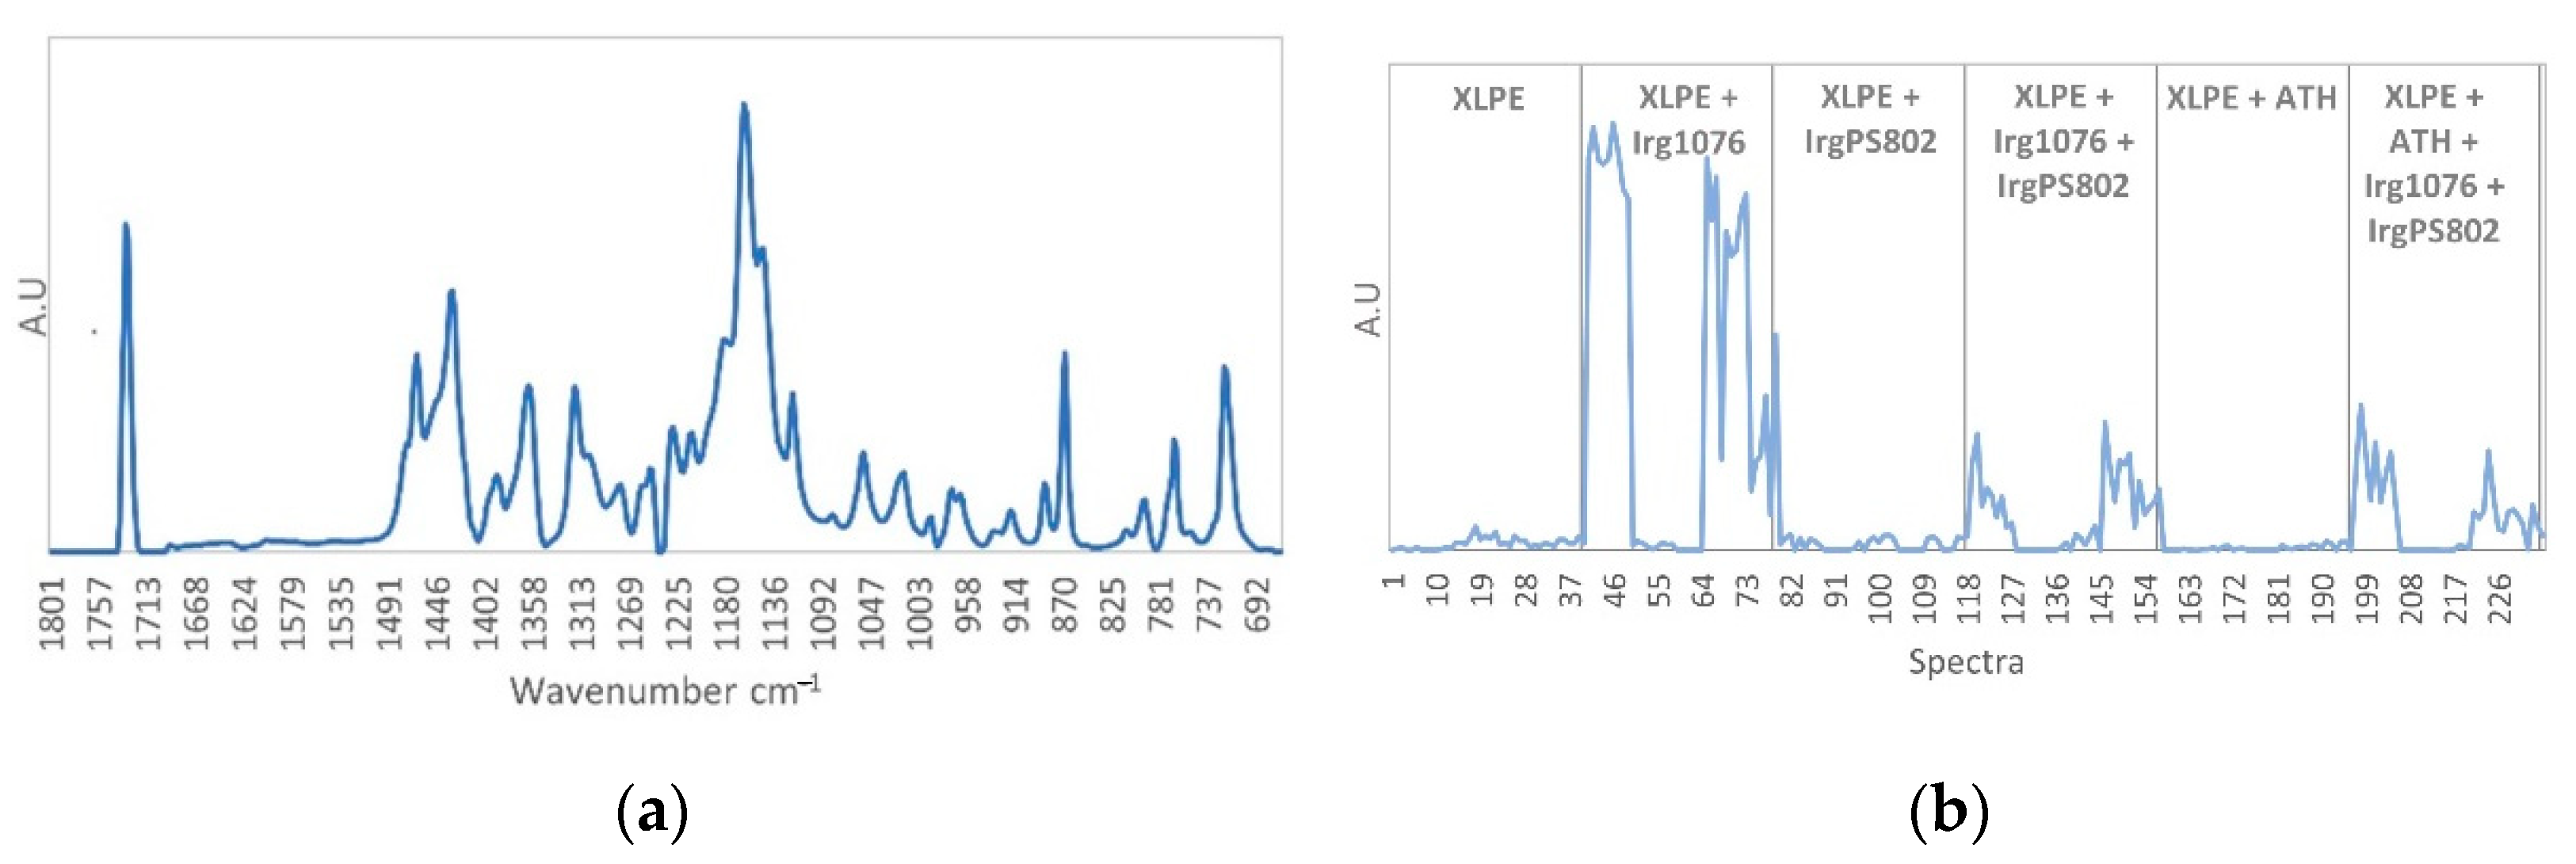
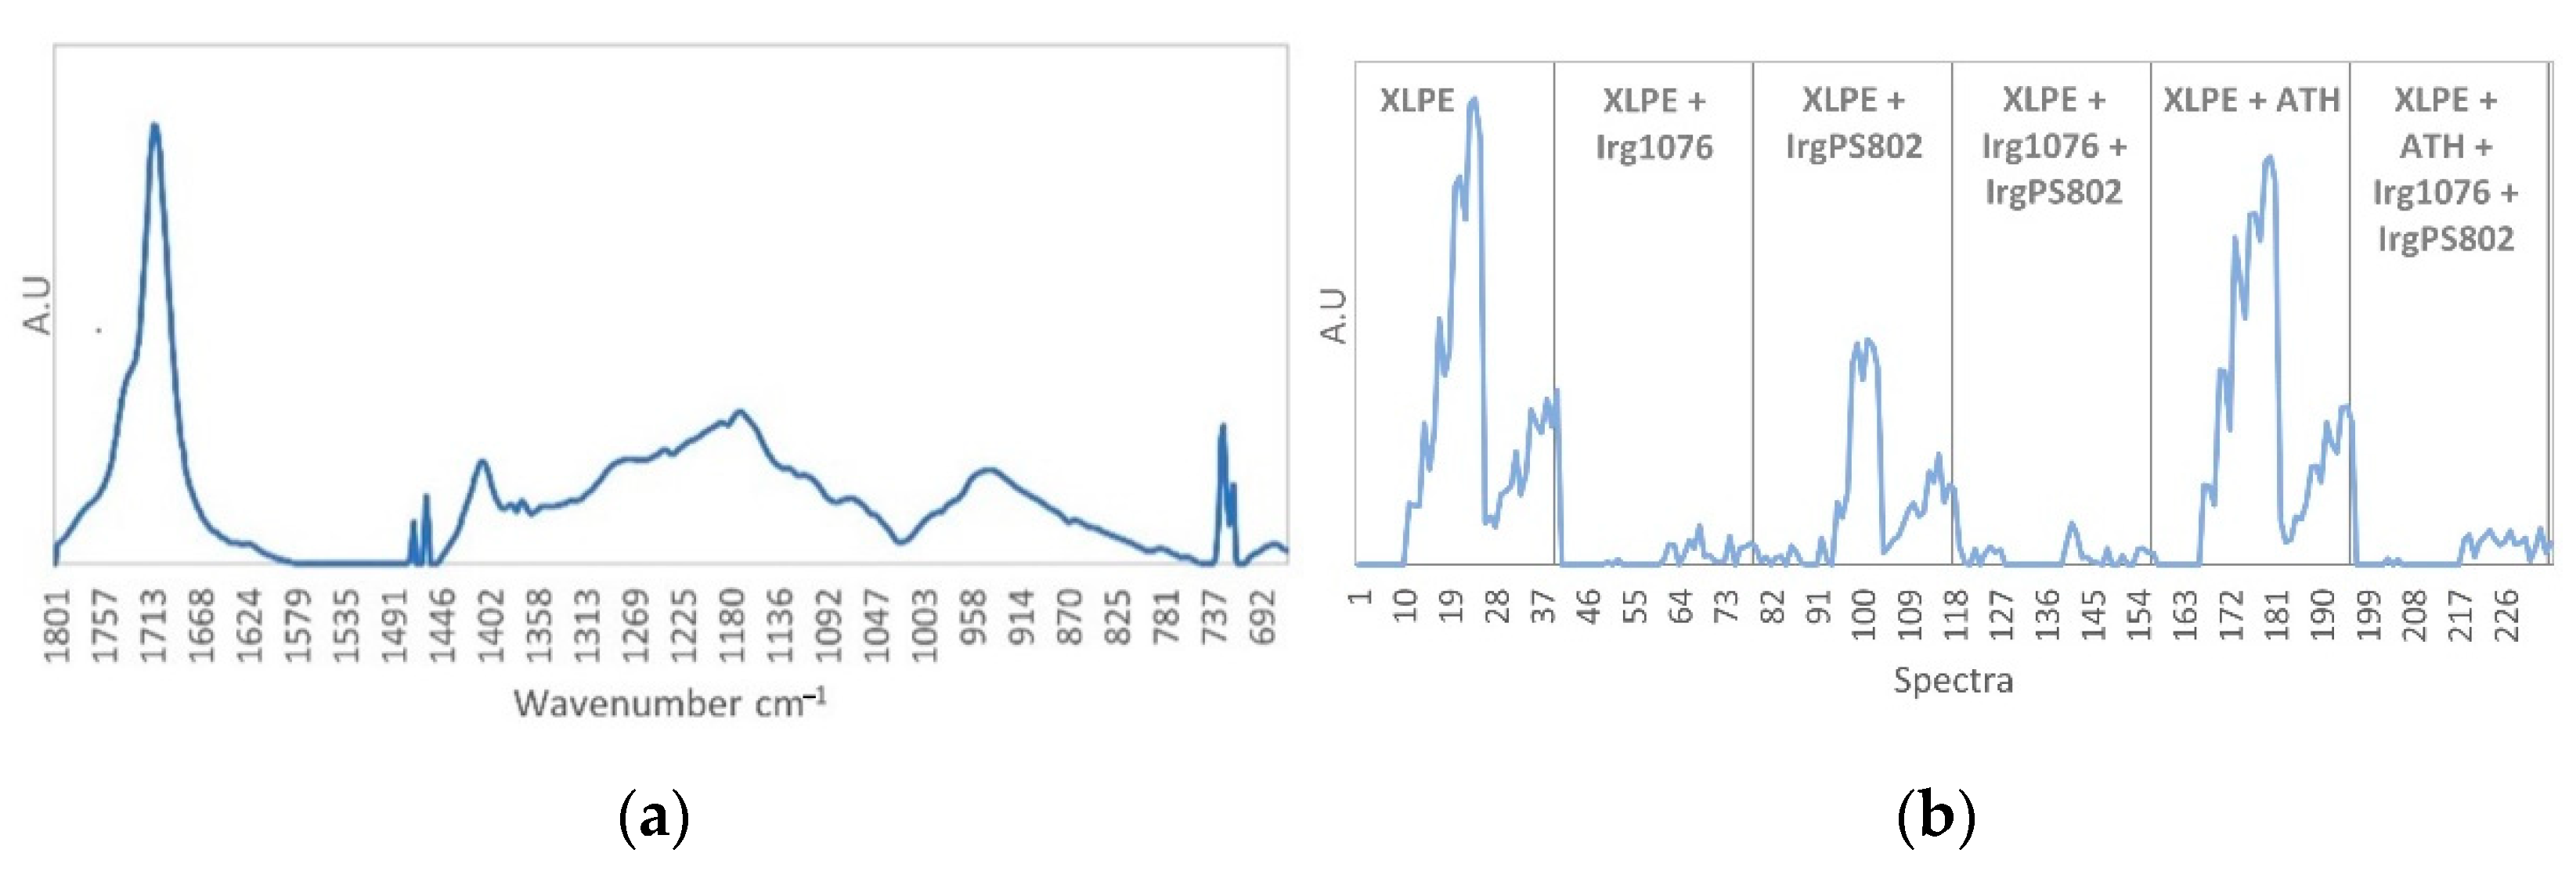
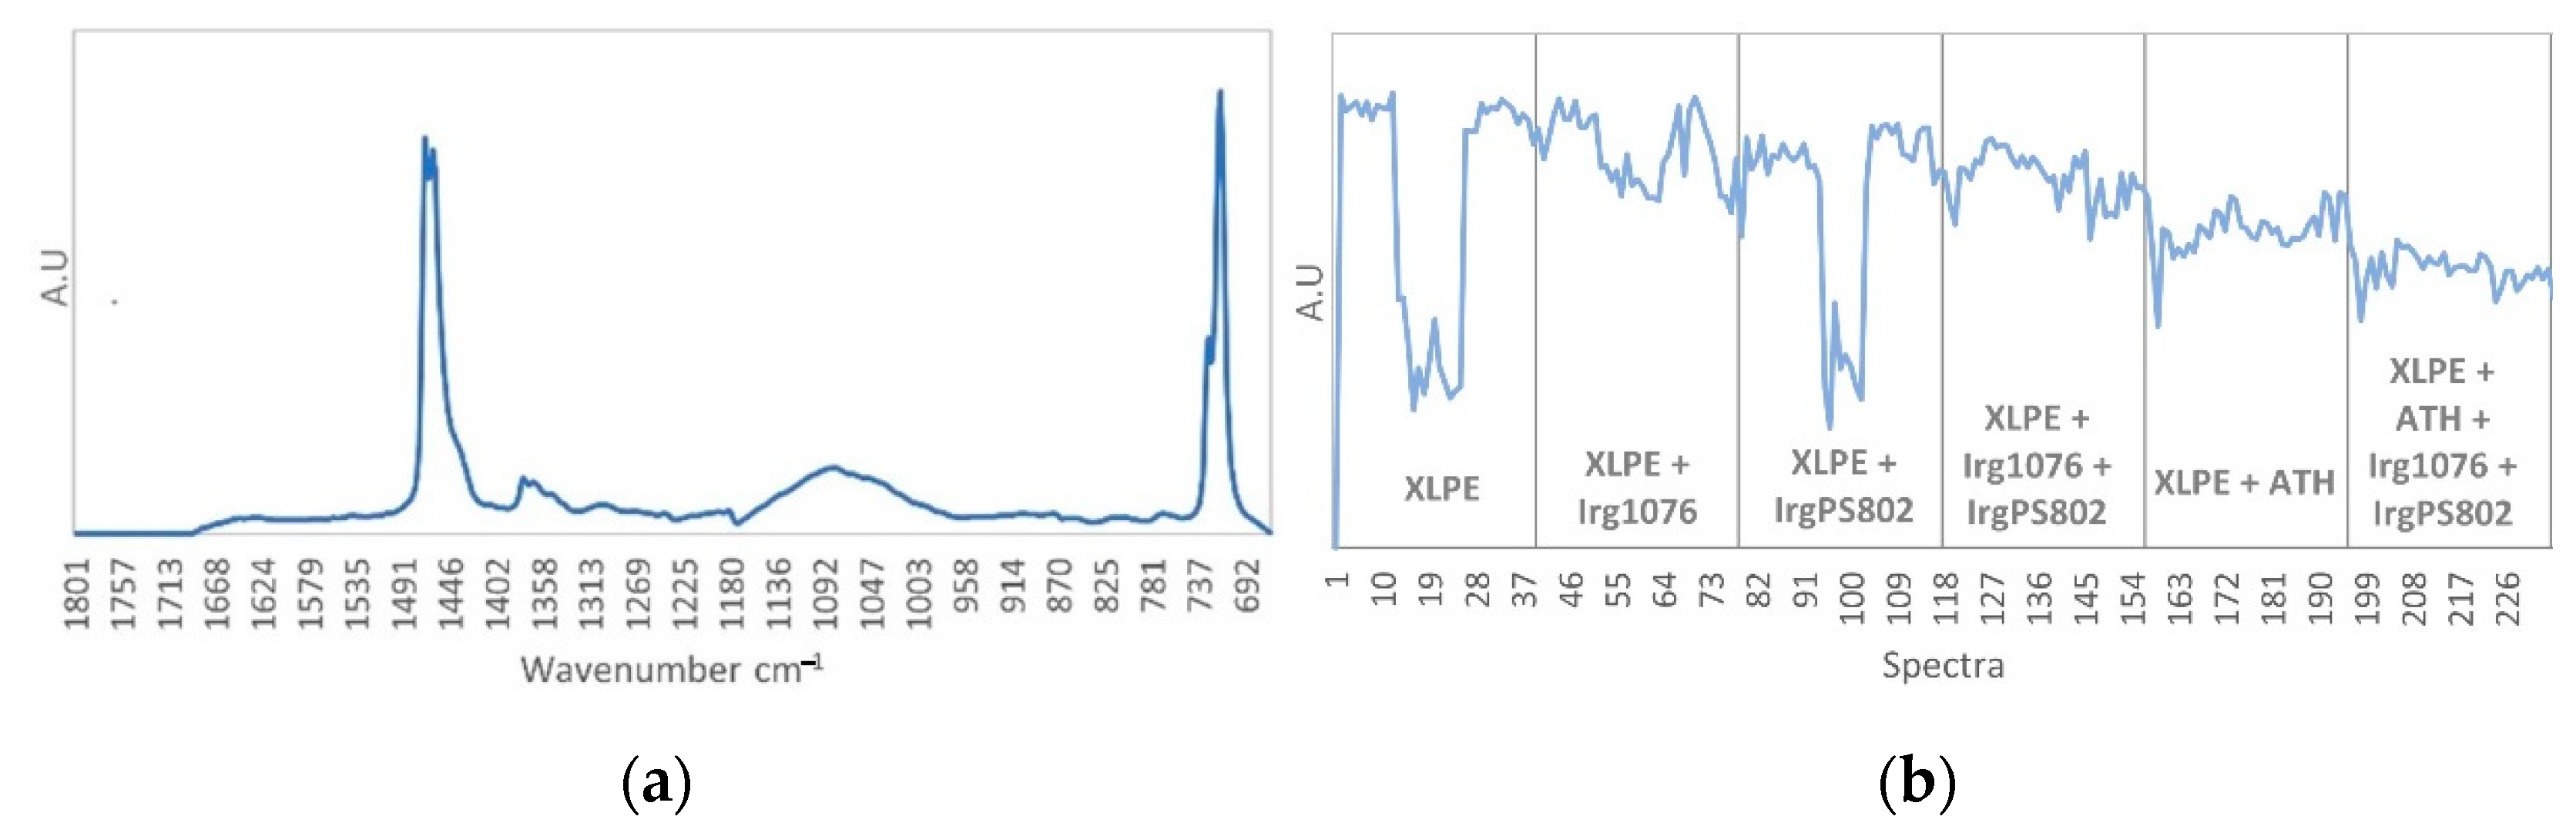
3.3. Curve Resolution Results
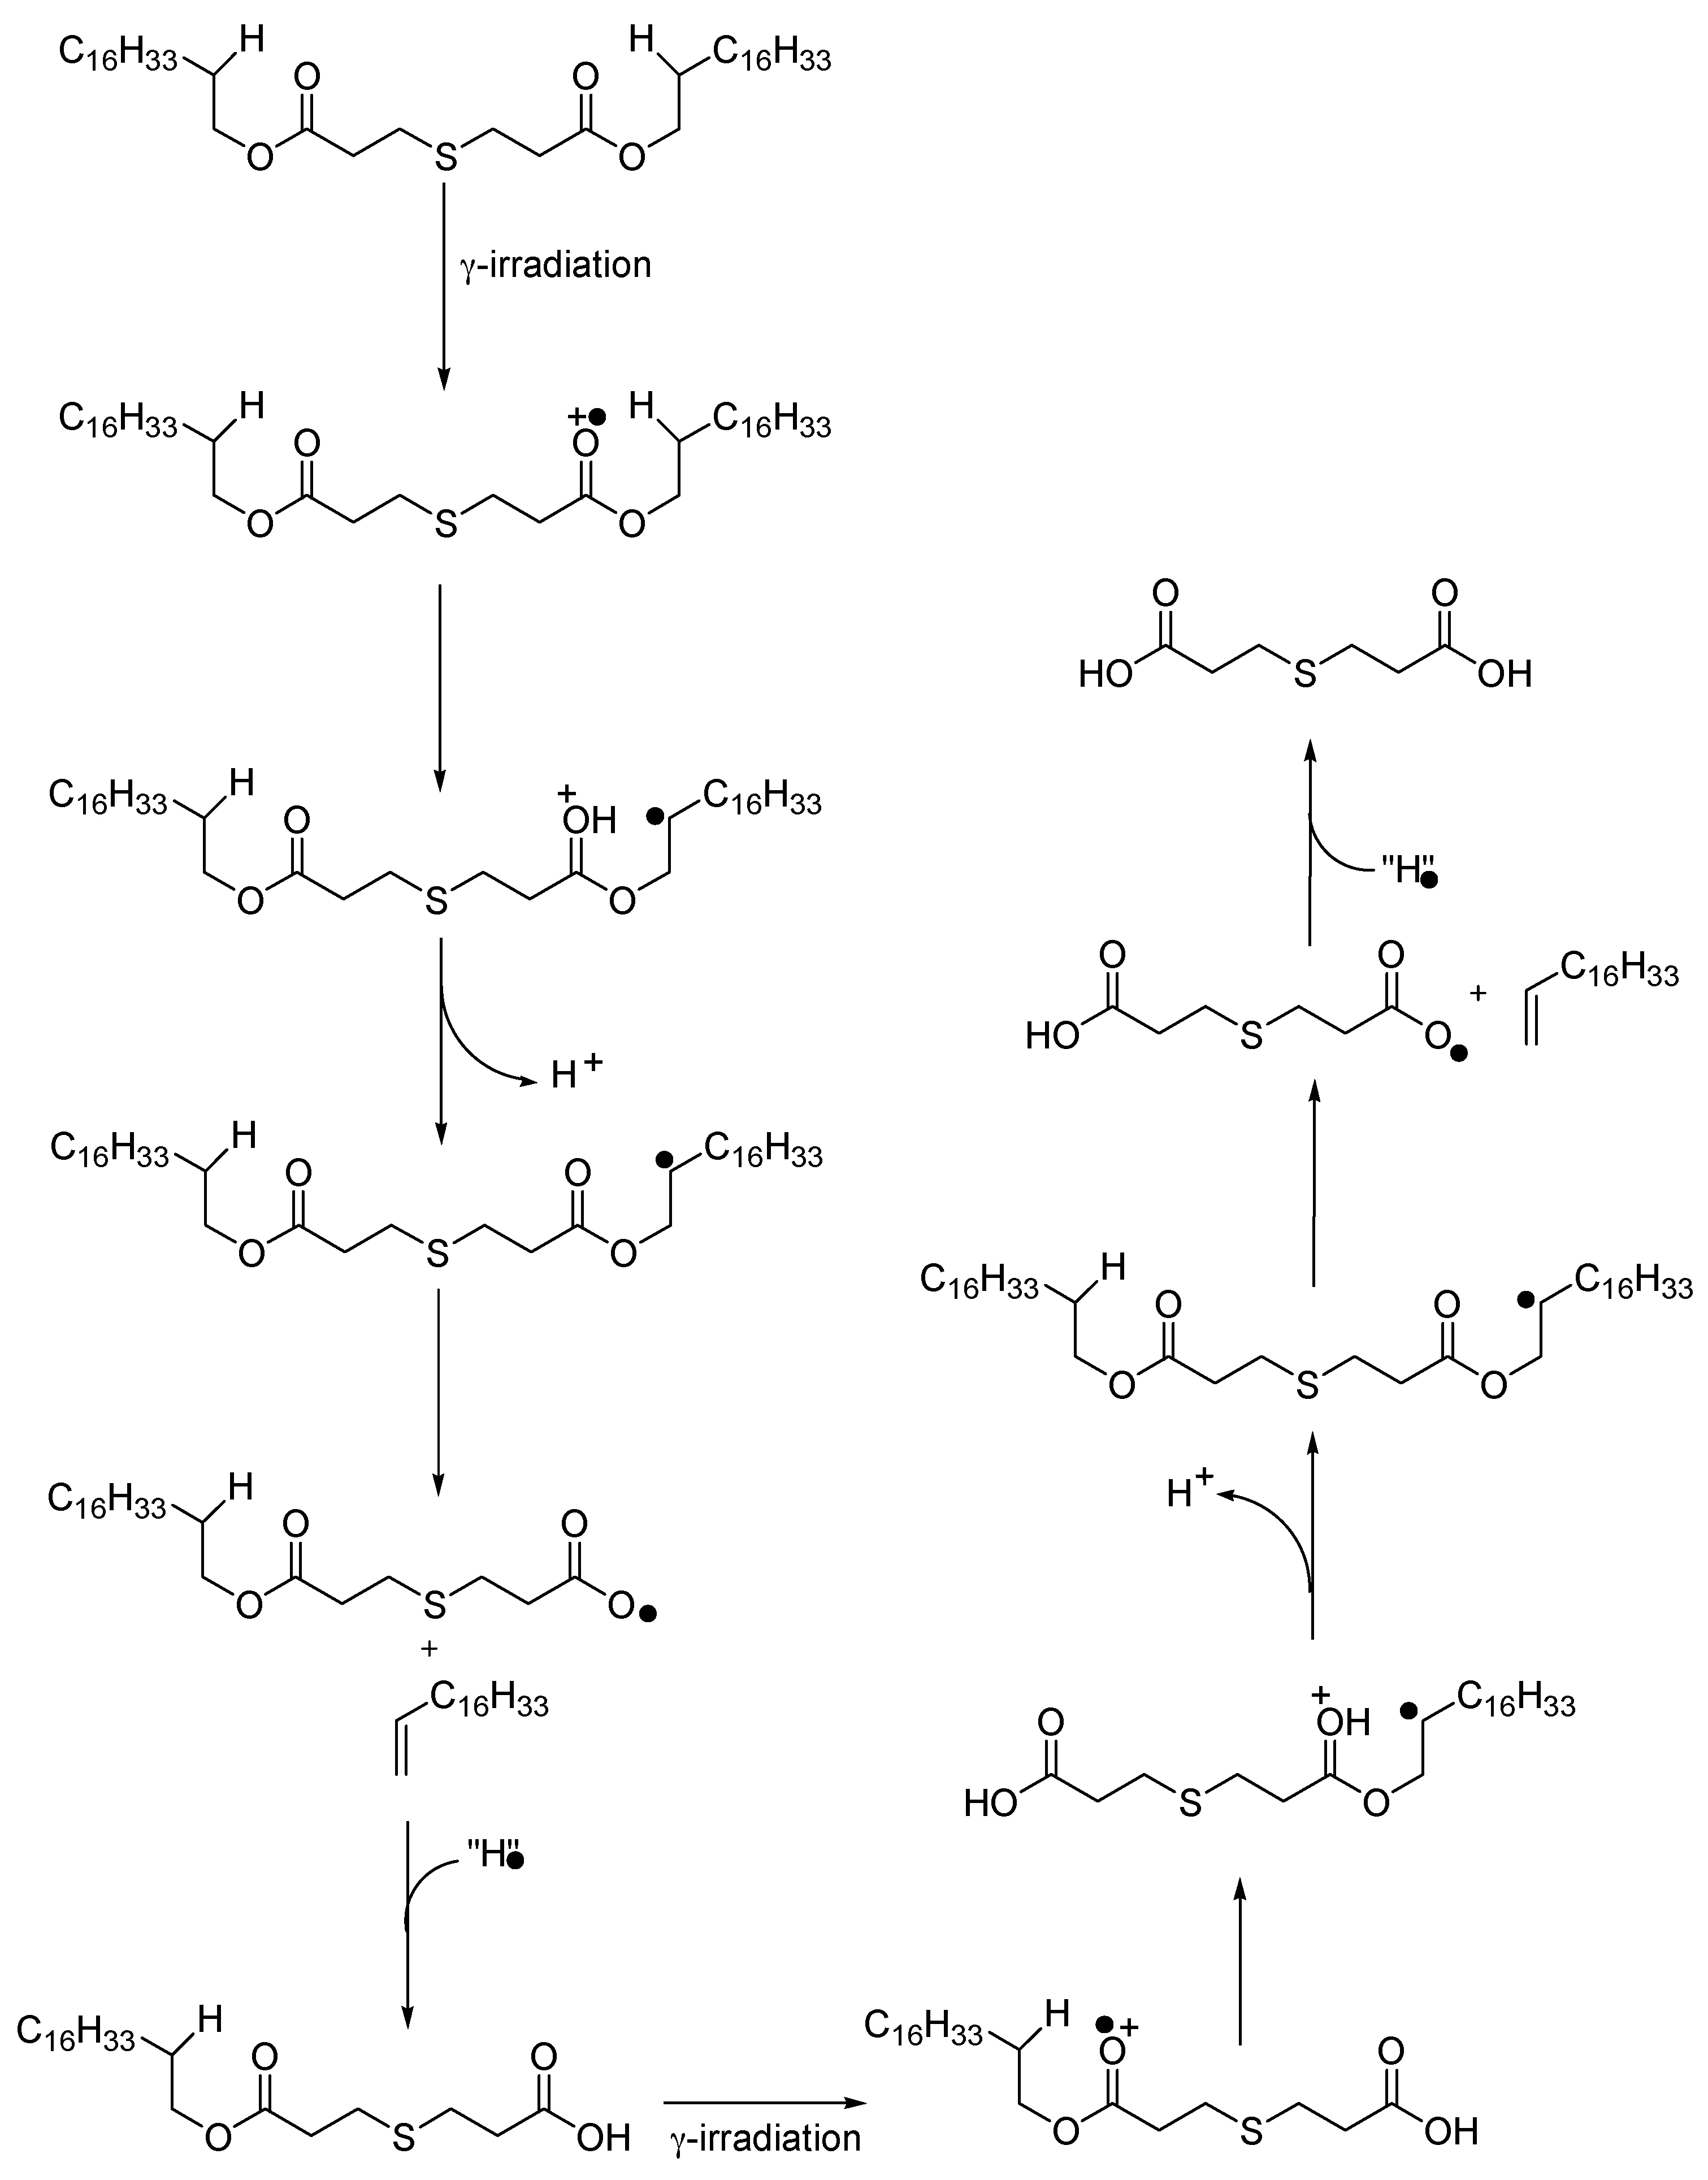
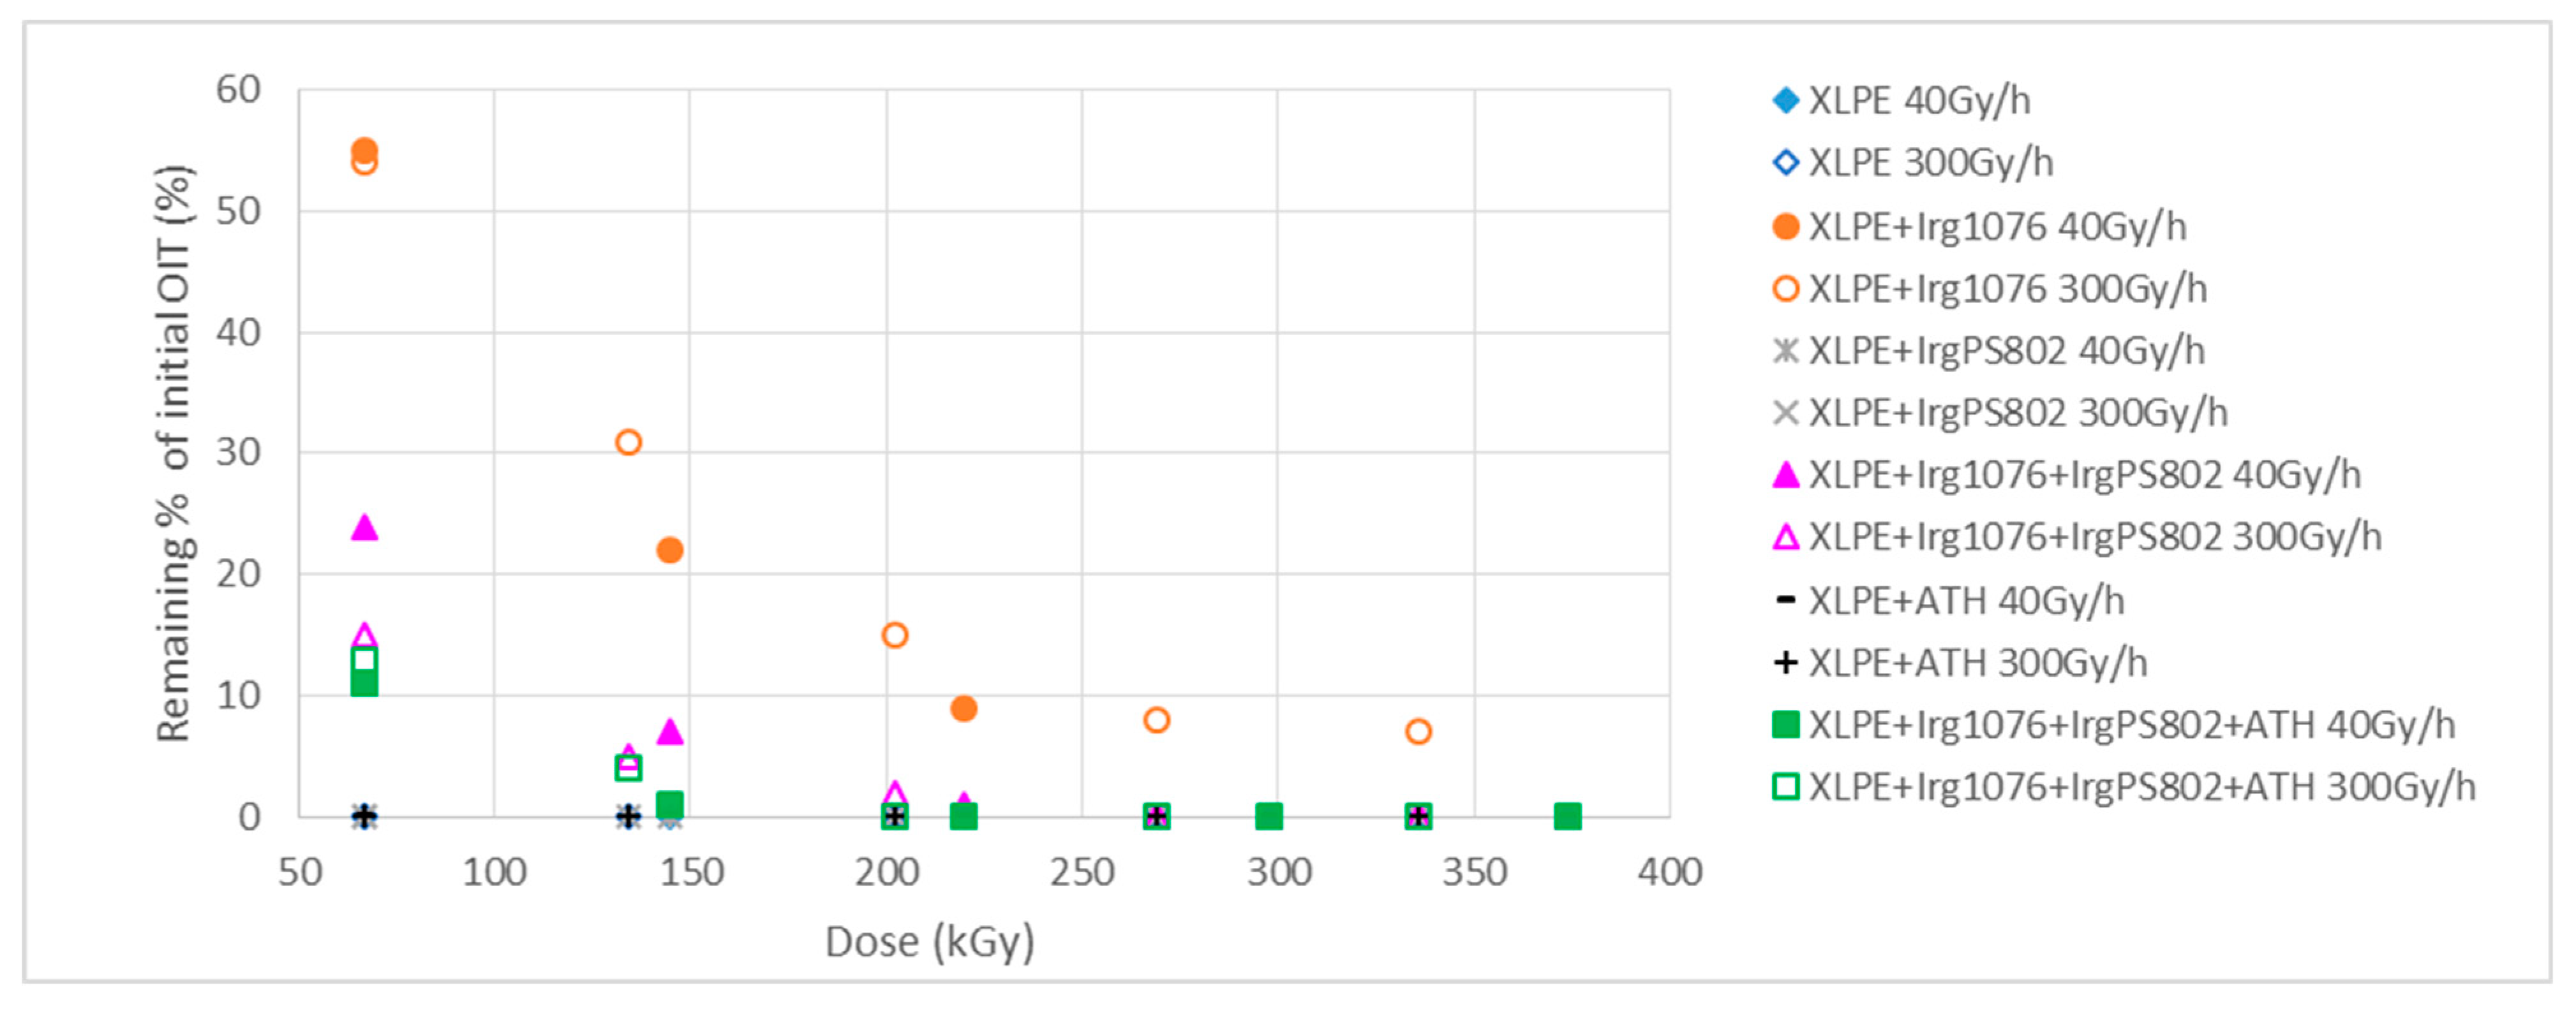
3.4. Impact of Irradiation on Stabilizers Consumption Evaluated by DSC (OIT)
4. Conclusions
Author Contributions
Funding
Informed Consent Statement
Data Availability Statement
Acknowledgments
Conflicts of Interest
References
- Nusbaum, H.J.; Rose, R.M. The effects of radiation sterilization on the properties of ultrahigh molecular weight polyethylene. J. Biomed. Mater. Res. 1979, 13, 557–576. [Google Scholar] [CrossRef] [PubMed]
- Clough, R.L. Radiation-resistant polymers. Encycl. Polym. Sci. Eng. 1988, 13, 667–708. [Google Scholar]
- International Atomic Energy Agency. Management of Life Cycle and Ageing at Nuclear Power Plants: Improved I&C Maintenance; IAEA: Vienna, Italy, 2004. [Google Scholar]
- Suraci, S.-V.; Fabiani, D.; Colin, X.; Roland, S. Chemical and electrical characterization of XLPE cables exposed to radio-thermal aging. In Proceedings of the 2020 IEEE 3rd International Conference on Dielectrics (ICD), Valencia, Spain, 5–31 July 2020. [Google Scholar] [CrossRef]
- Liu, Z.; Miyazaki, Y.; Hirai, N.; Ohki, Y. Comparison of the effects of heat and gamma irradiation on the degradation of cross-linked polyethylene. IEEJ Trans. Electr. Electron. Eng. 2019, 15, 24–29. [Google Scholar] [CrossRef]
- Singh, A. Irradiation of polyethylene: Some aspects of crosslinking and oxidative degradation. Radiat. Phys. Chem. 1999, 56, 375–380. [Google Scholar] [CrossRef]
- Liu, S.; Veysey, S.W.; Fifield, L.S.; Bowler, N. Quantitative analysis of changes in antioxidant in crosslinked polyethylene (XLPE) cable insulation material exposed to heat and gamma radiation. Polym. Degrad. Stab. 2018, 156, 252–258. [Google Scholar] [CrossRef]
- Audran, G.; Dorey, S.; Dupuy, N.; Gaston, F.; Marque, S.R. Degradation of γ-irradiated polyethylene-ethylene vinyl alcohol-polyethylene multilayer films: An ESR study. Polym. Degrad. Stab. 2015, 122, 169–179. [Google Scholar] [CrossRef]
- Gaston, F.; Dupuy, N.; Marque, S.R.A.; Gigmes, D.; Dorey, S. Monitoring of the discoloration on γ-irradiated PE and EVA films to evaluate antioxidant stability. J. Appl. Polym. Sci. 2018, 135, 46114. [Google Scholar] [CrossRef]
- Gaston, F.; Dupuy, N.; Marque, S.R.; Barbaroux, M.; Dorey, S. One year monitoring by FTIR of γ-irradiated multilayer film PE/EVOH/PE. Radiat. Phys. Chem. 2016, 125, 115–121. [Google Scholar] [CrossRef]
- Gaston, F.; Dupuy, N.; Marque, S.R.; Barbaroux, M.; Dorey, S. FTIR study of ageing of γ-irradiated biopharmaceutical EVA based film. Polym. Degrad. Stab. 2016, 129, 19–25. [Google Scholar] [CrossRef]
- Saito, O. On the Effect of High Energy Radiation to Polymers I. Cross-linking and Degradation. J. Phys. Soc. Jpn. 1958, 13, 198–206. [Google Scholar] [CrossRef]
- Saito, O. Effects of High Energy Radiation on Polymers II. End-linking and Gel Fraction. J. Phys. Soc. Jpn. 1958, 13, 1451–1464. [Google Scholar] [CrossRef]
- Seguchi, T.; Tamura, K.; Shimada, A.; Sugimoto, M.; Kudoh, H. Mechanism of antioxidant interaction on polymer oxidation by thermal and radiation ageing. Radiat. Phys. Chem. 2012, 81, 1747–1751. [Google Scholar] [CrossRef]
- Sun, Y.; Chmielewski, A.G. Applications of Ionizing Radiation in Materials Processing; Institute of Nuclear Chemistry and Technology: Warszawa, Poland, 2017. [Google Scholar]
- Dorey, S.; Gaston, F.; Girard-Perier, N.; Dupuy, N.; Marque, S.R.A.; Barbaroux, M.; Audran, G. Identification of chemical species created during γ-irradiation of antioxidant used in polyethylene and polyethylene-co-vinyl acetate multilayer film. J. Appl. Polym. Sci. 2020, 137, e49336. [Google Scholar] [CrossRef]
- Stoffers, N.H.; Linssen, J.P.; Franz, R.; Welle, F. Migration and sensory evaluation of irradiated polymers. Radiat. Phys. Chem. 2004, 71, 205–208. [Google Scholar] [CrossRef]
- Girard-Perier, N.; Dorey, S.; Marque, S.R.; Dupuy, N. Mapping the scientific research on the gamma irradiated polymers degradation (1975–2018). Radiat. Phys. Chem. 2020, 168, 108577. [Google Scholar] [CrossRef]
- Gillen, K.; Clough, R.; Dhooge, N. Density profiling of polymers. Polymer 1986, 27, 225–232. [Google Scholar] [CrossRef]
- Baccaro, S.; Buontempo, U.; D’Atanasio, P. Radiation induced degradation of EPR by IR oxidation profiling. Radiat. Phys. Chem. 1993, 42, 211–214. [Google Scholar] [CrossRef]
- Gemperline, P.J. Mixture analysis using factor analysis I: Calibration and quantitation. J. Chemom. 1989, 3, 549–568. [Google Scholar] [CrossRef]
- Hamilton, J.C.; Gemperline, P.J. Mixture analysis using factor analysis. II: Self-modeling curve resolution. J. Chemom. 1990, 4, 1–13. [Google Scholar] [CrossRef]
- Windig, W.; Guilment, J. Interactive self-modeling mixture analysis. Anal. Chem. 1991, 63, 1425–1432. [Google Scholar] [CrossRef]
- Windig, W.; Stephenson, D.A. Self-modeling mixture analysis of second-derivative near-infrared spectral data using the SIMPLISMA approach. Anal. Chem. 1992, 64, 2735–2742. [Google Scholar] [CrossRef]
- Windig, W. The use of second-derivative spectra for pure-variable based self-modeling mixture analysis techniques. Chemom. Intell. Lab. Syst. 1994, 23, 71–86. [Google Scholar] [CrossRef]
- Windig, W. Spectral data files for self-modeling curve resolution with examples using the Simplisma approach. Chemom. Intell. Lab. Syst. 1997, 36, 3–16. [Google Scholar] [CrossRef]
- Wold, S.; Geladi, P.; Esbensen, K.; Öhman, J. Multi-way principal components-and PLS-analysis. J. Chemom. 1987, 1, 41–56. [Google Scholar] [CrossRef]
- Socrates, G. Infrared and Raman Characteristic Group Frequencies, 3rd ed.; John Wiley & Sons: Hoboken, NJ, USA, 2001. [Google Scholar]
- Xu, A.; Roland, S.; Colin, X. Physico-chemical characterization of the blooming of Irganox 1076® antioxidant onto the surface of a silane-crosslinked polyethylene. Polym. Degrad. Stab. 2020, 171, 109046. [Google Scholar] [CrossRef]
- Sugimoto, M.; Shimada, A.; Kudoh, H.; Tamura, K.; Seguchi, T. Product analysis for polyethylene degradation by radiation and thermal ageing. Radiat. Phys. Chem. 2013, 82, 69–73. [Google Scholar] [CrossRef]
- Girois, S. Techniques de l’ingénieur. Plastiques et Composites. In Stabilisation des Plastiques: Principes Généraux; Techniques de L’ingénieur: Paris, France, 2013. [Google Scholar]
- Xu, A.; Roland, S.; Colin, X. Thermal ageing of a silane-crosslinked polyethylene stabilised with a thiodipropionate antioxidant. Polym. Degrad. Stab. 2020, 181, 109276. [Google Scholar] [CrossRef]
- Nist Webbook. Available online: https://webbook.nist.gov/chemistry/ (accessed on 6 March 2020).


| Withdrawal | RA(RT)40 | RA(RT)300 |
|---|---|---|
| 1 | 67.1 kGy (42 days) | 67.0 kGy (7 days) |
| 2 | 145.0 kGy (84 days) | 134.0 kGy (14 days) |
| 3 | 220.0 kGy (125 days) | 202.0 kGy (21 days) |
| 4 | 298.0 kGy (168 days) | 269.0 kGy (28 days) |
| 5 | 374.0 kGy (210 days) | 336.0 kGy (35 days) |
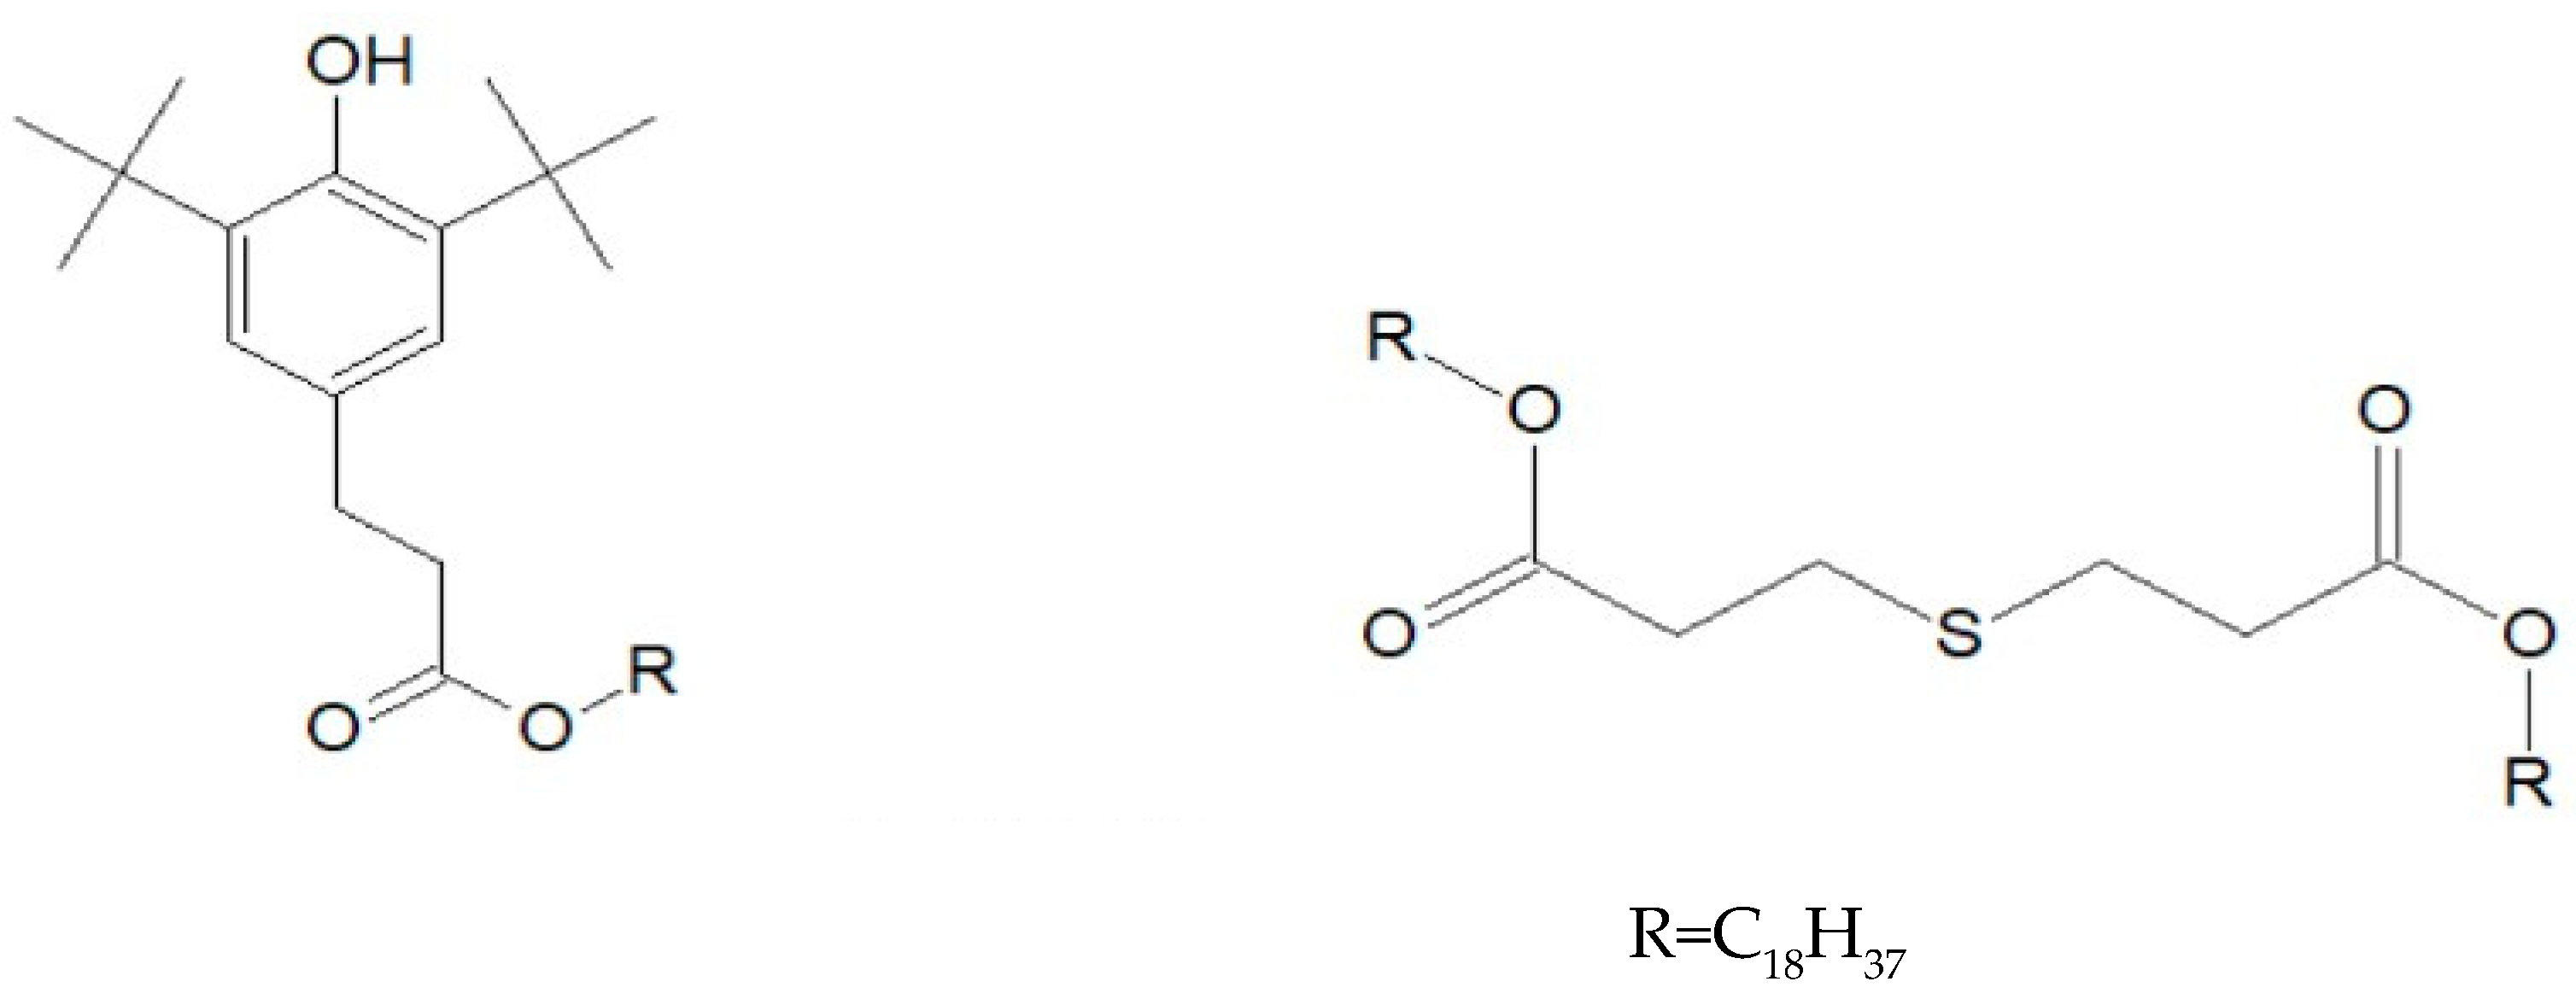
| Functional Group | Type of Vibration | XLPE | XLPE + Irganox 1076 | XLPE + Irganox PS802 | XLPE + ATH | |
|---|---|---|---|---|---|---|
| 3639 | ν–O–H phenol | Stretching | x | |||
| 3621-3372 | ν–Al–OH | O–H stretching | x | |||
| 3000 | ν=C–H aromatic | Stretching | x | |||
| 2954 | ν–CH2–S | CH2 antisymmetric stretching | x | |||
| 2952 | ν–CH3 | Stretching | x | |||
| 2914-2848 | ν–CH2– | Antisymmetric and Symmetric stretching | x | x | x | x |
| 1743-1733 | ν–C=O ester | Stretching | x | x | ||
| 1473-1463 | δ–CH2– | Deformation in the plane | x | x | x | x |
| 1434-1321 | δ–O–H, ν C–O | Combination | x | |||
| 1355 | ω–CH2–S– | Wagging | x | |||
| 1300-1000 | ν–C–O ester | Stretching | x | x | ||
| 1240-1180 | ν–C–O | Asymmetric stretching | x | |||
| 1175-1150 | δ–O–H, ν C–O | Combination | x | |||
| 1120 | δ–C–H aromatic | Deformation | x | |||
| 1020-698 | ν–Al–O | Stretching | x | |||
| 869 | δ=C–H aromatic | Bending | x | |||
| 728-717 | δ–CH2– | Inner rocking vibration of CH2 in the crystalline part | x | x | x | x |
| Formulations | Irradiation Conditions | Spectra |
|---|---|---|
| XLPE without additive | Non irradiated | 1 to 9 |
| 40 Gy/h: 67 to 374 kGy | 10 to 24 | |
| 300 Gy/h: 67 kGy to 336 kGy | 25 to 39 | |
| XLPE + Irg1076 (99% + 1% w/w) | Non irradiated | 40 to 48 |
| 40 Gy/h: 67 to 374 kGy | 49 to 63 | |
| 300 Gy/h: 67 kGy to 336 kGy | 64 to 78 | |
| XLPE + IrgPS802 (99% + 1% w/w) | Non irradiated | 79 to 87 |
| 40 Gy/h: 67 to 374 kGy | 88 to 102 | |
| 300 Gy/h: 67 kGy to 336 kGy | 103 to 117 | |
| XLPE + Irg1076 + IrgPS802 (98% + 1% + 1% w/w) | Non irradiated | 118 to 126 |
| 40 Gy/h: 67 to 374 kGy | 127 to 141 | |
| 300 Gy/h: 67 kGy to 336 kGy | 142 to 156 | |
| XLPE + ATH (67% + 33% w/w) | Non irradiated | 157 to 165 |
| 40 Gy/h: 67 to 374 kGy | 166 to 180 | |
| 300 Gy/h: 67 kGy to 336 kGy | 181 to 195 | |
| XLPE + ATH + Irg1076 + IrgPS802 (65.8% + 32.8% + 0.7% + 0.7% w/w) | Non irradiated | 196 to 204 |
| 40 Gy/h: 67 to 374 kGy | 205 to 219 | |
| 300 Gy/h: 67 kGy to 336 kGy | 220 to 234 |
Publisher’s Note: MDPI stays neutral with regard to jurisdictional claims in published maps and institutional affiliations. |
© 2021 by the authors. Licensee MDPI, Basel, Switzerland. This article is an open access article distributed under the terms and conditions of the Creative Commons Attribution (CC BY) license (https://creativecommons.org/licenses/by/4.0/).
Share and Cite
Maléchaux, A.; Colombani, J.; Amat, S.; Marque, S.R.A.; Dupuy, N. Influence of Gamma Irradiation on Electric Cables Models: Study of Additive Effects by Mid-Infrared Spectroscopy. Polymers 2021, 13, 1451. https://doi.org/10.3390/polym13091451
Maléchaux A, Colombani J, Amat S, Marque SRA, Dupuy N. Influence of Gamma Irradiation on Electric Cables Models: Study of Additive Effects by Mid-Infrared Spectroscopy. Polymers. 2021; 13(9):1451. https://doi.org/10.3390/polym13091451
Chicago/Turabian StyleMaléchaux, Astrid, Juliette Colombani, Sandrine Amat, Sylvain R. A. Marque, and Nathalie Dupuy. 2021. "Influence of Gamma Irradiation on Electric Cables Models: Study of Additive Effects by Mid-Infrared Spectroscopy" Polymers 13, no. 9: 1451. https://doi.org/10.3390/polym13091451
APA StyleMaléchaux, A., Colombani, J., Amat, S., Marque, S. R. A., & Dupuy, N. (2021). Influence of Gamma Irradiation on Electric Cables Models: Study of Additive Effects by Mid-Infrared Spectroscopy. Polymers, 13(9), 1451. https://doi.org/10.3390/polym13091451