The Influence of Nanofiller Shape and Nature on the Functional Properties of Waterborne Poly(urethane-urea) Nanocomposite Films

 ,
, 
Abstract
:
1. Introduction
2. Experimental
2.1. Materials
2.2. Preparation Procedure
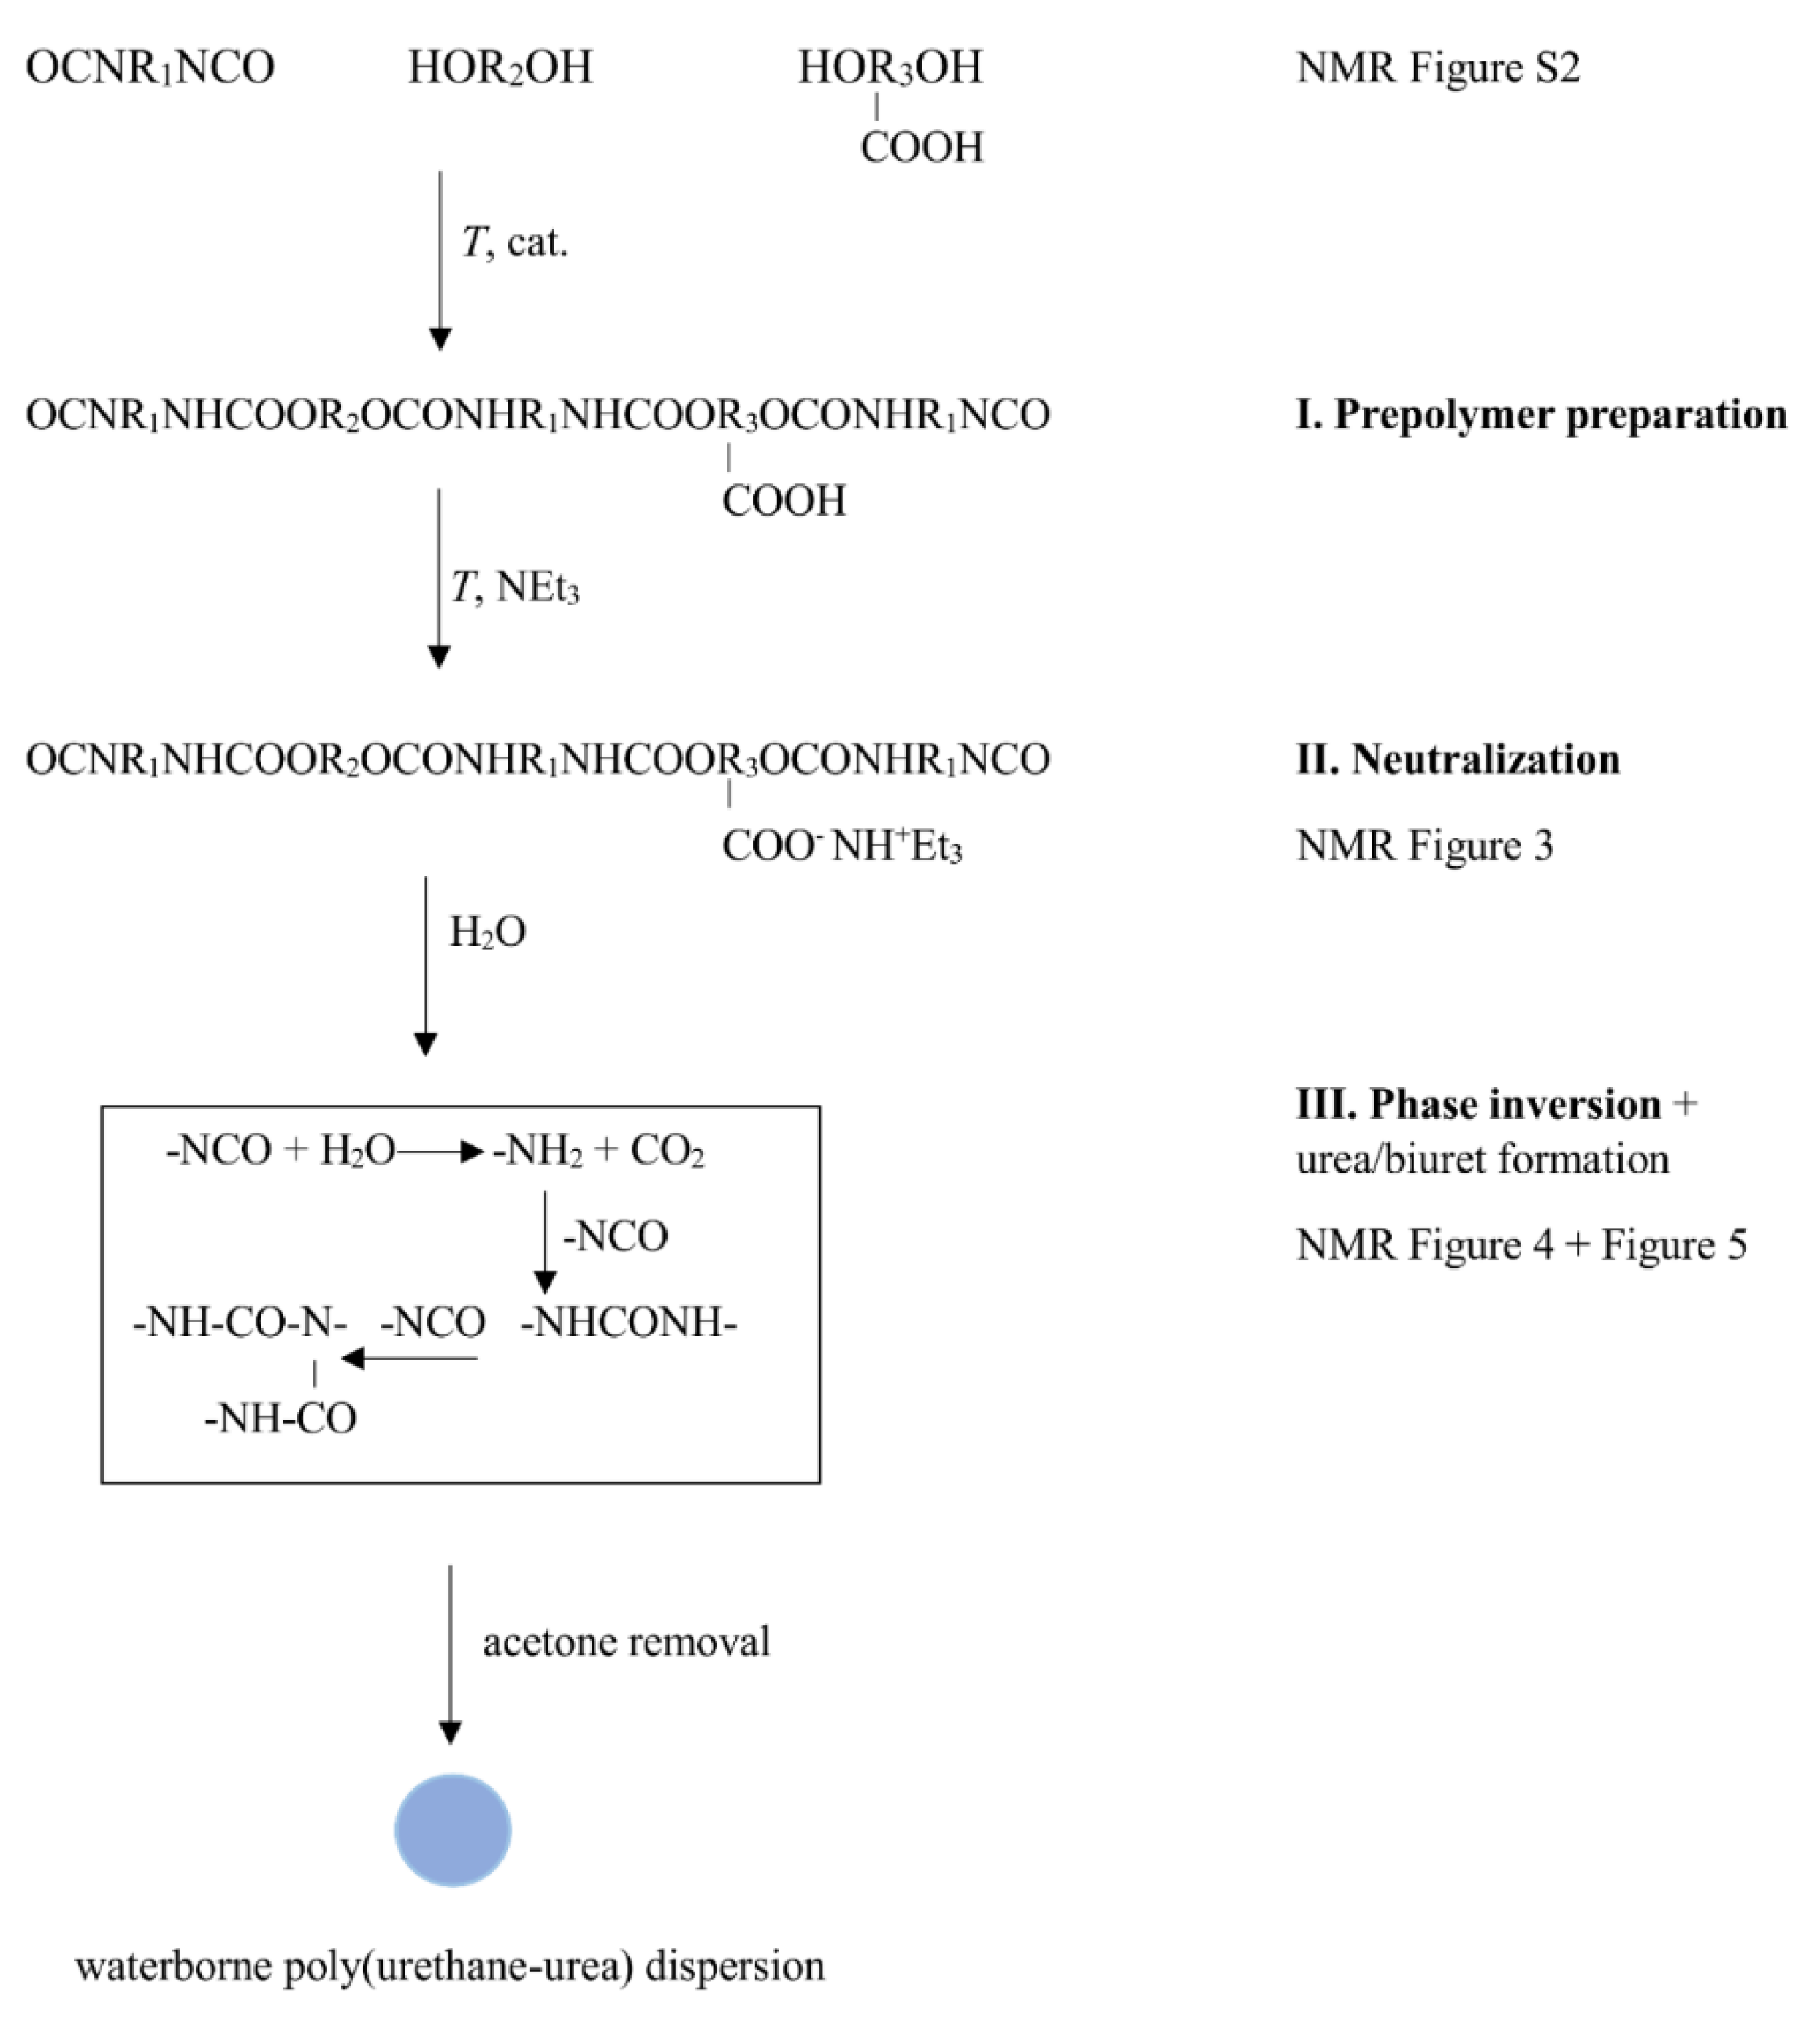
2.2.1. Polyurethane-Urea Water Dispersion (PUUD)
2.2.2. Nanocomposite Preparation
2.3. Methods of Characterization
3. Results and Discussion
3.1. Dispersion Formation
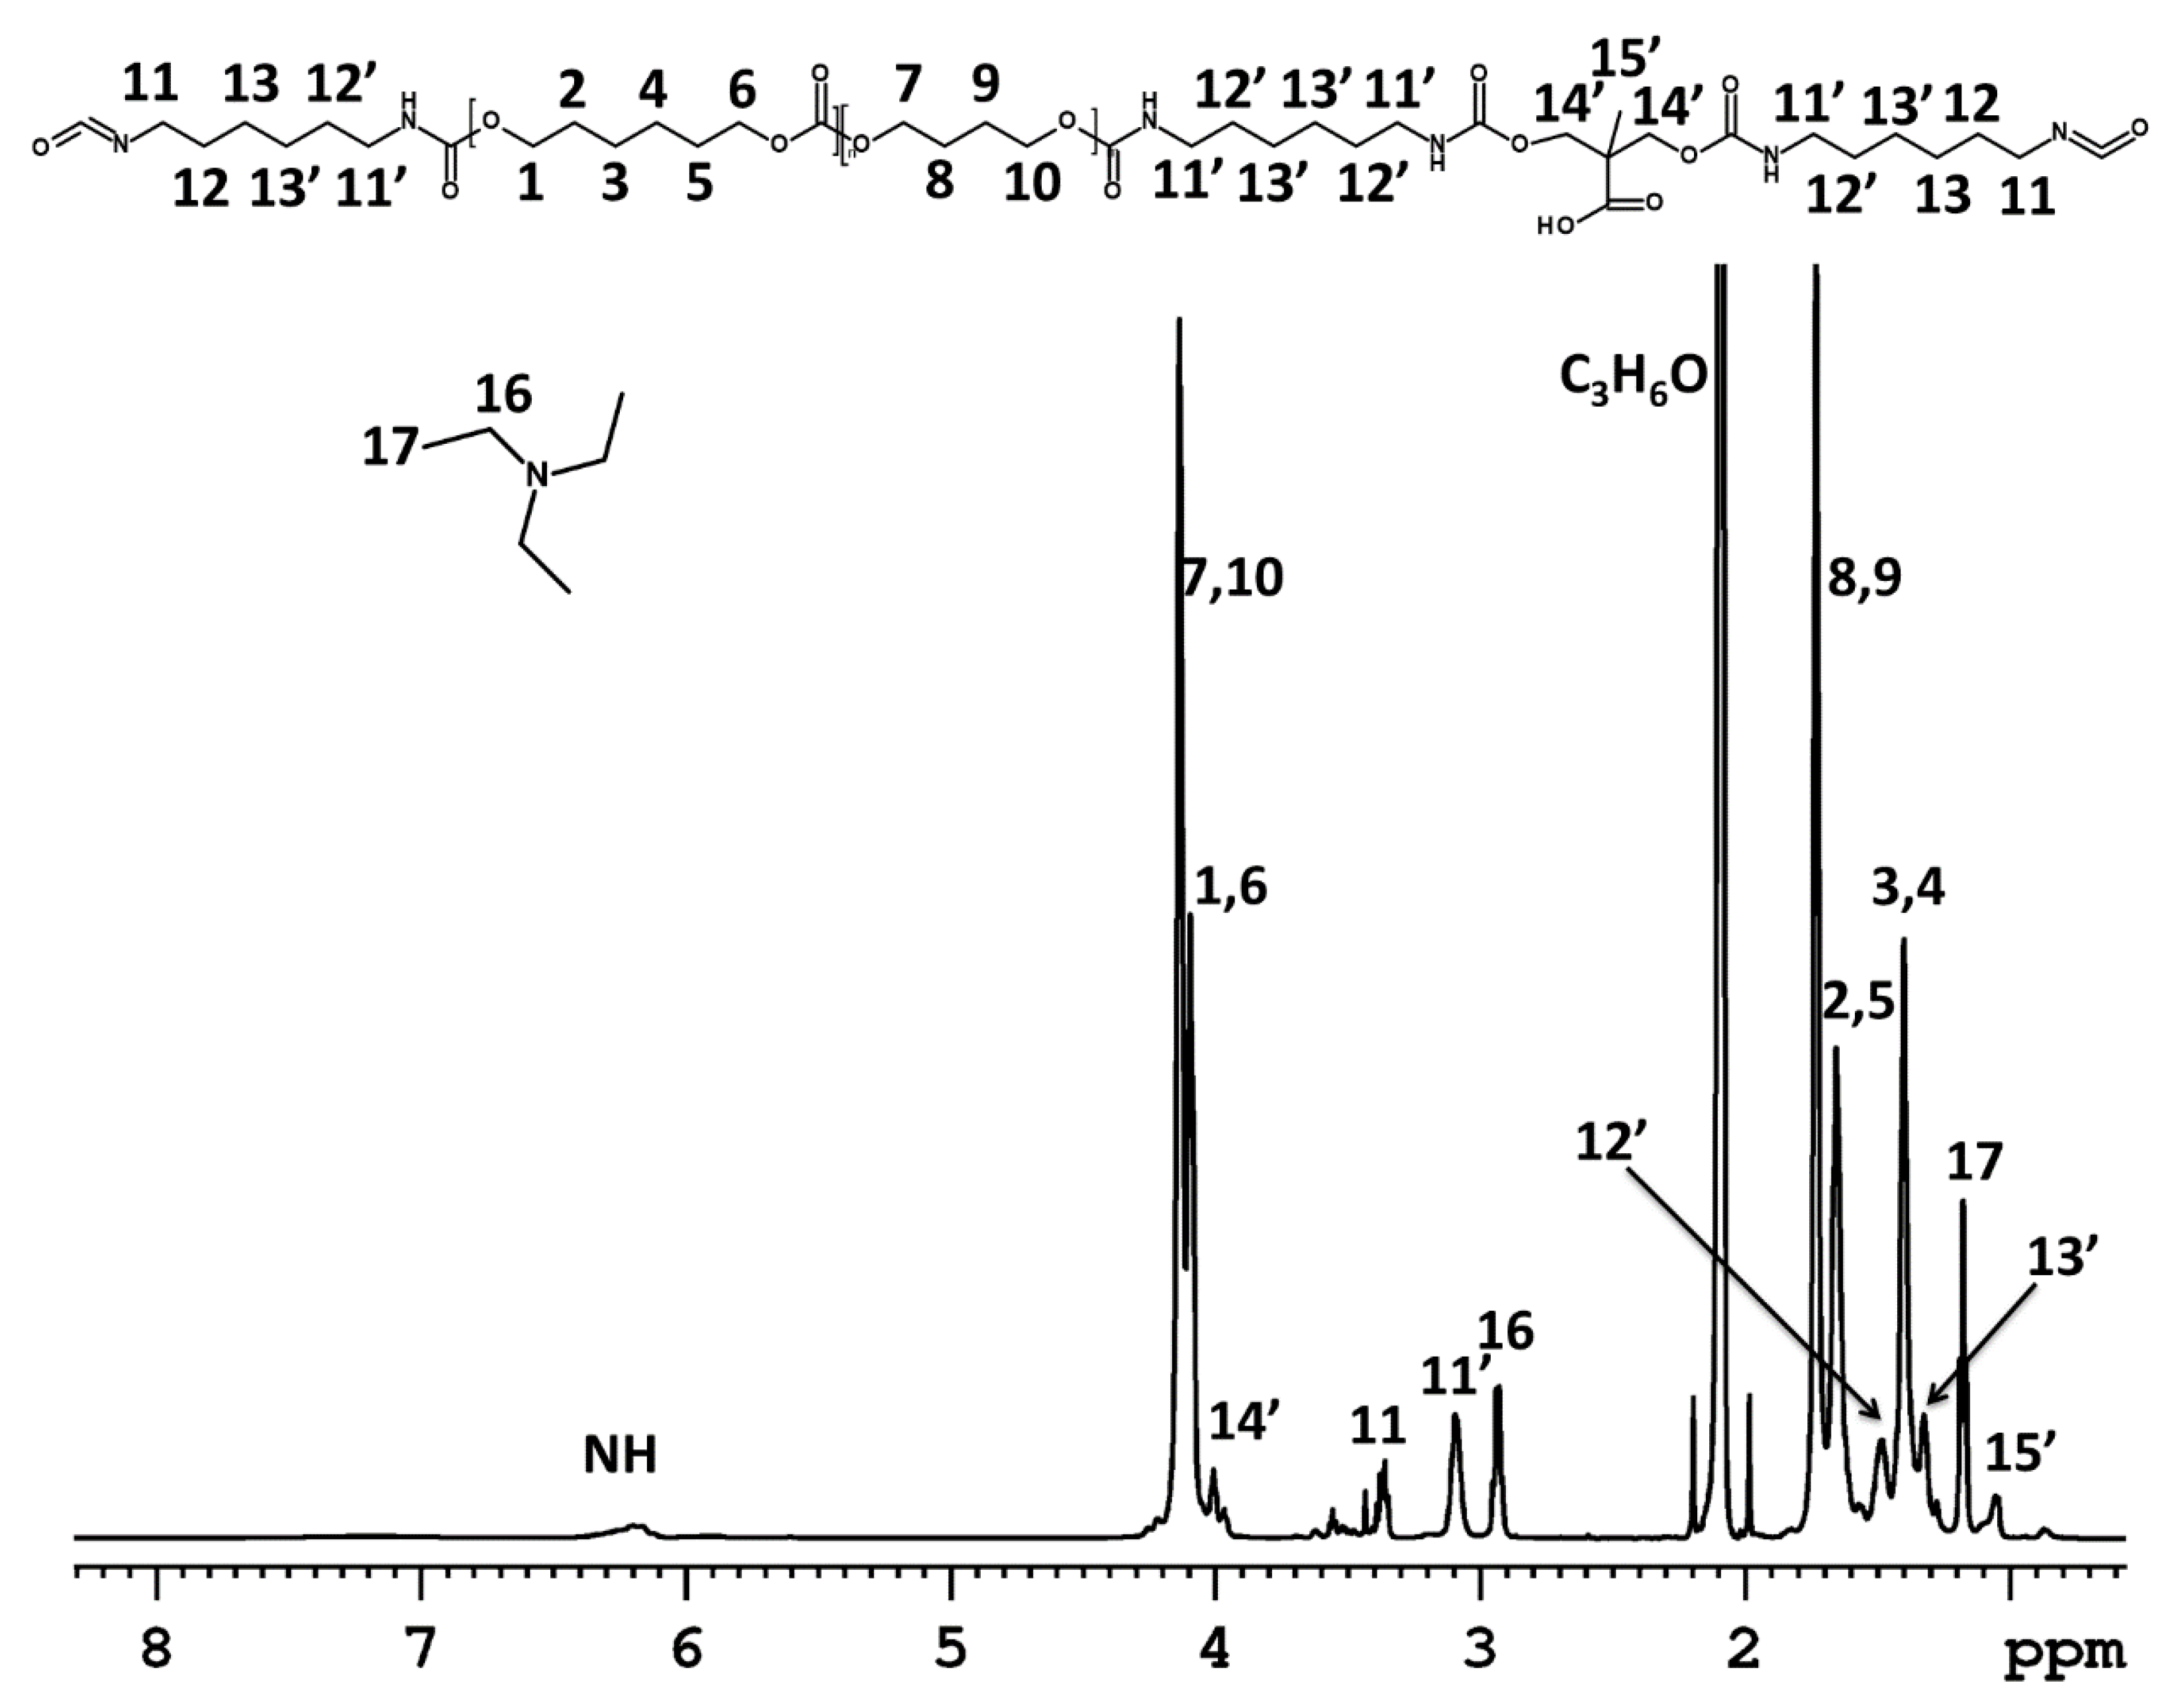
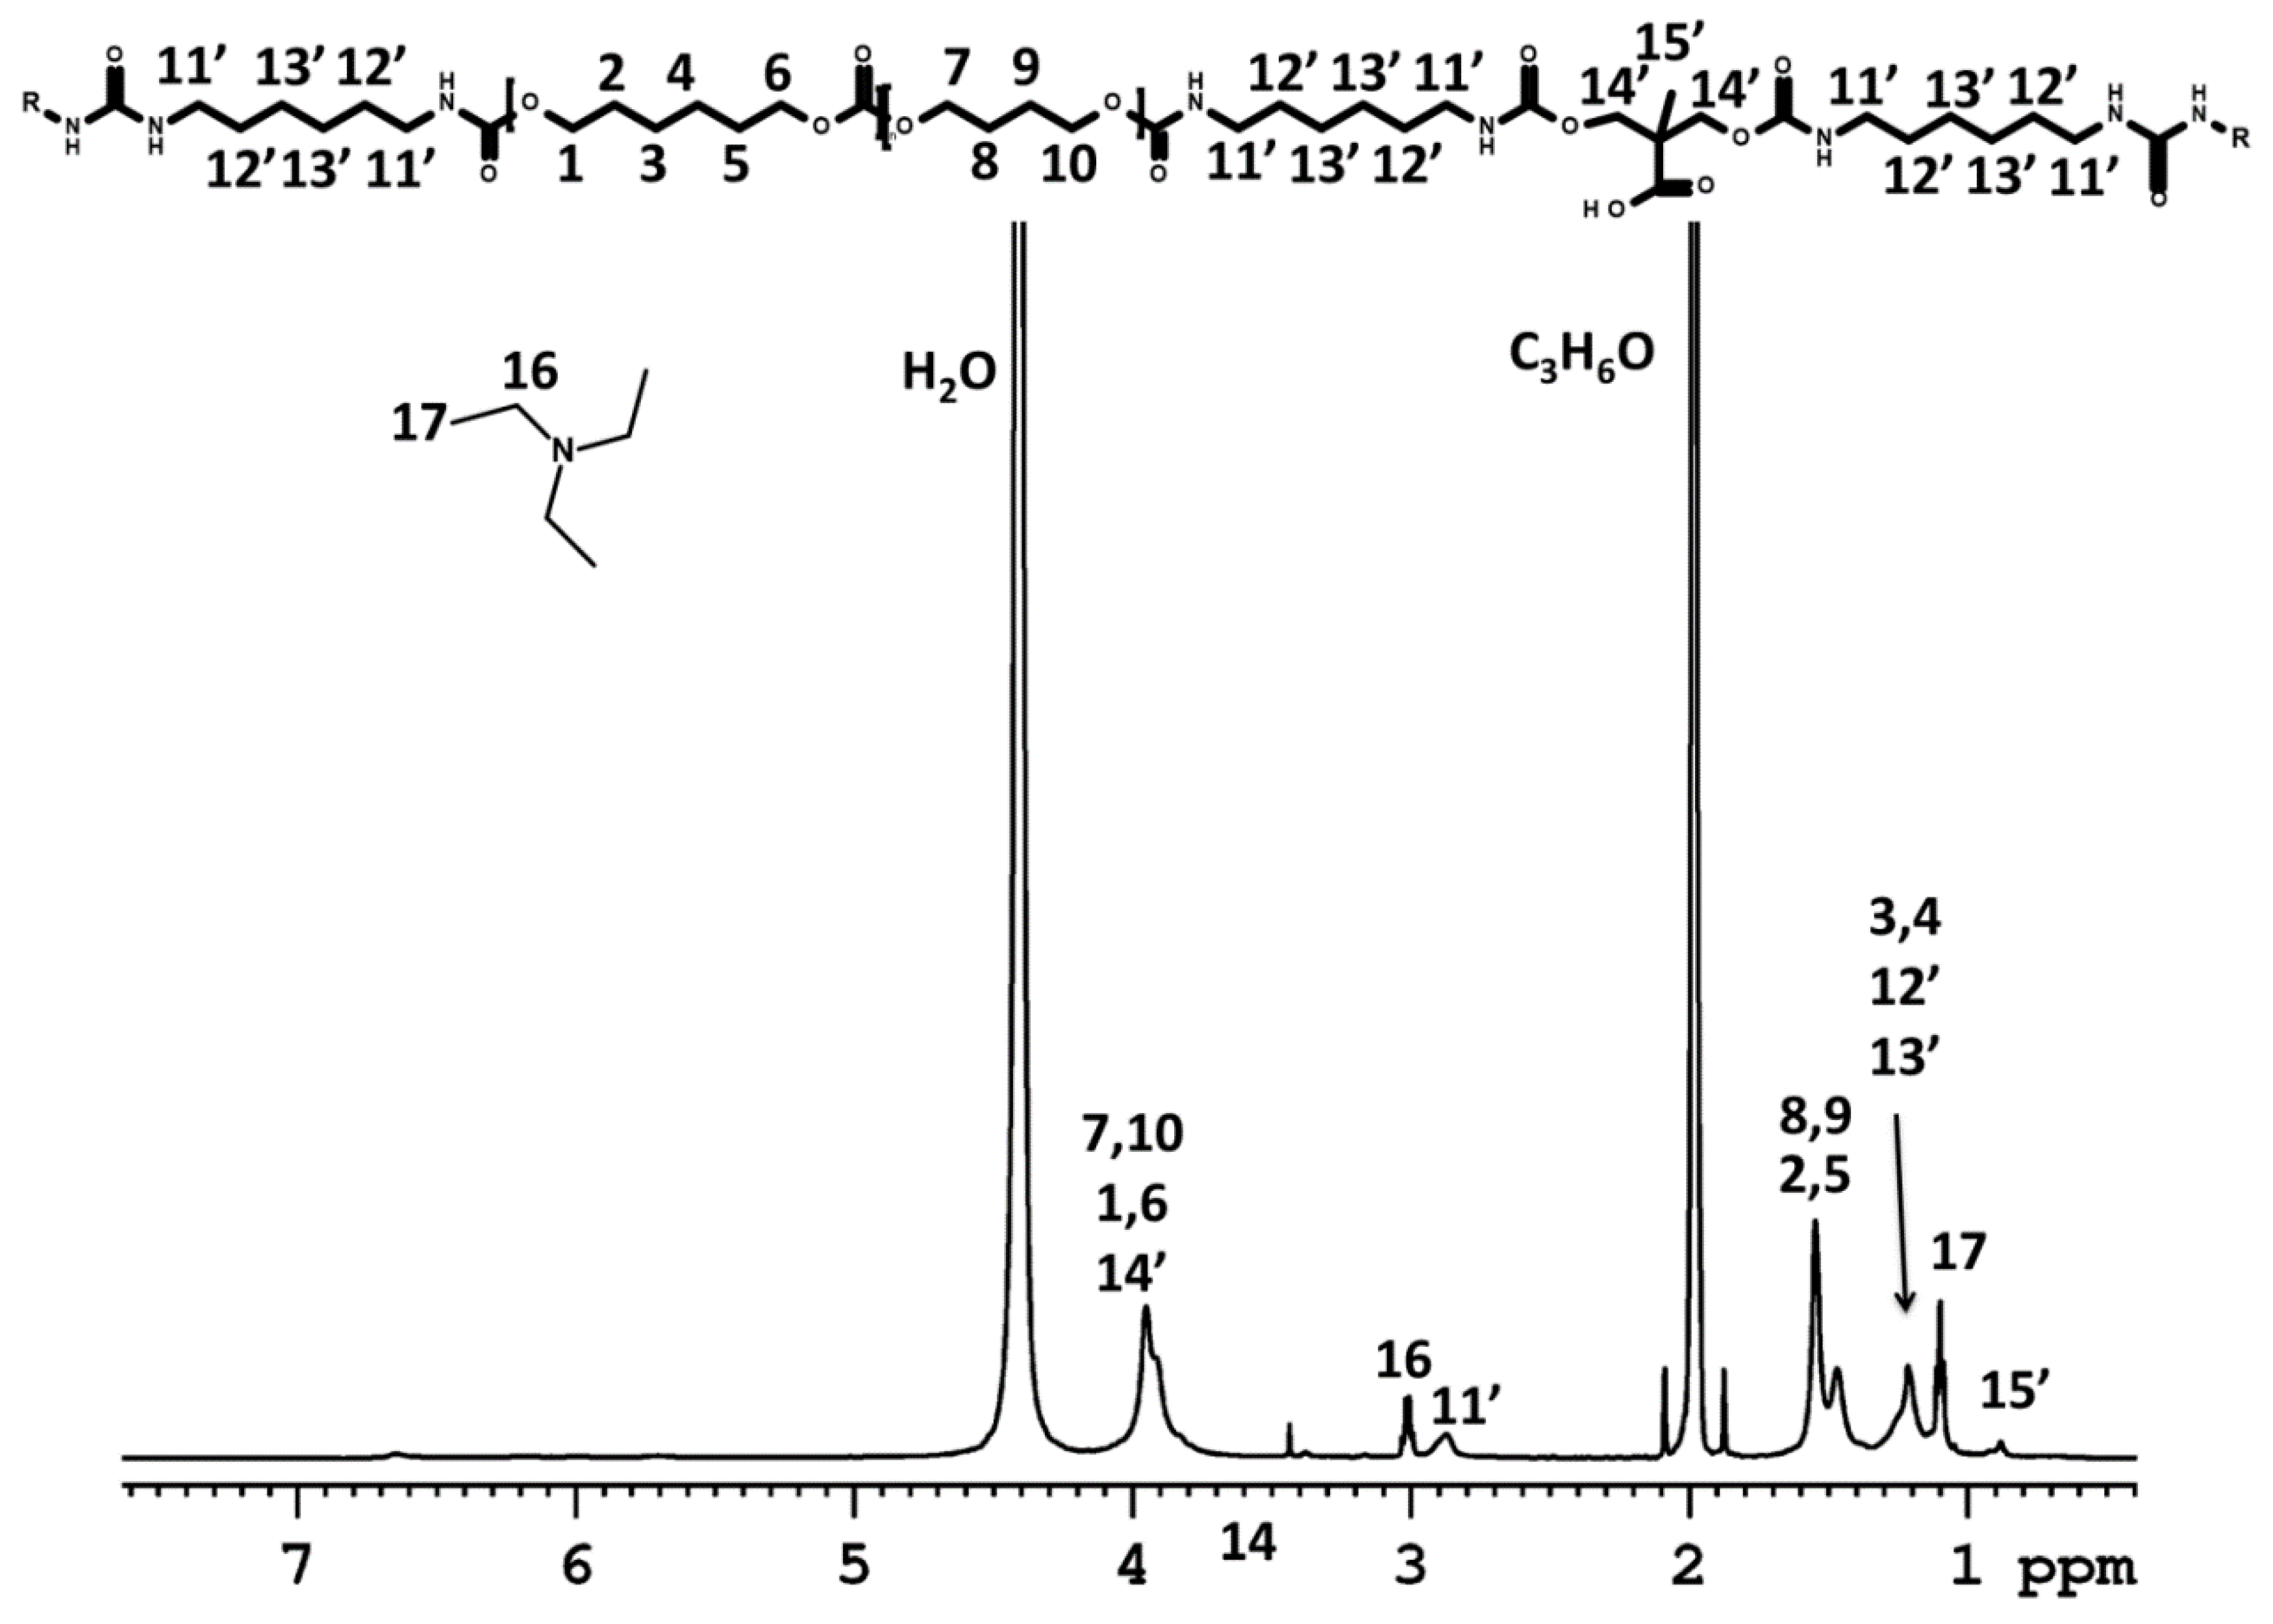
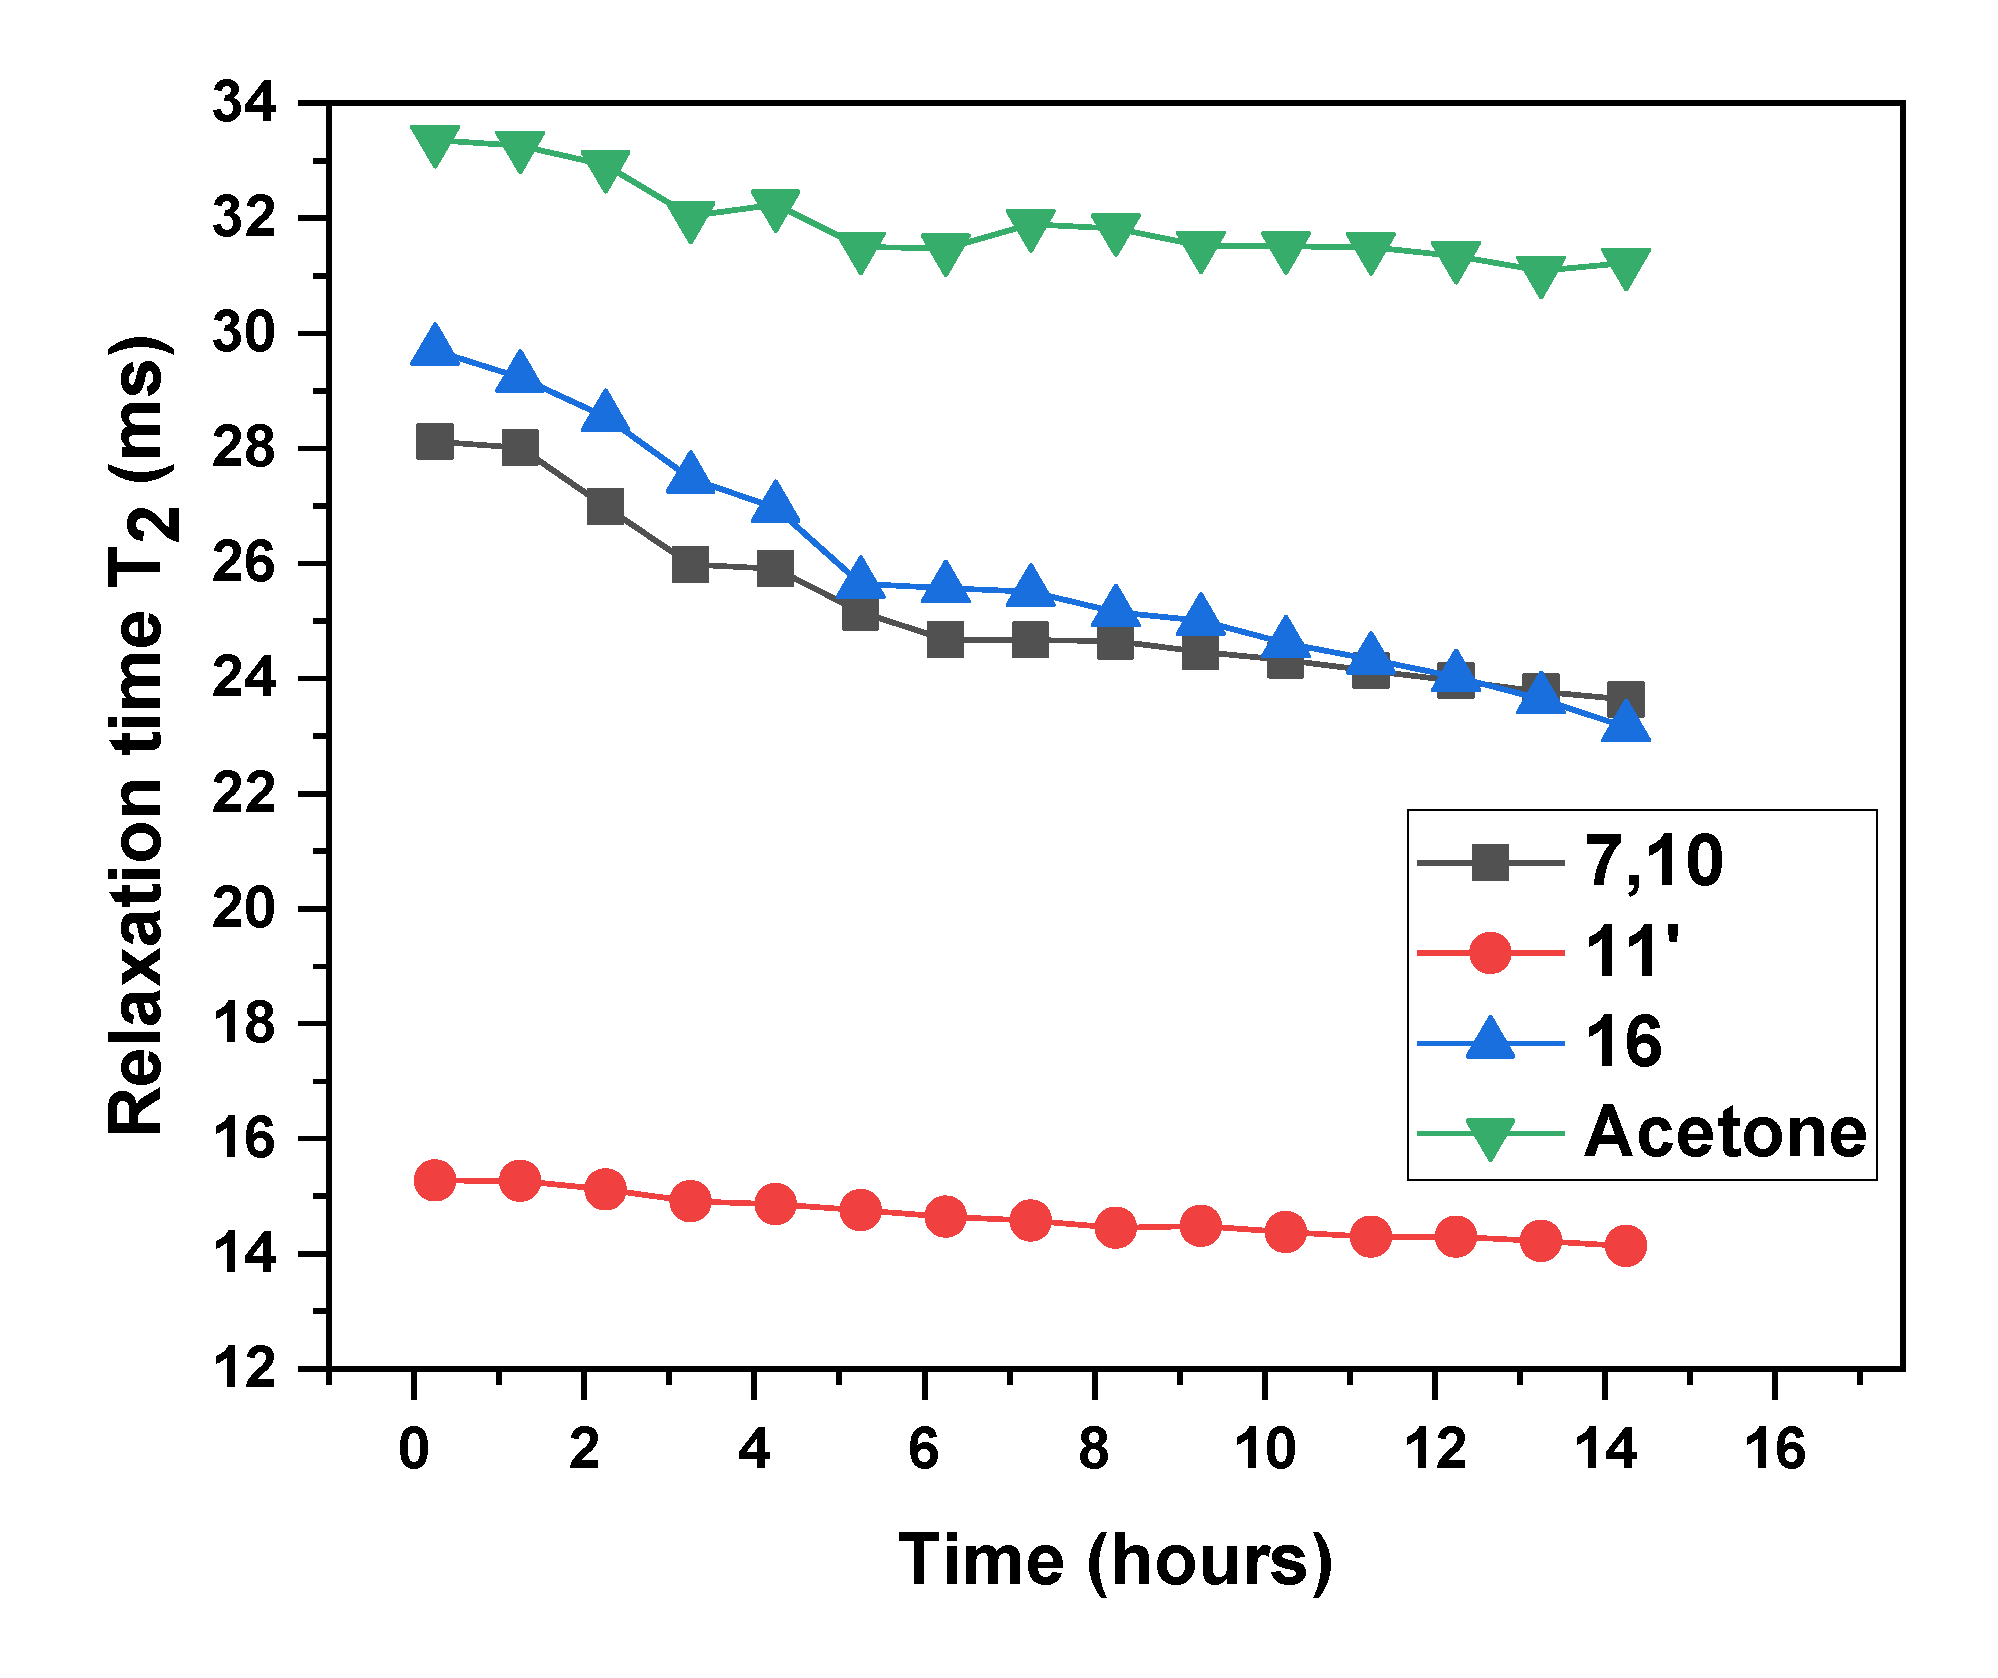
NMR Spectroscopy
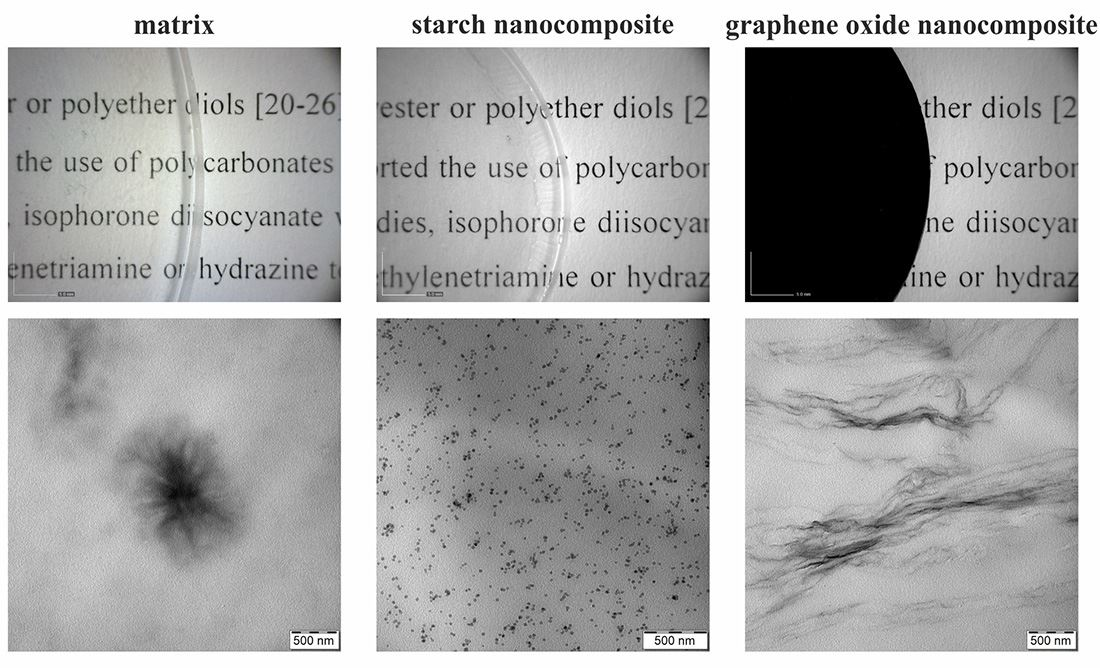
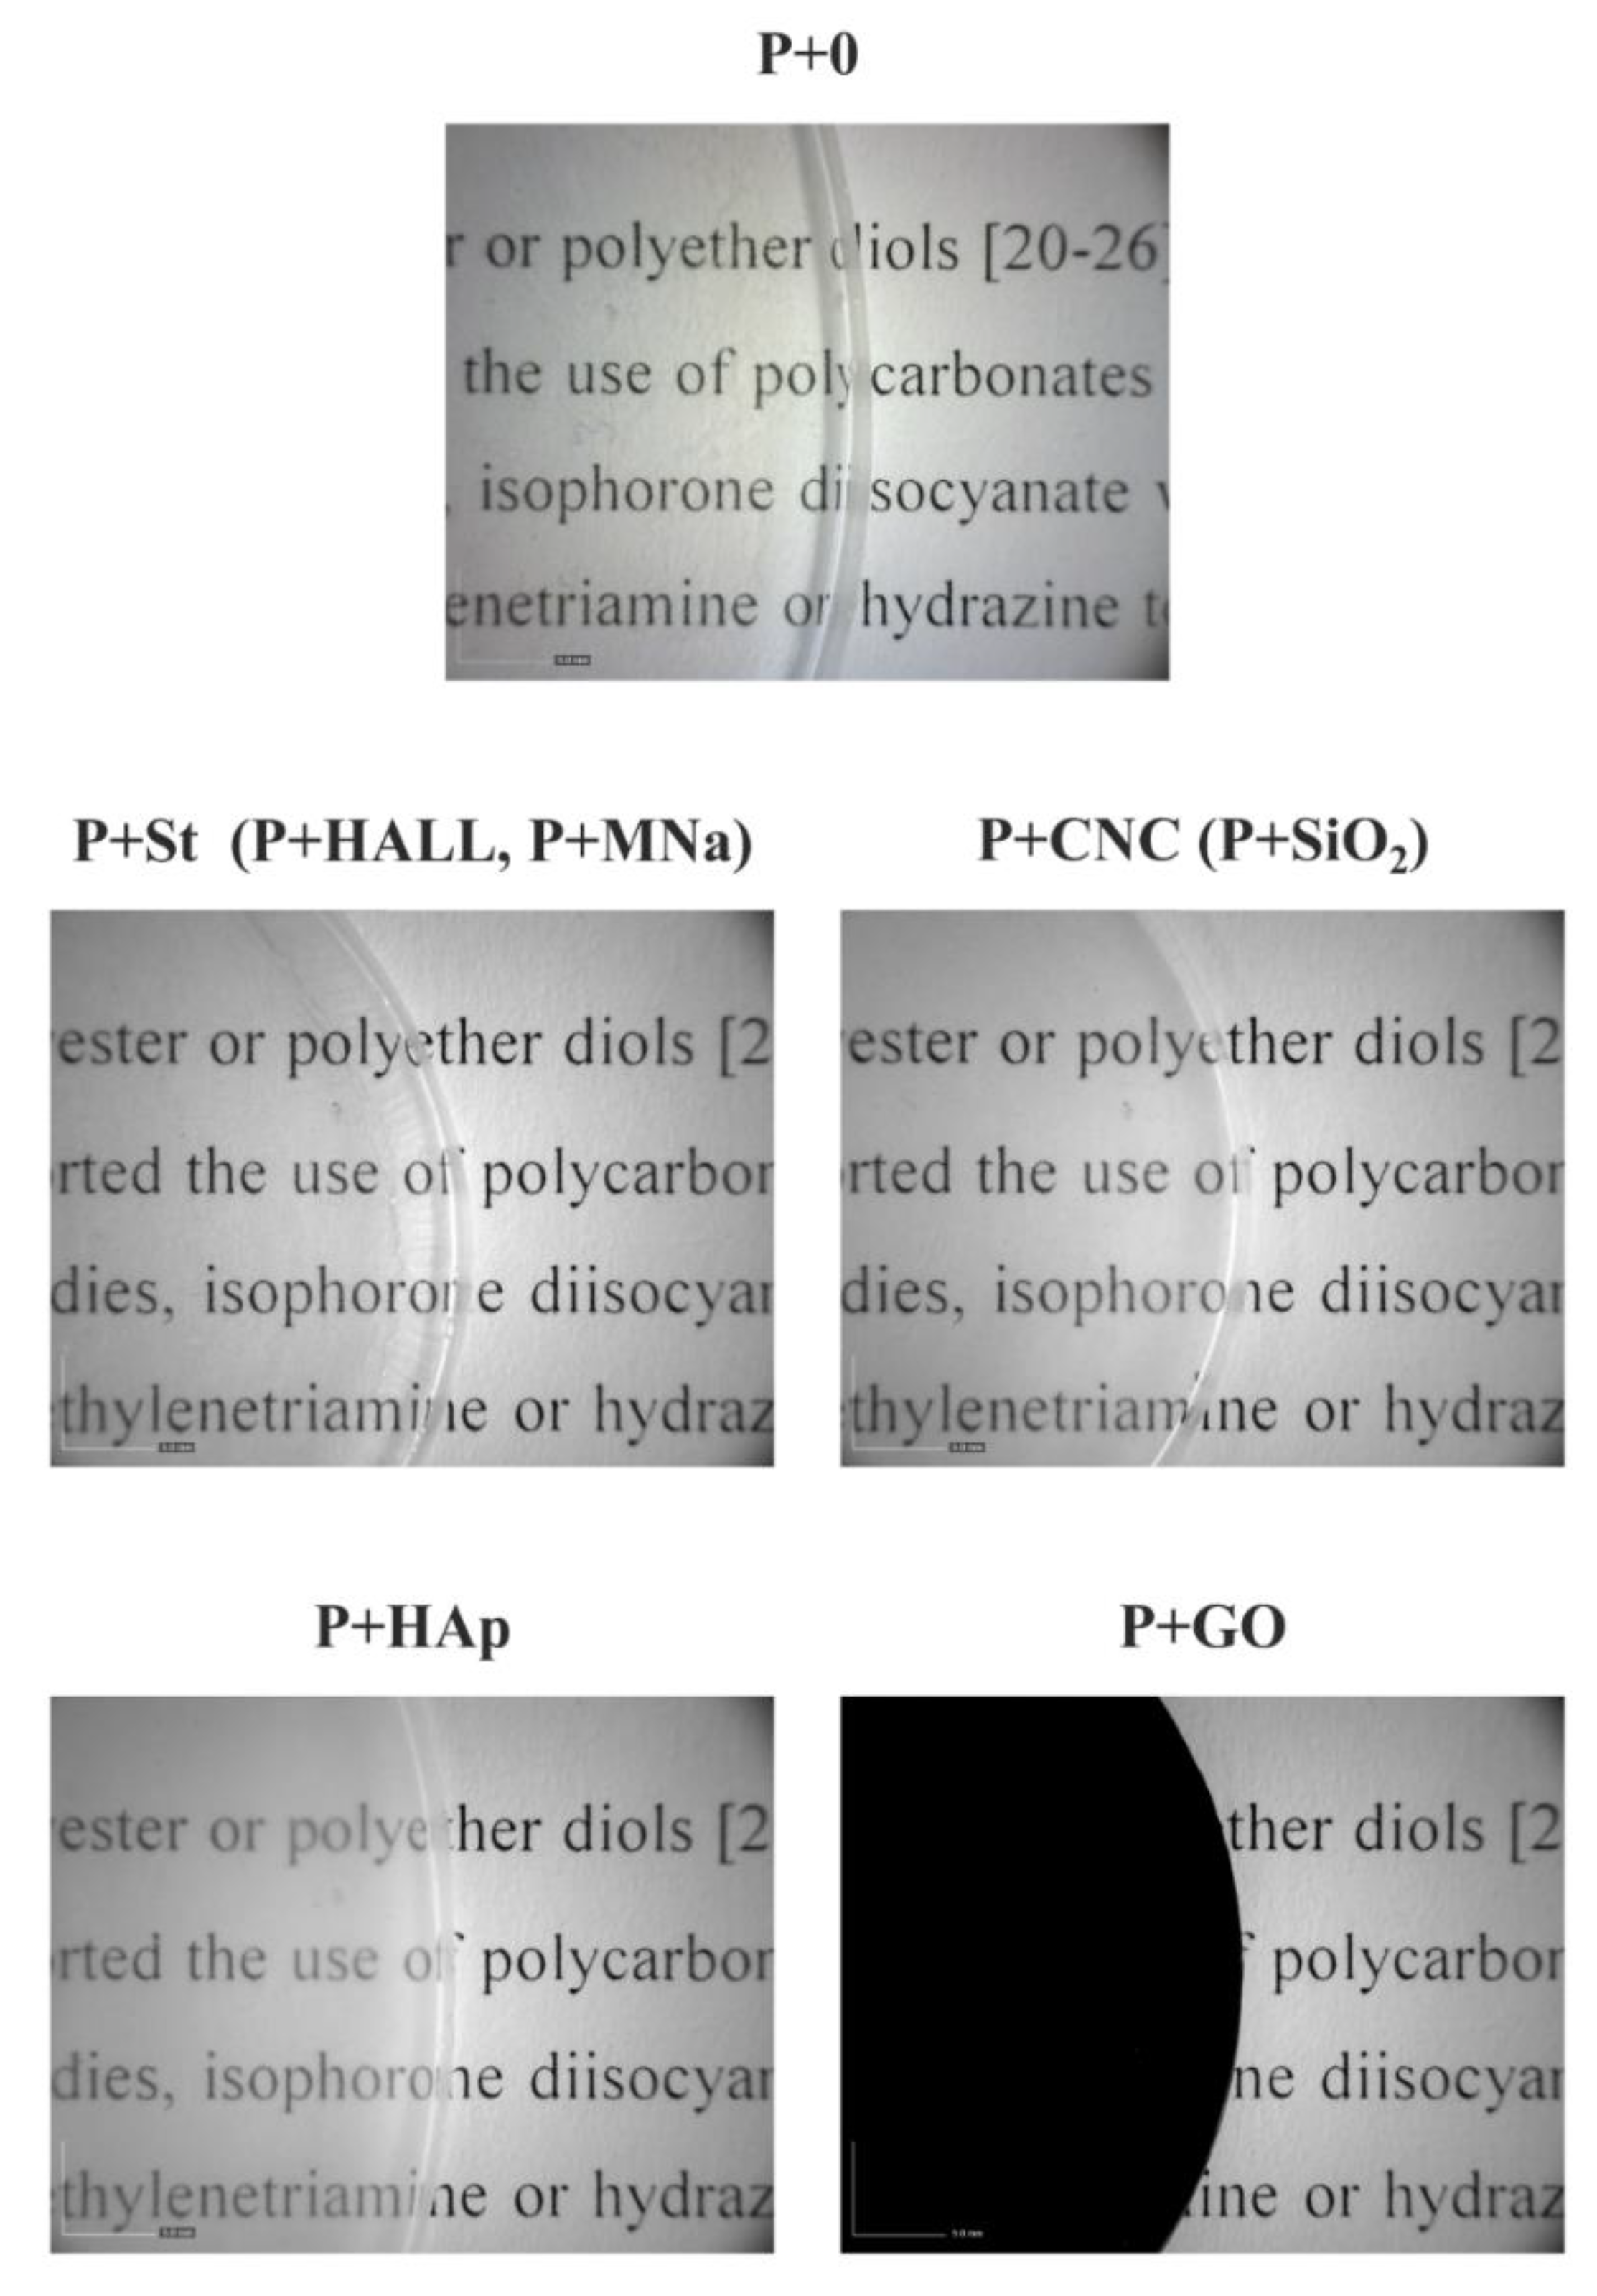
3.2. Film Formation
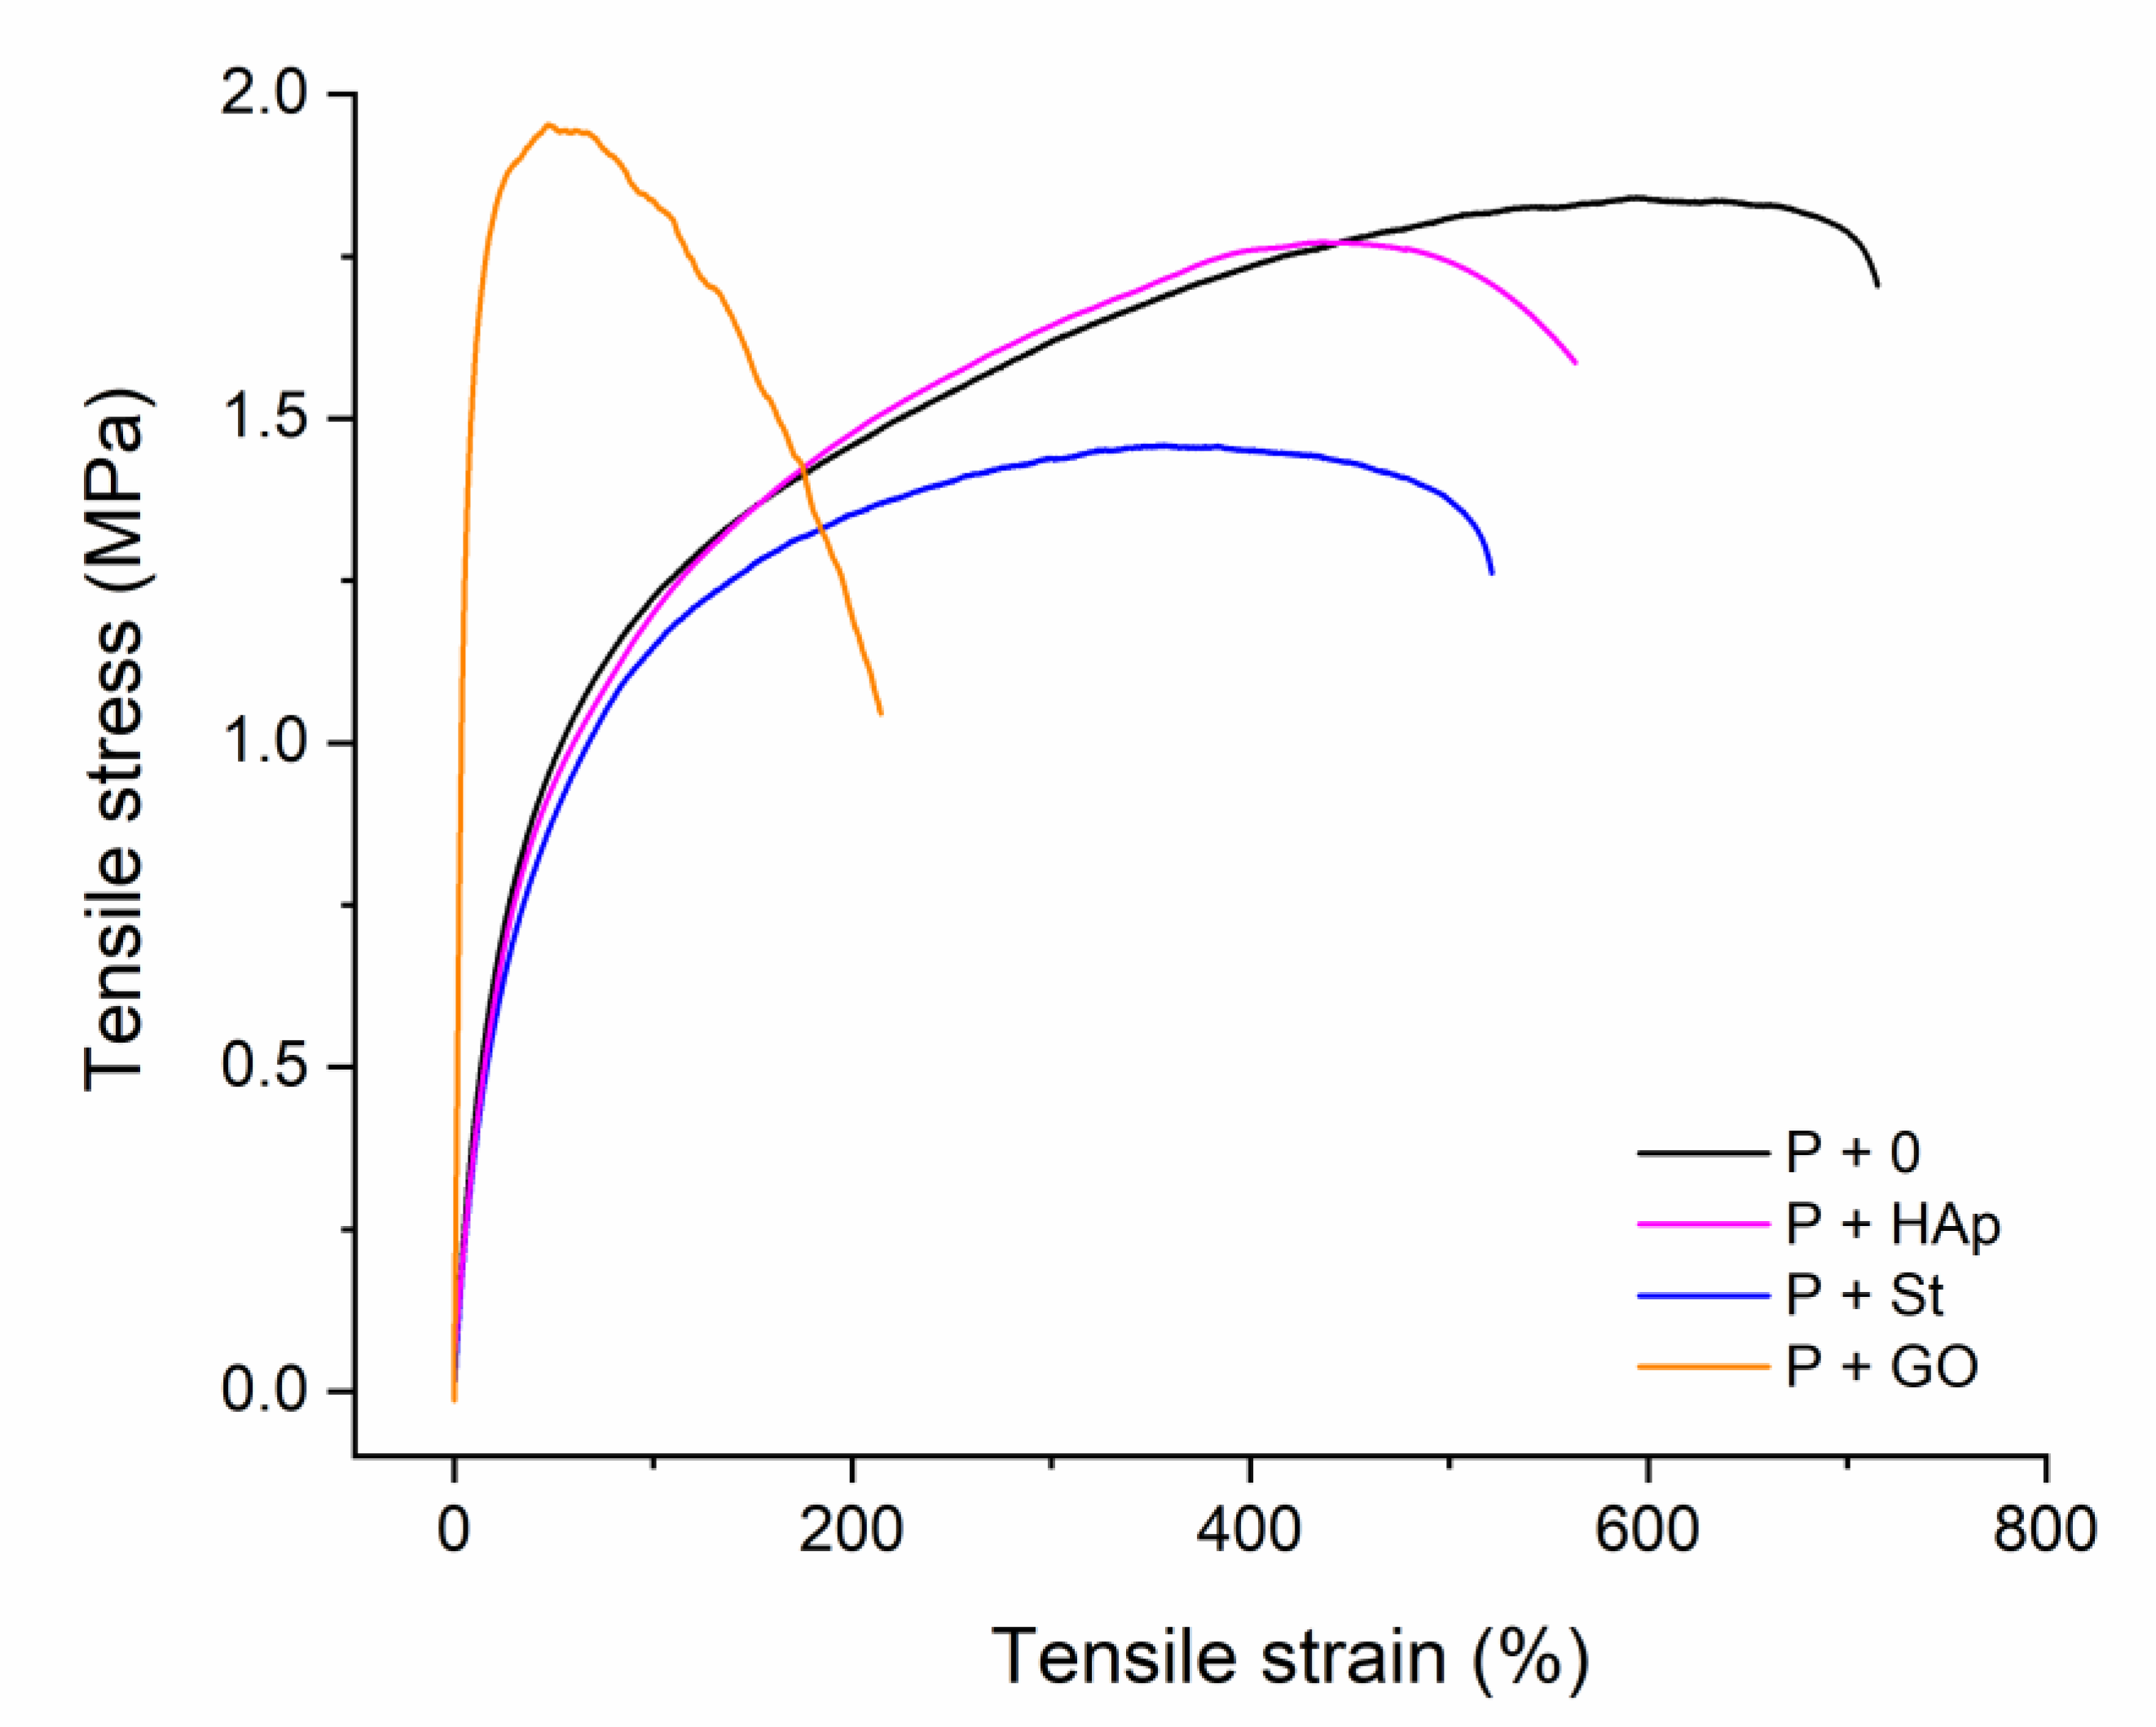
3.3. Tensile Properties
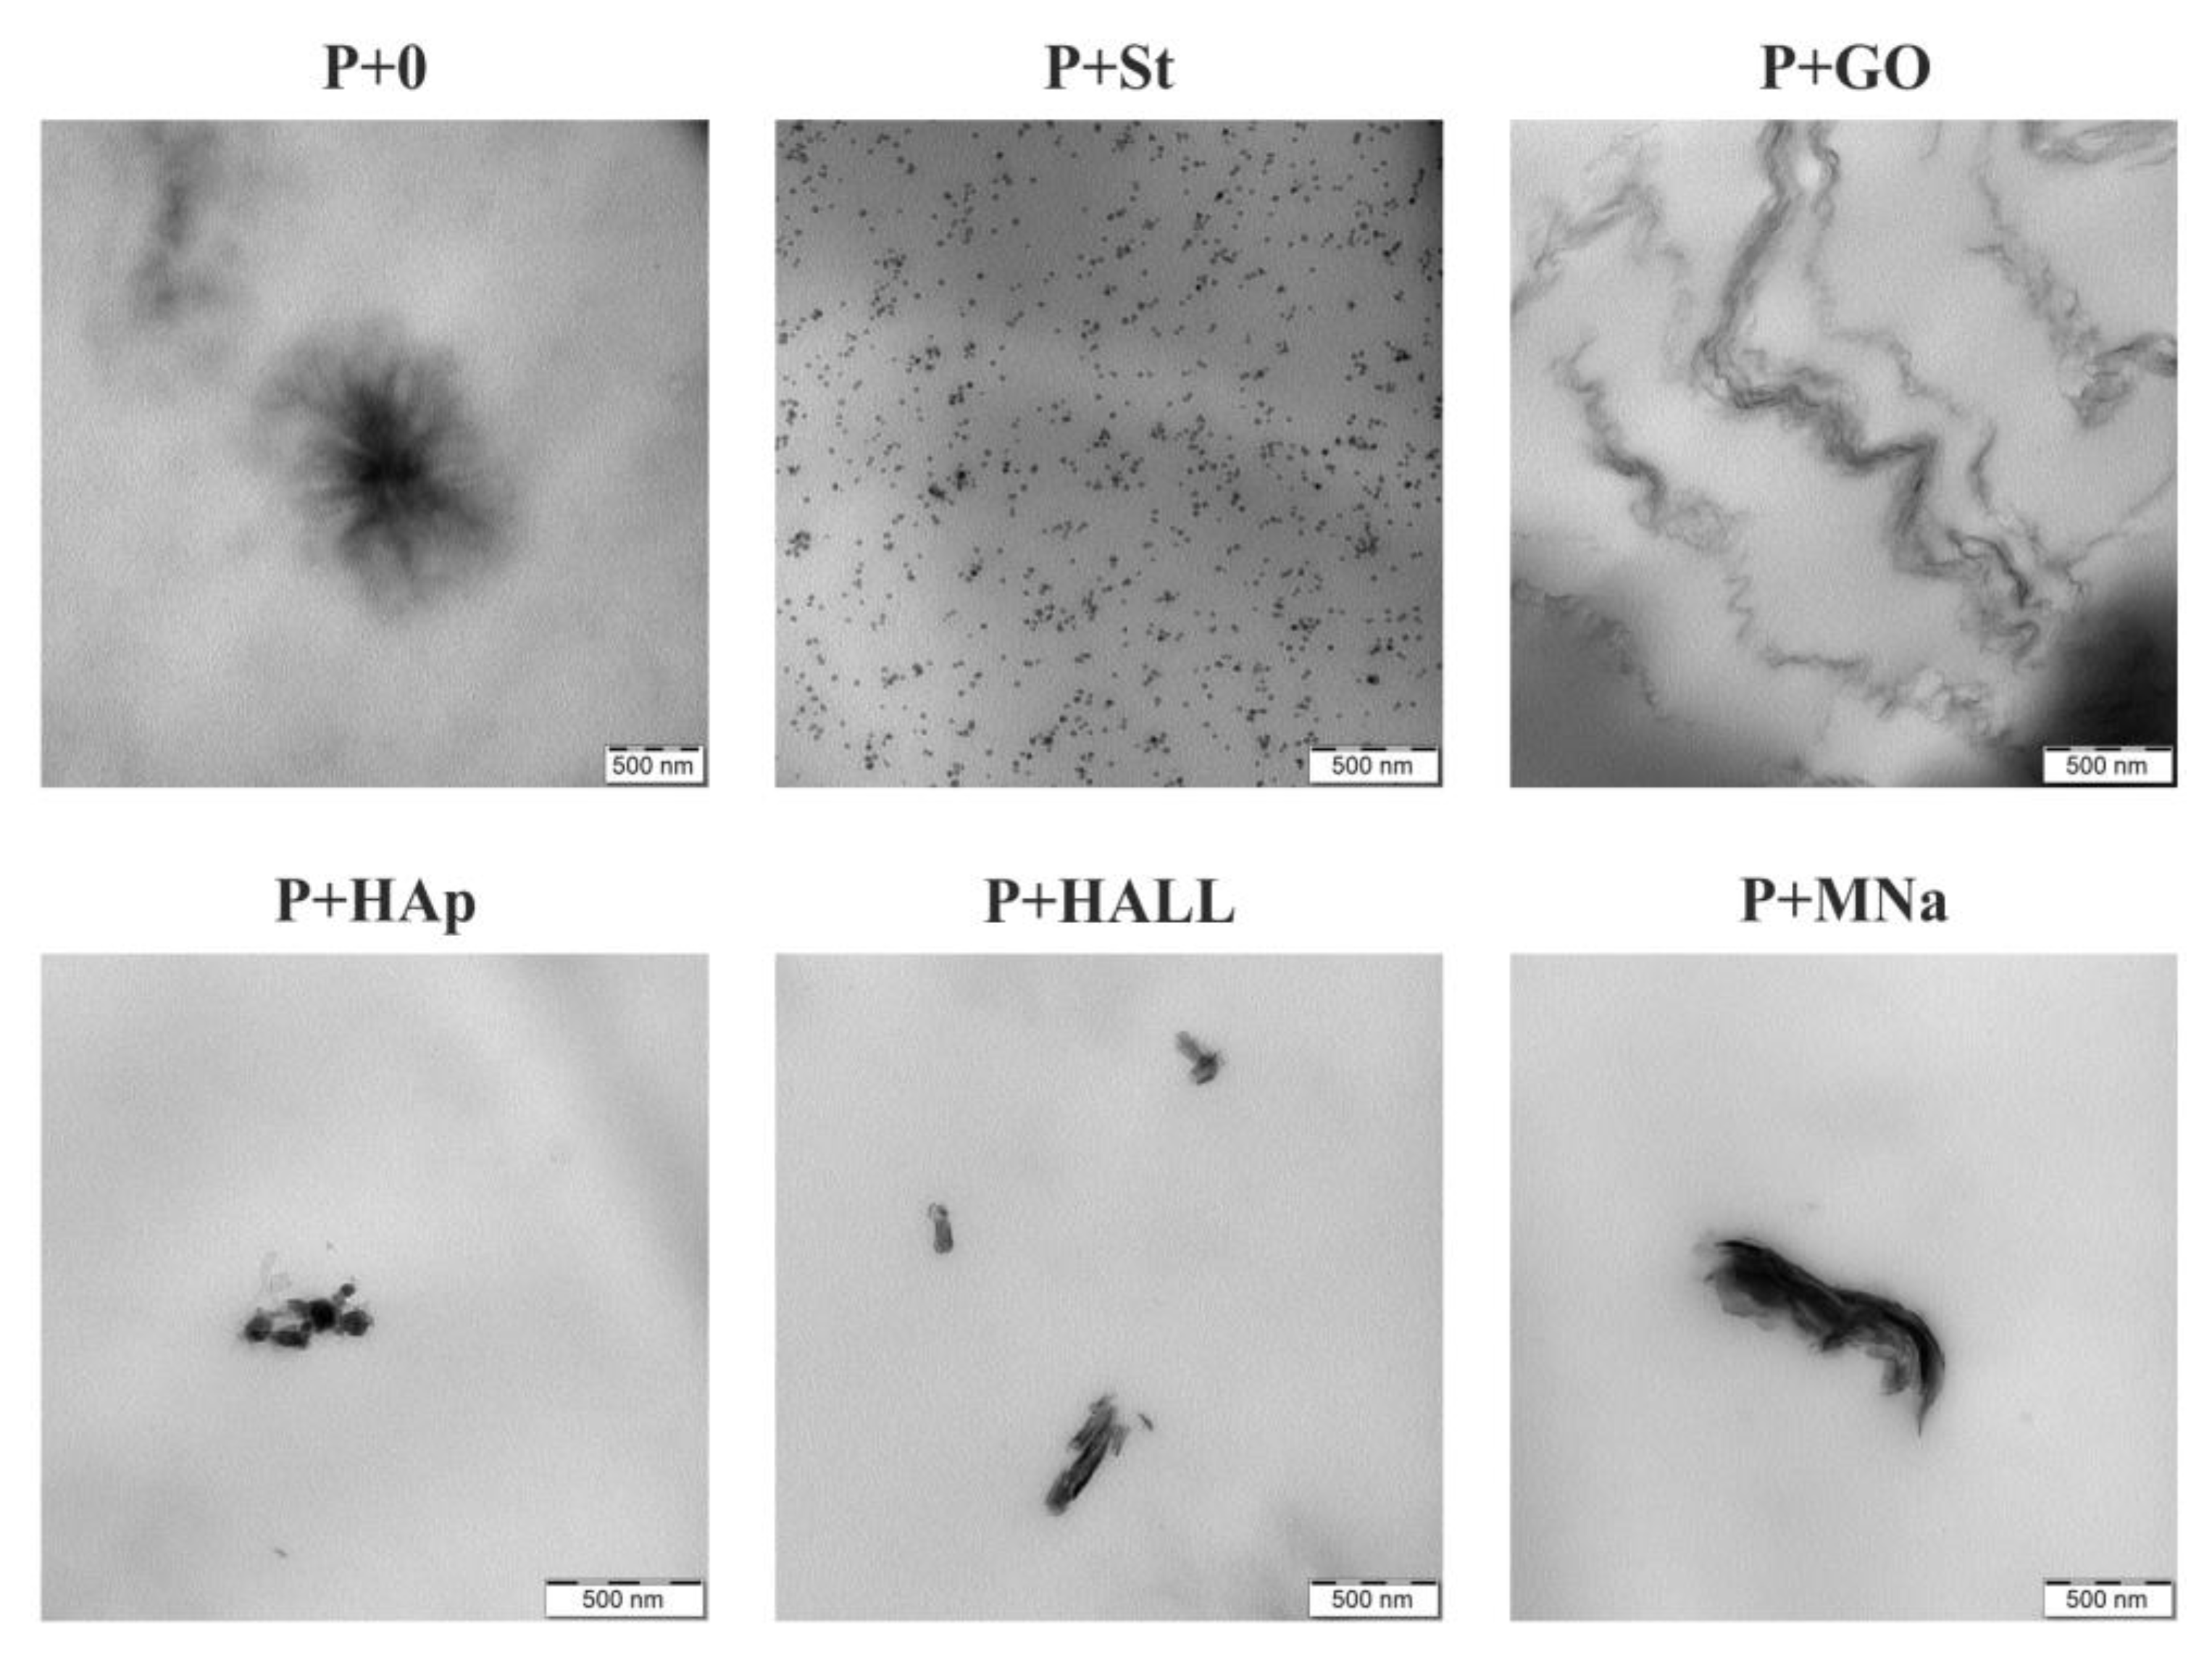
3.4. TEM Analysis
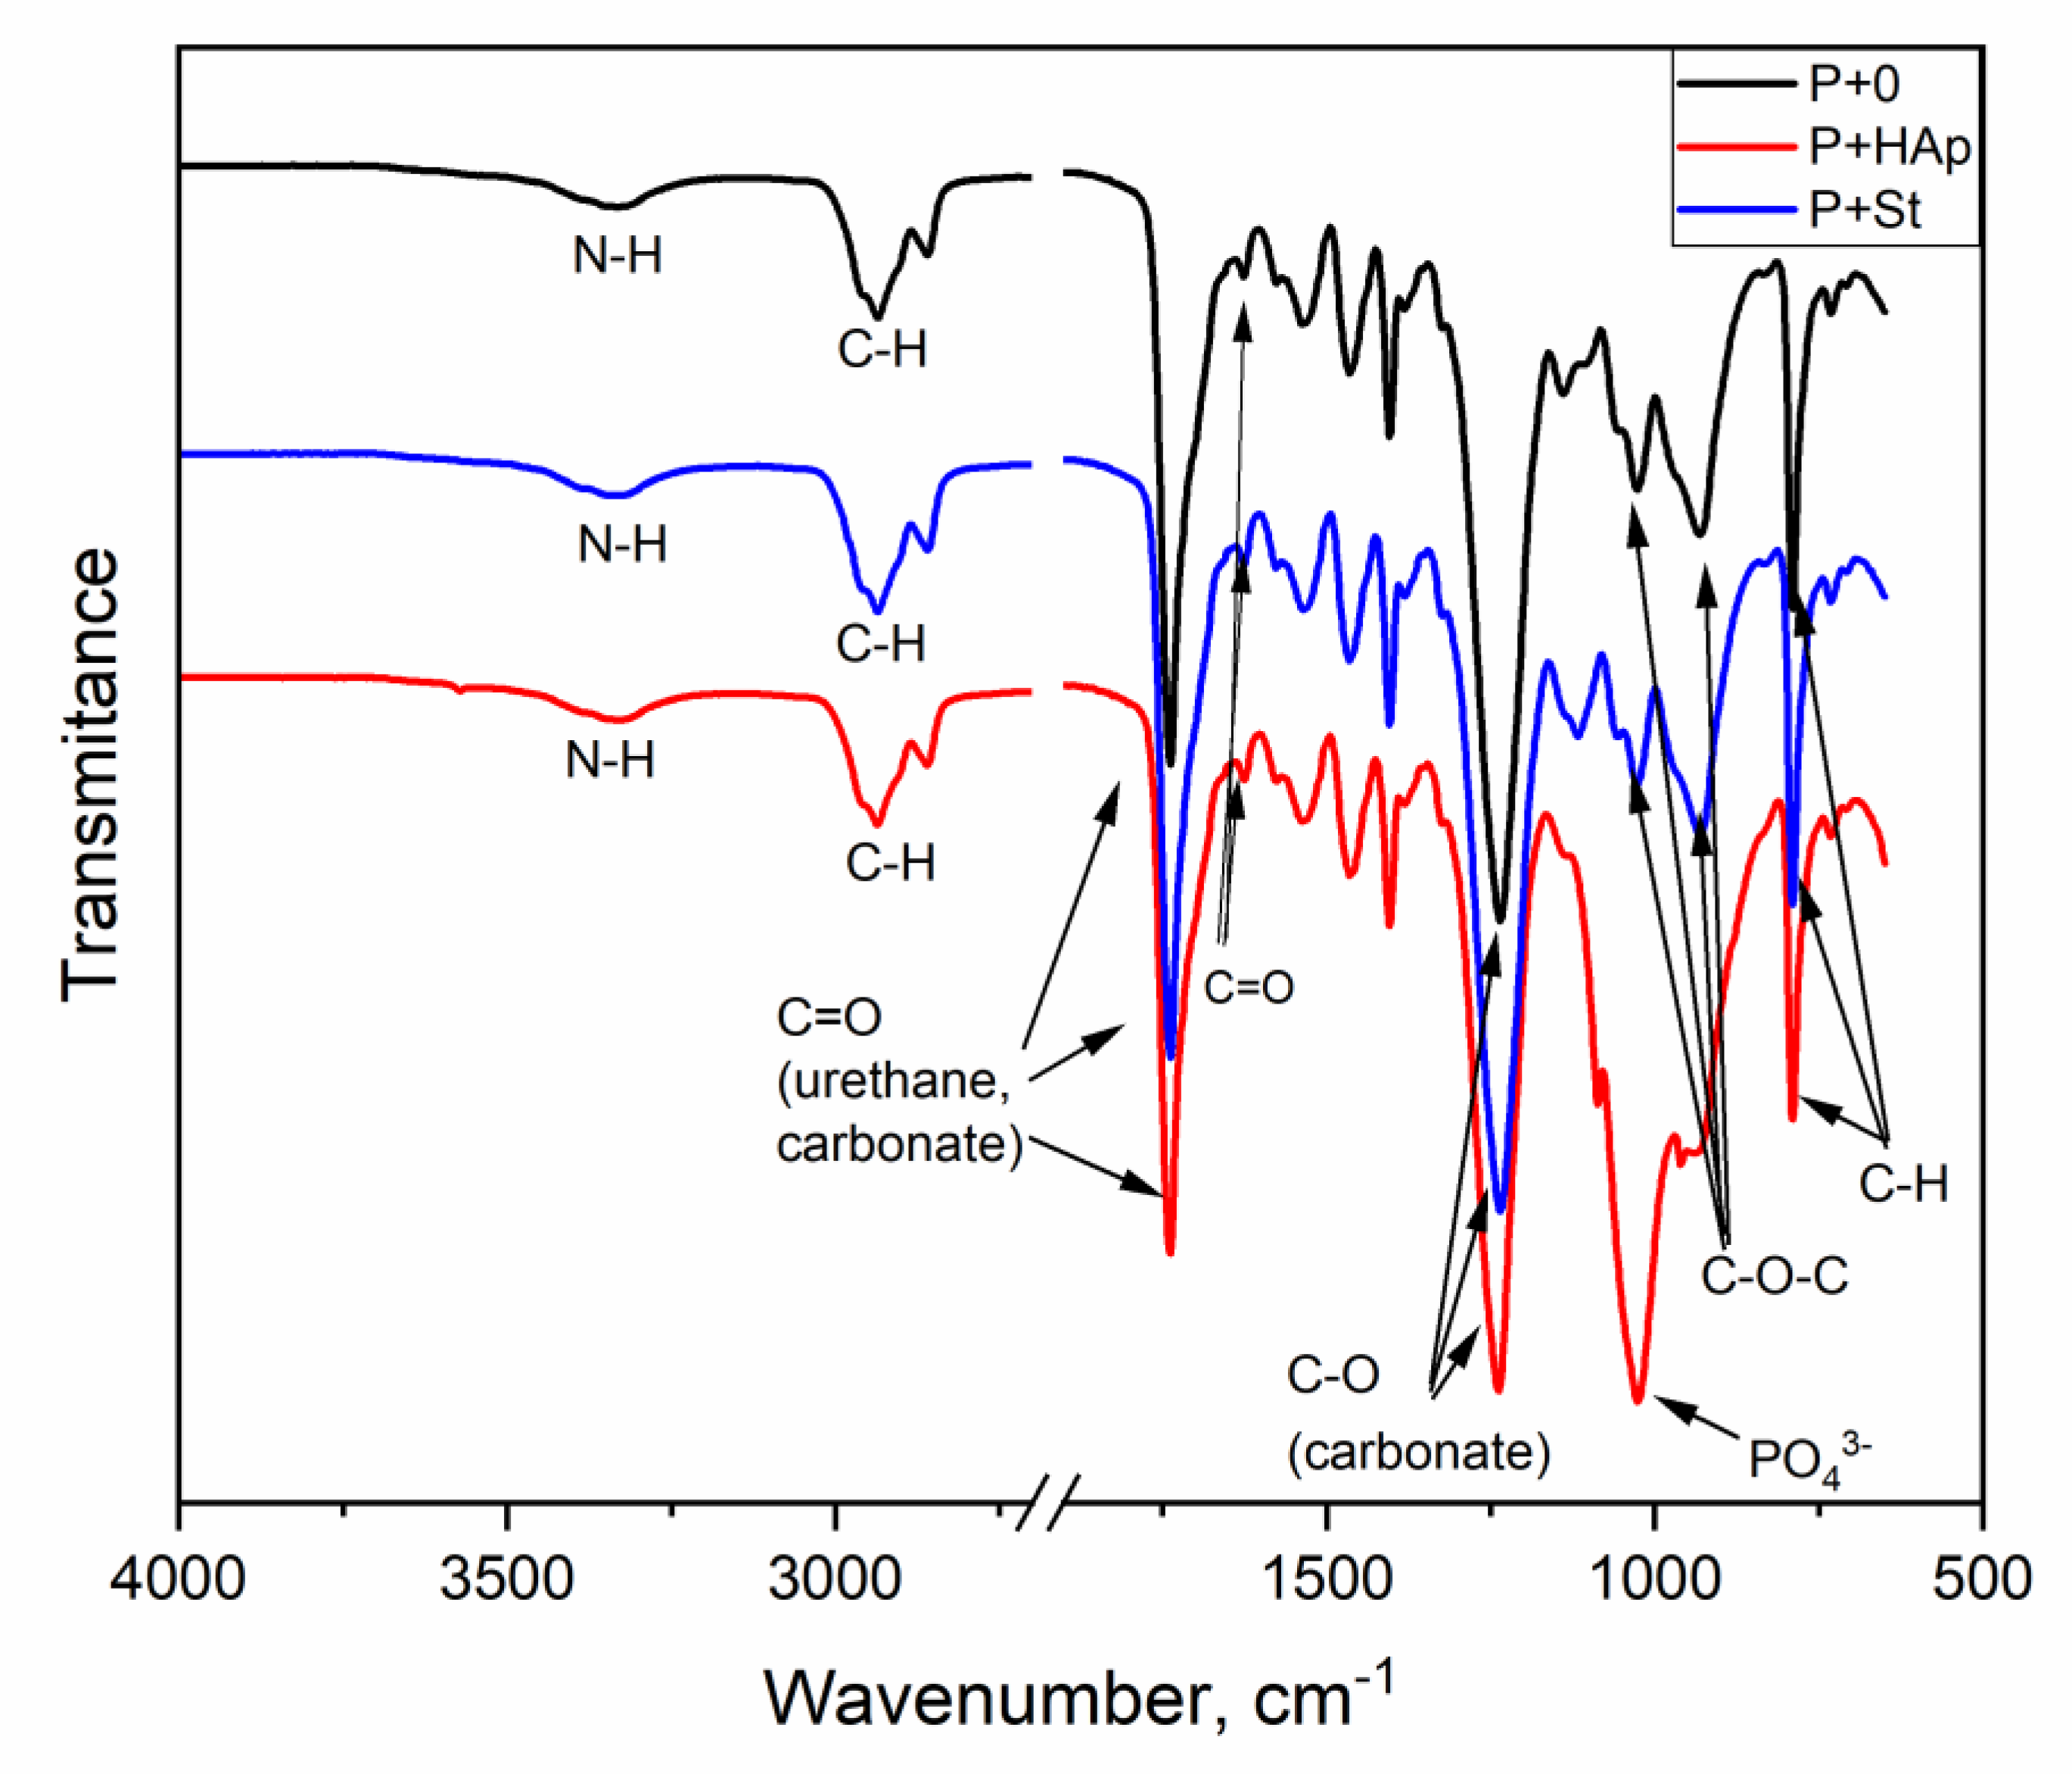
3.5. FTIR Spectroscopy
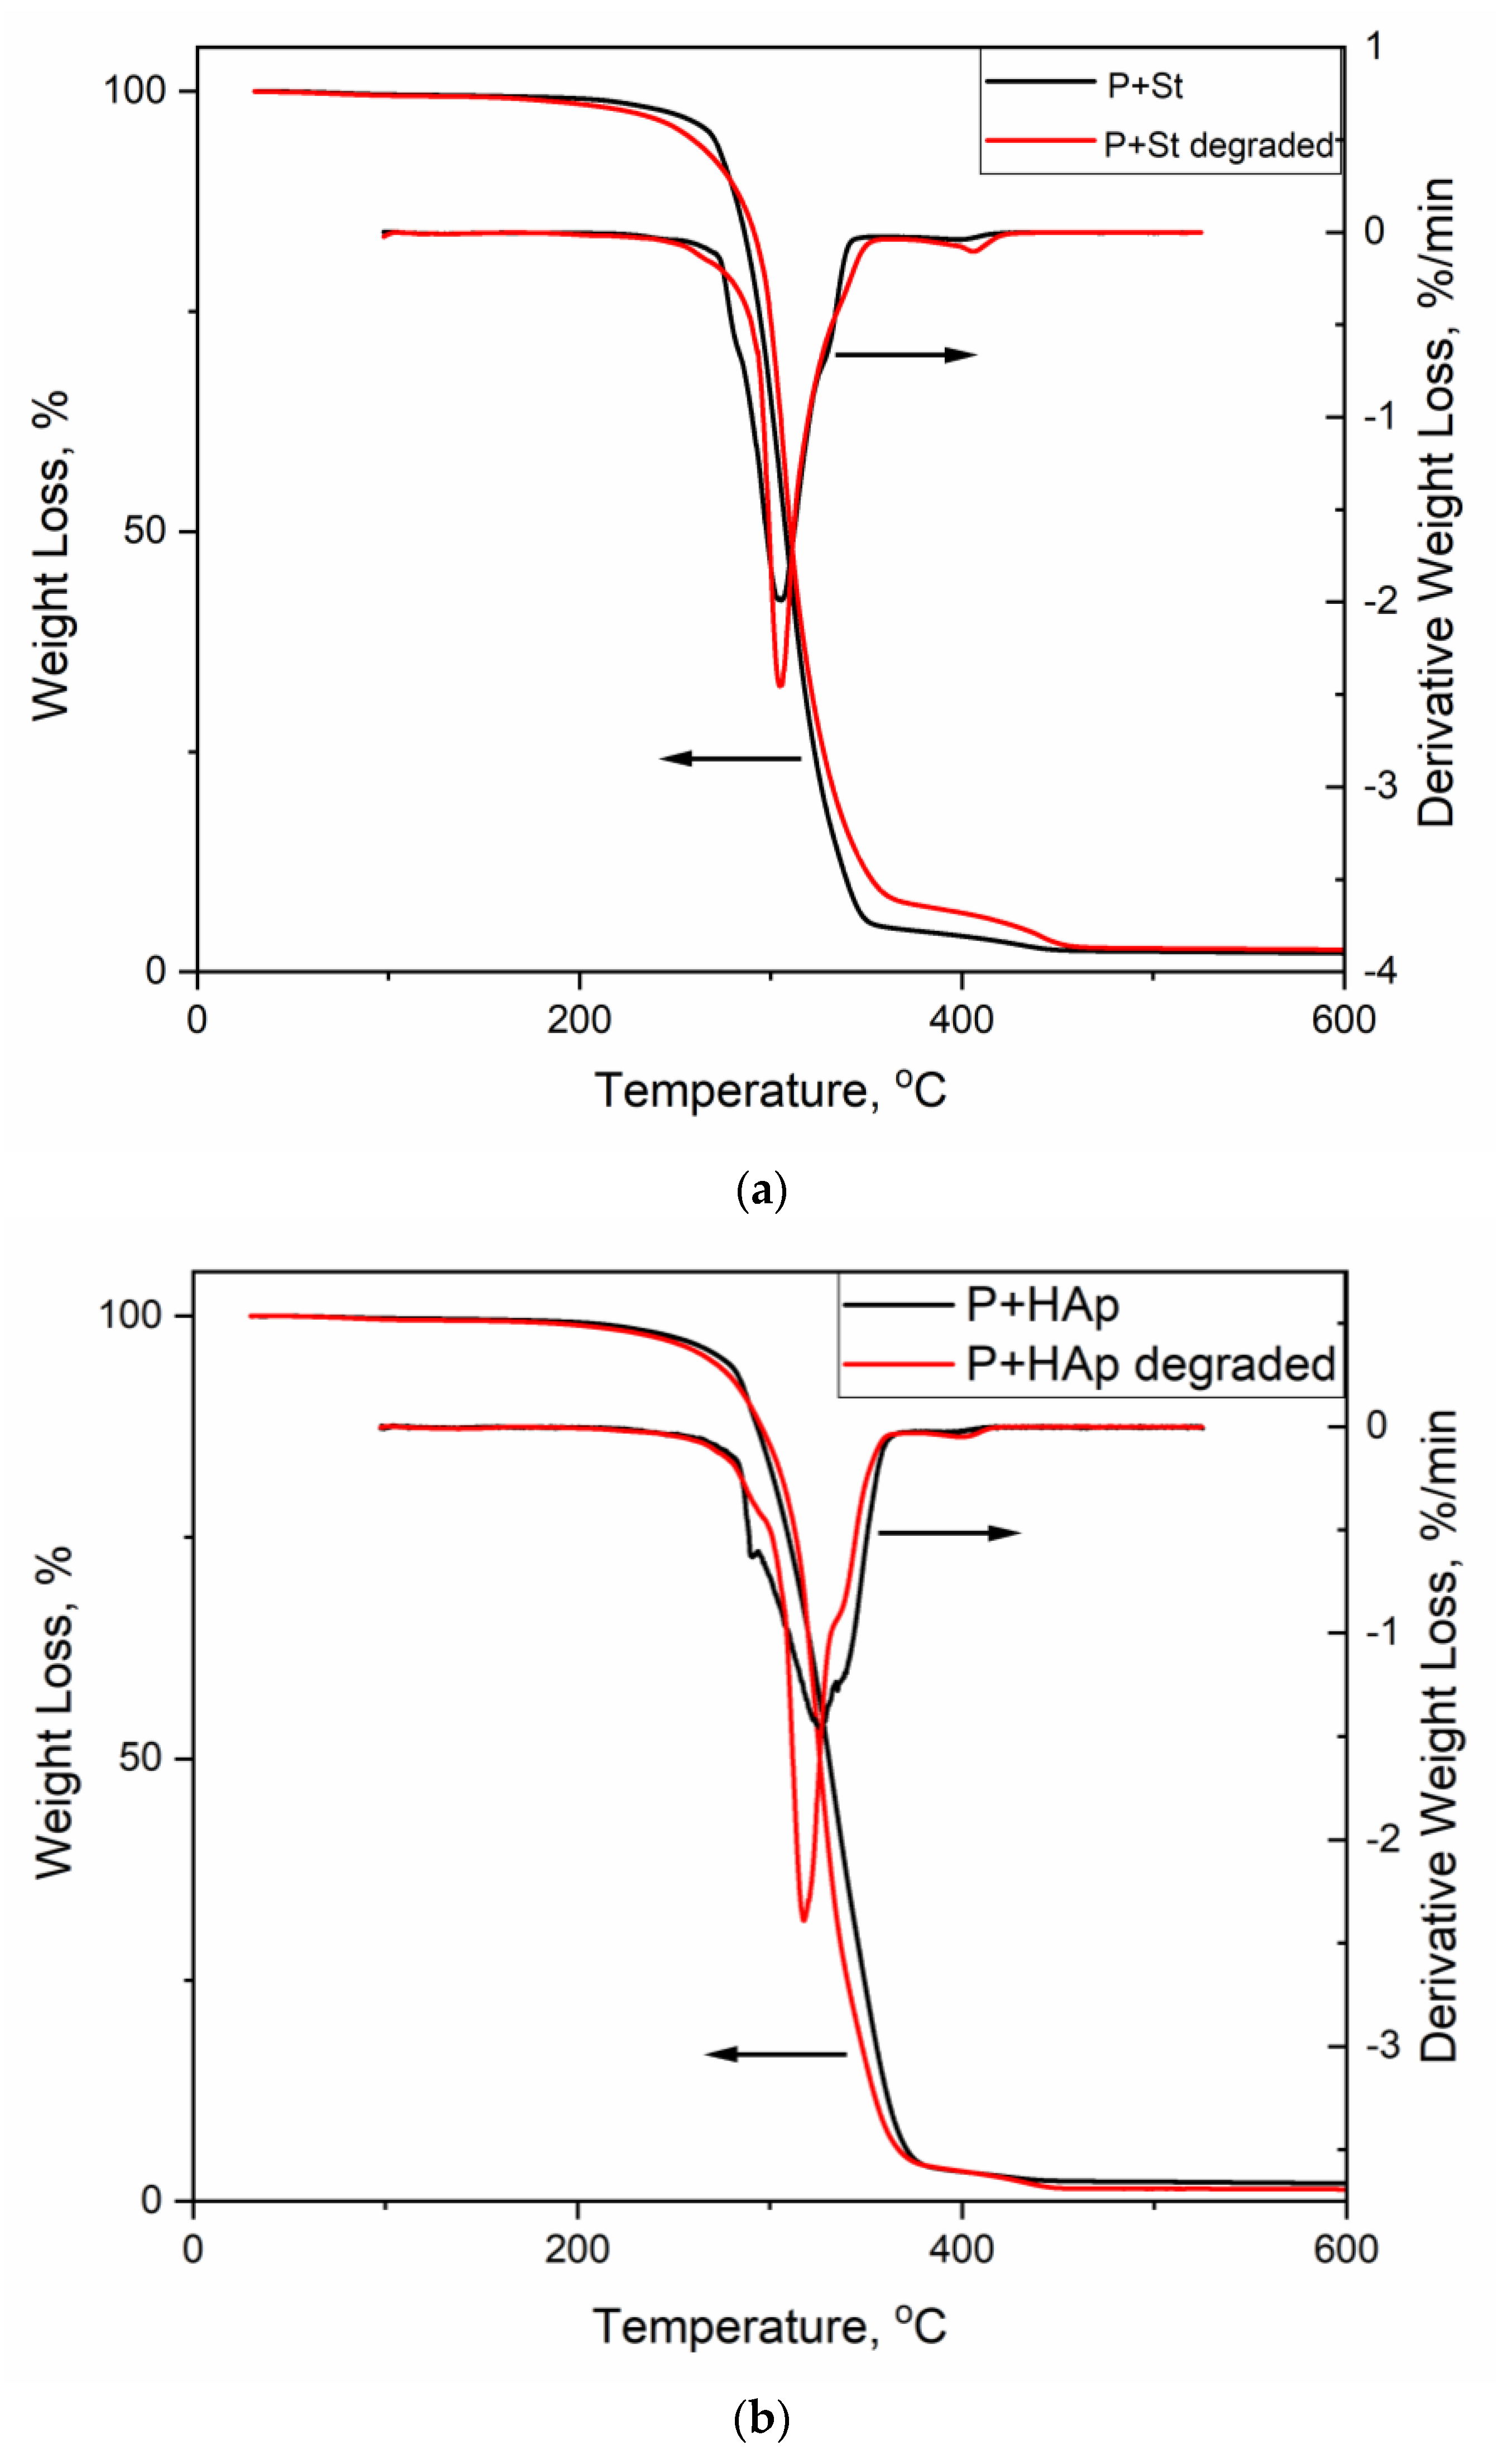
3.6. Thermogravimetric Analysis
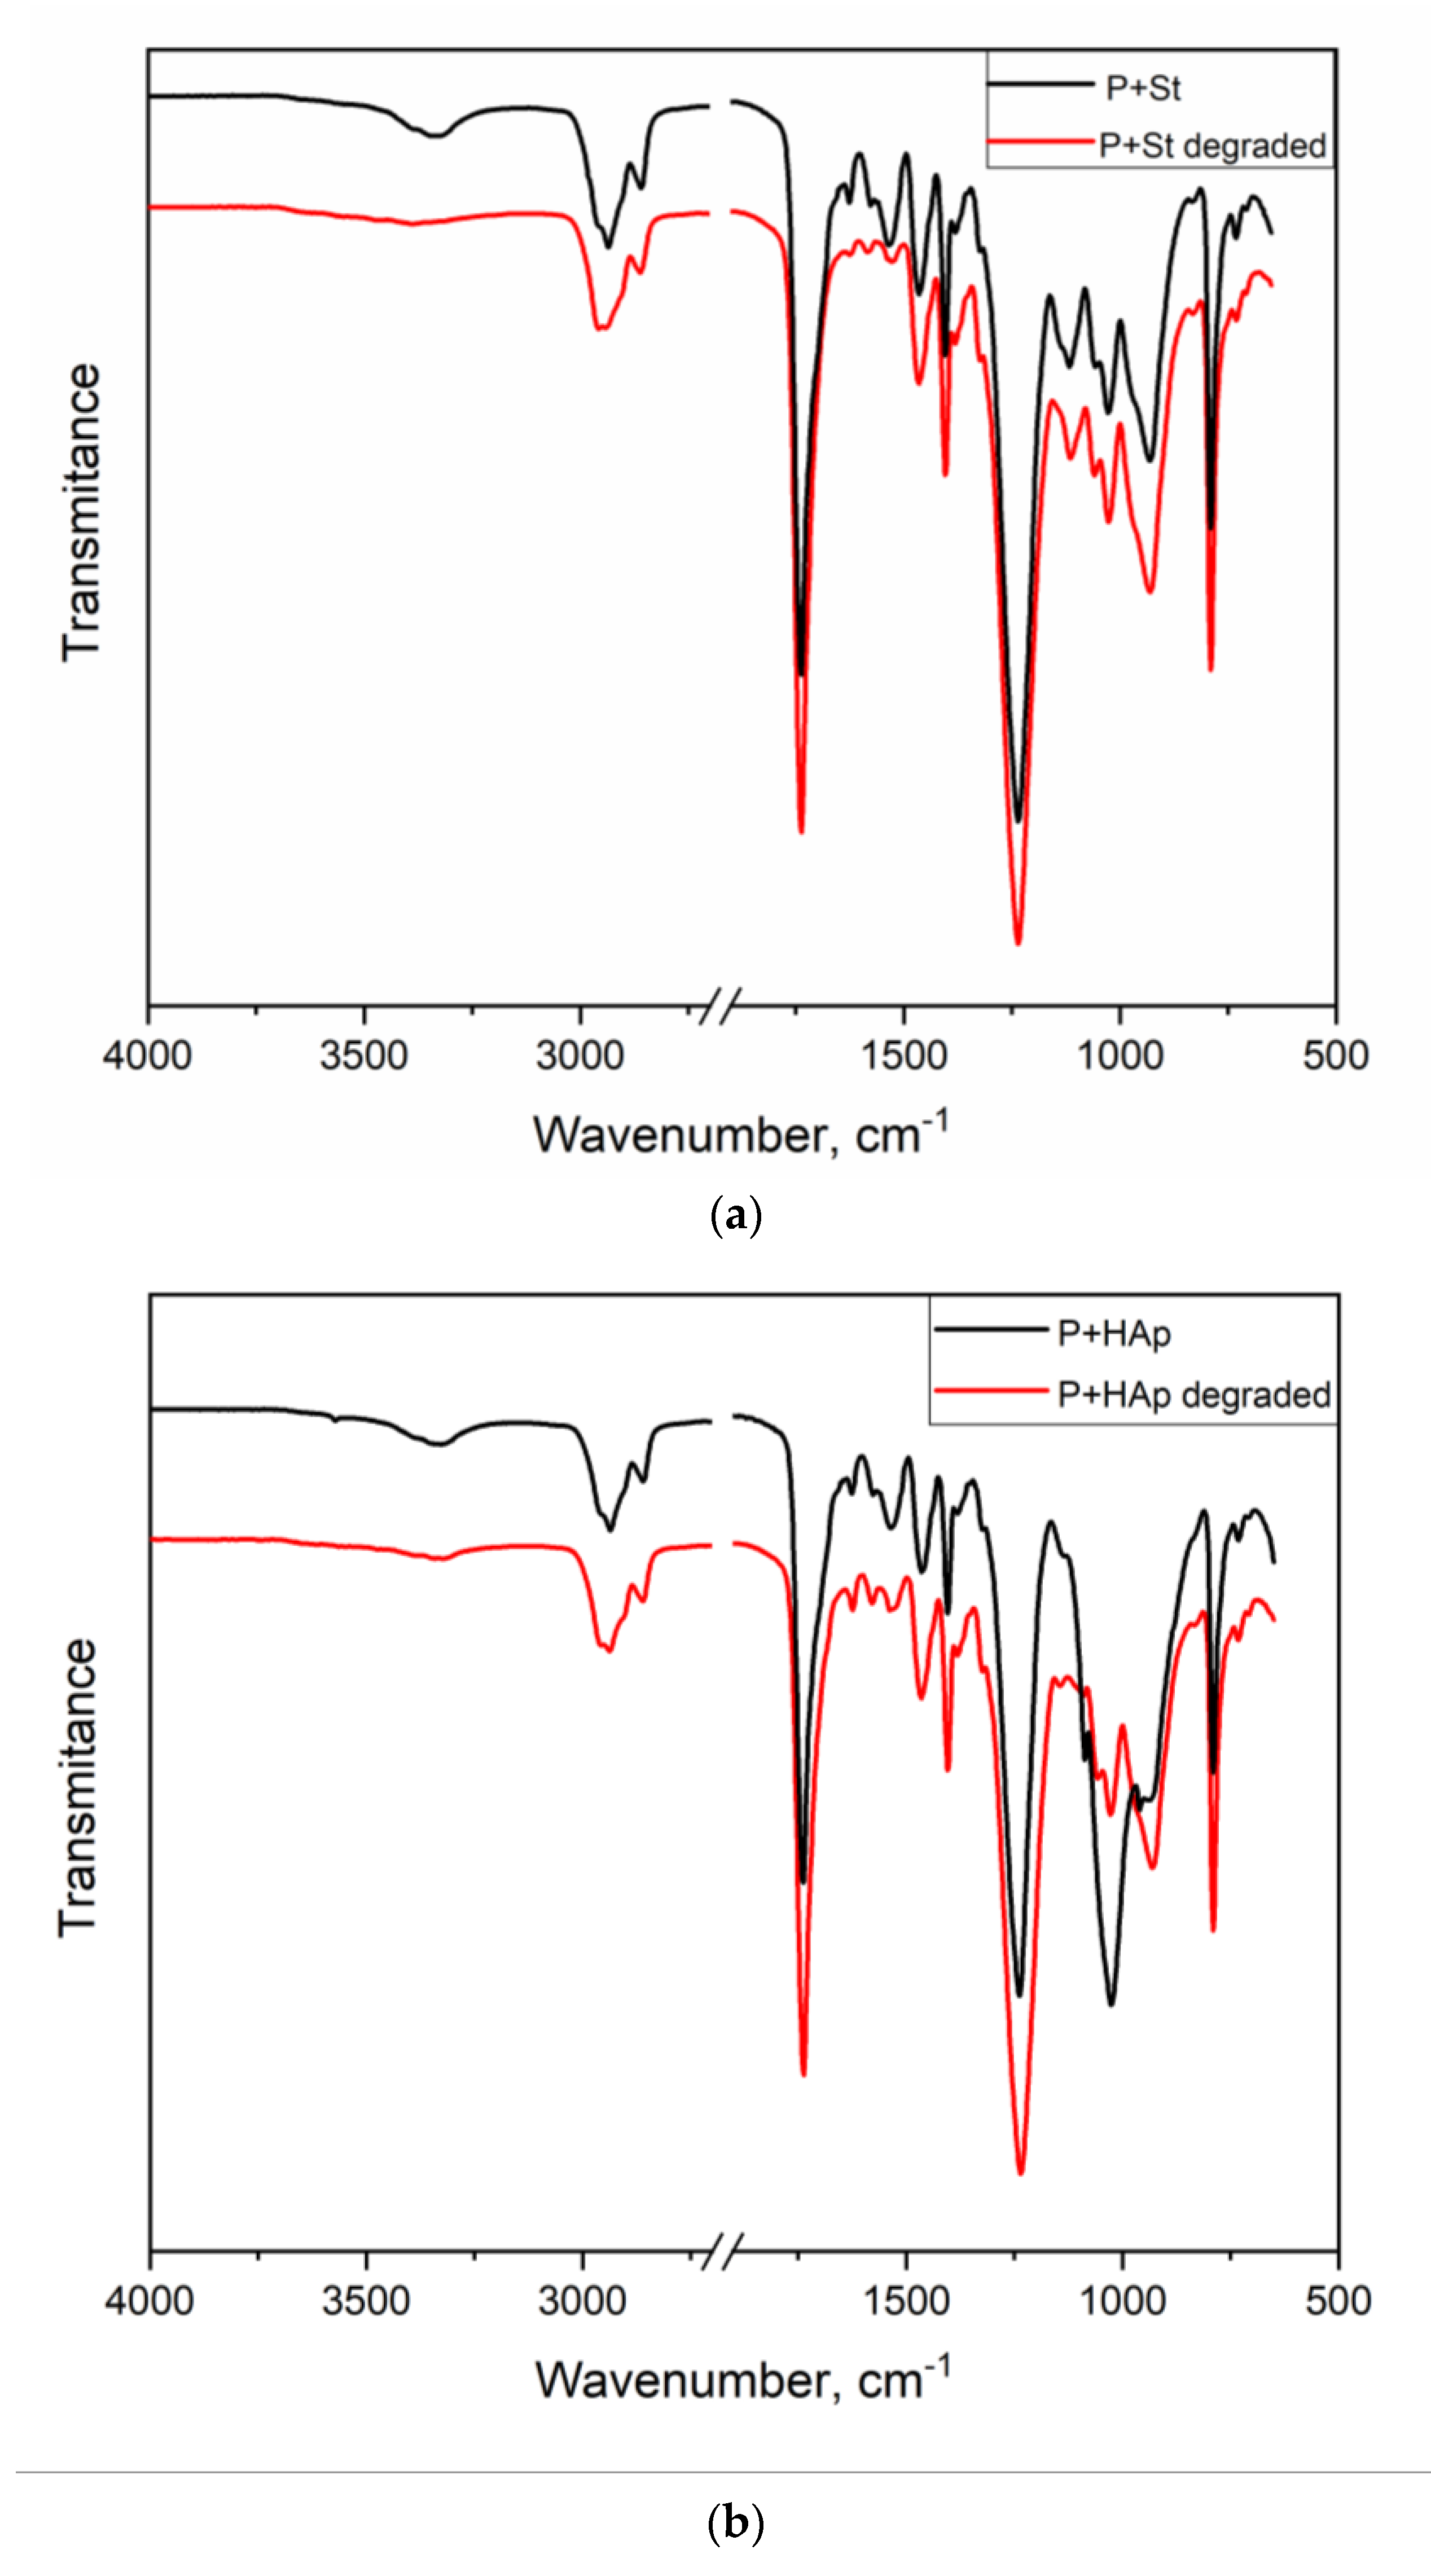
3.7. Study of the Ability of the Film to Degrade
4. Conclusions
Supplementary Materials
Author Contributions
Funding
Acknowledgments
Conflicts of Interest
References
- Srivastava, S.K.; Kotal, M. Recent advances on preparation, properties and applications of polyurethane nanocomposites. In Nanocomposites: Materials, Manufacturing and Engineering; Davim, J.P., Charitidis, C.A., Eds.; De Gruyter: Berlin, Germany, 2013; pp. 33–92. ISBN 978-3-11-026644-3. [Google Scholar] [CrossRef]
- Martin, D.J.; Osman, A.F.; Andriani, Y.; Edwards, G.A. Thermoplastic polyurethane (TPU)-based polymer nanocomposites. In Advances in Polymer Nanocomposites: Types and Applications; Gao, F., Ed.; Woodhead Publishing: Cambridge, UK, 2012; pp. 321–350. ISBN 978-3-11-026644-3. [Google Scholar] [CrossRef]
- Sonnenschein, M.F. Polyurethanes: Science, Technology, Markets and Trends; JohnWiley & Sons: New York, NY, USA, 2015; pp. 1–417. ISBN 978-1-118-73783-5. [Google Scholar]
- Ding, Z.M.; Li, J.; Xin, W.; Zhang, G.P.; Luo, Y.J. Low gloss waterborne polyurethane coatings with anti-dripping and flame retardancy via montmorillonite nanosheets. Prog. Org. Coat. 2019, 136, 105273. [Google Scholar] [CrossRef]
- Ding, X.D.; Wang, X.; Zhang, H.; Liu, T.Y.; Hong, C.Y.; Ren, Q.; Zhou, C. Preparation of waterborne polyurethane-silica nanocomposites by a click method. Mater. Today Commun. 2020, 23, 100911. [Google Scholar] [CrossRef]
- Cui, J.C.; Xu, J.C.; Li, J.; Qiu, H.X.; Yheng, S.Y.; Yang, J.H. A crosslinkable graphene oxide in waterborne polyurethane anticorrosive coatings: Experiments and simulation. Compos. Pt. B-Eng. 2020, 188, 107889. [Google Scholar] [CrossRef]
- Larraza, I.; Vadillo, J.; Santamaria-Echart, A.; Tejado, A.; Azpeitia, M.; Vesga, E.; Orue, A.; Saralegi, A.; Arbelaiz, A.; Eceiza, A. The effect of the carboxylation degree on cellulose nanofibers and waterborne polyurethane/cellulose nanofiber nanocomposites properties. Polym. Degrad. Stabil. 2020, 173, 109084. [Google Scholar] [CrossRef]
- Zia, F.; Zia, K.M.; Zuber, M.; Kamal, S.; Aslam, N. Starch based polyurethanes: A critical review updating recent literature. Carbohyd. Polym. 2015, 134, 784–798. [Google Scholar] [CrossRef]
- Chou, C.V.; Hsu, S.H.; Chang, H.; Tseng, S.M.; Lin, H.R. Enhanced thermal and mechanical properties and biostability of polyurethane containing silver nanoparticles. Polym. Degrad. Stabil. 2006, 91, 1017–1024. [Google Scholar] [CrossRef]
- Hsu, S.H.; Chou, C.W.; Tseng, S.M. Enhanced thermal and mechanical properties in polyurethane/Au nanocomposites. Macromol. Mater. Eng. 2004, 289, 1096–1101. [Google Scholar] [CrossRef]
- Charpentier, A.; Burgess, K.; Wang, L.; Chowdhury, R.R.; Lotus, A.F.; Moula, G. Nano-TiO2/polyurethane composites for antibacterial and self-cleaning coatings. Nanotechnology 2012, 23, 425606. [Google Scholar] [CrossRef]
- Das, B.; Mandal, M.; Upadhyay, A.; Chattopadhyay, P.; Karak, N. Bio-based hyperbranched polyurethane/Fe3O4 nanocomposites: Smart antibacterial biomaterials for biomedical devices and implants. Biomed. Mater. 2013, 8, 035003. [Google Scholar] [CrossRef]
- Moon, J.; Kwak, S.W.; Lee, J.Y.; Oh, J.S. Recent development in polyurethanes for automotives. Elastomers Compos. 2017, 52, 249–256. [Google Scholar] [CrossRef]
- Hepburn, C. Polyurethane Elastomers, 2nd ed.; Elsevier: London, UK, 1992; ISBN 978-94-011-2924-4. [Google Scholar]
- Zhang, X.Q.; Wright, M.E.E.; Cheung, J.W.C.; Battiston, K.G.; Sharifpoor, S.; Labow, R.S.; Santerre, J.P. New degradable polyurethanes for use in tissue engineering: Inspired by mechanisms of biodegradation and wound healing. J. Biomater. Tissue Eng. 2014, 4, 925–938. [Google Scholar] [CrossRef]
- Battiston, K.G.; Ouyang, B.; Labow, R.S.; Simmons, C.A.; Santerre, J.P. Monocyte/macrophage cytokine activity regulates vascular smooth muscle cell function within a degradable polyurethane scaffold. Acta Biomater. 2014, 10, 1146–1155. [Google Scholar] [CrossRef] [PubMed]
- Khadivi, P.; Salami-Kalajahi, M.; Roghani-Mamaqani, H. Evaluation of in vitro cytotoxicity and properties of polydimethylsiloxane-based polyurethane/crystalline nanocellulose bionanocomposites. J. Biomed. Mater. Res. Part A 2019, 107, 1771–1778. [Google Scholar] [CrossRef] [PubMed]
- Zhang, L.; Zhang, C.X.; Zhang, W.W.; Zhang, H.H.; Hou, Z.S. Synthesis and properties of biodegradable poly(ester-urethane)s based on poly(epsilon-caprolactone) and aliphatic diurethane diisocyanate for long-term implant application: Effect of uniform-size hard segment content. J. Biomater. Sci. Polym. Ed. 2019, 30, 1212–1226. [Google Scholar] [CrossRef] [PubMed]
- Gubanska, I.; Kucinska-Lipka, J.; Janik, H. The influence of amorphous macrodiol, diisocyanate type and L-ascorbic acid modifier on chemical structure, morphology and degradation behavior of polyurethanes for tissue scaffolds fabrication. Polym. Degrad. Stabil. 2019, 163, 52–67. [Google Scholar] [CrossRef]
- Baudis, S.; Ligon, S.C.; Seidler, K.; Weigel, G.; Grasl, C.; Bergmeister, H.; Schima, H.; Liska, R. Hard-block degradable thermoplastic urethane-elastomers for electrospun vascular prostheses. J. Polym. Sci. Pol. Chem. 2012, 50, 1272–1280. [Google Scholar] [CrossRef]
- Kidane, A.G.; Burriesci, G.; Edirisinghe, M.; Ghanbari, H.; Bonhoeffer, P.; Seifalian, A.M. A novel nanocomposite polymer for development of synthetic heart valve leaflets. Acta Biomater. 2009, 5, 2409–2417. [Google Scholar] [CrossRef]
- Rahmani, B.; Tzamtzis, S.; Ghanbari, H.; Burriesci, G.; Seifalian, A.M. Manufacturing and hydrodynamic assessment of a novel aortic valve made of a new nanocomposite polymer. J. Biomech. 2012, 45, 1205–1211. [Google Scholar] [CrossRef]
- Santerre, J.P.; Woodhouse, K.; Laroche, G.; Labow, R.S. Understanding the biodegradation of polyurethanes: From classical implants to tissue engineering materials. Biomaterials 2005, 26, 7457–7470. [Google Scholar] [CrossRef]
- Cakić, S.M.; Špírková, M.; Ristić, I.S.; Budinski-Simendić, J.; Marinović-Cincović, M.; Poręba, R. The waterborne polyurethane dispersions based on polycarbonate diol: Effect of ionic content. Mat. Chem. Phys. 2013, 138, 277–285. [Google Scholar] [CrossRef]
- Garcia-Pacios, V.; Jofre-Reche, J.A.; Costa, V.; Colera, M.; Martin-Martinez, J.M. Coatings prepared from waterborne polyurethane dispersions obtained with polycarbonates of 1,6-hexanediol of different molecular weights. Prog. Org. Coat. 2013, 76, 1484–1493. [Google Scholar] [CrossRef]
- Cakić, S.M.; Ristić, I.S.; Marinović-Cincović, M.; Špírková, M. The effects of the structure and molecular weight of the macrodiol on the properties polyurethane anionic adhesives. Int. J. Adhes. Adhes. 2013, 41, 132–139. [Google Scholar] [CrossRef]
- Kim, B.K. Aqueous polyurethane dispersions. Colloid. Polym. Sci. 1996, 274, 599–611. [Google Scholar] [CrossRef]
- Sukhawipat, N.; Saetung, N.; Pilard, J.F.; Bistac, S.; Saetung, A. Effects of molecular weight of hydroxyl telechelic natural rubber on novel cationic waterborne polyurethane: A new approach to water-based adhesives for leather applications. Int. J. Adhes. Adhes. 2020, 99, 102593. [Google Scholar] [CrossRef]
- Luo, H.H.; Liu, Y.; Ruj, B.; Cai, D.L.; He, Y.J. Synthesis of tannic acid waterborne polyurethane in application for leather finishing. J. Soc. Leather Technol. Chem. 2020, 104, 129–135. [Google Scholar]
- Feng, Z.X.; Wang, D.; Zheng, Y.D.; Yhao, L.; Xu, T.; Guo, Y.M.; Hussain, M.I.; Yeng, J.S.; Lou, L.Y.; Sun, Y.; et al. A novel waterborne polyurethane with biodegradability and high flexibility for 3D printing. Biofabrication 2020, 12, 035015. [Google Scholar] [CrossRef]
- Yang, Z.H.; Wu, G.F. Effects of soft segment characteristics on the properties of biodegradable amphiphilic waterborne polyurethane prepared by a green process. J. Mater. Sci. 2020, 55, 3139–3156. [Google Scholar] [CrossRef]
- Dieterich, D. Aqueous emulsions, dispersions and solutions of polyurethanes–Synthesis and properties. Prog. Org. Coat. 1981, 9, 281–340. [Google Scholar] [CrossRef]
- Sardon, H.; Irusta, L.; Fernandez-Berridi, M.J.; Luna, J.; Lansalot, M.; Bourgeat-Lami, E. Waterborne polyurethane dispersions obtained by the acetone process: A study of colloidal features. J. Appl. Polym. Sci. 2011, 120, 2054–2062. [Google Scholar] [CrossRef]
- Špírková, M.; Hodan, J.; Kredatusová, J.; Poręba, R.; Uchman, M.; Serkis-Rodzeń, M. Functional properties of films based on novel waterborne polyurethane dispersions prepared without a chain-extension step. Prog. Org. Coat. 2018, 123, 53–62. [Google Scholar] [CrossRef]
- Serkis, M.; Poręba, R.; Hodan, J.; Kredatusová, J.; Špírková, M. Preparation and characterization of thermoplastic waterborne polycarbonate-based polyurethane dispersions and cast films. J. Appl. Polym. Sci. 2015, 132, 42672. [Google Scholar] [CrossRef]
- Špírková, M.; Pavličević, J.; Aguilar Costumbre, Y.; Hodan, J.; Urbanová, M.; Krejčíková, S. Mechanically strong waterborne poly(urethane-urea) films and nanocomposite films. J. Appl. Polym. Sci. 2020, submitted. [Google Scholar]
- Hummers, W.S.; Offeman, R.E. Preparation of graphitic oxide. J. Am. Chem. Soc. 1958, 80, 1339. [Google Scholar] [CrossRef]
- Kohler, F.; Gopal, R.; Gótze, G.; Atrops, H.; Demiriz, A. Molecular interactions in mixtures of carboxylic acids with amines. 2. Volumetric, conductimetric and NMR properties. J. Phys. Chem. 1981, 85, 2524–2529. [Google Scholar] [CrossRef]
- Tennebroek, R.; van der Hoeven-van Casteren, I.; Swaans, R.; van der Slot, S.; Stals, P.J.M.; Tuijtelaars, B.; Koning, C. Water-based polyurethane dispersions. Polym. Int. 2019, 68, 832–842. [Google Scholar] [CrossRef]
- Špírková, M.; Pavličević, J.; Strachota, A.; Poręba, R.; Bera, O.; Kaprálková, L.; Baldrian, J.; Šlouf, M.; Lazić, N.; Budinski-Simendić, J. Novel polycarbonate-based polyurethane elastomers: Composition-property relationship. Eur. Polym. J. 2011, 47, 959–972. [Google Scholar] [CrossRef]
- Poręba, R.; Špírková, M.; Brožová, L.; Lazić, L.; Pavličević, J.; Strachota, A. Aliphatic polycarbonate-based polyurethane elastomers and nanocomposites. II. Mechanical, thermal and gas transport properties. J. Appl. Polym. Sci. 2013, 127, 329–341. [Google Scholar] [CrossRef]
- Serkis, M.; Špírková, M.; Poręba, R.; Hodan, J.; Kredatusová, J.; Kubies, D. Hydrolytic stability of polycarbonate-based polyurethane elastomers tested in physiologically simulated conditions. Polym. Degrad. Stabil. 2015, 119, 23–34. [Google Scholar] [CrossRef]


| Nanofiller | Young’s Modulus, E (MPa) | Stress-at-Break, σb (MPa) | Elongation-at-Break, εb (%) | Energy-at-Break, Toughness (mJ·mm−3) |
|---|---|---|---|---|
| P+0 | 5.3 ± 0.3 | 1.6(1.8 *) ± 0.1(0.1 *) | 722(601 *) ± 31(20 *) | 11.4 ± 1.0 |
| P+SiO2 | 3.9 ± 0.3 | 1.3(1.6*) ± 0.1(0.1 *) | 510(393 *) ± 16(16 *) | 7.1 ± 0.5 |
| P+ HAp | 4.0 ± 0.2 | 1.5(1.8 *) ± 0.1(0.1 *) | 583(463 *) ± 62(51 *) | 9.1 ± 1.3 |
| P+MNa | 4.4 ± 0.3 | 1.4(1.6 *) ± 0.1(0.1 *) | 547(415 *) ± 32(28 *) | 8.0 ± 0.5 |
| P+HALL | 4.1 ± 0.2 | 1.1(1.7 *) ± 0.1(0.1 *) | 559(446 *) ± 47(58 *) | 8.8 ± 1.4 |
| P+St | 3.8 ± 0.1 | 1.2(1.5 *) ± 0.1(0.1 *) | 515(373 *) ± 48(25 *) | 6.9 ± 0.7 |
| P+CNC | 4.4 ± 0.5 | 1.0(1.4 *) ± 0.1(0.1 *) | 471(310 *) ± 39(12 *) | 5.8 ± 0.7 |
| P+GO | 31.0 ± 1.4 | 0.9(1.9 *) ± 0.1(0.1 *) | 49(205 *) ± 4(11 *) | 3.4 ± 0.2 |
| Wavenumbers (cm−1) | Bonds | Vibration Modes |
|---|---|---|
| 3360–3335 | N-H (urethane, urea, event. biuret, amide) H bonded | Stretching |
| 2900–2850 | C-H (in CH2 and CH3) | Asymmetrical and symmetrical stretching |
| 1741–1738 | C=O in urethane free | Stretching |
| 1626–1623 | C=O in urea strongly bonded (ordered/bidentate) | Stretching |
| ca 1535 | N-H in urethane and urea | Symmetrical bending |
| ca 1464 | C-N in urethane and urea | Symmetrical stretching |
| ca 1460 | CH in CH2 | Symmetrical bending |
| ca 1240 | O-C=O in carbonate | Antisymmetrical stretching |
| ca 1240 | N-H in urethane and urea | Asymmetrical bending |
| ca 1240 | C-N in urethane and urea | Asymmetrical stretching |
| ca 1035 | C-O-C in urethane | Stretching |
| ca 1010 | (PO4)3- in hydroxyapatite | Symmetrical stretching |
| ca 940 | C-O-C in carbonate | Symmetrical stretching |
| Nanofiller | T5% (oC) | TDTGmax1 (oC) | TDTGmax2 (oC) | Char at 500 oC (wt%) |
|---|---|---|---|---|
| P+0 | 272 | 303 | 420 | 0.6 |
| P+SiO2 | 267 | 311 | 422 | 1.8 |
| P+HAp | 276 | 335 | 422 | 2.2 |
| P+MNa | 264 | 290 | 443 | 1.5 |
| P+HALL | 272 | 312 | 421 | 2 |
| P+St | 269 | 306 | 429 | 2.3 |
| P+CNC | 270 | 306 | 433 | 1.4 |
| P+GO | 272 | 336 | - | 1.8 |
| Film | Mass Loss After 2 Days, wt% | Mass Loss After 7 Days, wt% | Mass Loss After 21 Days, wt% |
|---|---|---|---|
| P+0 | 1.8 | 2.2 | 12.8 |
| P+SiO2 | 2.9 | 3.1 | 7.4 |
| P+HAp | 3.0 | 4.6 | 14.9 |
| P+MNa | 4.0 | 5.4 | 19.5 |
| P+HALL | 3.8 | 7.1 | 11.9 |
| P+St | 3.1 | 3.6 | 10.6 |
| P+CNC | 5.7 | 33.9 | Broke apart |
| P+GO | 10.9 | 58.9 | Broke apart |
© 2020 by the authors. Licensee MDPI, Basel, Switzerland. This article is an open access article distributed under the terms and conditions of the Creative Commons Attribution (CC BY) license (http://creativecommons.org/licenses/by/4.0/).
Share and Cite
Špírková, M.; Hodan, J.; Konefał, R.; Machová, L.; Němeček, P.; Paruzel, A. The Influence of Nanofiller Shape and Nature on the Functional Properties of Waterborne Poly(urethane-urea) Nanocomposite Films. Polymers 2020, 12, 2001. https://doi.org/10.3390/polym12092001
Špírková M, Hodan J, Konefał R, Machová L, Němeček P, Paruzel A. The Influence of Nanofiller Shape and Nature on the Functional Properties of Waterborne Poly(urethane-urea) Nanocomposite Films. Polymers. 2020; 12(9):2001. https://doi.org/10.3390/polym12092001
Chicago/Turabian StyleŠpírková, Milena, Jiří Hodan, Rafał Konefał, Luďka Machová, Pavel Němeček, and Aleksandra Paruzel. 2020. "The Influence of Nanofiller Shape and Nature on the Functional Properties of Waterborne Poly(urethane-urea) Nanocomposite Films" Polymers 12, no. 9: 2001. https://doi.org/10.3390/polym12092001
APA StyleŠpírková, M., Hodan, J., Konefał, R., Machová, L., Němeček, P., & Paruzel, A. (2020). The Influence of Nanofiller Shape and Nature on the Functional Properties of Waterborne Poly(urethane-urea) Nanocomposite Films. Polymers, 12(9), 2001. https://doi.org/10.3390/polym12092001