Plasma Treatment of Polypropylene-Based Wood–Plastic Composites (WPC): Influences of Working Gas


Abstract
1. Introduction
2. Materials and Methods
2.1. Specimen Preparation
2.2. Plasma Treatment
2.3. Analysis
2.3.1. Fourier-Transform Infrared Spectroscopy (FTIR)
2.3.2. X-ray Photoelectron Spectroscopy (XPS)
2.3.3. Contact Angle
2.3.4. Laser Scanning Microscopy (LSM)
2.3.5. Paint Adhesion/Pull-Off Strength/Cross-Cut Test
2.3.6. Statistical Analysis
3. Results
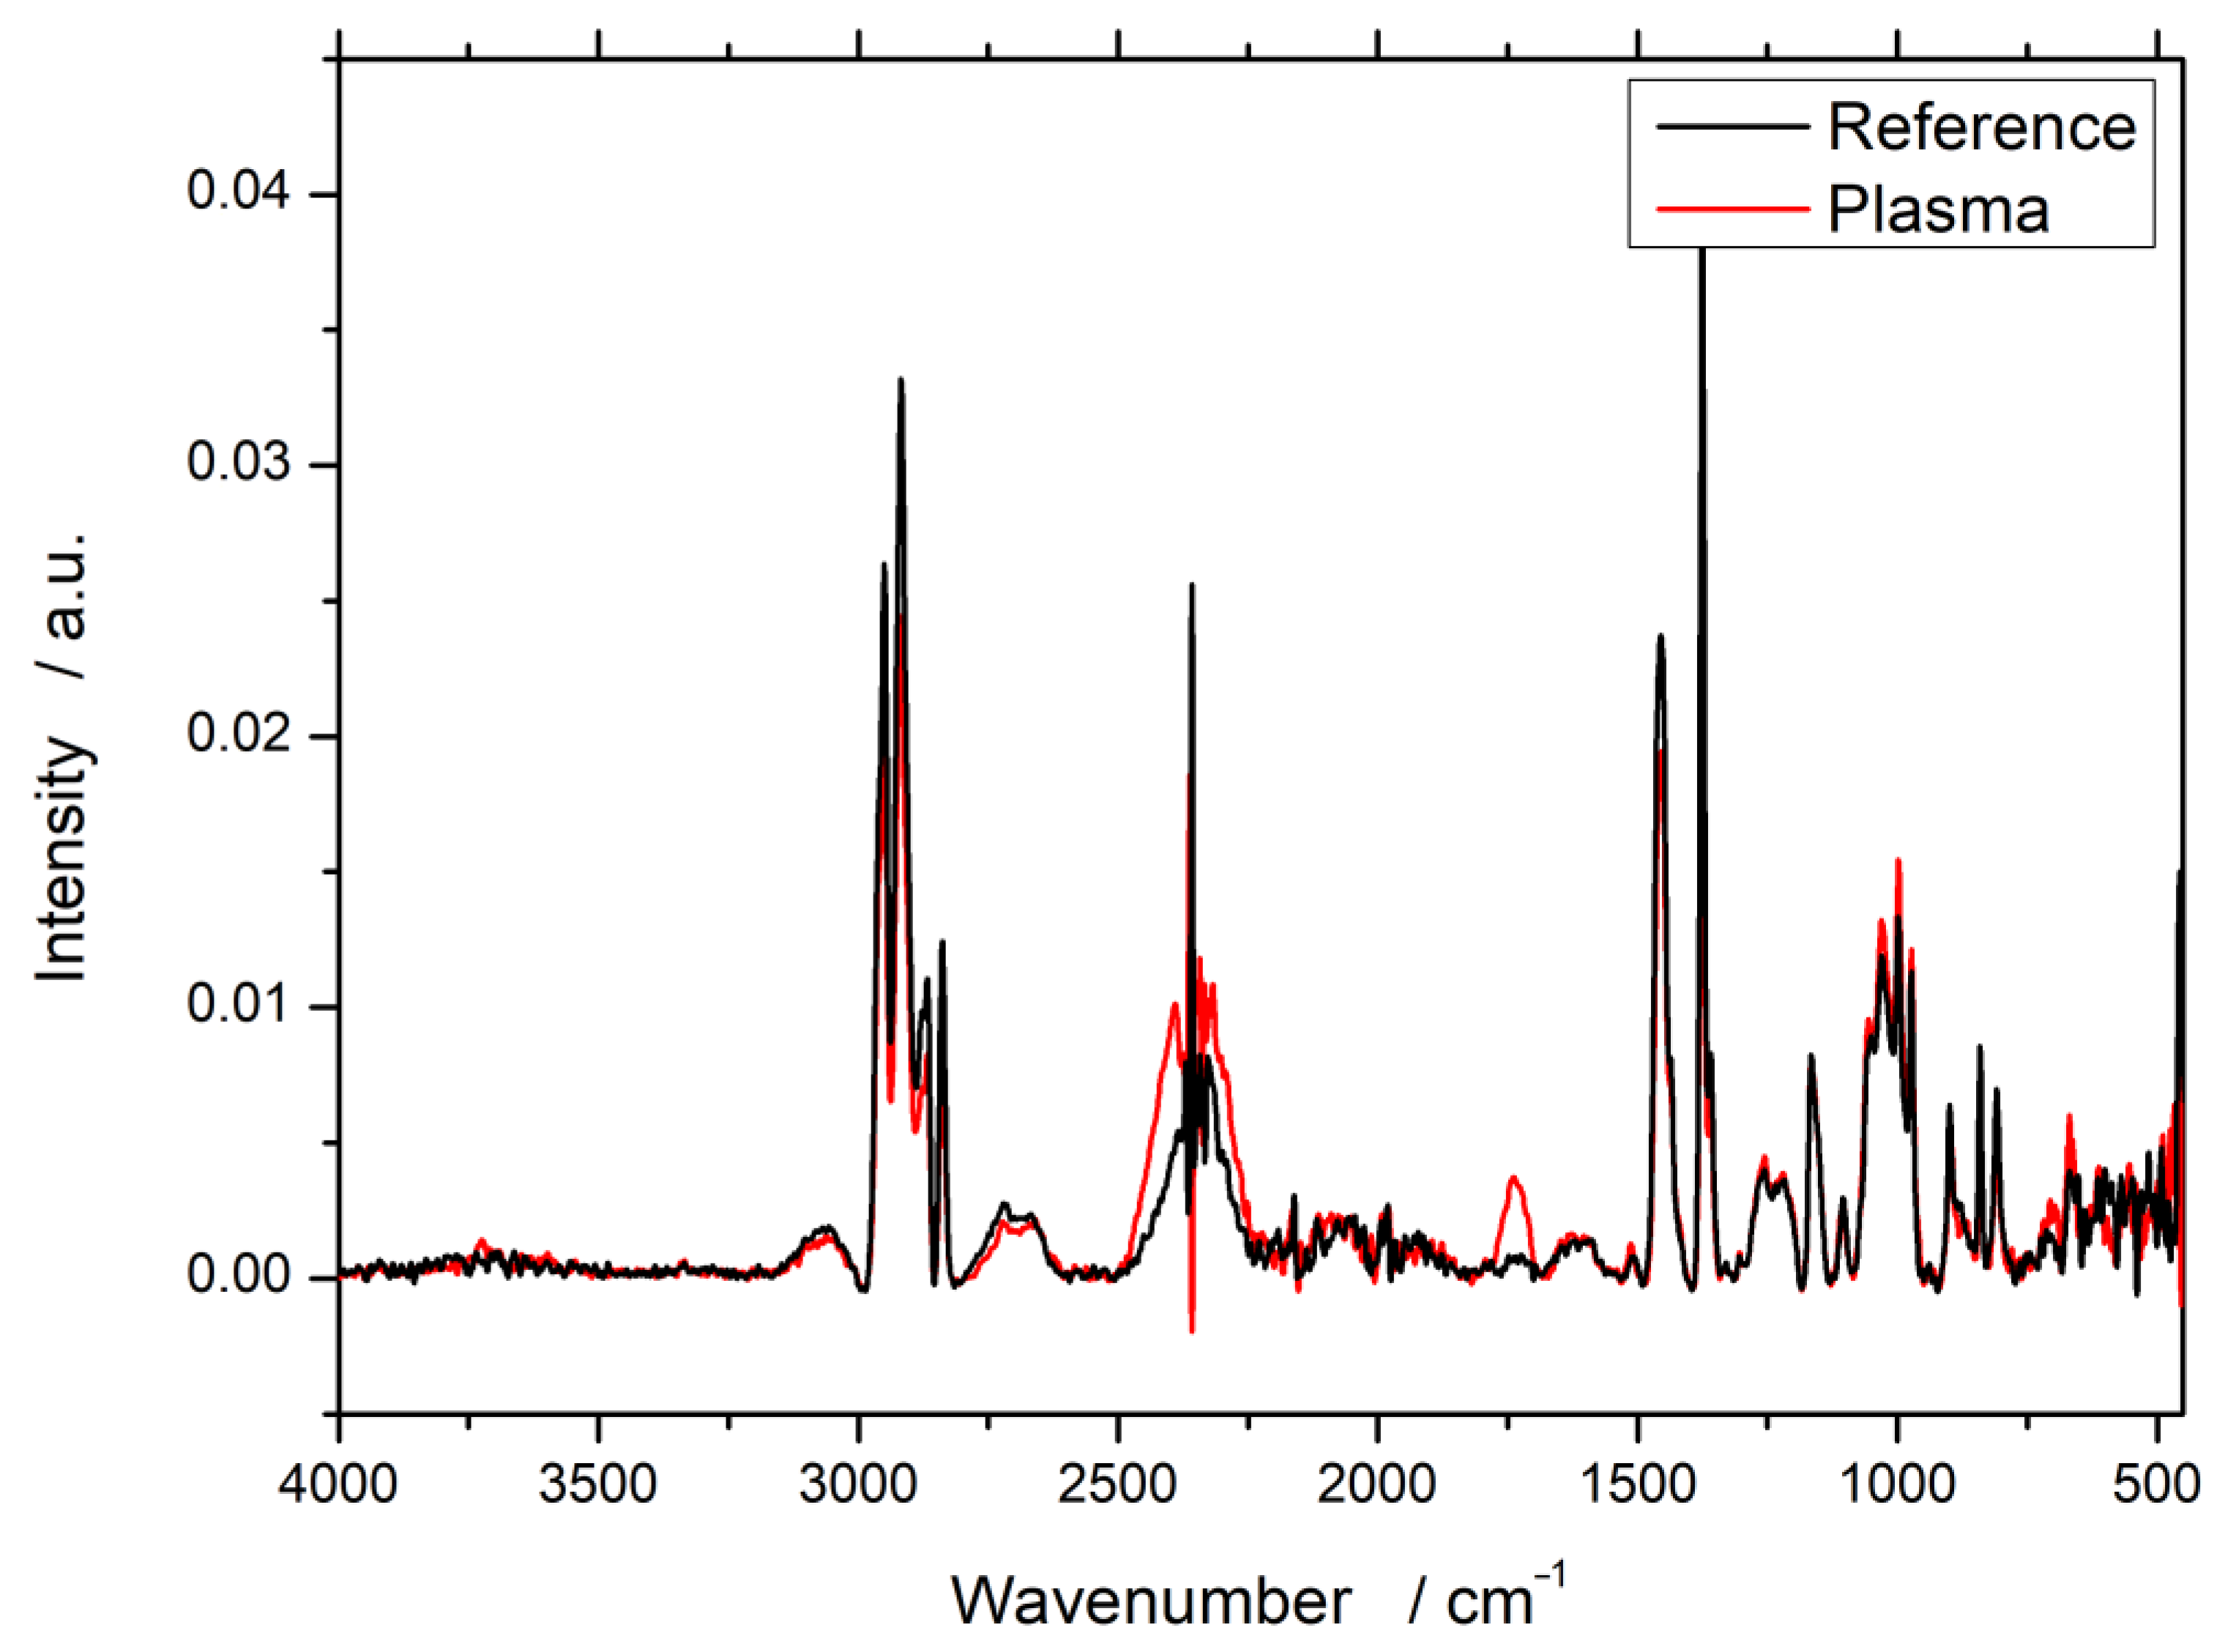
3.1. Fourier-Transform Infrared Spectroscopy (FTIR)
3.2. X-ray Photoelectron Spectroscopy (XPS)
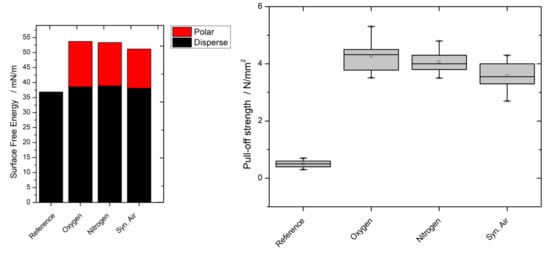
3.3. Contact Angle
3.4. Laser Scanning Microscopy (LSM)
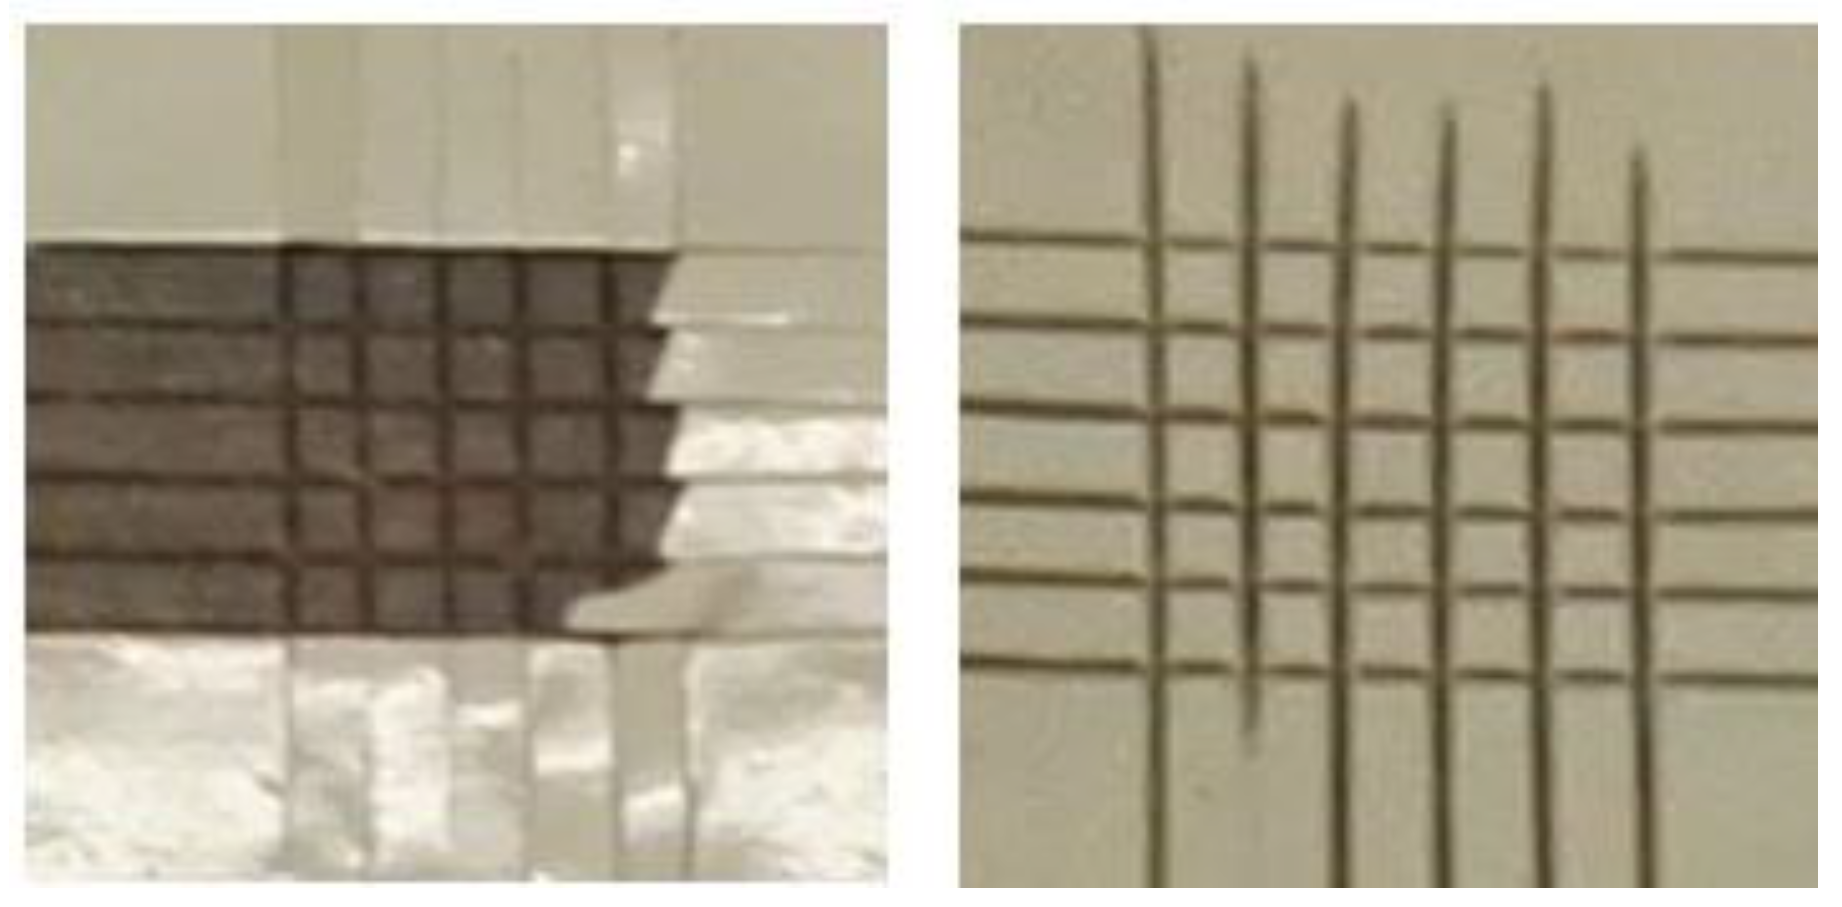
3.5. Paint Adhesion/Pull-Off Strength/Cross-Cut Test
4. Discussion
5. Conclusions
Author Contributions
Funding
Acknowledgments
Conflicts of Interest
Appendix A


| Working Gas | C–C/at% | C–O/at% | C=O/at% | O–C=O/at% |
|---|---|---|---|---|
| Reference | 96.5 | 3.5 | ||
| Nitrogen (Ar/N2) | 78.8 | 8.6 | 5.0 | 7.6 |
| Oxygen (Ar/O2) | 79.9 | 8.1 | 5.0 | 7.0 |
| Syn. air | 80.3 | 8.0 | 4.8 | 6.9 |


References
- Sobczak, L.; Bruggemann, O.; Putz, R.F. Polyolefin composites with natural fibers and wood-modification of the fiber/filler-matrix interaction. J. Appl. Polym. Sci. 2012, 127, 1–17. [Google Scholar] [CrossRef]
- Sobczak, L.; Lang, R.W.; Haider, A. Polypropylene composites with natural fibers and wood—General mechanical property profiles. Compos. Sci. Technol. 2012, 72, 550–557. [Google Scholar] [CrossRef]
- Joshi, S.V.; Drzal, L.T.; Mohanty, A.K.; Arora, S. Are natural fiber composites environmentally superior to glass fiber reinforced composites? Compos. Part A Appl. Sci. Manuf. 2004, 35, 371–376. [Google Scholar] [CrossRef]
- Feifel, S.; Stübs, O.; Seibert, K.; Hartl, J. Comparing wood–polymer composites with solid wood: The case of sustainability of terrace flooring. Eur. J. Wood Prod. 2015, 73, 829–836. [Google Scholar] [CrossRef]
- Bütün, F.Y.; Sauerbier, P.; Militz, H.; Mai, C. The effect of fibreboard (MDF) disintegration technique on wood polymer composites (WPC) produced with recovered wood particles. Compos. A Appl. Sci. Manuf. 2019, 118, 312–316. [Google Scholar] [CrossRef]
- Krause, K.C.; Sauerbier, P.; Koddenberg, T.; Krause, A. Utilization of Recycled Material Sources for Wood-Polypropylene Composites: Effect on Internal Composite Structure, Particle Characteristics and Physico-Mechanical Properties. Fibers 2018, 6, 86. [Google Scholar] [CrossRef]
- Carus, M.; Partanen, A. Bioverbundwerkstoffe-Naturfaserverstärkte Kunststoffe (NFK) und Holz-Polymer-Werkstoffe (WPC). Fachagentur Nachwachsende Rohstoffe 2020. Available online: https://mediathek.fnr.de/bioverbundwerkstoffe.html (accessed on 7 August 2020).
- Partanen, A.; Carus, M. Wood and natural fiber composites current trend in consumer goods and automotive parts. Reinf. Plast. 2016, 60, 170–173. [Google Scholar] [CrossRef]
- Chodák, I.; Novak, I. Surface modification of polypropylene by additives. In Polypropylene; Karger-Kocsis, J., Ed.; Polymer Science and Technology Series; Springer: Dordrecht, The Netherlands, 1999; Volume 2, pp. 790–793. ISBN 978-94-010-5899-5. [Google Scholar]
- Brewis, D.M.; Briggs, D. Adhesion to polyethylene and polypropylene. Polymer 1981, 22, 7–16. [Google Scholar] [CrossRef]
- Zielonka, A. Jahrbuch Oberflächentechnik Band 58, 2002; Giesel: Hanover, Germany, 2009. [Google Scholar]
- Pethrick, R.A. Plasma surface modification of polymers: Relevance to adhesion. In Polymer International; Strobel, M., Lyons, C.S., Mittal, K.L., Eds.; VSP: Zeist, The Netherlands, 1994; ISBN 90-6764-164-2. [Google Scholar]
- Jamali, A.; Evans, P.D. Etching of wood surfaces by glow discharge plasma. Wood Sci. Technol. 2011, 45, 169–182. [Google Scholar] [CrossRef]
- Wolkenhauer, A.; Avramidis, G.; Cai, Y.; Militz, H.; Viöl, W. Investigation of wood and timber surface modification by dielectric barrier discharge at atmospheric pressure. Plasma Process. Polym. 2007, 4, 470–474. [Google Scholar] [CrossRef]
- Wascher, R.; Leike, N.; Avramidis, G.; Wolkenhauer, A.; Militz, H.; Viöl, W. Improved DMDHEU uptake of beech veneers after plasma treatment at atmospheric pressure. Eur. Wood Wood Prod. 2015, 73, 433–437. [Google Scholar] [CrossRef]
- Köhler, R.; Sauerbier, P.; Militz, H.; Viöl, W. Atmospheric Pressure Plasma Coating of Wood and MDF with Polyester Powder. Coatings 2017, 7, 171. [Google Scholar] [CrossRef]
- Hünnekens, B.; Avramidis, G.; Ohms, G.; Krause, A.; Viöl, W.; Militz, H. Impact of plasma treatment under atmospheric pressure on surface chemistry and surface morphology of extruded and injection-molded wood-polymer composites (WPC). Appl. Surf. Sci. 2018, 441, 564–574. [Google Scholar] [CrossRef]
- Oporto, G.S.; Gardner, D.J.; Bernhardt, G.; Neivandt, D.J. Characterizing the mechanism of improved adhesion of modified wood plastic composite (WPC) surfaces. J. Adhes. Sci. Technol. 2007, 21, 1097–1116. [Google Scholar] [CrossRef]
- Oporto, G.S.; Gardner, D.J.; Bernhardt, G.; Neivandt, D.J. Forced Air Plasma Treatment (FAPT) of Hybrid Wood Plastic Composite (WPC)-Fiber Reinforced Plastic (FRP) Surfaces. Compos. Interfaces 2009, 16, 847–867. [Google Scholar] [CrossRef]
- Sauerbier, P.; Anderson, J.; Gardner, D.J. Surface Preparation and Treatment for Large-Scale 3D-Printed Composite Tooling Coating Adhesion. Coatings 2018, 8, 457. [Google Scholar] [CrossRef]
- Ten Bosch, L.; Pfohl, K.; Avramidis, G.; Wieneke, S.; Viöl, W.; Karlovsky, P. Plasma-Based Degradation of Mycotoxins Produced by Fusarium, Aspergillus and Alternaria Species. Toxins 2017, 9, 97. [Google Scholar] [CrossRef]
- Krüss GmbH: Measuring with Method—But with Which One? Available online: https://www.kruss-scientific.com/fileadmin/user_upload/website/literature/kruss-tn314-en.pdf (accessed on 20 August 2020).
- Kaelble, D.H. Dispersion-Polar Surface Tension Properties of Organic Solids. J. Adhes. 1970, 2, 66–81. [Google Scholar] [CrossRef]
- Owens, D.K.; Wendt, R.C. Estimation of the surface free energy of polymers. J. Appl. Polym. Sci. 1969, 13, 1741–1747. [Google Scholar] [CrossRef]
- Owens, Wendt, Rabel and Kaelble (OWRK) Method. Available online: https://www.kruss-scientific.com/services/education-theory/glossary/owens-wendt-rabel-and-kaelble-owrk-method/ (accessed on 13 July 2018).
- European Committee for Standardization. DIN EN ISO 25178-2:2012-09 Geometrical Product Specifications (GPS)-Surface Texture: Areal-Part 2: Terms, Definitions and Surface Texture Parameters (ISO 25178-2:2012); European Committee for Standardization: Brussels, Belgium, 2012. [Google Scholar]
- ASTM International. ASTM D4541-02 Standard Test Method for Pull-Off Strength of Coatings Using Portable Adhesion Testers; ASTM International: West Conshohocken, PA, USA, 2002. [Google Scholar]
- European Committee for Standardization. DIN EN ISO 4624:2016-08 Paints and Varnishes-Pull-Off Test for Adhesion (ISO 4624:2016); European Committee for Standardization: Brussels, Belgium, 2016. [Google Scholar]
- European Committee for Standardization. DIN EN ISO 2409:2013-06 Paints and Varnishes-Cross-Cut Test (ISO 2409:2013); European Committee for Standardization: Brussels, Belgium, 2016. [Google Scholar]
- Beamson, G.; Briggs, D. High Resolution XPS of Organic Polymers: The Scienta ESCA300 Database; Wiley: Chichester, UK, 1992; ISBN 978-0-471-93592-6. [Google Scholar]
- Morent, R.; De Geyter, N.; Leys, C.; Gengembre, L.; Payen, E. Comparison between XPS- and FTIR-analysis of plasma-treated polypropylene film surfaces. Surf. Interf. Anal. 2008, 40, 597–600. [Google Scholar] [CrossRef]
- Jaleh, B.; Parvin, P.; Wanichapichart, P.; Saffar, A.P.; Reyhani, A. Induced super hydrophilicity due to surface modification of polypropylene membrane treated by O2 plasma. Appl. Surf. Sci. 2010, 257, 1655–1659. [Google Scholar] [CrossRef]
- Akhtarkhavari, A.; Kortschot, M.T.; Spelt, J.K. Adhesion and durability of latex paint on wood fiber reinforced polyethylene. Prog. Org. Coat. 2004, 49, 33–41. [Google Scholar] [CrossRef]
- Hünnekens, B.; Peters, F.; Avramidis, G.; Krause, A.; Militz, H.; Viöl, W. Plasma treatment of wood–polymer composites: A comparison of three different discharge types and their effect on surface properties. J. Appl. Polym. Sci. 2016, 133. [Google Scholar] [CrossRef]
- Hadjiivanov, K. Identification and Characterization of Surface Hydroxyl Groups by Infrared Spectroscopy. In Advances in Catalysis; Elsevier: Amsterdam, The Netherlands, 2014; Volume 57, pp. 99–318. ISBN 978-0-12-800127-1. [Google Scholar]
- Fabiyi, J.S.; McDonald, A.G.; Wolcott, M.P.; Griffiths, P.R. Wood plastic composites weathering: Visual appearance and chemical changes. Polym. Degrad. Stab. 2008, 93, 1405–1414. [Google Scholar] [CrossRef]
- Gerenser, L.J. X-Ray photoemission study of plasma modified polyethylene surfaces. J. Adhes. Sci. Technol. 1987, 1, 303–318. [Google Scholar] [CrossRef]
- Wang, K.; Wang, W.; Yang, D.; Huo, Y.; Wang, D. Surface modification of polypropylene non-woven fabric using atmospheric nitrogen dielectric barrier discharge plasma. Appl. Surf. Sci. 2010, 256, 6859–6864. [Google Scholar] [CrossRef]
- Hünnekens, B.; Krause, A.; Militz, H.; Viöl, W. Hydrophobic recovery of atmospheric pressure plasma treated surfaces of Wood-Polymer Composites (WPC). Eur. J. Wood Wood Prod. 2017, 75, 761–766. [Google Scholar] [CrossRef]
- Fowkes, F.M. Surface effects of anisotropic London dispersion forces in n-alkanes. J. Phys. Chem. 1980, 84, 510–512. [Google Scholar] [CrossRef]
- Busscher, H.J.; Van, A.W.J.; Bobr, P.D.; Jono, H.P.D.; Arends, J. The effect of surface roughenlng of polymers on measured contact angles of liquids. Colloids Surfaces 1984, 9, 319–331. [Google Scholar] [CrossRef]
- Satake, M.; Iwase, T.; Kurihara, M.; Negishi, N.; Tada, Y.; Yoshida, H. Effect of oxygen addition to an argon plasma on etching selectivity of poly(methyl methacrylate) to polystyrene. J. Micro/Nanolith. MEMS MOEMS 2013, 12, 041309. [Google Scholar] [CrossRef][Green Version]
- Slepička, P.; Vasina, A.; Kolská, Z.; Luxbacher, T.; Malinský, P.; Macková, A.; Švorčík, V. Argon plasma irradiation of polypropylene. Nuclear Instrum. Methods Phys. Res. Sect. B Beam Interact. Mater. At. 2010, 268, 2111–2114. [Google Scholar] [CrossRef]
- Lee, S.D.; Sarmadi, M.; Denes, F.; Shohet, J.L. Surface modification of polypropylene under argon and oxygen-RF-plasma conditions. Plasma Pol. 1997, 2, 177–198. [Google Scholar] [CrossRef]
- Terpilowski, K.; Rymuszka, D.; Holysz, L.; Chibowski, E. Changes in wettability of polycarbonate and polypropylene pretreated with oxygen and argon plasma. In Proceedings of the 8th International Conference MMT-20142, Ariel, Israel, 28 July–1 August 2014; pp. 155–165. [Google Scholar]
- Seo, E.-D. Atomic force microscopy and specular reflectance infrared spectroscopic studies of the surface structure of polypropylene treated with argon and oxygen plasmas. Macromol. Res. 2004, 12, 608–614. [Google Scholar] [CrossRef]
- Spyrides, S.M.M.; Alencastro, F.S.; Guimaraes, E.F.; Bastian, F.L.; Simao, R.A. Mechanism of oxygen and argon low pressure plasma etching on polyethylene (UHMWPE). Surf. Coat. Technol. 2019, 378, 124990. [Google Scholar] [CrossRef]
- James, J.; Joseph, B.; Shaji, A.; Nancy, P.; Kalarikkal, N.; Thomas, S.; Grohens, Y.; Vignaud, G. Microscopic Analysis of Plasma-Activated Polymeric Materials. In Non-Thermal Plasma Technology for Polymeric Materials; Elsevier: Amsterdam, The Netherlands, 2019; pp. 287–317. ISBN 978-0-12-813152-7. [Google Scholar]


| Working Gas | Carbon/at% | Oxygen/at% | Nitrogen/at% |
|---|---|---|---|
| Reference | 98.2 | 1.7 | 0.1 |
| Nitrogen (Ar/N2) | 80.9 | 18.3 | 0.8 |
| Oxygen (Ar/O2) | 77.7 | 21.8 | 0.5 |
| Syn. air | 79.5 | 19.7 | 0.8 |
| Working Gas | Sdr Increase/% |
|---|---|
| Syn. air | 179.6 |
| Oxygen (Ar/O2) | 292.2 |
| Nitrogen (Ar/N2) | 304.7 |
| Working Gas | Cross-Cut Classification |
|---|---|
| (Reference) | 5 |
| Syn. air | 0 |
| Oxygen (Ar/O2) | 0 |
| Nitrogen (Ar/N2) | 0 |
© 2020 by the authors. Licensee MDPI, Basel, Switzerland. This article is an open access article distributed under the terms and conditions of the Creative Commons Attribution (CC BY) license (http://creativecommons.org/licenses/by/4.0/).
Share and Cite
Sauerbier, P.; Köhler, R.; Renner, G.; Militz, H. Plasma Treatment of Polypropylene-Based Wood–Plastic Composites (WPC): Influences of Working Gas. Polymers 2020, 12, 1933. https://doi.org/10.3390/polym12091933
Sauerbier P, Köhler R, Renner G, Militz H. Plasma Treatment of Polypropylene-Based Wood–Plastic Composites (WPC): Influences of Working Gas. Polymers. 2020; 12(9):1933. https://doi.org/10.3390/polym12091933
Chicago/Turabian StyleSauerbier, Philipp, Robert Köhler, Gerrit Renner, and Holger Militz. 2020. "Plasma Treatment of Polypropylene-Based Wood–Plastic Composites (WPC): Influences of Working Gas" Polymers 12, no. 9: 1933. https://doi.org/10.3390/polym12091933
APA StyleSauerbier, P., Köhler, R., Renner, G., & Militz, H. (2020). Plasma Treatment of Polypropylene-Based Wood–Plastic Composites (WPC): Influences of Working Gas. Polymers, 12(9), 1933. https://doi.org/10.3390/polym12091933