Article

Thermal Decomposition Kinetics of Basalt Fiber-Reinforced Wood Polymer Composites

1
Co-Innovation Center of Efficient Processing and Utilization of Forest Products, College of Materials Science and Engineering, Nanjing Forestry University, Nanjing 210037, China
2
School of Renewable Natural Resources, Louisiana State University Agricultural Center, Baton Rouge, LA 70803, USA
*
Author to whom correspondence should be addressed.
Polymers 2020, 12(10), 2283; https://doi.org/10.3390/polym12102283
Submission received: 16 August 2020 / Revised: 21 September 2020 / Accepted: 22 September 2020 / Published: 5 October 2020
(This article belongs to the Special Issue Wood Plastic Composites)

Abstract

:
Thermogravimetric analysis (TGA) was used for the observation of the pyrolysis kinetics characteristics of high density polyethylene (HDPE)-based composites enhanced by a variety of basalt fibers (BFs) and wood flour (WF). The improved Coats-Redfern (C-R), Flynn-Wall-Ozawa (F-W-O), Friedman, and Kissinger methods were utilized to ascertain the specific apparent activation energy (Ea) of each component and composite material. The results indicate that BFs do not decompose under 800 °C, while the pyrolysis of WF and waste HDPE showed two significant weight loss zones (250–380 °C and 430–530 °C), relative to cellulose/hemicellulose and HDPE thermal degradation, respectively. The average Ea of WF/BF/HDPE composites over the entire pyrolysis process obtained by the modified C-R method fluctuated in a range of 145–204 kJ/mol and increased with the BF content, which was higher than that of WPC (115–171 kJ/mol). The value of Ea computed by the F-W-O method was significantly lower than that computed with the improved C-R method, which could validate the reliability of two methods by comparing with the literature. The Friedman and Kissinger methods were not applicable to this composite material reinforced by mixed fillers, so the obtained Ea values were quite different from the previous two methods. The changes in Ea showed that the addition of BFs could improve the average Ea and further enhance the thermal stability and flame resistance of the composites.

1. Introduction

Over the past few years, wood-plastic composites (WPCs), which show advantages with respect to biodegradability, low cost, superb mechanical and thermal insulation performance, and availability, have been regarded as a novel green renewable material exhibiting great potential for structural building applications [1,2,3,4]. However, the increasing environmental concerns and market demands on natural fibers mean that reinforced polymer matrices in WPCs must be more environmentally friendly, cost-effective, and higher strength [5]. An array of studies have assessed the applicability of both organic and inorganic fibers in polymers. Among these fibers, mineral basalt fibers (BFs) have attracted intense research interest as a reinforcing material.
Conventional fiber materials include glass (GFs) and carbon fibers (CFs) that form popular fibers in polymer composites [6]. However, the use of these fiber composites is hindered by serious drawbacks including high energy costs for production, inhalation health risks, non-recyclability, and lack of biodegradability [7,8]. In this context, BFs, as a natural reinforcing material in polymers, provide a promising alternative to WPCs. The fibers consist of SiO2 and Al2O3 and are composed of natural ores via melting at ~1500 °C and have a significant number of capabilities including economical costs, high strength, excellent oxidation and corrosion resistance, are non-flammable, and show high insulative properties [9,10,11,12]. Furthermore, BFs have higher heat resistance and mechanical stability than both GFs and CFs [13,14,15]. Bashtannik et al. [16] successfully prepared polypropylene (PP) reinforced with BFs via extrusion and concluded that BF-reinforced polymers display excellent wear properties. Ozturkl et al. [17] showed that BF content initially intensified the resistance and peel strength of basalt/phenolic resin composites, which decreased when the BF content exceeded recommended levels, showing optimal properties at 48 wt.%. Wu et al. [18] discussed the thermal properties and morphologies of BF-loaded high density polyethylene (HDPE) and co-extruded WPCs with BF/HDPE composite shells. It was shown that BF, when present in the HDPE matrix, increased flexural expansion and increased dynamic and tensile modulus. However, compared with HDPE alone, BF/HDPE composites display a simplified linear coefficient of thermal expansion (LCTE).
Compared with other common plastics (such as PP and PE), HDPE, with a better low temperature resistance and relatively cheap price, has many mechanical property advantages, such as improved rigidity, hardness, and tensile strength [19]. The flexural and tensile properties of composite materials obtained by adding wood materials into polymers have been shown to be significantly improved, dimensional stability is maintained, and the environment will not be polluted during or after its useful lifetime [20,21,22]. WPCs have been favored by the vast majority of people, and the usage and output of WPCs are rapidly increasing every year. However, both the wood fiber and polymeric materials in WPC are flammable materials. Once exposed to fire, it is easy to cause further fires, and poses a serious threat to people’s lives, which restricts the application field of the material. Therefore, basalt fibers were selected to be added to WPC as a way to improve its thermal stability. Basalt products can be used over a wide temperature range (about −200~800 °C). Bazan et al. [23] added basalt fiber into poly (oxymethylene) and observed higher thermal and dimensional stability with very good strength and excellent stiffness for BF-reinforced composites. Ying et al. [24] reported the BFs had better strength retention than glass fibers at a relatively high temperature.
Thermogravimetric analysis (TGA) has extensive applications in the analysis of polymeric material composition, with the ability to ascertain thermal stability, decomposition reactions, and material kinetics. Kinetic analysis of pyrolysis reactions is important in understanding physiochemical changes during pyrolysis processing of materials. The thermal performance of WPCs is decided by a mix of factors related to heat and temperature, and the pyrolysis characteristics of composites have been evaluated [25,26,27]. Zhang et al. [28] fabricated BF-reinforced poly butylene succinate (PBS) composites using distinct molding methods and characterized how the heat resistance of the BF/PBS composites were enhanced with BF incorporation. Kim [29] demonstrated that the TGs of BF composites grew by ≥15 °C for epoxy-amine composites and ≥ 20% for epoxy-anhydride composites. BFs supplementation into the WPCs enhanced the performance of all composites assessed.
Herein, to systematically assess the thermal stability of WF/BF/HDPE composites, we investigated the influence of heating rates on pyrolysis through TGA. The modified Coats-Redfern (C-R), Flynn-Wall-Ozawa (F-W-O), Friedman, and Kissinger protocols were employed for the assessment of apparent activation energy (Ea) and to perform thermal decomposition measurements of the composites to enhance our understanding of the reaction mechanisms and pyrolysis characteristics during thermogravimetric decomposition.

2. Methods

2.1. Study Agents/Fibers

BFs (diameter = 7 µm, length = 2.5 cm, density = 2.6 g/m3) were supplied by the US-headquartered company CETCO Oilfield Services (Broussard, LA, USA). Wood flour was obtained from American pine (particle size: 0.6–0.75 mm). Coupling agents including maleic anhydride grafted polypropylene (MAPE), EpoleneTM G2608 with a melt flow rate (MFR) of 6 to 10 g/10 min at 190 °C/2.16 kg, MF = 65,000 g/mol, and acid number 8 mg KOH/g were purchased from Eastman Chemical Co. (Kingsport, TN, USA) to enhance filler and plastic compatibility. HDPE (AD60-007) with an MFR = 0.7 g/10 min at 190 °C/2.16 kg and density = 0.96 g/cm3 was purchased from Exxon Mobil Chemicals (Houston, TX, USA).

2.2. Composite Sample Preparation

BF, WF, HDPE, and 2% MAPE (accounts for 2% of the total mass fraction) were melt compounded (Table 1) using a counter-rotating Brabender twin-screw extruder equipped with an intermesh at 40 rpm. Feeding zone temperatures of the extruders were set at 150 °C and the plasticizing and homogenizing zone temperatures were 175 °C. Extrudates were cooled and pelletized. Pellets were dried in the oven at 70 °C for 12 h before experimental analyses.

2.3. Test Conditions for Thermogravimetric Analysis

Thermogravimetric decomposition assessments were employed for the assessment of global mass loss on a TG209F3 analyzer (Netzsch Group, Selb, Germany). Experimental temperatures were set at 30 ± 3 °C to 800 °C at four heating rates for a period of 5 to 20 °C/min. Samples (6 mg) were taken and dried at 70 °C for 24 h before testing. Experiments were performed at room temperature (RT) under 99.5% nitrogen and 0.5% oxygen at a 30 mL/min flow rate.

2.4. Data Analysis

Kinetic studies were assessed using the fundamental rate equation:
d α / d t = k f α
where k : rate constant and f(α): reaction model decided by the reaction mechanism.
Equation (1): rate of conversion; d α / d t : fixed temperature according to the loss of the reactant and rate constant.
Conversion rate (α):
α = W 0 W t / W 0 W f
where W0, Wt and Wt: initial, time t, and final weights of samples, respectively.
k was defined using the Arrhenius equation:
k = A e x p E a / R T
Where Ea: activation energy in kJ/mol, R: gas constant (8.3145 J/K mol), A: pre-exponential factor (min−1), and T absolute temperature (K).
Combining Equations (1) and (3):
d α / d t = A e x p E a / R T f α
Dynamic TGA is calculated through the introduction of the heating rate,   β = d T / d t , into Equations (4) and (5), for which the following holds:
d α / d t = A / β e x p E a / R T f α
This equation represents the assessment of the kinetic parameters of the TGA data.
The F-W-O and improved C-R methods (Table 2) are frequently employed to measure the activation energy [30]. The iso-conversional F-W-O results in E a / R from the slope up to lg β   versus 1 / T with a given rate of conversion. The improved C-R method uses ln β / T P 2 against 1 / T assessed at a range of temperatures and heating rates from TG (DTG, derivative thermogravimetry) curves. Under the framework of the Friedman method, ln d α / d t should be drawn in line with 1 / T during a set of tests and the Kissinger method explicitly results in E a / R of the term ln β / T 2 according to 1 / T P with heating rates at the peak temperature, TP, of the DTG curve.

3. Results and Discussion

3.1. Thermal Decomposition Characteristics

The thermogravimetric decomposition process of raw materials at a given heating rate of 20 °C /min is shown in Figure 1. The thermal degradation of cellulosic materials occurring in the composite material processing process may influence the composite performance [30,31,32]. At a lower temperature (below 100 °C), BFs and waste HDPE almost did not decompose in the TG curves, and the residual mass was nearly 100%. Wood flour had a weight loss of ~7 % as a result of the loss of adsorbed water and crystal water from the fibers [33]. The residue of BFs, WF, and waste HDPE was 97.1%, 15.5%, and 3.9%, respectively, at the end of test, which were quite different. BFs had only 3% weight loss in the entire pyrolysis process, which was consistent with the literature [34], and the residual mass was the largest among the three raw materials, indicating that BF had a good high temperature resistance. At a given heating rate, the pyrolysis of wood mainly went through four stages with increasing temperature. The first stage is from 100 to 250 °C, where the weight loss of wood materials was very small, because only a portion of the cellulose was dehydrated at lower temperature to produce dehydrated cellulose, which was a slow process. The second stage was from 250 °C to 450 °C, which is the main stage of samples pyrolysis. In this range, hemicellulose and cellulose in the wood pyrolysis reaction produce bio oil, dehydrated cellulose further generated small molecular gas and coke, resulting in significant weight loss, and the weight loss rate reached a maximum value at about 350 ° C. The last area corresponded to the slow decomposition of lignin and the final residue, and some carbon and ash were generated [35,36,37]. The two weightless peaks in Figure 1 of waste HDPE, with complex components, were the decomposition of wood fiber and HDPE. The main structure of HDPE was C-C as the main chain, and its pyrolysis process is a free radical chain reaction. According to the TG-DTG curves of materials in Figure 1, it can be deduced that the second part was mainly the fracture of the C-C main chain in HDPE, which is the pyrolysis macromolecular polymers into small molecules. The weight loss rate of continuous BFs was the lowest relative to the others, because basalt fibers were mainly composed of SiO2 as the main component, Al2O3 as the secondary, and other oxide ceramic components, which leads to basalt fibers showing excellent high temperature resistance performance [38]. The initial decomposition temperature T0 (obtained by the corresponding temperature when the weight loss percentage was 5%) of the three raw materials at the differential heating rates β, the peak temperature TP (the temperature at the maximum point on the DTG curve), WL (ratio of weight loss percentage relative to T0 and TP is the marked sample, respectively), and residual amount are shown in Table 3. As the weight changes of BFs were so small that the mass loss rates were less than 5 % at 800 °C, the following studies on the decomposition and average Ea of BFs were no longer conducted.
Table 3 presents the thermal decomposition parameters of the raw materials at the indicated heating rates. The heating rate of the raw material temperature lagged behind that of environmental temperatures, meaning the T0 and TP increased. The temperatures when DTG reached the peaks of WF and waste HDPE at a heating rate of 5 °C/min were 342.0 and 447.5 °C, respectively. Once the heating rate approached 20 °C/min, the maximum TP of WF and waste HDPE appeared at 357.4 °C and 469.6 °C, respectively, which were higher than that at 5, 10, and 15 °C/min.
The thermogravimetric decomposition process of wood plastic composites and WPCs reinforced with varying amounts of BFs at a heating rate of 20 °C/min is shown in Figure 2. With reference to Figure 2, the general trend of TG and DTG curves for WPCs and WPCs reinforced with BFs was similar, and the two significant weight loss zones of the composites were in the 250–350 °C and 440 –540 °C ranges. The first weight loss stage of wood-plastic composites was mainly pyrolysis of the mixture of cellulose and hemicellulose in wood flour, and the second was the fracture of the C-C main chain in HDPE [35]. The coke produced by the pyrolysis of hemicellulose and cellulose covered the surface of HDPE and basalt fibers, which prevented further pyrolysis of the composite materials, and the salt minerals in basalt fibers also have some chemical reactions during this stage; for example, FeO was oxidized to Fe2O3, which makes the pyrolysis of composites more difficult [23]. Thermal decomposition parameters, T0 and TP, and residual amounts of composites with different BF contents with varying heating rates are listed in Table 4. When the heating rate grew from 10 °C/min to 30 °C/min, T0 of all composites tended to move towards a high temperature side, and the temperature relative to maximal weight loss rate also tended to increase, which was consistent with the view of Kim et al. [39]. This is because the outside-to-inside heat transfer of the particles takes a longer time at a higher temperature rise rate [40], which reduces the heat transfer efficiency, so the TP rises when the maximum weight loss rate is attained. In addition, there was no distinct difference in residual mass among the four heating rates observed, indicating that the change in heating rate made no obvious impact on residue. Compared with A2 (without loading BFs in composites), the T0 and TP of composite materials with BF addition shifted to higher temperatures, and with a higher BF content, the T0 and TP values were higher. In addition, the content of BF mainly affected the change in the residual amount of the thermal decomposition process of composites, and the residual levels of WF/BF/HDPE composites were significantly greater than those of WF/HDPE composites; furthermore, the composite residuals gradually increased with the increasing BF content, indicating the filling of BFs is beneficial in improving the thermal stability of composites.
Heating rates significantly impact the thermogravimetric process of materials (Table 3 and Table 4). With increasing heating rates, the thermogravimetric curves reach higher temperatures, causing the extent of the weight loss of materials to vary. Generally, it is considered that the difference in the degree of weight loss under different heating rates are due to the differences in the reaction process and secondary reactions of WPC at varying heating rates, resulting in the discrepancy concerning wood flour carbonization. In addition, with increasing heating rates, the main reaction ranges of the materials are widened.
The T0 and TP values of all materials changed with the increased heating rates, as the actual temperature of the materials lagged behind the surrounding temperatures with the increased heating rates during testing. To exclude the effects of the heating rate, T0 and TP were retrieved from the linear extrapolation β = 0 . Figure 3 shows the decomposition characteristic parameters with 6.7% BF content (B3). According to its T0 and TP values under different heating rates, linear extrapolation methods were adopted to determine the initial T0 and TP values [41]. Table 5 lists T0, TP, and residual mass of composites after linear fitting. It is shown that there is no significant change in T0 and TP among wood plastic composite materials with different wood flour concentrations. Compared with wood plastic composites, the addition of BFs has little impact on the T0 and TP of materials after eliminating the influences of heating rates, indicating that the BF content within the scope of the test had little influence on the material characteristics of the pyrolysis process temperature, but the addition of BF increased the residual mass of the composites.

3.2. Kinetics of WPC

Upon assessment of the pyrolysis kinetics of the materials, the activation energy (Ea) tendencies of the materials were assessed. Figure 4 presents representative iso-conversional plots drawn by the modified C-R and F-W-O methods for waste HDPE and wood-plastic composites (A2), respectively. Assuming a reaction order of n = 1 according to the modified C-R method, the connectivity of ln β / T 2 and 1 / T at different conversion rates ranging between 0.1 and 0.9 is shown in Figure 4, and the kinetic parameters calculated with varying heating rates are listed in Table 6. The fitting lines of different conversion rates were close to parallel, suggesting that they had an approximate Ea and, consequently, the pyrolysis process could be described as a first-order reaction. From the TG curves, the conversion rate was relatively slow when the pyrolysis conversion rate of materials was between 0 and 10%, and in addition, Yao et al. [30] found that the reaction mechanism was altered under conditions of high conversion rates when studying the thermal decomposition of different natural fiber materials. As such, we focused on conversions ranging from 0.2 to 0.8 as opposed to the complete process. The correlation coefficients (R2) of kinetic parameters computed with the improved Coats-Redfern method with different conversion rates (α = 0.2–0.8) were greater than 0.9 (in Table 6), which indicates that the C-R method can better describe the pyrolysis process. The average Ea value of WF was close to that of waste HDPE, at 182.7 and 178.9 kJ/mol, respectively. By comparing four kinds of WPCs with different ratios of wood flour, it can be found that, as the proportion of WF increased, the Ea values also continued to increase. When the WF content accounted for 5 wt.% in the composites, the activation energy calculated by the C-R method was 115.8 kJ/mol, and when the wood flour content accounted for 20%, the Ea value was 171.3 kJ/mol. This is because the pyrolysis carbonization of wood flour can form carbon on the plastic matrix in WPC materials, which prevents heat transfer, so that the reaction activation energy of the composite material increases.

3.3. Kinetics of WPC Reinforced with BFs

Activation energy trends of wood-plastic composites reinforced with basalt fibers are expressed in the plots of iso-conversional improved C-R and F-W-O methods in Figure 5. The F-W-O plot for B3 is listed in Figure 5a, and Figure 5b illustrates the plot of the modified C-R method. The fitted lines were nearly parallel as the conversion rate varied from 0.5 to 0.8 and the specific activation energy values are presented in Table 6. The average Ea obtained by the modified C-R method of wood plastic composites loaded with 3.3 wt% BFs was relatively low at 145.5 kJ/mol, but the differences in average Ea values with incremental BF contents became obvious. The average Ea of BF/WF/HDPE composites increased to 204.6 kJ/mol after the fiber loading level increased to 6.7 wt.%.
Ea is a key factor used to ascertain the reaction rate, indicative of the minimum energy necessary to reach an activating molecule from the reactant molecule in the chemical reaction [42]. Different reactions are matched with different activation energies. Besides, a lower reaction Ea results in more highly activated molecules and faster reaction rates at a given temperature. Conversely, a higher average Ea results in a slower reaction rate. The modified Coats-Redfern, Flynne-Walle-Ozawa, and Friedman methods were adopted for ascertaining the Ea of overall composite materials. The average Ea values of WF/BF/HDPE composites calculated by modified Coats-Redfern and F-W-O methods were significantly greater than those of WF/HDPE composites. Moreover, the average Ea increased, which indicates that the addition of BFs improves the thermal stability of the composite, increases the difficulty of thermal decomposition, and enhances the fire safety performance. This is because the BF is resistant to high temperatures, which enables the BF/WF/HDPE composites to have a better thermal stability from the surface and higher Ea. Through the evaluation of the decomposition activation energy for wood-plastic composites and WF/BF/HDPE composites, it can be judged that composites coated with BFs enjoy prominent edges. However, it is worth mentioning that the Ea values computed with the Friedman and Kissinger methods are quite different from those obtained by the other two methods, indicating that the Friedman and Kissinger models are not suitable for basalt fiber-reinforced wood-plastic composites. Scholars have made pyrolysis kinetic models of natural materials and fiber-reinforced polymer composites, and the Ea values are consistent with different kinetic models [30,43,44,45]. The differences of Ea in composite materials may be due to the mixture of basalt fibers and wood flour, which leads to changes in the pyrolysis process. In the initial stage of the pyrolysis process (α = 0.1–0.4), the accelerated decomposition process of hemicellulose, cellulose, and HPDE is prominent, which corresponds to the carbonization of cellulose and fracture of the HDPE backbone. Beyond α = 0.4, the fitting lines of materials were parallel and close. This is because the carbonization of wood flour in the initial stage hindered the transfer of heat, and basalt fibers still maintained a stable state at this stage, so the energy required for the pyrolysis reaction gradually increased, resulting in Ea values higher than in the initial stage.
The linear relationship between log β   and 1 / T at different conversion rates obtained via the F-W-O method is displayed in Figure 4 and Figure 5. The specific results of Ea and correlation coefficients are also listed in Table 6. The iso-conversional F-W-O method, defined as a specific integral method devoid of a functional model, can avert the trouble of choosing the reaction mechanism function until the activation energy is solved, without causing errors related to the hypothesis about the reaction mechanism function. Consequently, it is capable of examining the feasibility of the activation energy retrieved from the Coats-Redfern model method. Thus, the value of Ea calculated by the F-W-O method was not significantly different from that computed with the modified Coats-Redfern method. The activation energies retrieved with the F-W-O method were relatively higher, but the variation in Ea was the same as that obtained by the modified Coats-Redfern method. This change was similar to the literature [45,46], which proves that the kinetic parameters obtained by these two models are reliable. The activation energy calculated by the Friedman and Kissinger methods was quite different from the value obtained by the modified Coats-Redfern method, which shows that WPCs loaded with basalt fiber cannot be accurately modelled with the Friedman and Kissinger models.
Figure 6 shows the changes in activation energy in raw materials and composite materials with respect to the conversion rate. Figure 4a clearly shows that the Ea values of wood flour and waste HDPE increase as the conversion rate increases, and the corresponding activation energy range (153–234 kJ/mol) of HDPE during the entire pyrolysis process is relatively narrow compared with that of wood flour (59–224 kJ/mol). Low Ea with low rates of conversion and high Ea with high rates of conversion of polymer composite materials (in Figure 6b, c) are presented in their pyrolysis processes, which imply different decomposition mechanisms [47]. It is obvious that, in Figure 6c, the Ea values of WPCs reinforced with basalt fibers at any conversion rate over the full pyrolysis range are significantly higher than those of other WPCs without basalt fibers loading. These results demonstrate that polymer composites reinforced with basalt fibers show better thermal stability compared with other WPCs.

4. Conclusions

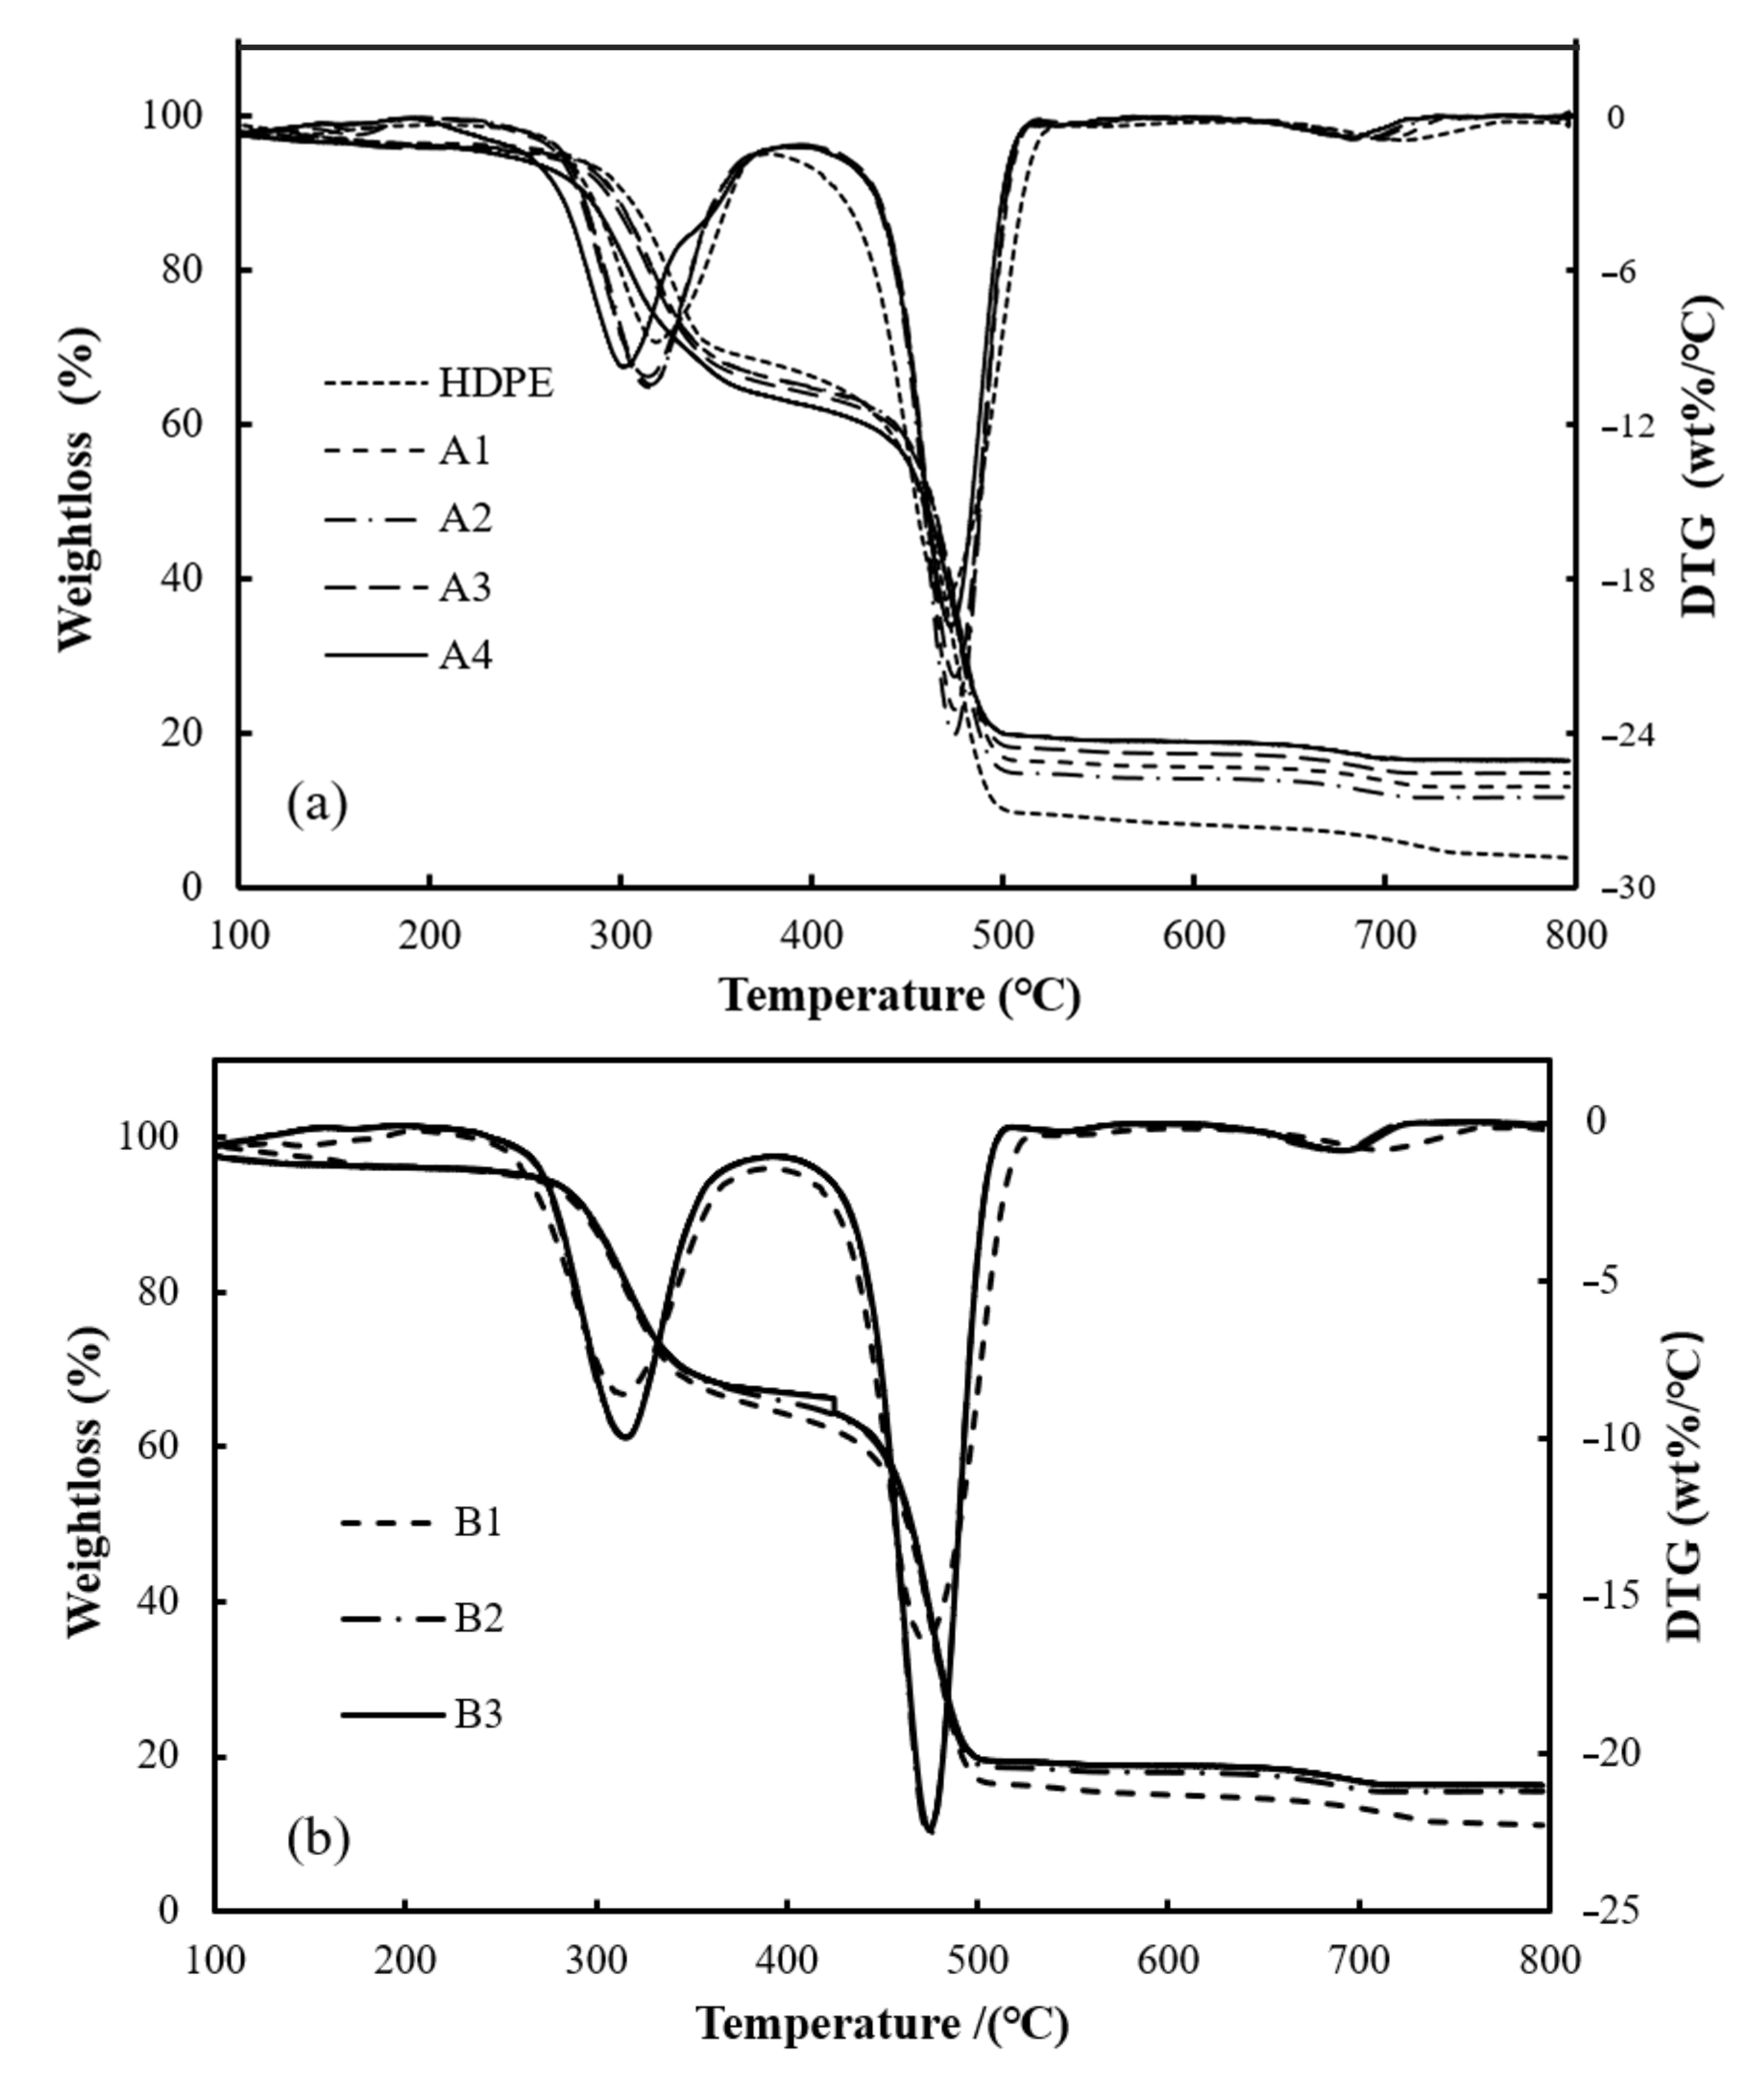
  • This research investigated how basalt fiber content in HDPE matrix composites affected the thermal decomposition process using dynamic thermogravimetric analysis. The thermal decomposition of WF/HDPE and BF/WF/HDPE composites at temperatures ranging between room temperature and 800 °C showed significant weight loss zones. The pyrolysis of cellulose/hemicellulose of wood flour occurred from 250 to 380 °C, and HDPE was mainly decomposed within a temperature range of 430–530 °C.
  • Heating rates β have a great influence on the thermal weight loss of composites. With increased heating rates, the TG curves were significantly shifted to high temperatures. By eliminating the influence exerted by the heating rate on composite pyrolysis, the addition of BFs caused the decomposition temperature range, T0, and TP of the composite materials to shift towards a high temperature in comparison with wood-plastic composites, indicating that the introduction of BFs improved the thermal stability of composites.
  • The modified Coats-Redfern, Flynn-Wall-Ozawa, Friedman, and Kissinger methods were used to model the activation energies of these materials. The results show the values of 115–171 kJ/mol for wood-plastic composites and 145–204 kJ/mol for other composites reinforced with basalt fibers obtained by the modified Coats-Redfern and Flynn-Wall-Ozawa methods throughout the pyrolysis processes, but the Friedman and Kissinger models were not suitable for polymer materials reinforced by mixed fillers. The addition of basalt fibers in polymer composites increased the activation energy and exhibited better stability during pyrolysis, and the increased degree of activation energy was significant as the content of basalt fibers increased.

Author Contributions

R.H. designed the study and conducted parts of experiments and data analysis. X.Z. wrote the initial manuscript. X.Z. performed the composite property testing/data analysis. All authors have read and agreed to the published version of the manuscript.

Funding

This collaborative study was supported by Major projects of Natural Science Foundation of Jiangsu (18KJA220002); China Postdoctoral Science Foundation: Special Program (2017T100313); China Postdoctoral Science Foundation: General Program (2016M601821). Natural Science Foundation of China (Grant No. 51606103); Louisiana Board of Regents, grant number LEQSF (2017-19)-RD-B-01.

Conflicts of Interest

There is no conflict of interest among authors.

References

  1. Yang, C.; Li, G.; Qi, R.; Huang, M. Glass fiber/wood flour modified high density polyethylene composites. J. Appl. Polym. Sci. 2011, 123, 2084–2089. [Google Scholar] [CrossRef]
  2. Salim, W.S. Comparison Between Wood Plastic Composites (WPCs) And Woods. Master’s Thesis, Sudan University of Science & Technology. Available online: http://repository.sustech.edu/handle/123456789/9436 (accessed on 13 May 2020).
  3. Kaseem, M.; Hamad, K.; Deri, F.; Ko, Y.G. Material properties of polyethylene/wood composites: A review of recent works. Polym. Sci. Ser. A 2015, 57, 689–703. [Google Scholar] [CrossRef]
  4. Chen, B.; Shen, X.; Luo, Z.; Chen, H.; Cai, D.; Chen, C.; Zhang, C.; Qin, P.; Cao, H.; Tan, T. Feasibility of polyethylene composites reinforced by distillers dried fibers with solubles (DDFS) after different generations of ethanol fermentation. RSC Adv. 2018, 8, 25602–25610. [Google Scholar] [CrossRef] [Green Version]
  5. Lee, S.-Y.; Kang, I.-A.; Doh, G.-H.; Yoon, H.-G.; Park, B.-D.; Wu, Q. Thermal and Mechanical Properties of Wood Flour/Talc-filled Polylactic Acid Composites: Effect of Filler Content and Coupling Treatment. J. Thermoplast. Compos. Mater. 2008, 21, 209–223. [Google Scholar] [CrossRef]
  6. Mirabedini, A.; Ang, A.; Nikzad, M.; Fox, B.; Lau, K.-T.; Hameed, N. Evolving Strategies for Producing Multiscale Graphene-Enhanced Fiber-Reinforced Polymer Composites for Smart Structural Applications. Adv. Sci. 2020, 7, 1903501. [Google Scholar] [CrossRef] [Green Version]
  7. Cheung, H.-Y.; Ho, M.-P.; Lau, K.-T.; Cardona, F.; Hui, D. Natural fibre-reinforced composites for bioengineering and environmental engineering applications. Compos. Part. B Eng. 2009, 40, 655–663. [Google Scholar] [CrossRef]
  8. Mokhtar, I.; Yahya, M.Y.; Kadir, M.R.A.; Kambali, M.F. Effect on Mechanical Performance of UHMWPE/HDPE-Blend Reinforced with Kenaf, Basalt and Hybrid Kenaf/Basalt Fiber. Polym. Technol. Eng. 2013, 52, 1140–1146. [Google Scholar] [CrossRef]
  9. Friedrich, M.; Schulze, A.; Walter, C.; Weikert, D.; Binh, N.M.; Zahn, D.R.; Prösch, G. Investigation of Chemically Treated Basalt and Glass Fibres. Microchim. Acta 2000, 133, 171–174. [Google Scholar] [CrossRef]
  10. Czigány, T.; Pölöskei, K.; Karger-Kocsis, J. Fracture and failure behavior of basalt fiber mat-reinforced vinylester/epoxy hybrid resins as a function of resin composition and fiber surface treatment. J. Mater. Sci. 2005, 40, 5609–5618. [Google Scholar] [CrossRef]
  11. Sim, J.; Park, C.; Moon, D.Y. Characteristics of basalt fiber as a strengthening material for concrete structures. Compos. Part. B Eng. 2005, 36, 504–512. [Google Scholar] [CrossRef]
  12. Dalinkevich, A.A.; Gumargalieva, K.Z.; Marakhovsky, S.S.; Soukhanov, A.V. Modern Basalt Fibrous Materials and Basalt Fiber-Based Polymeric Composites. J. Nat. Fibers 2009, 6, 248–271. [Google Scholar] [CrossRef]
  13. Militký, J.; Kovačič, V.; Rubnerová, J. Influence of thermal treatment on tensile failure of basalt fibers. Eng. Fract. Mech. 2002, 69, 1025–1033. [Google Scholar] [CrossRef]
  14. Artemenko, S.E. Polymer Composite Materials Made from Carbon, Basalt, and Glass Fibers. Structure and Properties. Fibre Chem. 2003, 35, 226–229. [Google Scholar] [CrossRef]
  15. Liu, Q.; Shaw, M.T.; Parnas, R.S.; McDonnell, A.-M. Investigation of basalt fiber composite aging behavior for applications in transportation. Polym. Compos. 2006, 27, 475–483. [Google Scholar] [CrossRef]
  16. Bashtannik, P.I.; Ovcharenko, V.G.; Boot, Y.A. Effect of combined extrusion parameters on mechanical properties of basalt fiber-reinforced plastics based on polypropylene. Mech. Compos. Mater. 1997, 33, 600–603. [Google Scholar] [CrossRef]
  17. Öztürk, S. The effect of fibre content on the mechanical properties of hemp and basalt fibre reinforced phenol formaldehyde composites. J. Mater. Sci. 2005, 40, 4585–4592. [Google Scholar] [CrossRef]
  18. Wu, Q.; Chi, K.; Wua, Y.; Lee, S. Mechanical, thermal expansion, and flammability properties of co-extruded wood polymer composites with basalt fiber reinforced shells. Mater. Des. 2014, 60, 334–342. [Google Scholar] [CrossRef]
  19. Halary, J.L.; Laupretre, F.; Monnerie, L. Polymer Materials: Macroscopic Properties and Molecular Interpretations; Wiley & Sons: Hoboken, NJ, USA, 2010; ISBN 978-0-470-61619-2. [Google Scholar]
  20. Morrell, J.J.; Stark, N.M.; Pendleton, D.E.; McDonald, A.G. Durability of Wood-Plastic Composites. Available online: https://www.researchgate.net/publication/47538905 (accessed on 22 May 2020).
  21. García, M.; Hidalgo, J.; Garmendia, I.; García-Jaca, J. Wood–plastics composites with better fire retardancy and durability performance. Compos. Part. A Appl. Sci. Manuf. 2009, 40, 1772–1776. [Google Scholar] [CrossRef]
  22. Khanam, P.N.; Reddy, G.R.; Raghu, K.; Naidu, S.V. Tensile, Flexural, and Compressive Properties of Coir/Silk Fiber-reinforced Hybrid Composites. J. Reinf. Plast. Compos. 2009, 29, 2124–2127. [Google Scholar] [CrossRef]
  23. Bazan, P.; Kuciel, S.; Sądej, M. The influence of adding long basalt fiber on the mechanical and thermal properties of composites based on poly(oxymethylene). J. Thermoplast. Compos. Mater. 2018, 33, 435–450. [Google Scholar] [CrossRef]
  24. Ying, S.; Zhou, X. Chemical and thermal resistance of basalt fiber in inclement environments. J. Wuhan Univ. Technol. Sci. Ed. 2013, 28, 560–565. [Google Scholar] [CrossRef]
  25. Kaboorani, A. Effects of Formulation Design on Thermal Properties of Wood/Thermoplastic Composites. J. Compos. Mater. 2010, 44, 2205–2215. [Google Scholar] [CrossRef]
  26. Jeske, H.; Schirp, A.; Cornelius, F. Development of a thermogravimetric analysis (TGA) method for quantitative analysis of wood flour and polypropylene in wood plastic composites (WPC). Thermochim. Acta 2012, 543, 165–171. [Google Scholar] [CrossRef]
  27. Guo, Y.; Zhu, S.; Guo, Y.; Li, D. Thermal Properties of Wood-Plastic Composites with Different Compositions. Materials 2019, 12, 881. [Google Scholar] [CrossRef] [PubMed] [Green Version]
  28. Zhang, Y.; Yu, C.; Chu, P.K.; Lv, F.; Zhang, C.; Ji, J.; Zhang, R.; Wang, H. Mechanical and thermal properties of basalt fiber reinforced poly(butylene succinate) composites. Mater. Chem. Phys. 2012, 133, 845–849. [Google Scholar] [CrossRef]
  29. Kim, H. Enhancement of thermal and physical properties of epoxy composite reinforced with basalt fiber. Fibers Polym. 2013, 14, 1311–1316. [Google Scholar] [CrossRef]
  30. Yao, F.; Wu, Q.; Lei, Y.; Guo, W.; Xu, Y. Thermal decomposition kinetics of natural fibers: Activation energy with dynamic thermogravimetric analysis. Polym. Degrad. Stab. 2008, 93, 90–98. [Google Scholar] [CrossRef]
  31. Fei, Y. Rice straw fiber polymer composites: Thermal and mechanical performance. Available online: https://www.researchgate.net/publication/265934018 (accessed on 26 May 2020).
  32. Beldzki, A.K.; Faruk, O.; Sperber, V.E. Natural and Wood Fibre Reinforcement in Polymers; Rapra Technology Ltd.: Shrewsbury, UK, 2002. [Google Scholar]
  33. Zeriouh, A.; Belkbir, L. Thermal decomposition of a Moroccan wood under a nitrogen atmosphere. Thermochim. Acta 1995, 258, 243–248. [Google Scholar] [CrossRef]
  34. Chen, J.; Yi-Zhuo, G.U.; Yang, Z.J.; Min, L.I.; Wang, S.K.; Zhang, Z.G. Effects of Elevated Temperature Treatment on Compositions and Tensile Properties of Several Kinds of Basalt Fibers. J. Mater. Eng. 2017, 45, 61–66. [Google Scholar] [CrossRef]
  35. Bilbao, R.; Mastral, J.; Aldea, M.; Ceamanos, J. Kinetic study for the thermal decomposition of cellulose and pine sawdust in an air atmosphere. J. Anal. Appl. Pyrolysis 1997, 39, 53–64. [Google Scholar] [CrossRef]
  36. Statheropoulos, M.; Liodakis, S.; Tzamtzis, N.; Pappa, A.; Kyriakou, S. Thermal degradation of Pinus halepensis pine-needles using various analytical methods. J. Anal. Appl. Pyrolysis 1997, 43, 115–123. [Google Scholar] [CrossRef]
  37. Kilzer, F.J.; Broido, A. Speculation on the nature of cellulose pyrolysis. Pyrodynamics 1965, 2, 151–163. [Google Scholar]
  38. Hao, L.; Yu, W. Comparison of the morphological structure and thermal properties of basalt fiber and glass fiber. J. Xian Polytechnic Univ. 2009, 23, 327–332. [Google Scholar]
  39. Kim, J.; Ly, H.V.; Kim, J.; Choi, J.H.; Woo, H.C. Thermogravimetric characteristics and pyrolysis kinetics of Alga Sagarssum sp. biomass. Bioresour. Technol. 2013, 139, 242–248. [Google Scholar] [CrossRef]
  40. Giuntoli, J.; Arvelakis, S.; Spliethoff, H.; de Jong, W.; Verkooijen, A.H.M. Quantitative and Kinetic Thermogravimetric Fourier Transform Infrared (TG-FTIR) Study of Pyrolysis of Agricultural Residues: Influence of Different Pretreatments. Energy Fuels 2009, 23, 5695–5706. [Google Scholar] [CrossRef]
  41. Marongiu, A.; Faravelli, T.; Ranzi, E. Detailed kinetic modeling of the thermal degradation of vinyl polymers. J. Anal. Appl. Pyrolysis 2007, 78, 343–362. [Google Scholar] [CrossRef]
  42. Hung, K.-C.; Yang, C.-N.; Yang, T.C.; Wu, T.-L.; Chen, Y.-L.; Wu, J.-H. Characterization and Thermal Stability of Acetylated Slicewood Production by Alkali-Catalyzed Esterification. Materials 2017, 10, 393. [Google Scholar] [CrossRef]
  43. Arora, S.; Kumar, M.; Dubey, G.P. Thermal decomposition kinetics of rice husk: Activation energy with dynamic thermogravimetric analysis. J. Energy Inst. 2009, 82, 138–143. [Google Scholar] [CrossRef]
  44. Hung, K.-C.; Yeh, H.; Yang, T.C.; Wu, T.-L.; Xu, J.-W.; Wu, J.-H. Characterization of Wood-Plastic Composites Made with Different Lignocellulosic Materials that Vary in Their Morphology, Chemical Composition and Thermal Stability. Polymers 2017, 9, 726. [Google Scholar] [CrossRef] [Green Version]
  45. Avella, M.; Avolio, R.; Bonadies, I.; Carfagna, C.; Errico, M.E.; Gentile, G. Effect of compatibilization on thermal degradation kinetics of HDPE-based composites containing cellulose reinforcements. J. Therm. Anal. Calorim. 2010, 102, 975–982. [Google Scholar] [CrossRef]
  46. Jhu, Y.-S.; Hung, K.-C.; Xu, J.-W.; Wu, J.-H. Effects of acetylation on the thermal decomposition kinetics of makino bamboo fibers. Wood Sci. Technol. 2019, 53, 873–887. [Google Scholar] [CrossRef]
  47. Ouajai, S.; Shanks, R. Composition, structure and thermal degradation of hemp cellulose after chemical treatments. Polym. Degrad. Stab. 2005, 89, 327–335. [Google Scholar] [CrossRef]
Figure 1. Thermal decomposition process of raw materials at a heating rate of 20 °C /min. BF, basalt fiber; WF, wood flour; HDPE, high density polyethylene.
Polymers 12 02283 g001
Figure 2. Thermal decomposition process of wood–plastic composites (WPCs) (a) and WPCs reinforced with BFs (b) at a heating rate of 20 °C/min.
Polymers 12 02283 g002
Figure 3. Determination of T0 and TP with B3 as an example.
Polymers 12 02283 g003
Figure 4. Iso-conversion plots of the iso-conversion plots of the Flynn-Wall-Ozawa (F-W-O) method for waste HDPE (a); A2 (c), the modified Coats-Redfern (C-R) method for waste HDPE (b); A2 (d).
Polymers 12 02283 g004
Figure 5. Iso-conversion plots of F-W-O method for B3 (a); example iso-conversion plots of the modified C-R method for B3 (b).
Polymers 12 02283 g005
Figure 6. Effects of conversion rate on activation energy changes of raw materials (a), WPCs (b), and WPCs reinforced with BFs (c).
Polymers 12 02283 g006
Table 1. Blending ratios of the composite materials (mass fraction). BF, basalt fiber; WF, wood flour; HDPE, high density polyethylene.
SamplesBF/WFBF(%)WF(%)Coupling(%)HDPE(%)
A0 (HDPE)---2100
A1--5295
A2--10290
A3--15285
A4--20280
B11:23.36.7290
B21:155290
B32:16.73.3290
Table 2. Kinetic methods for activation energy assessment in the research [31].
MethodExpressionPlots
Flynn-Wall-Ozawa lg β = lg A E a R f a 2.315 0.4567 E a R T lg β vs. 1 T
Coats-Redfern (modified) ln β T 2 1 2 R T E a = ln A R 1 2 R T E a β E a E a R T ln β T 2 vs. 1 T
Friedman ln d α d t = ln A f α E a R T ln d α d t vs. 1 T
Kissinger ln β T P 2 = ln A R E a + 1 T P E a R ln β T P 2 vs. 1 T P
Table 3. Thermal decomposition parameters of raw materials.
Materialsβ a (°C/min)T0 (°C)WL0 (%)TP (°C)WLP (%)Residue (%)
BF5----96.7
10----96.8
15----97.7
20----97.1
WF567.55342.057.010.9
1076.55353.255.813.7
1587.45358.051.514.7
20103.85357.446.215.5
HDPE5230.4 5447.569.24.3
10253.45463.166.15.7
15184.2 5469.367.61.8
20262.3 5469.662.23.9
a Capital: β = heating rate, T = temperature, W = weight loss, Residue = mean value of residual mass at different heating rates; subscript: o = onset, p = DTG peak.
Table 4. Thermal decomposition parameters of the composite materials.
Samplesβ (°C/min)T0 (°C)WL0TP (°C)WLPResidue (%)
A15224.75442.470.88.5
10285.55464.760.816.7
15190.75469.166.48.7
20271.85474.763.213.1
A25207.95449.364.315.4
10230.25463.464.310.7
15168.75469.167.47.5
20264.95474.764.211.7
A35203.75447.567.35.8
10165.15449.073.31.8
15190.75469.166.48.7
20254.95474.762.814.8
A45231.35449.765.313.1
10246.55462.267.47.7
15166.05469.165.911.7
20236.65472.962.816.4
B15236.15448.762.417.1
10230.2 5463.3 64.310.7
15257.9 5470.6 63.410.6
20258.0 5472.6 59.311.1
B25148.65440.4 67.510.6
10227.6 5453.5 68.37.7
15198.45469.9 63.712.5
20265.8 5474.5 61.515.5
B35219.7 5448.4 65.19.2
10251.8 5462.6 61.113.7
15198.3 5469.6 63.812.3
20264.1 5474.9 60.616.3
Table 5. Pyrolysis parameters (β → 0).
SamplesT0 a β 0 (℃)WL0(%)TP β 0 (℃)WLP(%)Residue b (%)
BF- - -
WF53.95340.052.3(4.6)b10.0
HDPE226.05444.366.3(3.0)5.2
A1231.65437.465.3(4.3)10.3
A2190.65443.665.0(1.5)14.9
A3158.85434.767.4(4.4)0.8
A4236.25444.365.3(1.9)8.7
B1222.25444.162.4(2.2)16.9
B2129.55429.8 65.2(3.2)6.7
B3213.6 5442.3 62.7(2.1)7.9
a T0 = initial decomposition temperature when β→0, TP = maximum decomposition temperature when β → 0 “;„ b Values from materials with mean value and standard deviation“.
Table 6. Coats-Redfern (C-R) and Flynn-Wall-Ozawa (F-W-O) assessments of the apparent activation energy of the materials.
Coats-RedfernFlynn-Wall-OzawaFriedmanKissinger
Ea(kJ·mol−1)R2Ea(kJ·mol−1)R2Ea(kJ·mol−1)R2Ea(kJ·mol−1)R2
BF--------
WF182.7 (24.2)0.98 (0.03)183.3 (23.4)0.99 (0.04)15.8 (41.0)0.26 (0.32)241.10.91
HDPE178.9 (31.5)0.91 (0.09)181.0 (30.7)0.95 (0.05)3.0 (20.9)0.10 (0.10)239.00.93
A1115.8 (34.3)0.74 (0.27)120.8 (32.7)0.76 (0.25)28.8 (25.6)0.71 (0.45)171.70.95
A2143.8 (51.3)0.96 (0.02)147.4 (49.6)0.97 (0.02)14.8 (49.1)0.81 (0.19)234.10.99
A3146.3 (55.3)0.71 (0.23)149.7 (52.3)0.90 (0.15)38.0 (53.1)0.45 (0.26)162.50.79
A4171.3 (92.4)0.61 (0.36)173.4 (88.6)0.62 (0.35)37.7 (43.7)0.21 (0.15)250.51.00
B1145.5 (45.4)0.97 (0.03)149.0 (43.9)0.99 (0.01)4.8 (31.5)0.66 (0.22)233.20.97
B2156.2 (37.9)0.95 (0.02)159.1 (35.5)0.96 (0.01)10.2 (83.9)0.62 (0.43)156.10.97
B3204.6 (27.9)0.98 (0.01)205.3 (27.0)0.99 (0.01)8.1 (18.8)0.55 (0.45)222.51.00

