Effect of Different Flame-Retardant Bridged DOPO Derivatives on Properties of in Situ Produced Fiber-Forming Polyamide 6
Abstract
1. Introduction
2. Experimental
2.1. Materials
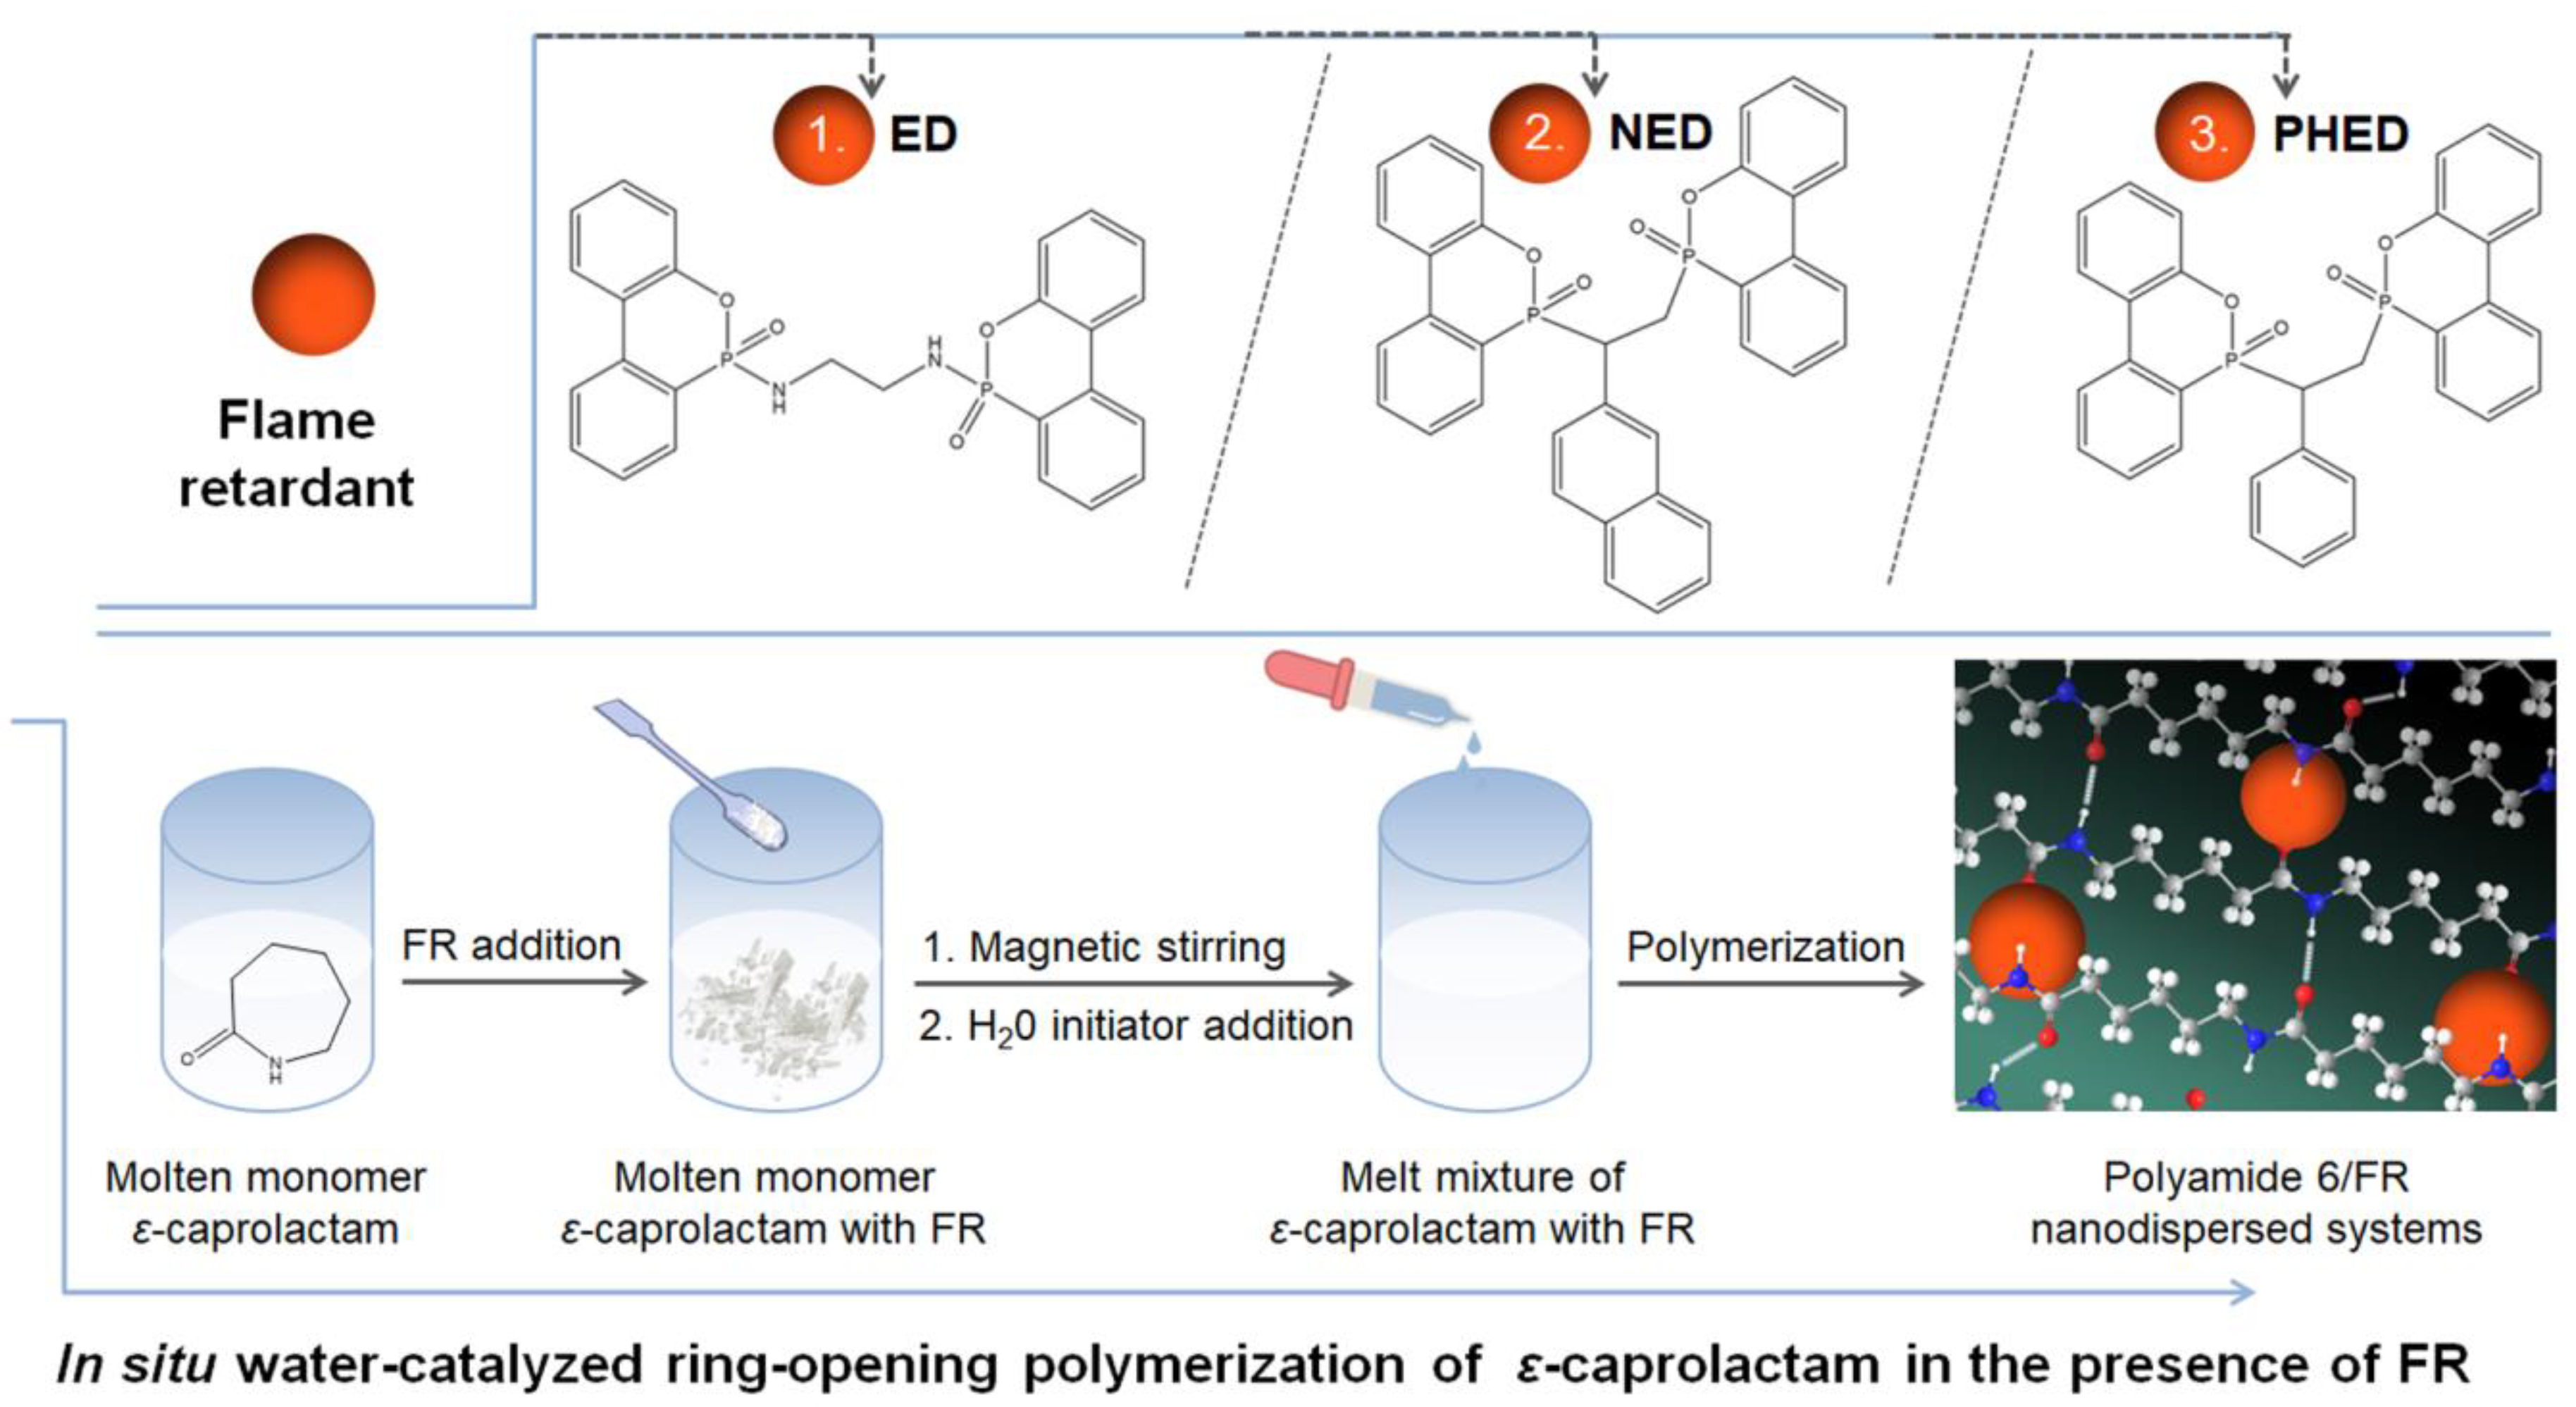
2.2. In Situ Polymerization
2.3. Characterization
3. Results and Discussion
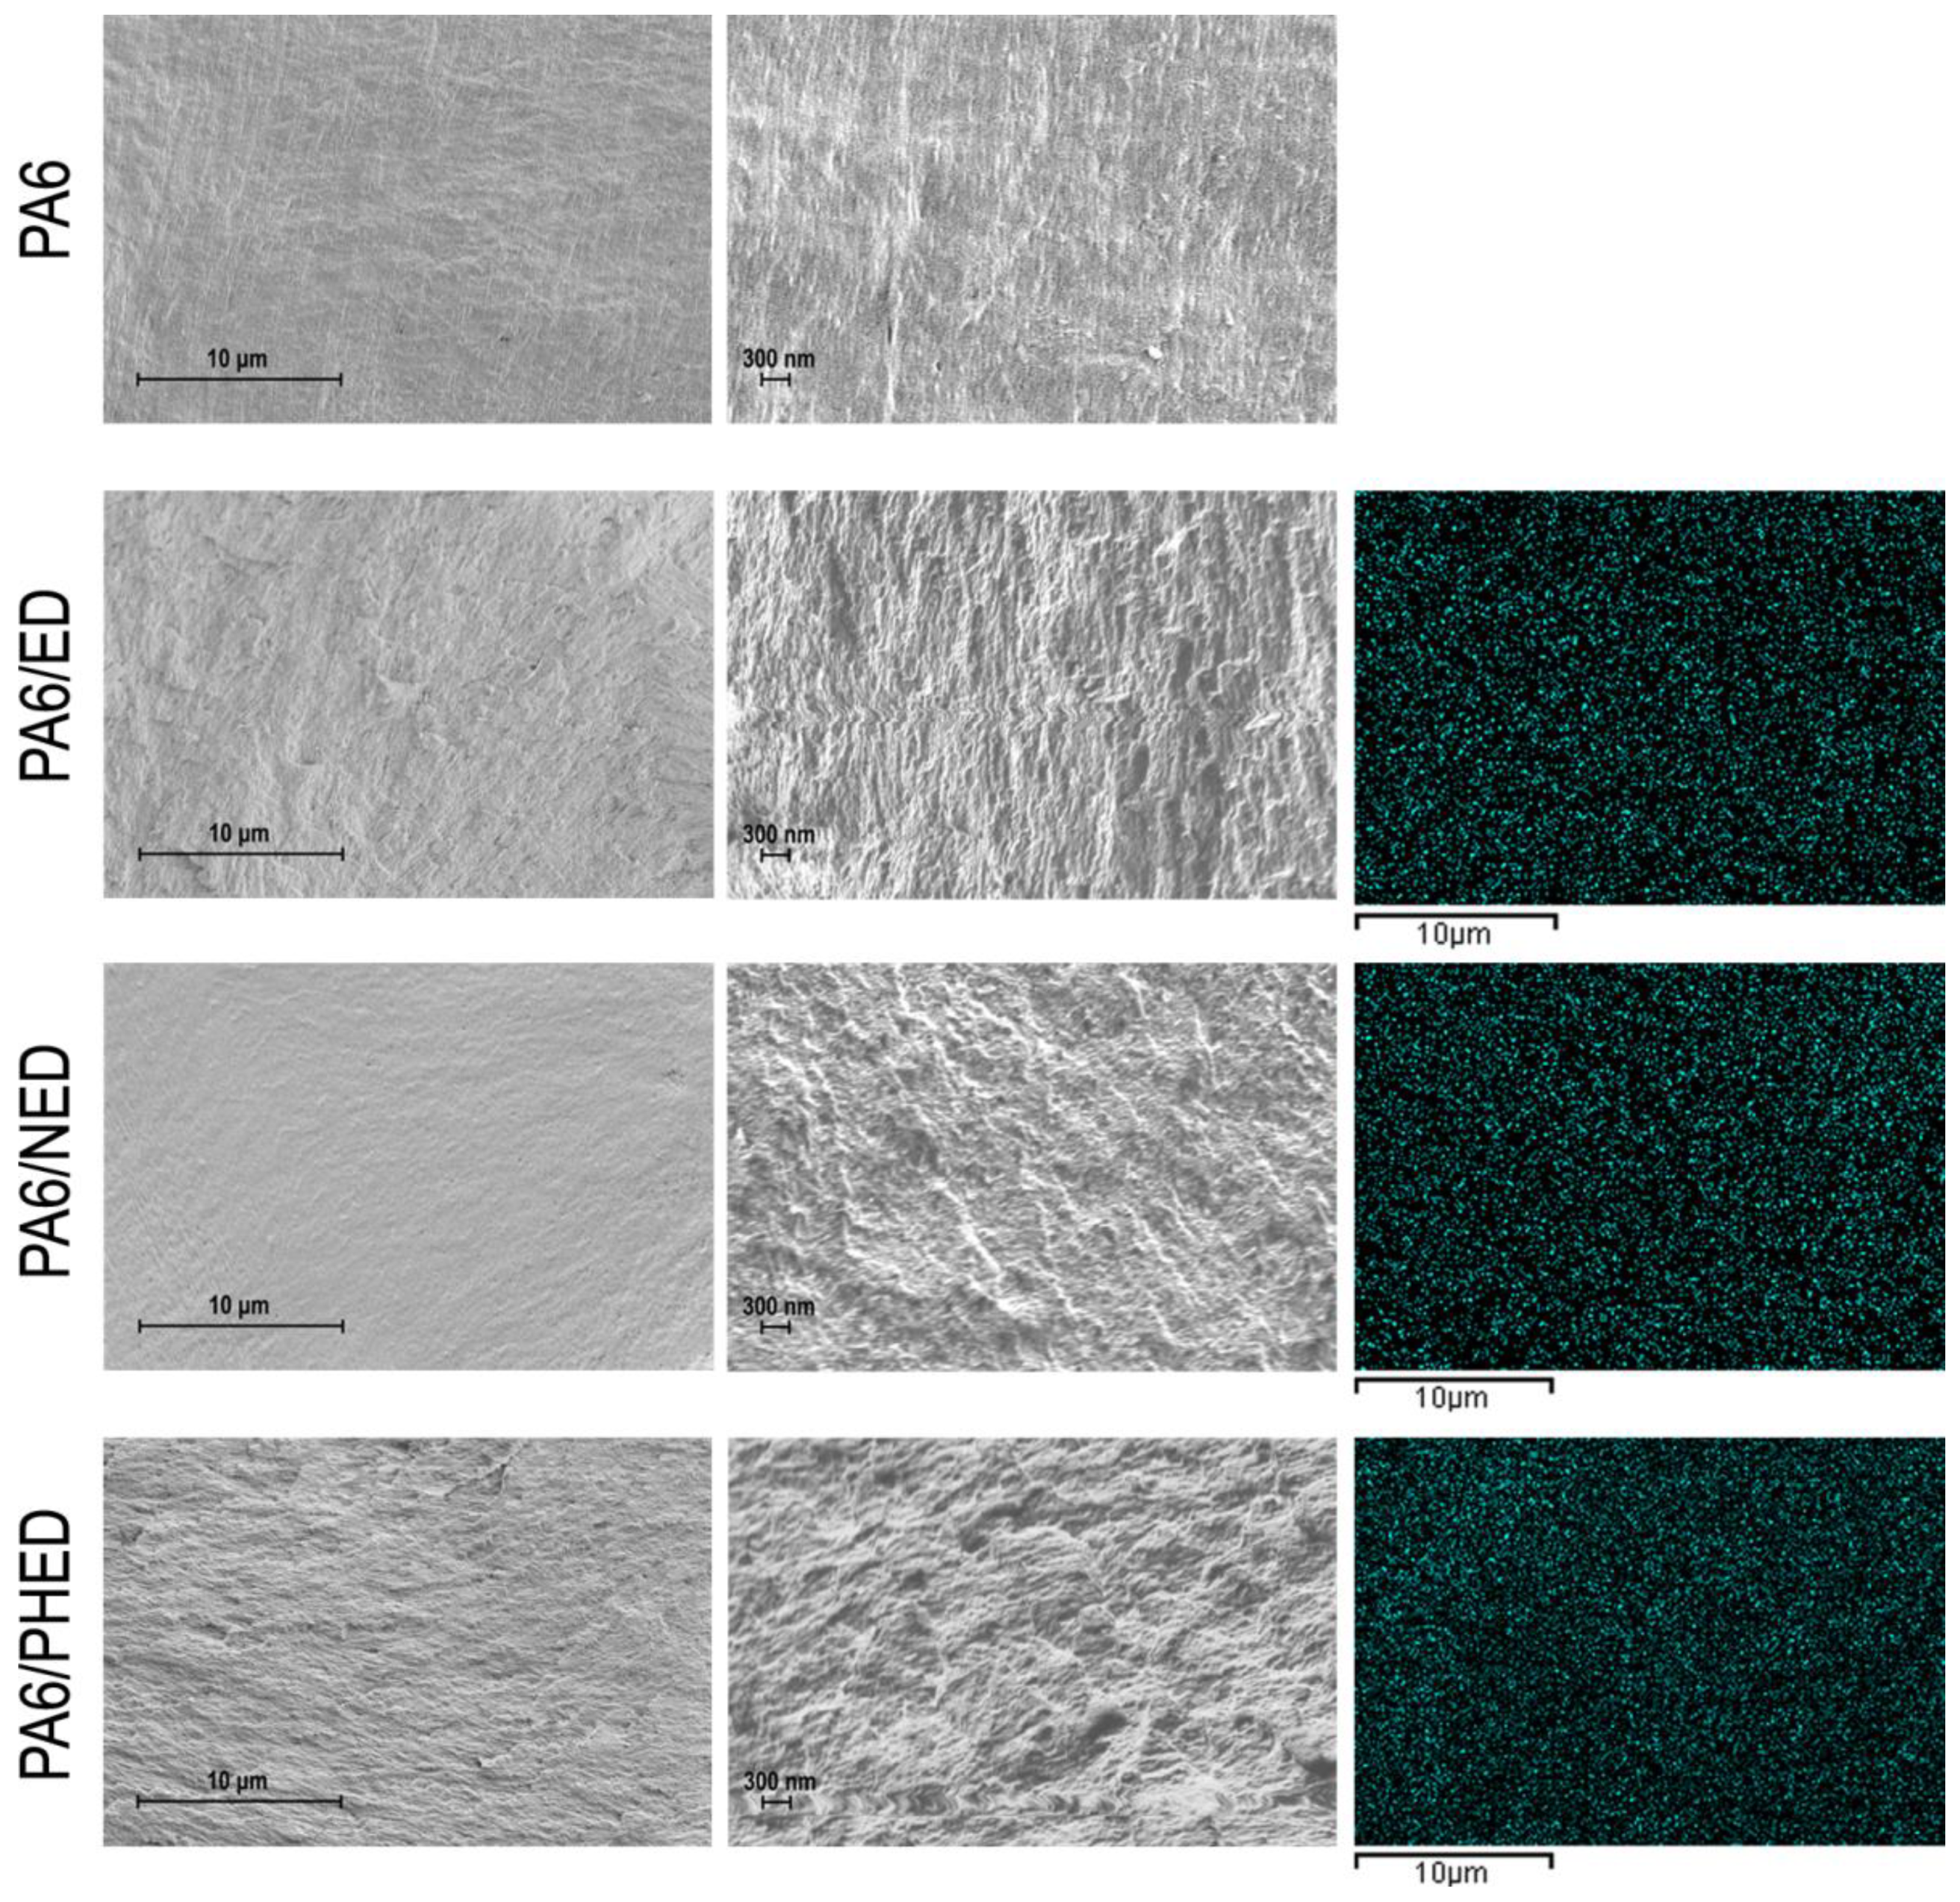
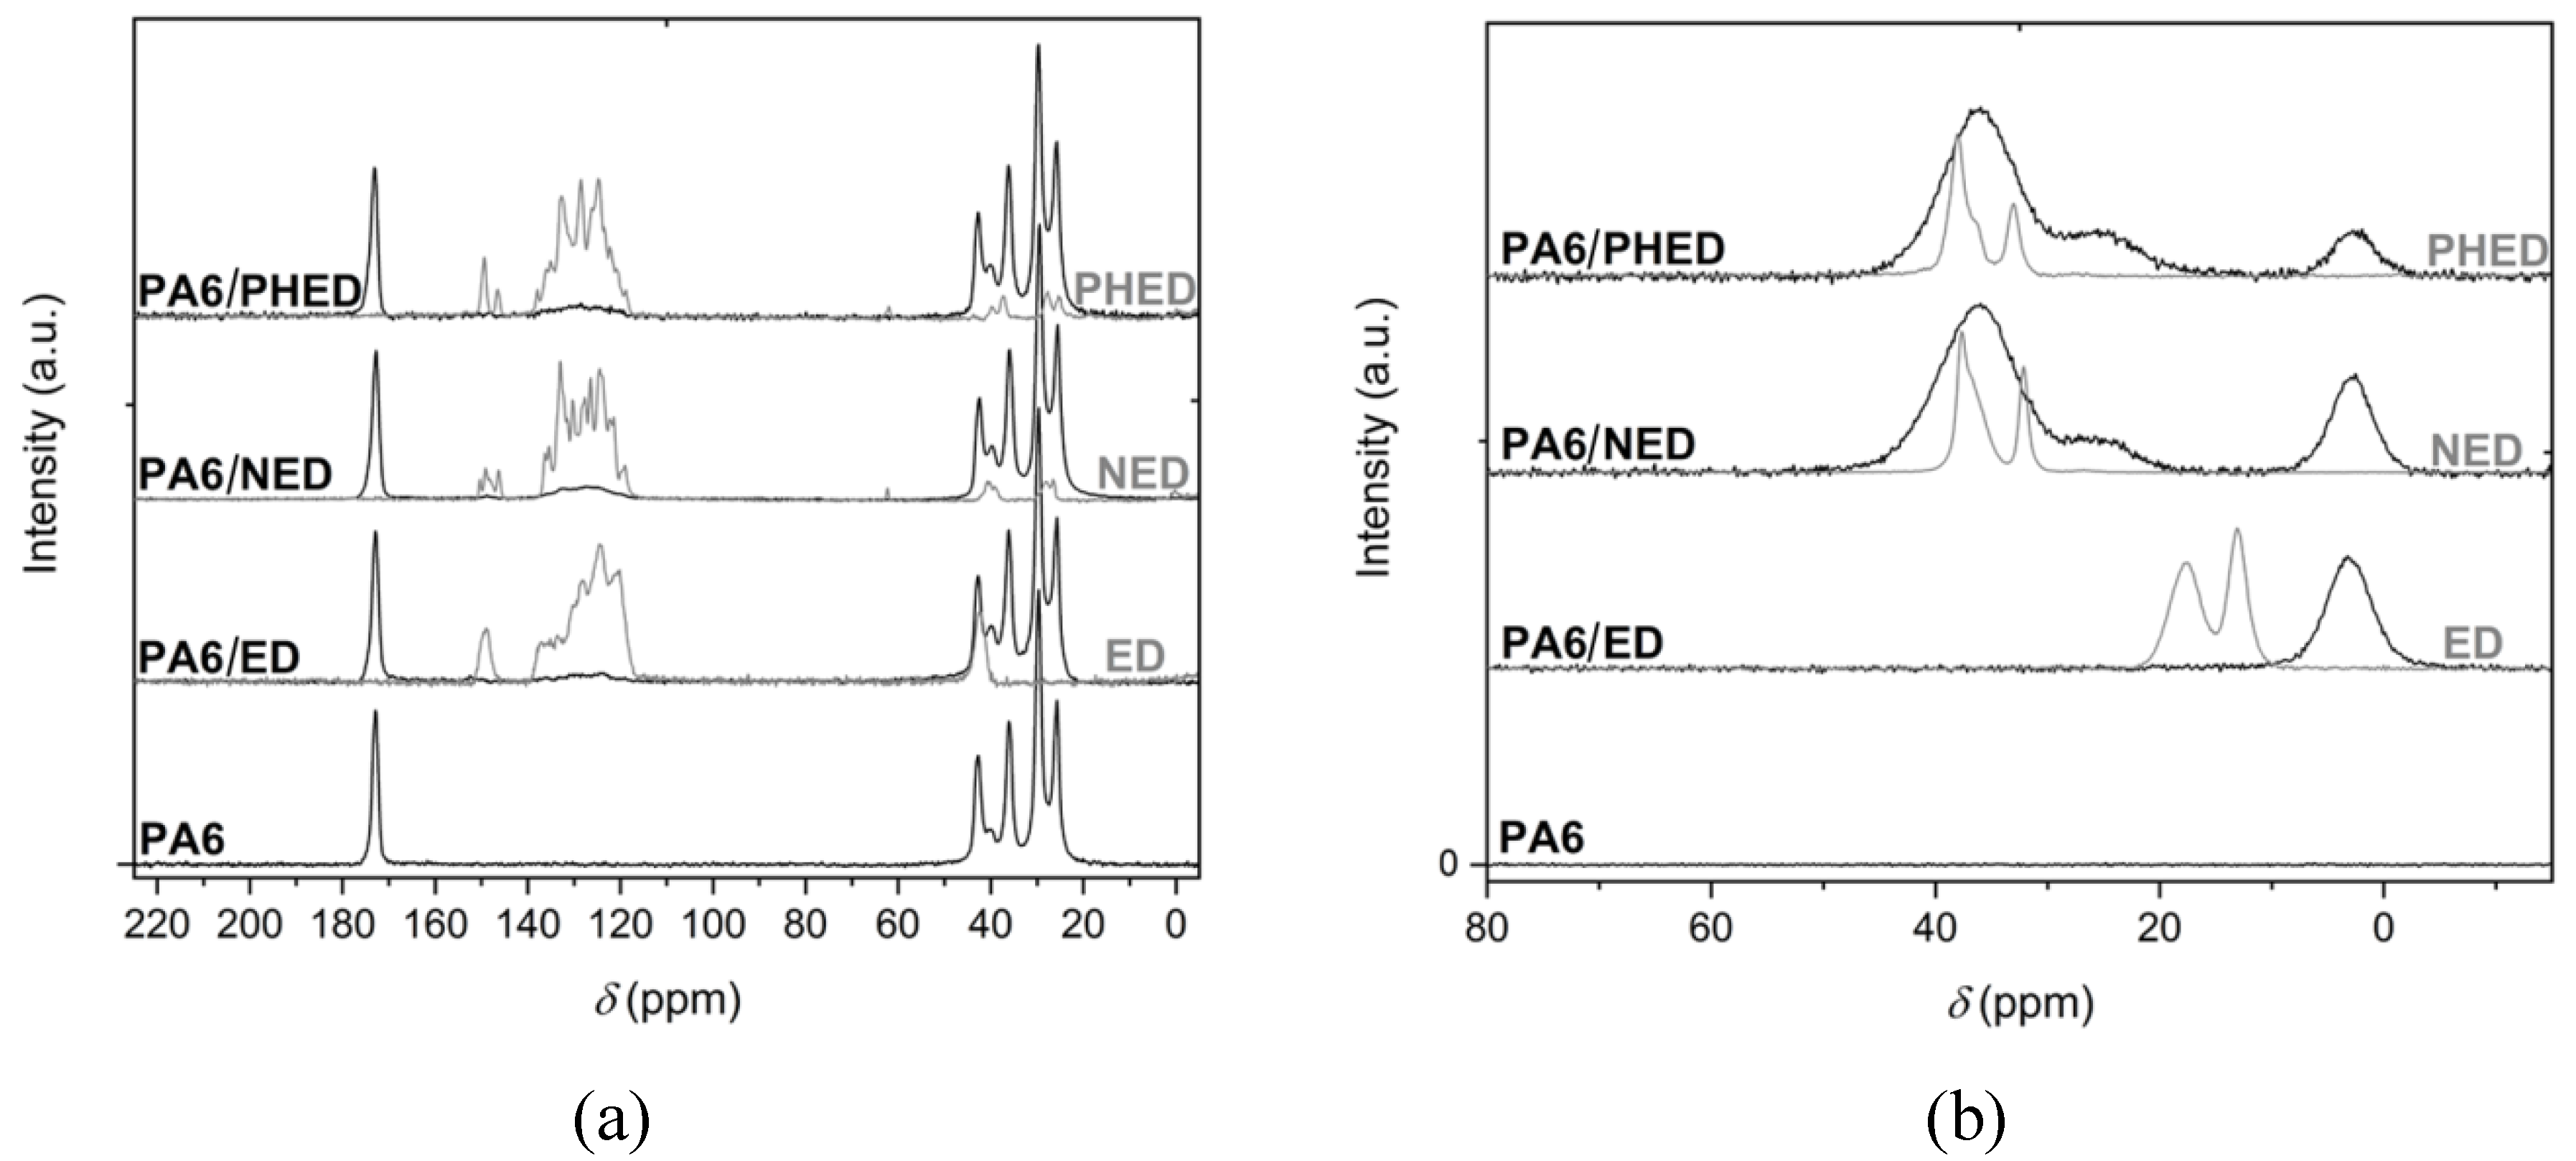
3.1. Structure Characterization
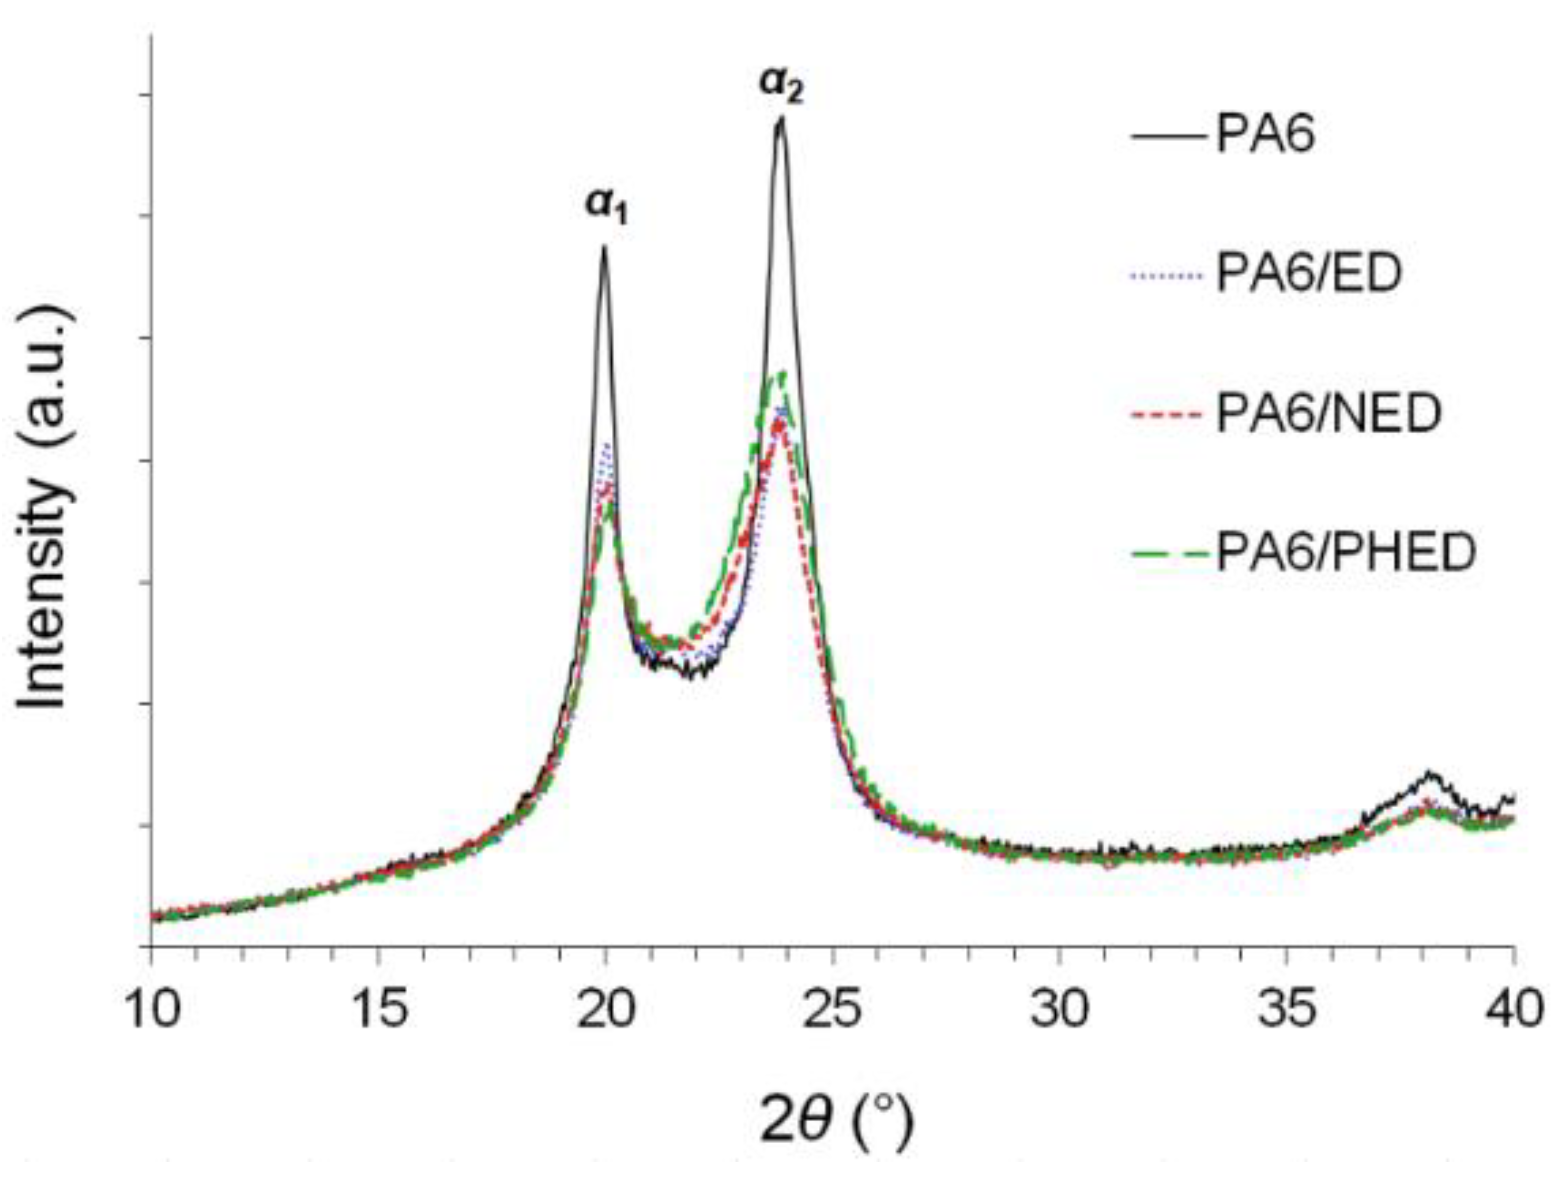
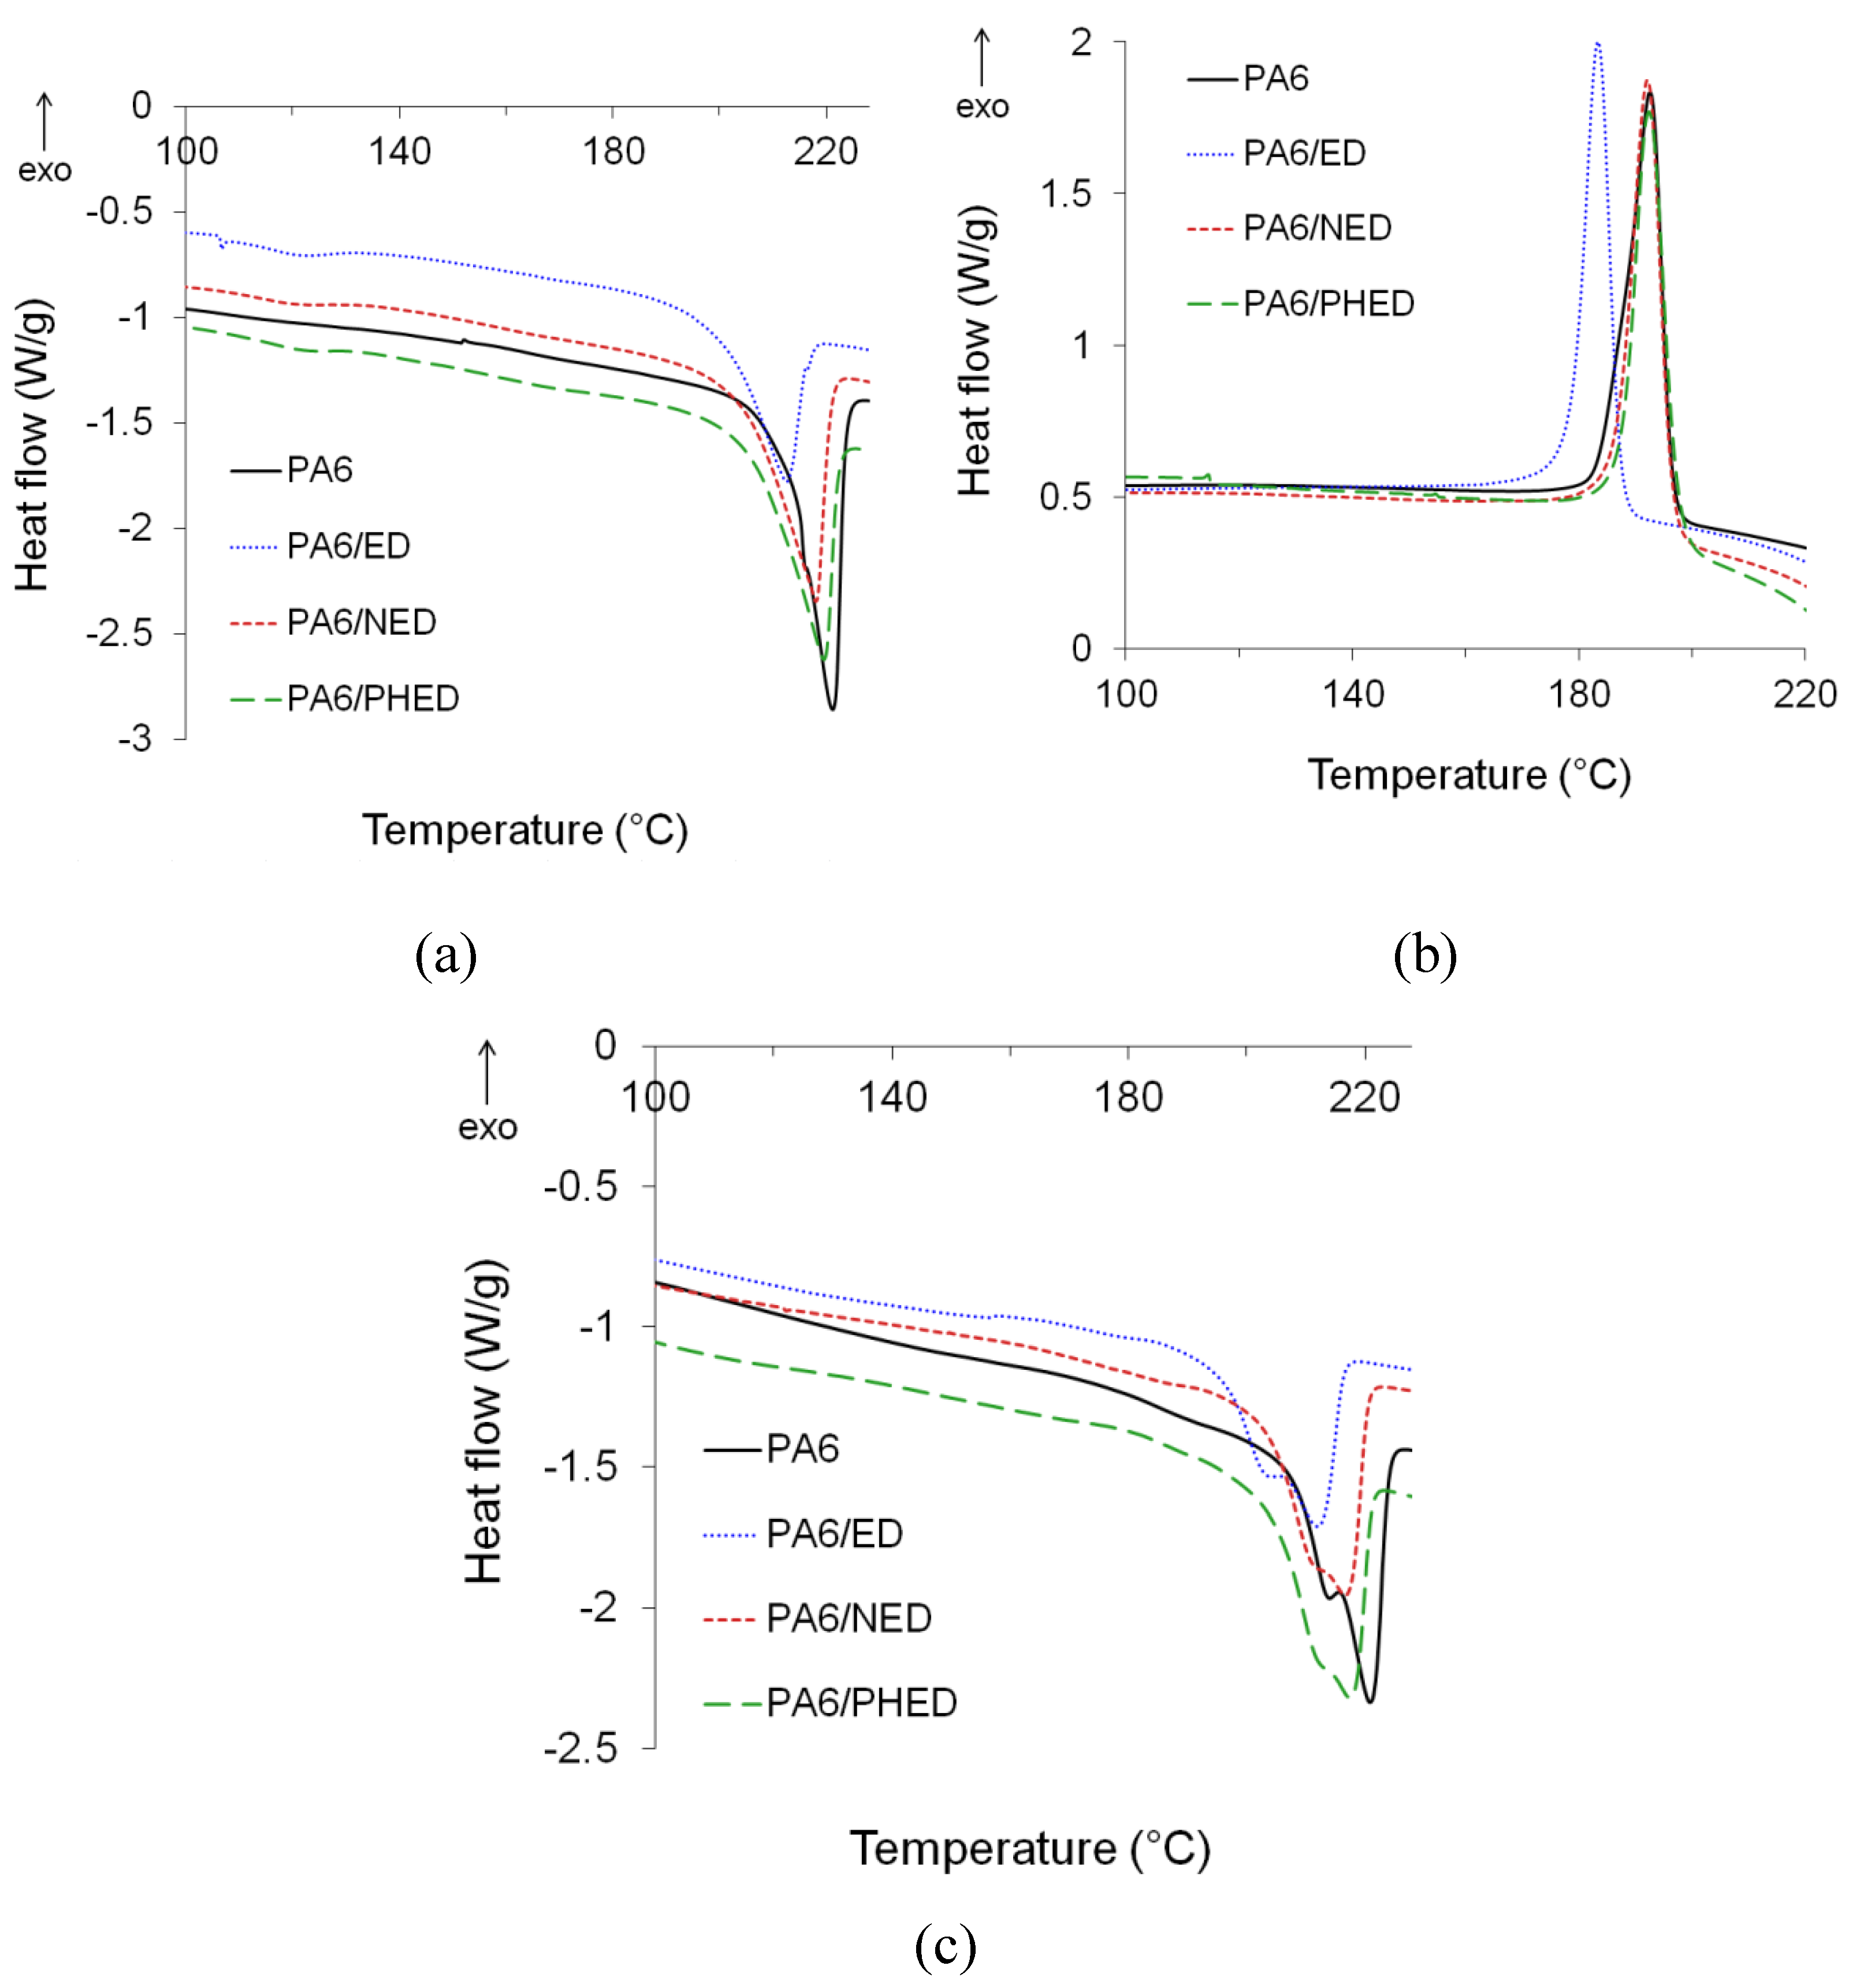
3.2. Melting and Crystallization Behavior
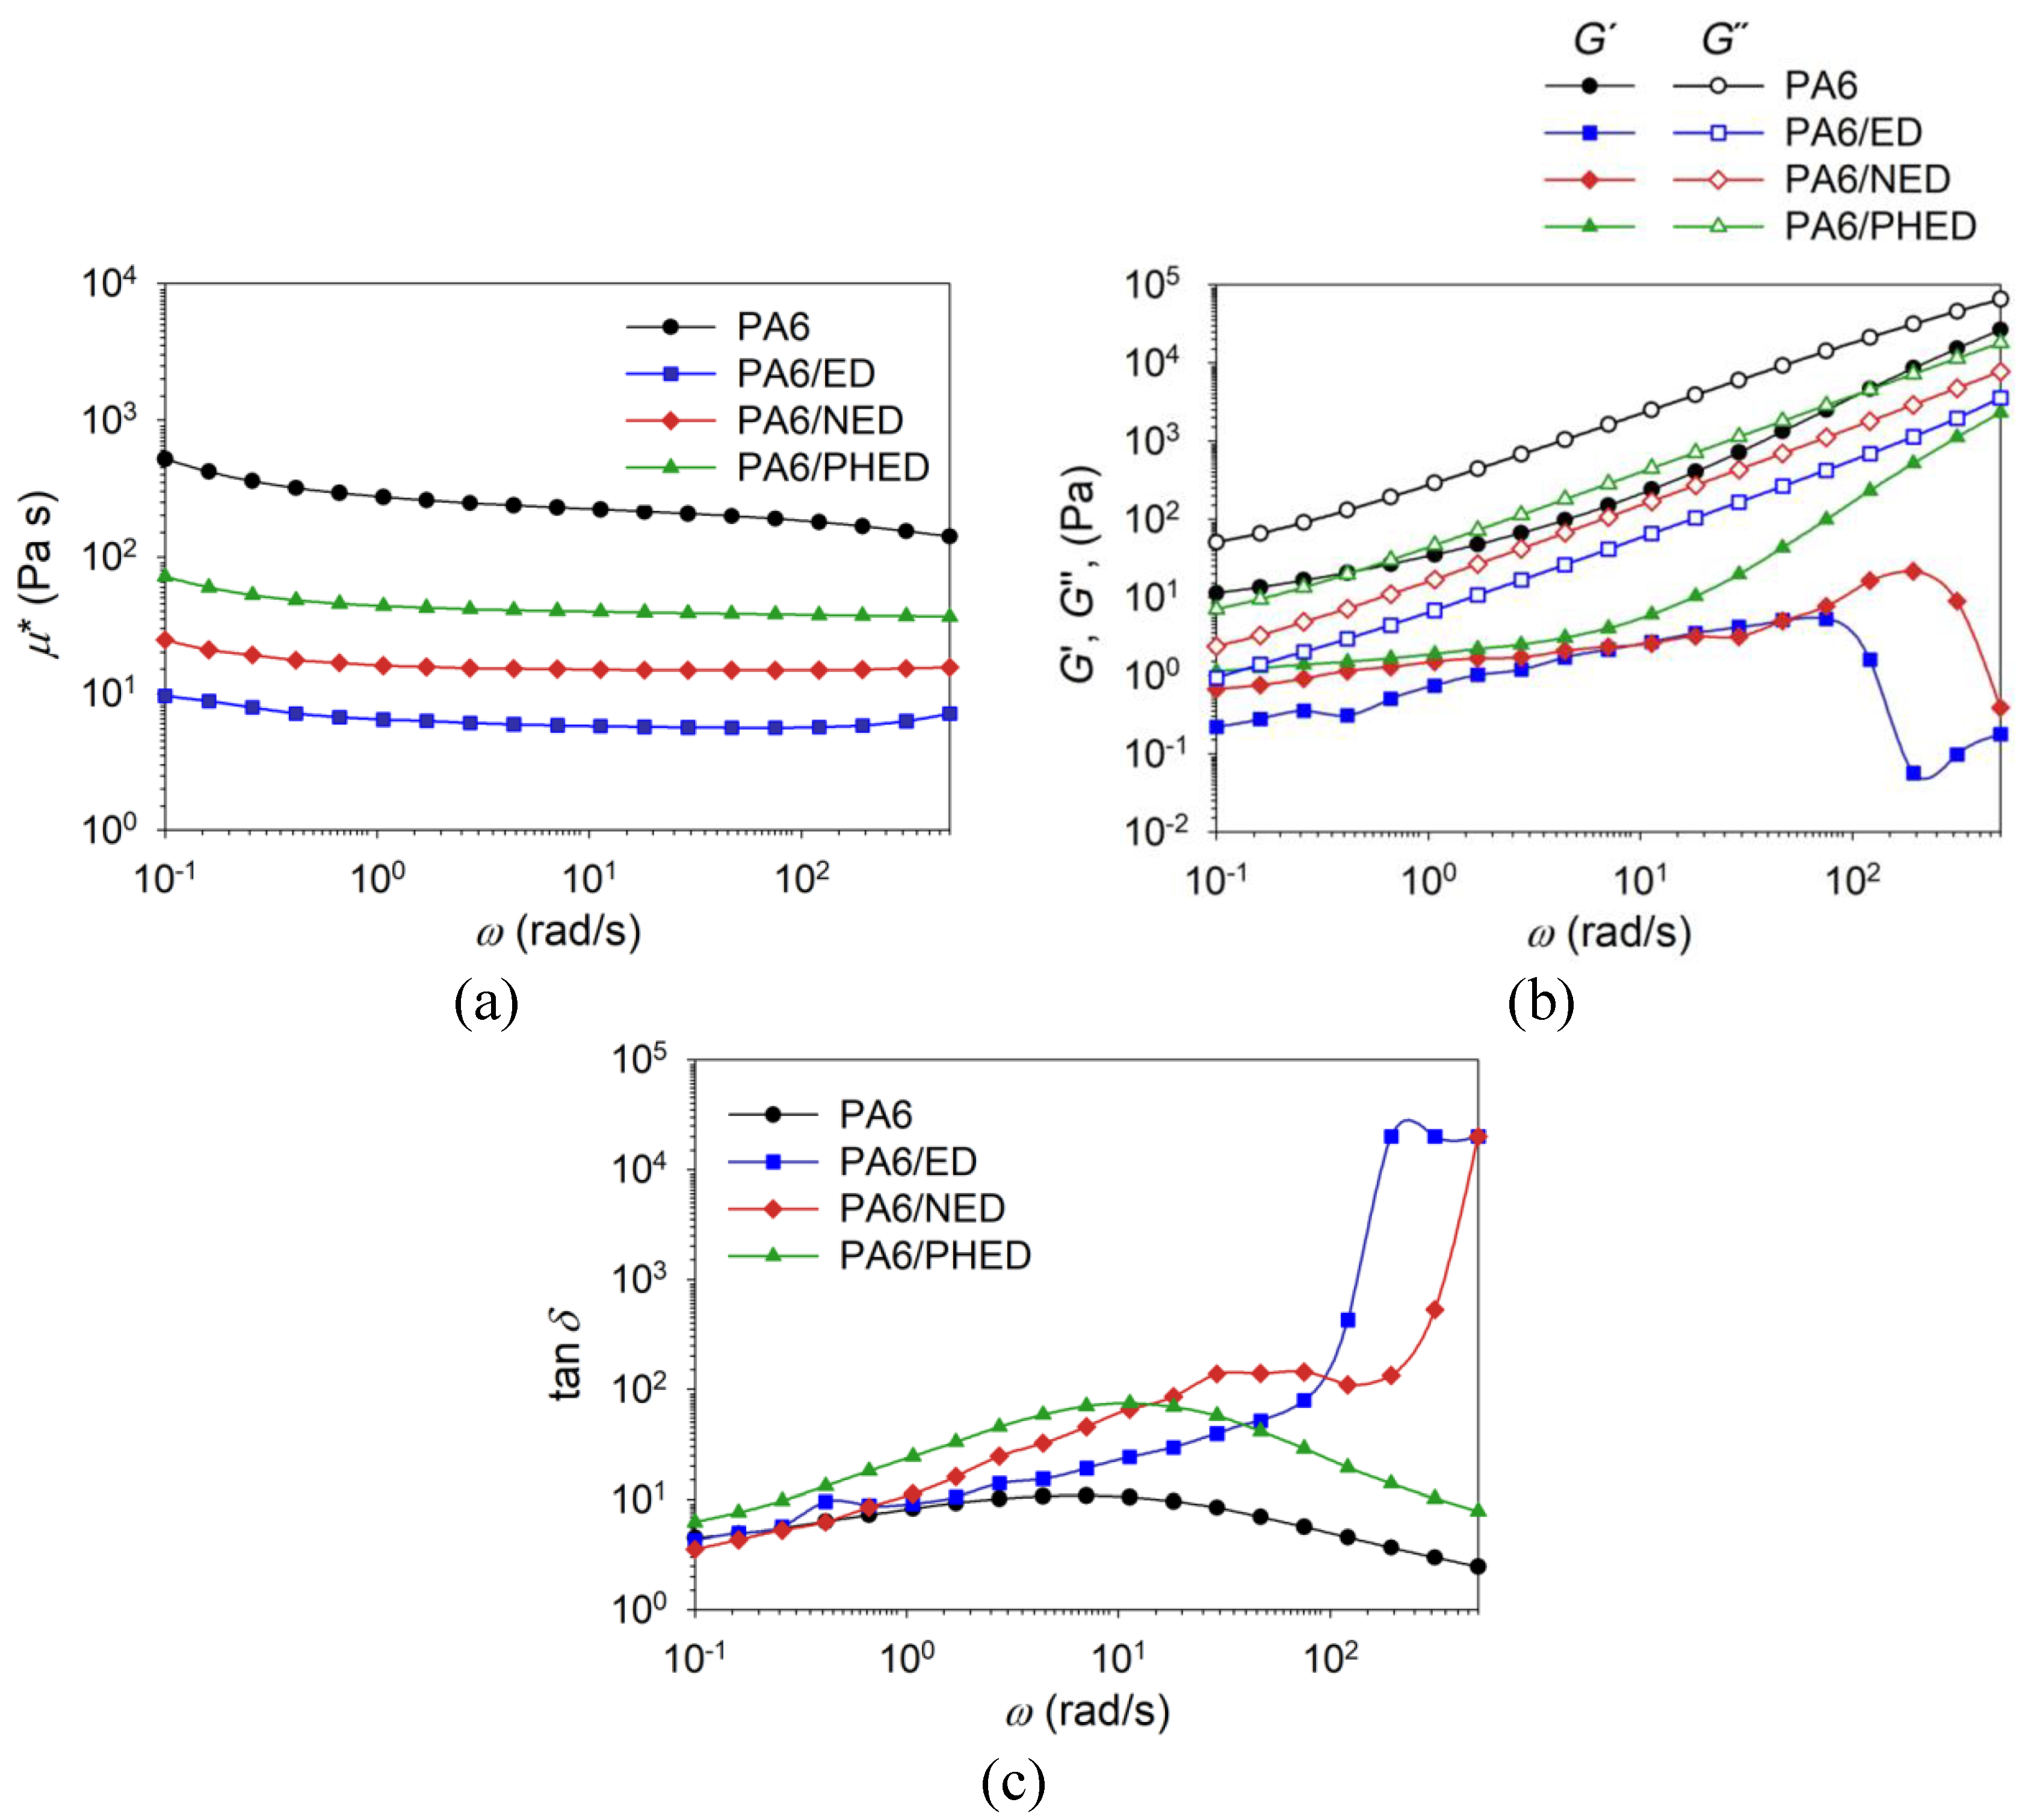
3.3. Melt-Rheology
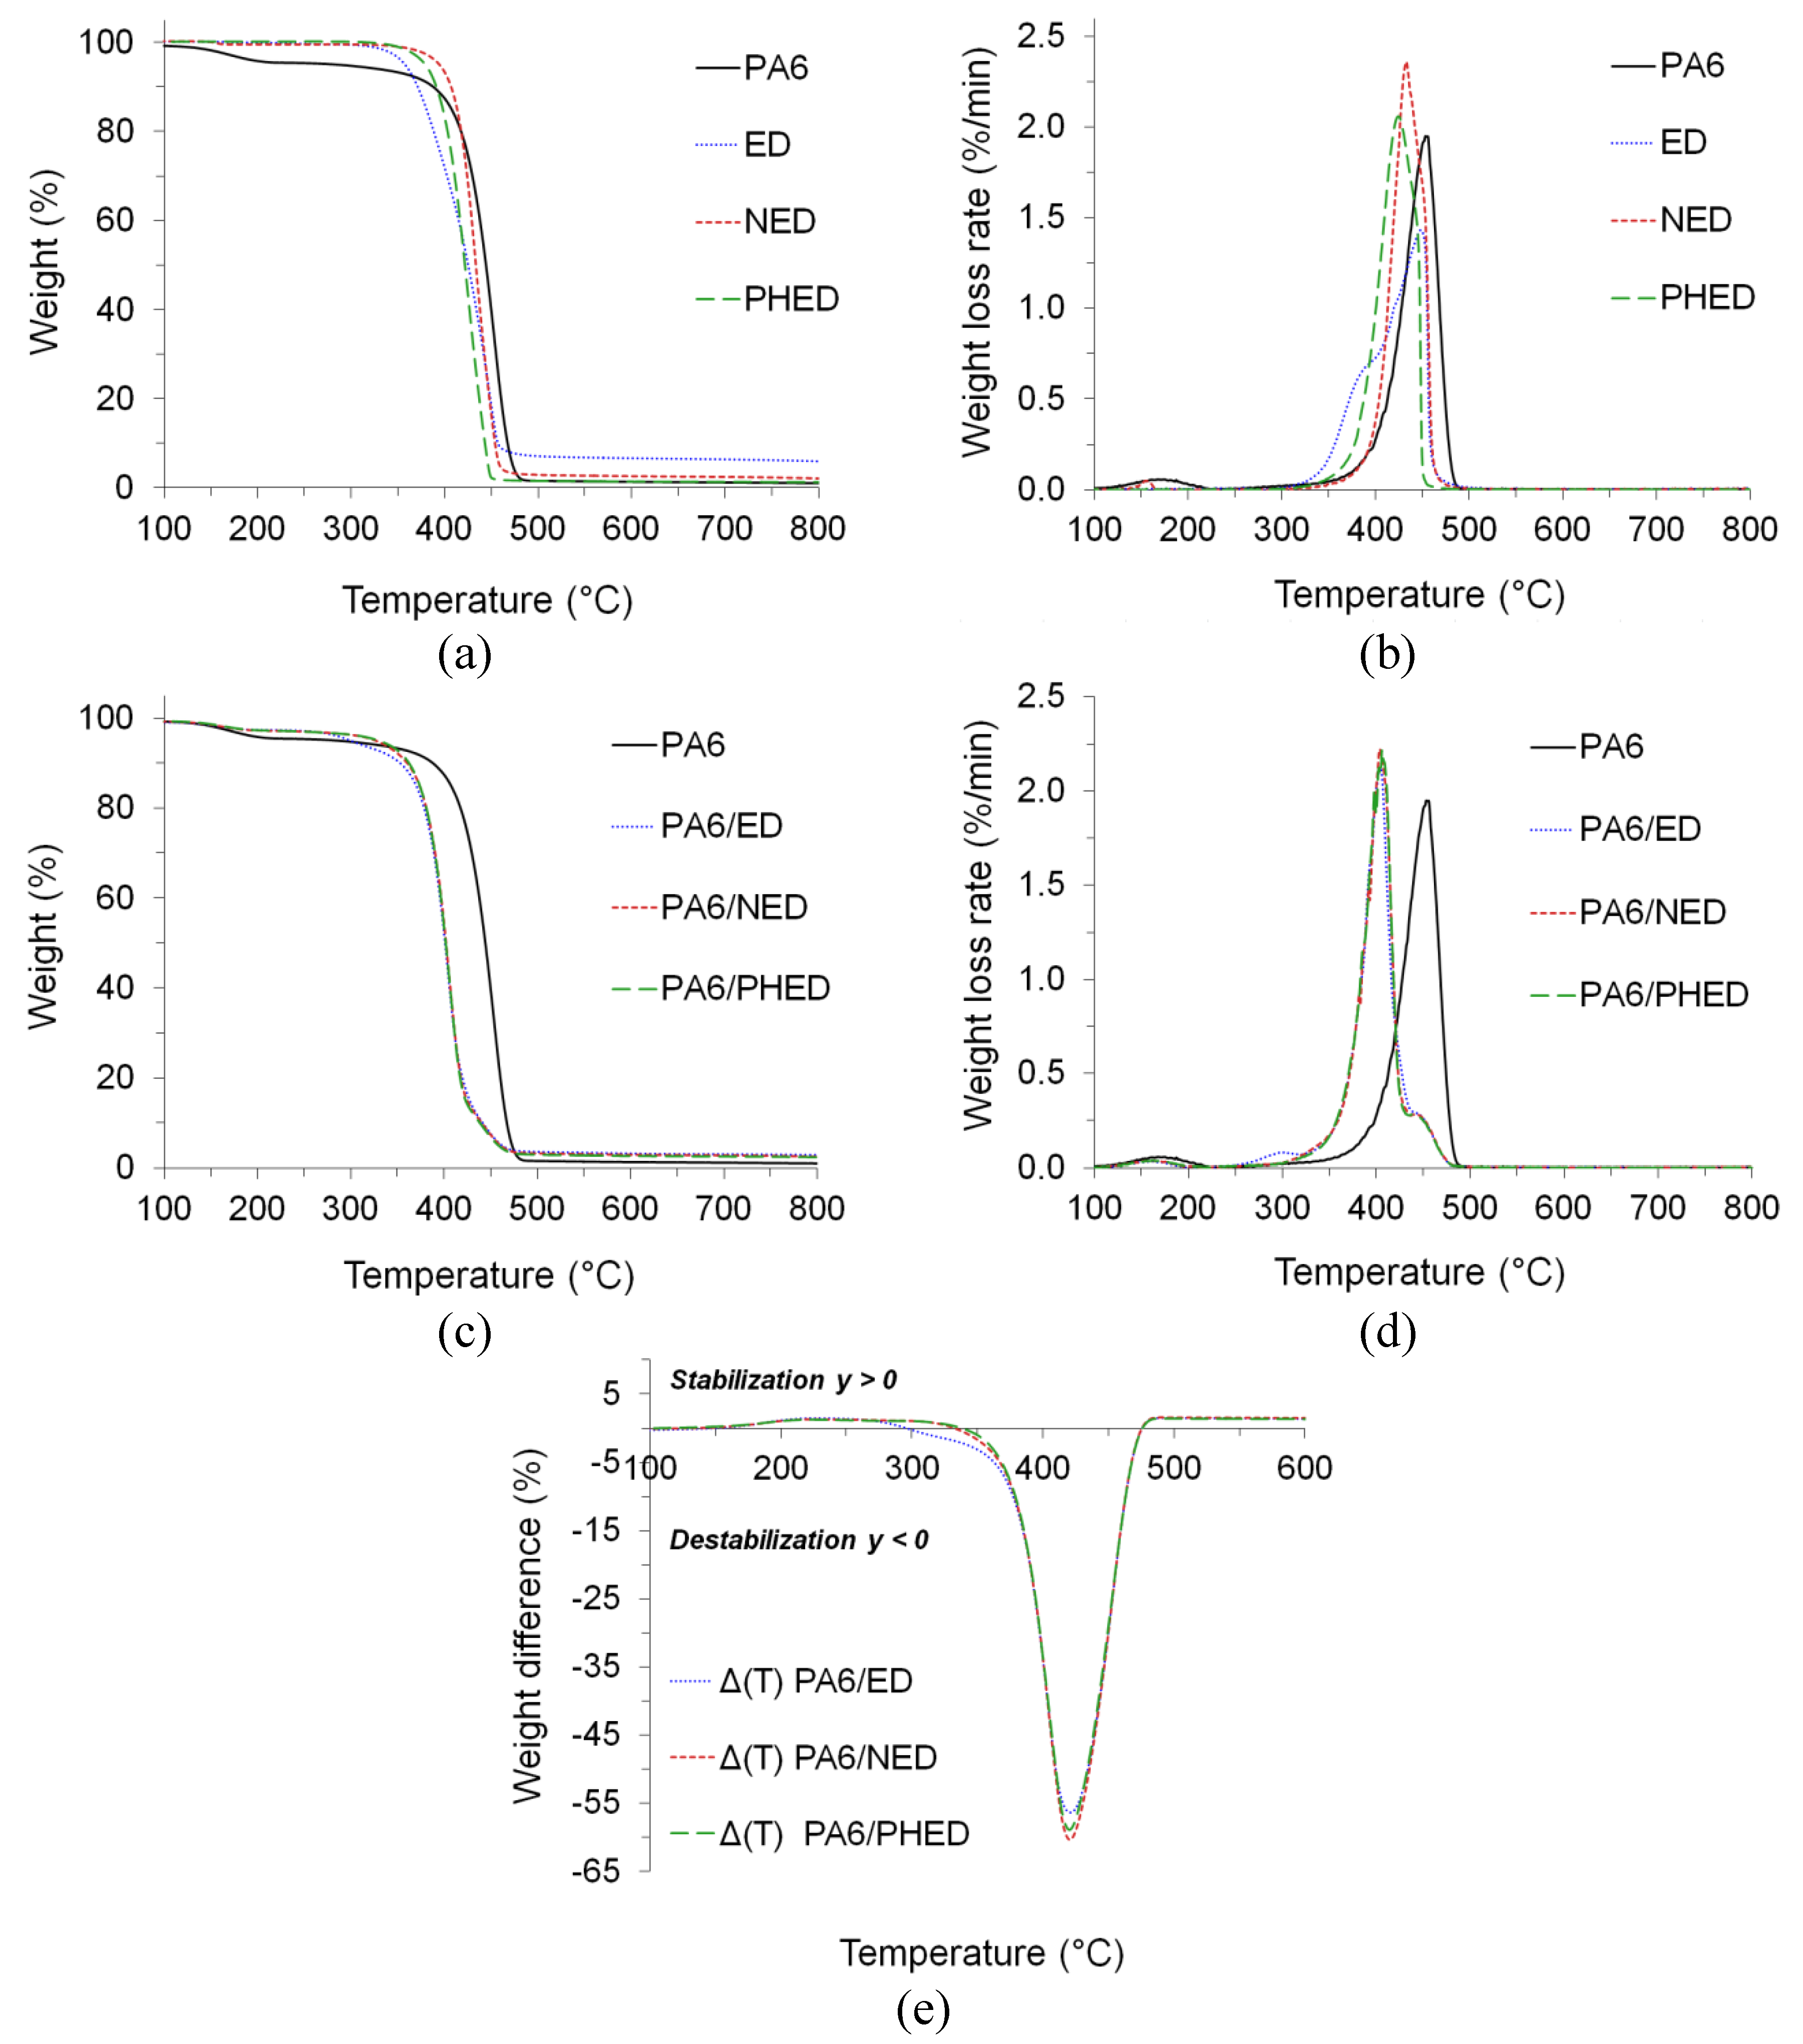
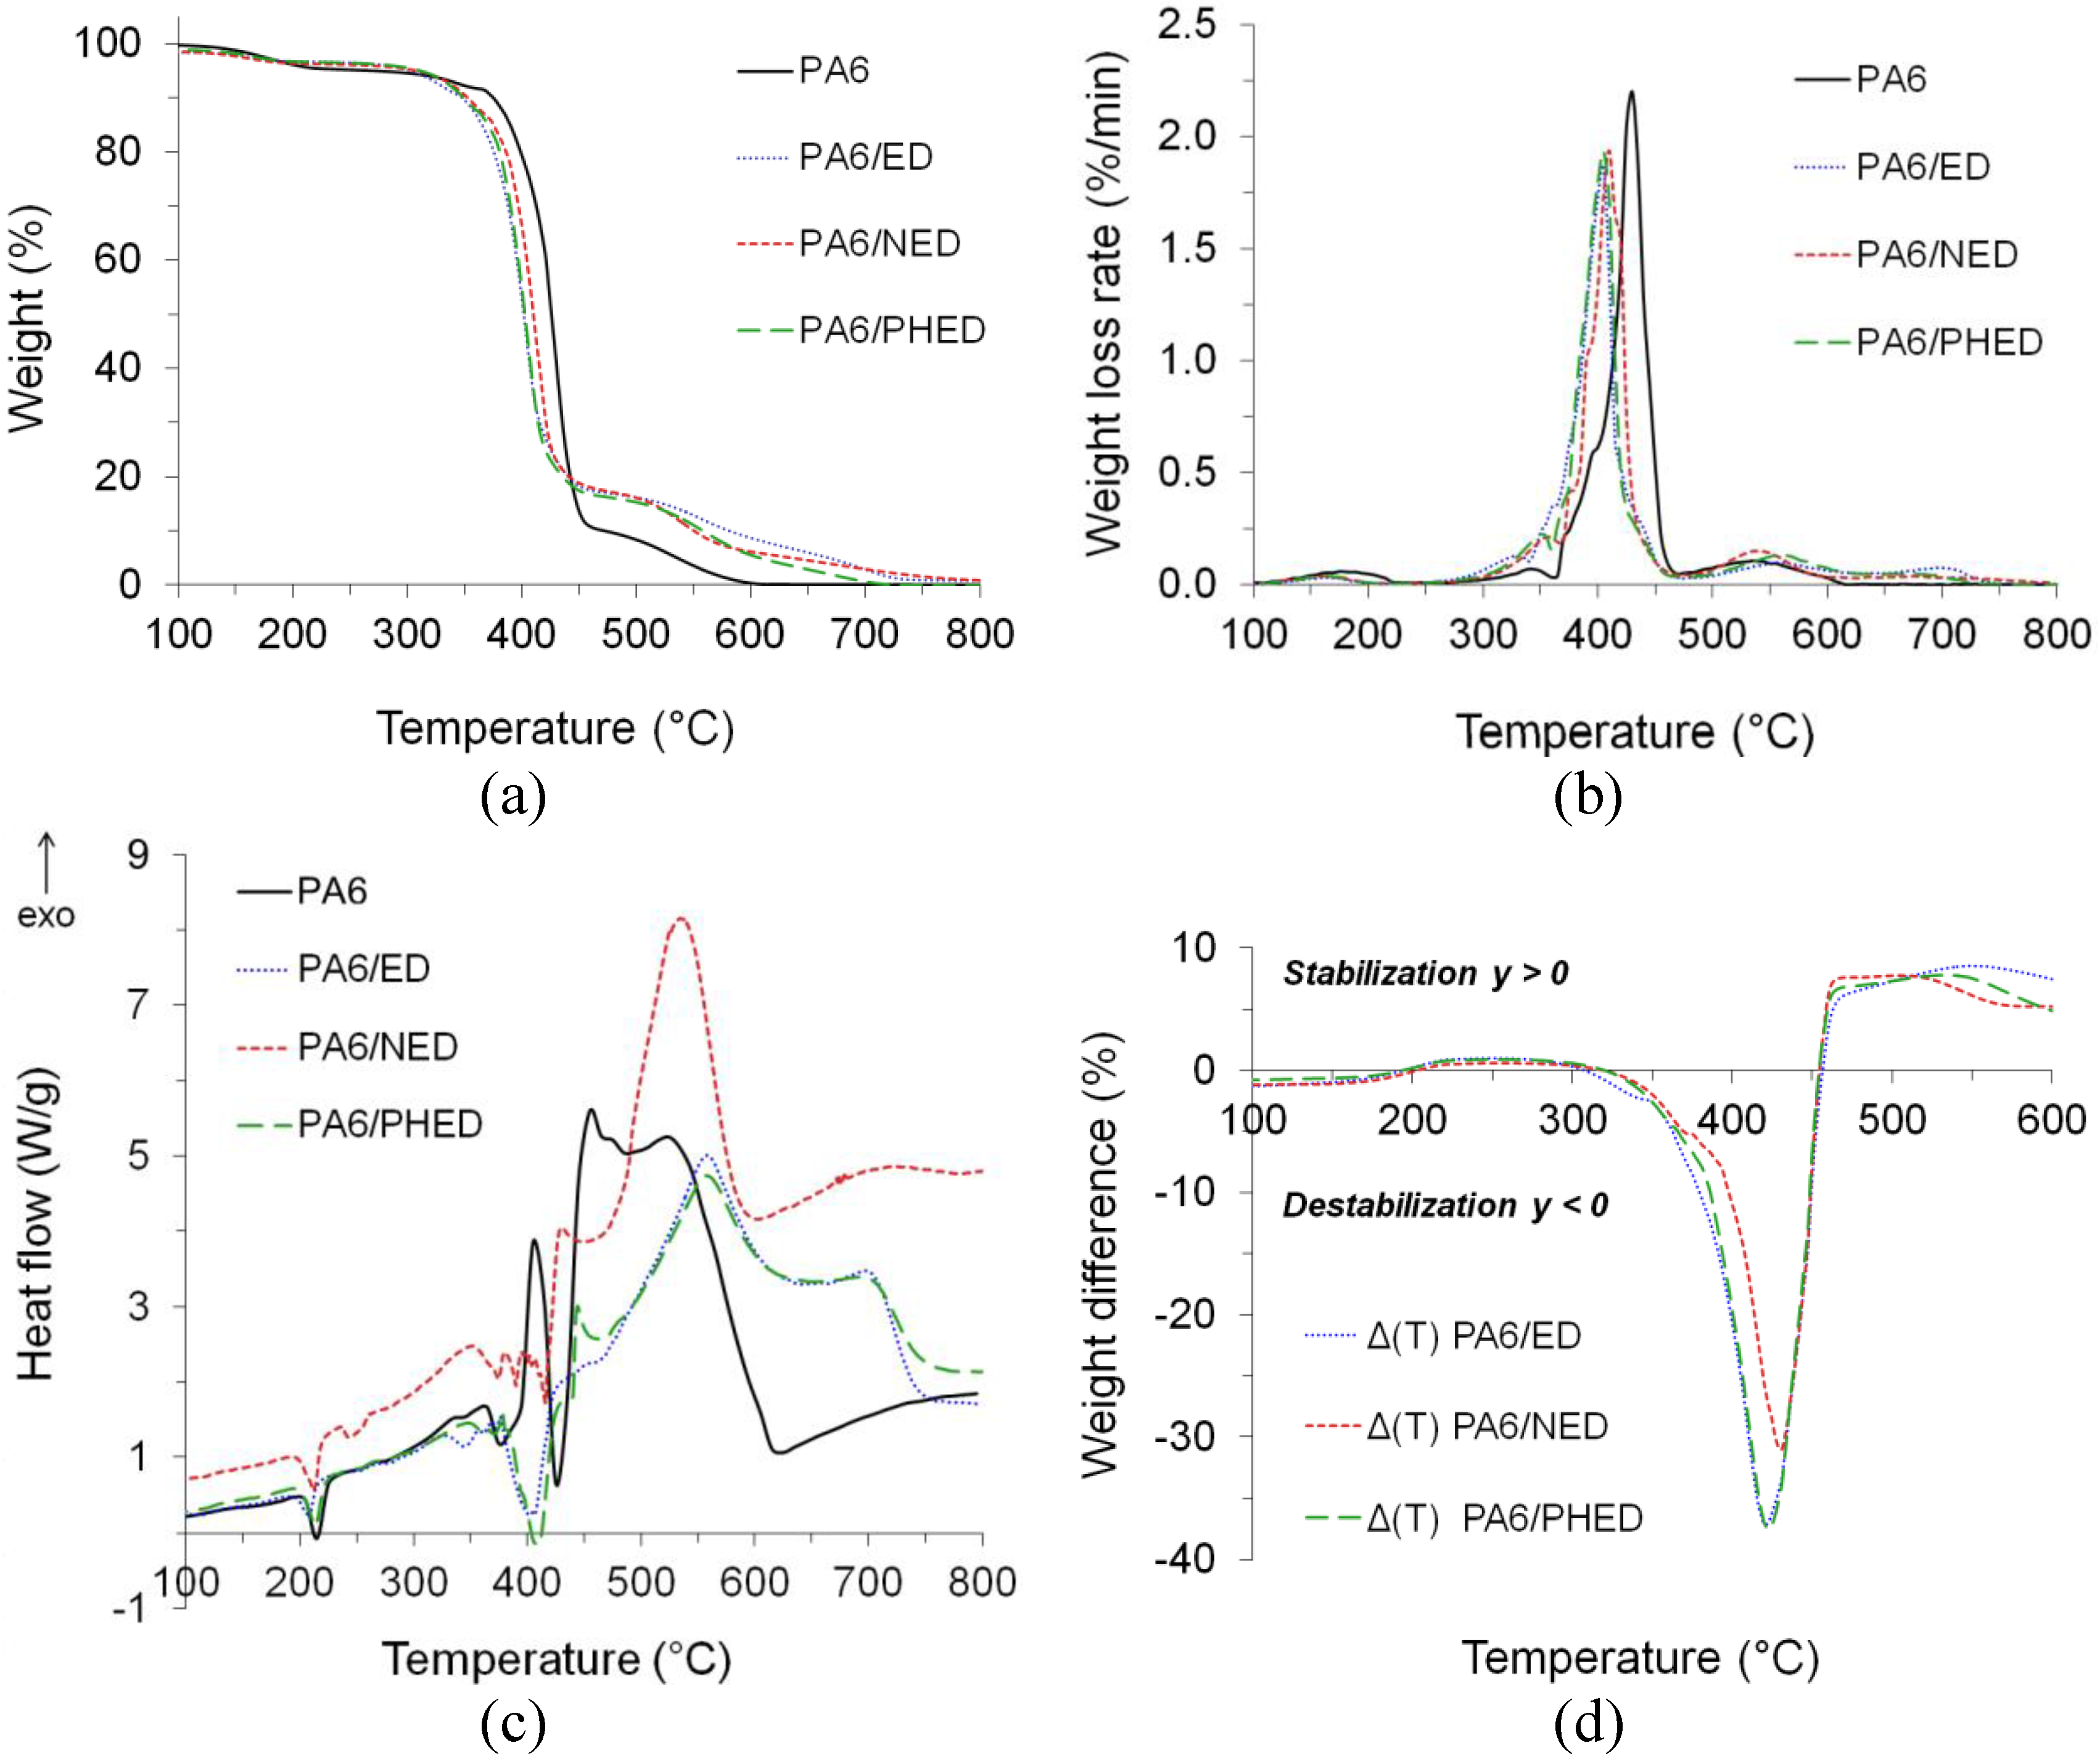
3.4. Thermal Stability
3.5. Vertical Flammability Tests
4. Conclusions
Supplementary Materials
Author Contributions
Funding
Acknowledgments
Conflicts of Interest
References
- Hong, M.; Chen, E.Y.X. Chemically recyclable polymers: A circular economy approach to sustainability. Green Chem. 2017, 19, 3692–3706. [Google Scholar] [CrossRef]
- Šehić, A.; Vasiljević, J.; Demšar, A.; Leskovšek, M.; Bukošek, V.; Medved, J.; Čolović, M.; Jerman, I.; Simončič, B. Polyamide 6 composite fibers with incorporated mixtures of melamine cyanurate, carbon nanotubes, and carbon black. J. Appl. Polym. Sci. 2018, 136, 47007. [Google Scholar] [CrossRef]
- Coquelle, M.; Duquesne, S.; Casetta, M.; Sun, J.; Zhang, S.; Bourbigot, S. Investigation of decomposition pathway of polyamide 6/ammonium sulfamate fibers. Polym. Degrad. Stab. 2014, 106, 150–157. [Google Scholar] [CrossRef]
- Dogan, M.; Bayramli, E. Effect of boron phosphate on the mechanical, thermal and fire retardant properties of polypropylene and polyamide-6 fibers. Fibers Polym. 2013, 14, 1595–1601. [Google Scholar] [CrossRef]
- Horrocks, R.; Sitpalan, A.; Zhou, C.; Kandola, B.K. Flame retardant polyamide fibers: The challenge of minimising flame retardant additive content with added nanoclays. Polymers 2016, 8, 288. [Google Scholar] [CrossRef]
- Weise, B.A.; Wirth, K.G.; Völkel, L.; Morgenstern, M.; Seide, G. Pilot-scale fabrication and analysis of graphene-nanocomposite fibers. Carbon 2019, 144, 351–361. [Google Scholar] [CrossRef]
- Levchik, S.V.; Levchik, G.F.; Camino, G.; Costa, L. Mechanism of action of phosphorus-based flame retardants in nylon 6. II. Ammonium polyphosphate/talc. J. Fire Sci. 1995, 13, 43–58. [Google Scholar] [CrossRef]
- Velencoso, M.M.; Battig, A.; Markwart, J.C.; Schartel, B.; Wurm, F.R. Molecular firefighting—How modern phosphorus chemistry can help solve the challenge of flame retardancy. Angew. Chem. 2018, 57, 10450–10467. [Google Scholar] [CrossRef]
- EUR-Lex. Access to European Union Law. 2019. Available online: https://eur-lex.europa.eu/legal-content/EN/TXT/?qid=1575293524797&uri=CELEX:32019R1021 (accessed on 6 February 2020).
- Wendels, S.; Chavez, T.; Bonnet, M.; Salmeia, K.A.; Gaan, S. Recent developments in organophosphorus flame retardants containing P-C bond and their applications. Materials 2017, 10, 784. [Google Scholar] [CrossRef]
- Yu, B.; Wang, X.; Qian, X.; Xing, W.; Yang, H.; Ma, L.; Lin, Y.; Jiang, S.; Song, L.; Hu, Y.; et al. Functionalized graphene oxide/phosphoramide oligomer hybrids flame retardant prepared via in situ polymerization for improving the fire safety of polypropylene. RSC Adv. 2014, 4, 31782–31794. [Google Scholar] [CrossRef]
- Hu, W.; Yu, B.; Jiang, S.-D.; Song, L.; Hu, Y.; Wang, B. Hyper-branched polymer grafting graphene oxide as an effective flame retardant and smoke suppressant for polystyrene. J. Hazard. Mater. 2015, 300, 58–66. [Google Scholar] [CrossRef]
- Shi, Y.; Yu, B.; Zheng, Y.; Yang, J.; Duan, Z.; Hu, Y. Design of reduced graphene oxide decorated with DOPO-phosphanomidate for enhanced fire safety of epoxy resin. J. Colloid Interface Sci. 2018, 521, 160–171. [Google Scholar] [CrossRef]
- Guo, W.; Yu, B.; Yuan, Y.; Song, L.; Hu, Y. In situ preparation of reduced graphene oxide/DOPO-based phosphonamidate hybrids towards high-performance epoxy nanocomposites. Compos. Part B Eng. 2017, 123, 154–164. [Google Scholar] [CrossRef]
- Schmidt, C.; Ciesielski, M.; Greiner, L.; Döring, M. Novel organophosphorus flame retardants and their synergistic application in novolac epoxy resin. Polym. Degrad. Stab. 2018, 158, 190–201. [Google Scholar] [CrossRef]
- Greiner, L.; Kukla, P.; Eibl, S.; Döring, M. Phosphorus containing polyacrylamides as flame retardants for epoxy-based composites in aviation. Polymers 2019, 11, 284. [Google Scholar] [CrossRef]
- Wang, H.; Wang, S.; Du, X.; Wang, H.; Cheng, X.; Du, Z. Synthesis of a novel flame retardant based on DOPO derivatives and its application in waterborne polyurethane. RSC Adv. 2019, 9, 7411–7419. [Google Scholar] [CrossRef]
- Mincheva, R.; Guemiza, H.; Hidan, C.; Moins, S.; Coulembier, O.; Dubois, P.; Laoutid, F. Development of inherently flame-retardant phosphorylated PLA by combination of ring-opening polymerization and reactive extrusion. Materials 2020, 13, 13. [Google Scholar] [CrossRef]
- Mourgas, G.; Giebel, E.; Schneck, T.; Unold, J.; Buchmeiser, M.R. Syntheses of intrinsically flame-retardant polyamide 6 fibers and fabrics. J. Appl. Polym. Sci. 2019, 136, 47829. [Google Scholar] [CrossRef]
- Liu, K.; Li, Y.; Tao, L.; Liu, C.; Xiao, R. Synthesis and characterization of inherently flame retardant polyamide 6 based on a phosphine oxide derivative. Polym. Degrad. Stab. 2019, 163, 151–160. [Google Scholar] [CrossRef]
- Ma, C.; Li, J. Synthesis of an organophosphorus flame retardant derived from daidzein and its application in epoxy resin. Compos. Part B Eng. 2019, 178, 107471. [Google Scholar] [CrossRef]
- Howell, B.A.; Daniel, Y.G. Incorporation of comonomer exo-5-(Diphenylphosphato)isosorbide-2-endo-acrylate to generate flame retardant poly(styrene). Polymers 2019, 11, 2038. [Google Scholar] [CrossRef]
- Howell, B.A.; Han, X. Effective biobased phosphorus flame retardants from starch-derived bis-2,5-(hydroxymethyl)furan. Molecules 2020, 25, 592. [Google Scholar] [CrossRef] [PubMed]
- Salmeia, K.A.; Gaan, S. An overview of some recent advances in DOPO-derivatives: Chemistry and flame retardant applications. Polym. Degrad. Stab. 2015, 113, 119–134. [Google Scholar] [CrossRef]
- Rakotomalala, M.; Wagner, S.; Döring, M. Recent developments in halogen free flame retardants for epoxy resins for electrical and electronic applications. Materials 2010, 3, 4300–4327. [Google Scholar] [CrossRef]
- Simonetti, P.; Nazir, R.; Gooneie, A.; Lehner, S.; Jovic, M.; Salmeia, K.A.; Hufenus, R.; Rippl, A.; Kaiser, J.-P.; Hirsch, C.; et al. Michael addition in reactive extrusion: A facile sustainable route to developing phosphorus based flame retardant materials. Compos. Part B Eng. 2019, 178, 107470. [Google Scholar] [CrossRef]
- Horrocks, A.R.; Sitpalan, A.; Kandola, B.K. Design and characterisation of bicomponent polyamide 6 fibers with specific locations of each flame retardant component for enhanced flame retardancy. Polym. Test. 2019, 79, 106041. [Google Scholar] [CrossRef]
- Vasiljević, J.; Čolović, M.; Jerman, I.; Simončič, B.; Demšar, A.; Samaki, Y.; Šobak, M.; Šest, E.; Golja, B.; Leskovšek, M.; et al. In situ prepared polyamide 6/DOPO-derivative nanocomposite for melt-spinning of flame retardant textile filaments. Polym. Degrad. Stab. 2019, 166, 50–59. [Google Scholar] [CrossRef]
- Neisius, N.M.; Lutz, M.; Rentsch, D.; Hemberger, P.; Gaan, S. Synthesis of DOPO-based phosphonamidates and their thermal properties. Ind. Eng. Chem. Res. 2014, 53, 2889–2896. [Google Scholar] [CrossRef]
- Yao, Q.; Zhou, H.; Zhang, W.W.; Cao, W.H.; Liu, Z.X.; Xu, Z. Dopo Derivative, and Preparation Method and Use Thereof. WO2016008072A1, 21 January 2016. [Google Scholar]
- Schindler, A.; Doedt, M.; Gezgin, Ş.; Menzel, J.; Schmölzer, S. Identification of polymers by means of DSC, TG, STA and computer-assisted database search. J. Therm. Anal. Calorim. 2017, 129, 833–842. [Google Scholar] [CrossRef]
- Bourbigot, S.; Devaux, E.; Flambard, X. Flammability of polyamide-6/clay hybrid nanocomposite textiles. Polym. Degrad. Stab. 2002, 75, 397–402. [Google Scholar] [CrossRef]
- Zhang, C.-L.; Feng, L.-F.; Hu, G.-H. Anionic polymerization of lactams: A comparative study on various methods of measuring the conversion of ε-caprolactam to polyamide 6. J. Appl. Polym. Sci. 2006, 101, 1972–1981. [Google Scholar] [CrossRef]
- Chang, Q.; Long, L.; He, W.; Qin, S.; Yu, J. Thermal degradation behavior of PLA composites containing bis DOPO phosphonates. Thermochim. Acta 2016, 639, 84–90. [Google Scholar] [CrossRef]
- Hatfield, G.R.; Glans, J.H.; Hammond, W.B. Characterization of structure and morphology in nylon 6 by solid-state 13C and 15N NMR. Macromolecules 1990, 23, 1654–1658. [Google Scholar] [CrossRef]
- Nagel, K.; Kaßner, L.; Seifert, A.; Grützner, R.-E.; Cox, G.; Spange, S. Ternary composites by an in situ hydrolytic polymerization process. RSC Adv. 2018, 8, 14713–14721. [Google Scholar] [CrossRef]
- Fakirov, S.; Banerjee, S.; Lin, R.J.T. On the degree of crystallinity from DSC in the case of multiple melting of synthetic polymers. J. Macromol. Sci. Part B Phys. 2007, 46, 317–320. [Google Scholar] [CrossRef]
- Li, J.; Fang, Z.; Zhu, Y.; Tong, L.; Gu, A.; Liu, F. Isothermal crystallization kinetics and melting behavior of multiwalled carbon nanotubes/polyamide-6 composites. J. Appl. Polym. Sci. 2007, 105, 3531–3542. [Google Scholar] [CrossRef]
- Murthy, N.S. Hydrogen bonding, mobility, and structural transitions in aliphatic polyamides. J. Polym. Sci. Part B Polym. Phys. 2006, 44, 1763–1782. [Google Scholar] [CrossRef]
- Buczko, A.; Stelzig, T.; Bommer, L.; Rentsch, D.; Heneczkowski, M.; Gaan, S. Bridged DOPO derivatives as flame retardants for PA6. Polym. Degrad. Stab. 2014, 107, 158–165. [Google Scholar] [CrossRef]
- Song, P.; Dai, J.; Chen, G.; Yu, Y.; Fang, Z.; Lei, W.; Fu, S.; Wang, H.; Chen, Z.-G. Bioinspired design of strong, tough, and thermally stable polymeric materials via nanoconfinement. ACS Nano 2018, 12, 9266–9278. [Google Scholar] [CrossRef]
- Schartel, B.; Wilkie, C.A.; Camino, G. Recommendations on the scientific approach to polymer flame retardancy: Part 1—Scientific terms and methods. J. Fire Sci. 2016, 34, 447–467. [Google Scholar] [CrossRef]

| Sample | CLconv (%) | Mn (g/mol) | Mw (g/mol) | Mw/Mn |
|---|---|---|---|---|
| PA6 | 95.9 | 7.1 × 10⁴ | 2.6 × 10⁵ | 3.57 |
| PA6/ED | 97.4 | 2.0 × 10⁴ | 1.3 × 10⁵ | 6.50 |
| PA6/NED | 97.3 | 4.6 × 10⁴ | 2.0 × 10⁵ | 4.45 |
| PA6/PHED | 97.2 | 5.8 × 10⁴ | 2.4 × 10⁵ | 4.09 |
| Sample | Tg (C°) | Tm1 (C°) | Tm2 (C°) | Tc (C°) | Xc (%) |
|---|---|---|---|---|---|
| PA6 | 52 | 222 | 220 | 196 | 31.2 |
| PA6/ED | 59 | 213 | 212 | 184 | 20.4 |
| PA6/NED | 53 | 220 | 217 | 194 | 30.4 |
| PA6/PHED | 52 | 221 | 219 | 194 | 26.6 |
| Sample | P (%) | LOI (%) | UL 94 | ||||
|---|---|---|---|---|---|---|---|
| Test | t1/t2 (s) | Cotton Ignition | Burning up to the Clamp | Classification | |||
| PA6 | 0 | 25.0 | 1 | 0/0 | Yes | No | V2 |
| 2 | 0/0 | Yes | No | V2 | |||
| PA6/10PHED | 1.16 | 26.9 | 1 | 1/1 | No | No | V0 |
| 2 | 1/0 | Yes | No | V2 | |||
| PA6/15PHED | 1.74 | 27.8 | 1 | 1/0 | No | No | V0 |
| 2 | 0/1 | No | No | V0 | |||
© 2020 by the authors. Licensee MDPI, Basel, Switzerland. This article is an open access article distributed under the terms and conditions of the Creative Commons Attribution (CC BY) license (http://creativecommons.org/licenses/by/4.0/).
Share and Cite
Vasiljević, J.; Čolović, M.; Čelan Korošin, N.; Šobak, M.; Štirn, Ž.; Jerman, I. Effect of Different Flame-Retardant Bridged DOPO Derivatives on Properties of in Situ Produced Fiber-Forming Polyamide 6. Polymers 2020, 12, 657. https://doi.org/10.3390/polym12030657
Vasiljević J, Čolović M, Čelan Korošin N, Šobak M, Štirn Ž, Jerman I. Effect of Different Flame-Retardant Bridged DOPO Derivatives on Properties of in Situ Produced Fiber-Forming Polyamide 6. Polymers. 2020; 12(3):657. https://doi.org/10.3390/polym12030657
Chicago/Turabian StyleVasiljević, Jelena, Marija Čolović, Nataša Čelan Korošin, Matic Šobak, Žiga Štirn, and Ivan Jerman. 2020. "Effect of Different Flame-Retardant Bridged DOPO Derivatives on Properties of in Situ Produced Fiber-Forming Polyamide 6" Polymers 12, no. 3: 657. https://doi.org/10.3390/polym12030657
APA StyleVasiljević, J., Čolović, M., Čelan Korošin, N., Šobak, M., Štirn, Ž., & Jerman, I. (2020). Effect of Different Flame-Retardant Bridged DOPO Derivatives on Properties of in Situ Produced Fiber-Forming Polyamide 6. Polymers, 12(3), 657. https://doi.org/10.3390/polym12030657


