Synthesis of Polyaniline/Scarlet 3R as a Conductive Polymer


Abstract

1. Introduction
2. Experimental Section
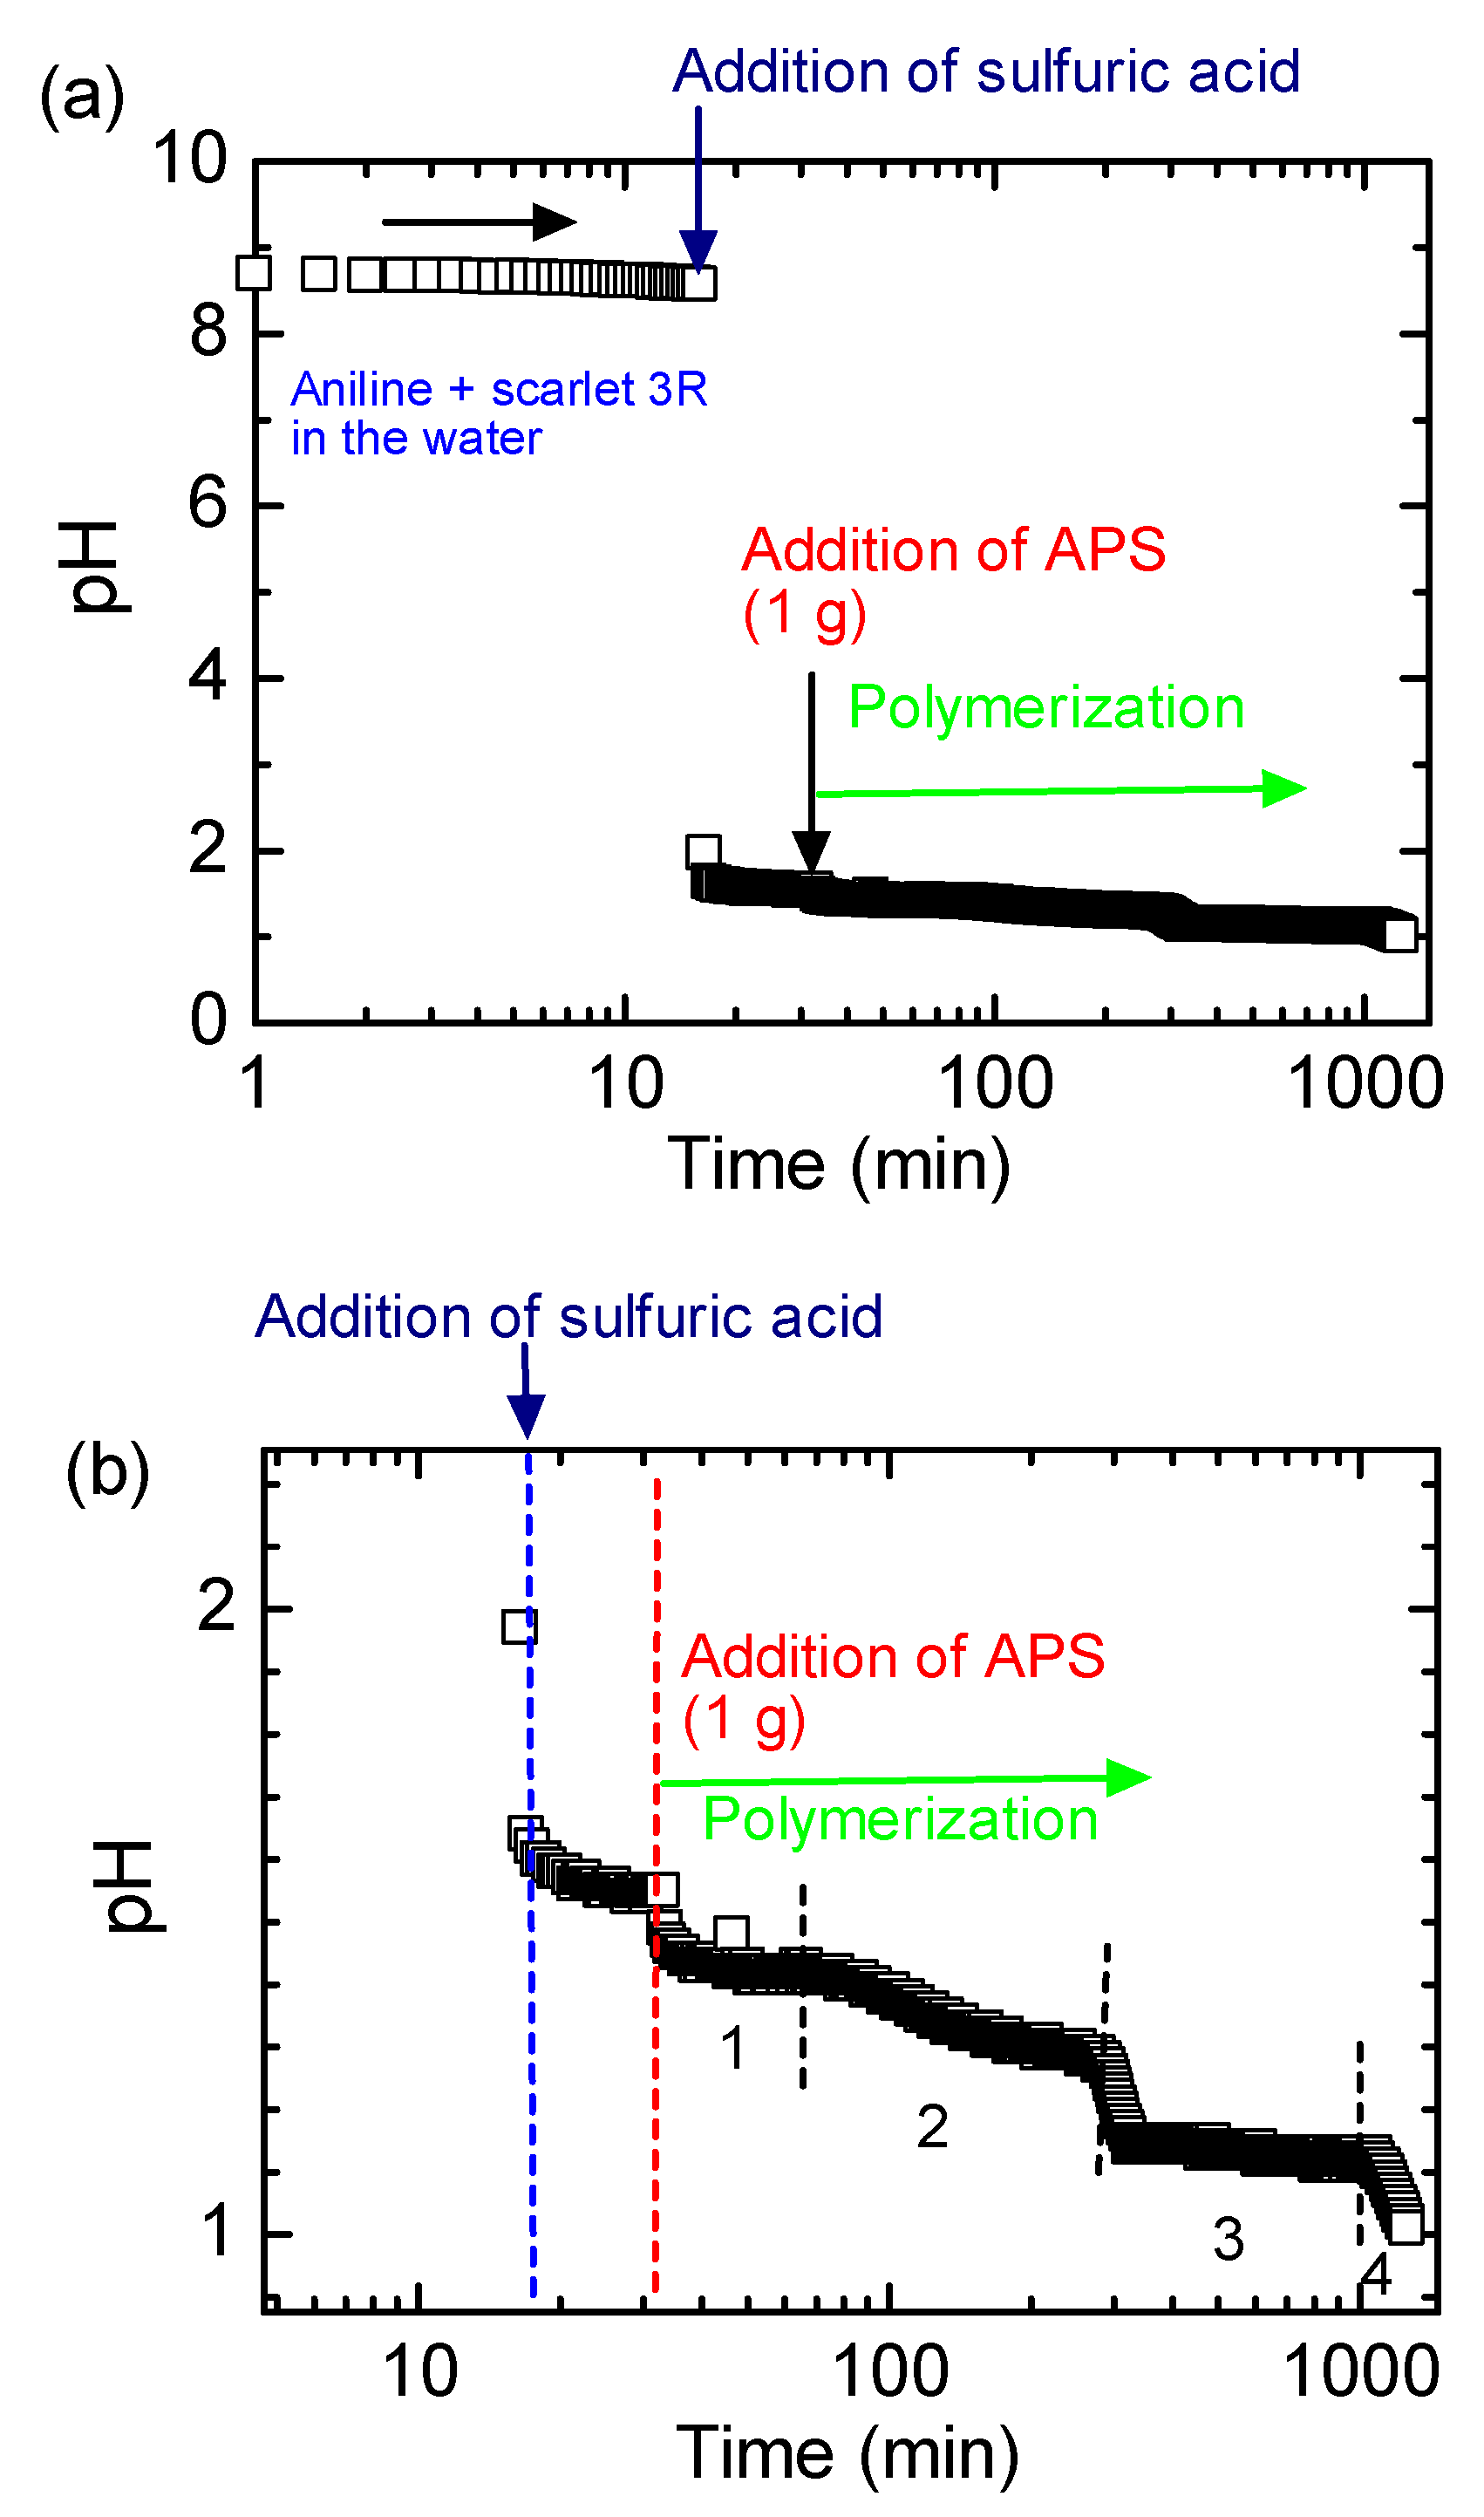
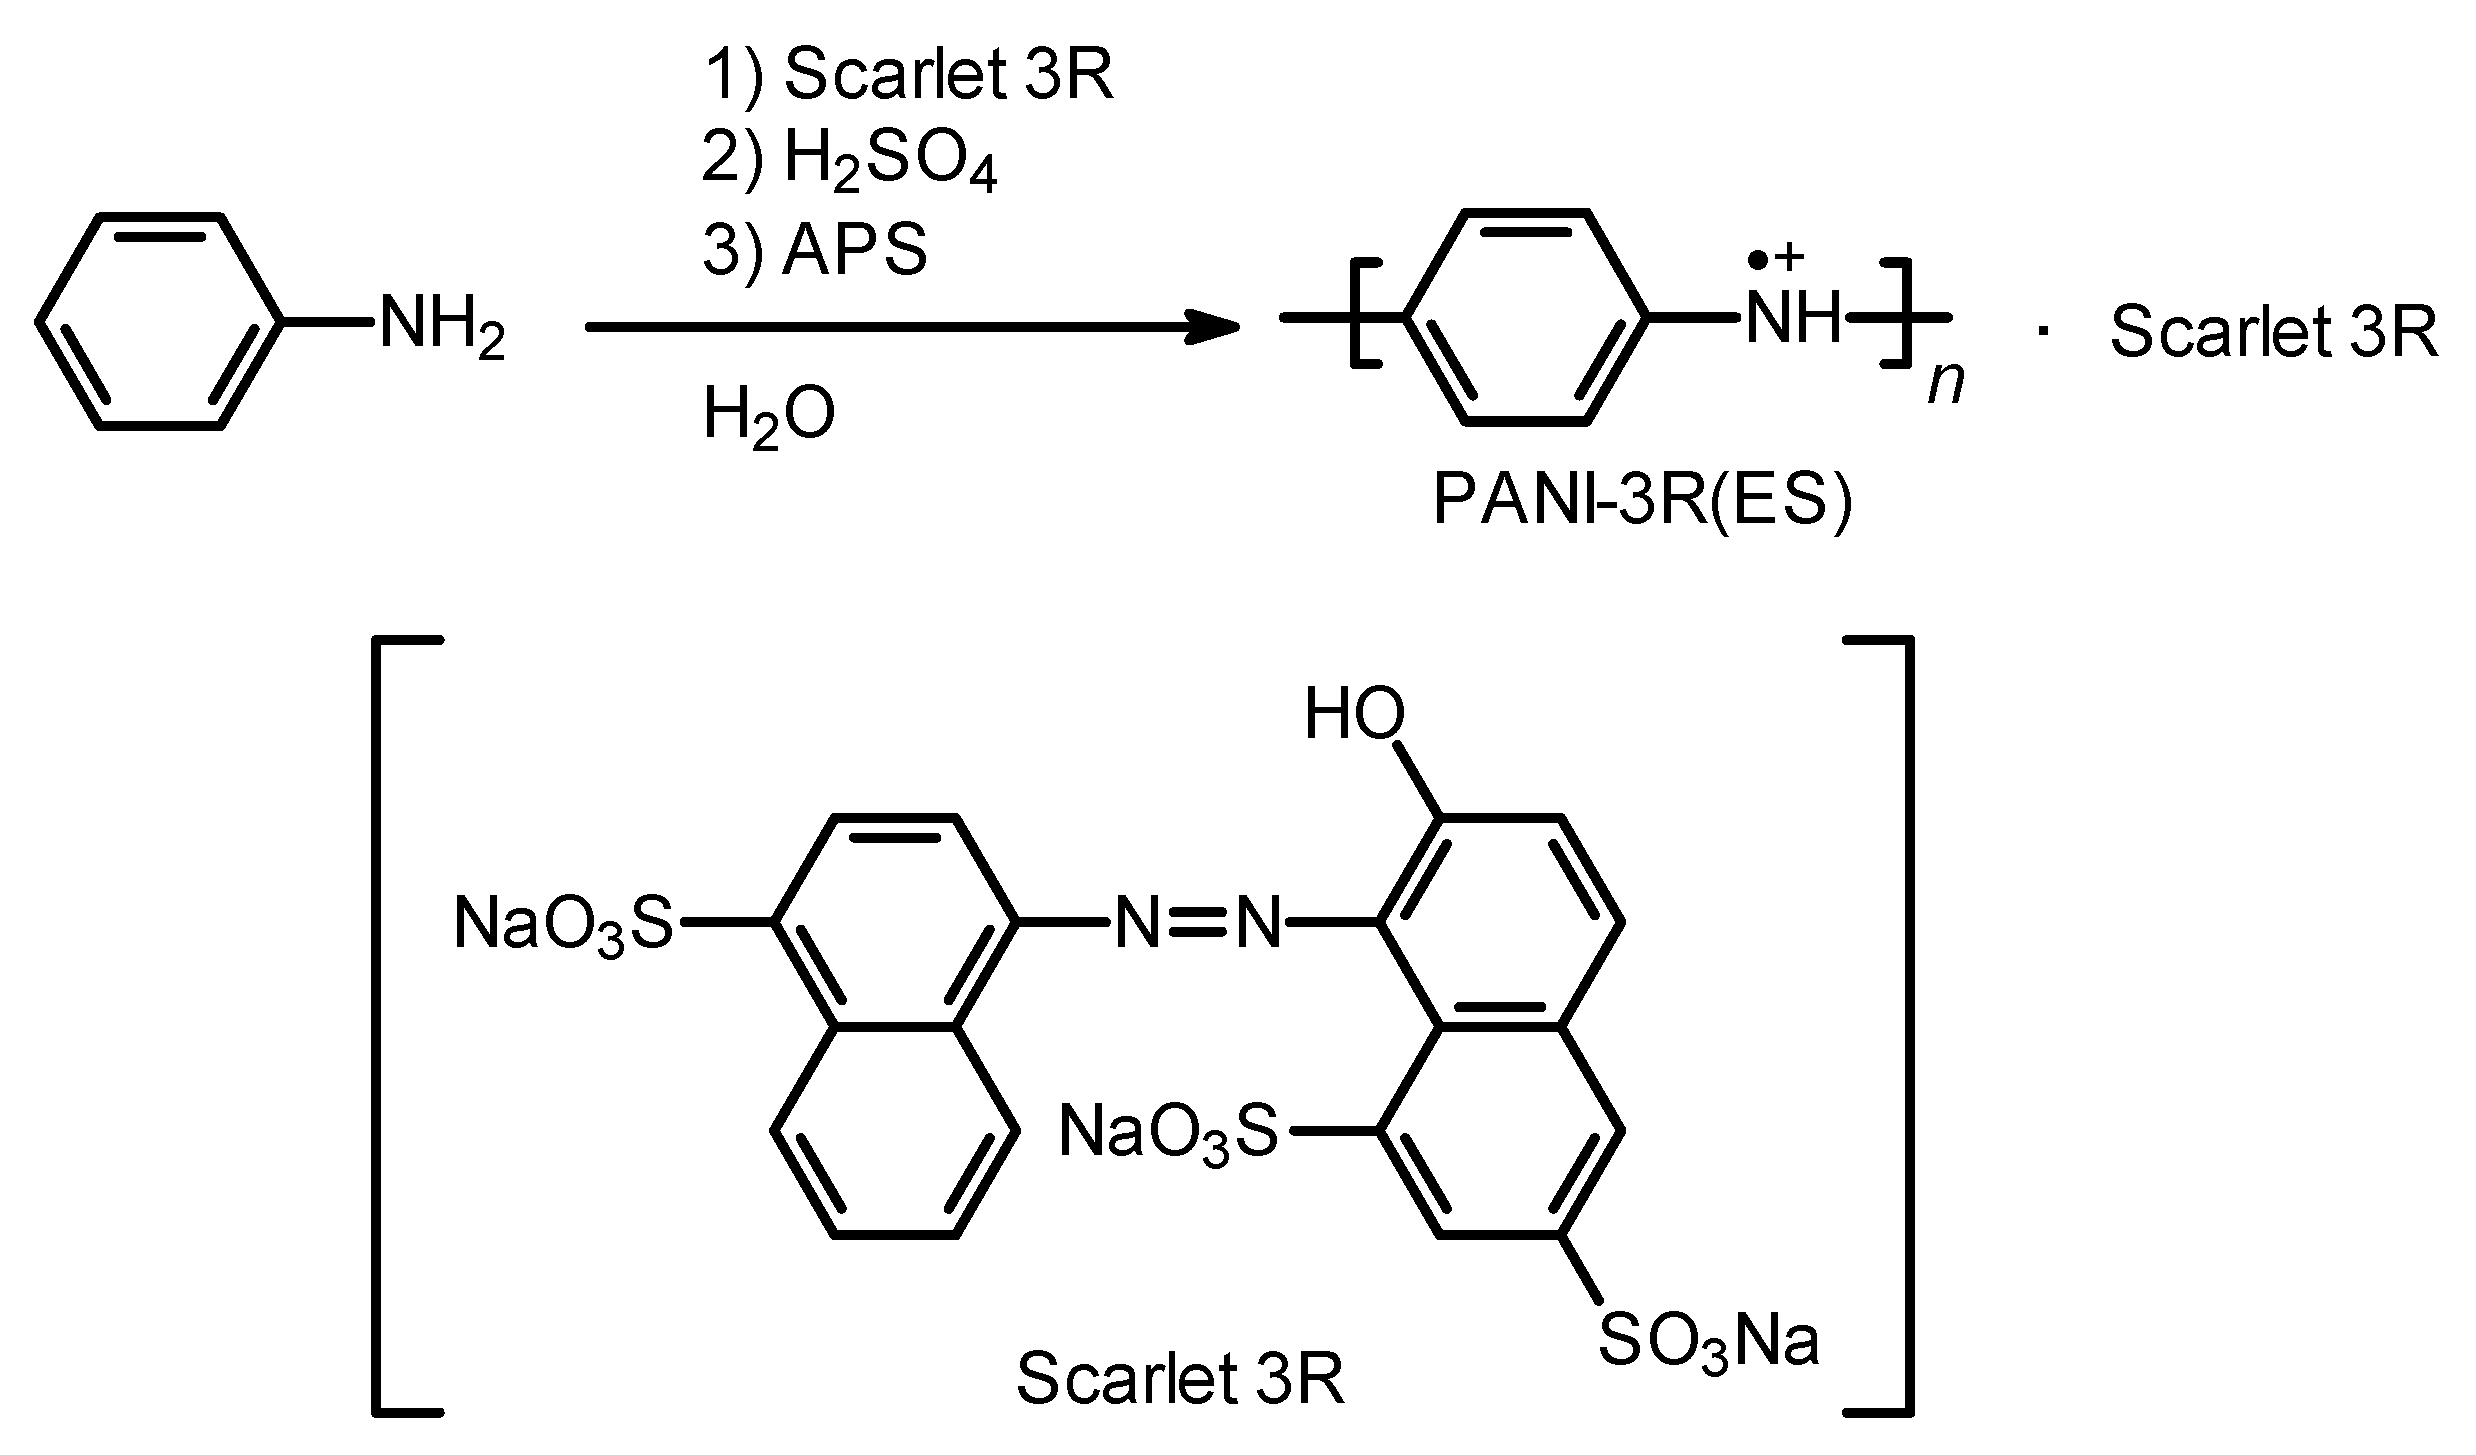
2.1. Synthesis
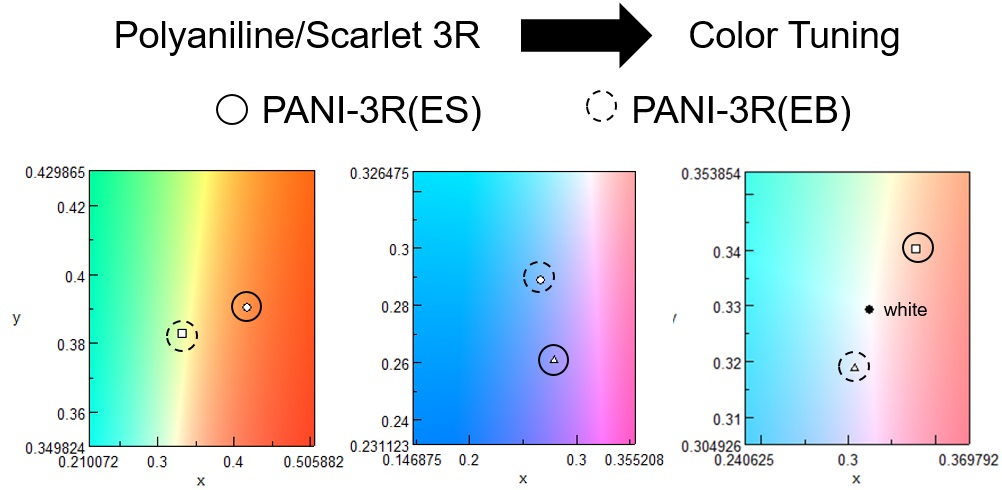
PANI-3R(ES)
2.2. Reagents and Methods
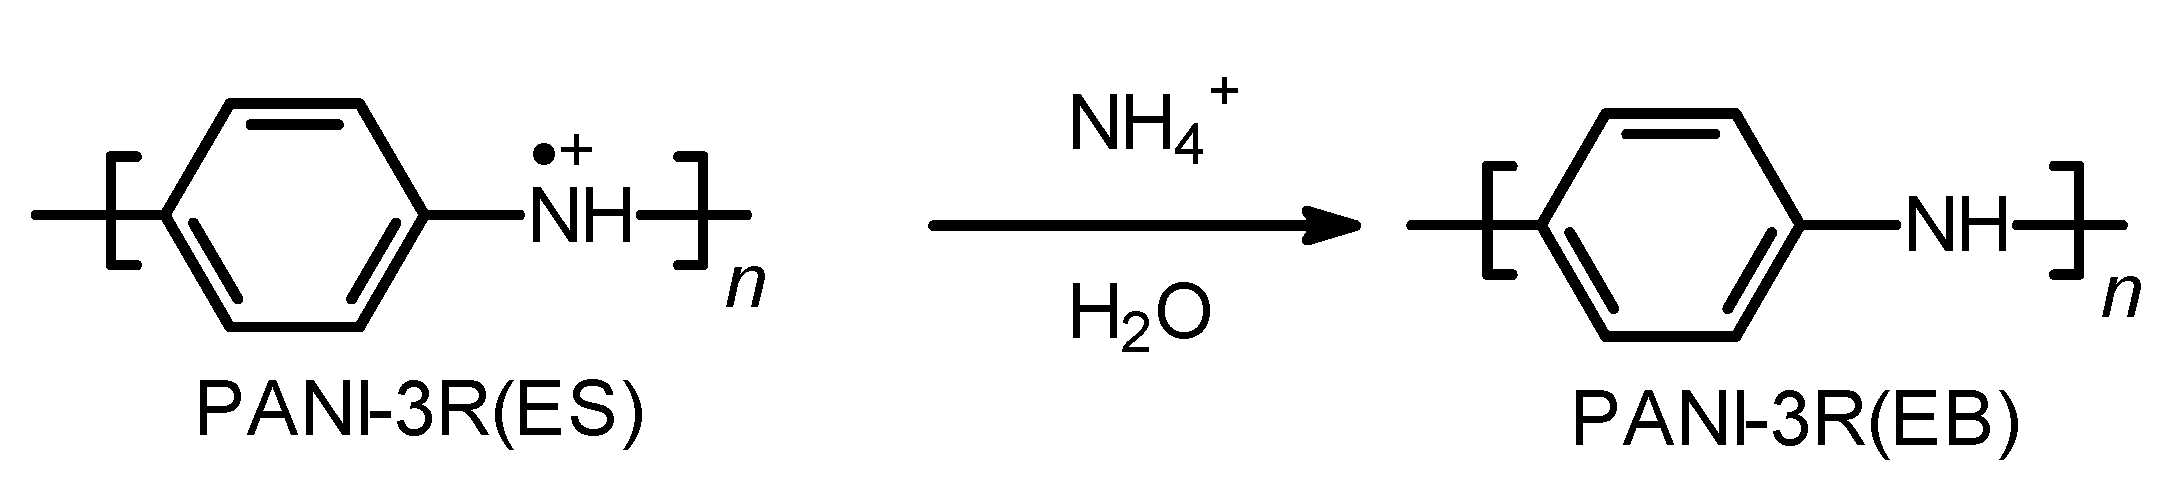
2.2.1. PANI-3R(EB)
2.2.2. Chemicals
2.2.3. Infrared (IR) Absorption Measurement
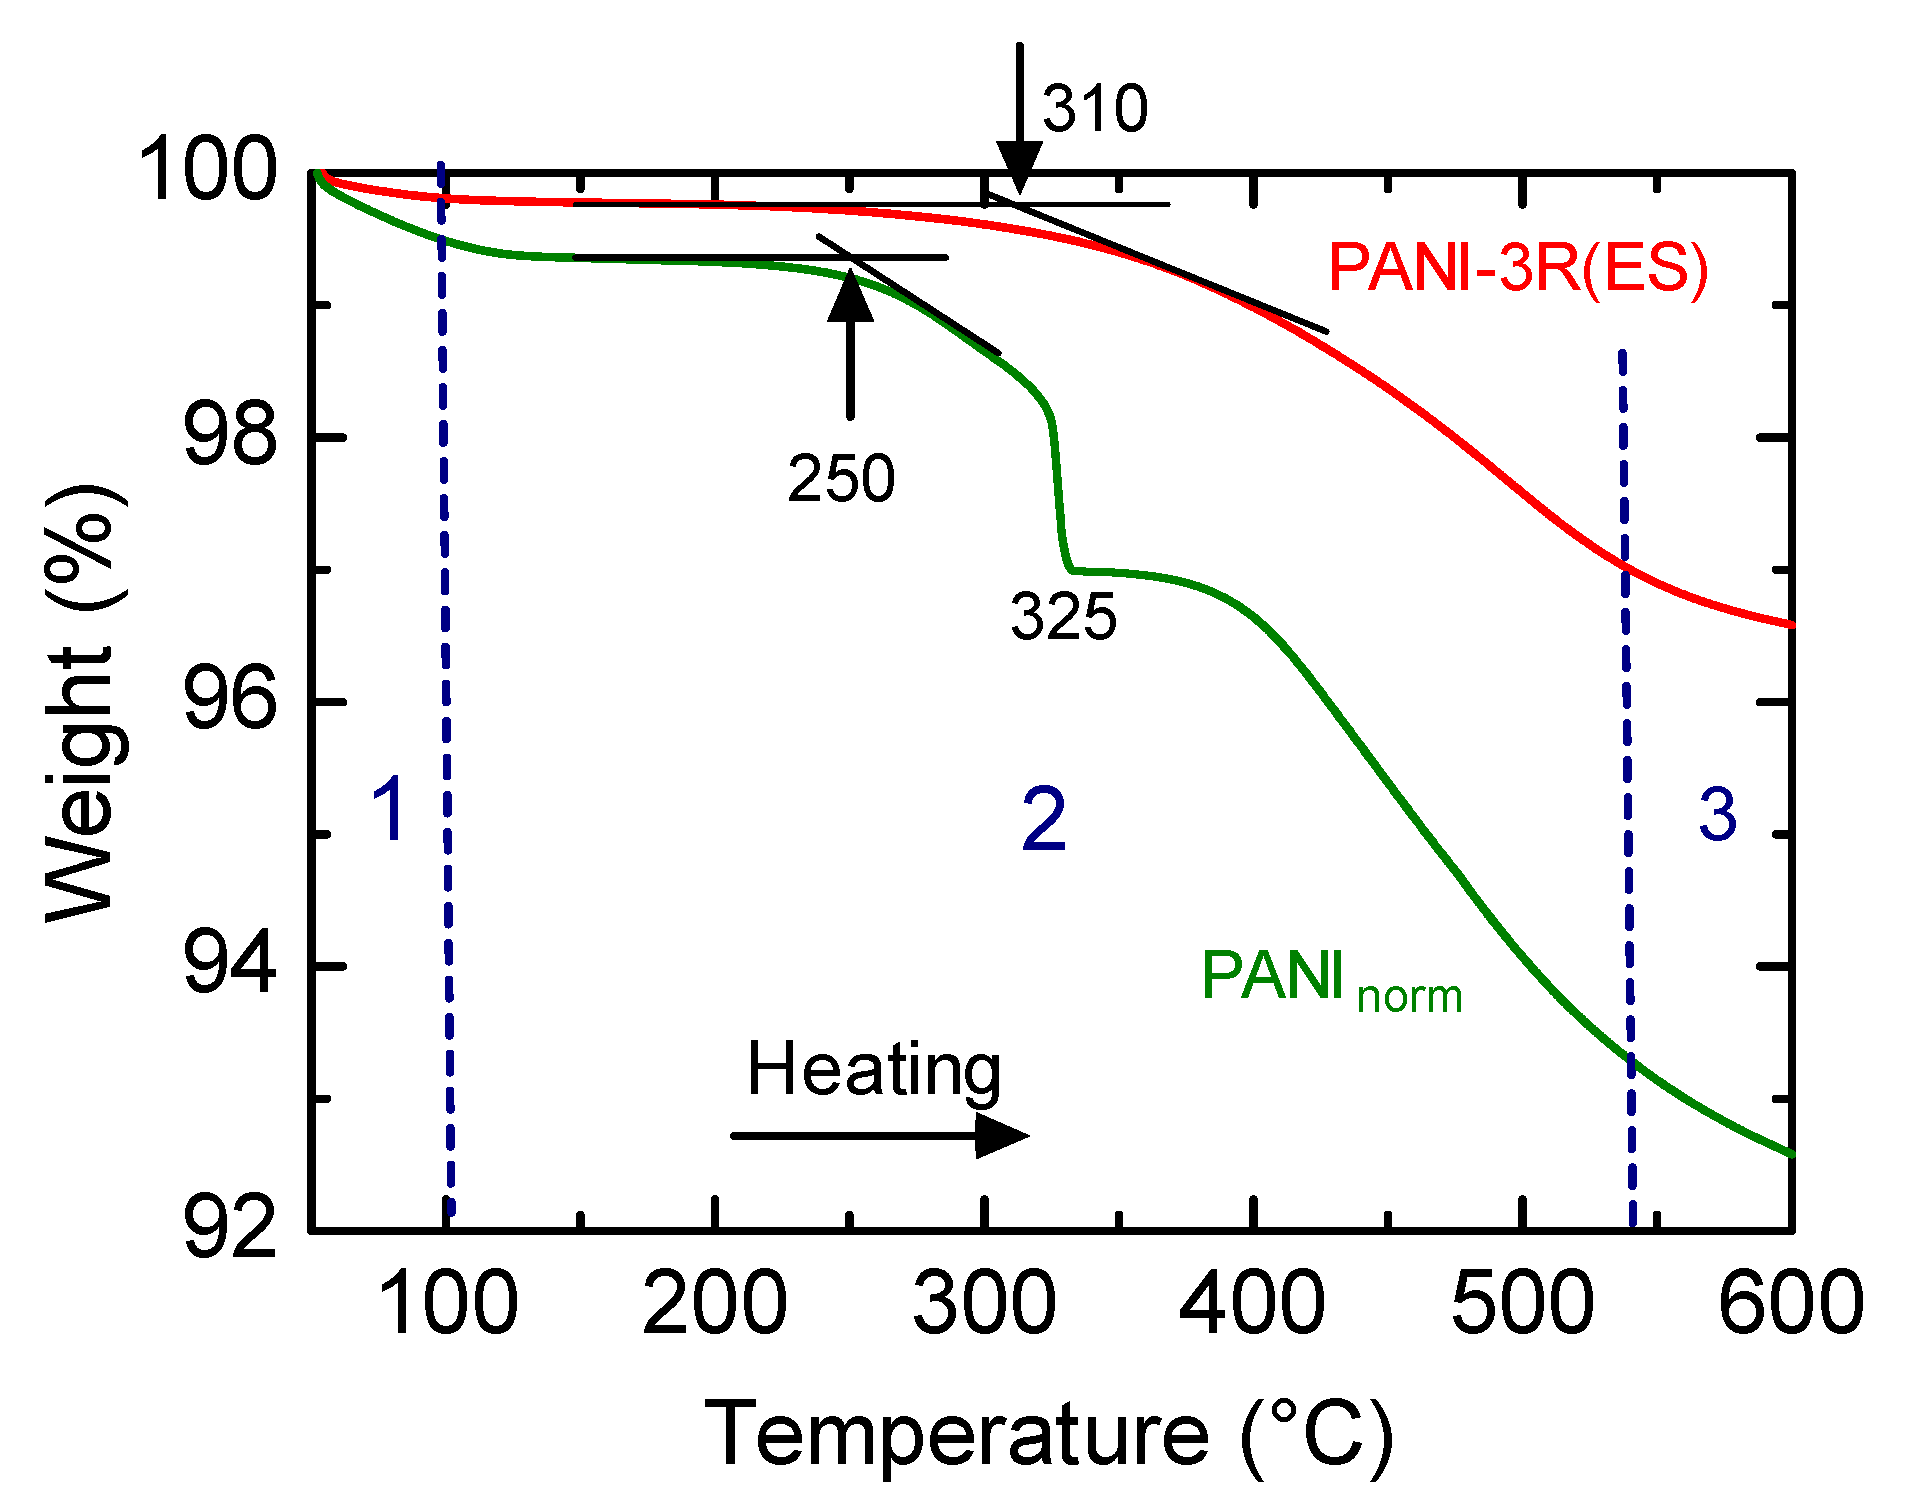
2.2.4. Thermogravimetric (TG) Analysis
2.2.5. X-ray Diffraction (XRD) Spectroscopy
2.2.6. Instrumentation
3. Results and Discussion
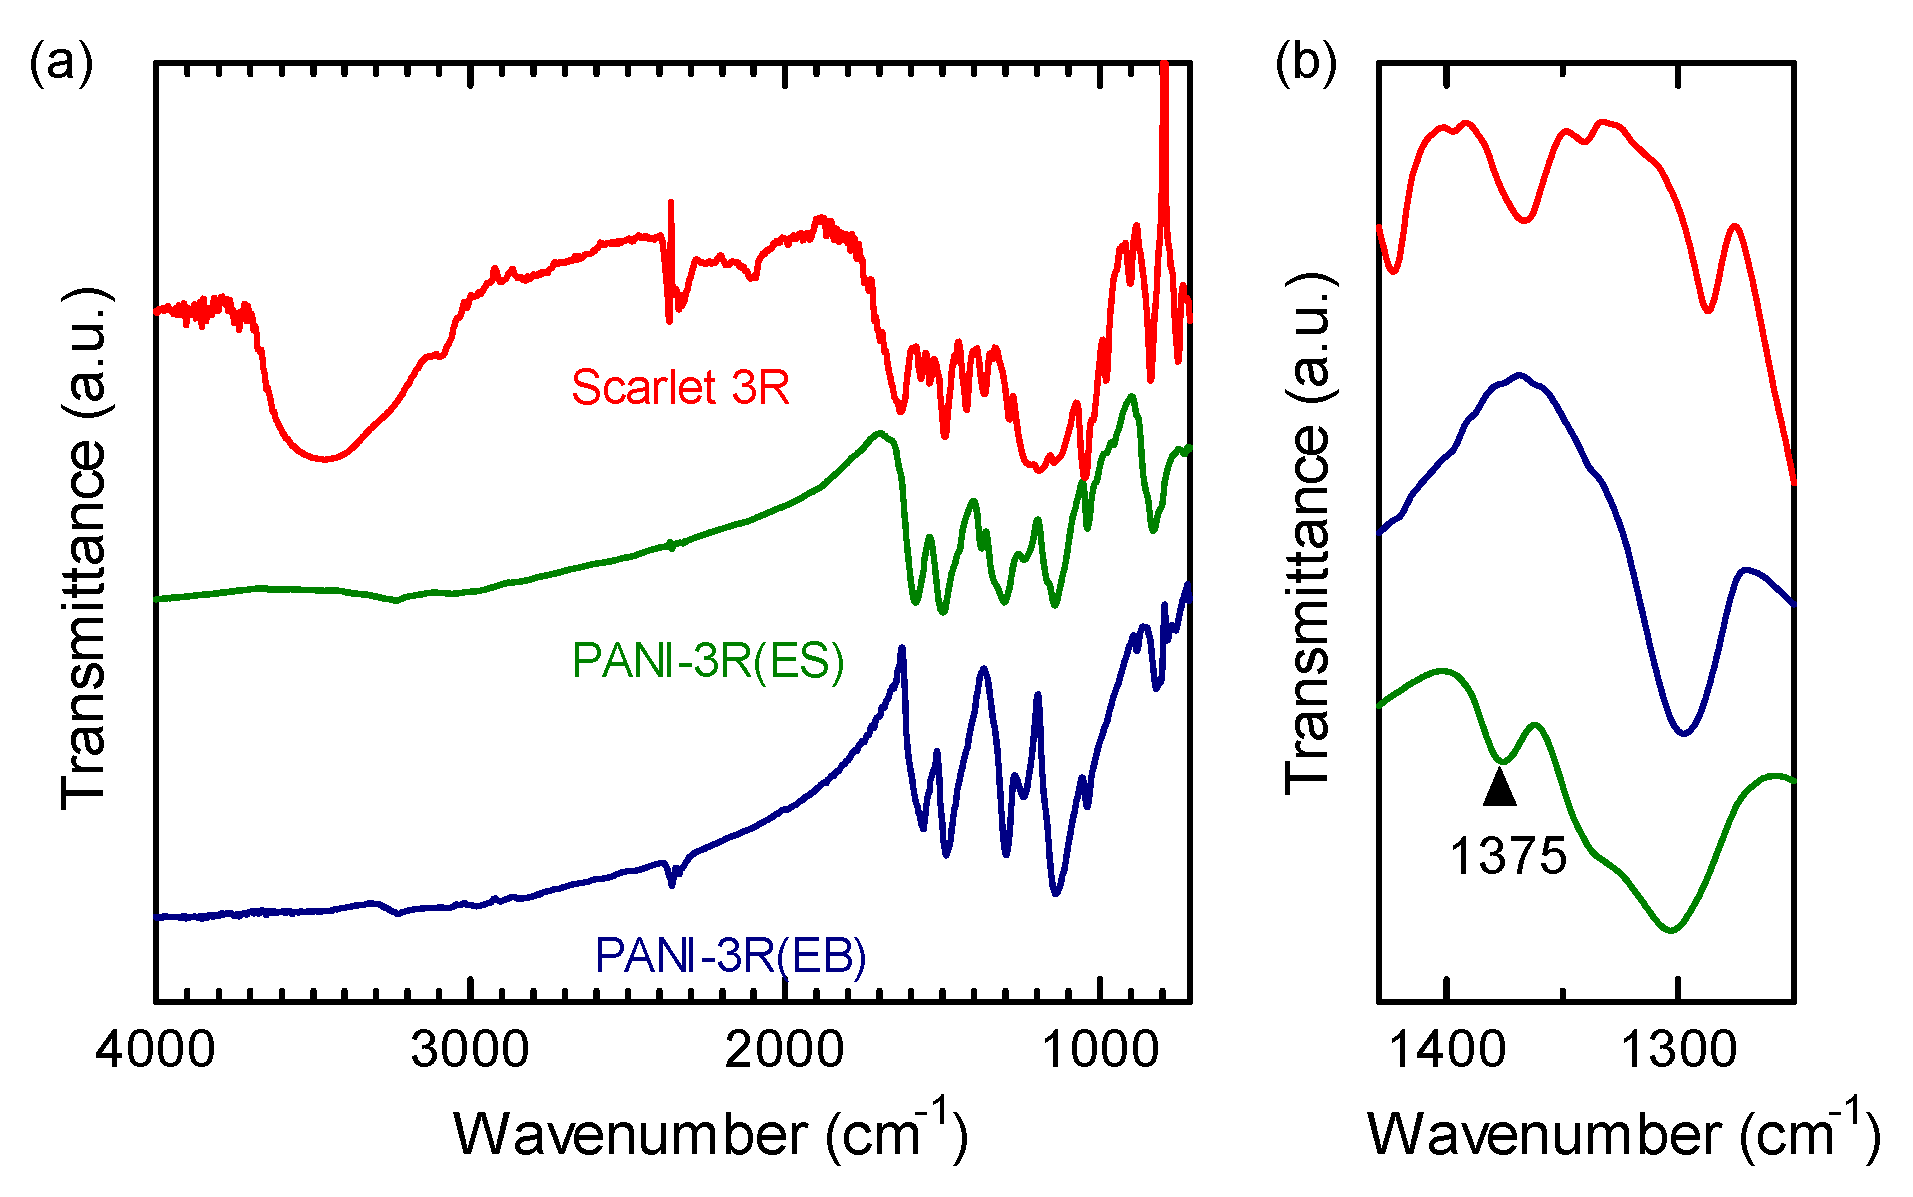
3.1. FTIR
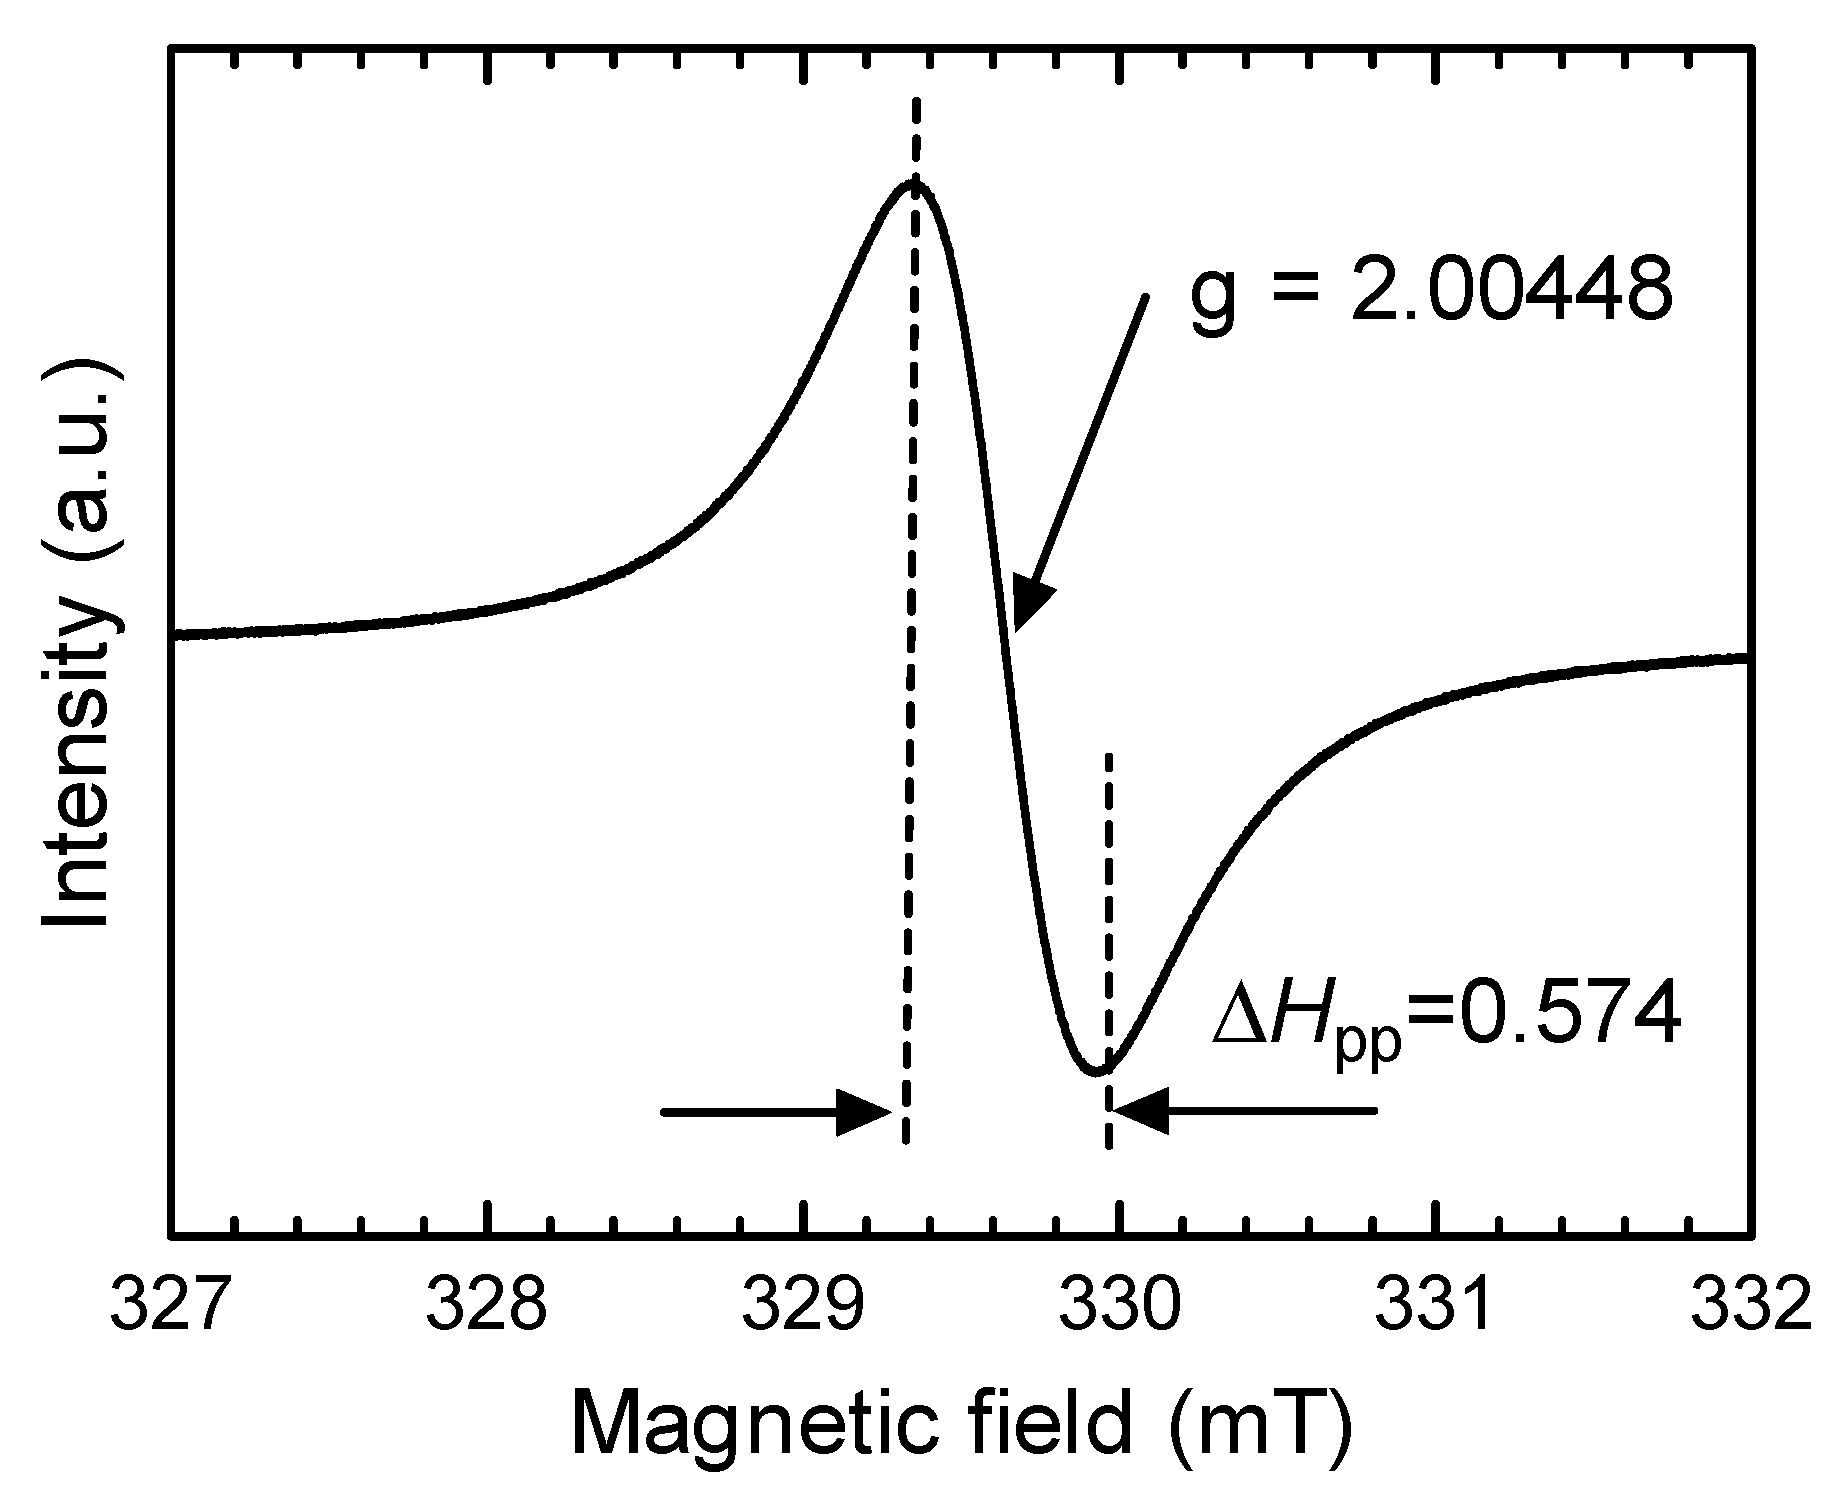
3.2. Electron spin Resonance
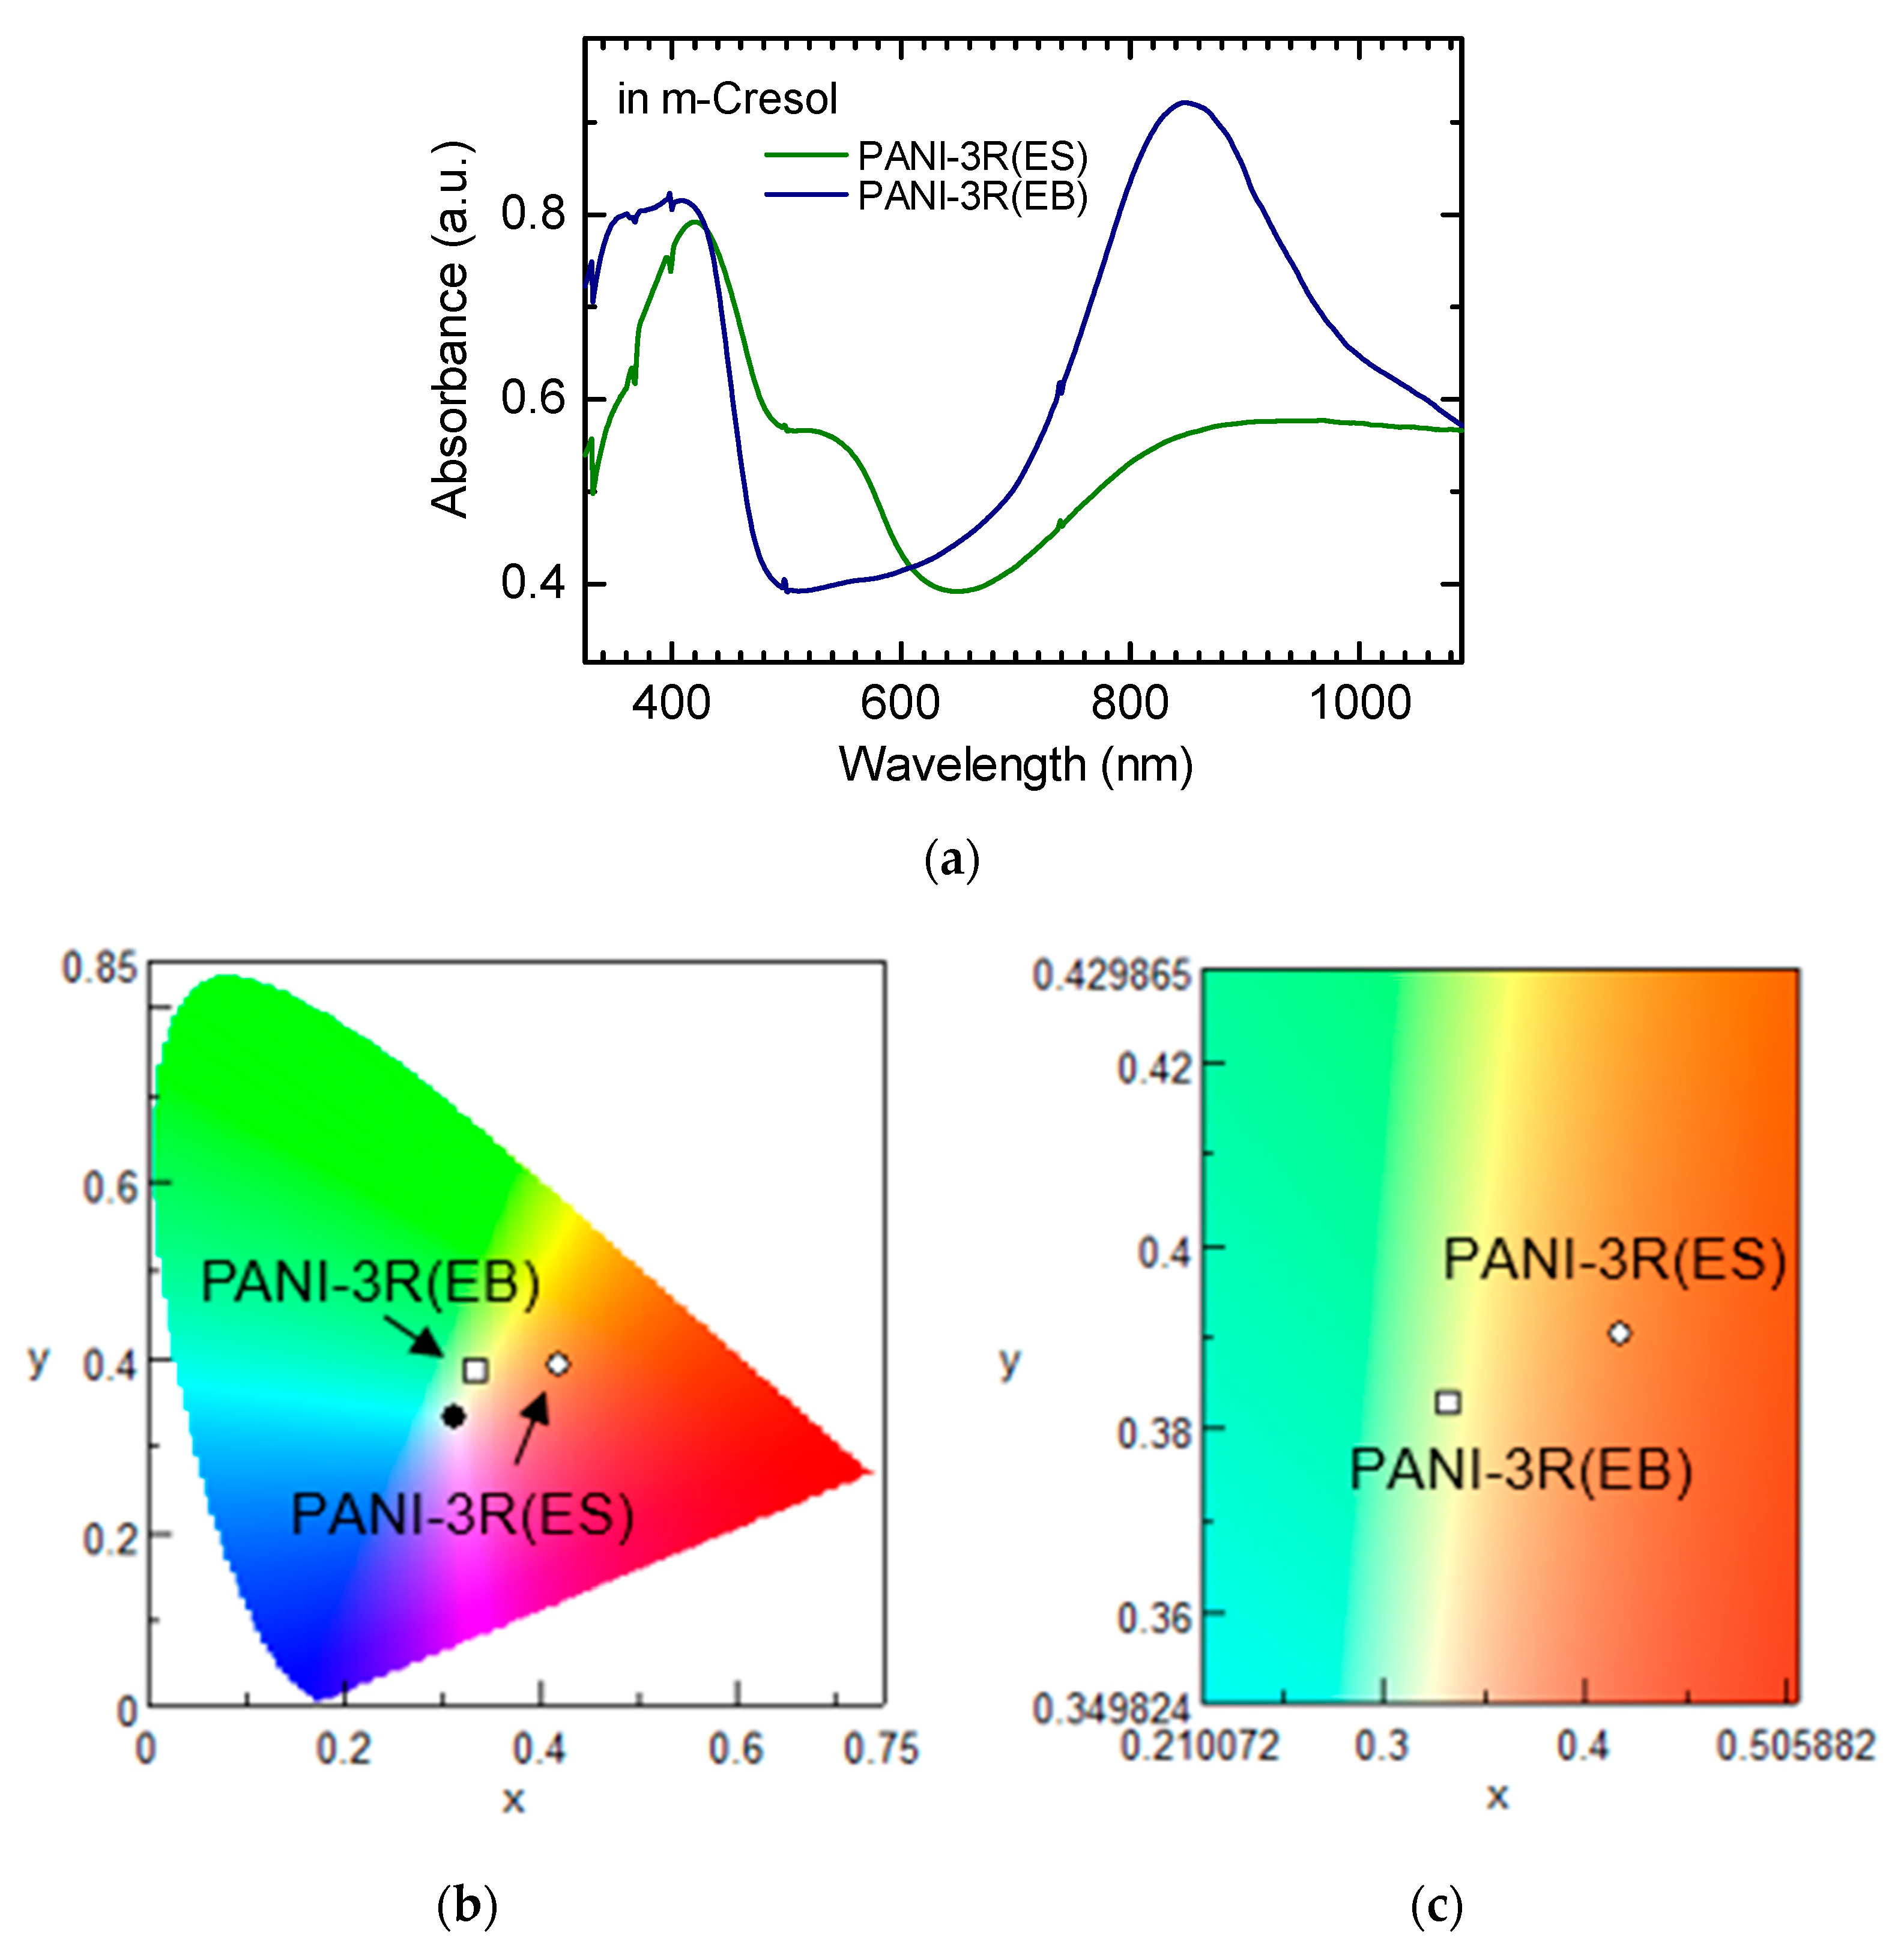
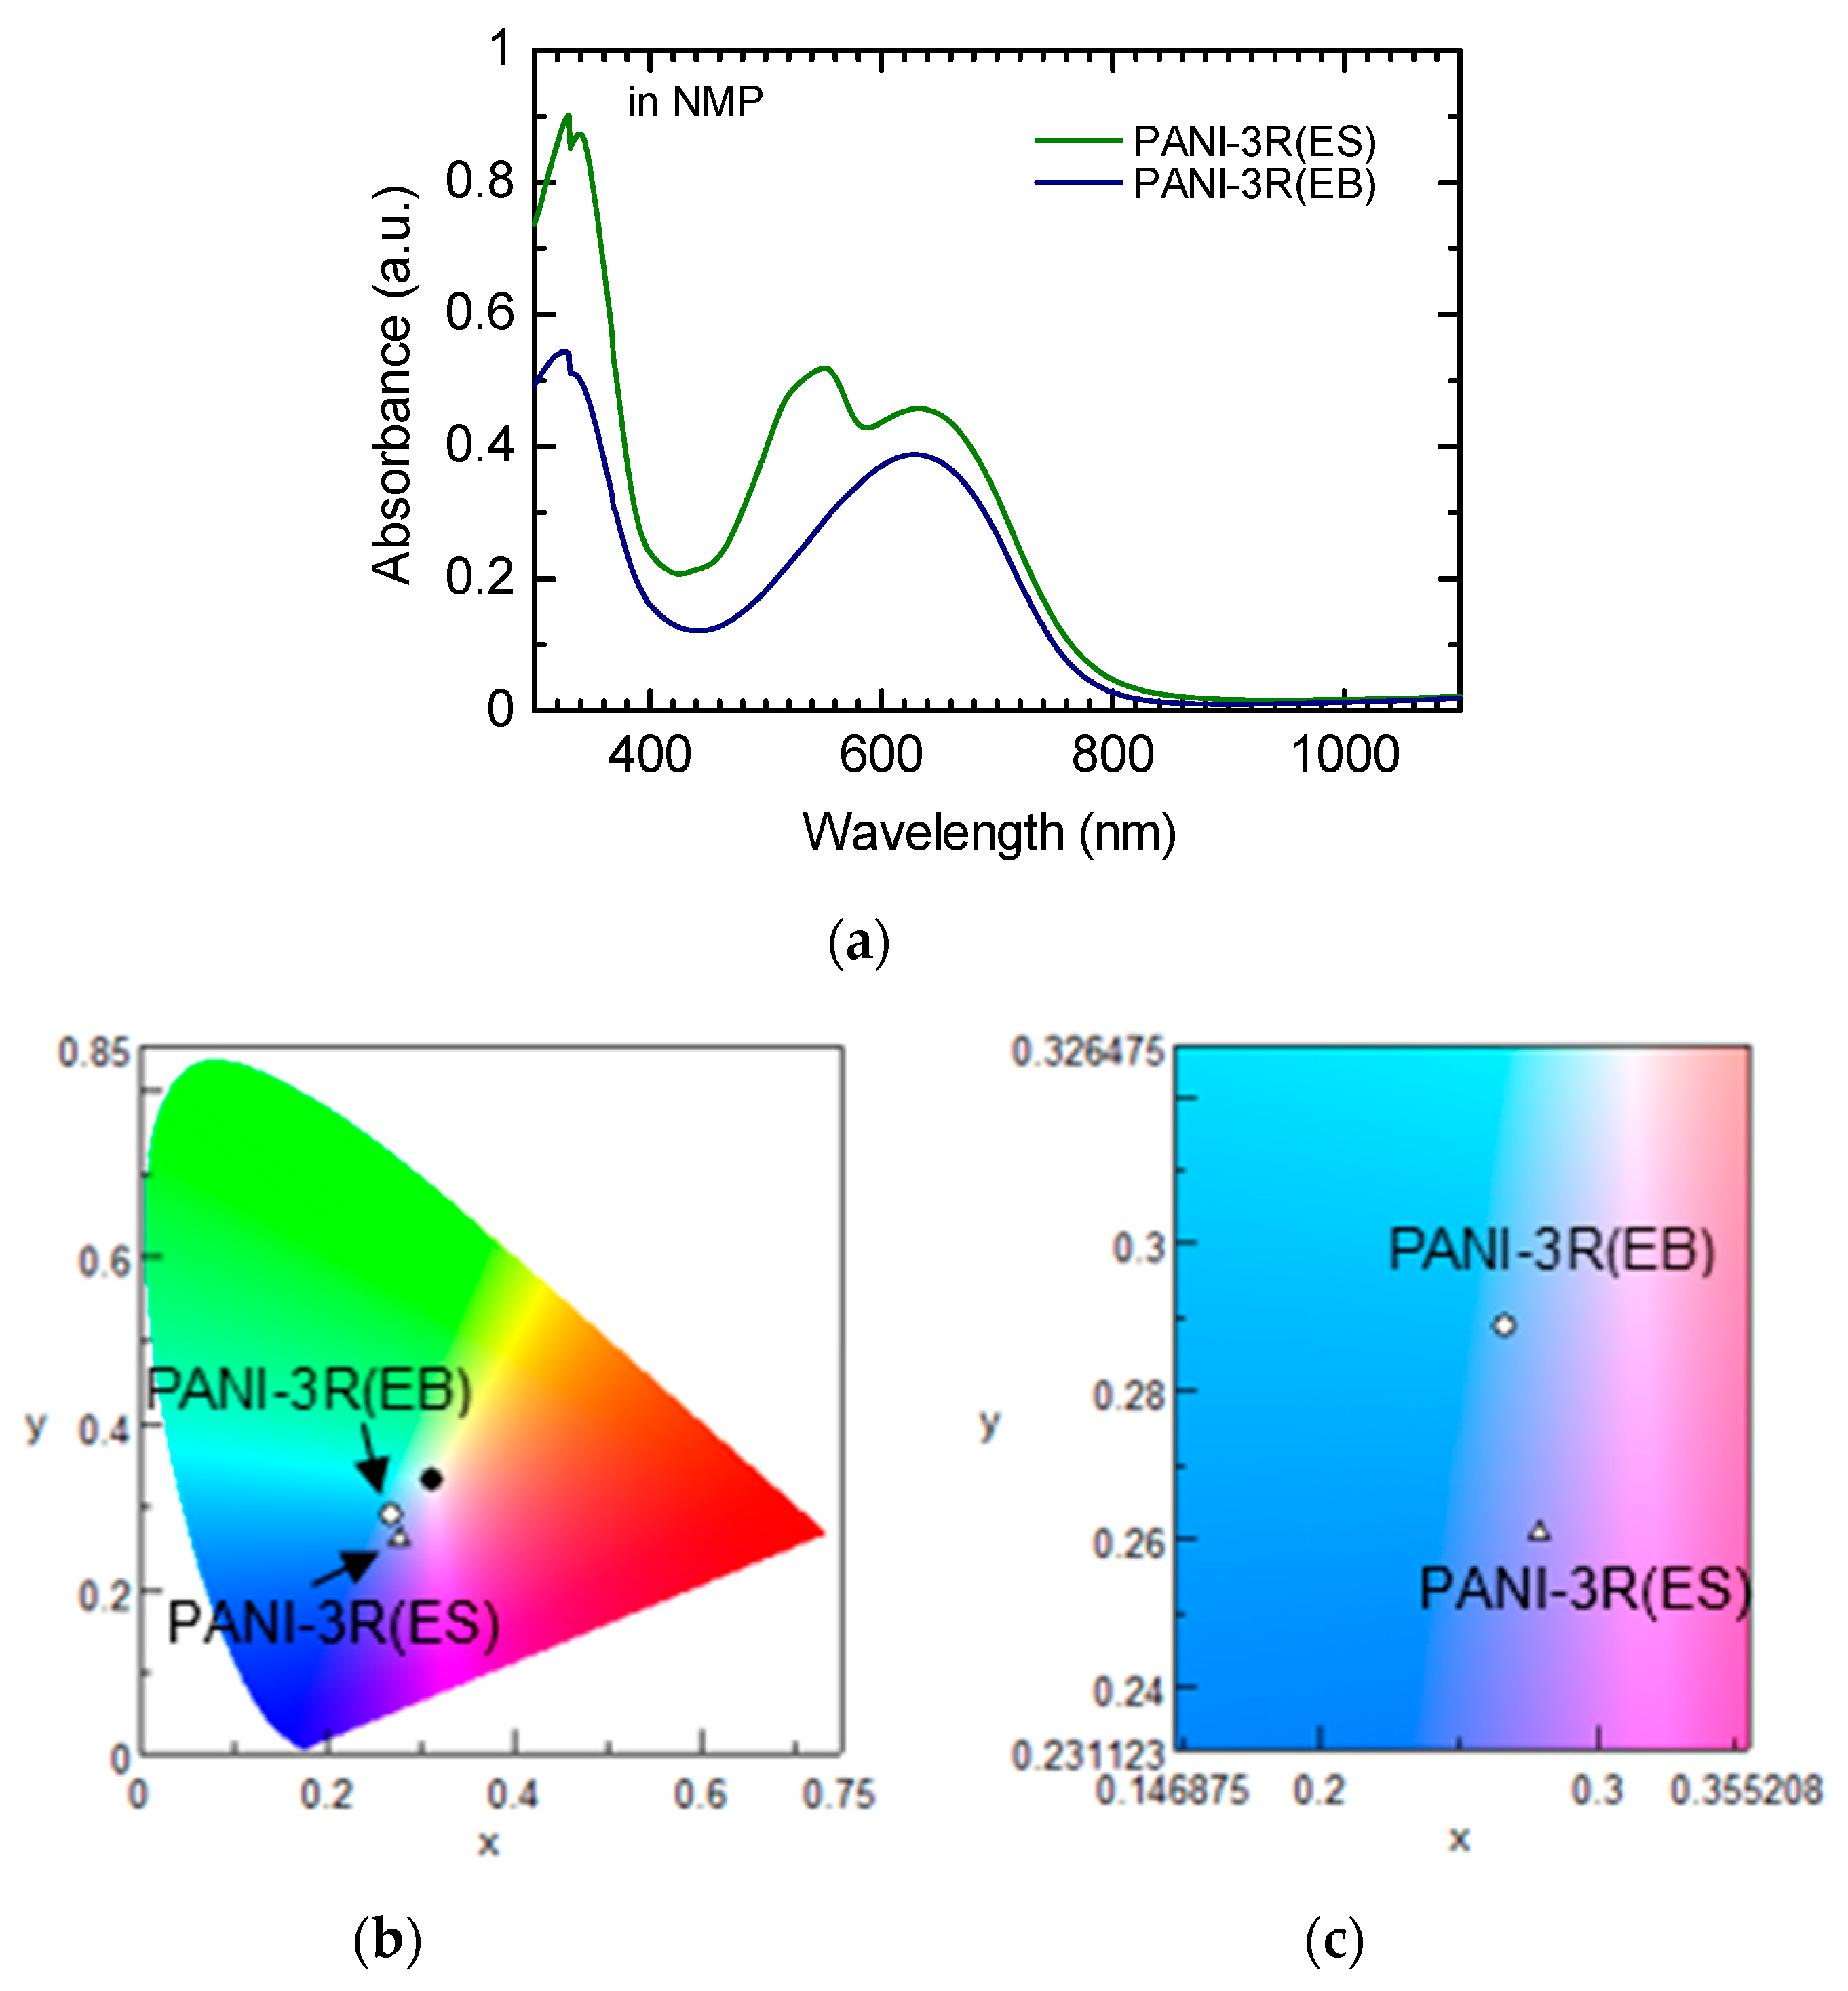
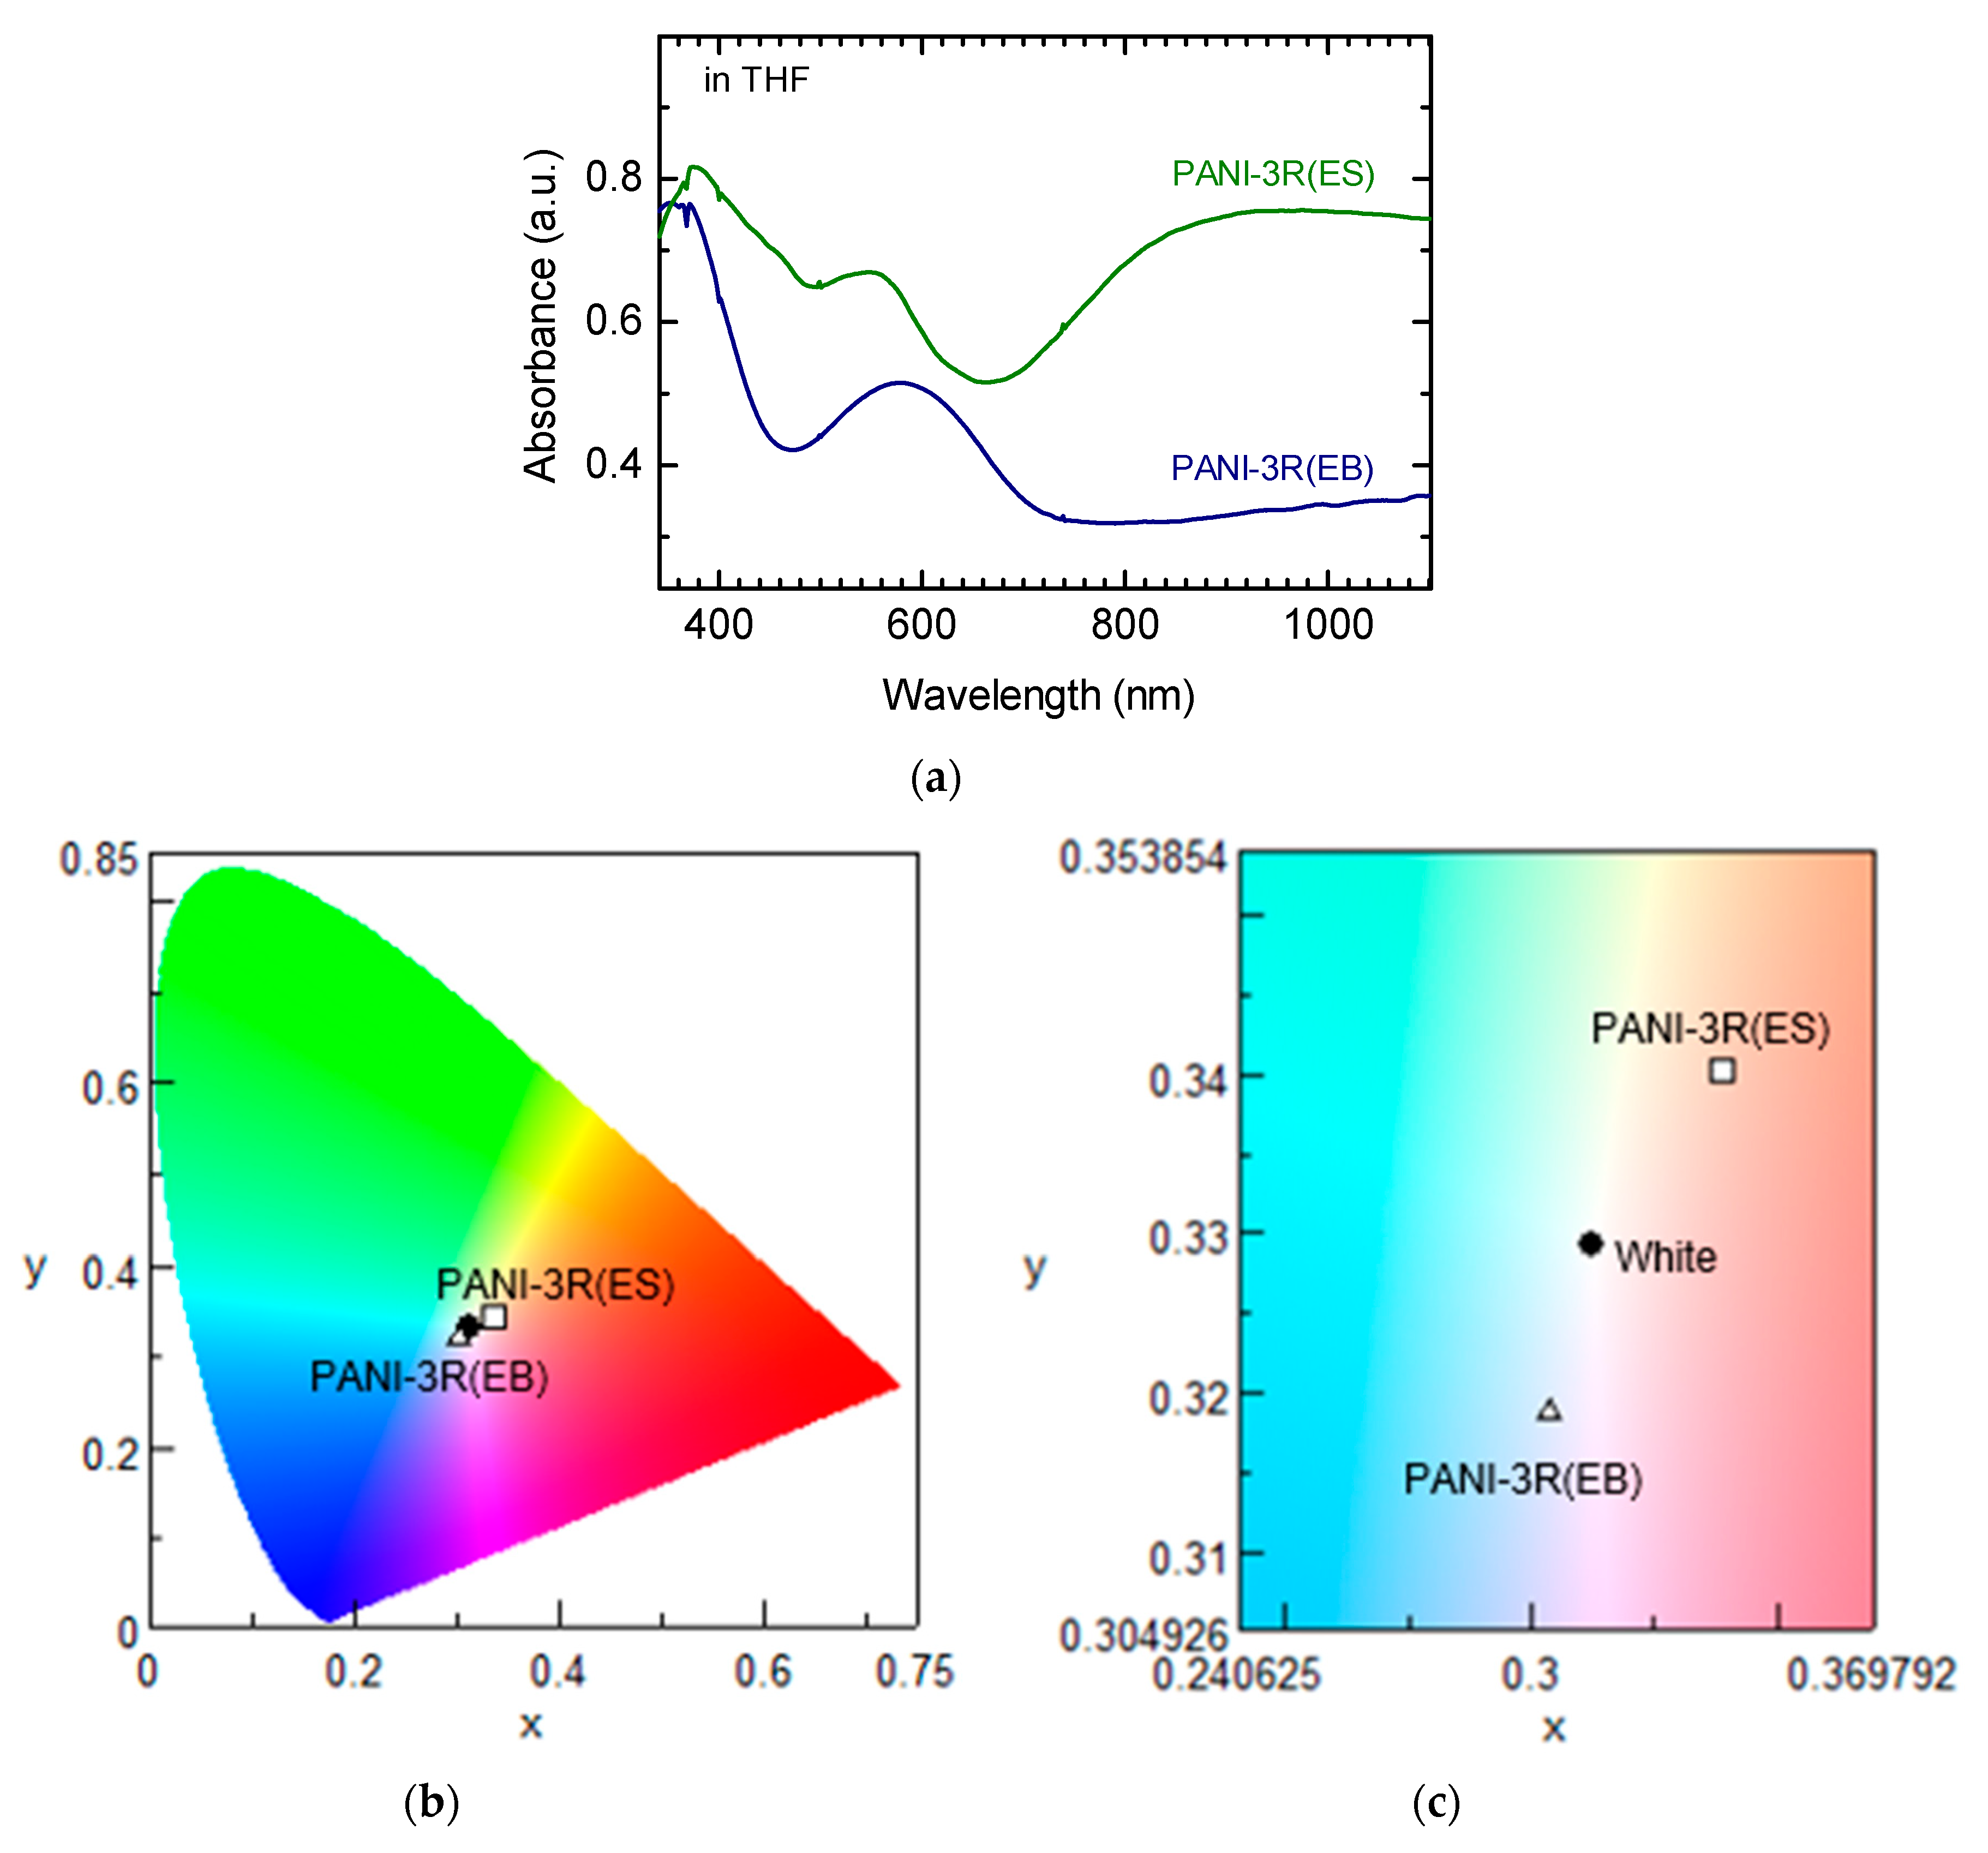
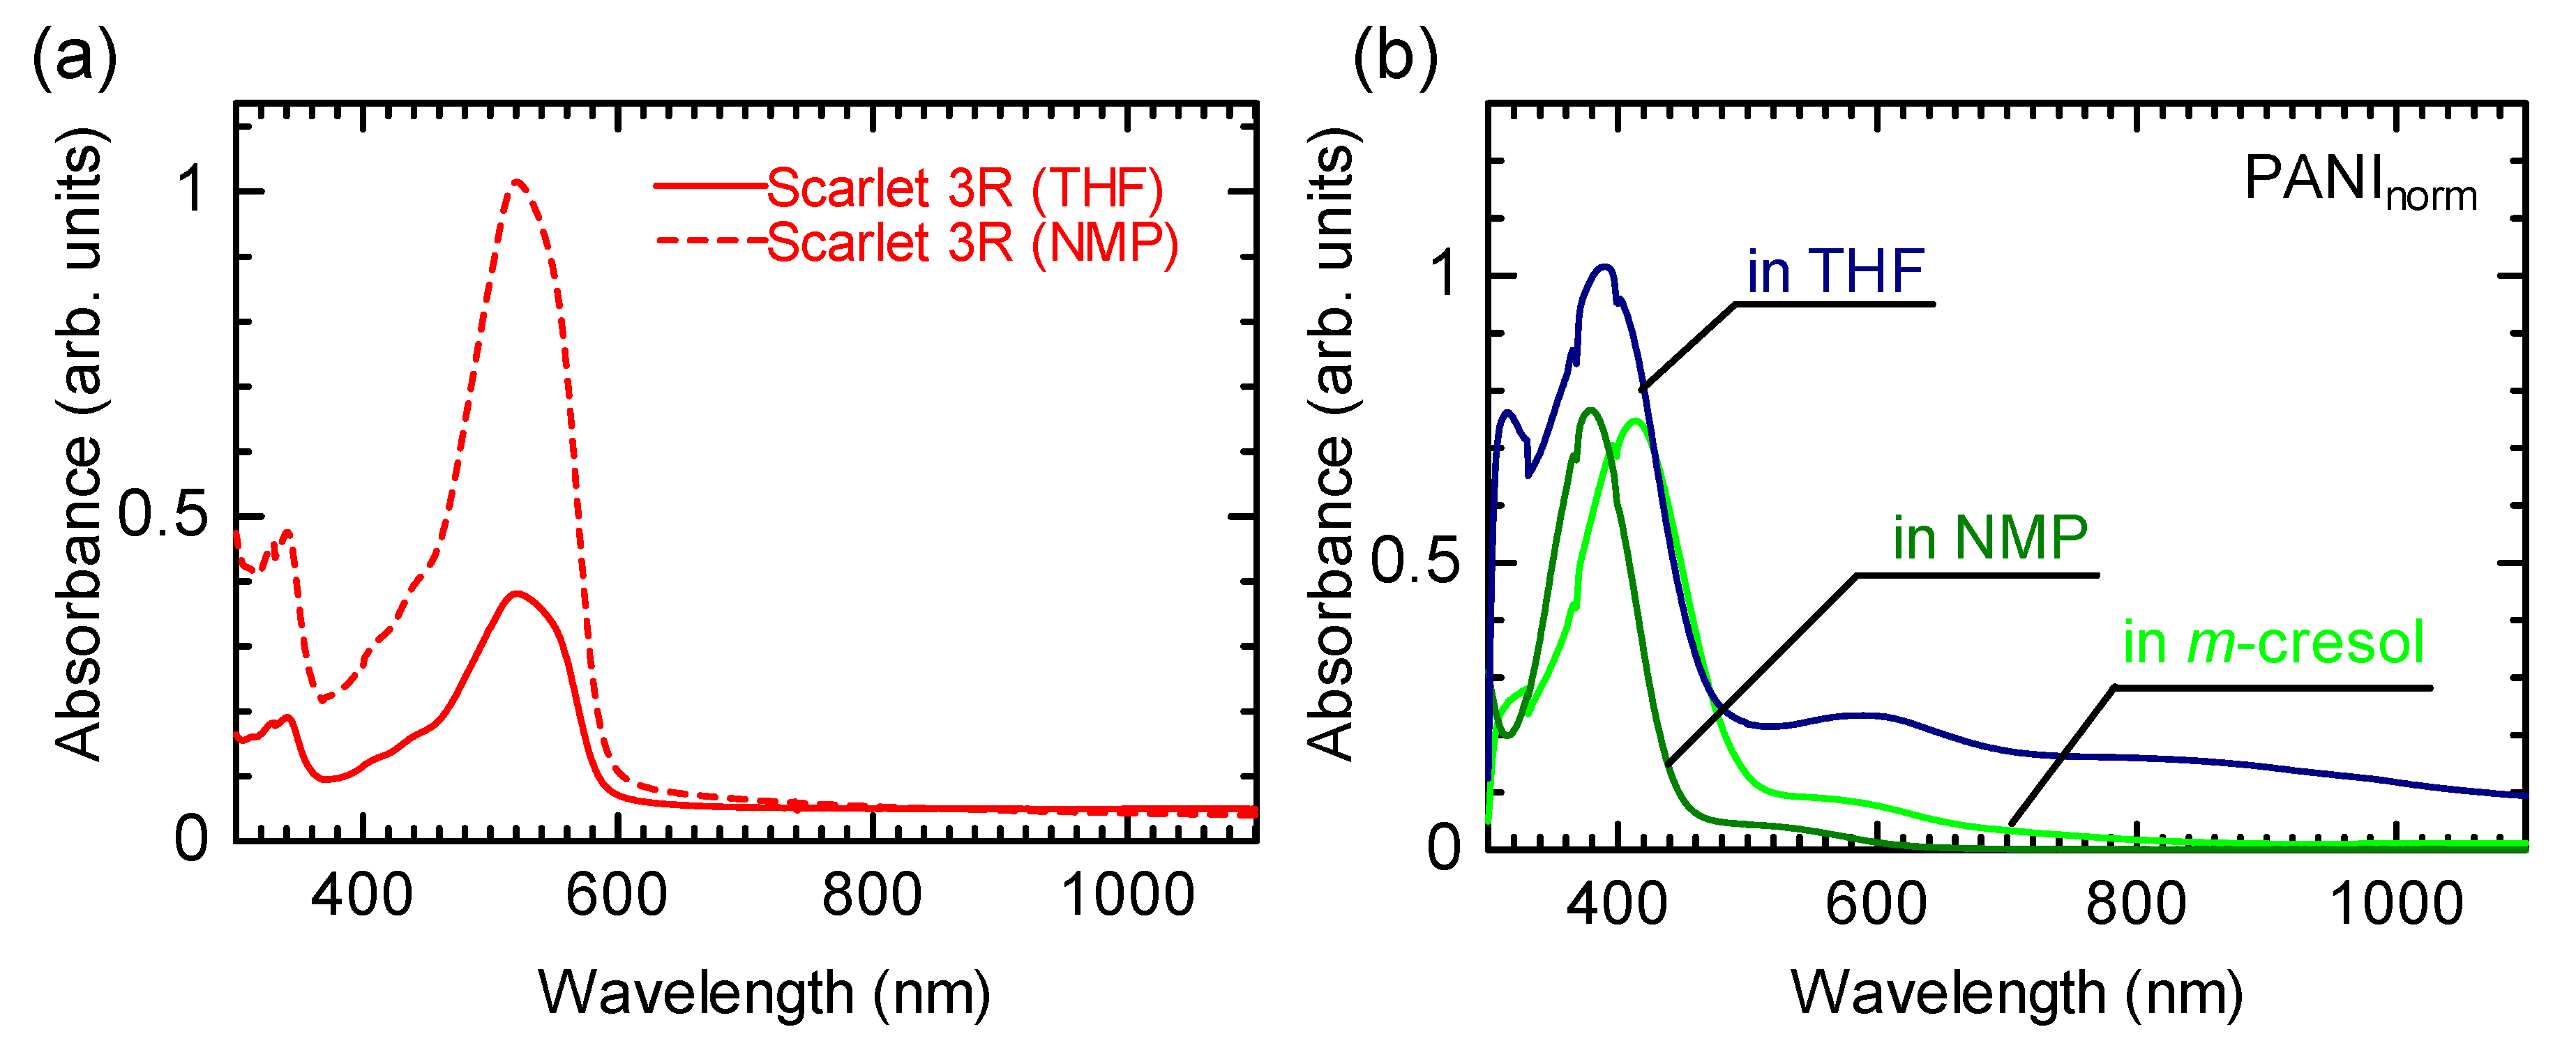
3.3. UV–Vis
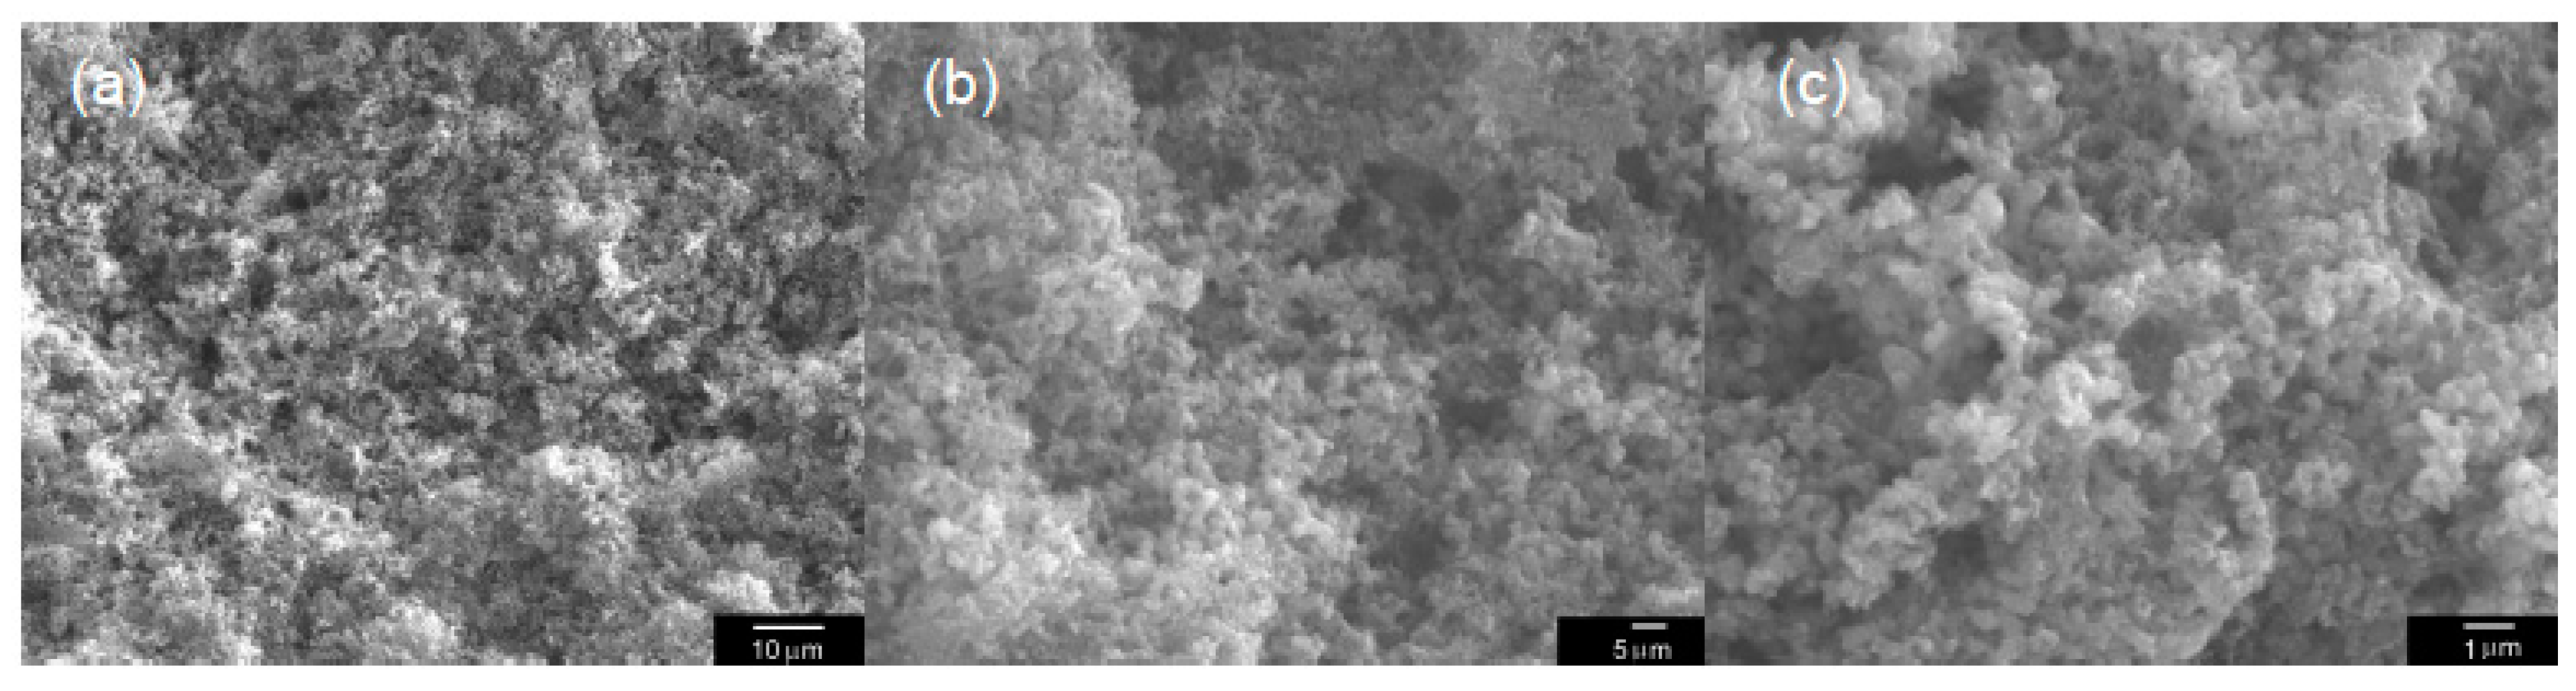
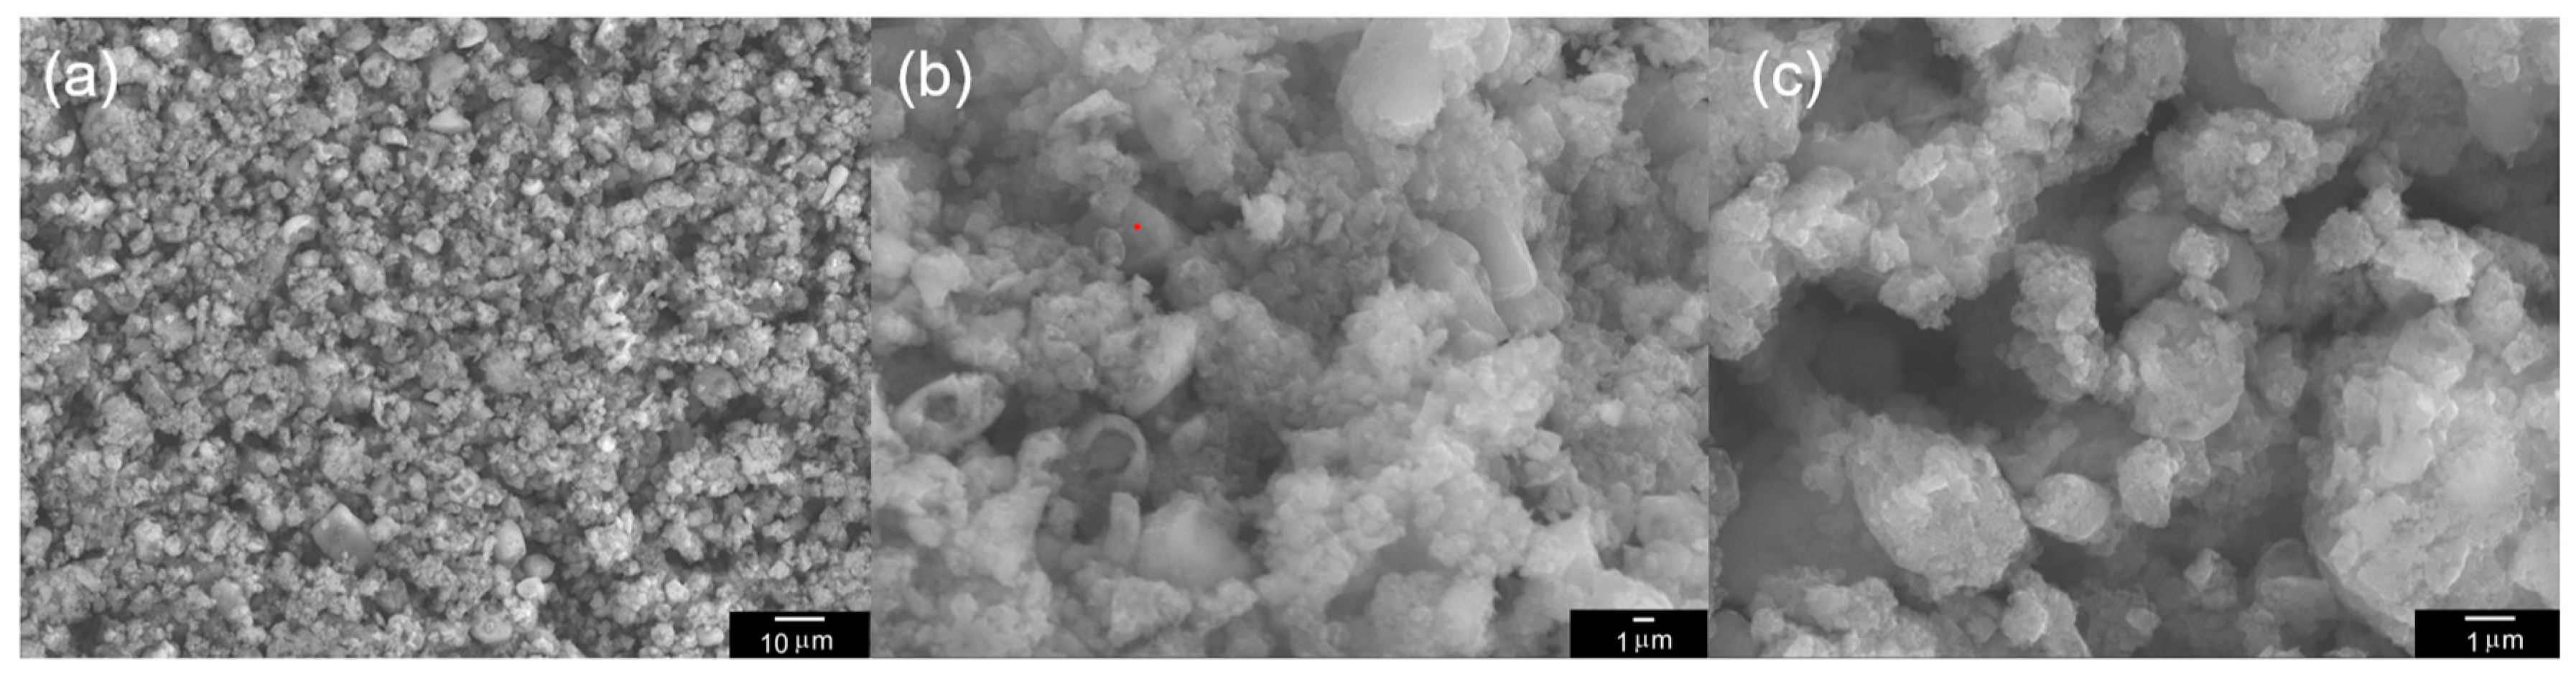
3.4. Scanning Electron Microscopy
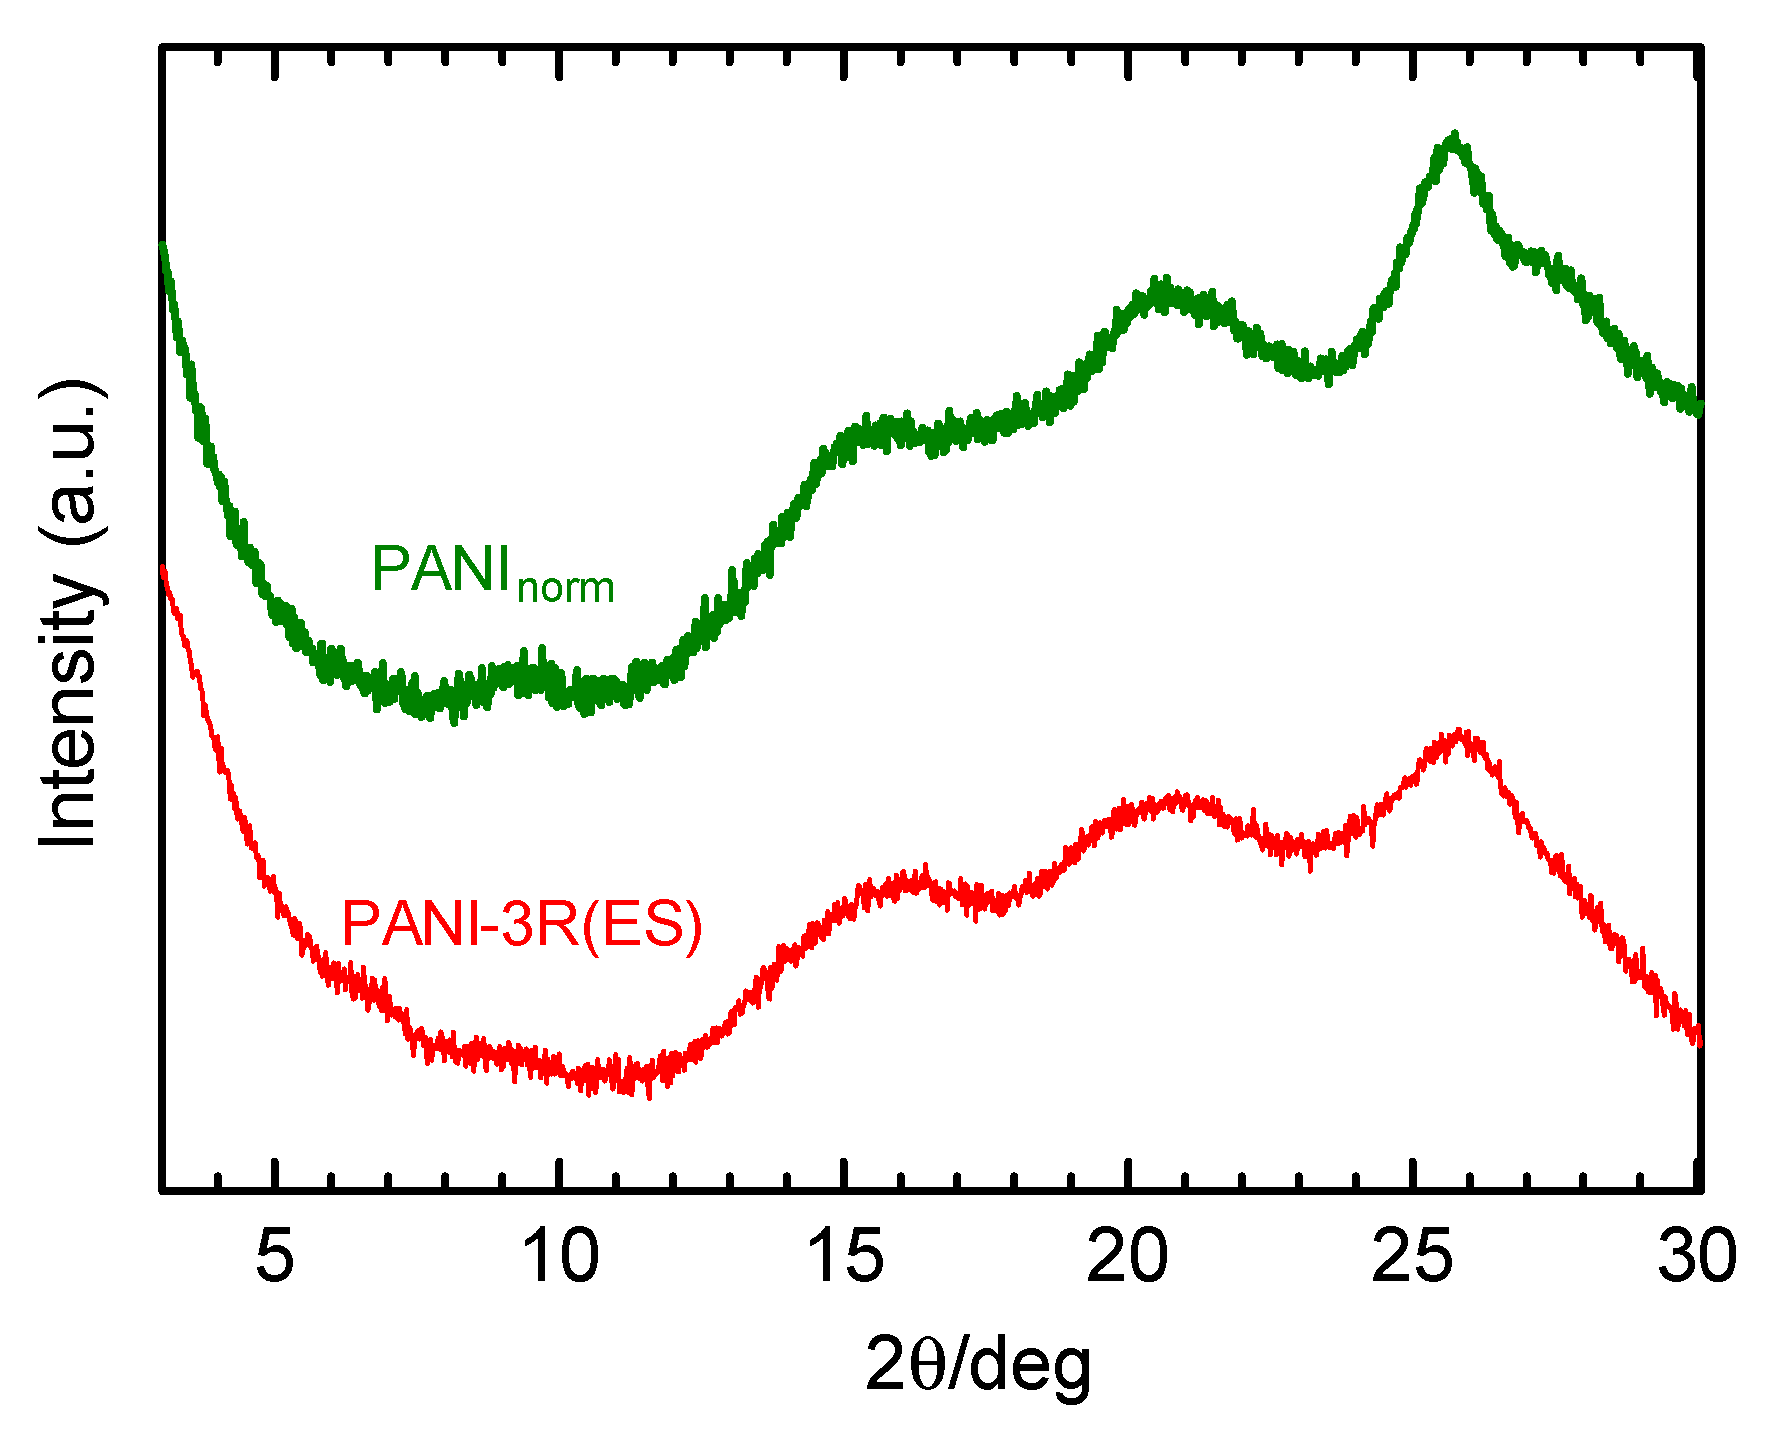
3.5. XRD
3.6. Thermogravimetric Analysis
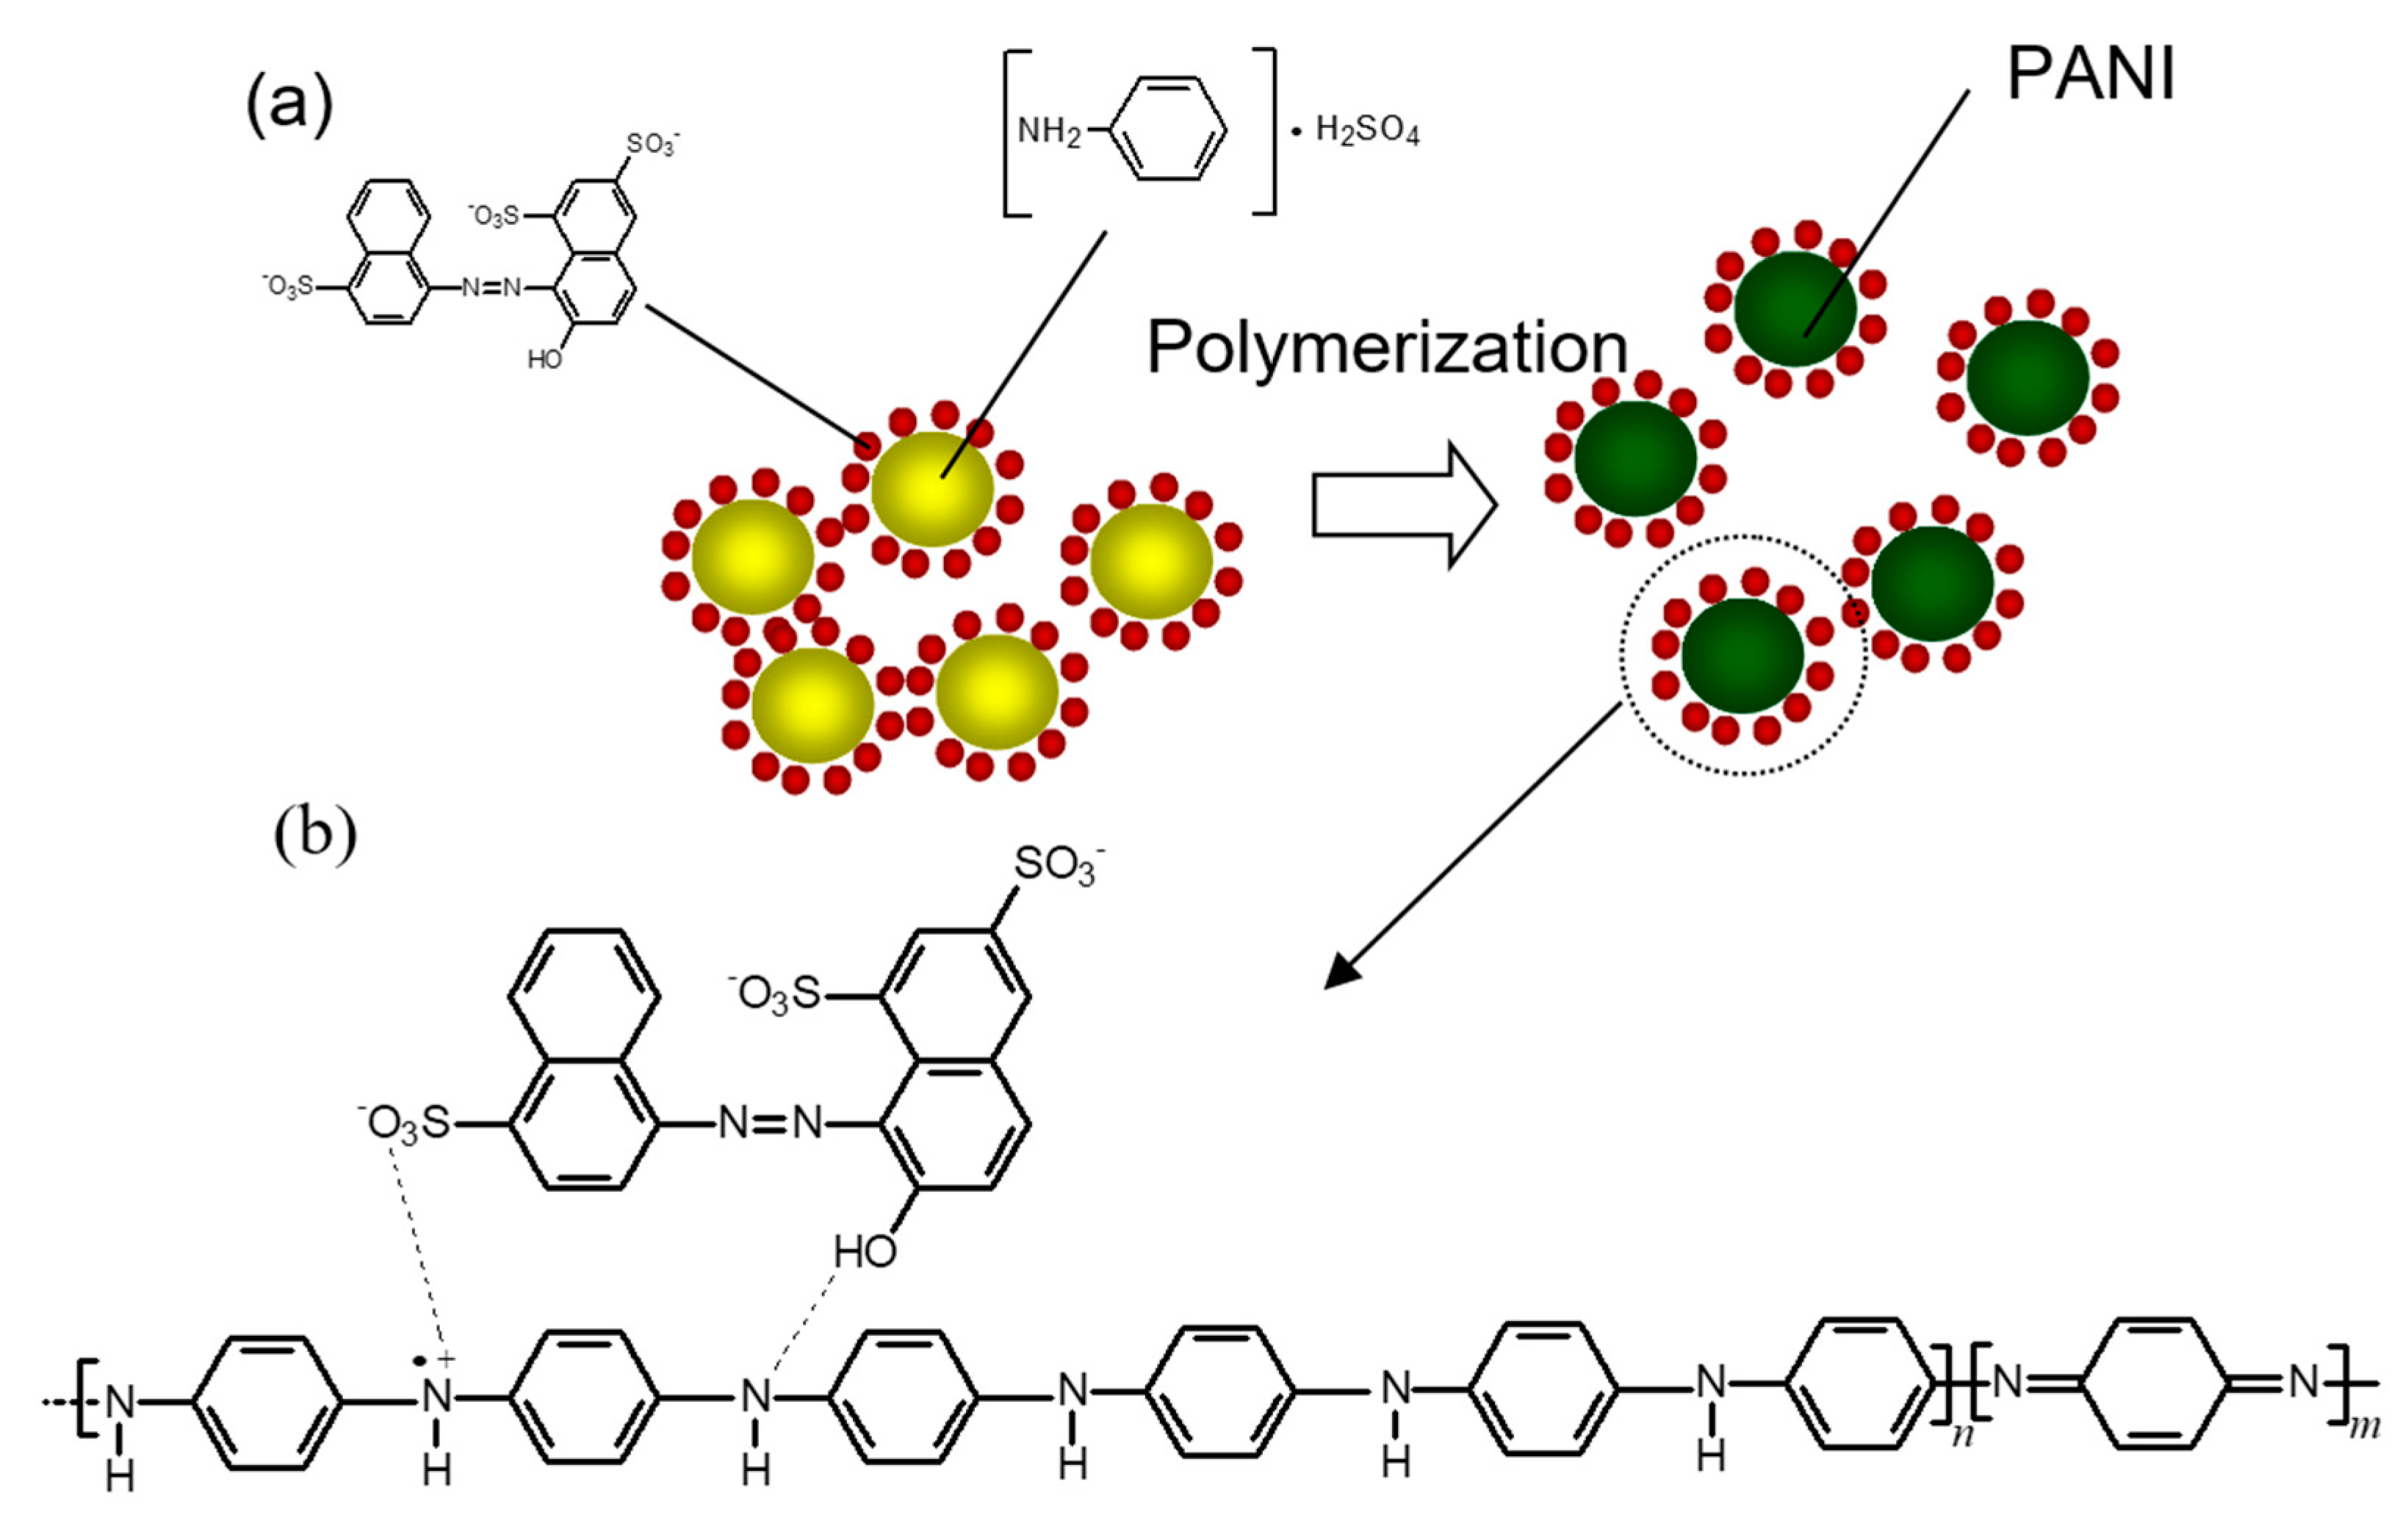
3.7. Proposed Structure
4. Conclusions
Author Contributions
Funding
Acknowledgments
Conflicts of Interest
References
- Zare, E.N.; Motahari, A.; Sillanpää, M. Nanoadsorbents based on conducting polymer nanocomposites with main focus on polyaniline and its derivatives for removal of heavy metal ions/dyes: A review. Env. Res. 2018, 162, 173–195. [Google Scholar] [CrossRef] [PubMed]
- Liu, S.; Ma, Y.; Cui, M.; Luo, X. Enhanced electrochemical biosensing of alpha-fetoprotein based on three-dimensional macroporous conducting polymer polyaniline. Sens. Act. B Chem. 2018, 255, 2568–2574. [Google Scholar] [CrossRef]
- Zhang, D.; Wang, D.; Zong, X.; Dong, G.; Zhang, Y. High-performance QCM humidity sensor based on graphene oxide/tin oxide/polyaniline ternary nanocomposite prepared by in-situ oxidative polymerization method. Sens. Act. B Chem. 2018, 262, 531–541. [Google Scholar] [CrossRef]
- Gu, H.; Zhang, H.; Lin, J.; Shao, Q.; Young, D.P.; Sun, L.; Shen, T.D.; Guo, Z. Large negative giant magnetoresistance at room temperature and electrical transport in cobalt ferrite-polyaniline nanocomposites. Polymer 2018, 143, 324–330. [Google Scholar] [CrossRef]
- Xu, X.; Fu, Q.; Gu, H.; Guo, Y.; Zhou, H.; Zhang, J.; Pan, D.; Wu, S.; Dong, M.; Guo, Z. Polyaniline crystalline nanostructures dependent negative permittivity metamaterials. Polymer 2020, 188, 122129. [Google Scholar] [CrossRef]
- Gu, H.; Xu, X.; Cai, J.; Wei, S.; Wei, H.; Liu, H.; Young, D.P.; Shao, Q.; Wu, S.; Ding, T.; et al. Controllable organic magnetoresistance in polyaniline coated poly(p-phenylene-2,6-benzobisoxazole) short fibers. Chem. Commun. 2019, 55, 10068–10071. [Google Scholar] [CrossRef] [PubMed]
- Shah, A.H.A.; Shaheen, S.; Kamran, M.; Seema, H.; Ullah, R.; Bilal, S. Synthesis of soluble and highly thermally stable polyaniline- titanium dioxide composite via inverse emulsion polymerization. J. Chem. Soc. Pak. 2019, 41, 921–931. [Google Scholar]
- Shah, A.H.A.; Kamran, M.; Bilal, S.; Ullah, R. Cost effective chemical oxidative synthesis of soluble and electroactive polyaniline salt and its application as anticorrosive agent for steel. Materials 2019, 12, 1527. [Google Scholar] [CrossRef] [PubMed]
- Tang, J.; Jing, X.; Wang, B.; Wang, F. Infrared spectra of soluble polyaniline. Synt. Met. 1988, 24, 231–238. [Google Scholar] [CrossRef]
- MacDiarmid, A.G.; Epstein, A.J. Secondary doping in polyaniline. Synt. Met. 1995, 69, 85–92. [Google Scholar] [CrossRef]
- Tigelaar, D.M.; Lee, W.; Bates, K.A.; Saprigin, A.; Prigodin, V.N.; Cao, X.; Nafie, L.A.; Platz, M.S.; Epstein, A.J. Role of solvent and secondary doping in polyaniline films doped with chiral camphorsulfonic acid: Preparation of a chiral metal. Chem. Mater. 2002, 14, 1430–1438. [Google Scholar] [CrossRef]
- Soares, B.; Leyva, M.E.; Barra, G.M.O.; Khastgir, D. Dielectric behavior of polyaniline synthesized by different techniques. Eur. Polym. J. 2006, 42, 676–686. [Google Scholar] [CrossRef]
- Mazzeu, M.A.C.; Faria, L.K.; Cardoso, A.M.; Gama, A.M.; Baldan, M.R.; Goncalves, E.S. Structural and morphological characteristics of polyaniline synthesized in pilot scale. J. Aerosp. Technol. Manag. São José Dos Campos. 2017, 9, 39–47. [Google Scholar] [CrossRef]
- Kannusamy, P.; Sivalingam, T. Synthesis of porous chitosan–polyaniline/ZnO hybrid composite and application for removal of reactive orange 16 dye. Coll. Surf. B Bioint. 2013, 108, 229–238. [Google Scholar] [CrossRef] [PubMed]
- Su, S.-J.; Kuramoto, N. Synthesis of processable polyaniline complexed with anionic surfactant and its conducting blends in aqueous and organic system. Synth. Met. 2000, 108, 121–126. [Google Scholar] [CrossRef]


| PANI-3R(ES) (cm−1) | PANI-3R(EB) (cm−1) | Assignment |
|---|---|---|
| 3246 | 3246 | NH2 Str. |
| 1588 | 1561 | Str. of N=Q=N |
| 1503 | 1489 | Str. of N–B–N |
| 1498 | 1484 | Str. of benzene ring |
| 1374 | - | Str. of B–Q–B |
| 1336 | - | C-N str. in BQB, QBB, BBQ |
| 1144 | 1144 | B-N+H=Q, B–N+H–B |
| 1039 | 1041 | C–H in plane on 1,2,4-ring |
© 2020 by the authors. Licensee MDPI, Basel, Switzerland. This article is an open access article distributed under the terms and conditions of the Creative Commons Attribution (CC BY) license (http://creativecommons.org/licenses/by/4.0/).
Share and Cite
Yonehara, T.; Goto, H. Synthesis of Polyaniline/Scarlet 3R as a Conductive Polymer. Polymers 2020, 12, 579. https://doi.org/10.3390/polym12030579
Yonehara T, Goto H. Synthesis of Polyaniline/Scarlet 3R as a Conductive Polymer. Polymers. 2020; 12(3):579. https://doi.org/10.3390/polym12030579
Chicago/Turabian StyleYonehara, Takuya, and Hiromasa Goto. 2020. "Synthesis of Polyaniline/Scarlet 3R as a Conductive Polymer" Polymers 12, no. 3: 579. https://doi.org/10.3390/polym12030579
APA StyleYonehara, T., & Goto, H. (2020). Synthesis of Polyaniline/Scarlet 3R as a Conductive Polymer. Polymers, 12(3), 579. https://doi.org/10.3390/polym12030579