Development of Flexible and Conductive Immiscible Thermoplastic/Elastomer Monofilament for Smart Textiles Applications Using 3D Printing

 ,
,  , , and
Abstract
1. Introduction
2. Materials and Methods
2.1. Materials
2.2. Method
2.2.1. Design of Experiments
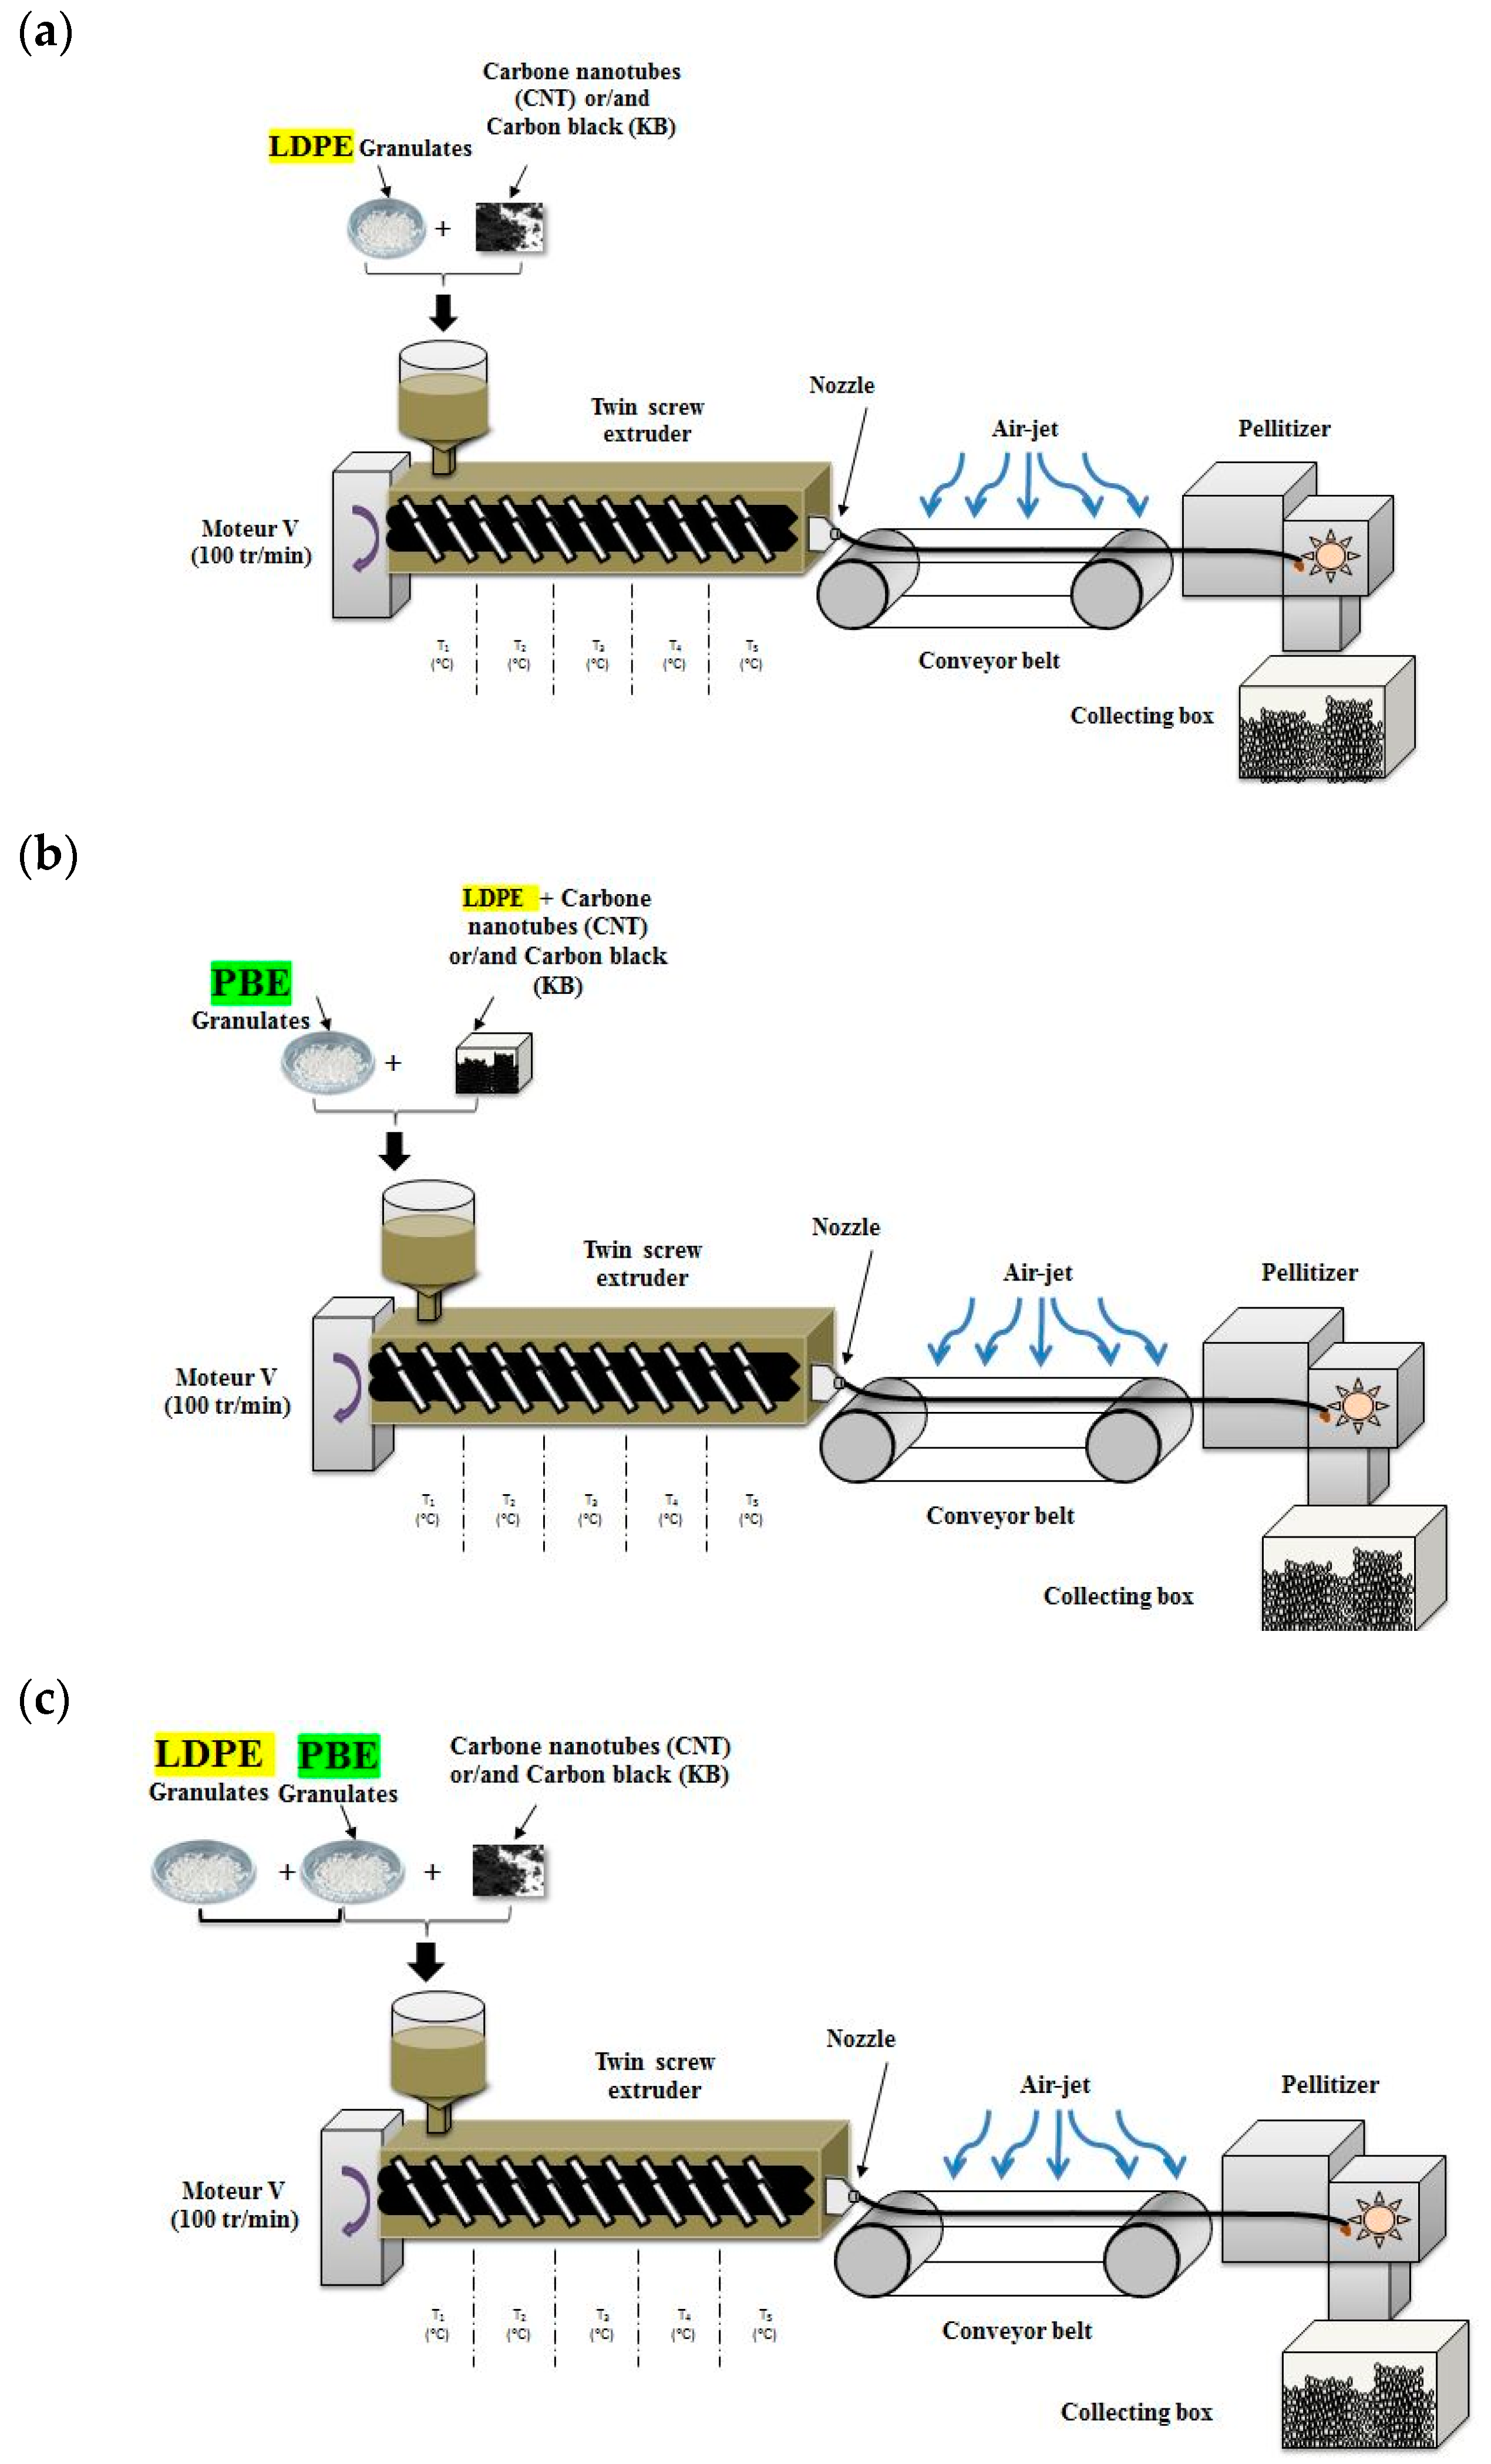
2.2.2. Preparation of the Oompounds
2.2.3. Rheological Measurements
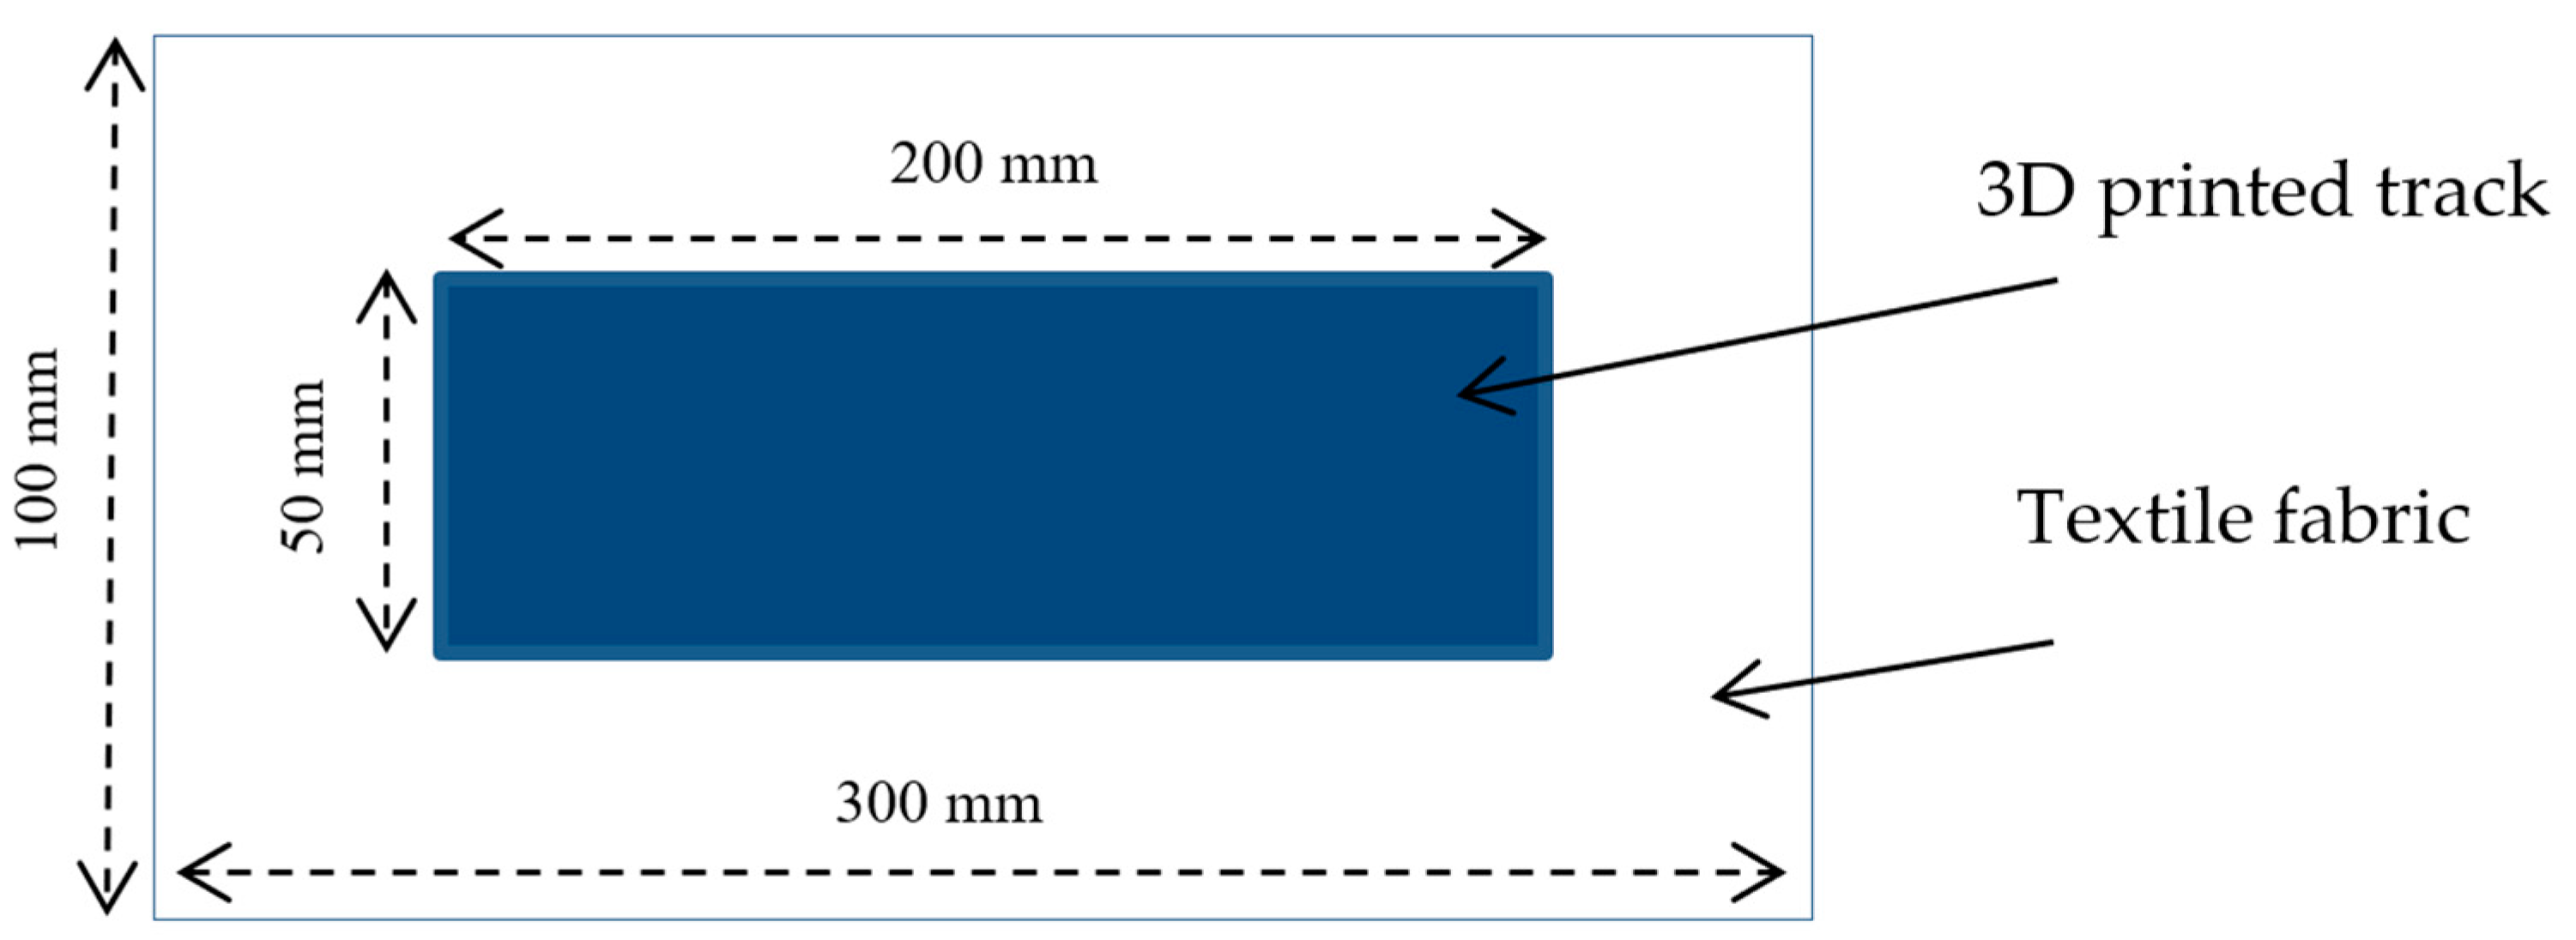
2.2.4. 3D Printing Process
2.2.5. Filler Location Prediction Based on Contact Angle and Wettability Coefficient Determination
- The wettability coefficient is lower than −1, which means that filler 1 is located in polymer B;
- The wettability coefficient is between −1 and 1, which means that filler 1 is found at the interface of the two polymers;
- The wettability coefficient is higher than 1, which means that filler 1 is in polymer A.
2.2.6. Thickness Measurement
2.2.7. Stress and Strain at Break
2.2.8. Morphology Analysis through Scanning Electron Microscopy (SEM)
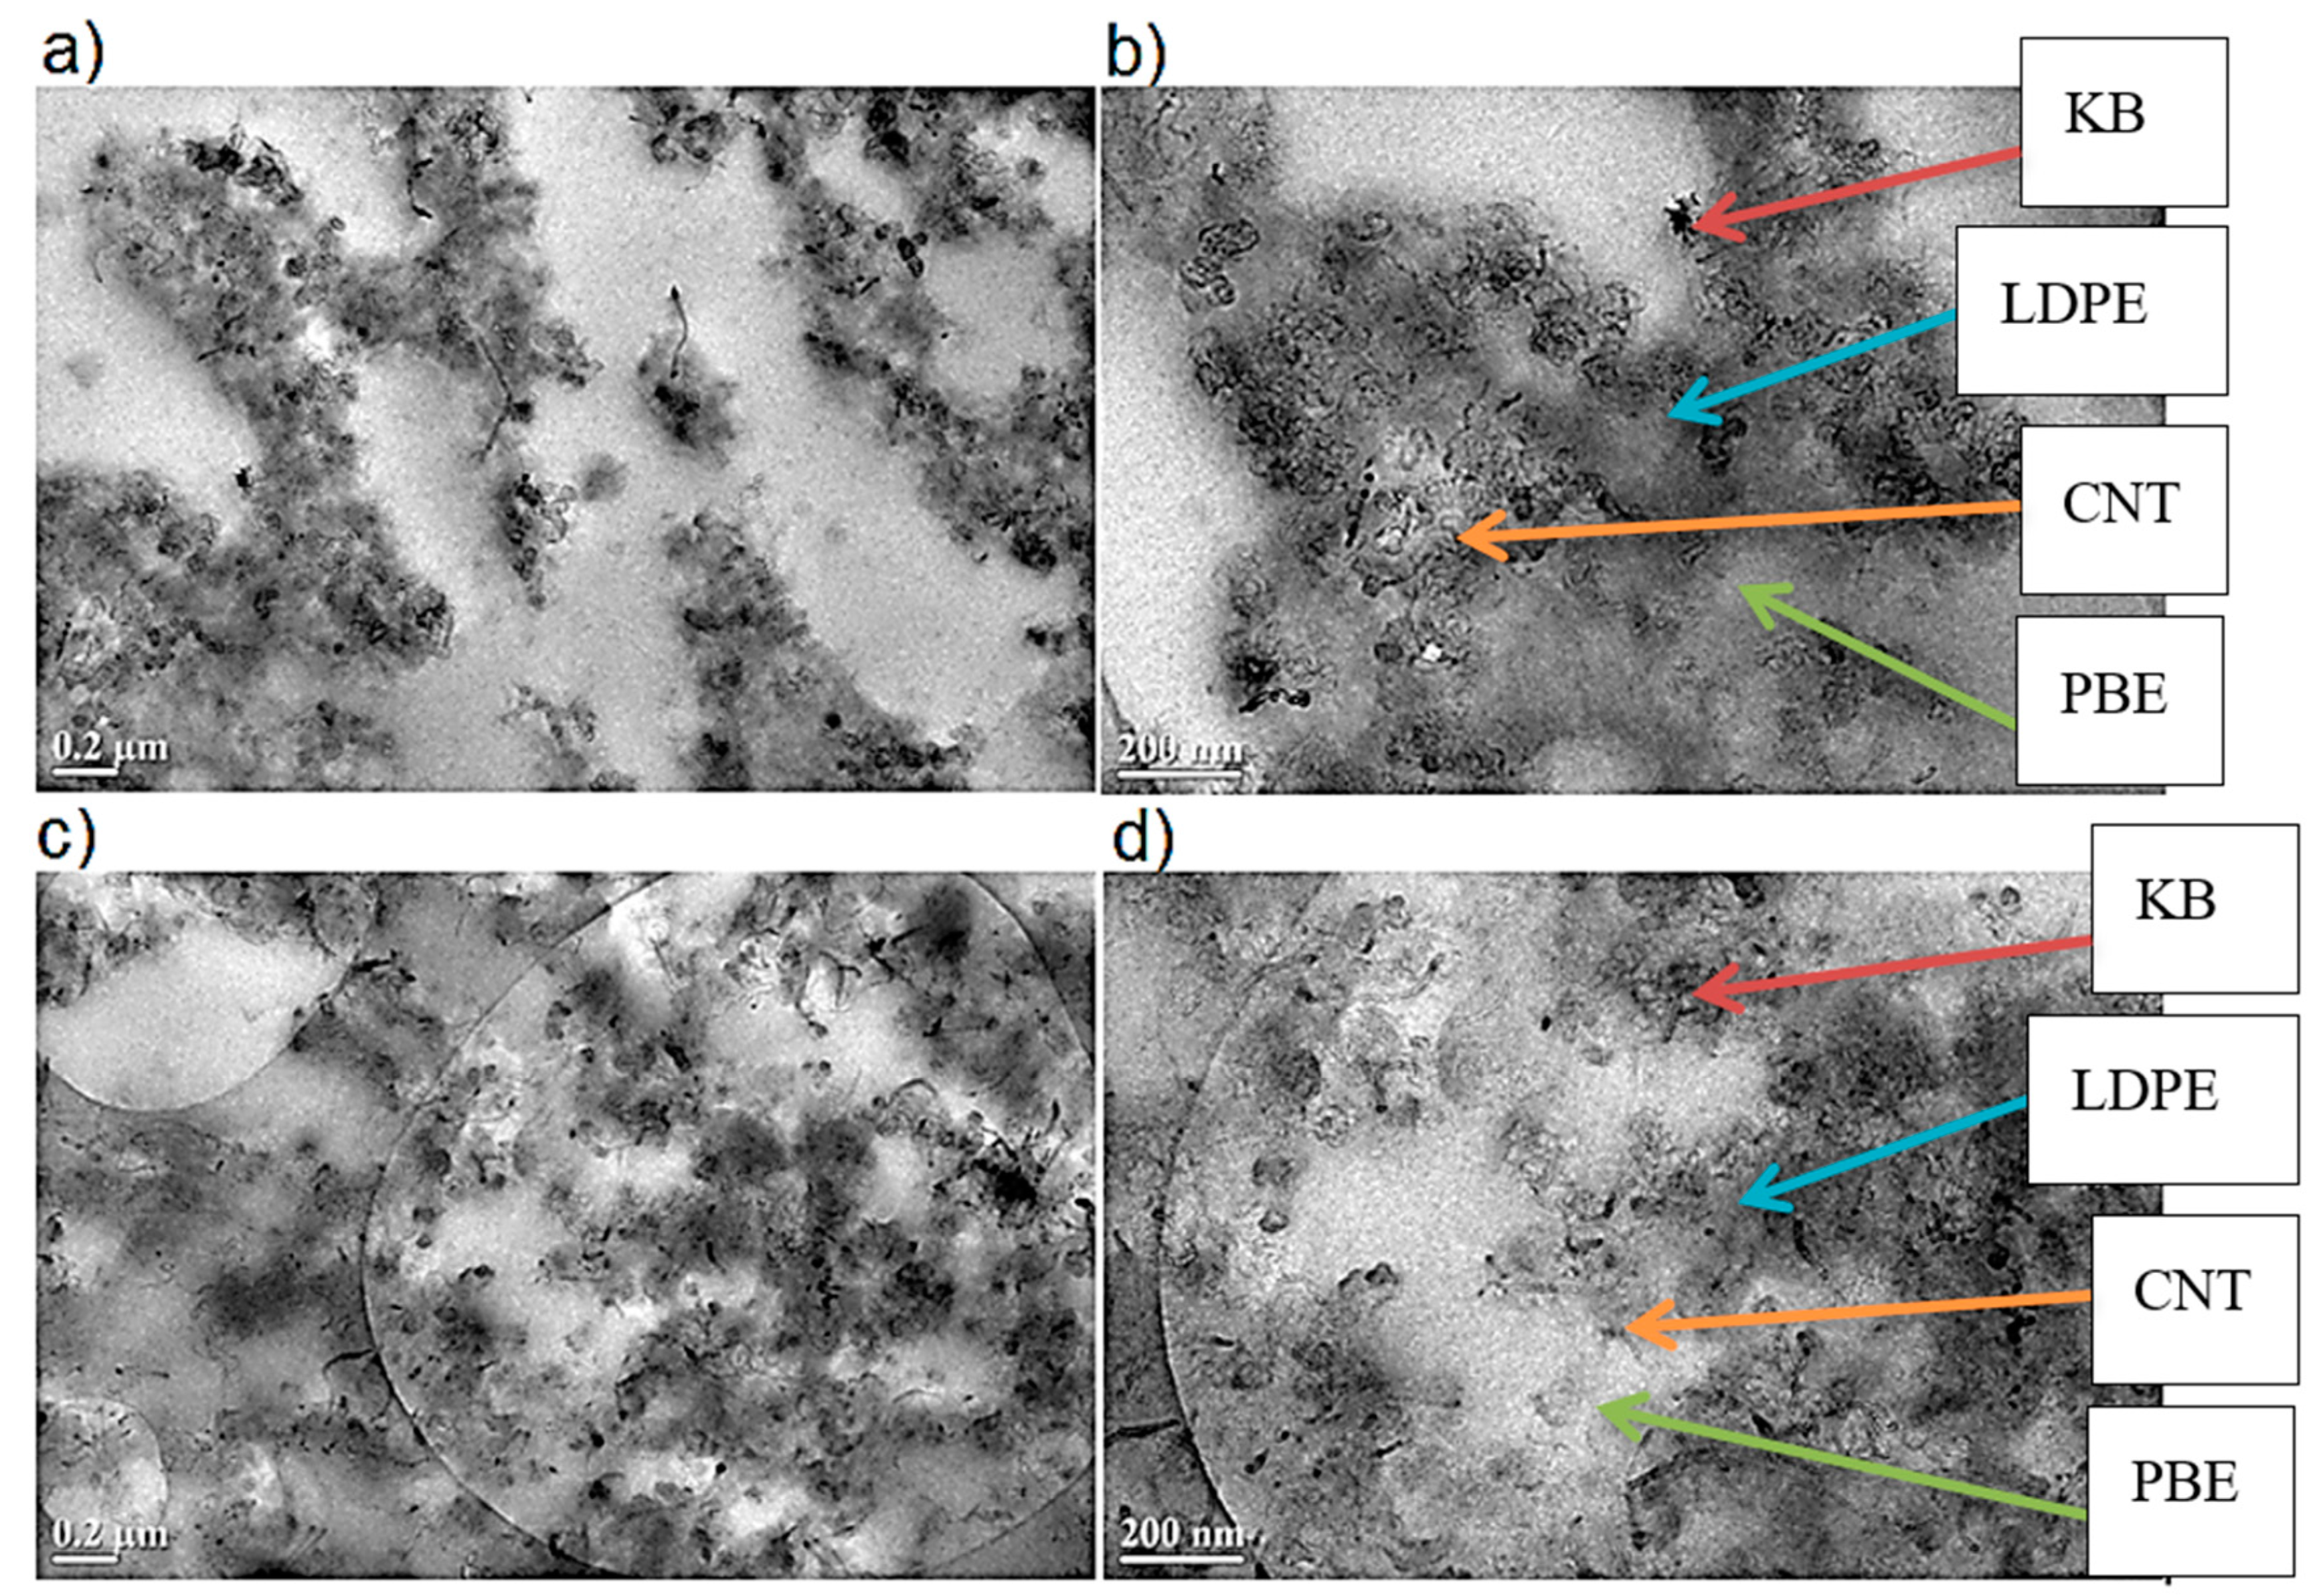
2.2.9. Morphology Analysis through Transmission Electron Microscopy (TEM)
2.2.10. Permanent, Elastic and Total Deformations
2.2.11. Thermal Properties through Differential Scanning Calorimetry (DSC)
2.2.12. Electrical Conductivity Measurement
3. Results
3.1. Analysis of Virgin LDPE/PBE Biphasic Polymer Blends
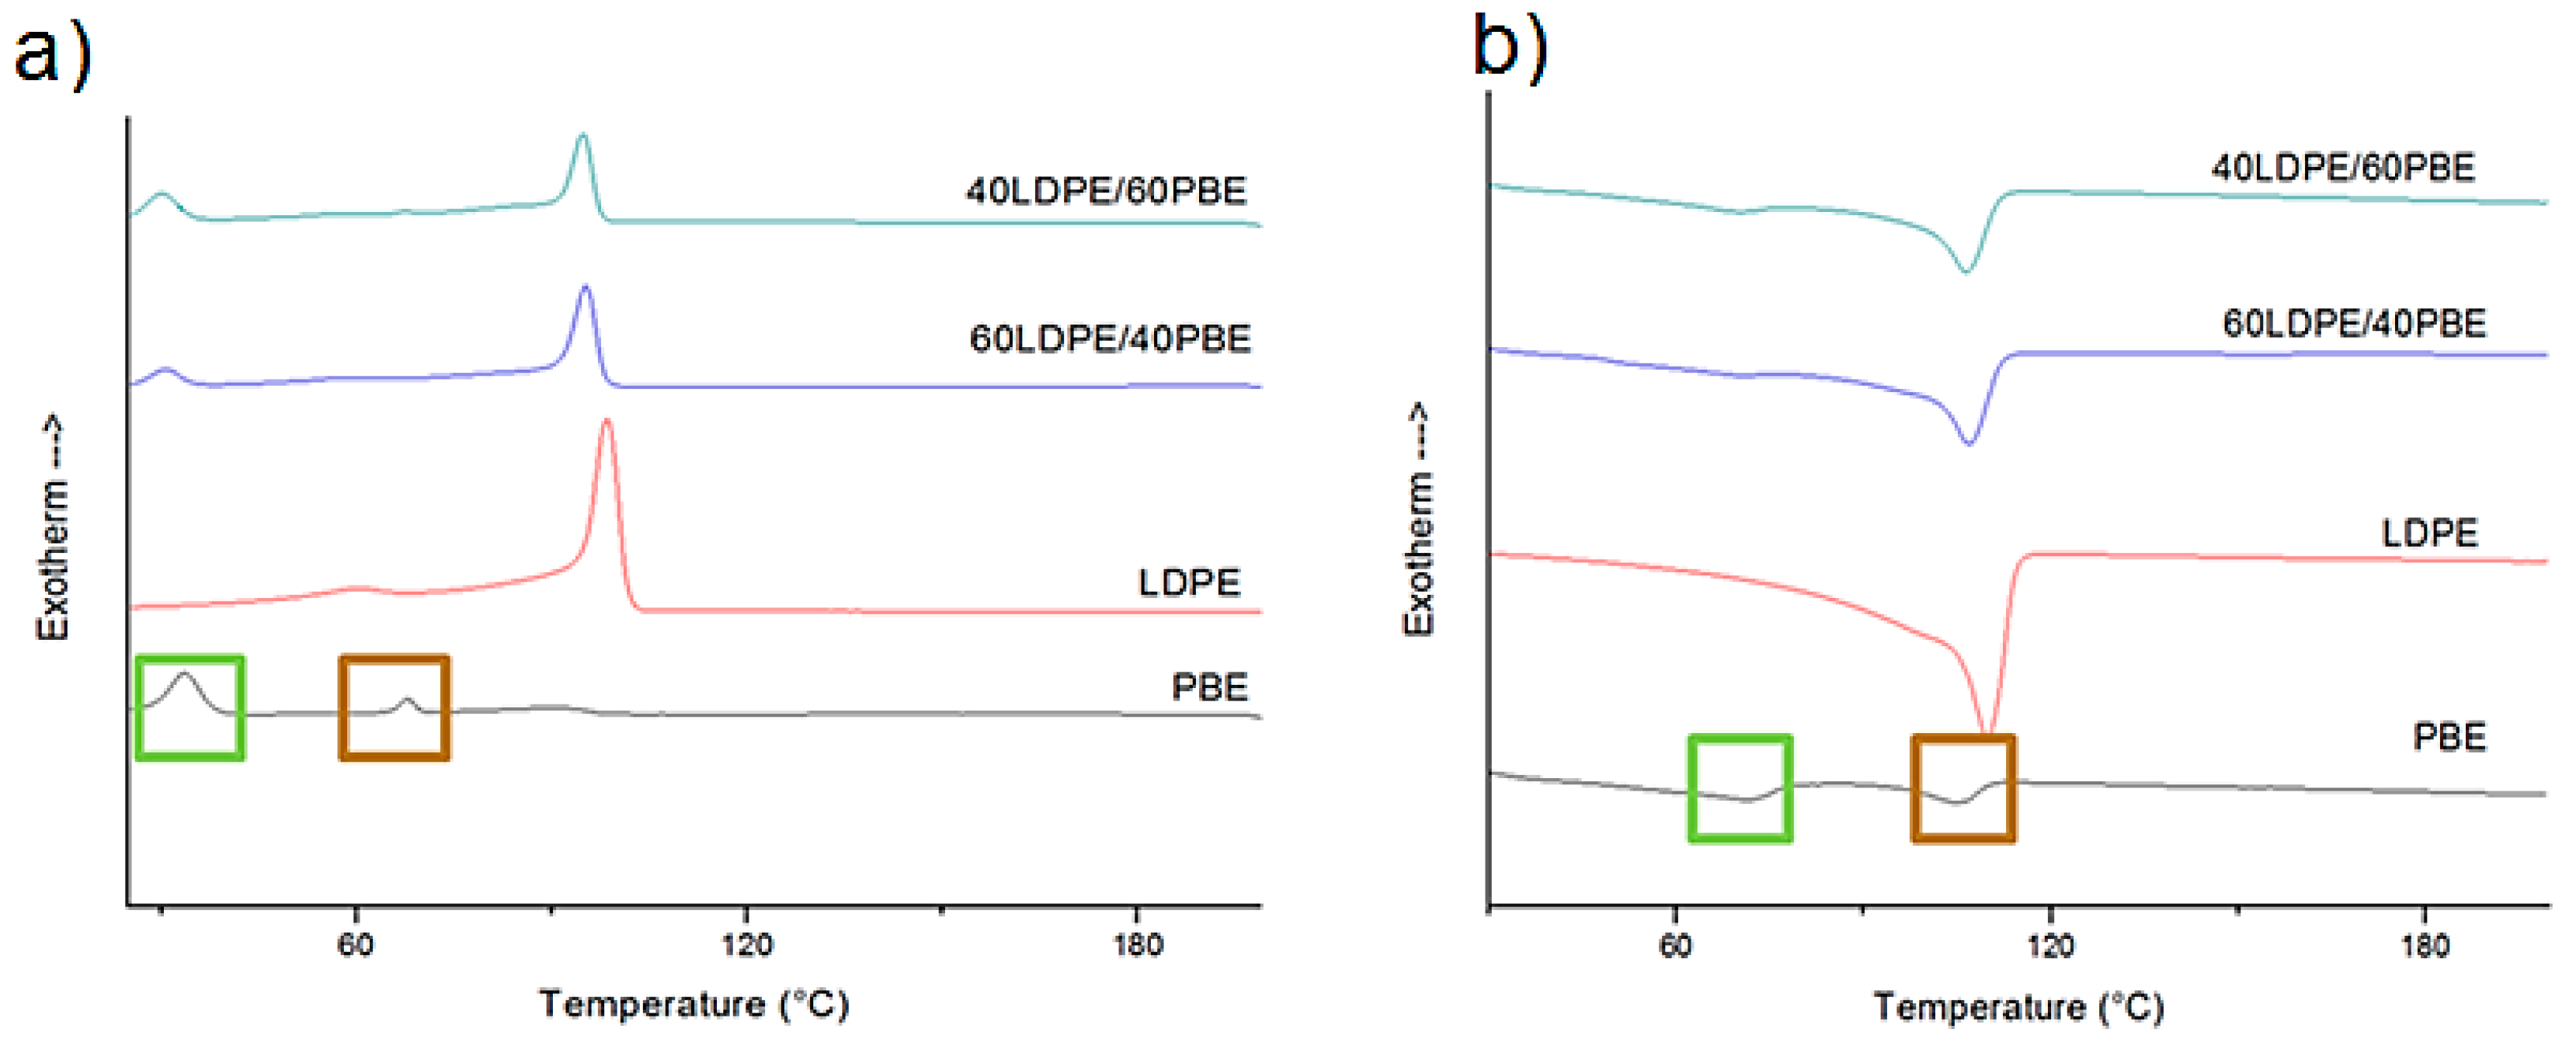
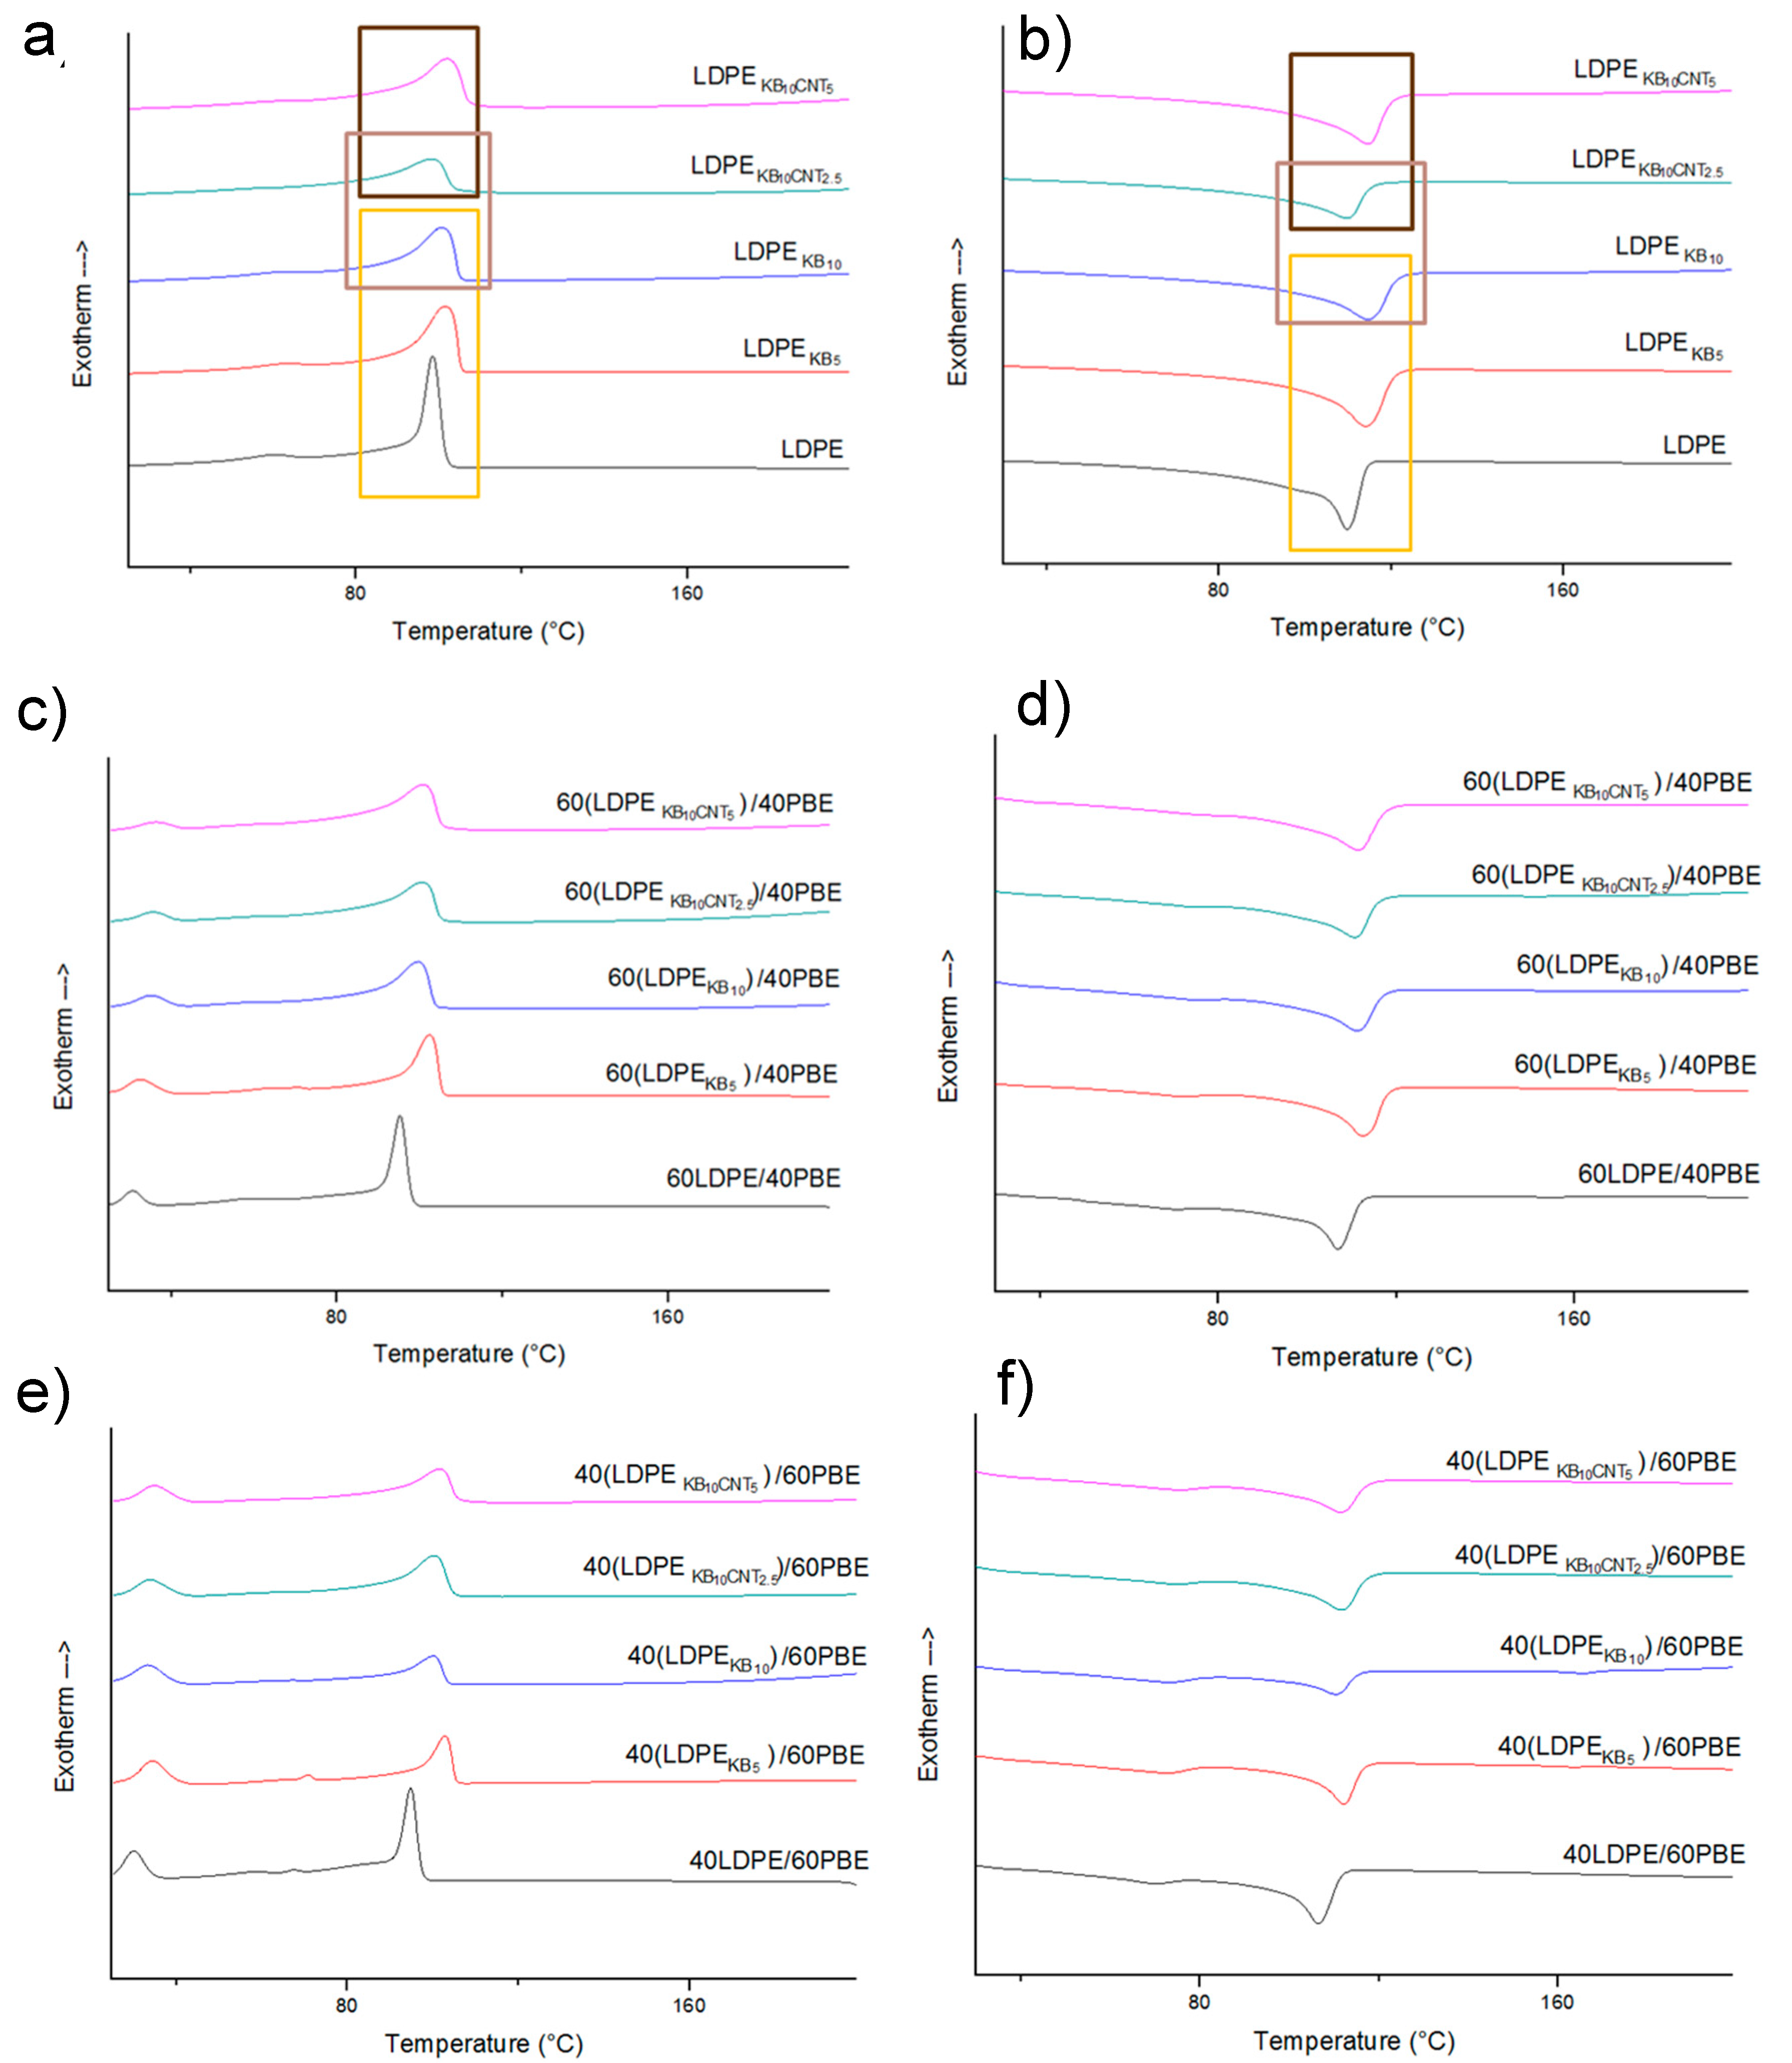
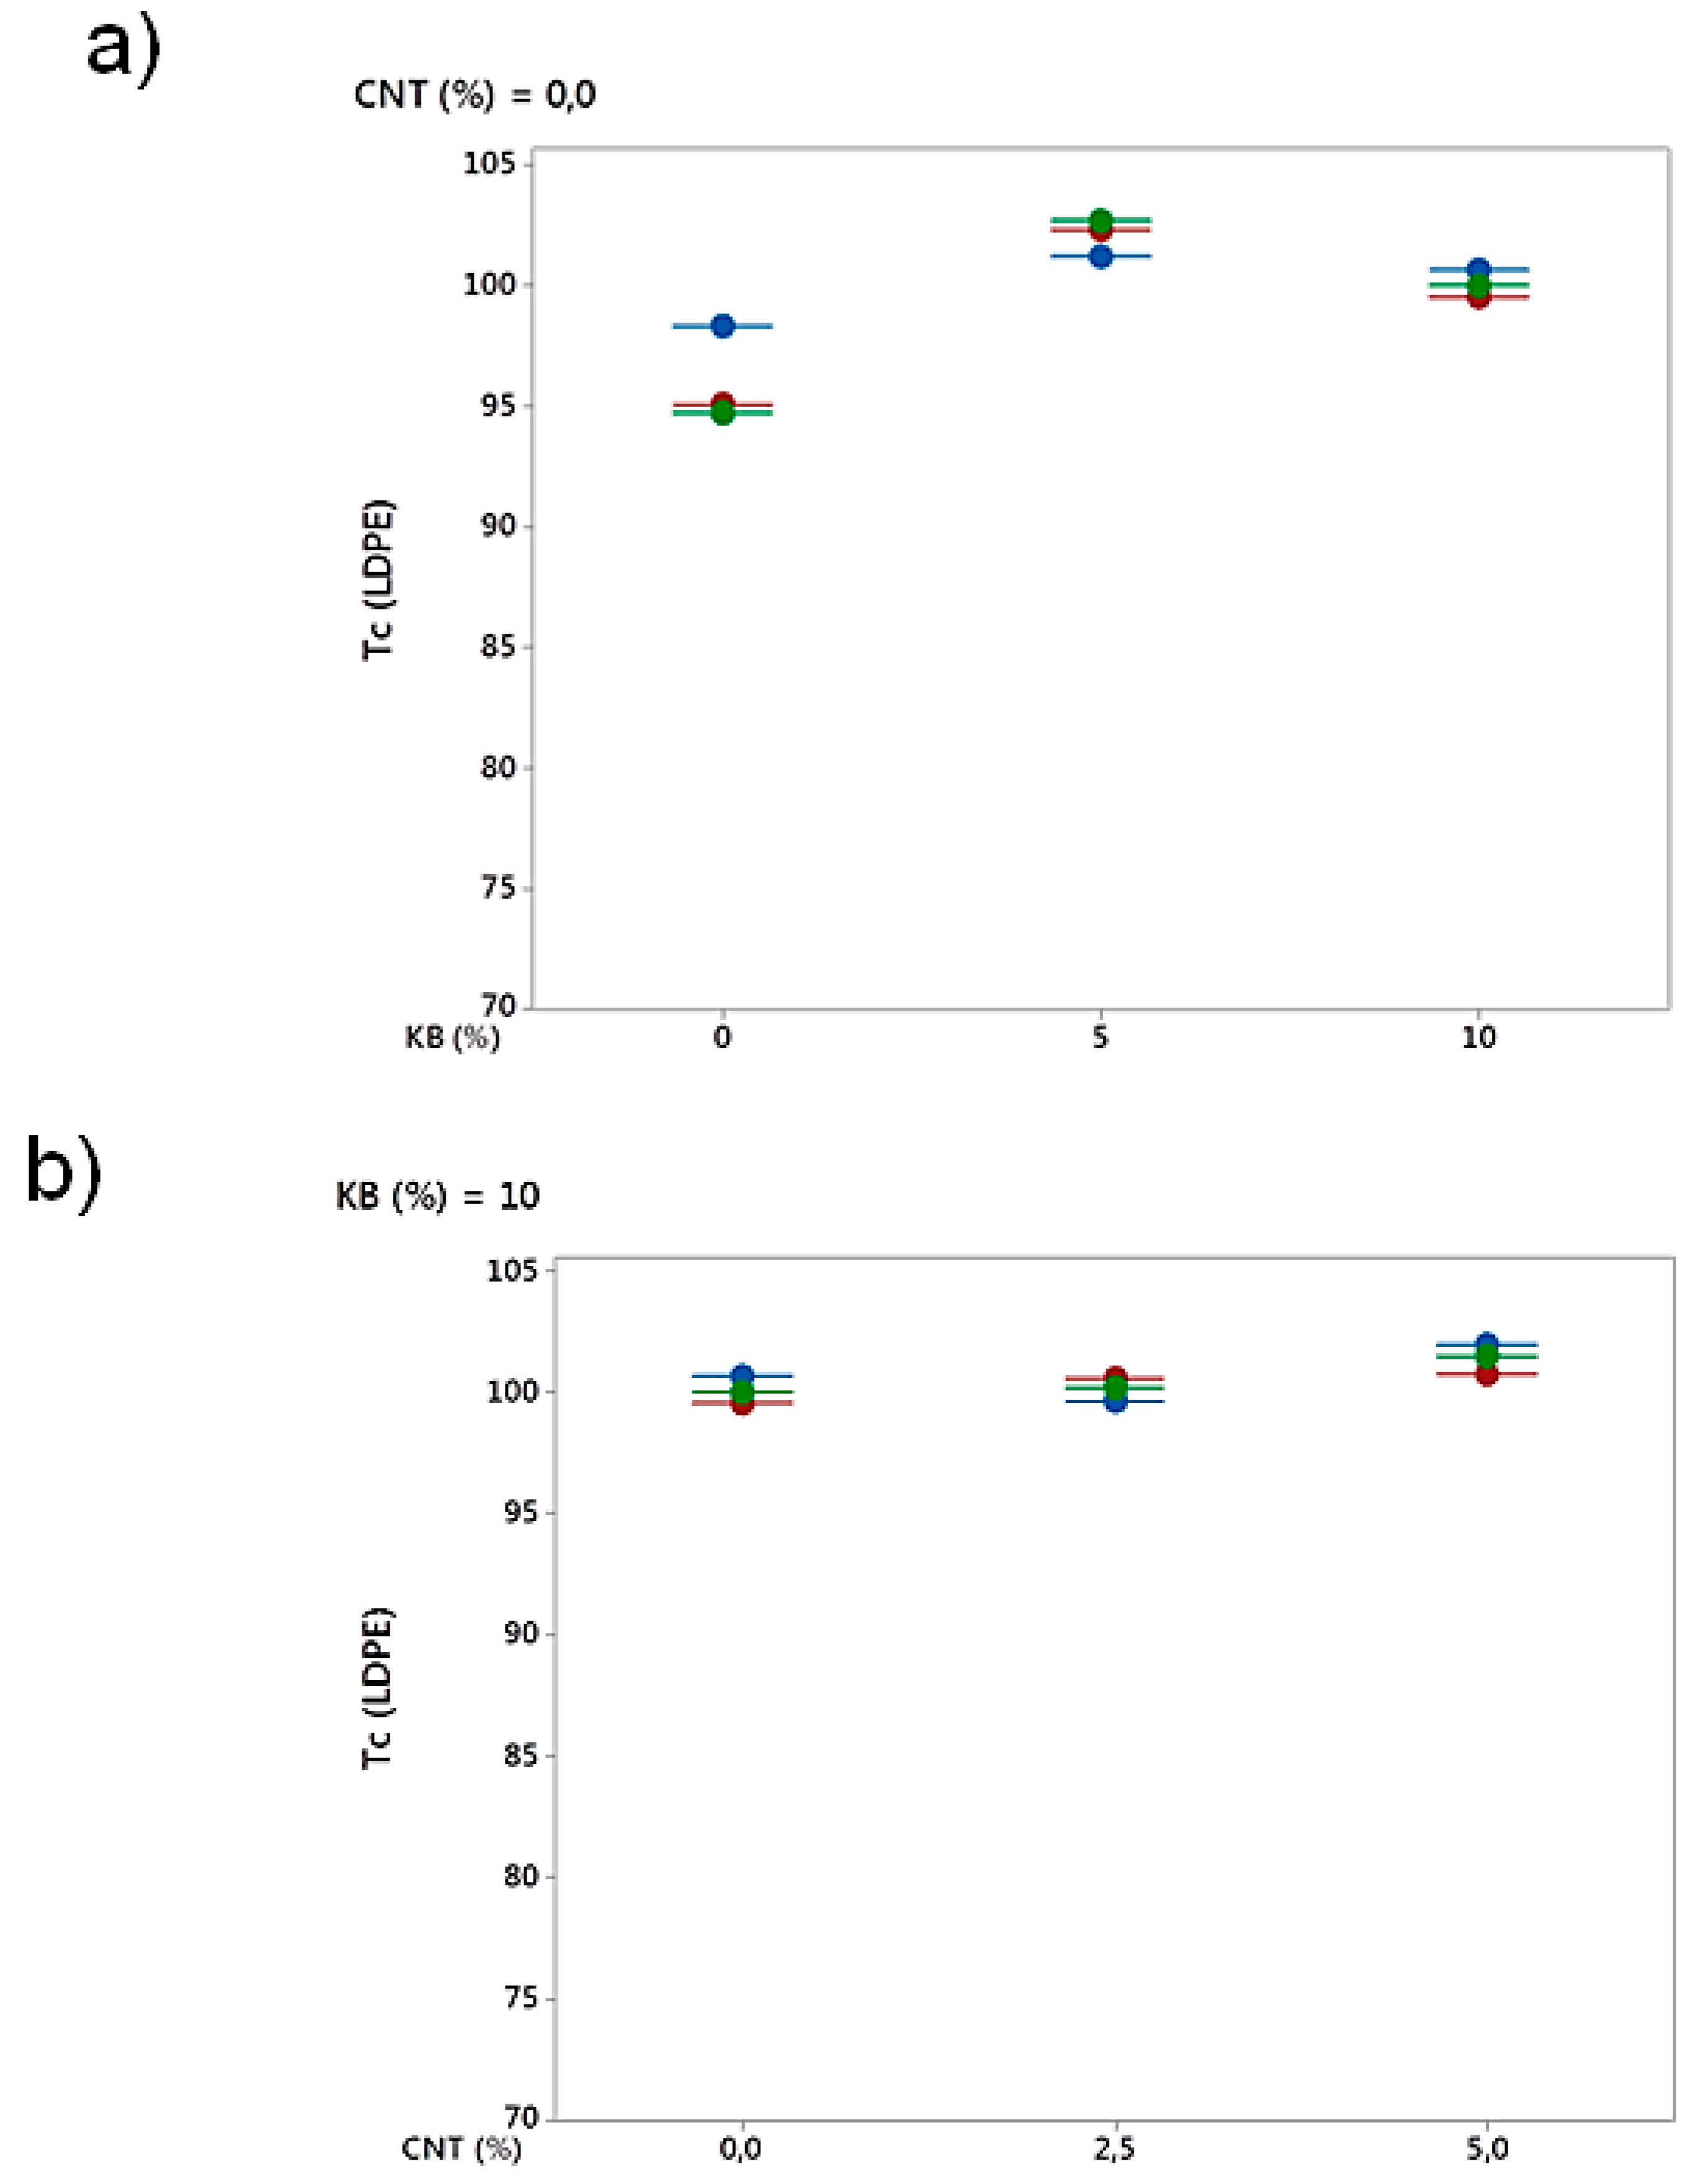
3.1.1. DSC Analysis
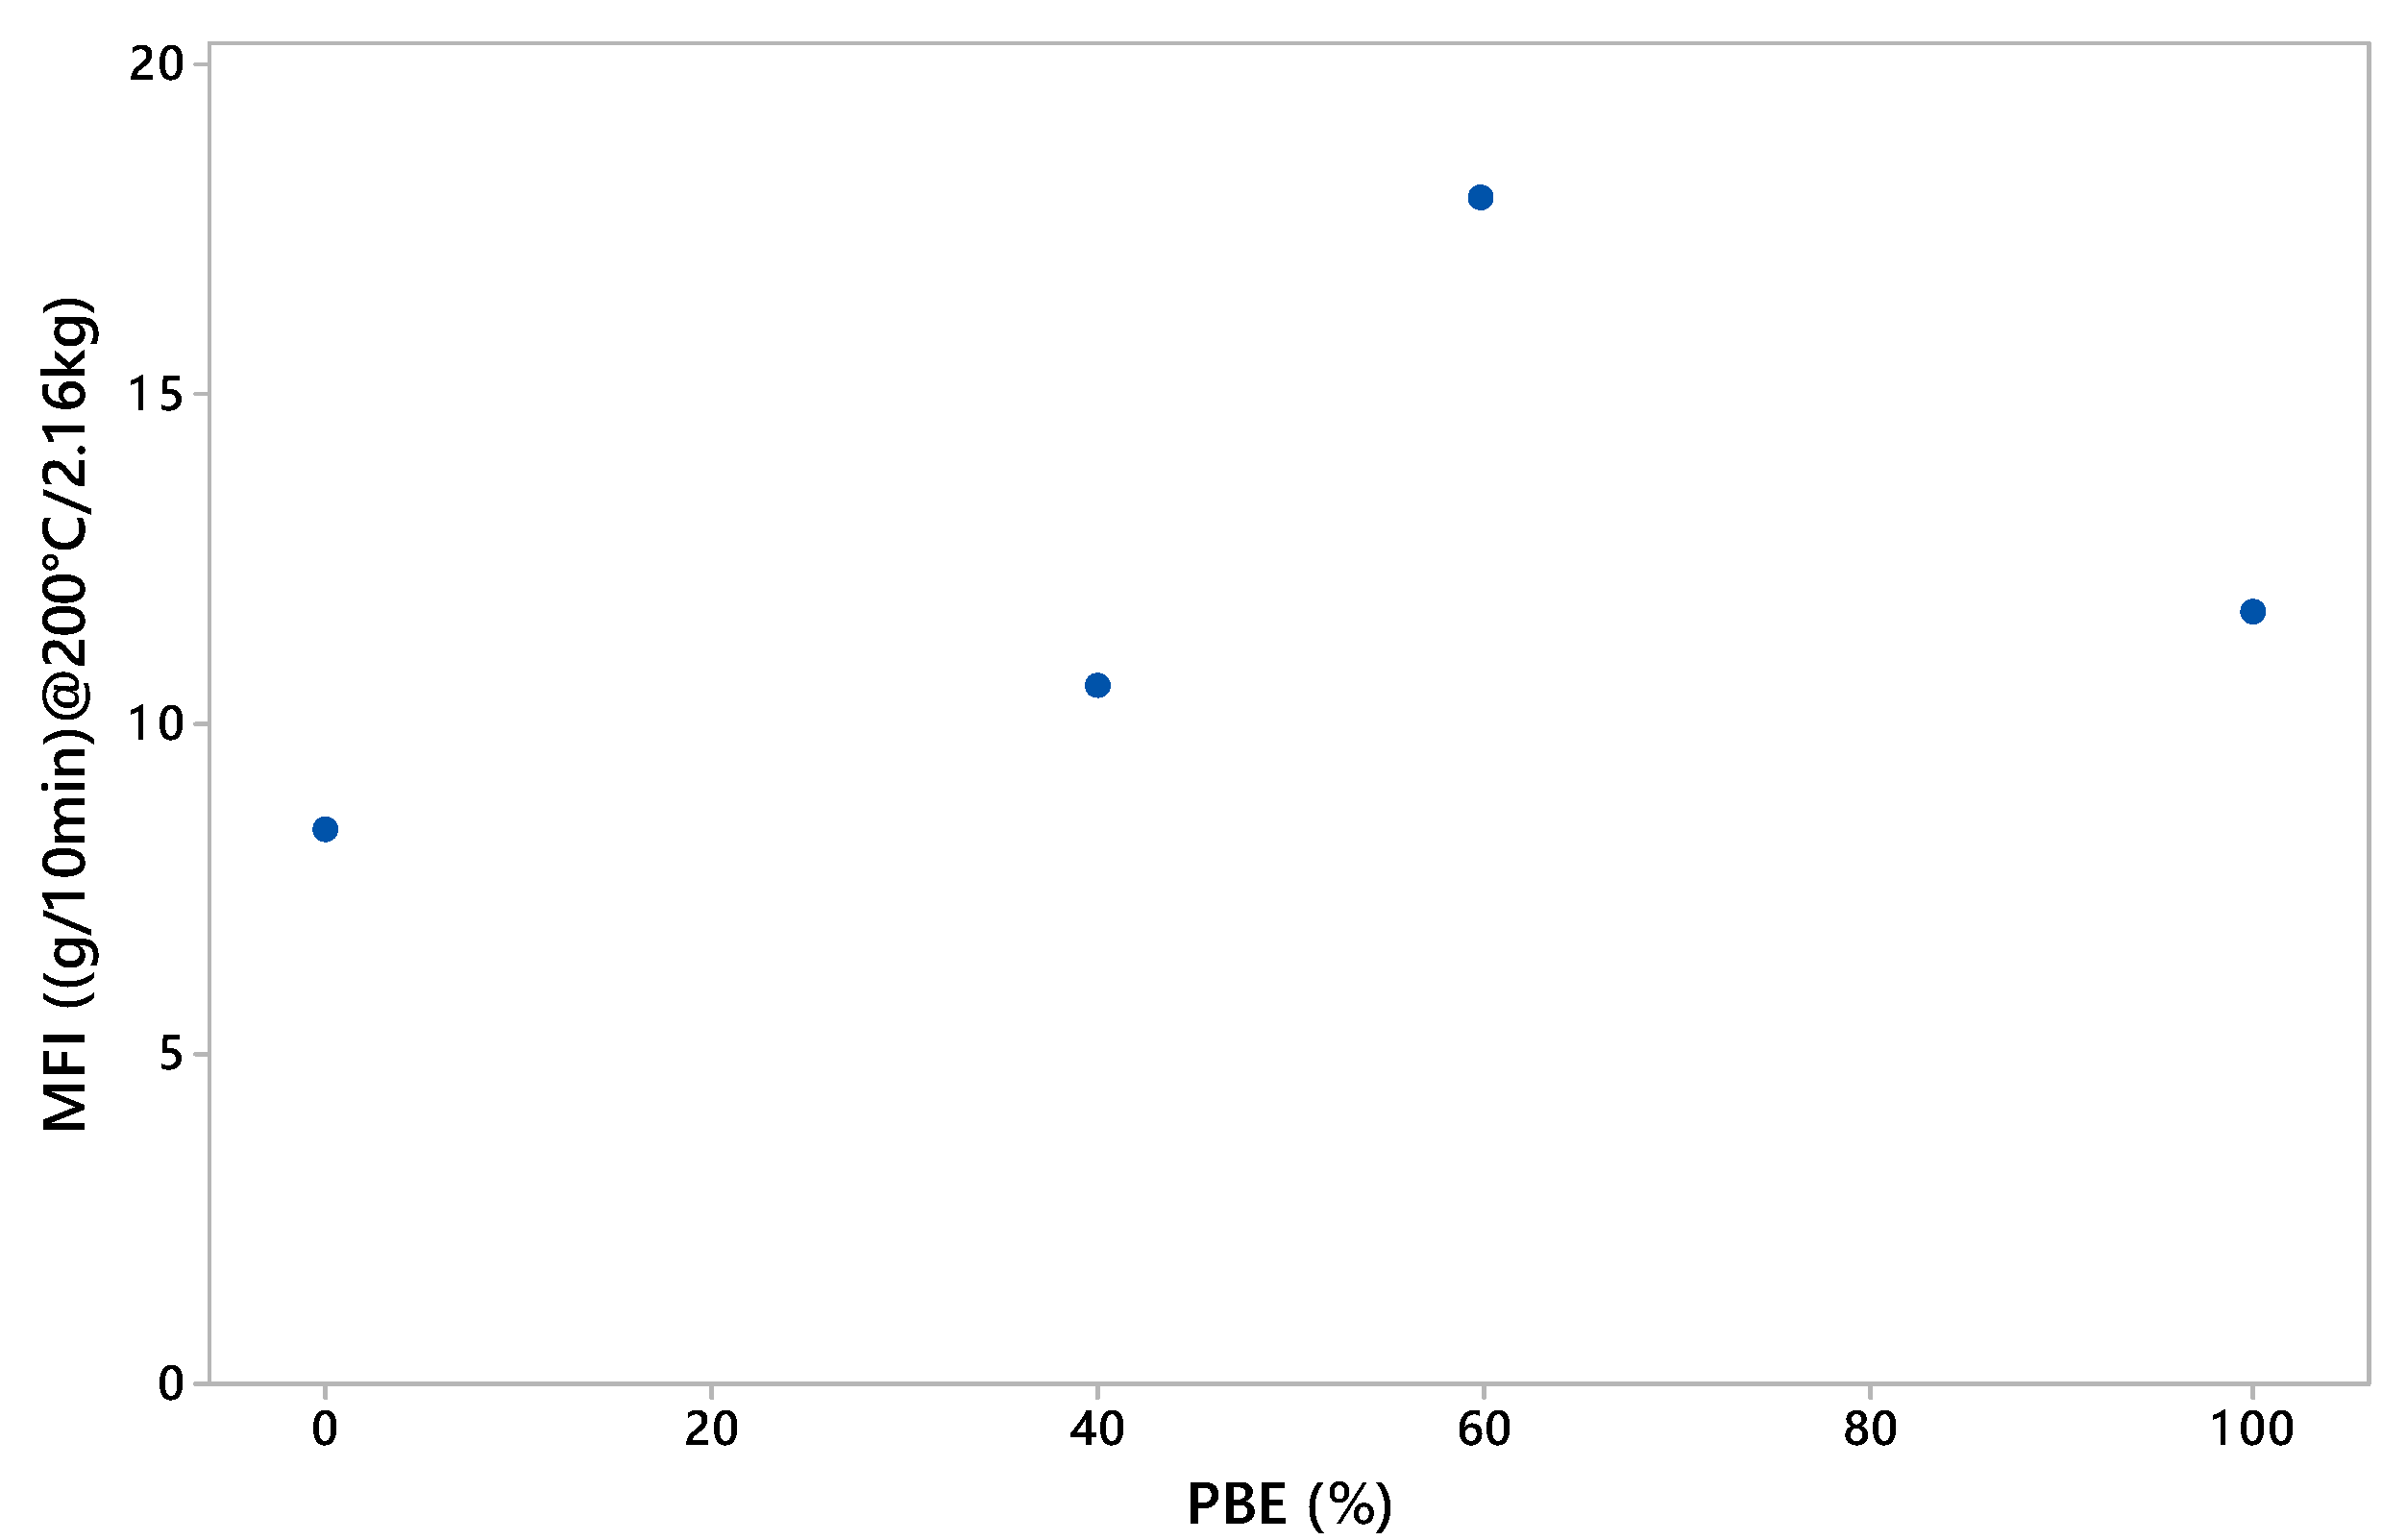
3.1.2. Rheology Analysis
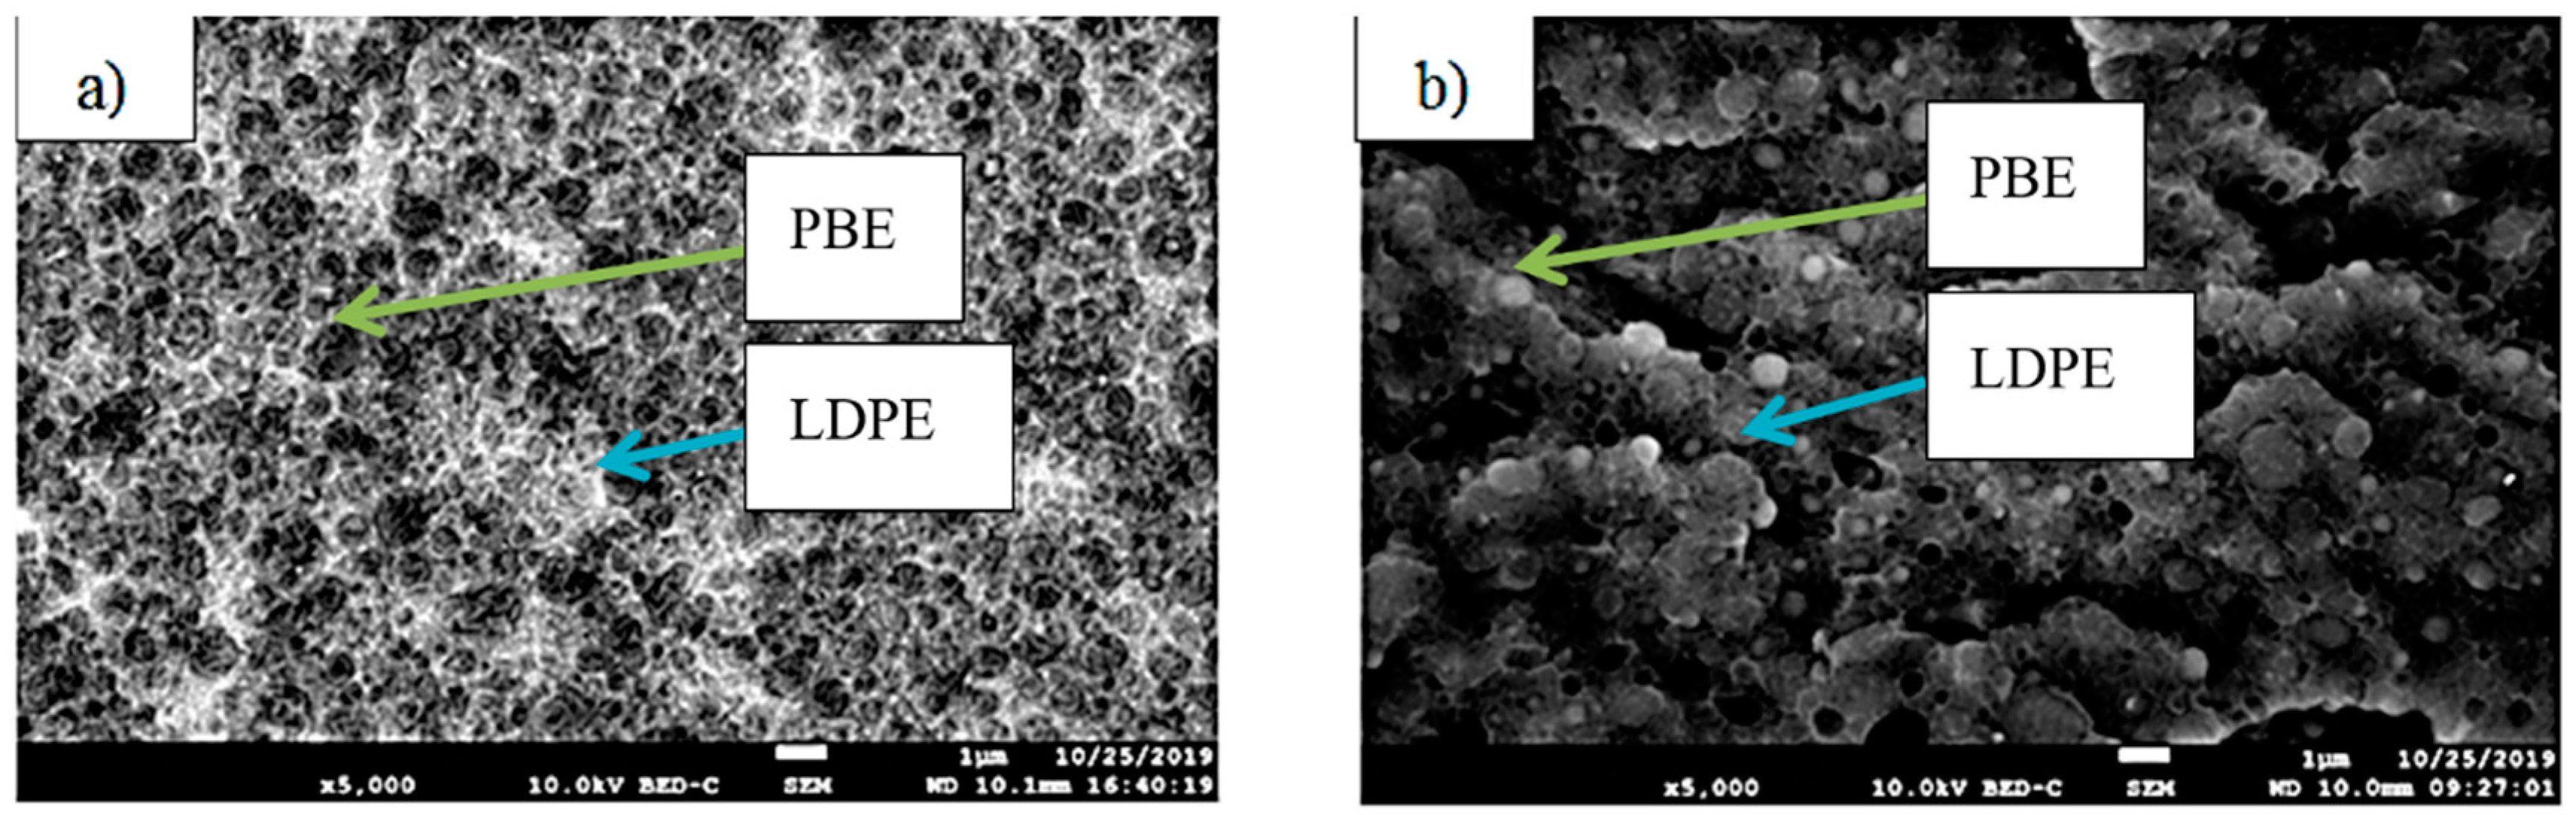
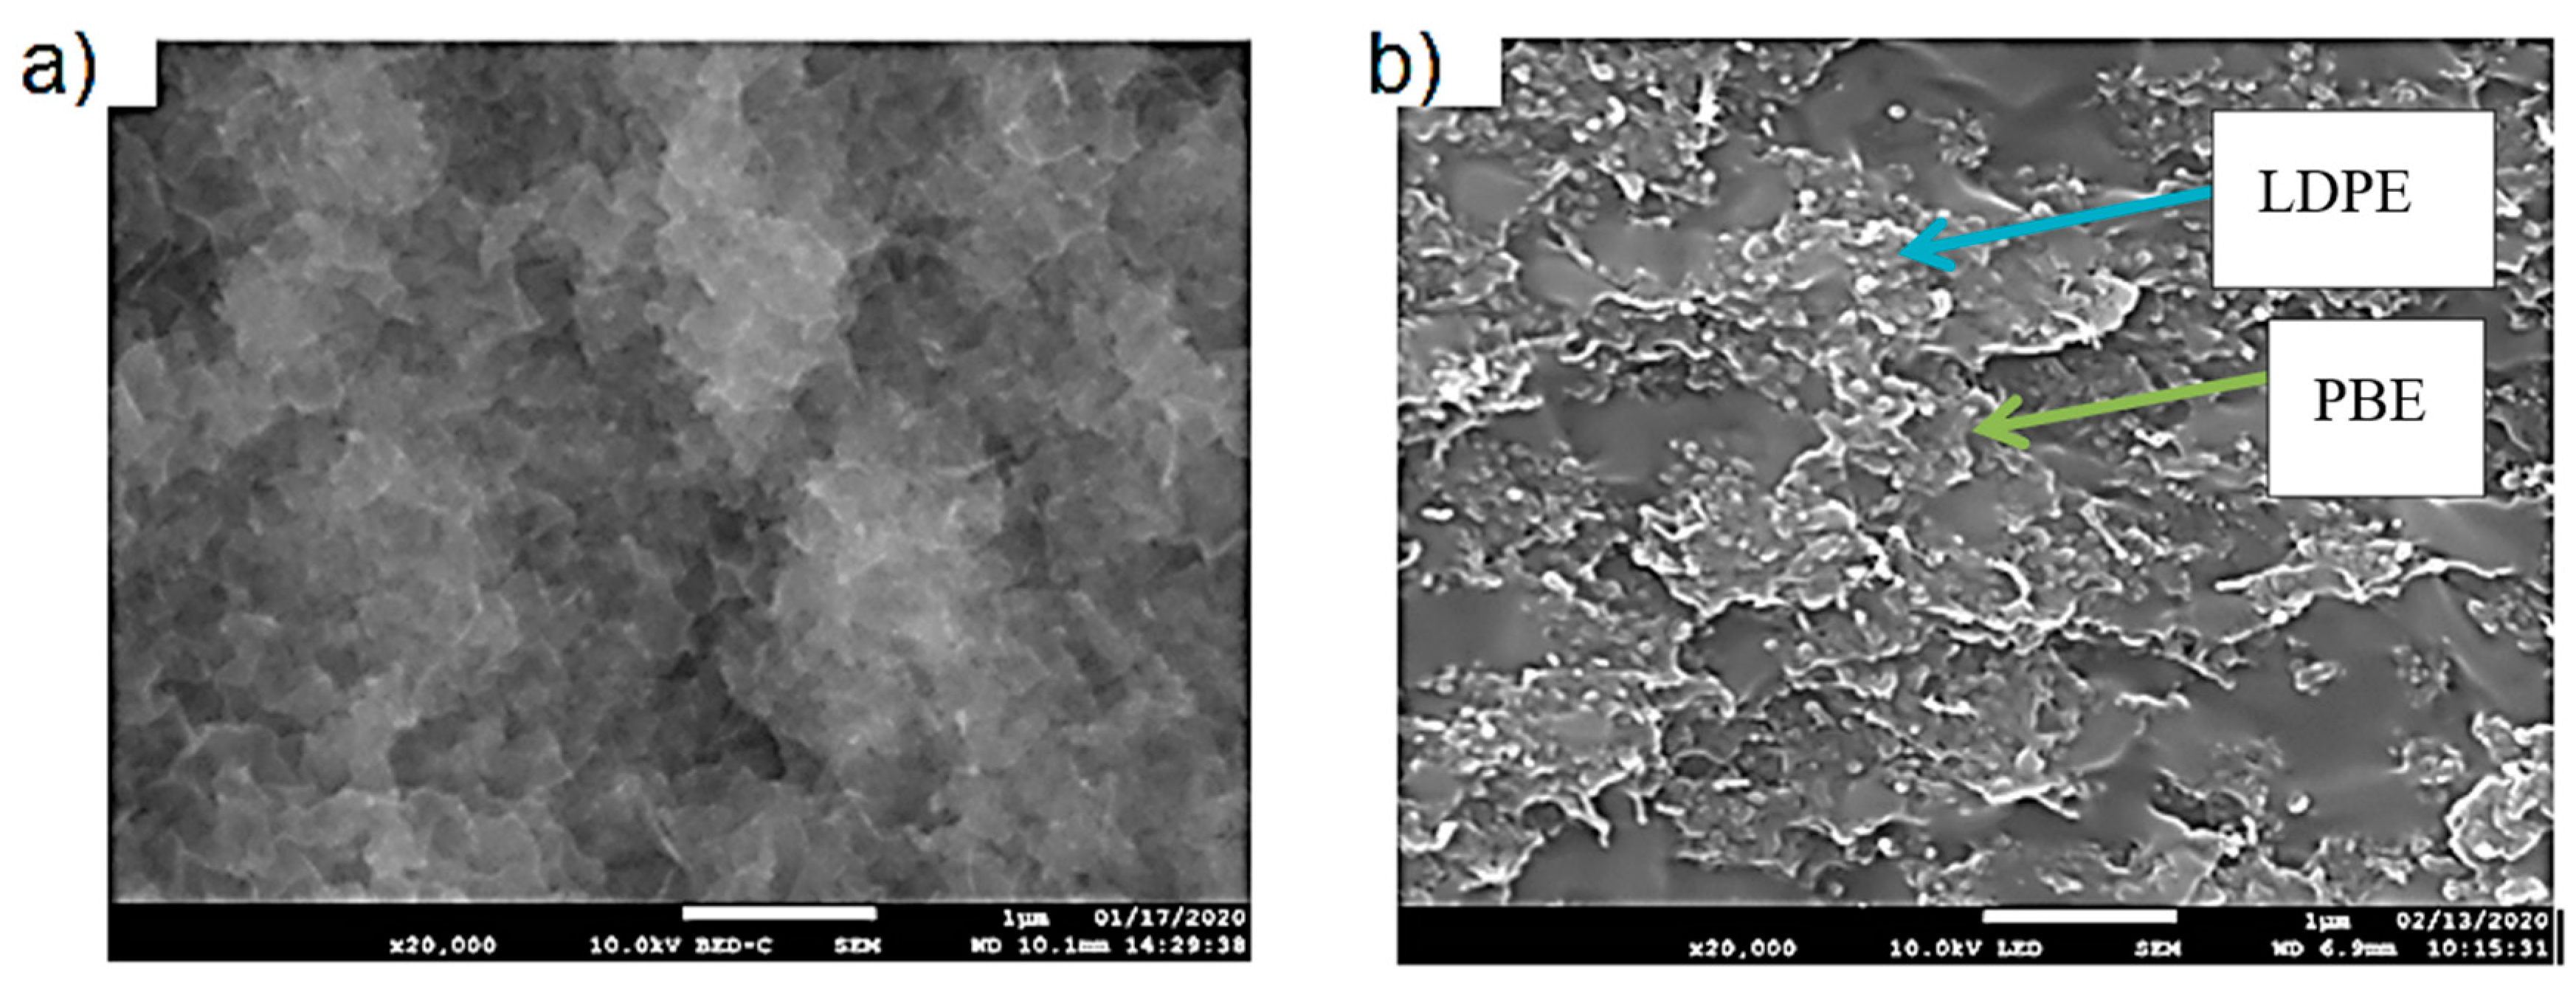
3.1.3. Morphology Analysis
3.2. Analysis of Conducting LDPE/PBE Biphasic Polymer Blends
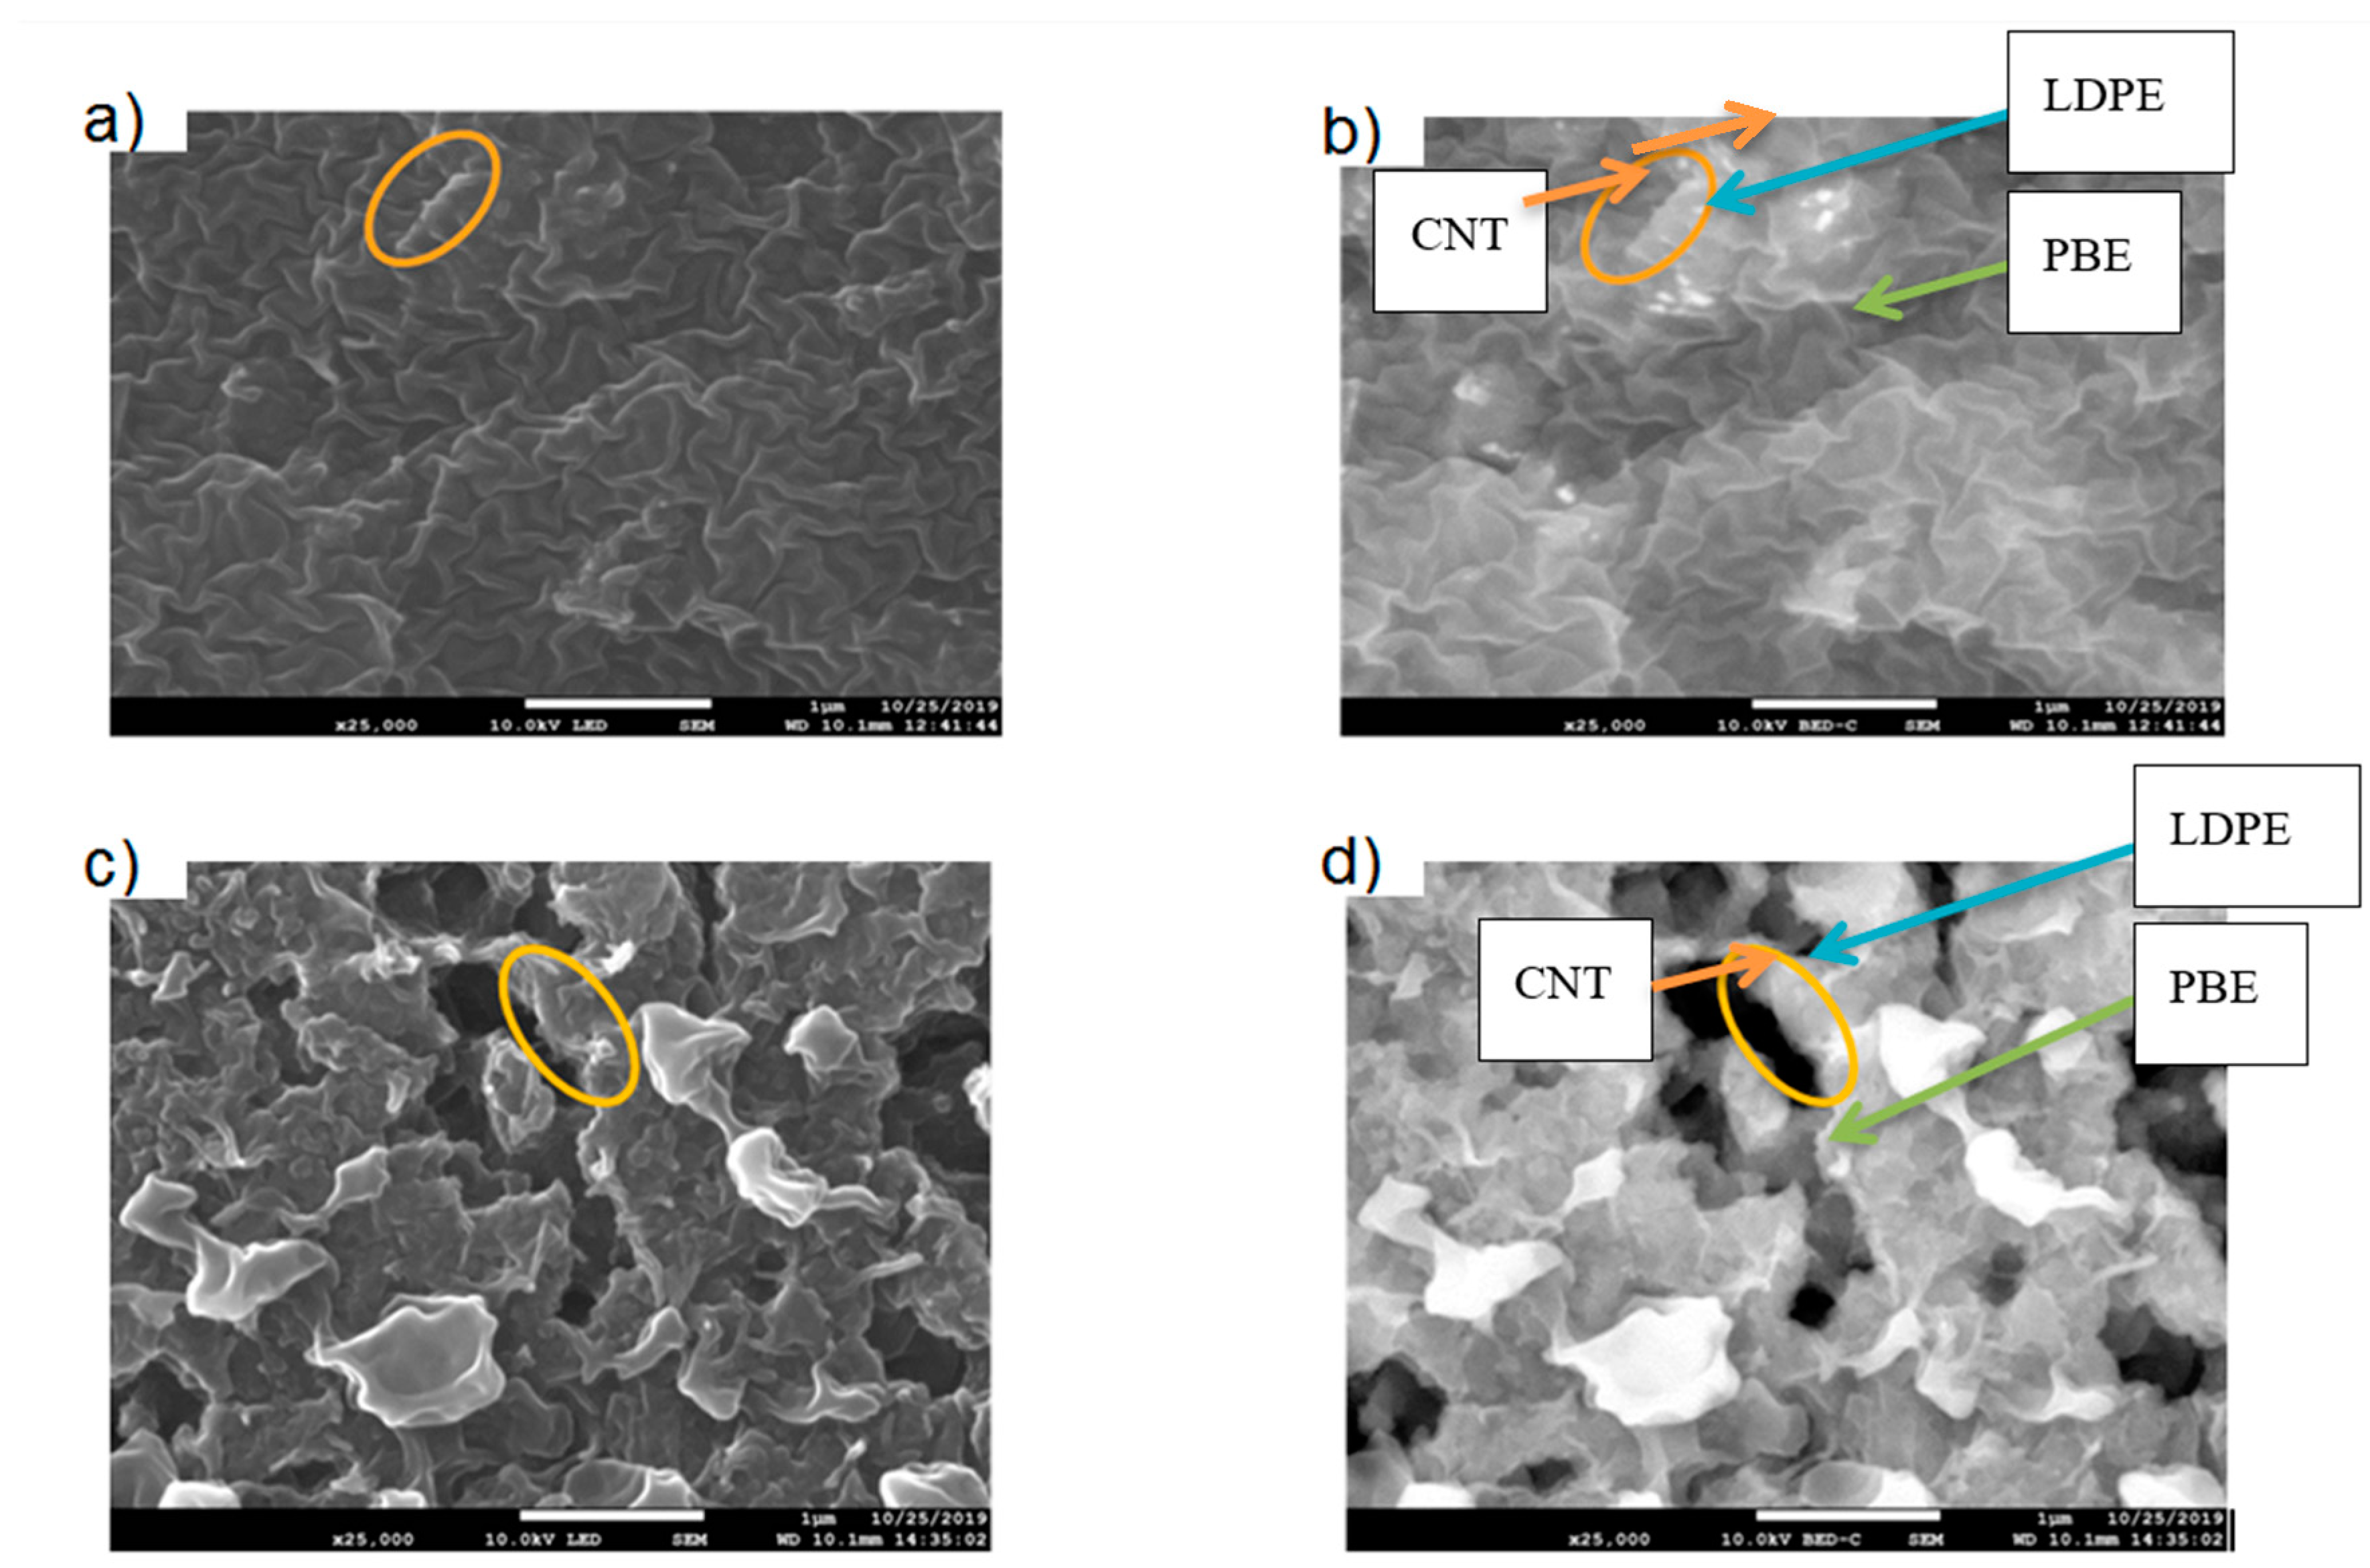
3.2.1. Location of KB and CNT in LDPE/PBE Blends
- a)
- Prediction of the Location through Theoretical Models
- 1)
- The wettability coefficient is lower than −1 and the filler 1 is located in the polymer B;
- 2)
- The wettability coefficient is between −1 and 1 and the filler 1 is found at the interface of the two polymers;
- 3)
- The wettability coefficient is higher than 1 and the filler 1 is in the polymer A.
- b)
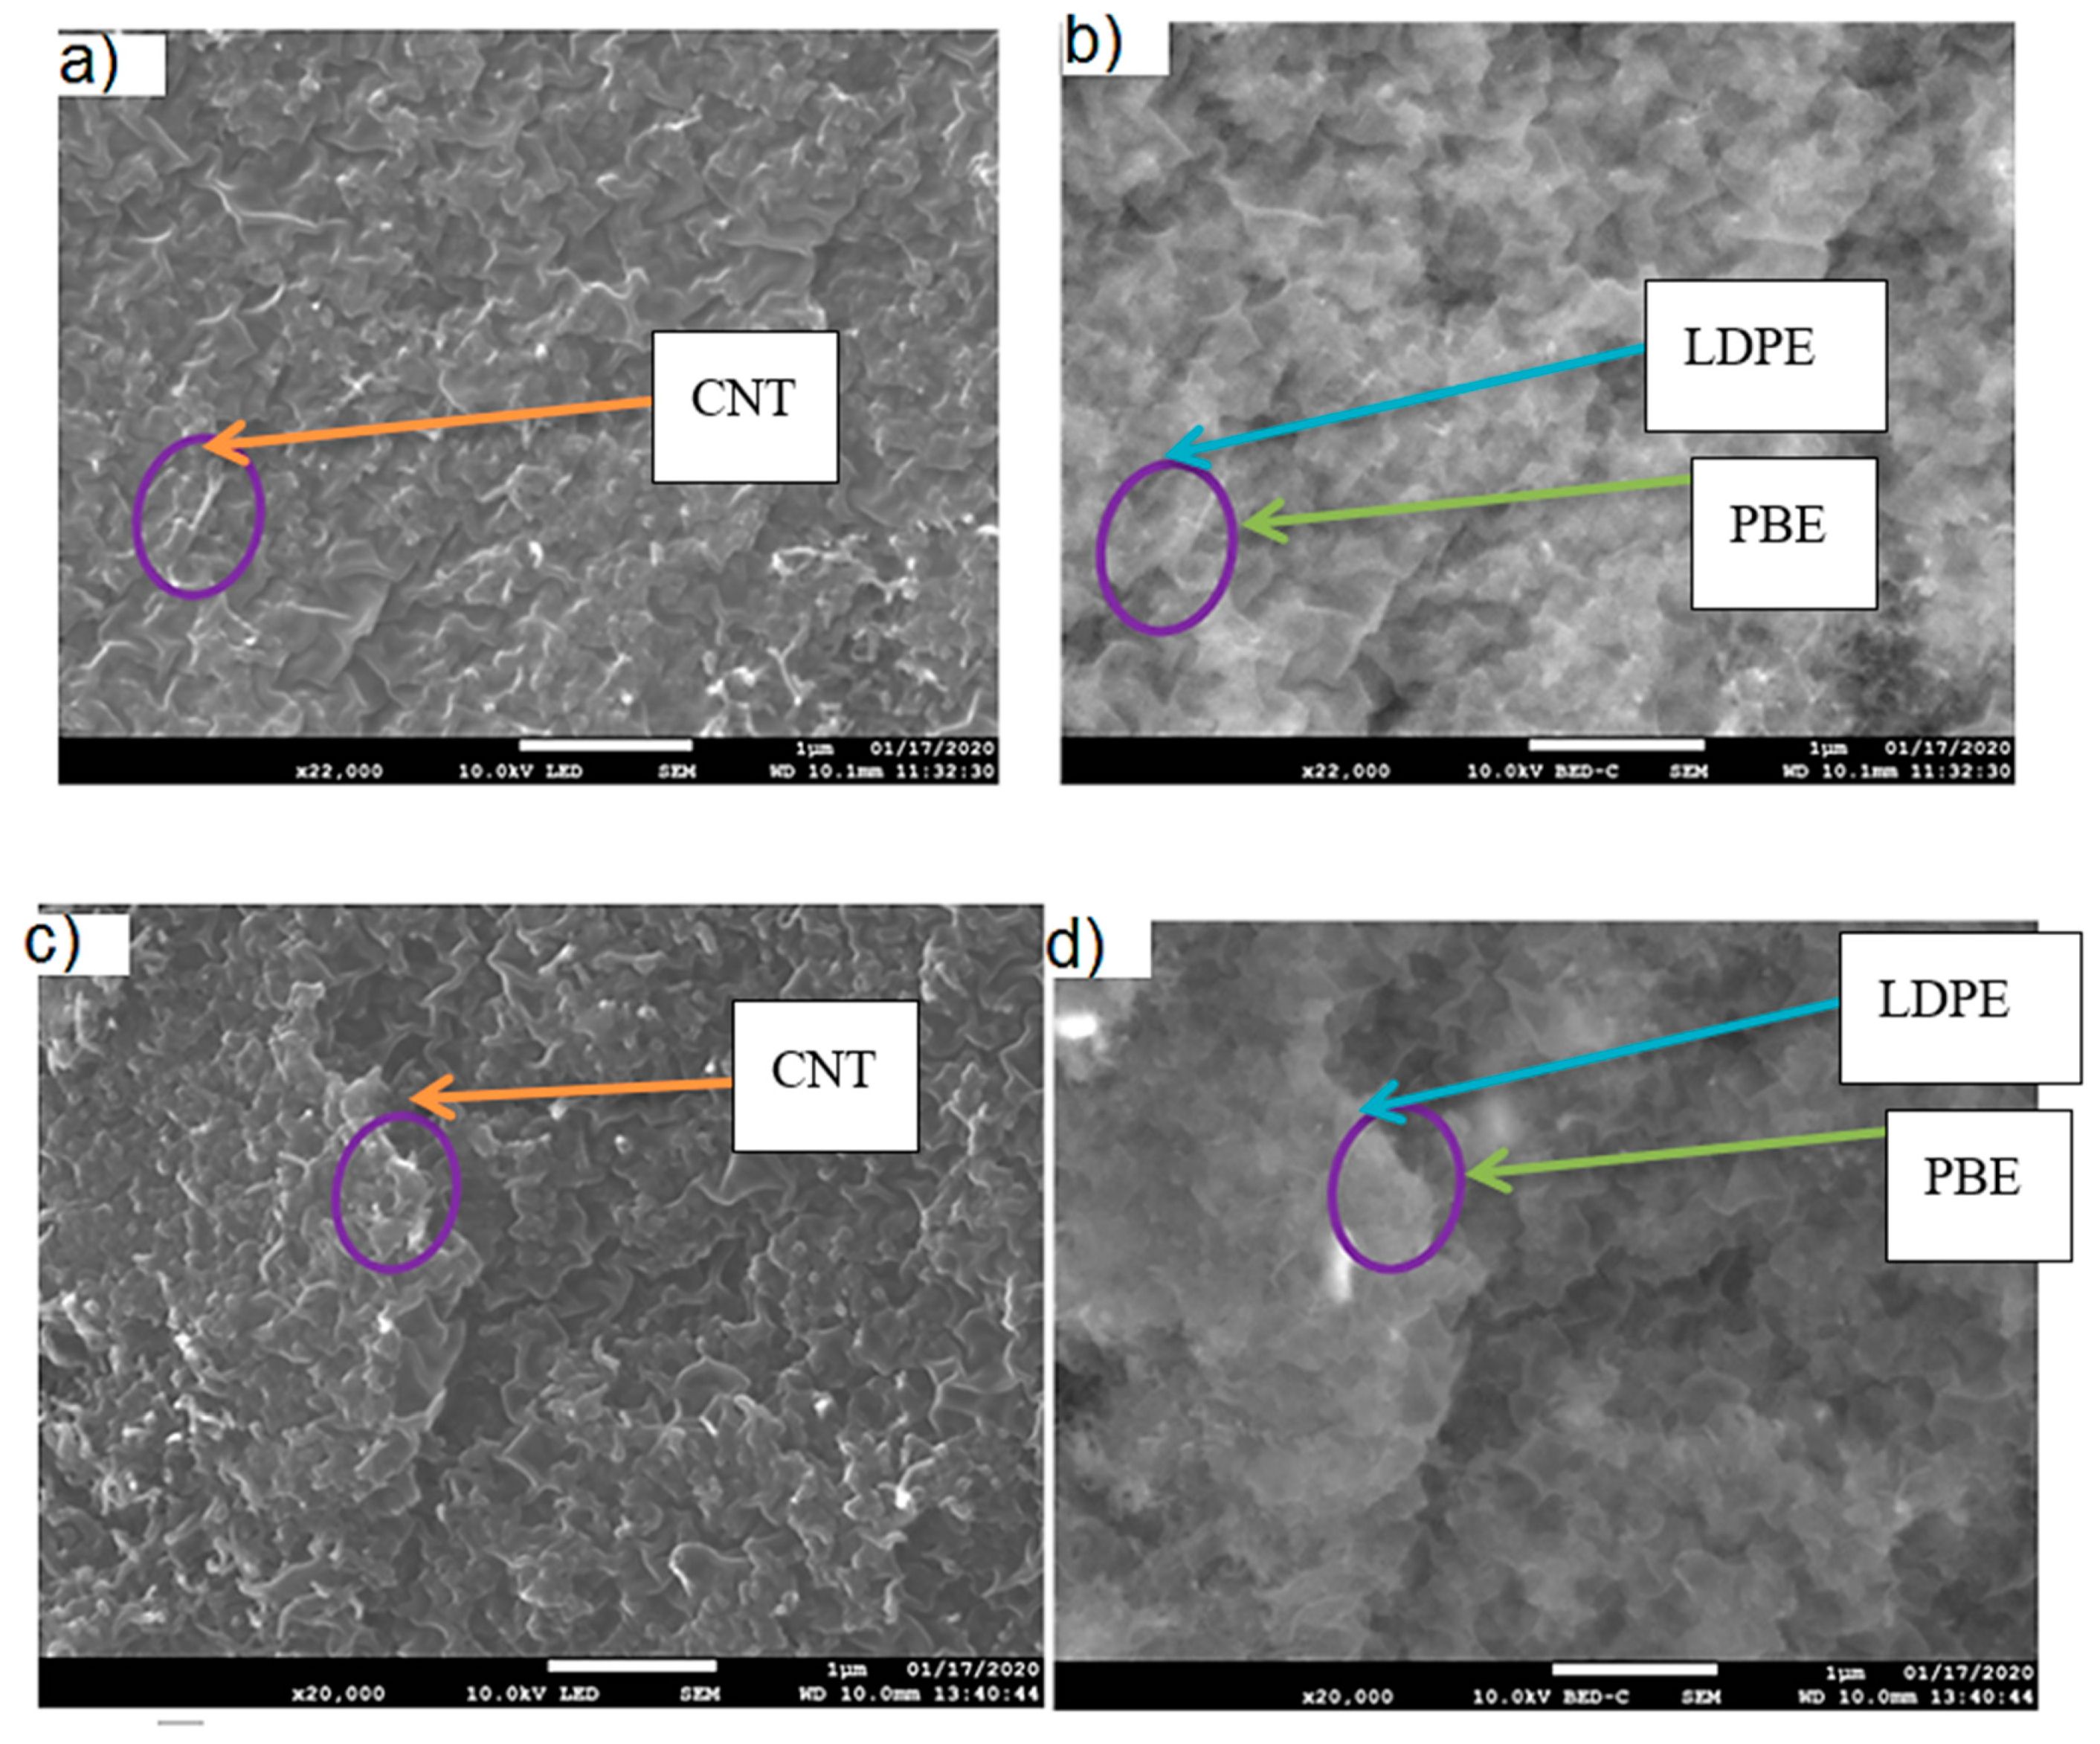
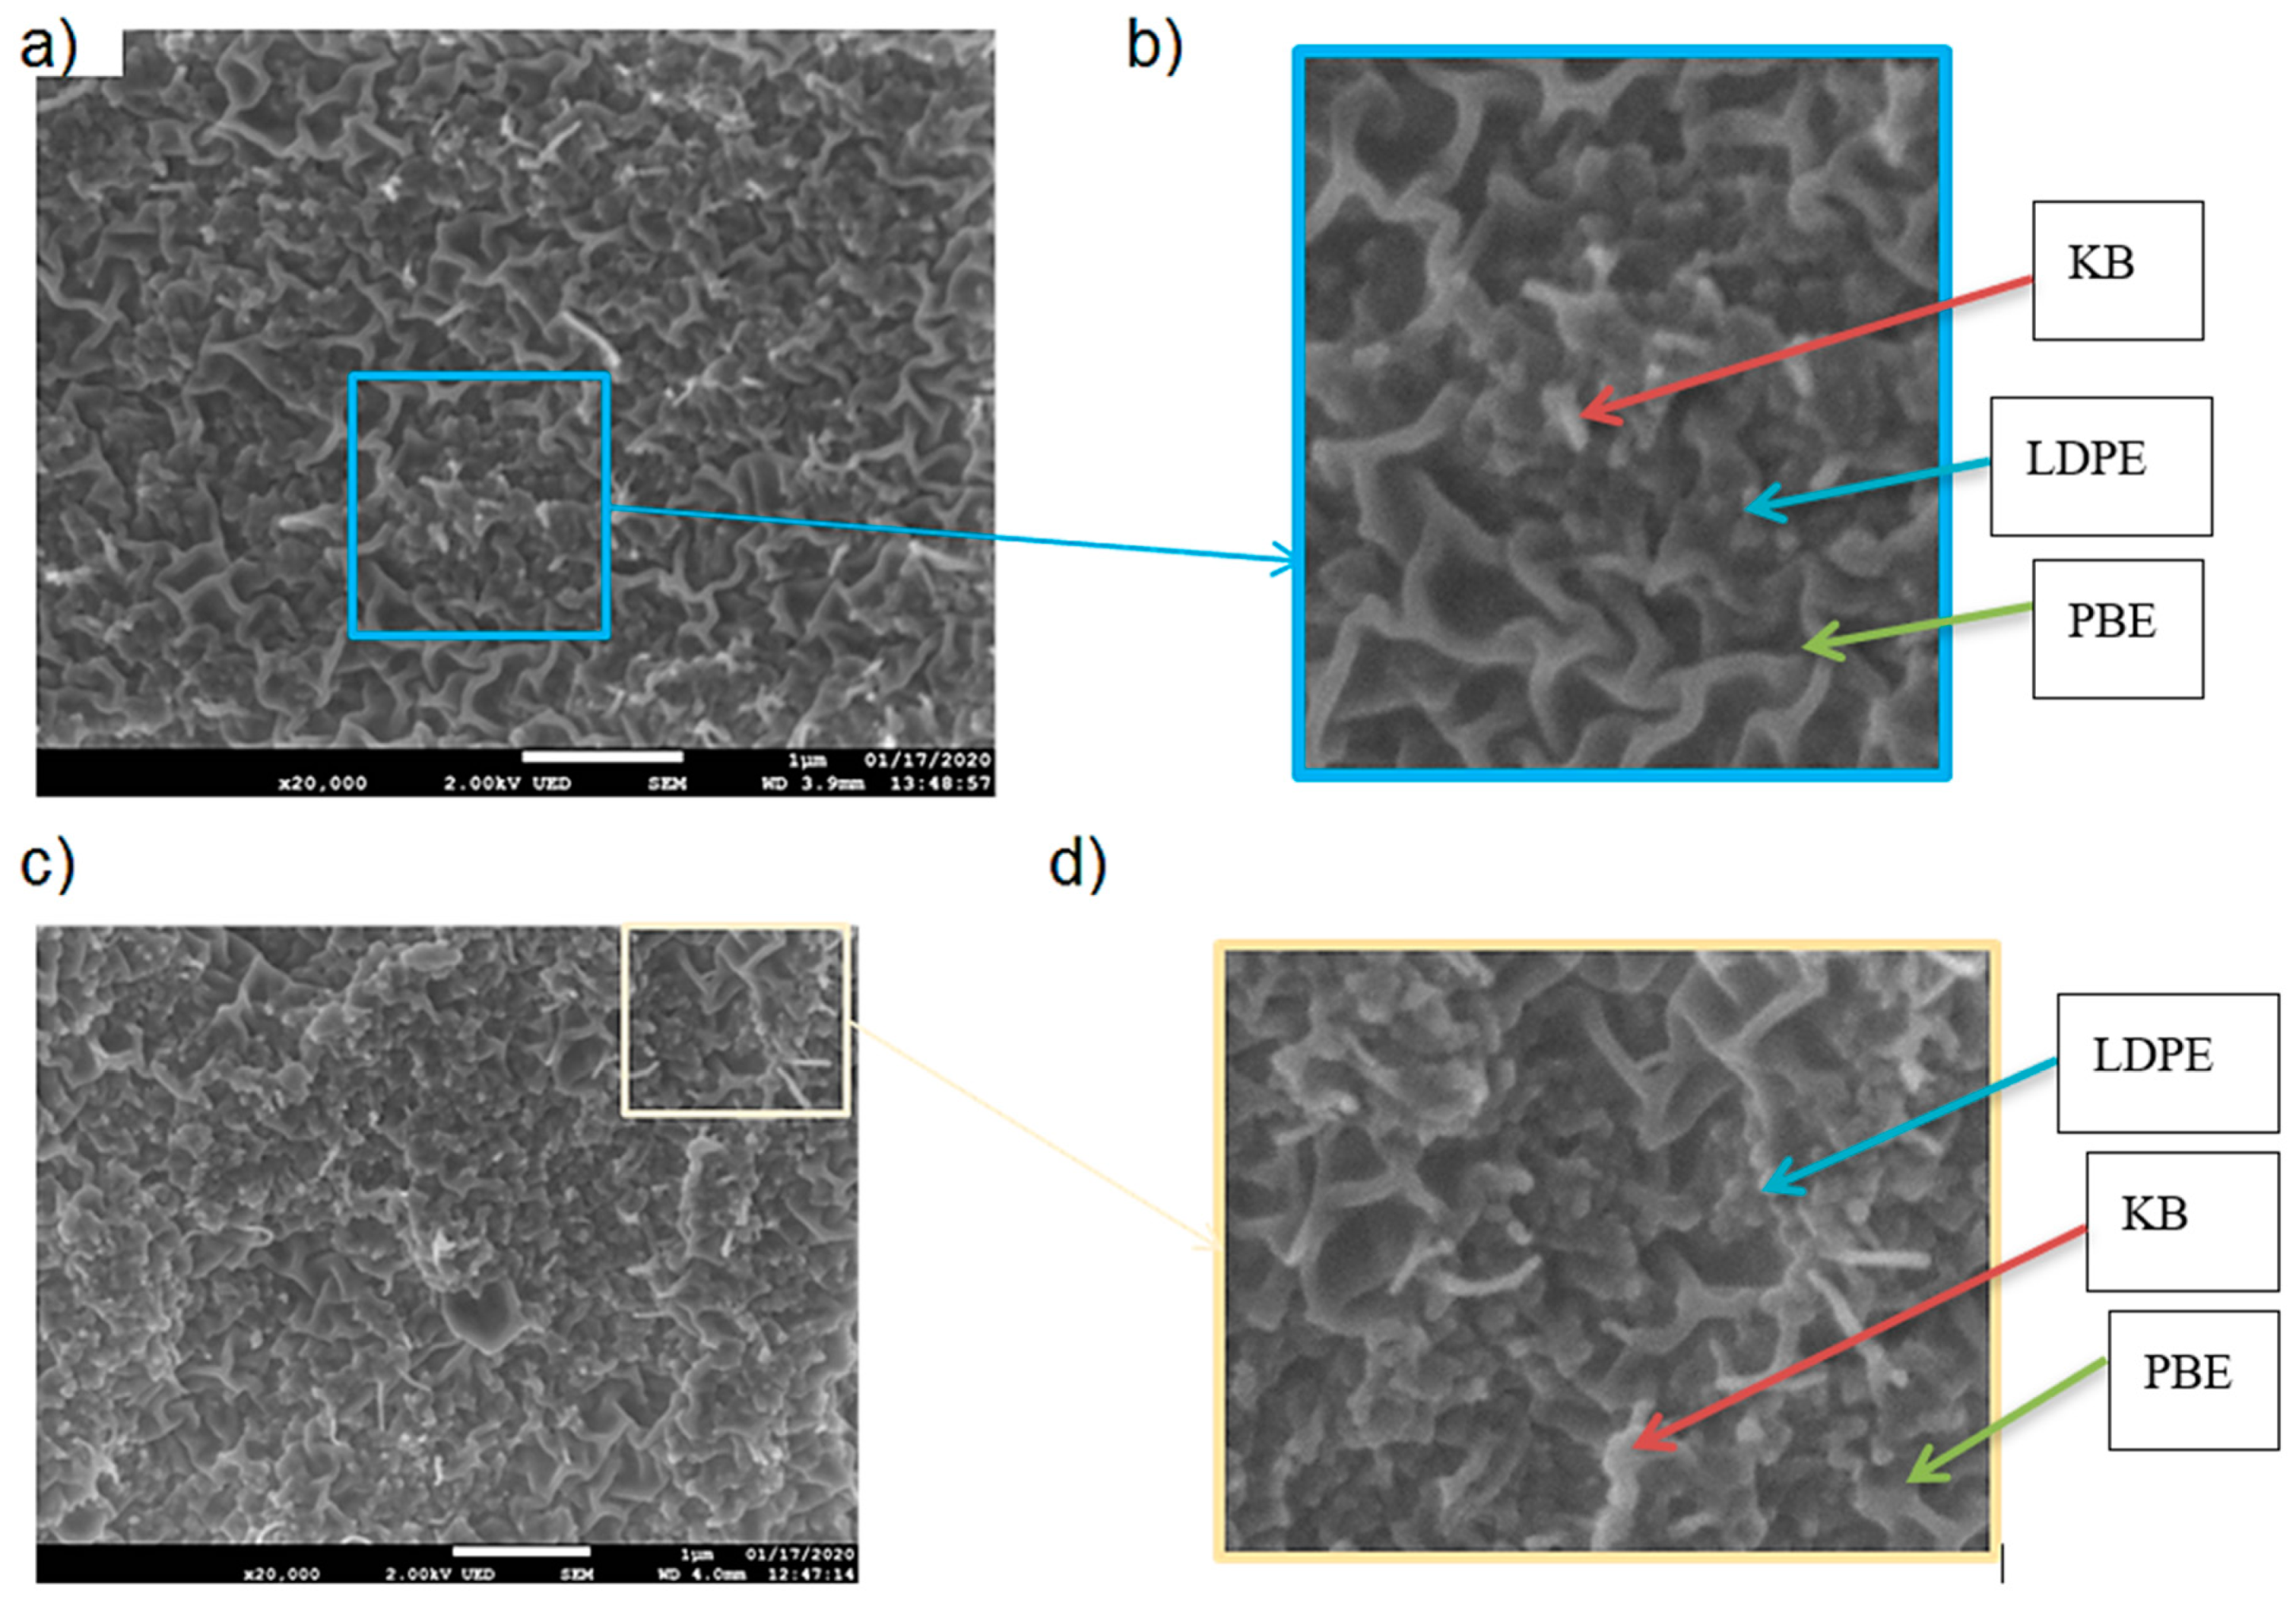
- Location of Fillers through SEM Images
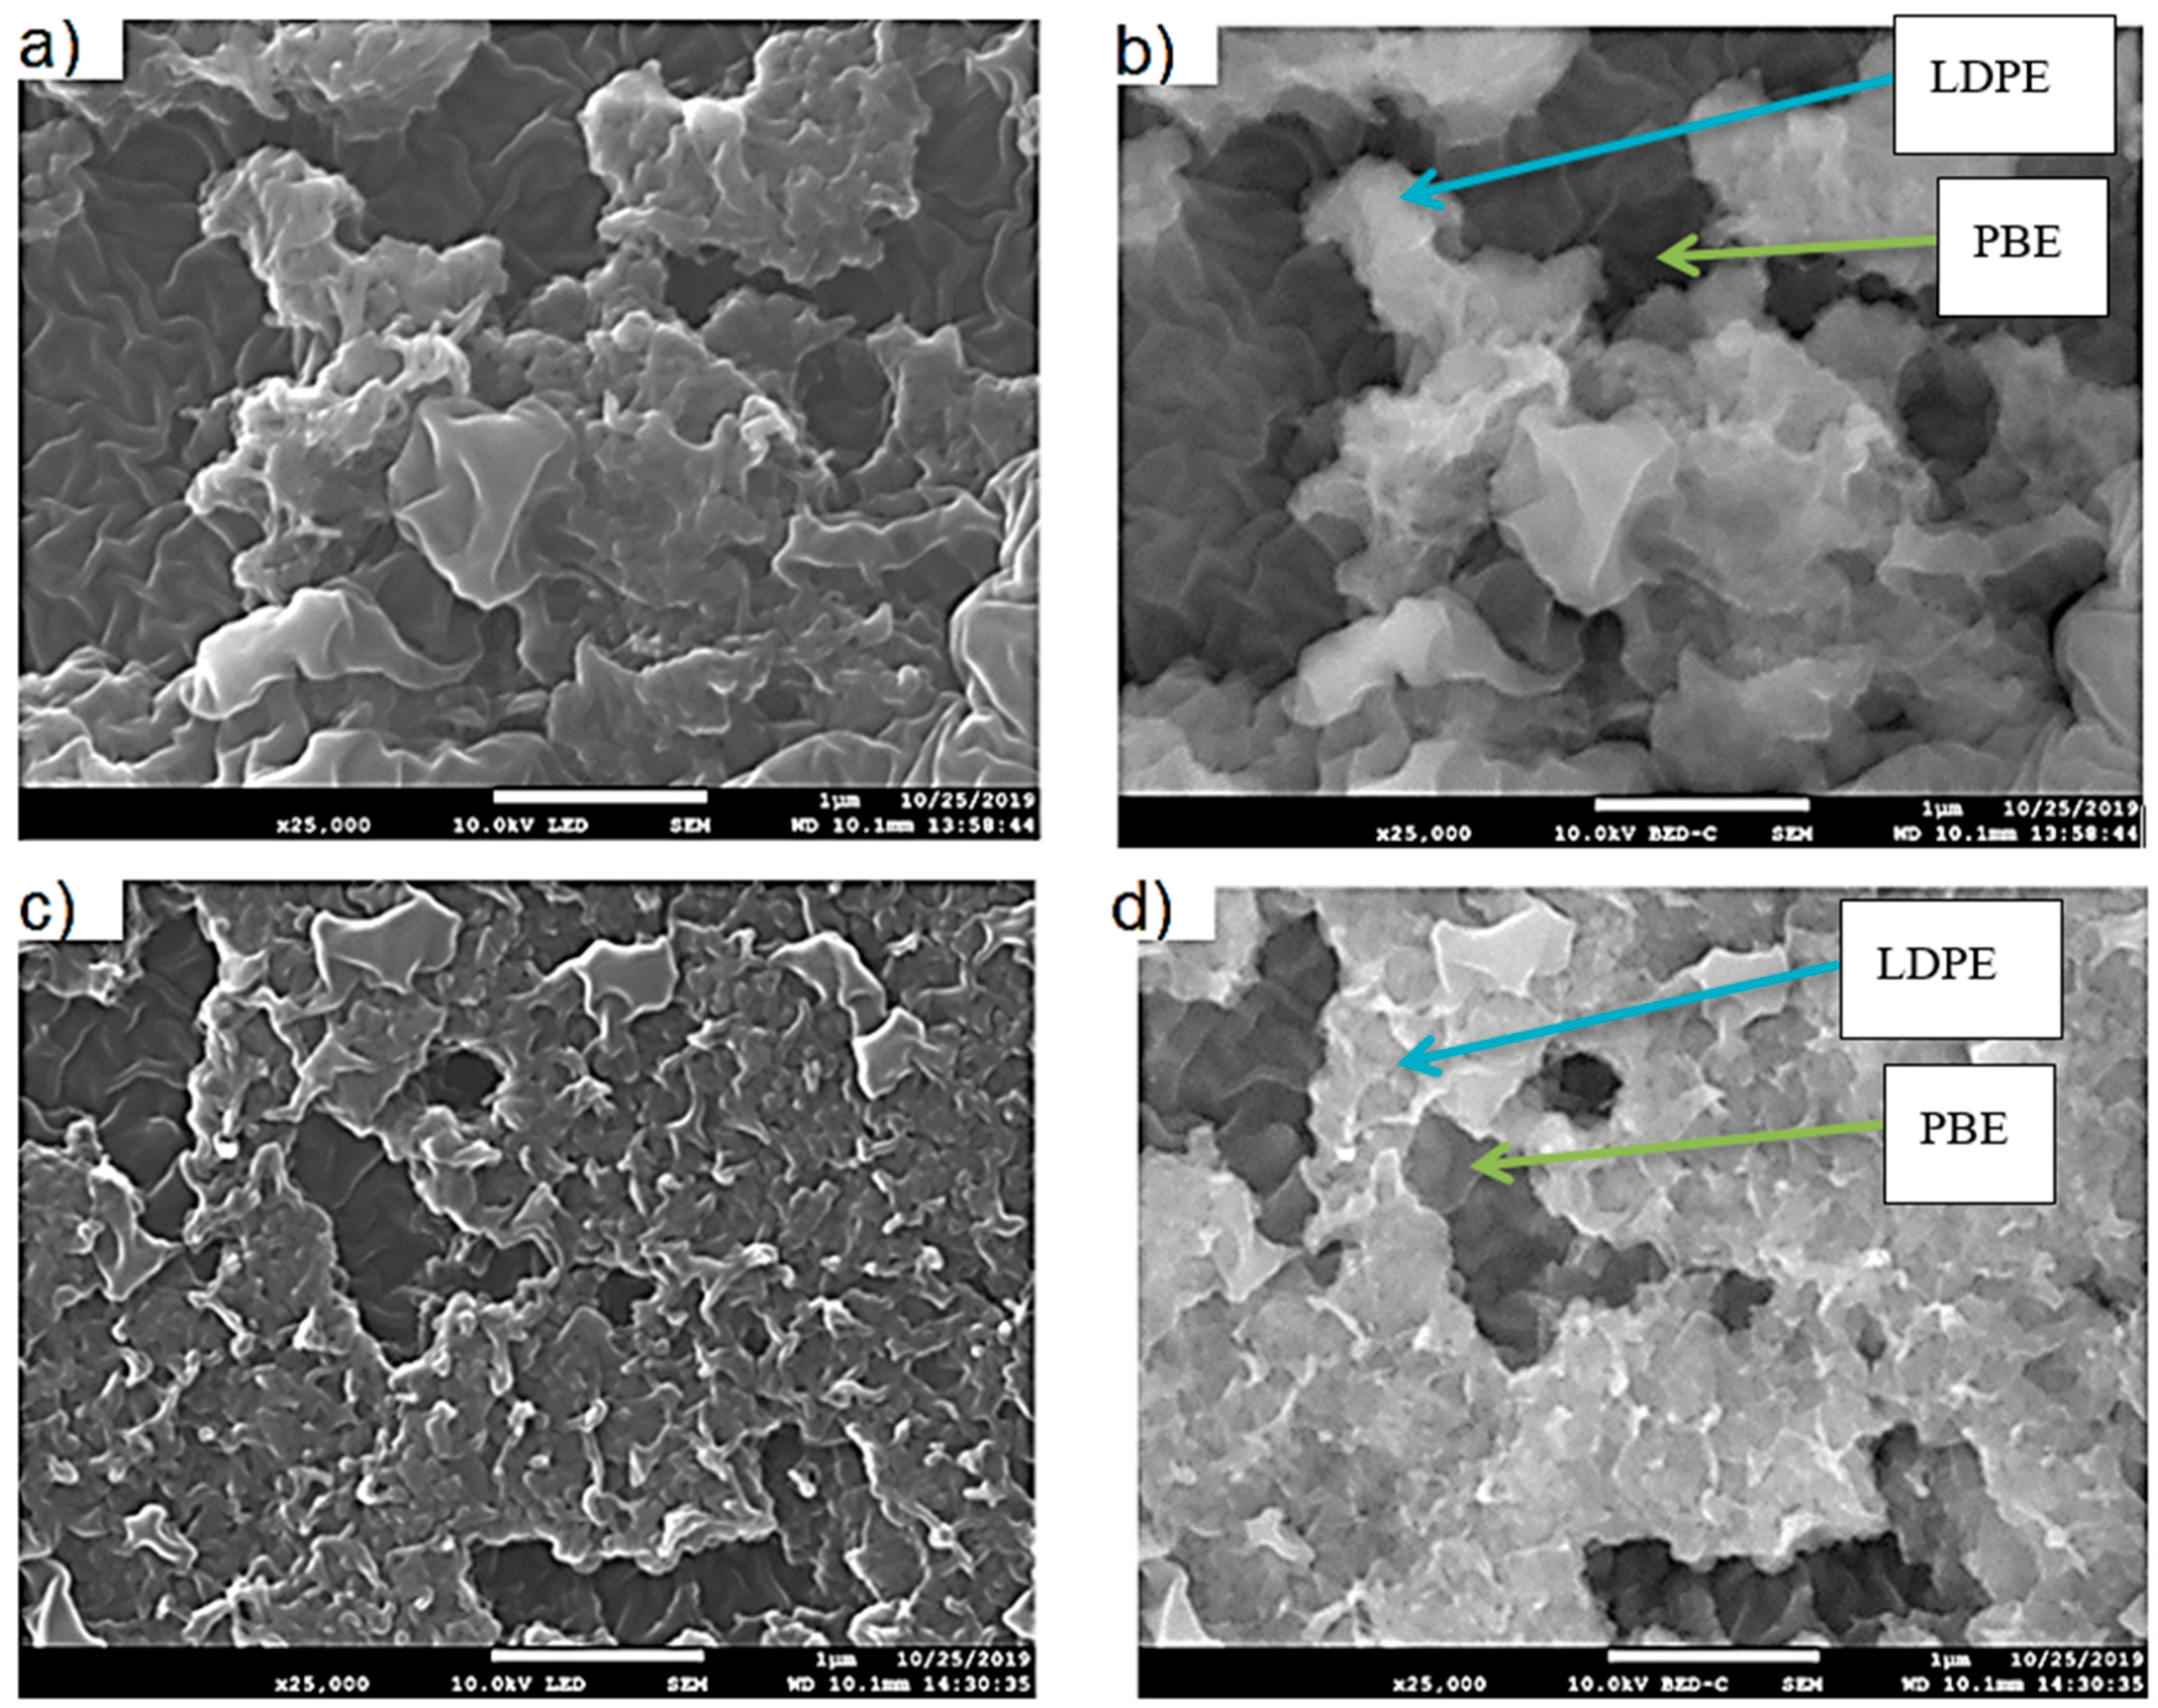
3.2.2. Morphology Analysis
3.2.3. Rheology Analysis
3.2.4. Differential Scanning Calorimetry (DSC) Analysis
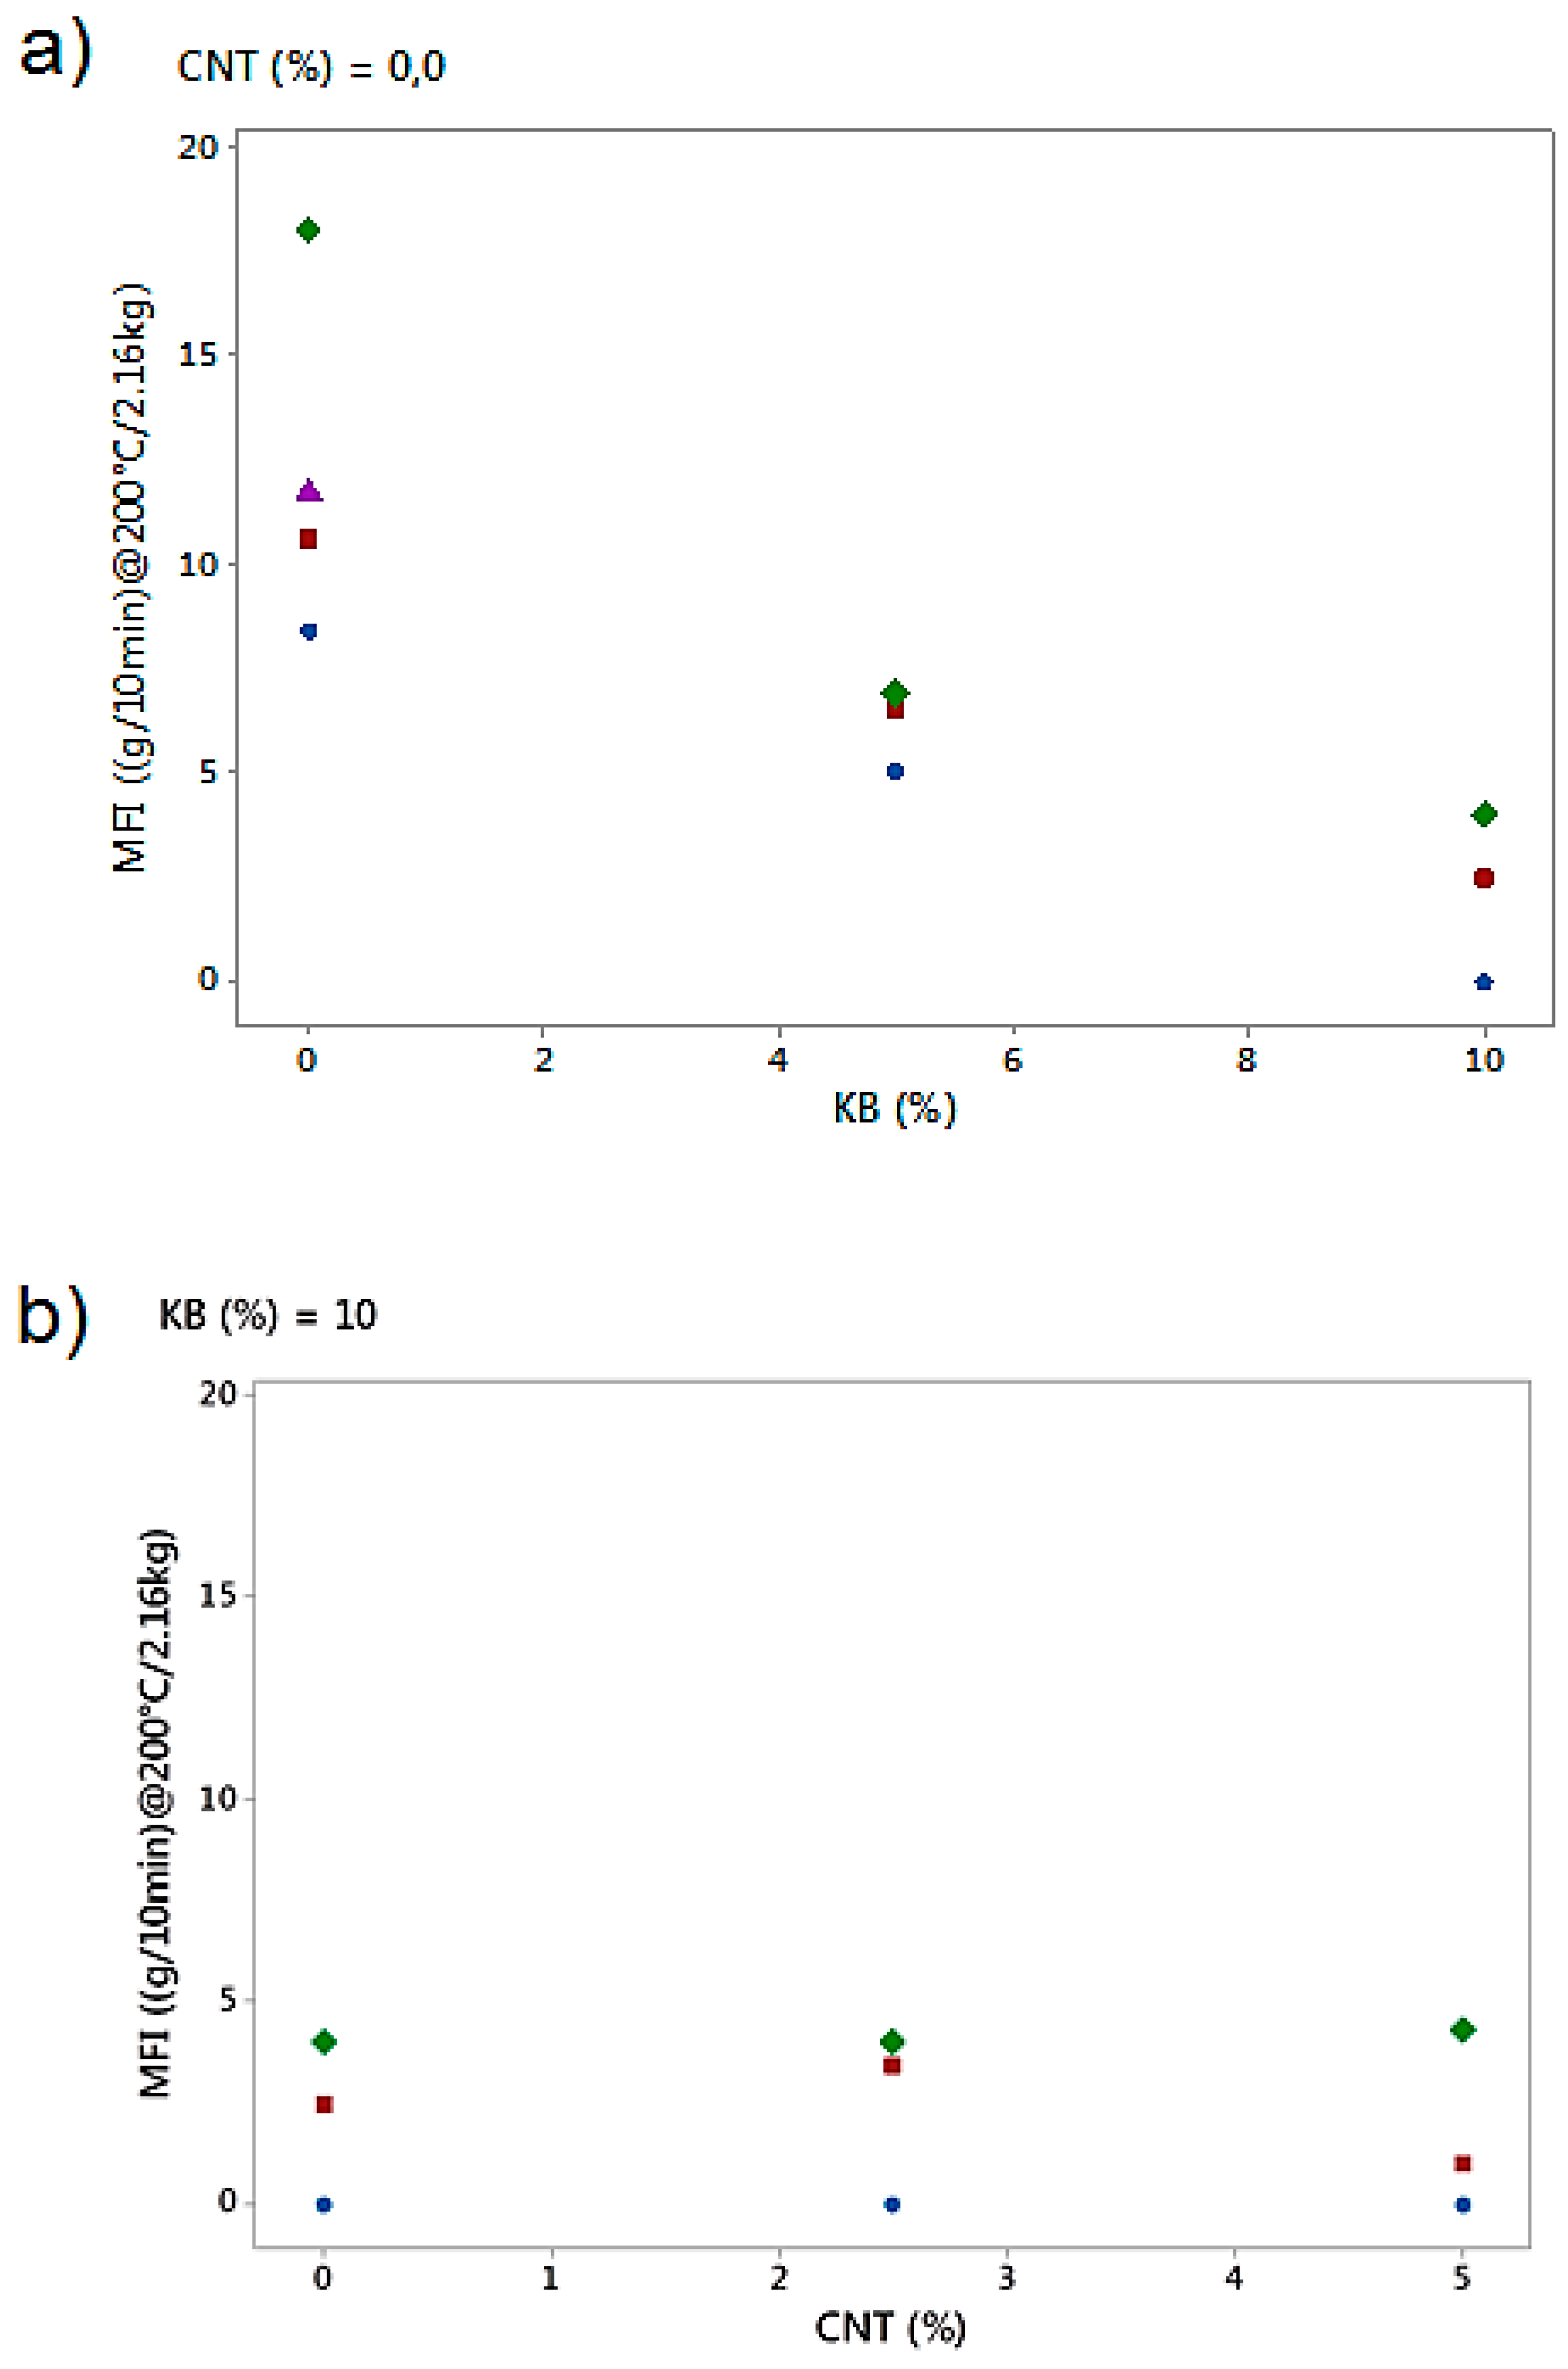
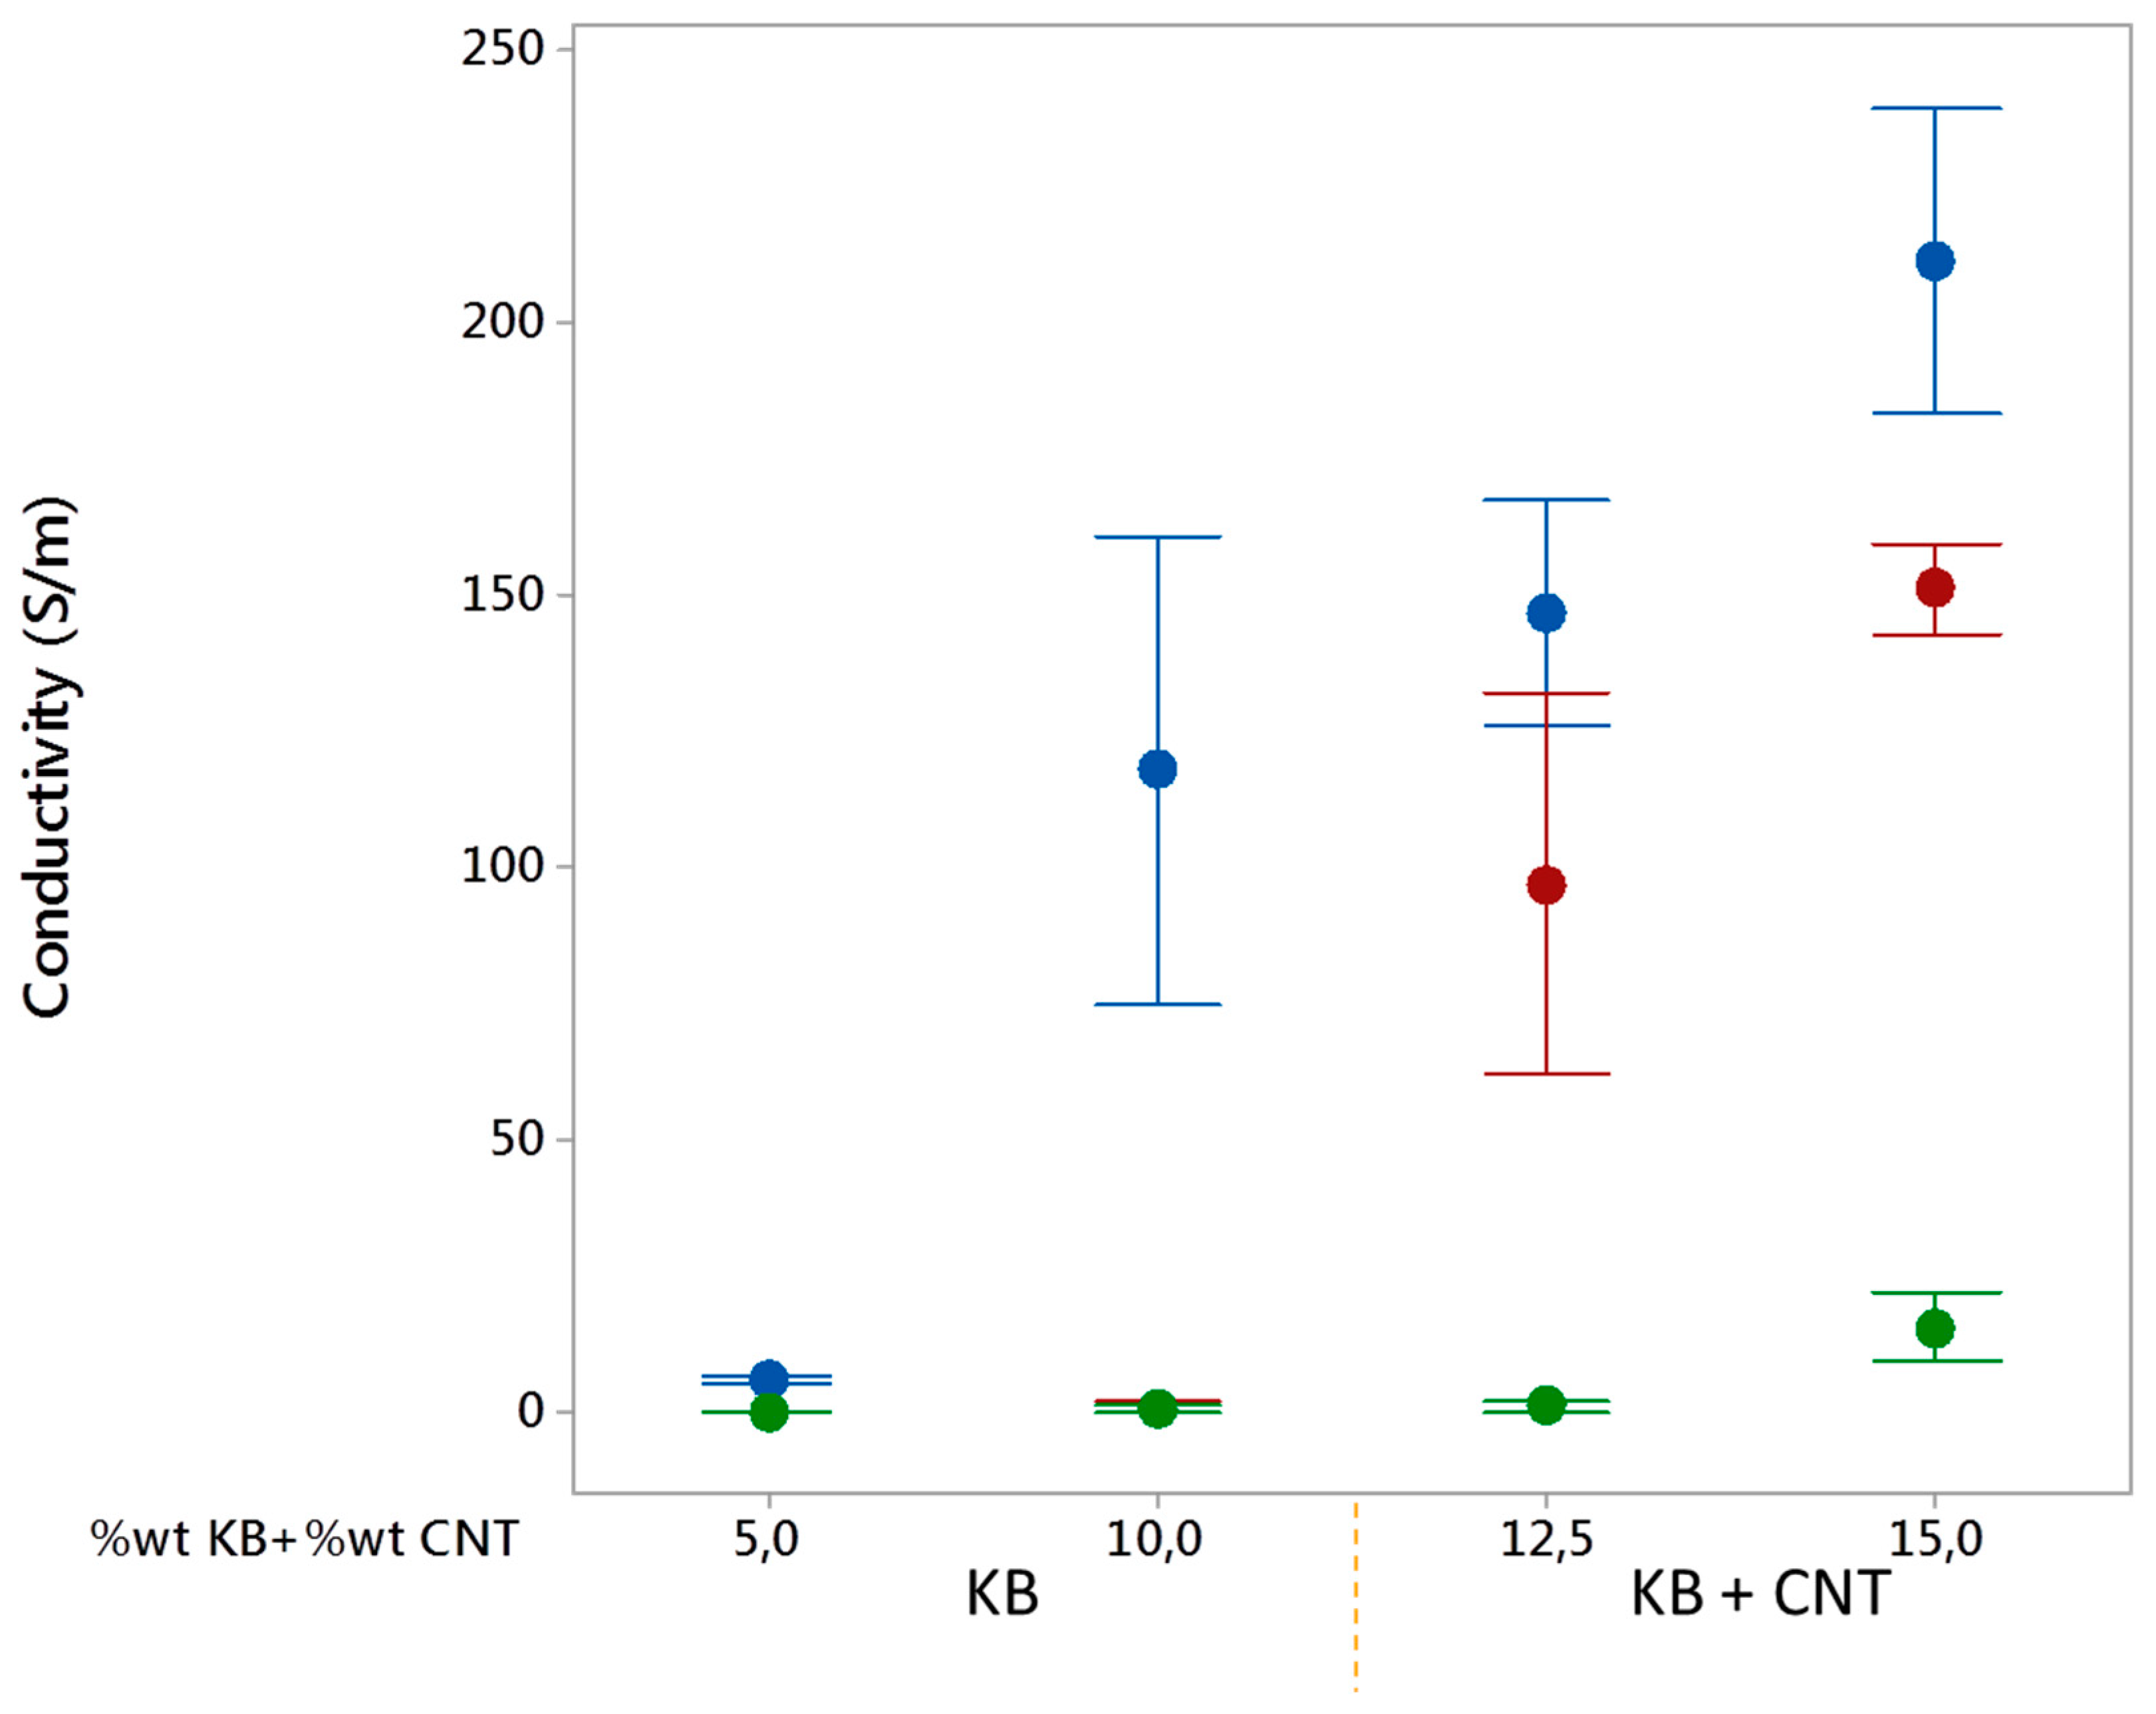
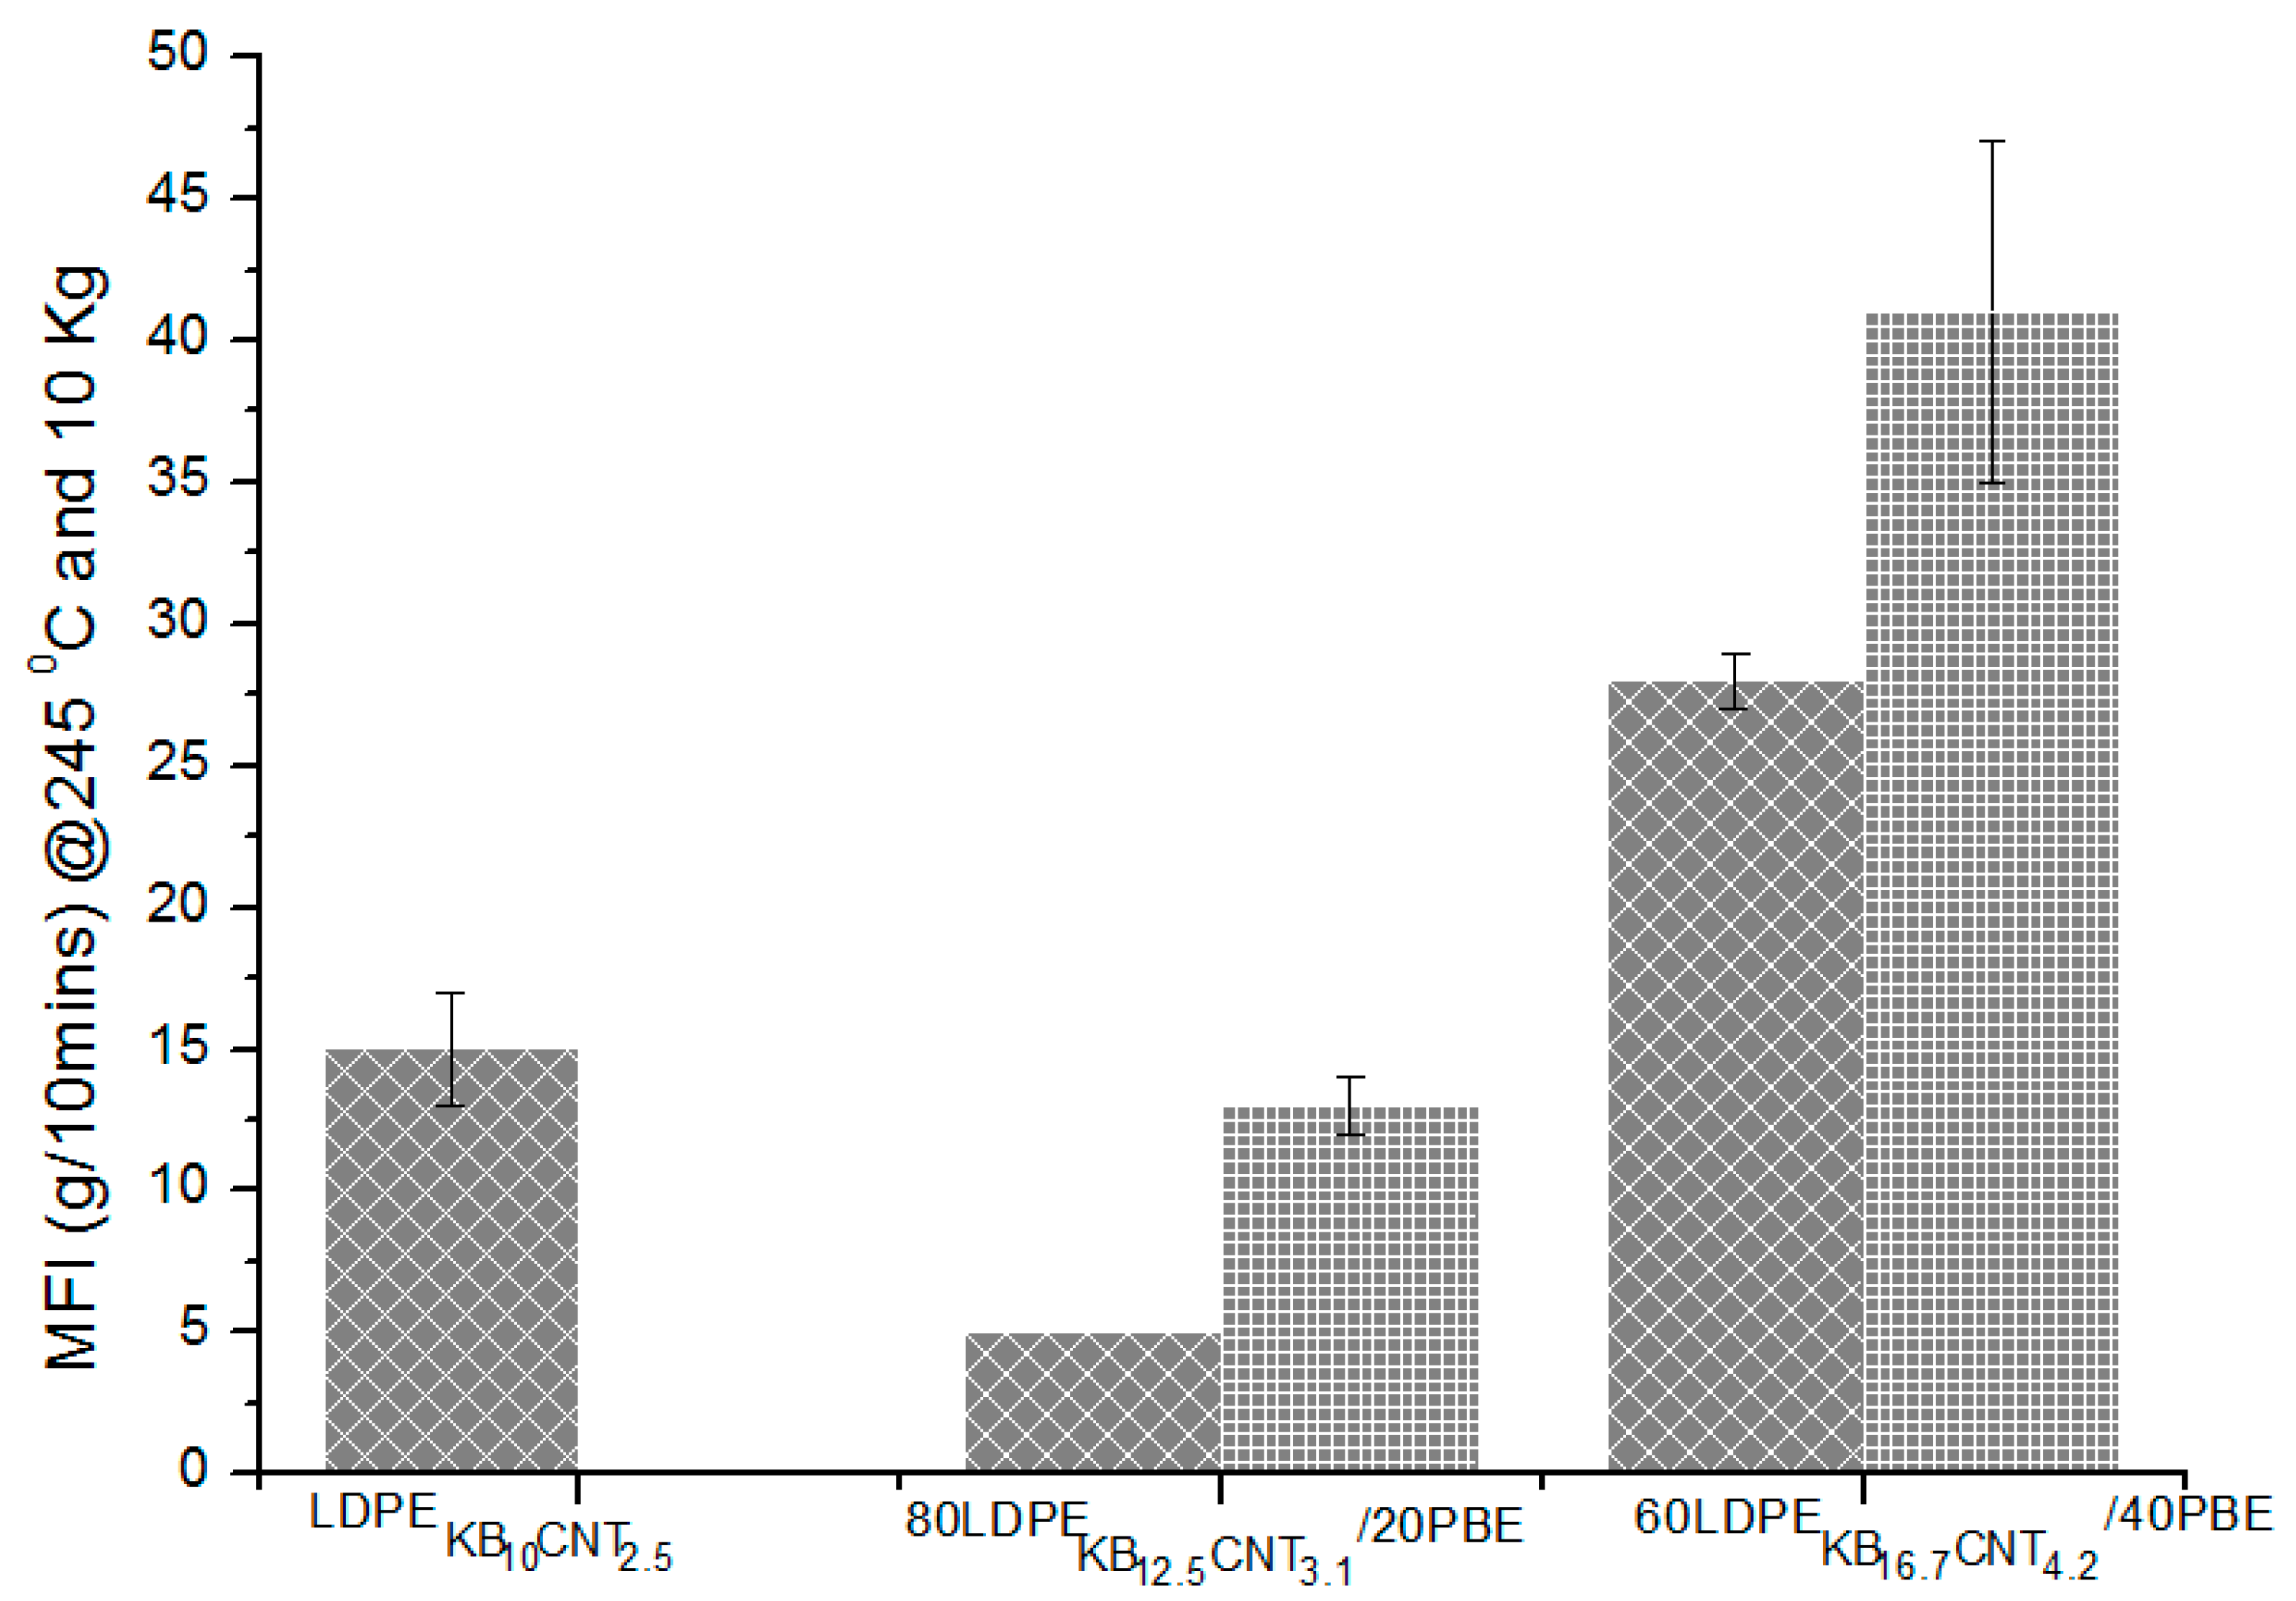
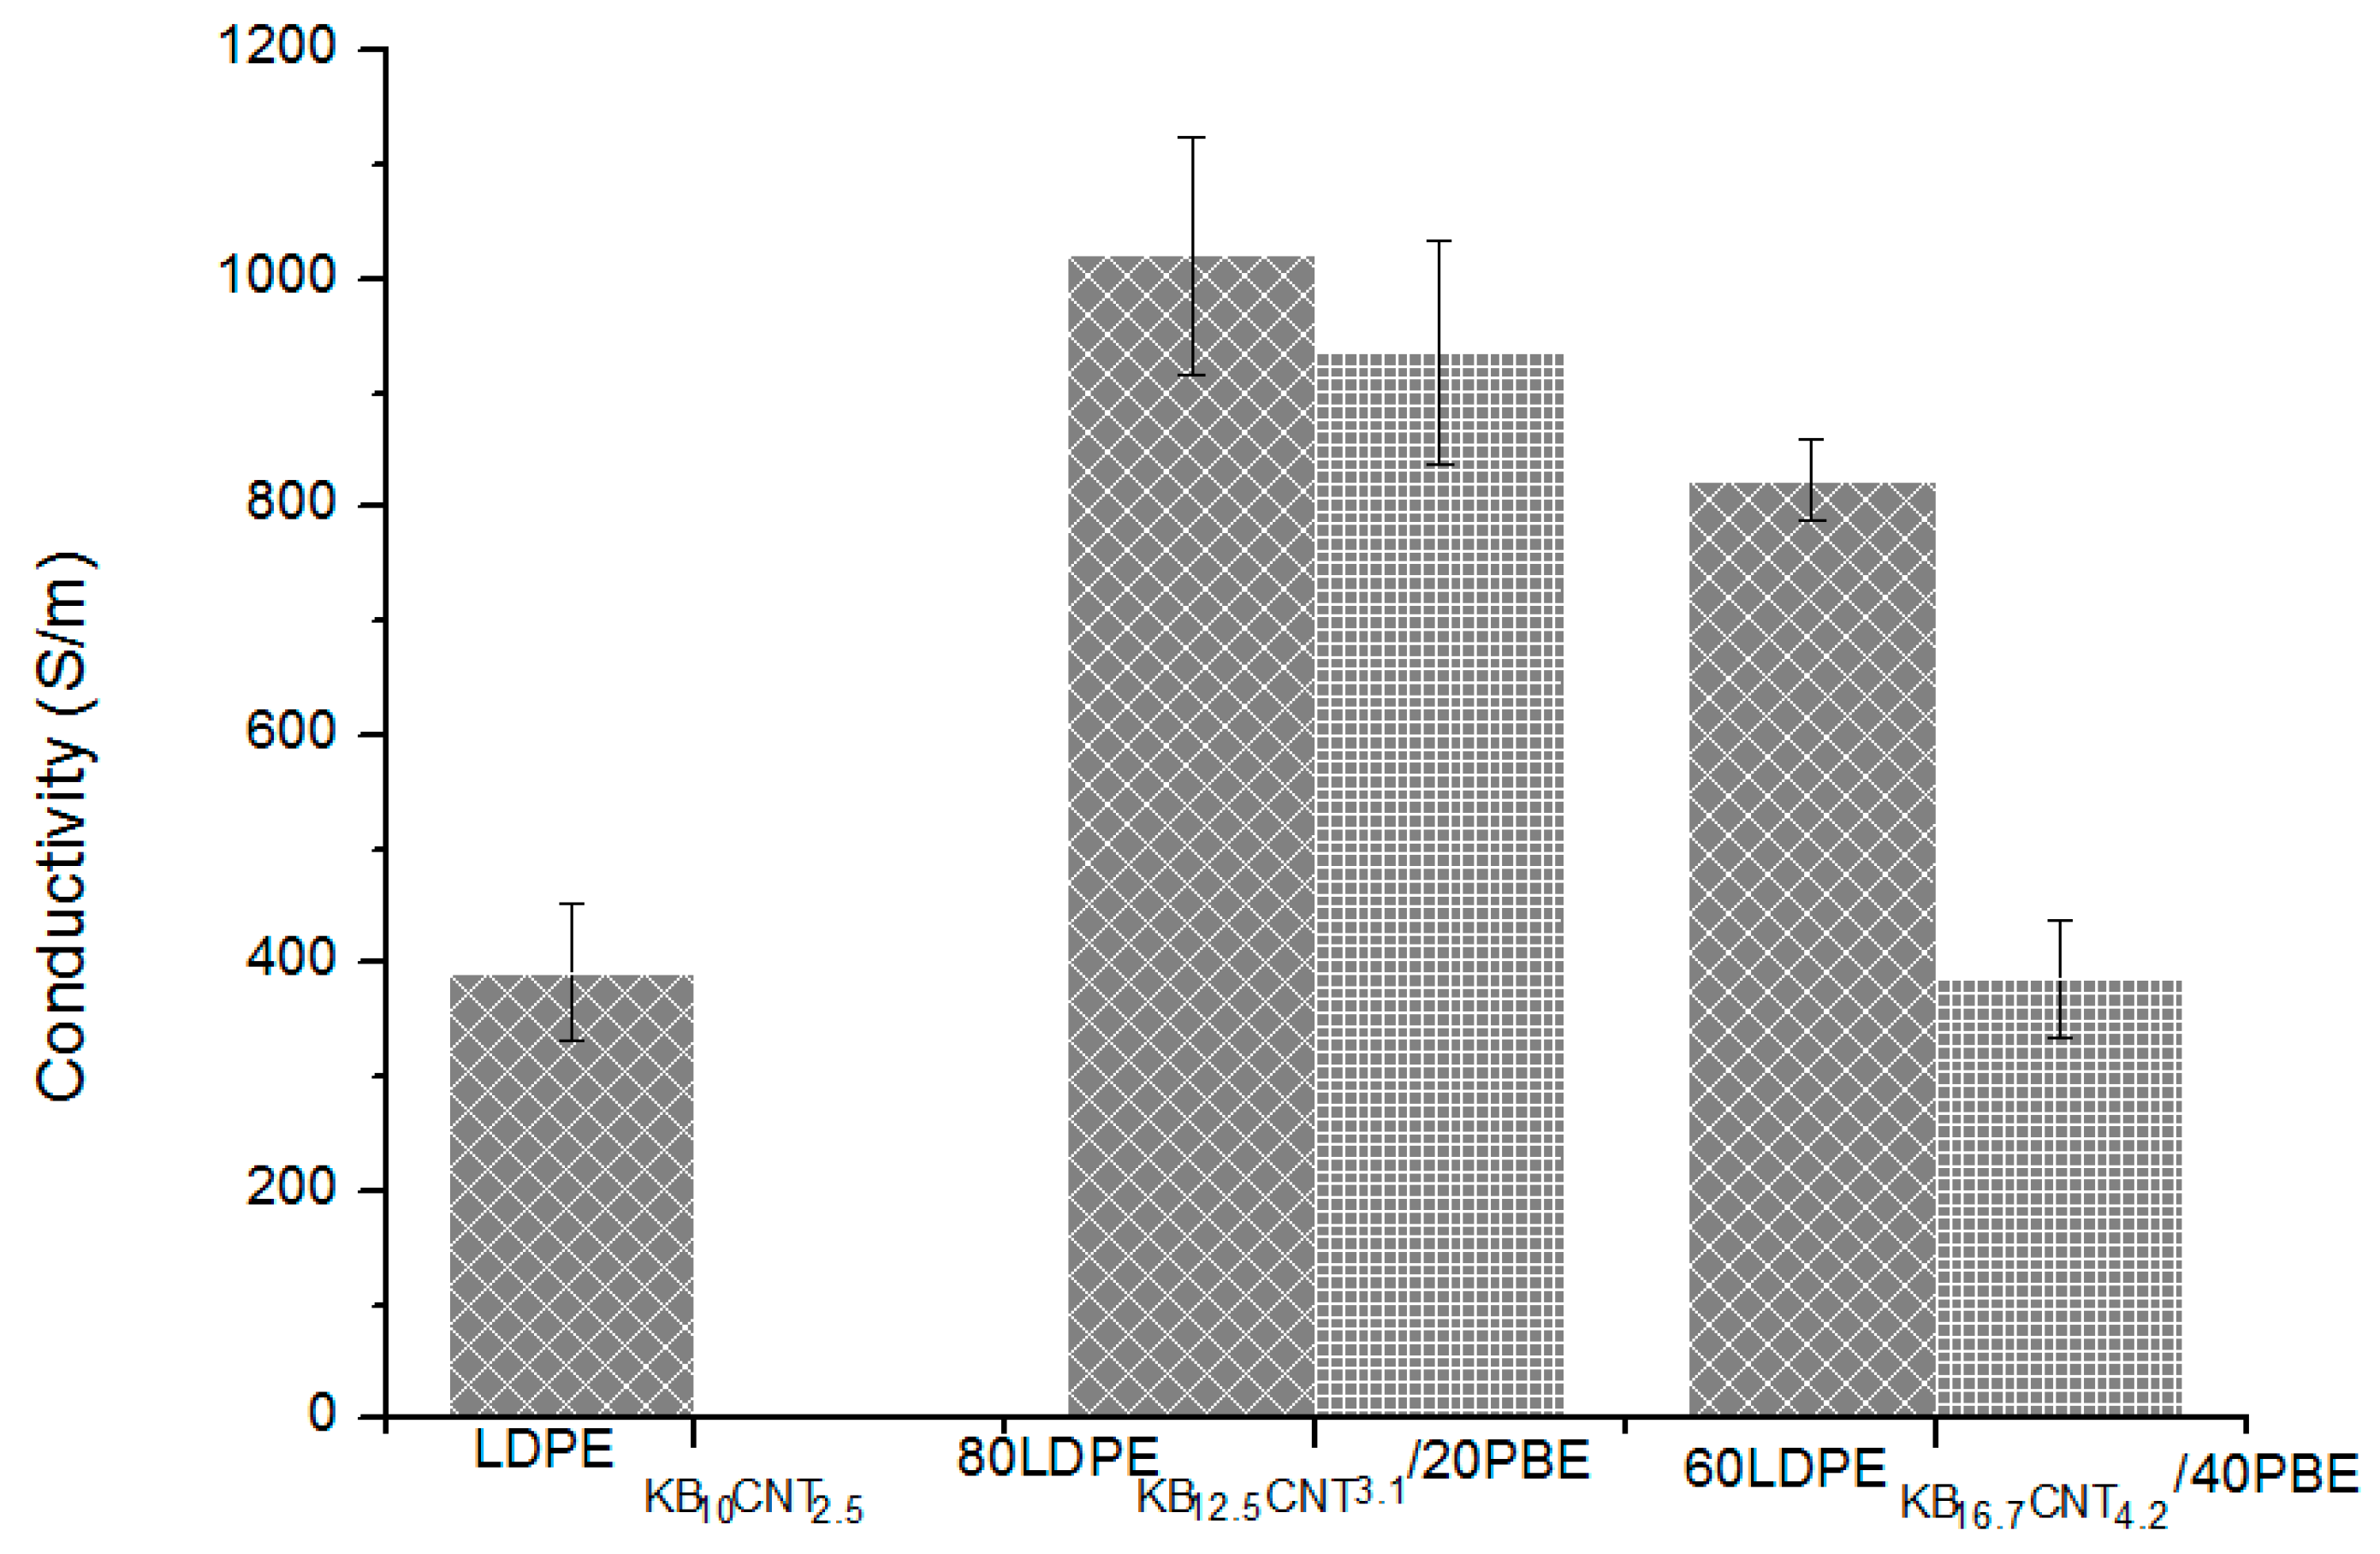
3.2.5. Electrical Conductivity of Conducting LDPE/PBE Biphasic Polymer Blends in Monofilament
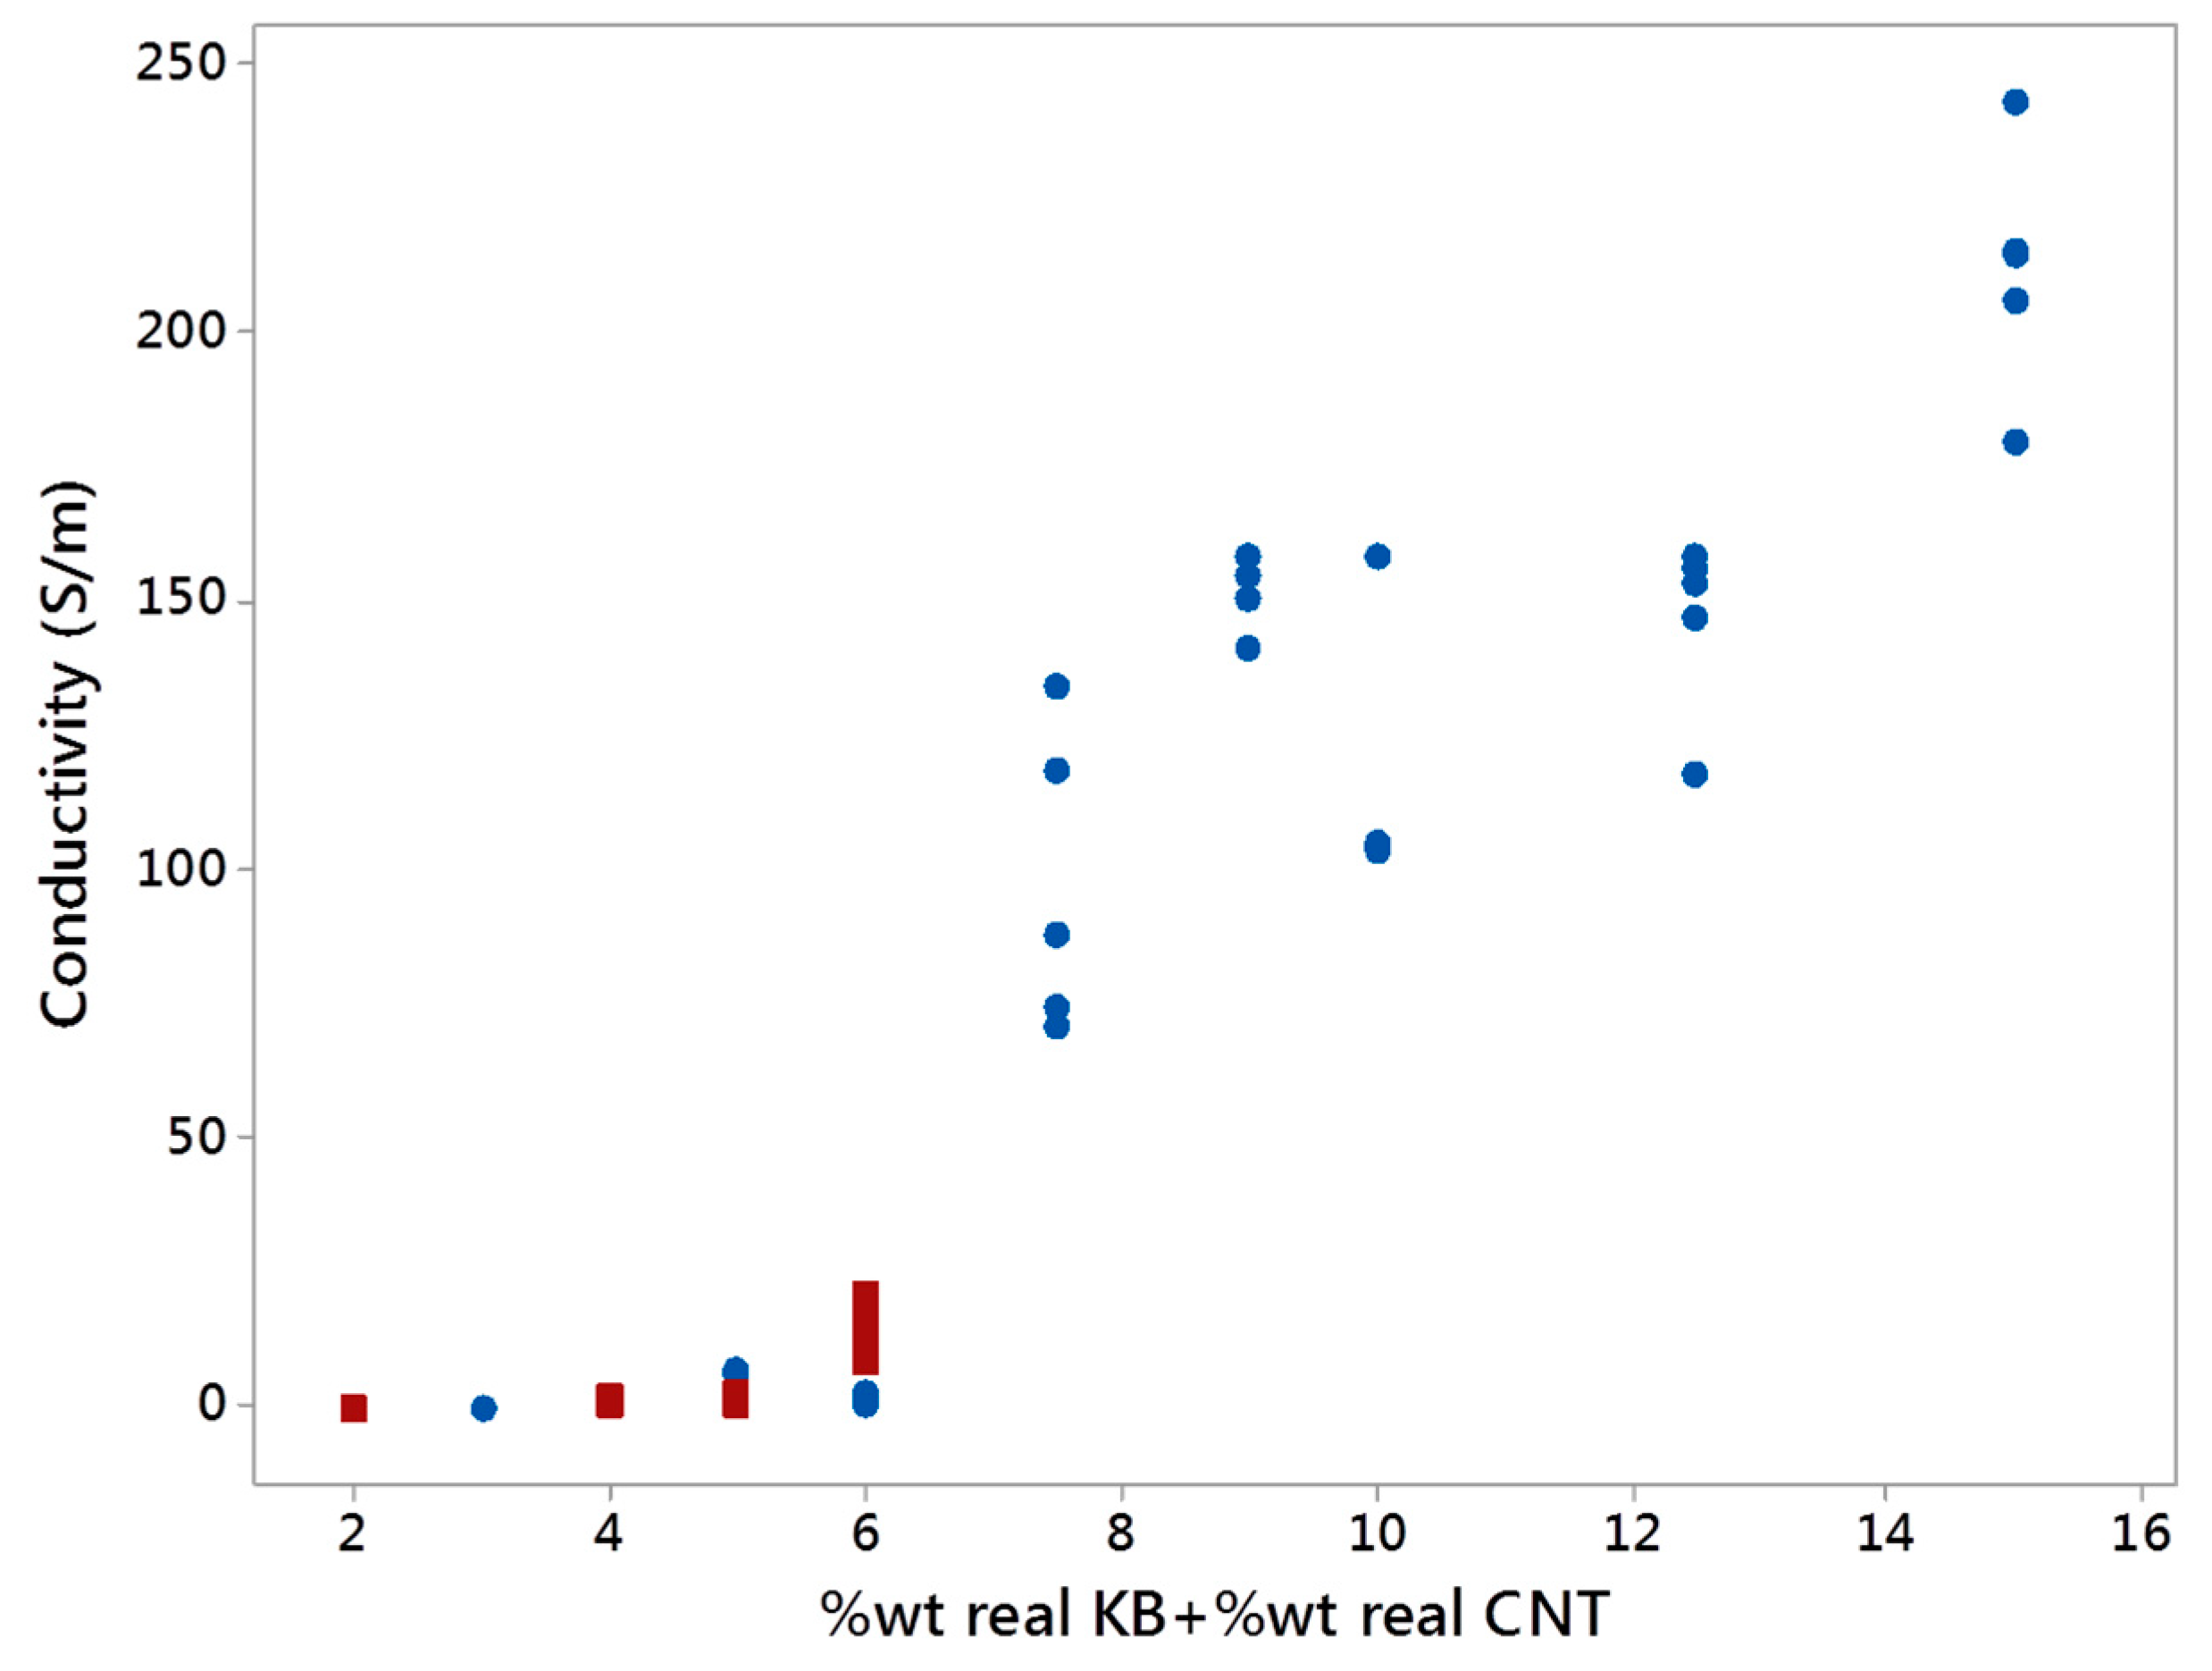
3.3. Analysis of Conducting LDPE/PBE Biphasic Polymer Blends at An Equivalent Global Ratio of Fillers
3.3.1. Morphology Analysis
3.3.2. Location of Fillers
3.3.3. Rheology Analysis
3.3.4. Electrical Conductivity
3.4. Properties of 3D-PPOT using Biphasic Polymer Blends
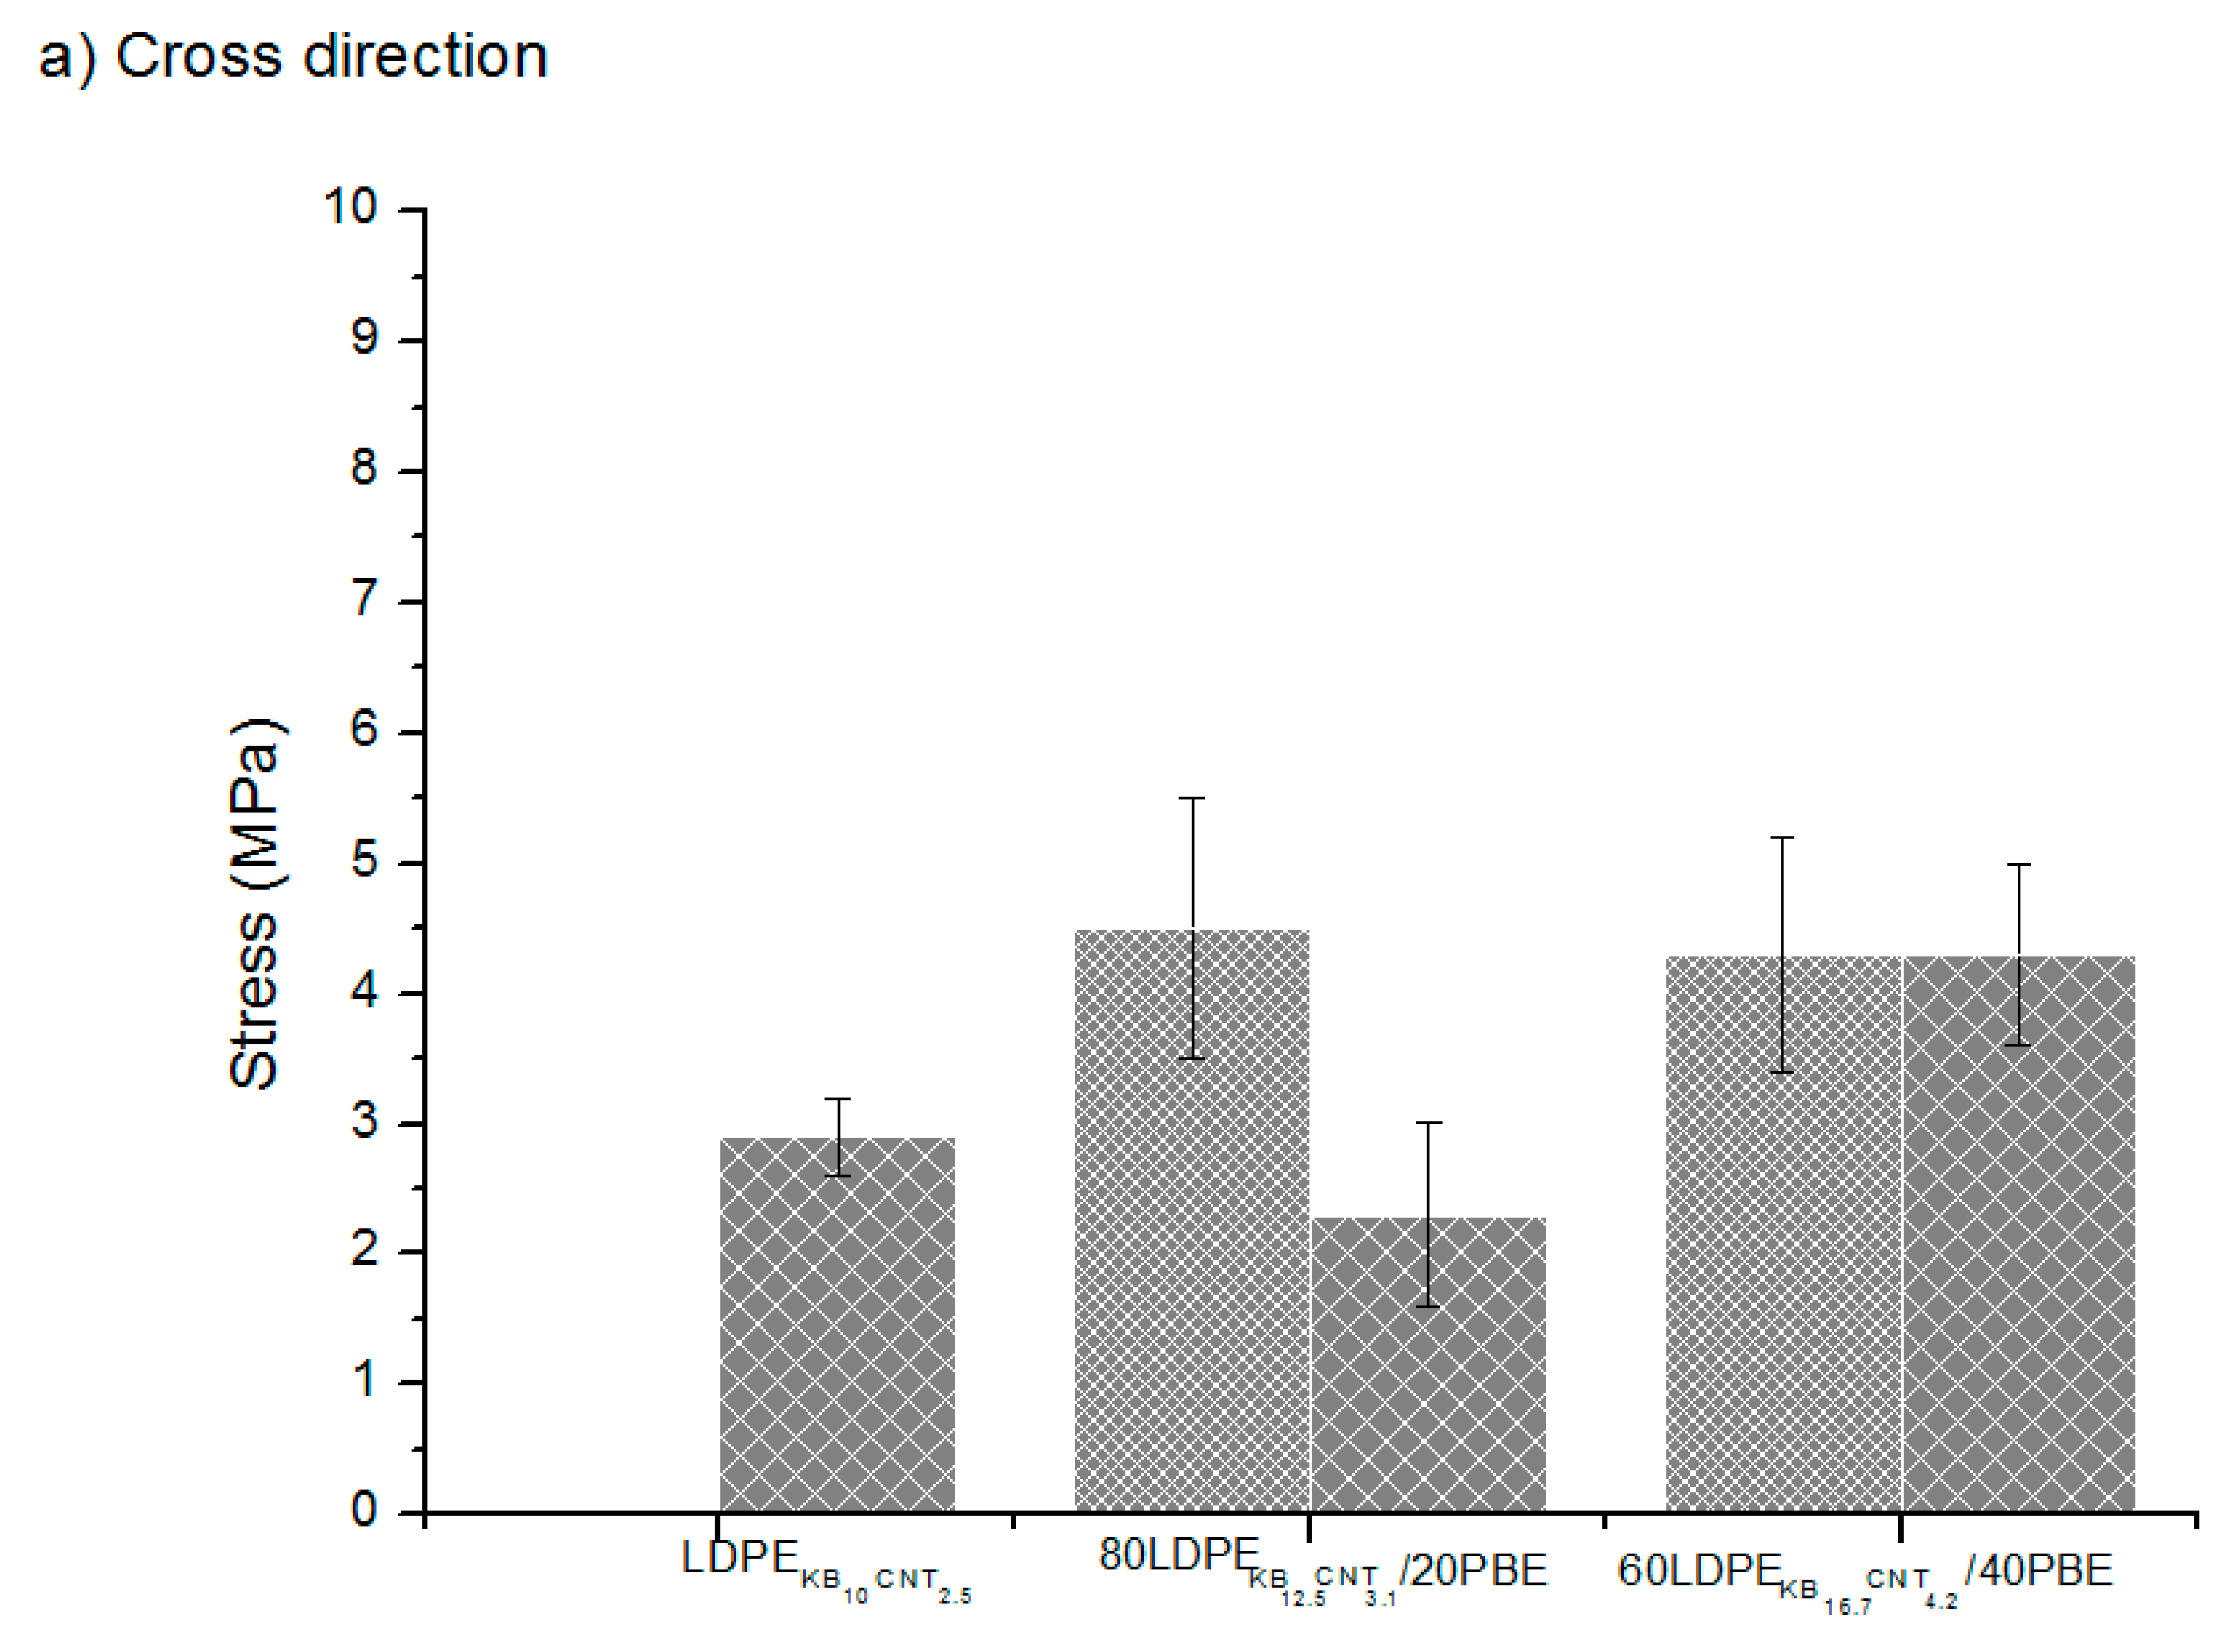
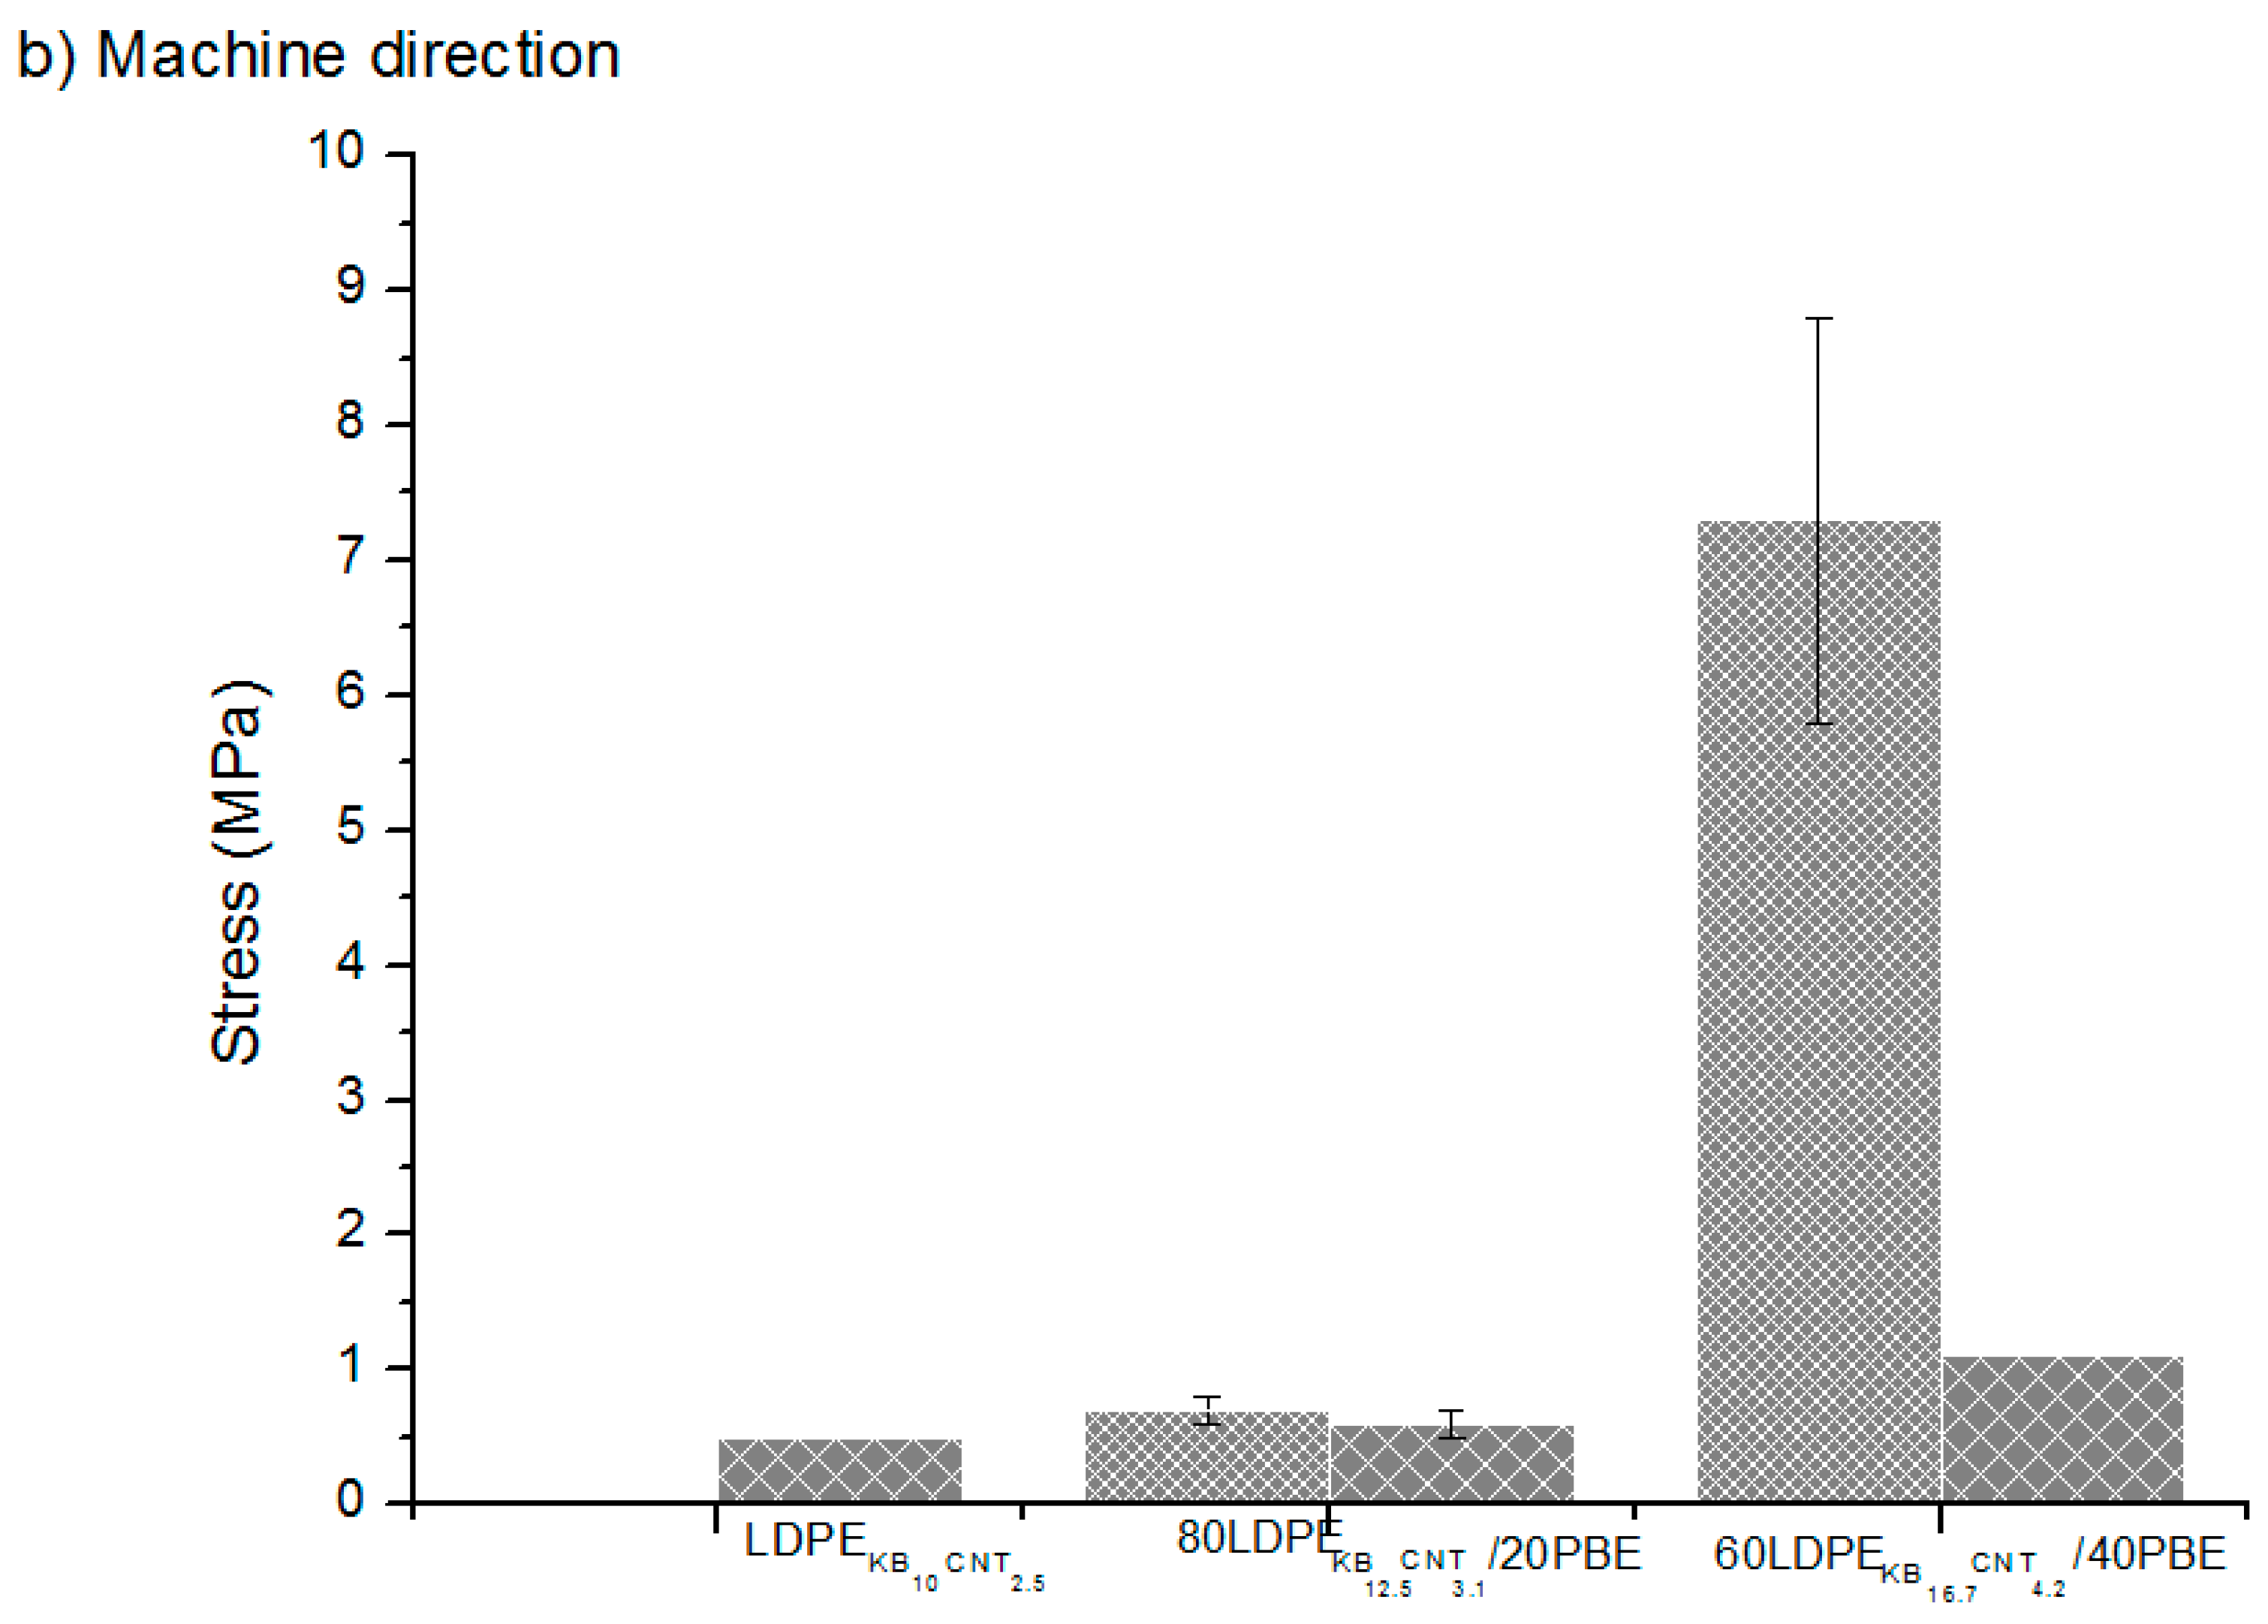
3.4.1. Tensile Properties
3.4.2. Deformation Properties
3.4.3. Electrical Conductivity Properties
4. Conclusions
Author Contributions
Funding
Acknowledgments
Conflicts of Interest
References
- Ransley, M.; Smitham, P.; Miodownik, M. Active chainmail fabrics for soft robotic applications. Smart Mater. Struct. 2017, 26, 8. [Google Scholar] [CrossRef]
- Hashemi Sanatgar, R.; Campagne, C.; Nierstrasz, V. Investigation of the adhesion properties of direct 3D printing of polymers and nanocomposites on textiles: Effect of FDM printing process parameters. Appl. Surf. Sci. 2017, 403, 551–563. [Google Scholar] [CrossRef]
- Mpofu, N.S.; Mwasiagi, J.I.; Nkiwane, L.C.; Njuguna, D. Use of regression to study the effect of fabric parameters on the adhesion of 3D printed PLA polymer onto woven fabrics. Fash. Text. 2019, 6, 24. [Google Scholar] [CrossRef]
- Eutionnat-Diffo, P.A.; Chen, Y.; Guan, J.; Cayla, A.; Campagne, C.; Zeng, X.; Nierstrasz, V. Stress, strain and deformation of poly-lactic acid filament deposited onto polyethylene terephthalate woven fabric through 3D printing process. Sci. Rep. 2019, 9, 1–18. [Google Scholar] [CrossRef] [PubMed]
- Eutionnat-Diffo, P.A.; Chen, Y.; Guan, J.; Cayla, A.; Campagne, C.; Zeng, X.; Nierstrasz, V. Optimization of adhesion of poly lactic acid 3D printed onto polyethylene terephthalate woven fabrics through modelling using textile properties. Rapid Prototyp. J. 2020, 26. [Google Scholar] [CrossRef]
- Döpke, C.; Grimmelsmann, N.; Ehrmann, A. 3D printing on knitted fabrics. Melliand Int. 2017, 23, 97–98. [Google Scholar]
- Sanatgar, R.H.; Cayla, A.; Campagne, C.; Nierstrasz, V. Morphological and electrical characterization of conductive polylactic acid based nanocomposite before and after FDM 3D printing. J. Appl. Polym. Sci. 2018, 136, 47040. [Google Scholar] [CrossRef]
- Grimmelsmann, N.; Kreuziger, M.; Korger, M.; Meissner, H.; Ehrmann, A. Adhesion of 3D printed material on textile substrates. Rapid. Prototyp. J. 2018, 24, 166–170. [Google Scholar] [CrossRef]
- Spahiu, T.; Fafenrot, S.; Grimmelsmann, N.; Piperi, E.; Shehi, E.; Ehrmann, A. Varying fabric drape by 3D-imprinted patterns for garment design. IOP Conf. Ser. Mater. Sci. Eng. 2017, 254. [Google Scholar] [CrossRef]
- Pei, E.; Shen, J.; Watling, J. Direct 3D printing of polymers onto textiles: Experimental studies and applications. Rapid. Prototyp. J. 2015, 21, 556–571. [Google Scholar] [CrossRef]
- Shin, D.-G.; Kim, T.-H.; Kim, D.-E. Review of 4D Printing Materials and their Properties. Int. J. Precis. Eng. Manuf. Technol. 2017, 4, 349–357. [Google Scholar] [CrossRef]
- Tadesse, M.G.; Dumitrescu, D.; Loghin, C.; Chen, Y.; Wang, L.; Nierstrasz, V. 3D Printing of NinjaFlex Filament onto PEDOT:PSS-Coated Textile Fabrics for Electroluminescence Applications. J. Electron. Mater. 2018, 47, 2082–2092. [Google Scholar] [CrossRef]
- Schirmeister, C.G.; Hees, T.; Licht, E.H.; Mülhaupt, R. 3D printing of high density polyethylene by fused filament fabrication. Addit. Manuf. 2019, 28, 152–159. [Google Scholar] [CrossRef]
- Selke, S.E.M. Packaging: Polymers in Flexible Packaging. Ref. Modul. Mater. Sci. Mater. Eng. 2019, 1–5. [Google Scholar] [CrossRef]
- Villmow, T.; Pegel, S.; John, A.; Rentenberger, R.; Pötschke, P. Liquid sensing: Smart polymer/CNT composites. Mater. Today 2011, 14, 340–345. [Google Scholar] [CrossRef]
- Feller, J.F.; Linossier, I.; Levesque, G. Conductive Polymer Composites (CPCs): Comparison of electrical properties of poly(ethylene-co-ethyl acrylate)-carbon black with poly(butylene terephthalate)/poly(ethylene-co-ethyl acrylate)-carbon black. Polym. Adv. Technol. 2002, 13, 714–724. [Google Scholar] [CrossRef]
- Deng, H.; Du, R.; Duan, L.; Fu, Q. Strain sensing conductive polymer composites: Sensitivity and stability. AIP Conf. Proc. 2016, 1713, 090001. [Google Scholar] [CrossRef]
- Paredes-Madrid, L.; Matute, A.; Bareño, J.O.; Vargas, C.A.P.; Velásquez, E.I.G. Underlying physics of conductive polymer composites and Force Sensing Resistors (FSRs). A study on creep response and dynamic loading. Materials 2017, 10, 1334. [Google Scholar] [CrossRef]
- Marischal, L.; Cayla, A.; Lemort, G.; Campagne, C.; Éric, D. Selection of immiscible polymer blends filled with carbon nanotubes for heating applications. Polymers 2019, 11, 1827. [Google Scholar] [CrossRef]
- Cayla, A.; Campagne, C.; Rochery, M.; Devaux, E. Electrical, rheological properties and morphologies of biphasic blends filled with carbon nanotubes in one of the two phases. Synth. Met. 2011, 161, 1034–1042. [Google Scholar] [CrossRef]
- Chum, P.S.; Swogger, K.W. Olefin polymer technologies-History and recent progress at The Dow Chemical Company. Prog. Polym. Sci. 2008, 33, 797–819. [Google Scholar] [CrossRef]
- Wu, G.; Li, B.; Jiang, J. Carbon black self-networking induced co-continuity of immiscible polymer blends. Polymer 2010, 51, 2077–2083. [Google Scholar] [CrossRef]
- Balazs, A.C.; Emrick, T.; Russell, T.P. Nanoparticle polymer composites: Where two small worlds meet. Science 2006, 314, 1107–1110. [Google Scholar] [CrossRef]
- Hom, S.; Bhattacharyya, A.R.; Khare, R.A.; Kulkarni, A.R.; Saroop, M.; Biswas, A. PP/ABS blends with carbon black: Morphology and electrical properties. J. Appl. Polym. Sci. 2009, 112, 998–1004. [Google Scholar] [CrossRef]
- Al-Saleh, M.H.; Sundararaj, U. Review of the mechanical properties of carbon nanofiber/polymer composites. Compos. Part A Appl. Sci. Manuf. 2011, 42, 2126–2142. [Google Scholar] [CrossRef]
- Kelnar, I.; Rotrekl, J.; Kotek, J.; Kaprálková, L. Effect of montmorillonite modification on the behaviour of polyamide/polystyrene blends. Polym. Int. 2008, 57, 1281–1286. [Google Scholar] [CrossRef]
- Wu, D.; Wu, L.; Zhou, W.; Sun, Y.; Zhang, M. Relations between the aspect ratio of carbon nanotubes and the formation of percolation networks in biodegradable polylactide/carbon nanotube composites. J. Polym. Sci. Part B Polym. Phys. 2010, 48, 479–489. [Google Scholar] [CrossRef]
- Filippone, G.; Dintcheva, N.T.; La Mantia, F.P.; Acierno, D. Using organoclay to promote morphology refinement and co-continuity in high-density polyethylene/polyamide 6 blends - Effect of filler content and polymer matrix composition. Polymer 2010, 51, 3956–3965. [Google Scholar] [CrossRef]
- Gubbels, F.; Jérôme, R.; Teyssie, P.; Vanlathem, E.; Deltour, R.; Calderone, A.; Parente, V.; Brédas, J.L. Selective Localization of Carbon Black in Immiscible Polymer Blends: A Useful Tool To Design Electrical Conductive Composites. Macromolecules 1994, 27, 1972–1974. [Google Scholar] [CrossRef]
- Meng, H.; Sui, G.X.; Fang, P.F.; Yang, R. Effects of acid- and diamine-modified MWNTs on the mechanical properties and crystallization behavior of polyamide 6. Polymer 2008, 49, 610–620. [Google Scholar] [CrossRef]
- DOWTM 722 Low Density Polyethylene Resin n.d. Available online: https://www.dow.com/en-us/pdp.dow-722-low-density-polyethylene-resin.62814z.html (accessed on 25 June 2020).
- VistamaxxTM 6202 Elastomer, Propylene-based. 2012. Available online: http://www.matweb.com/search/datasheettext.aspx?matguid=55dee1d869ed4fdb8574619ff21a0f6b (accessed on 25 June 2020).
- Wang, X.; Hu, S.; Guo, Y.; Li, G.; Xu, R. Toughened high-flow polypropylene with polyolefin-based elastomers. Polymers 2019, 11, 1976. [Google Scholar] [CrossRef] [PubMed]
- Fowkes, F.M. Attractive forces at interfaces. Ind. Eng. Chem. 1964, 56, 40–52. [Google Scholar] [CrossRef]
- Cardinaud, R.; McNally, T. Localization of MWCNTs in PET/LDPE blends. Eur. Polym. J. 2013, 49, 1287–1297. [Google Scholar] [CrossRef]
- Owens, D.K.; Wendt, R.C. Estimation of the surface free energy of polymers. J. Appl. Polym. Sci. 1969, 13, 1741–1747. [Google Scholar] [CrossRef]
- Park, S.J.; Kim, J.S. Surface energy characterization of modified carbon blacks and its relationship to composites tearing properties. J. Adhes. Sci. Technol. 2001, 15, 1443–1452. [Google Scholar] [CrossRef]
- Carbon nanotubes, SEM n.d. Available online: https://www.sciencephoto.com/media/874476/view/carbon-nanotubes-sem (accessed on 20 September 2020).
- KETJENBLACK Highly Electro-Conductive Carbon Black n.d. Available online: https://www.lion-specialty-chem.co.jp/en/product/carbon/carbon01.htm (accessed on 12 May 2020).
- Manasoglu, G.; Celen, R.; Kanik, M.; Ulcay, Y. Electrical resistivity and thermal conductivity properties of graphene-coated woven fabrics. J. Appl. Polym. Sci. 2019, 136, 1–8. [Google Scholar] [CrossRef]
- Ku, T.H.; Lin, C.A. Rheological properties of thermoplastic polyvinyl alcohol and polypropylene blend melts in capillary extrusions. J. Polym. Res. 2005, 12, 23–29. [Google Scholar] [CrossRef]
- Baudouin, A.-C.; Bailly, C.; Devaux, J. Interface localization of carbon nanotubes in blends of two copolymers. Polym. Degrad. Stab. 2010, 95, 389–398. [Google Scholar] [CrossRef]
- Nuzzo, A.; Bilotti, E.; Peijs, T.; Acierno, D.; Filippone, G. Nanoparticle-induced co-continuity in immiscible polymer blends—A comparative study on bio-based PLA-PA11 blends filled with organoclay, sepiolite, and carbon nanotubes. Polymer 2014, 55, 4908–4919. [Google Scholar] [CrossRef]
- Refaa, Z.; Boutaous, M.; Xin, S.; Siginer, D.A. Thermophysical analysis and modeling of the crystallization and melting behavior of PLA with talc: Kinetics and crystalline structures. J. Therm. Anal. Calorim. 2017, 128, 687–698. [Google Scholar] [CrossRef]
- Battegazzore, D.; Bocchini, S.; Frache, A. Crystallization kinetics of poly(lactic acid)-talc composites. Express Polym. Lett. 2011, 5, 849–858. [Google Scholar] [CrossRef]
- Yang, Z.; Peng, H.; Wang, W.; Liu, T. Crystallization behavior of poly(ε-caprolactone)/layered double hydroxide nanocomposites. J. Appl. Polym. Sci. 2010, 116, 2658–2667. [Google Scholar] [CrossRef]
- Shi, X.; Jing, Z.; Zhang, G. Influence of PLA stereocomplex crystals and thermal treatment temperature on the rheology and crystallization behavior of asymmetric poly(L-Lactide)/poly(D-lactide) blends. J. Polym. Res. 2018, 25, 71. [Google Scholar] [CrossRef]


 ) or 2-step (
 ) extrusion.
) or 2-step () extrusion.
) extrusion.
) or 2-step () extrusion. )or 2-step () extrusion.
)or 2-step () extrusion.
)or 2-step () extrusion. )or 2-step () extrusion.
)or 2-step () extrusion.
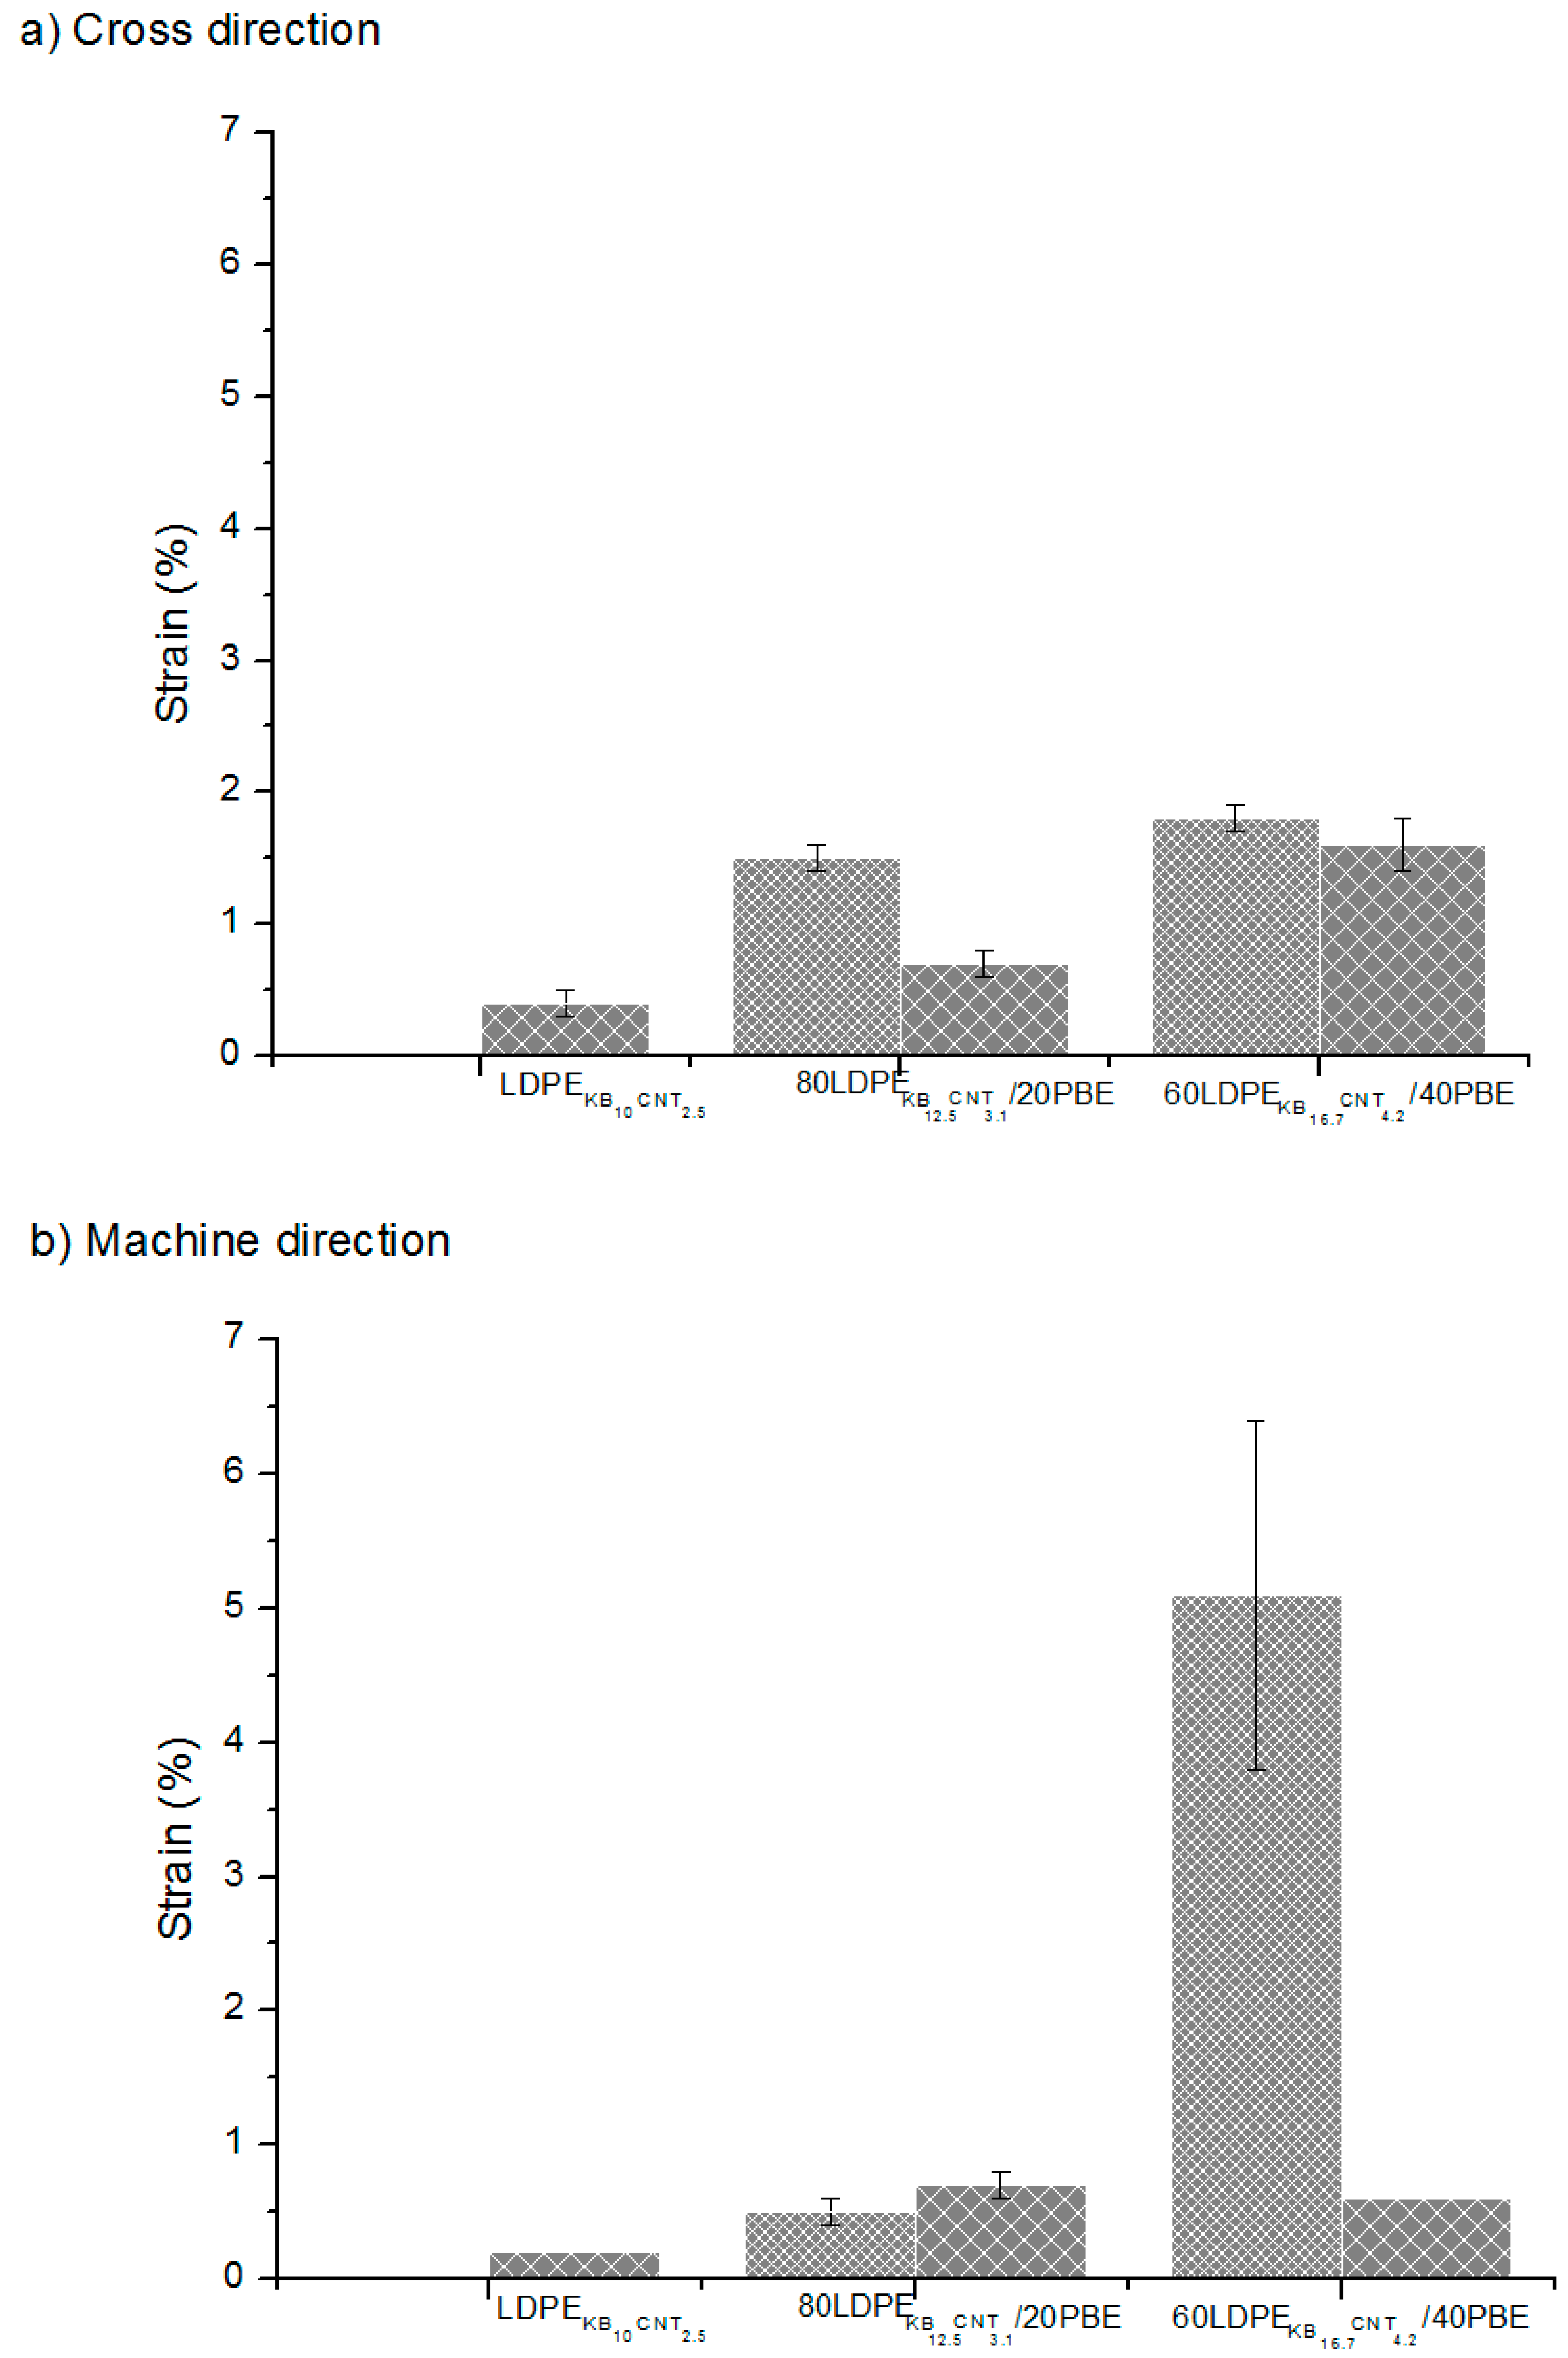
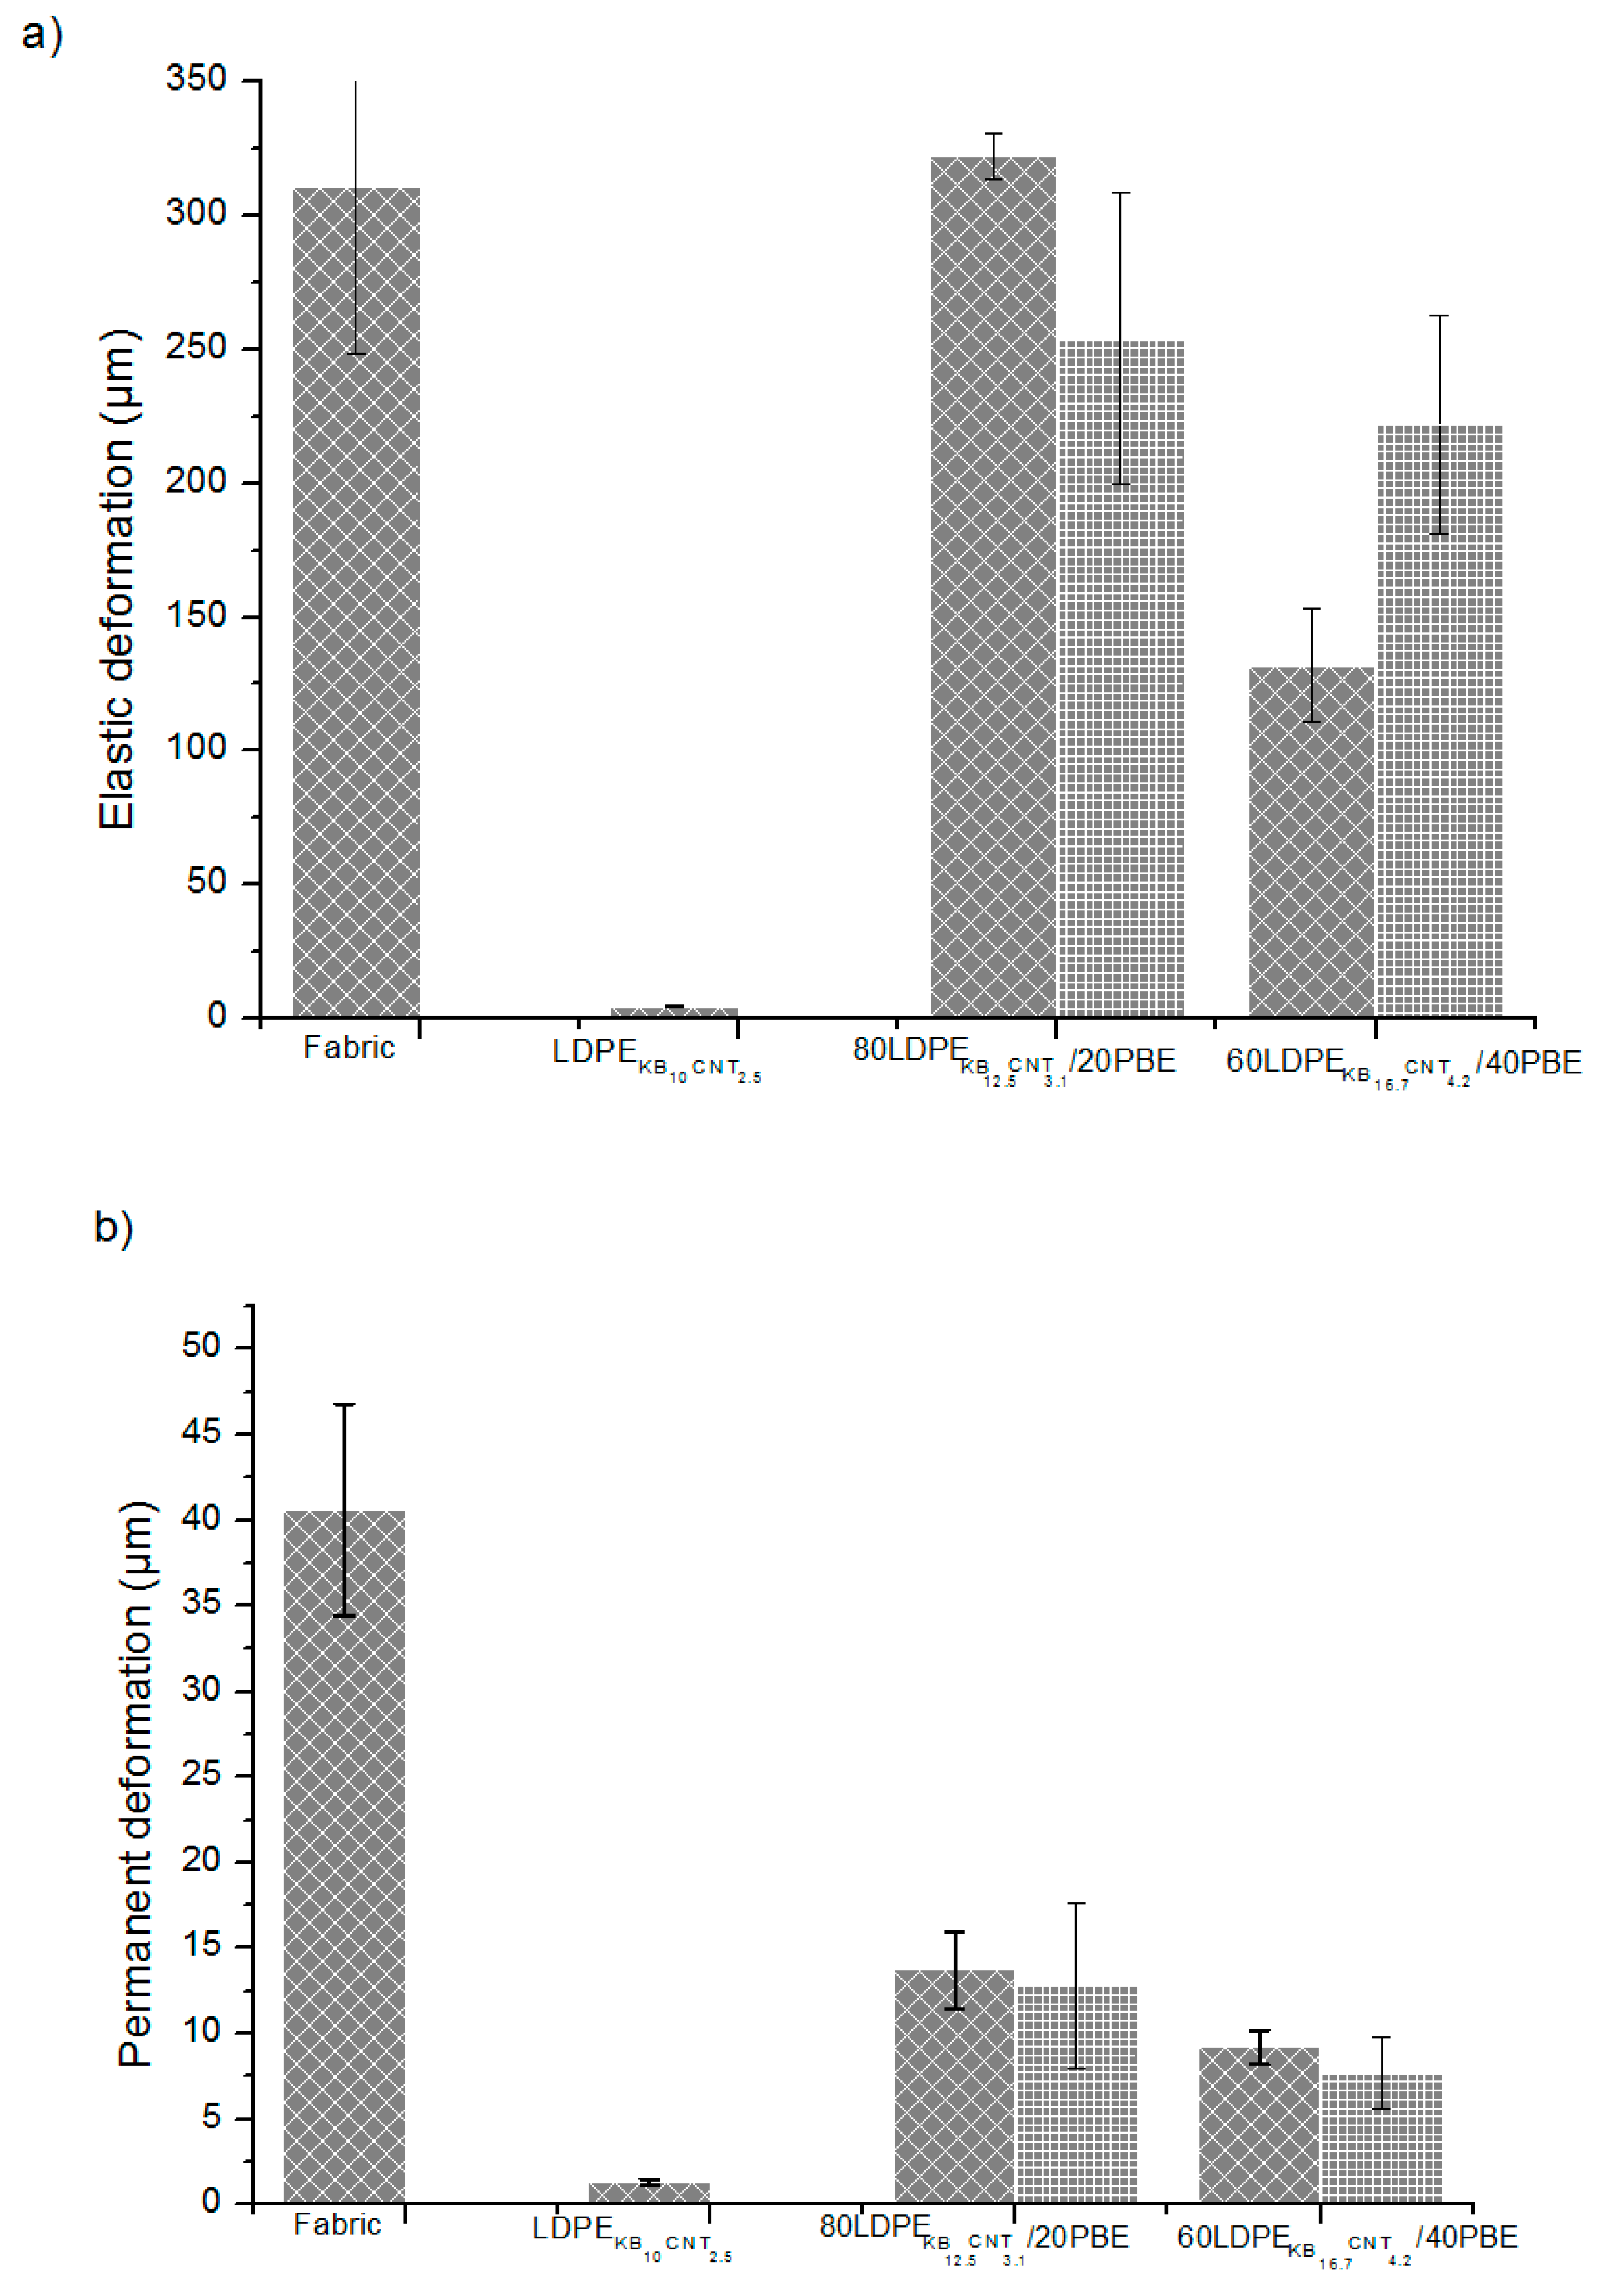
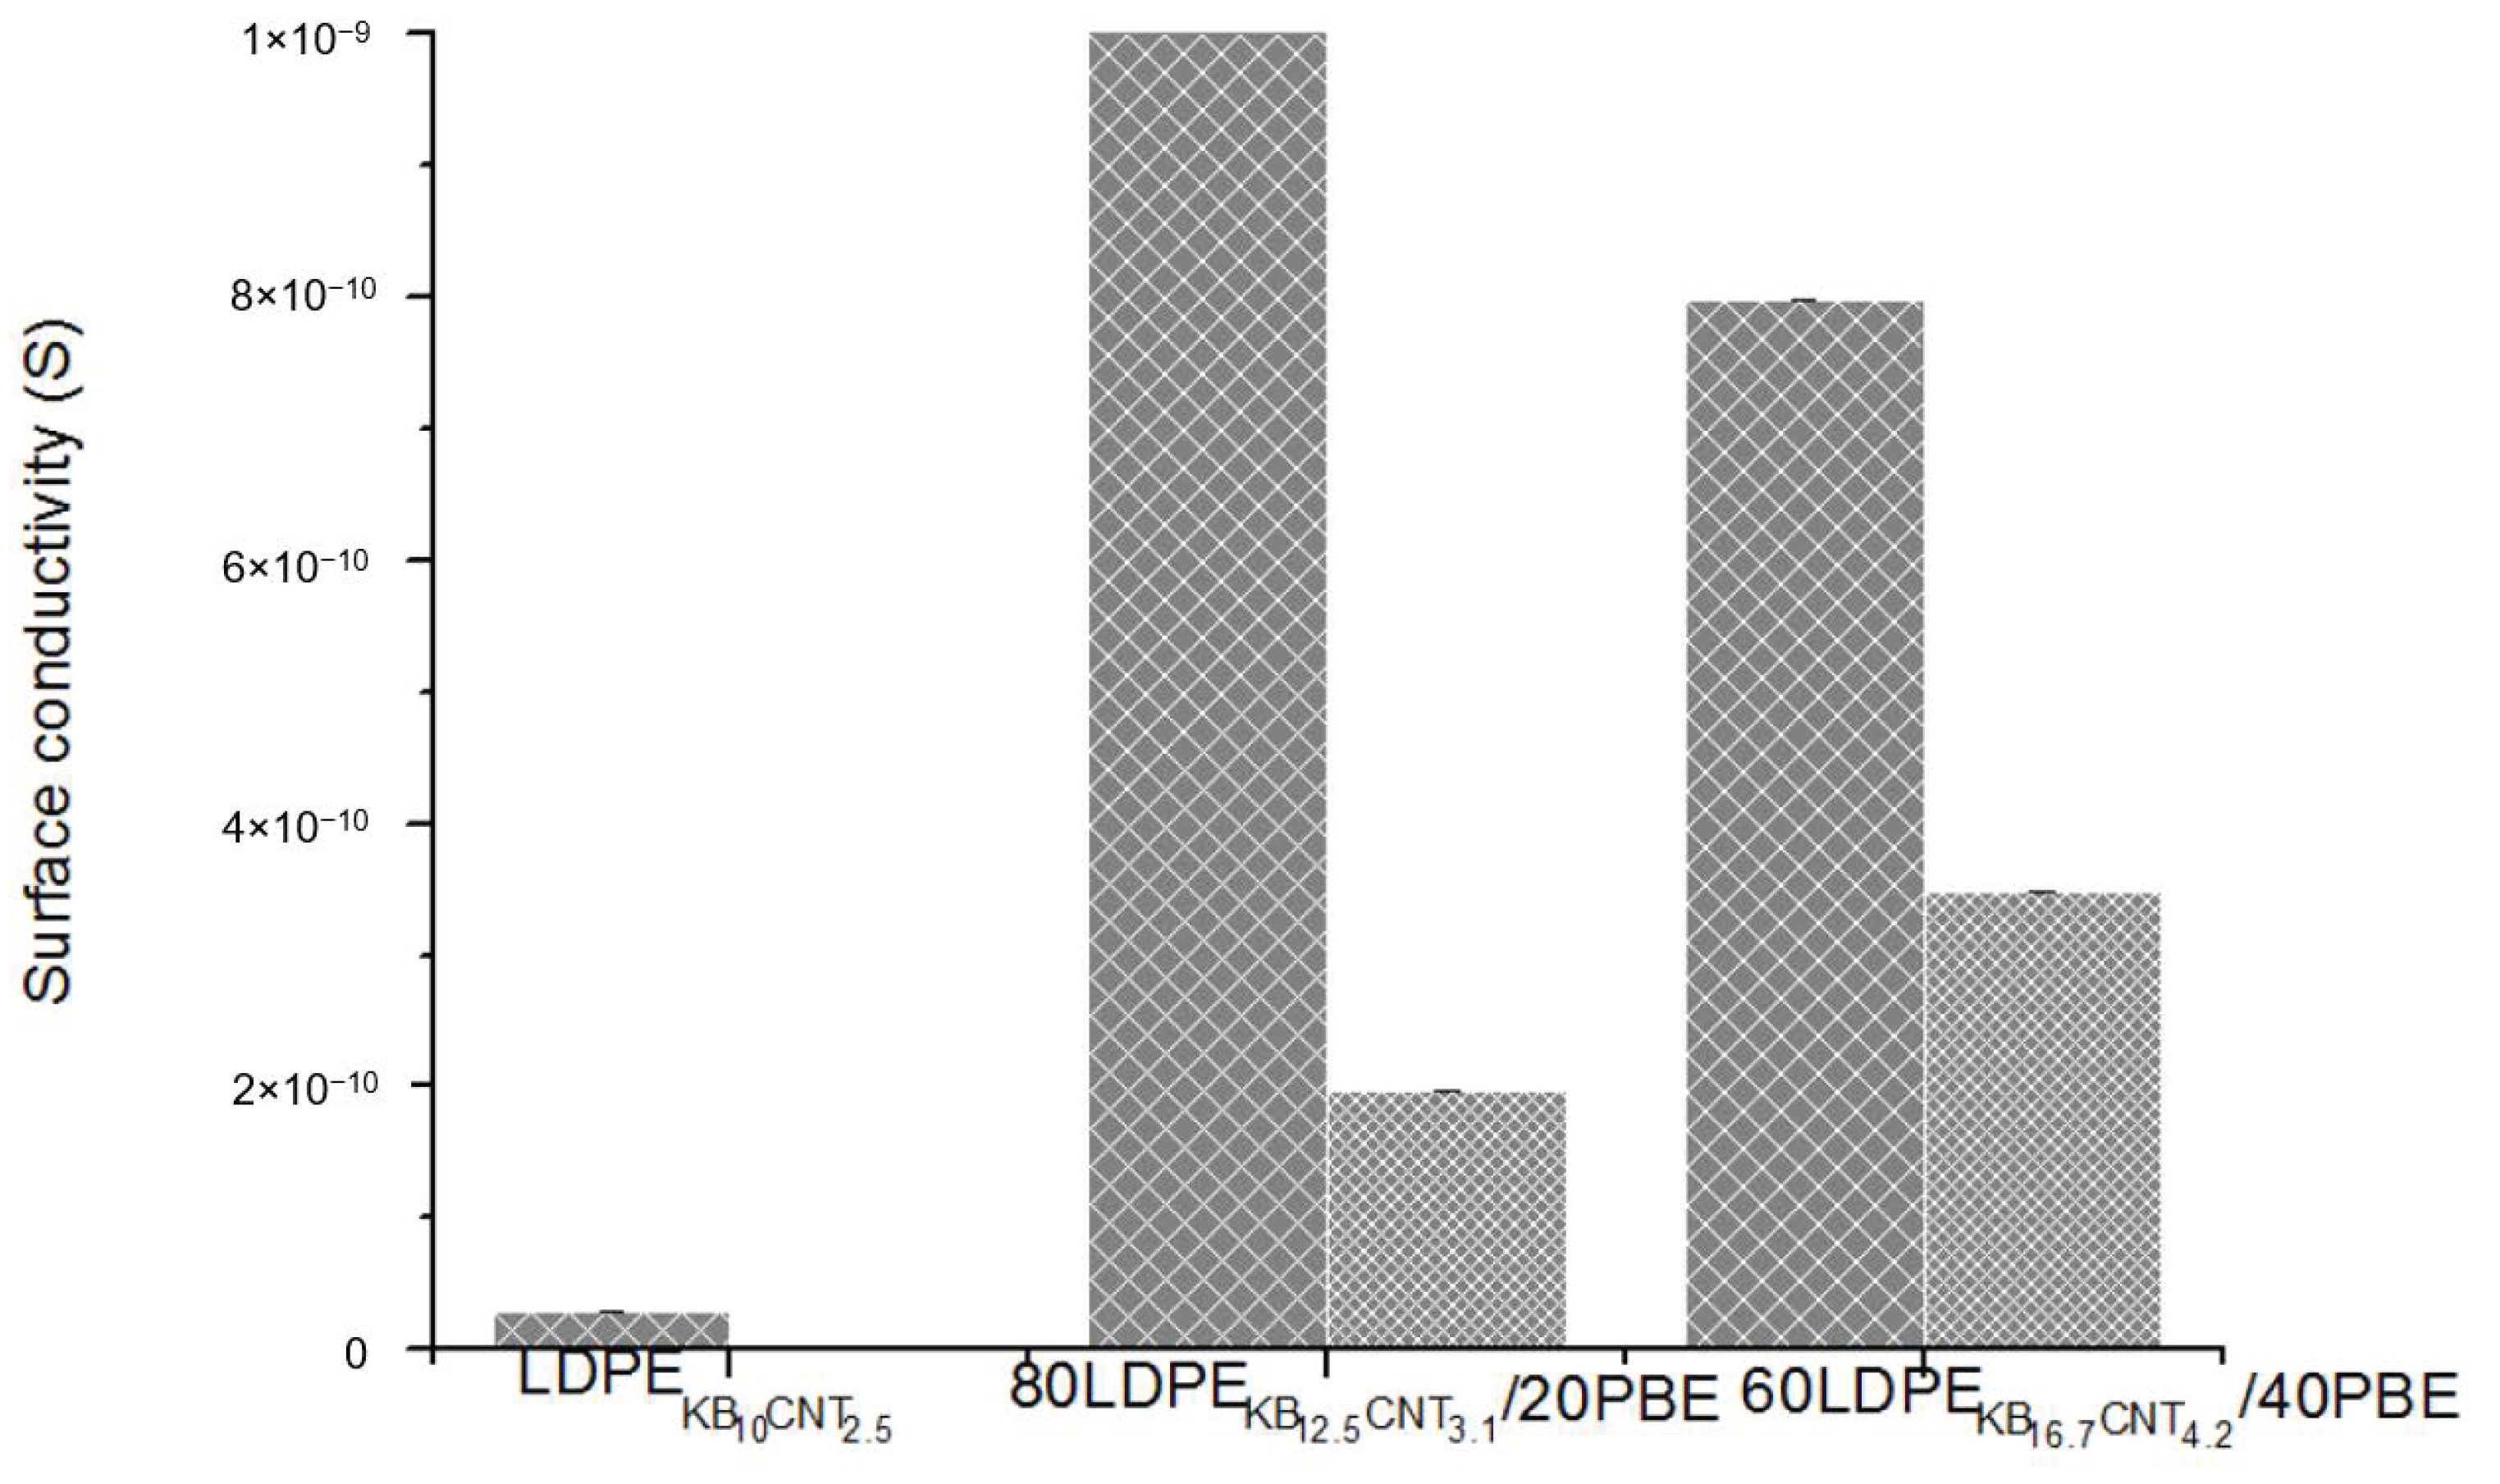
)or 2-step () extrusion. ) or 2-step () extrusion 3D-printed onto textile materials in the cross (a) and machine (b) directions of the fabric.
) or 2-step () extrusion 3D-printed onto textile materials in the cross (a) and machine (b) directions of the fabric.
) or 2-step () extrusion 3D-printed onto textile materials in the cross (a) and machine (b) directions of the fabric.
 ) or 2-step () extrusion 3D-printed onto textile materials in the cross (a) and machine (b) directions of the fabric.
) or 2-step () extrusion 3D-printed onto textile materials in the cross (a) and machine (b) directions of the fabric.
) or 2-step () extrusion 3D-printed onto textile materials in the cross (a) and machine (b) directions of the fabric. ) or 2-step () extrusion.
) or 2-step () extrusion.
) or 2-step () extrusion. ) or 2-step () extrusion.
) or 2-step () extrusion.
) or 2-step () extrusion.

| Sample Reference | Composition of (KB and CNT)-Filled LDPE * | Composition of KB- and CNT-Filled LDPE/PBE Blends | |||||
|---|---|---|---|---|---|---|---|
| wt% KB | wt% CNT | wt% LDPE | wt% (KB and CNT)-Filled LDPE | wt% PBE | |||
| wt% KB | wt% CNT | wt% LDPE | |||||
| A1 | 0 | 0 | 100 | 0 | 0 | 60 | 40 |
| A2 | 5 | 0 | 95 | 5 | 0 | 95 | 0 |
| A3 | 10 | 0 | 90 | 10 | 0 | 90 | 0 |
| A4 | 10 | 2.5 | 87.5 | 10 | 2.5 | 87.5 | 0 |
| A5 | 10 | 5 | 85 | 10 | 5 | 85 | 0 |
| A6 | 5 | 0 | 95 | 3 | 0 | 57 | 40 |
| A7 | 10 | 0 | 90 | 6 | 0 | 54 | 40 |
| A8 | 10 | 2.5 | 87.5 | 6 | 1.5 | 52.5 | 40 |
| A9 | 10 | 5 | 85 | 6 | 3 | 51 | 40 |
| A10 | 5 | 0 | 95 | 2 | 0 | 38 | 60 |
| A11 | 10 | 0 | 90 | 4 | 0 | 36 | 60 |
| A12 | 10 | 2.5 | 87.5 | 4 | 1 | 35 | 60 |
| A13 | 10 | 5 | 85 | 4 | 2 | 34 | 60 |
| A14 | 0 | 0 | 100 | 0 | 0 | 40 | 60 |
| Sample Reference | Composition of KB- and CNT- Filled LDPE Formulations | Composition of KB- and CNT-Filled LDPE/PBE Blend Formulations | Extrusion Scenario | |||||
|---|---|---|---|---|---|---|---|---|
| wt% KB | wt% CNT | wt% LDPE | wt% (KB and CNT)- Filled LDPE | wt% PBE | ||||
| wt% KB | wt% CNT | wt% LDPE | ||||||
| B1 | 10 | 2.5 | 87.5 | 10 | 2.5 | 87.5 | 0 | 1-step 1 |
| B2 | 12.5 | 3.1 | 84.4 | 10 | 2.5 | 67.5 | 20 | 1-step |
| B3 | 16.7 | 4.2 | 79.1 | 10 | 2.5 | 47.5 | 40 | 1-step |
| B4 | 12.5 | 3.1 | 84.4 | 10 | 2.5 | 67.5 | 20 | 2-step 2 |
| B5 | 16.7 | 4.2 | 79.1 | 10 | 2.5 | 47.5 | 40 | 2-step |
| Sample Reference 1 | Description of Polymer Blends | T1 (°C) | T2 (°C) | T3 (°C) | T4 (°C) | T5 (°C) |
|---|---|---|---|---|---|---|
| A5 A9 A13 | 125 | 175 | 215 | 225 | 240 | |
| A4, B1 A8 A12 | 125 | 175 | 210 | 220 | 240 | |
| A3 A7 A11 | 125 | 175 | 205 | 215 | 240 | |
| A2 A6 A10 | 125 | 175 | 195 | 210 | 230 | |
| A14 | 125 | 170 | 175 | 180 | 200 | |
| A1 | 125 | 170 | 175 | 180 | 200 | |
| B3, B5 | 120 | 220 | 250 | 260 | 270 | |
| B2, B4 | 120 | 220 | 250 | 260 | 270 |
| Parameters | Values (Unit) |
|---|---|
| Infill percentage | 100 (%) |
| Z offset (distance between the head) | 0 (mm) |
| Printing speed | 3600 (mm/mi) |
| Extruder diameter | 0.4 (mm) |
| Extruder temperature | 245 (°C) |
| Liquid | γL (mN/m) | γLD (mN/m) | γLP (mN/m) |
|---|---|---|---|
| Water | 72.6 | 21.6 | 51 |
| α-bromonaphthalene | 44.6 | 44.6 | 0 |
| Contact Angle (°) | ||
|---|---|---|
| Water | α-Bromonaphtalene | |
| PBE | 102.1 ± 1 | 45.6 ± 2 |
| Material | Ys (mN/m) | Ysd (mN/m) | Ysp (mN/m) |
|---|---|---|---|
| LDPE | 33.2 [36] | 33.2 [36] | 0 [36] |
| PBE | 11.7 | 5.5 | 6.3 |
| CNT | 27.8 [19] | 17.6 [19] | 10.2 [19] |
| KB (carbon black) | 71.2 [37] | 36.8 [37] | 34.4 [37] |
| KB | CNT | |
|---|---|---|
| ω PBE / LDPE | 0.31 ± 0.02 | −0.29 ± 0.01 |
| Location of fillers | Interface | Interface |
© 2020 by the authors. Licensee MDPI, Basel, Switzerland. This article is an open access article distributed under the terms and conditions of the Creative Commons Attribution (CC BY) license (http://creativecommons.org/licenses/by/4.0/).
Share and Cite
Eutionnat-Diffo, P.A.; Cayla, A.; Chen, Y.; Guan, J.; Nierstrasz, V.; Campagne, C. Development of Flexible and Conductive Immiscible Thermoplastic/Elastomer Monofilament for Smart Textiles Applications Using 3D Printing. Polymers 2020, 12, 2300. https://doi.org/10.3390/polym12102300
Eutionnat-Diffo PA, Cayla A, Chen Y, Guan J, Nierstrasz V, Campagne C. Development of Flexible and Conductive Immiscible Thermoplastic/Elastomer Monofilament for Smart Textiles Applications Using 3D Printing. Polymers. 2020; 12(10):2300. https://doi.org/10.3390/polym12102300
Chicago/Turabian StyleEutionnat-Diffo, Prisca Aude, Aurélie Cayla, Yan Chen, Jinping Guan, Vincent Nierstrasz, and Christine Campagne. 2020. "Development of Flexible and Conductive Immiscible Thermoplastic/Elastomer Monofilament for Smart Textiles Applications Using 3D Printing" Polymers 12, no. 10: 2300. https://doi.org/10.3390/polym12102300
APA StyleEutionnat-Diffo, P. A., Cayla, A., Chen, Y., Guan, J., Nierstrasz, V., & Campagne, C. (2020). Development of Flexible and Conductive Immiscible Thermoplastic/Elastomer Monofilament for Smart Textiles Applications Using 3D Printing. Polymers, 12(10), 2300. https://doi.org/10.3390/polym12102300