A Nonequilibrium Model for Particle Networking/Jamming and Time-Dependent Dynamic Rheology of Filled Polymers


Abstract
1. Introduction
2. Materials and Methods
3. Results and Discussion
4. Conclusions
Author Contributions
Funding
Acknowledgments
Conflicts of Interest
References
- Futamura, S. Effect of Material Properties on Tire Performance Characteristics—Part II, Tread Material. Tire Sci. Technol. 1990, 18, 2–12. [Google Scholar] [CrossRef]
- Warasitthinon, N.; Robertson, C.G. Interpretation of the tanδ Peak Height for Particle-Filled Rubber and Polymer Nanocomposites with Relevance to Tire Tread Performance Balance. Rubber Chem. Technol. 2018, 91, 577–594. [Google Scholar] [CrossRef]
- Ferry, J.D. Viscoelastic Properties of Polymers, 3rd ed.; John Wiley & Sons, Inc.: New York, NY, USA, 1980. [Google Scholar]
- Roland, C.M. Viscoelastic Behavior of Rubbery Materials; Oxford University Press, Inc.: New York, NY, USA, 2011. [Google Scholar]
- Shaw, M.T. Introduction to Polymer Rheology; John Wiley & Sons, Inc.: Hoboken, NJ, USA, 2012. [Google Scholar]
- Osswald, T.A.; Rudolph, N. Polymer Rheology: Fundamentals and Applications; Carl Hanser Verlag: München, Germany, 2015. [Google Scholar]
- Dillon, J.H.; Prettyman, I.B.; Hall, G.L. Hysteretic and Elastic Properties of Rubberlike Materials Under Dynamic Shear Stresses. J. Appl. Phys. 1944, 15, 309–323. [Google Scholar] [CrossRef]
- Payne, A.R. The dynamic properties of carbon black-loaded natural rubber vulcanizates. Part I. J. Appl. Polym. Sci. 1962, 6, 57–63. [Google Scholar] [CrossRef]
- Payne, A.R. Strainwork dependence of filler-loaded vulcanizates. J. Appl. Polym. Sci. 1964, 8, 2661–2686. [Google Scholar] [CrossRef]
- Fletcher, W.P.; Gent, A.N. Nonlinearity in the Dynamic Properties of Vulcanized Rubber Compounds. Trans. Inst. Rub. Ind. 1953, 29, 266–280. [Google Scholar] [CrossRef]
- Heinrich, G.; Klüppel, M. Recent advances in the theory of filler networking in elastomers. Adv. Polm. Sci. 2002, 160, 1–44. [Google Scholar]
- Robertson, C.G. Dynamic Mechanical Properties. In Encyclopedia of Polymeric Nanomaterials; Kobayashi, S., Müllen, K., Eds.; Springer: Berlin/Heidelberg, Germany, 2015; pp. 647–654. [Google Scholar]
- World Petrol Demand ‘Likely to Peak by 2030 as Electric Car Sales Rise. Available online: https://www.theguardian.com/business/2017/oct/16/world-petrol-demand-peak-electric-car-wood-mackenzie-oil (accessed on 9 January 2020).
- Smith, S.M.; Simmons, D.S. Poisson ratio mismatch drives low-strain reinforcement in elastomeric nanocomposites. Soft Matter 2019, 15, 656–670. [Google Scholar] [CrossRef]
- Warasitthinon, N.; Genix, A.-C.; Sztucki, M.; Oberdisse, J.; Robertson, C.G. The Payne effect: Primarily polymer-related or filler-related phenomenon? Rubber Chem. Technol. 2019, 92, 599–611. [Google Scholar] [CrossRef]
- Kraus, G. Mechanical Losses in Carbon-Black-Filled Rubbers. Appl. Polym. Symp. 1984, 39, 75–92. [Google Scholar]
- Hentschke, R. The Payne effect revisited. Express Polym. Lett. 2017, 11, 278–292. [Google Scholar] [CrossRef]
- Mujtaba, A.; Keller, M.; Ilisch, S.; Radusch, H.J.; Beiner, M.; Thurn-Albrecht, T.; Saalwächter, K. Detection of Surface-Immobilized Components and Their Role in Viscoelastic Reinforcement of Rubber–Silica Nanocomposites. ACS Macro Lett. 2014, 3, 481–485. [Google Scholar] [CrossRef]
- Berriot, J.; Lequeux, F.; Monnerie, L.; Montes, H.; Long, D.; Sotta, P. Filler-Elastomer Interaction in Model Filled Rubbers, a H-1 NMR Study. J. Non-Cryst. Solids 2002, 307, 719–724. [Google Scholar] [CrossRef]
- Xiong, W.; Wang, X. Linear-nonlinear dichotomy of rheological responses in particle-filled polymer melts. J. Rheol. 2018, 62, 171–181. [Google Scholar] [CrossRef]
- Böhm, G.G.A.; Nguyen, M.N. Flocculation of carbon black in filled rubber compounds. I. Flocculation occurring in unvulcanized compounds during annealing at elevated temperatures. J. Appl. Polym. Sci. 1995, 55, 1041–1050. [Google Scholar] [CrossRef]
- Lin, C.J.; Hergenrother, W.L.; Alexanian, E.; Böhm, G.G.A. On the Filler Flocculation in Silica-Filled Rubbers Part I. Quantifying and Tracking the Filler Flocculation and Polymer-Filler Interactions in the Unvulcanized Rubber Compounds. Rubber Chem. Technol. 2002, 75, 865–890. [Google Scholar] [CrossRef]
- Schwartz, G.A.; Cerveny, S.; Marzocca, A.J.; Gerspacher, M.; Nikiel, L. Thermal aging of carbon black filled rubber compounds. I. Experimental evidence for bridging flocculation. Polymer 2003, 44, 7229–7240. [Google Scholar] [CrossRef]
- Scurati, A.; Lin, C.J. The hysteresis temperature and strain dependences in filled rubbers. Rubber Chem. Technol. 2006, 79, 170–197. [Google Scholar] [CrossRef]
- Meier, J.G.; Klüppel, M. Carbon black networking in elastomers monitored by dynamic mechanical and dielectric spectroscopy. Macromol. Mater. Eng. 2008, 293, 12–38. [Google Scholar] [CrossRef]
- Mihara, S.; Datta, R.N.; Noordermeer, J.W.M. Flocculation in silica reinforced rubber compounds. Rubber Chem. Technol. 2009, 82, 524–540. [Google Scholar] [CrossRef]
- Böhm, G.A.; Tomaszewski, W.; Cole, W.; Hogan, T. Furthering the understanding of the non linear response of filler reinforced elastomers. Polymer 2010, 51, 2057–2068. [Google Scholar] [CrossRef]
- Richter, S.; Saphiannikova, M.; Stöckelhuber, K.W.; Heinrich, G. Jamming in filled polymer systems. Macromol. Symp. 2010, 291–292, 193–201. [Google Scholar] [CrossRef]
- Robertson, C.G.; Lin, C.J.; Bogoslovov, R.B.; Rackaitis, M.; Sadhukhan, P.; Quinn, J.D.; Roland, C.M. Flocculation, reinforcement, and glass transition effects in silica-filled styrene-butadiene rubber. Rubber Chem. Technol. 2011, 84, 507–519. [Google Scholar] [CrossRef]
- Randall, A.M.; Robertson, C.G. Linear-Nonlinear Dichotomy of the Rheological Response of Particle-Filled Polymers. J. Appl. Polym. Sci. 2014, 131, 40818. [Google Scholar] [CrossRef]
- Tunnicliffe, L.B.; Kadlcak, J.; Morris, M.D.; Shi, Y.; Thomas, A.G.; Busfield, J.J.C. Flocculation and Viscoelastic Behaviour in Carbon Black-Filled Natural Rubber. Macromol. Mater. Eng. 2014, 299, 1474–1483. [Google Scholar] [CrossRef]
- Robertson, C.G. Flocculation in elastomeric polymers containing nanoparticles: Jamming and the new concept of fictive dynamic strain. Rubber Chem. Technol. 2015, 88, 463–474. [Google Scholar] [CrossRef]
- Stöckelhuber, K.W.; Wießner, S.; Das, A.; Heinrich, G. Filler flocculation in polymers–a simplified model derived from thermodynamics and game theory. Soft Matter 2017, 13, 3701–3709. [Google Scholar] [CrossRef]
- Gundlach, N.; Hentschke, R.; Karimi-Varzaneh, H.A. Filler flocculation in elastomer blends-an approach based on measured surface tensions and monte carlo simulation. Soft Mater. 2019, 17, 283–296. [Google Scholar] [CrossRef]
- Gundlach, N.; Hentschke, R. Modelling Filler Dispersion in Elastomers: Relating Filler Morphology to Interface Free Energies via SAXS and TEM Simulation Studies. Polymers 2018, 10, 446. [Google Scholar] [CrossRef]
- Hayichelaeh, C.; Reuvekamp, L.A.E.M.; Dierkes, W.K.; Blume, A.; Noordermeer, J.W.M.; Sahakaro, K. Enhancing the Silanization Reaction of the Silica-Silane System by Different Amines in Model and Practical Silica-Filled Natural Rubber Compounds. Polymers 2018, 10, 584. [Google Scholar] [CrossRef]
- Liu, A.J.; Nagel, S.R. Nonlinear dynamics: Jamming is not just cool any more. Nature 1998, 396, 21–22. [Google Scholar] [CrossRef]
- Trappe, V.; Prasad, V.; Cipelletti, L.; Segre, P.N.; Weitz, D.A. Jamming phase diagram for attractive particles. Nature 2001, 411, 772–775. [Google Scholar] [CrossRef] [PubMed]
- Wang, X.; Robertson, C.G. Strain-induced nonlinearity of filled rubbers. Phys. Rev. E 2005, 72. [Google Scholar] [CrossRef] [PubMed]
- Robertson, C.G.; Wang, X. Isoenergetic jamming transition in particle-filled systems. Phys. Rev. Lett. 2005, 95. [Google Scholar] [CrossRef] [PubMed]
- Stöckelhuber, K.W.; Svistkov, A.S.; Pelevin, A.G.; Heinrich, G. Impact of Filler Surface Modification on Large Scale Mechanics of Styrene Butadiene/Silica Rubber Composites. Macromolecules 2011, 44, 4366–4381. [Google Scholar] [CrossRef]
- Stöckelhuber, K.W.; Das, A.; Jurk, R.; Heinrich, G. Contribution of physico-chemical properties of interfaces on dispersibility, adhesion and flocculation of filler particles in rubber. Polymer 2010, 51, 1954–1963. [Google Scholar] [CrossRef]
- Frenkin, E.I.; Podolsky, Y.Y.; Vinogradov, G.V. Thermal Vulcanization of Rubbers at High Pressure. Rubber Chem. Technol. 1985, 58, 23–36. [Google Scholar] [CrossRef]
- Bellander, M.; Stenberg, B.; Perrson, S. Crosslinking of polybutadiene rubber without any vulcanization agent. Polym. Eng. Sci. 1998, 38, 1254–1260. [Google Scholar] [CrossRef]
- Robertson, C.G.; Wang, X. Nanoscale cooperative length of local segmental motion in polybutadiene. Macromolecules 2004, 37, 4266–4270. [Google Scholar] [CrossRef]
- Robertson, C.G.; Wang, X. Spectral hole burning to probe the nature of unjamming (Payne effect) in particle-filled elastomers. Europhys. Lett. 2006, 76, 278–284. [Google Scholar] [CrossRef]
- Tool, A.Q. Relation between inelastic deformability and thermal expansion of glass in its annealing range. J. Am. Ceram. Soc. 1946, 29, 240–253. [Google Scholar] [CrossRef]
- Narayanaswamy, O.S. A Model of Structural Relaxation in Glass. J. Am. Ceram. Soc. 1971, 54, 491–498. [Google Scholar] [CrossRef]
- McKenna, G.B. Comprehensive Polymer Science, Polymer Properties; Booth, C., Price, C., Eds.; Pergamon: Oxford, UK, 1989; Volume 2, pp. 311–362. [Google Scholar]
- Simon, S.L.; Sobieski, J.W.; Plazek, D.J. Volume and enthalpy recovery of polystyrene. Polymer 2001, 42, 2555–2567. [Google Scholar] [CrossRef]
- Moynihan, C.T.; Easteal, A.J.; DeBolt, M.A.; Tucker, J. Dependence of the Fictive Temperature of Glass on Cooling Rate. J. Am. Ceram. Soc. 1976, 59, 12–16. [Google Scholar] [CrossRef]
- Hodge, I.M. Adam-Gibbs Formulation of Enthalpy Relaxation Near the Glass Transition. J. Res. Natl. Inst. Stand. Technol. 1997, 102, 195–205. [Google Scholar] [CrossRef]
- Kobayashi, H.; Takahashi, H.; Hiki, Y. Viscosity measurement of organic glasses below and above glass transition temperature. J. Non-Cryst. Solids 2001, 290, 32–40. [Google Scholar] [CrossRef]
- Zhao, J.; Simon, S.L.; McKenna, G.B. Using 20-million-year-old amber to test the super-Arrhenius behaviour of glass-forming systems. Nat. Commun. 2013, 4, 1783. [Google Scholar] [CrossRef]


| Compound: | SBR-CB | SBR-Silica | EPDM-CB | EPDM-Silica |
|---|---|---|---|---|
| SBR | 100 | 100 | ||
| EPDM | 100 | 100 | ||
| Carbon Black (N115) | 40 | 40 | ||
| Precipitated Silica | 40 | 40 | ||
| Antioxidant (6PPD) | 2 | 2 | 2 | 2 |
| Total (phr): | 142 | 142 | 142 | 142 |
| Filler Volume Fraction, φ: | 0.17 | 0.15 | 0.16 | 0.15 |
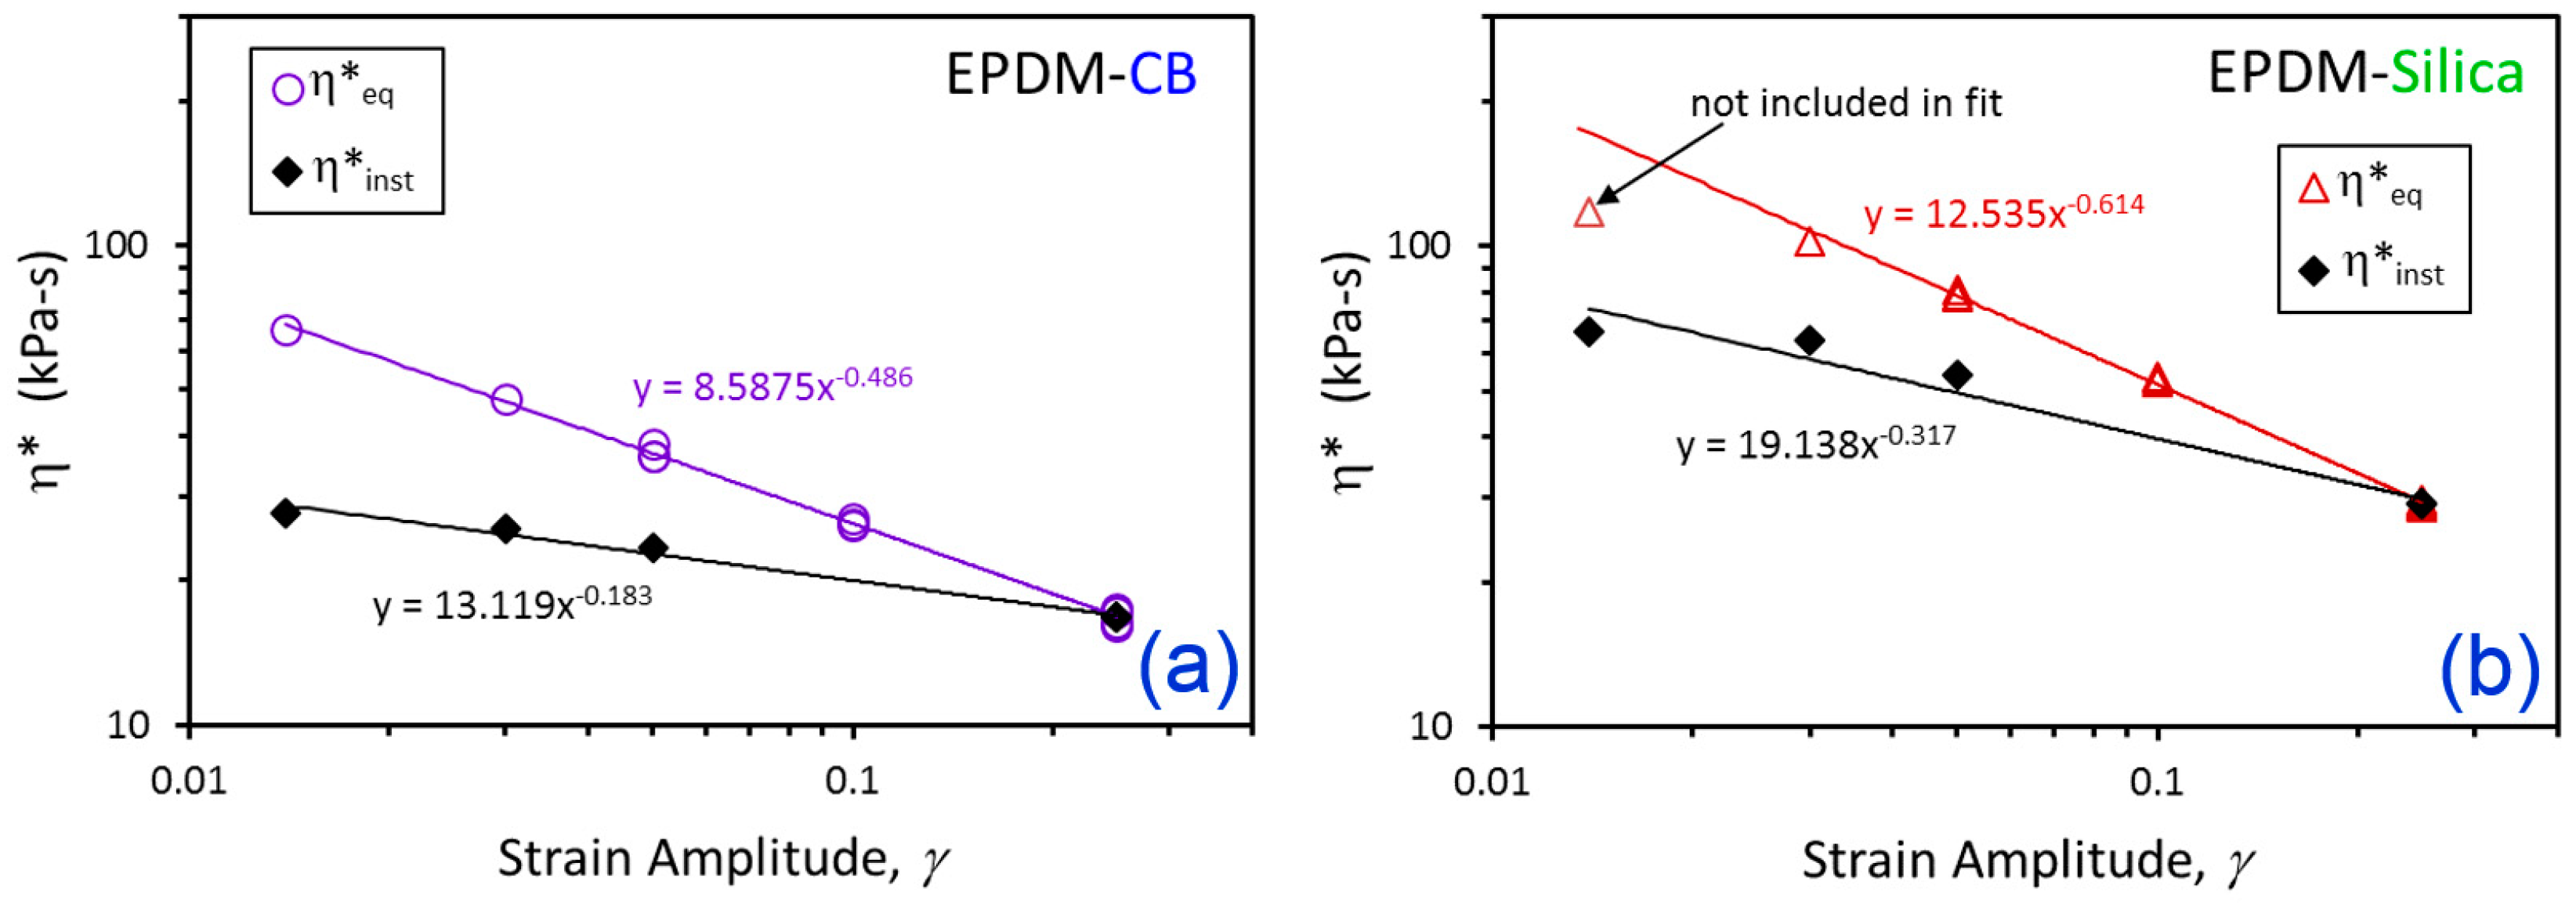
| Compound | η*eq [Equations (1) and (2)] | η*inst [Equation (3)] | ||
|---|---|---|---|---|
| c (kPa-s) | α | b (kPa-s) | θ | |
| EPDM-CB | 8.588 | 0.486 | 13.119 | 0.183 |
| EPDM-Silica | 12.535 | 0.614 | 19.138 | 0.317 |
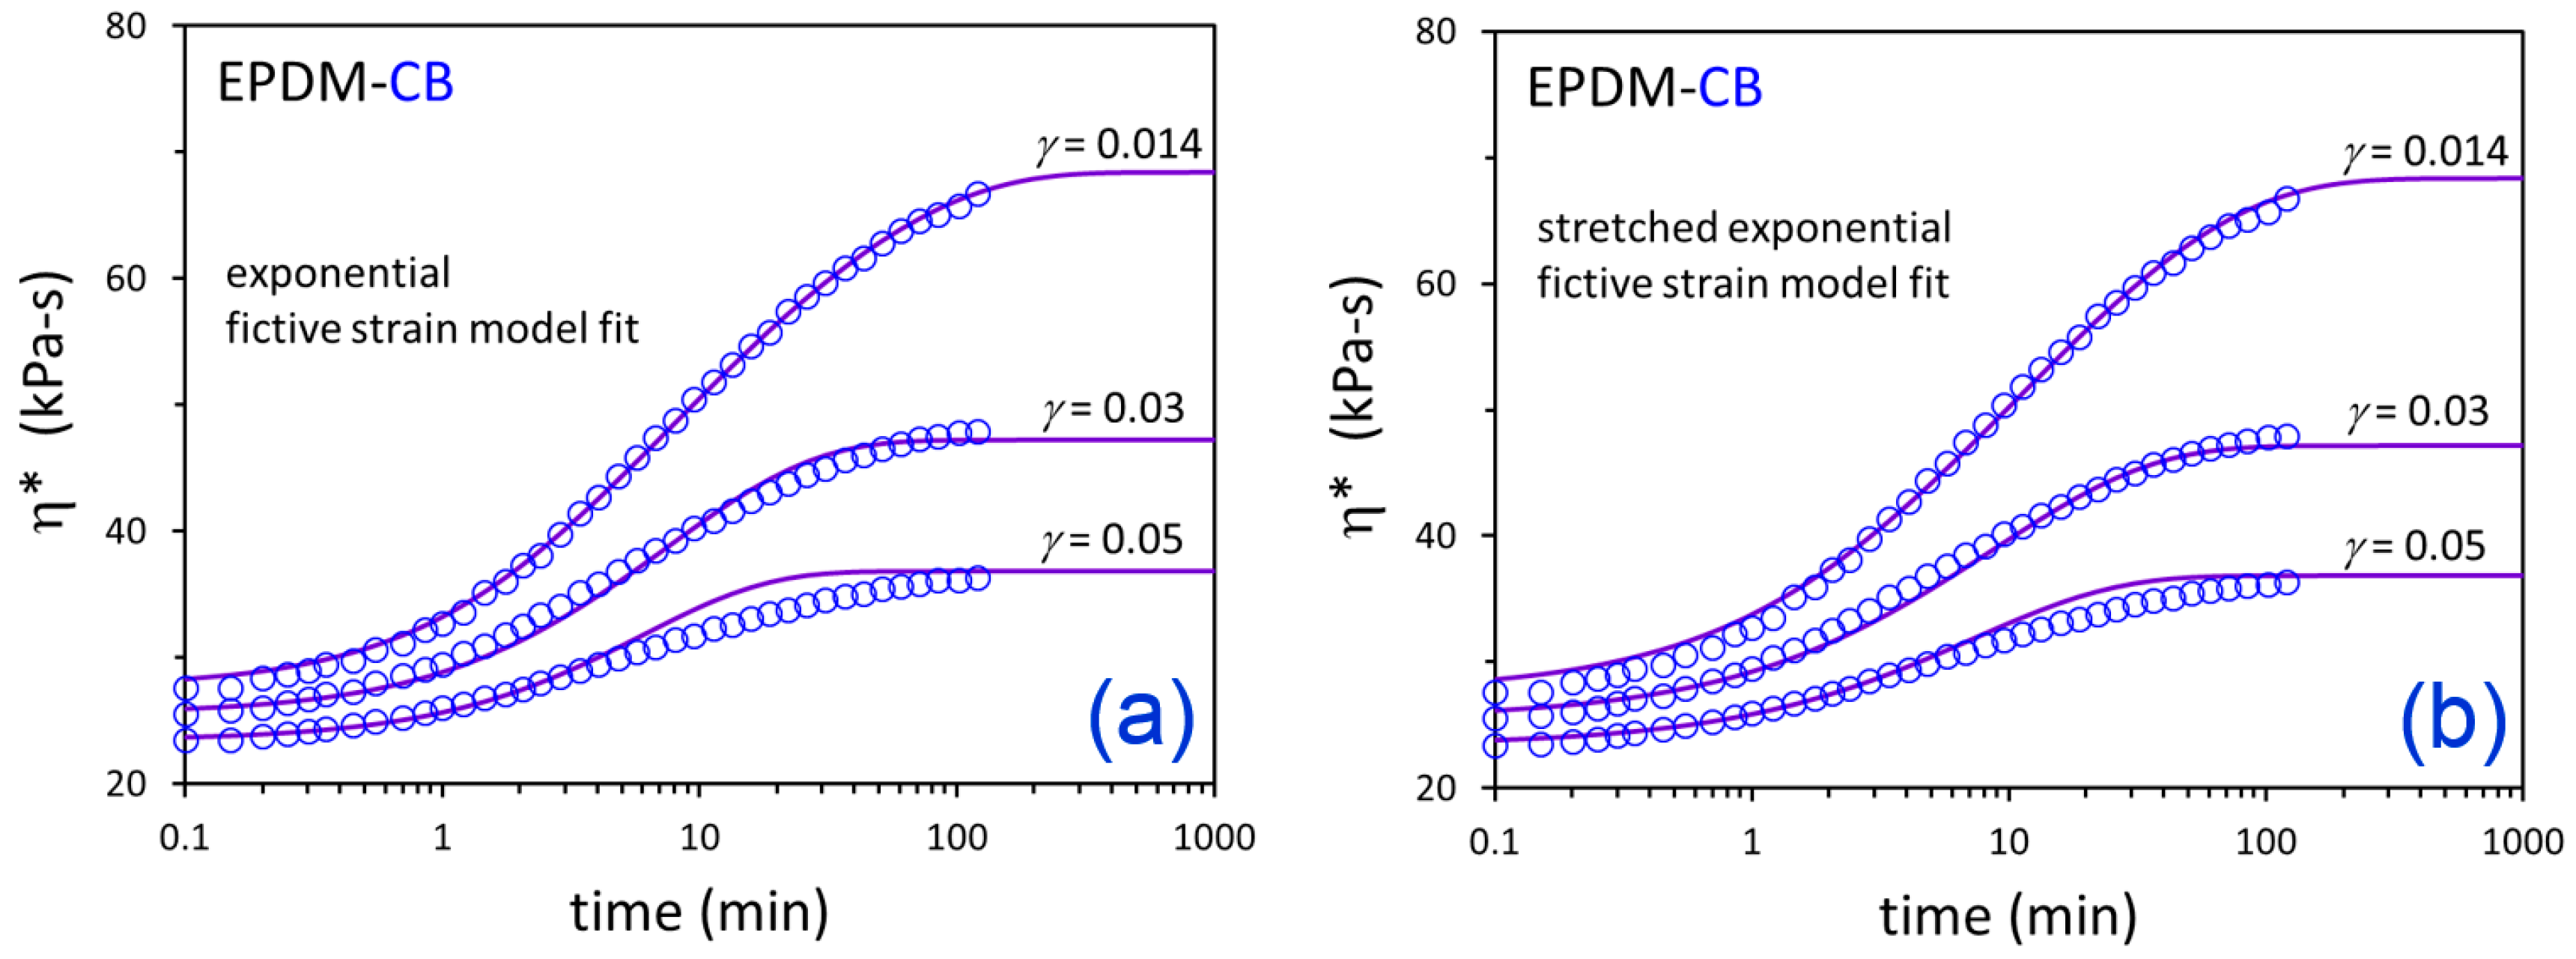
| Compound | Model | A (min) | a | s | β |
|---|---|---|---|---|---|
| EPDM-CB | Exponential | 3.76 | 4.13 × 10⁻⁴ | 4.14 × 10⁻² | 1.0 (fixed) |
| EPDM-Silica | 0.765 | 9.01 × 10⁻³ | 1.48 × 10⁻¹ | 1.0 (fixed) | |
| EPDM-CB | Stretched Exponential | 5.06 | 2.47 × 10⁻³ | 2.71 × 10⁻² | 0.835 |
| EPDM-Silica | 1.61 | 2.20 × 10⁻² | 9.45 × 10⁻² | 0.723 |
© 2020 by the authors. Licensee MDPI, Basel, Switzerland. This article is an open access article distributed under the terms and conditions of the Creative Commons Attribution (CC BY) license (http://creativecommons.org/licenses/by/4.0/).
Share and Cite
Robertson, C.G.; Vaikuntam, S.R.; Heinrich, G. A Nonequilibrium Model for Particle Networking/Jamming and Time-Dependent Dynamic Rheology of Filled Polymers. Polymers 2020, 12, 190. https://doi.org/10.3390/polym12010190
Robertson CG, Vaikuntam SR, Heinrich G. A Nonequilibrium Model for Particle Networking/Jamming and Time-Dependent Dynamic Rheology of Filled Polymers. Polymers. 2020; 12(1):190. https://doi.org/10.3390/polym12010190
Chicago/Turabian StyleRobertson, Christopher G., Sankar Raman Vaikuntam, and Gert Heinrich. 2020. "A Nonequilibrium Model for Particle Networking/Jamming and Time-Dependent Dynamic Rheology of Filled Polymers" Polymers 12, no. 1: 190. https://doi.org/10.3390/polym12010190
APA StyleRobertson, C. G., Vaikuntam, S. R., & Heinrich, G. (2020). A Nonequilibrium Model for Particle Networking/Jamming and Time-Dependent Dynamic Rheology of Filled Polymers. Polymers, 12(1), 190. https://doi.org/10.3390/polym12010190