Molecular Modeling of EUV Photoresist Revealing the Effect of Chain Conformation on Line-Edge Roughness Formation

 ,
,  ,
,
Abstract
:
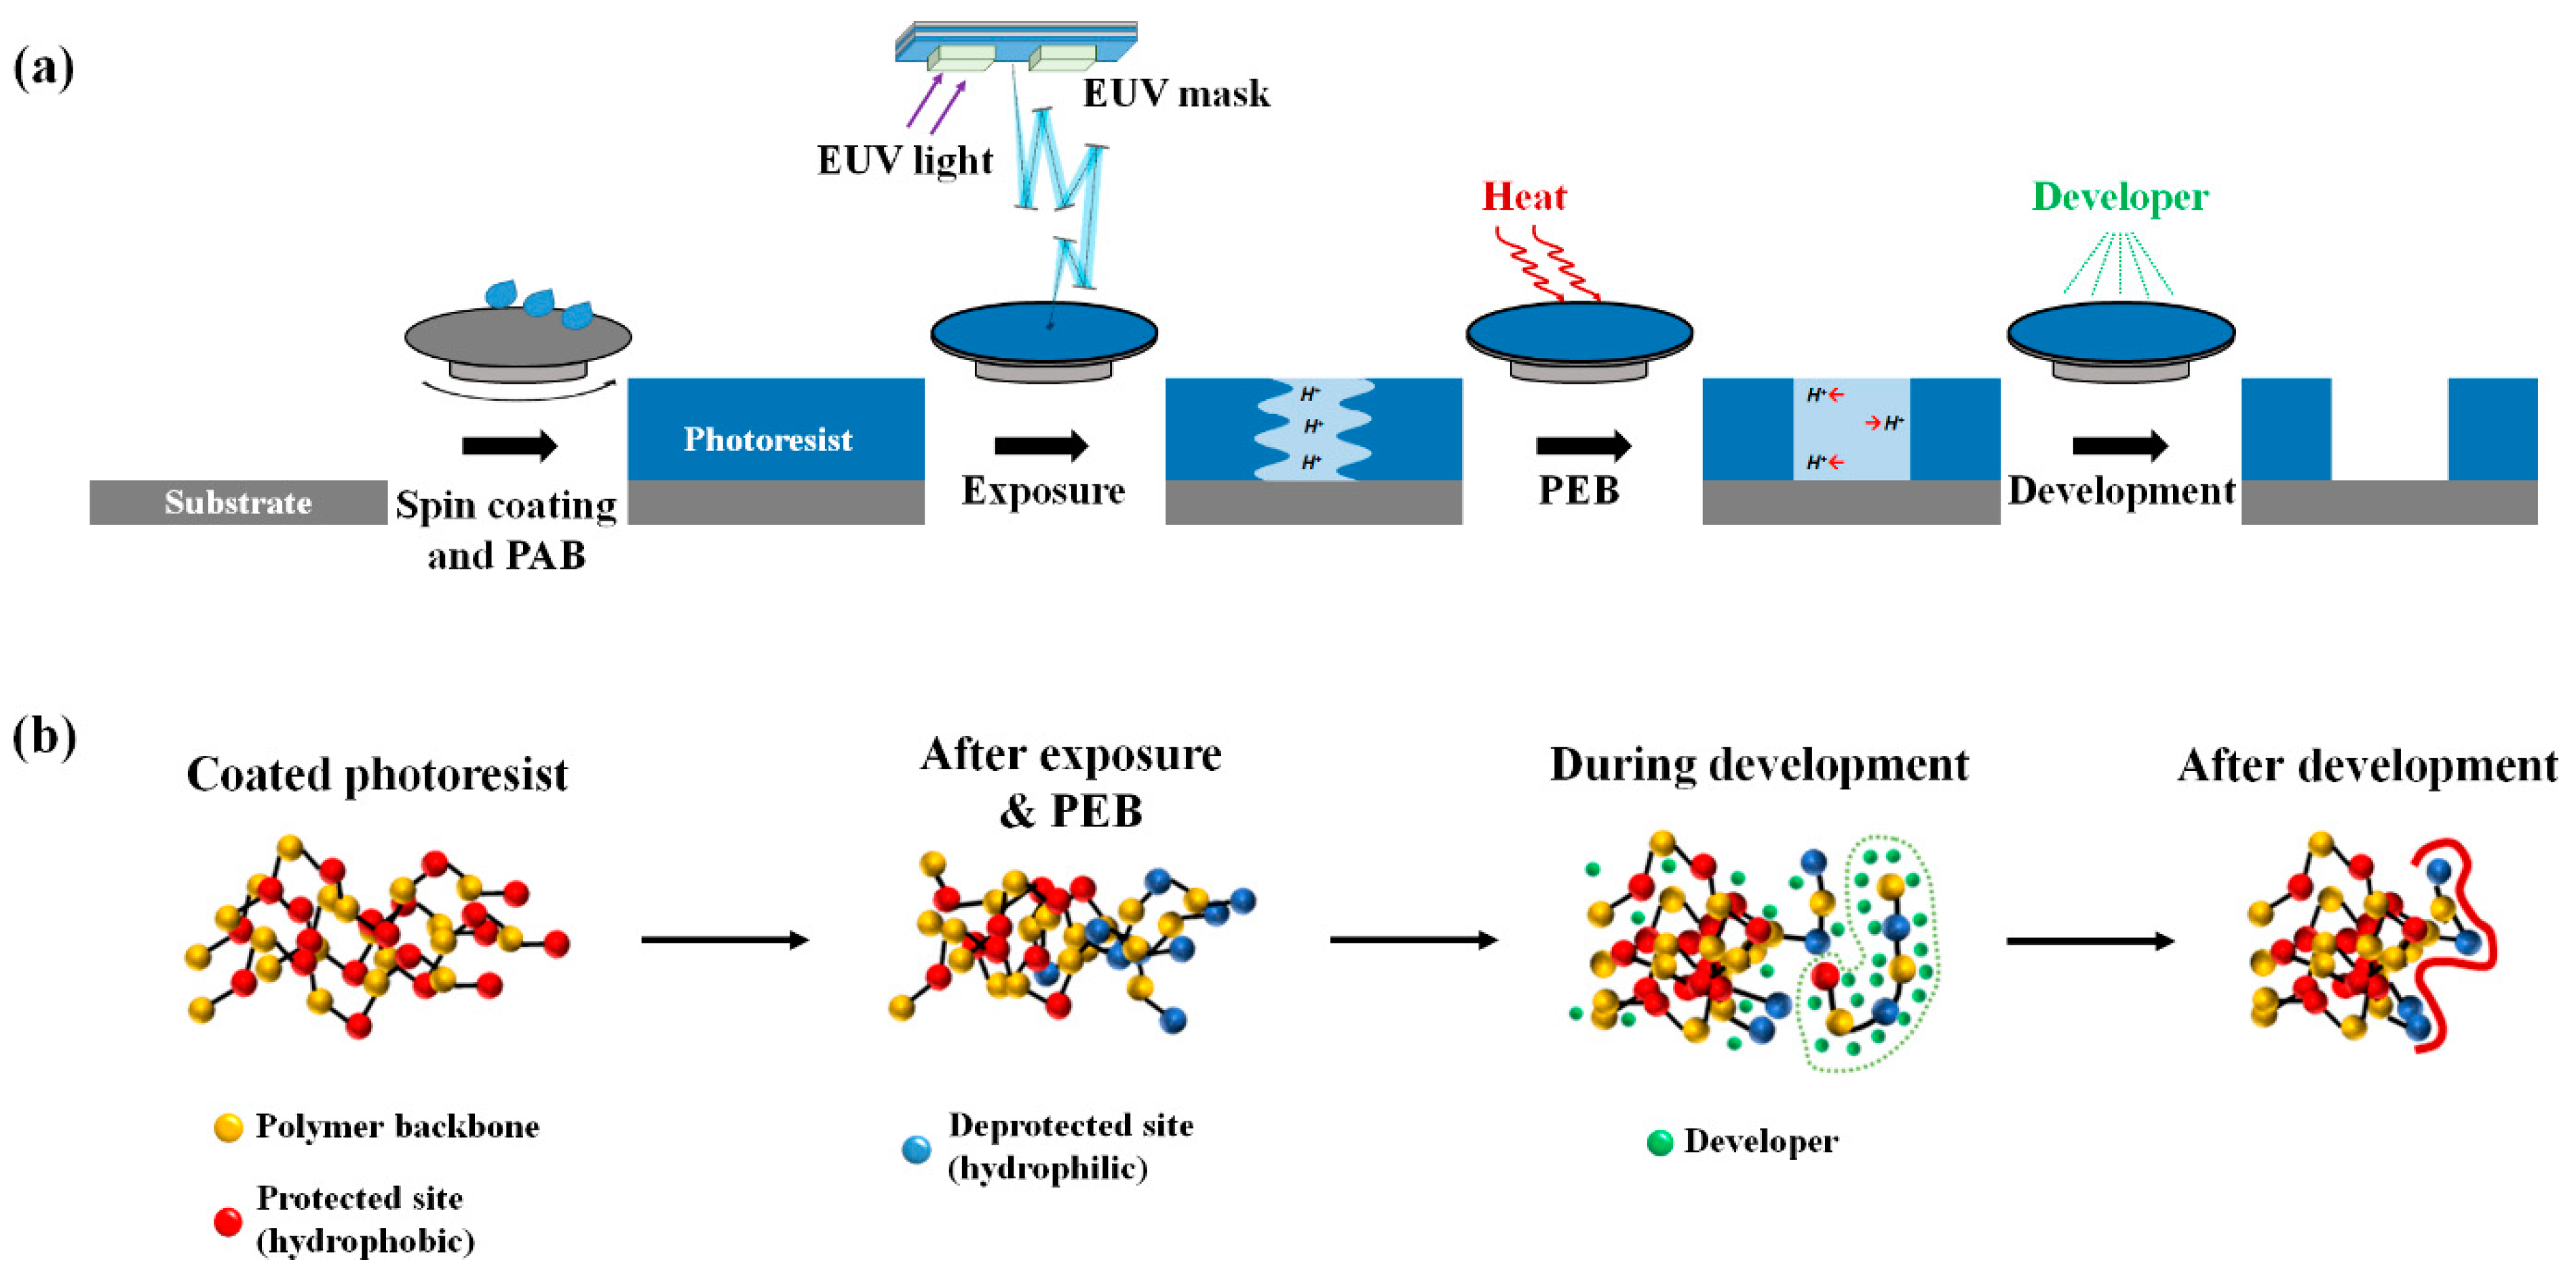
1. Introduction
2. Model and Methods
3. Results and Discussion
3.1. Exposure and Deprotection Reaction
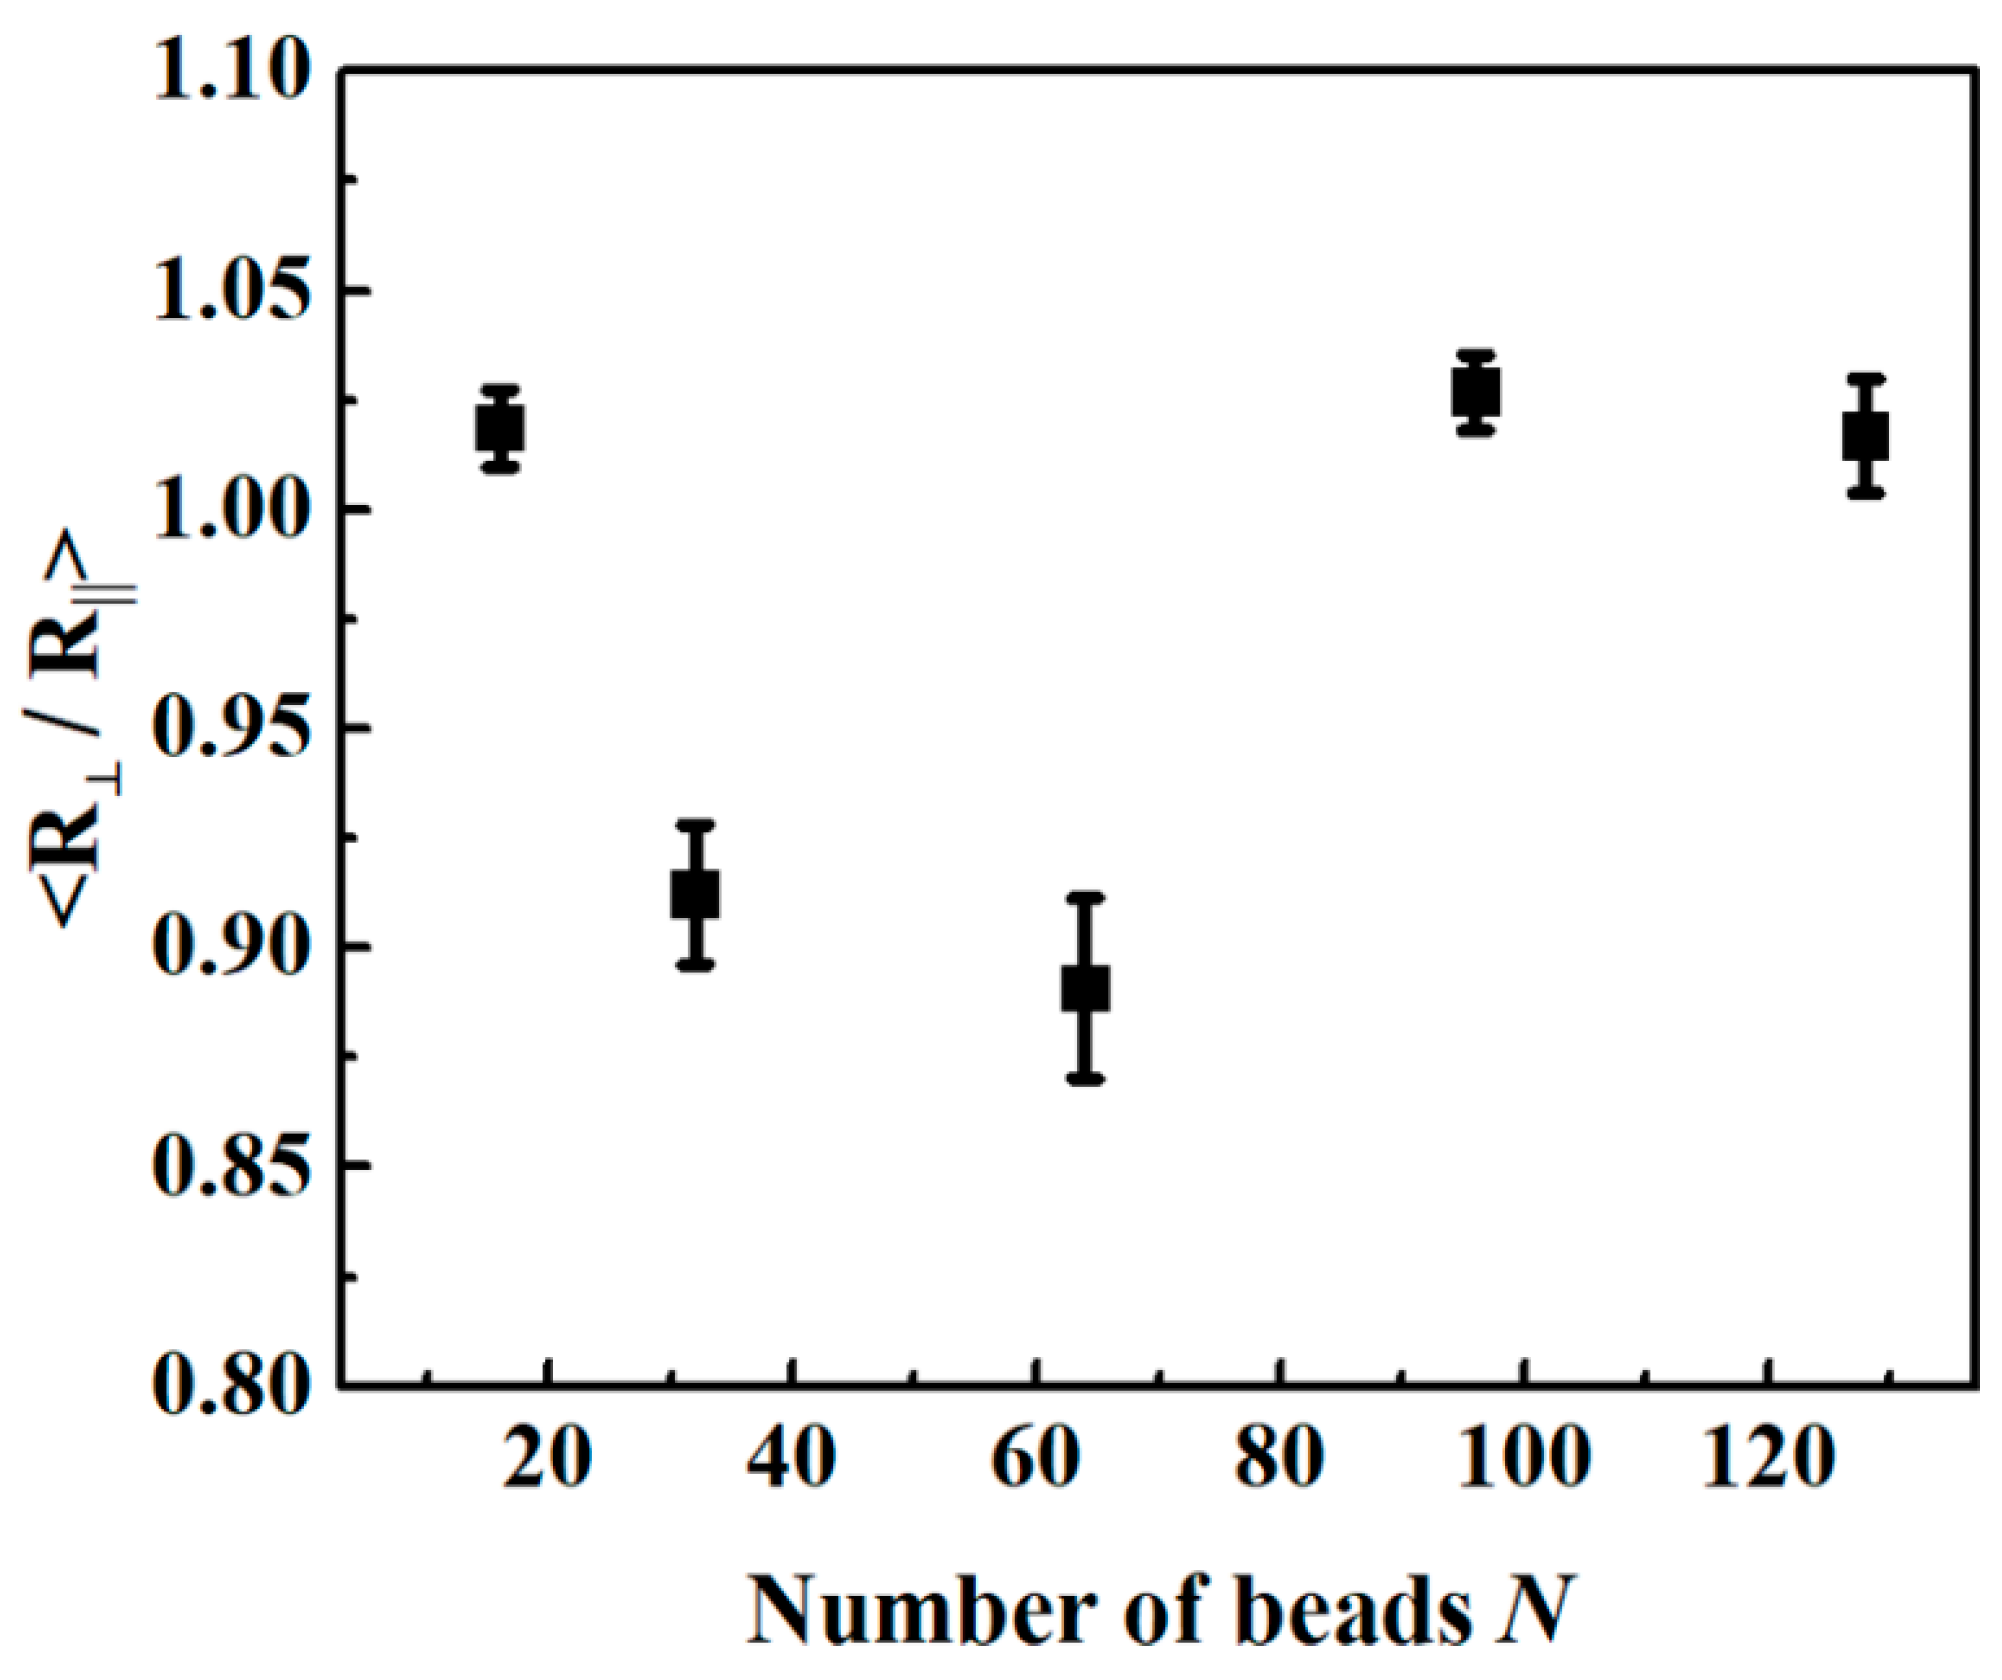
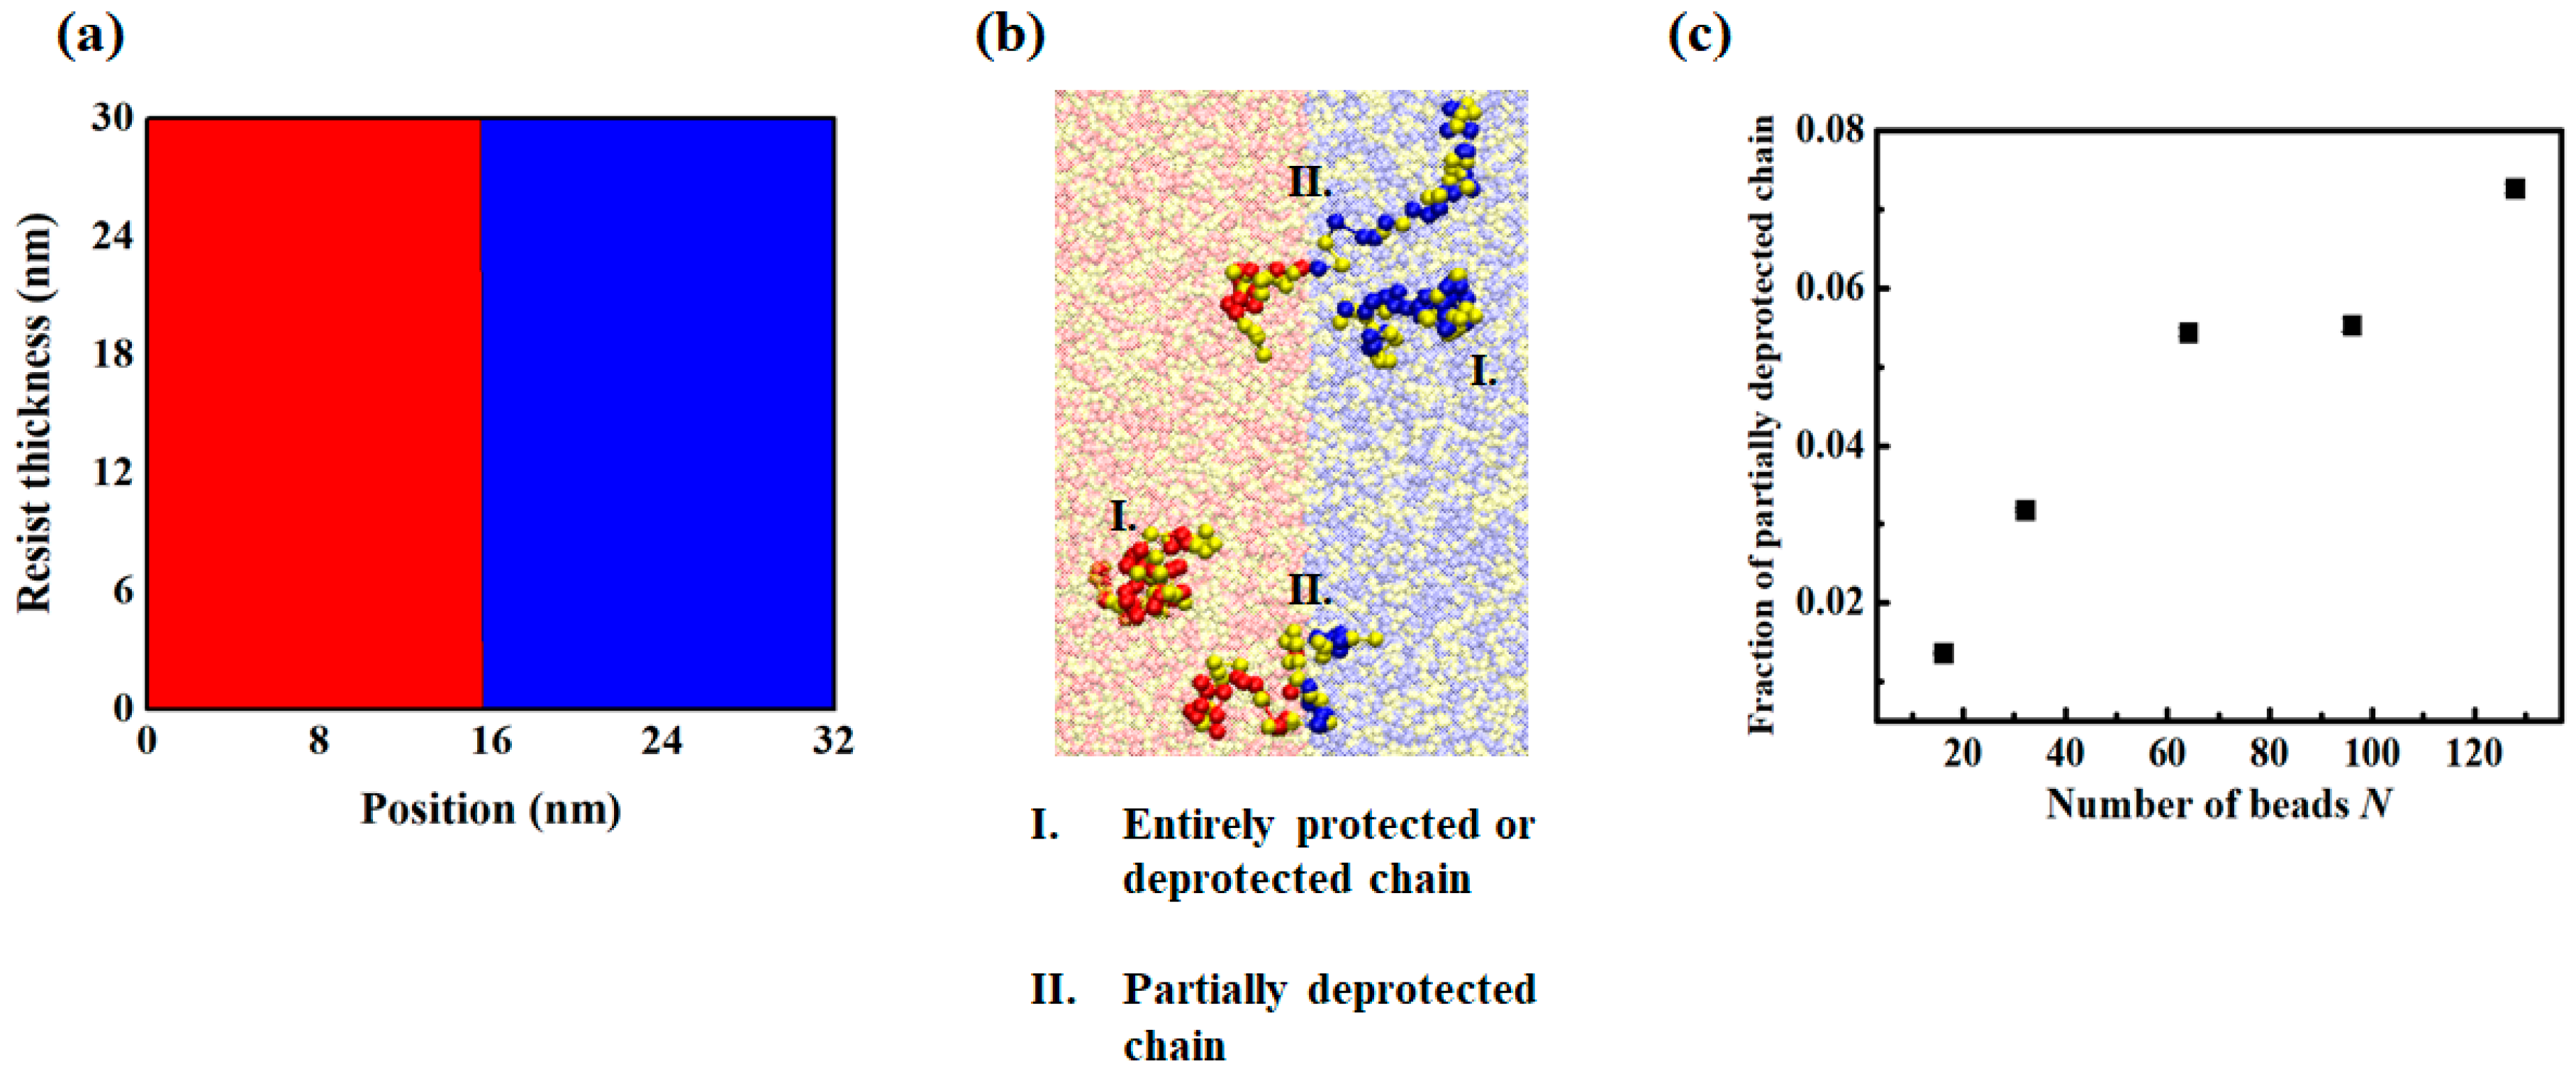
3.2. Chain Conformation Changes during the PEB Process
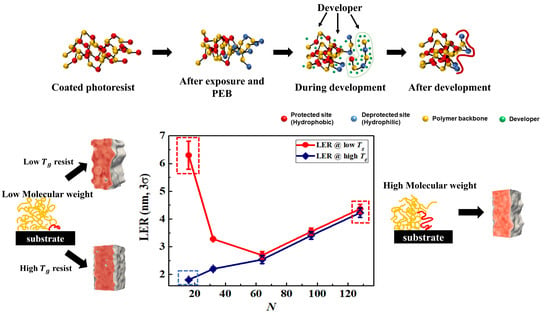
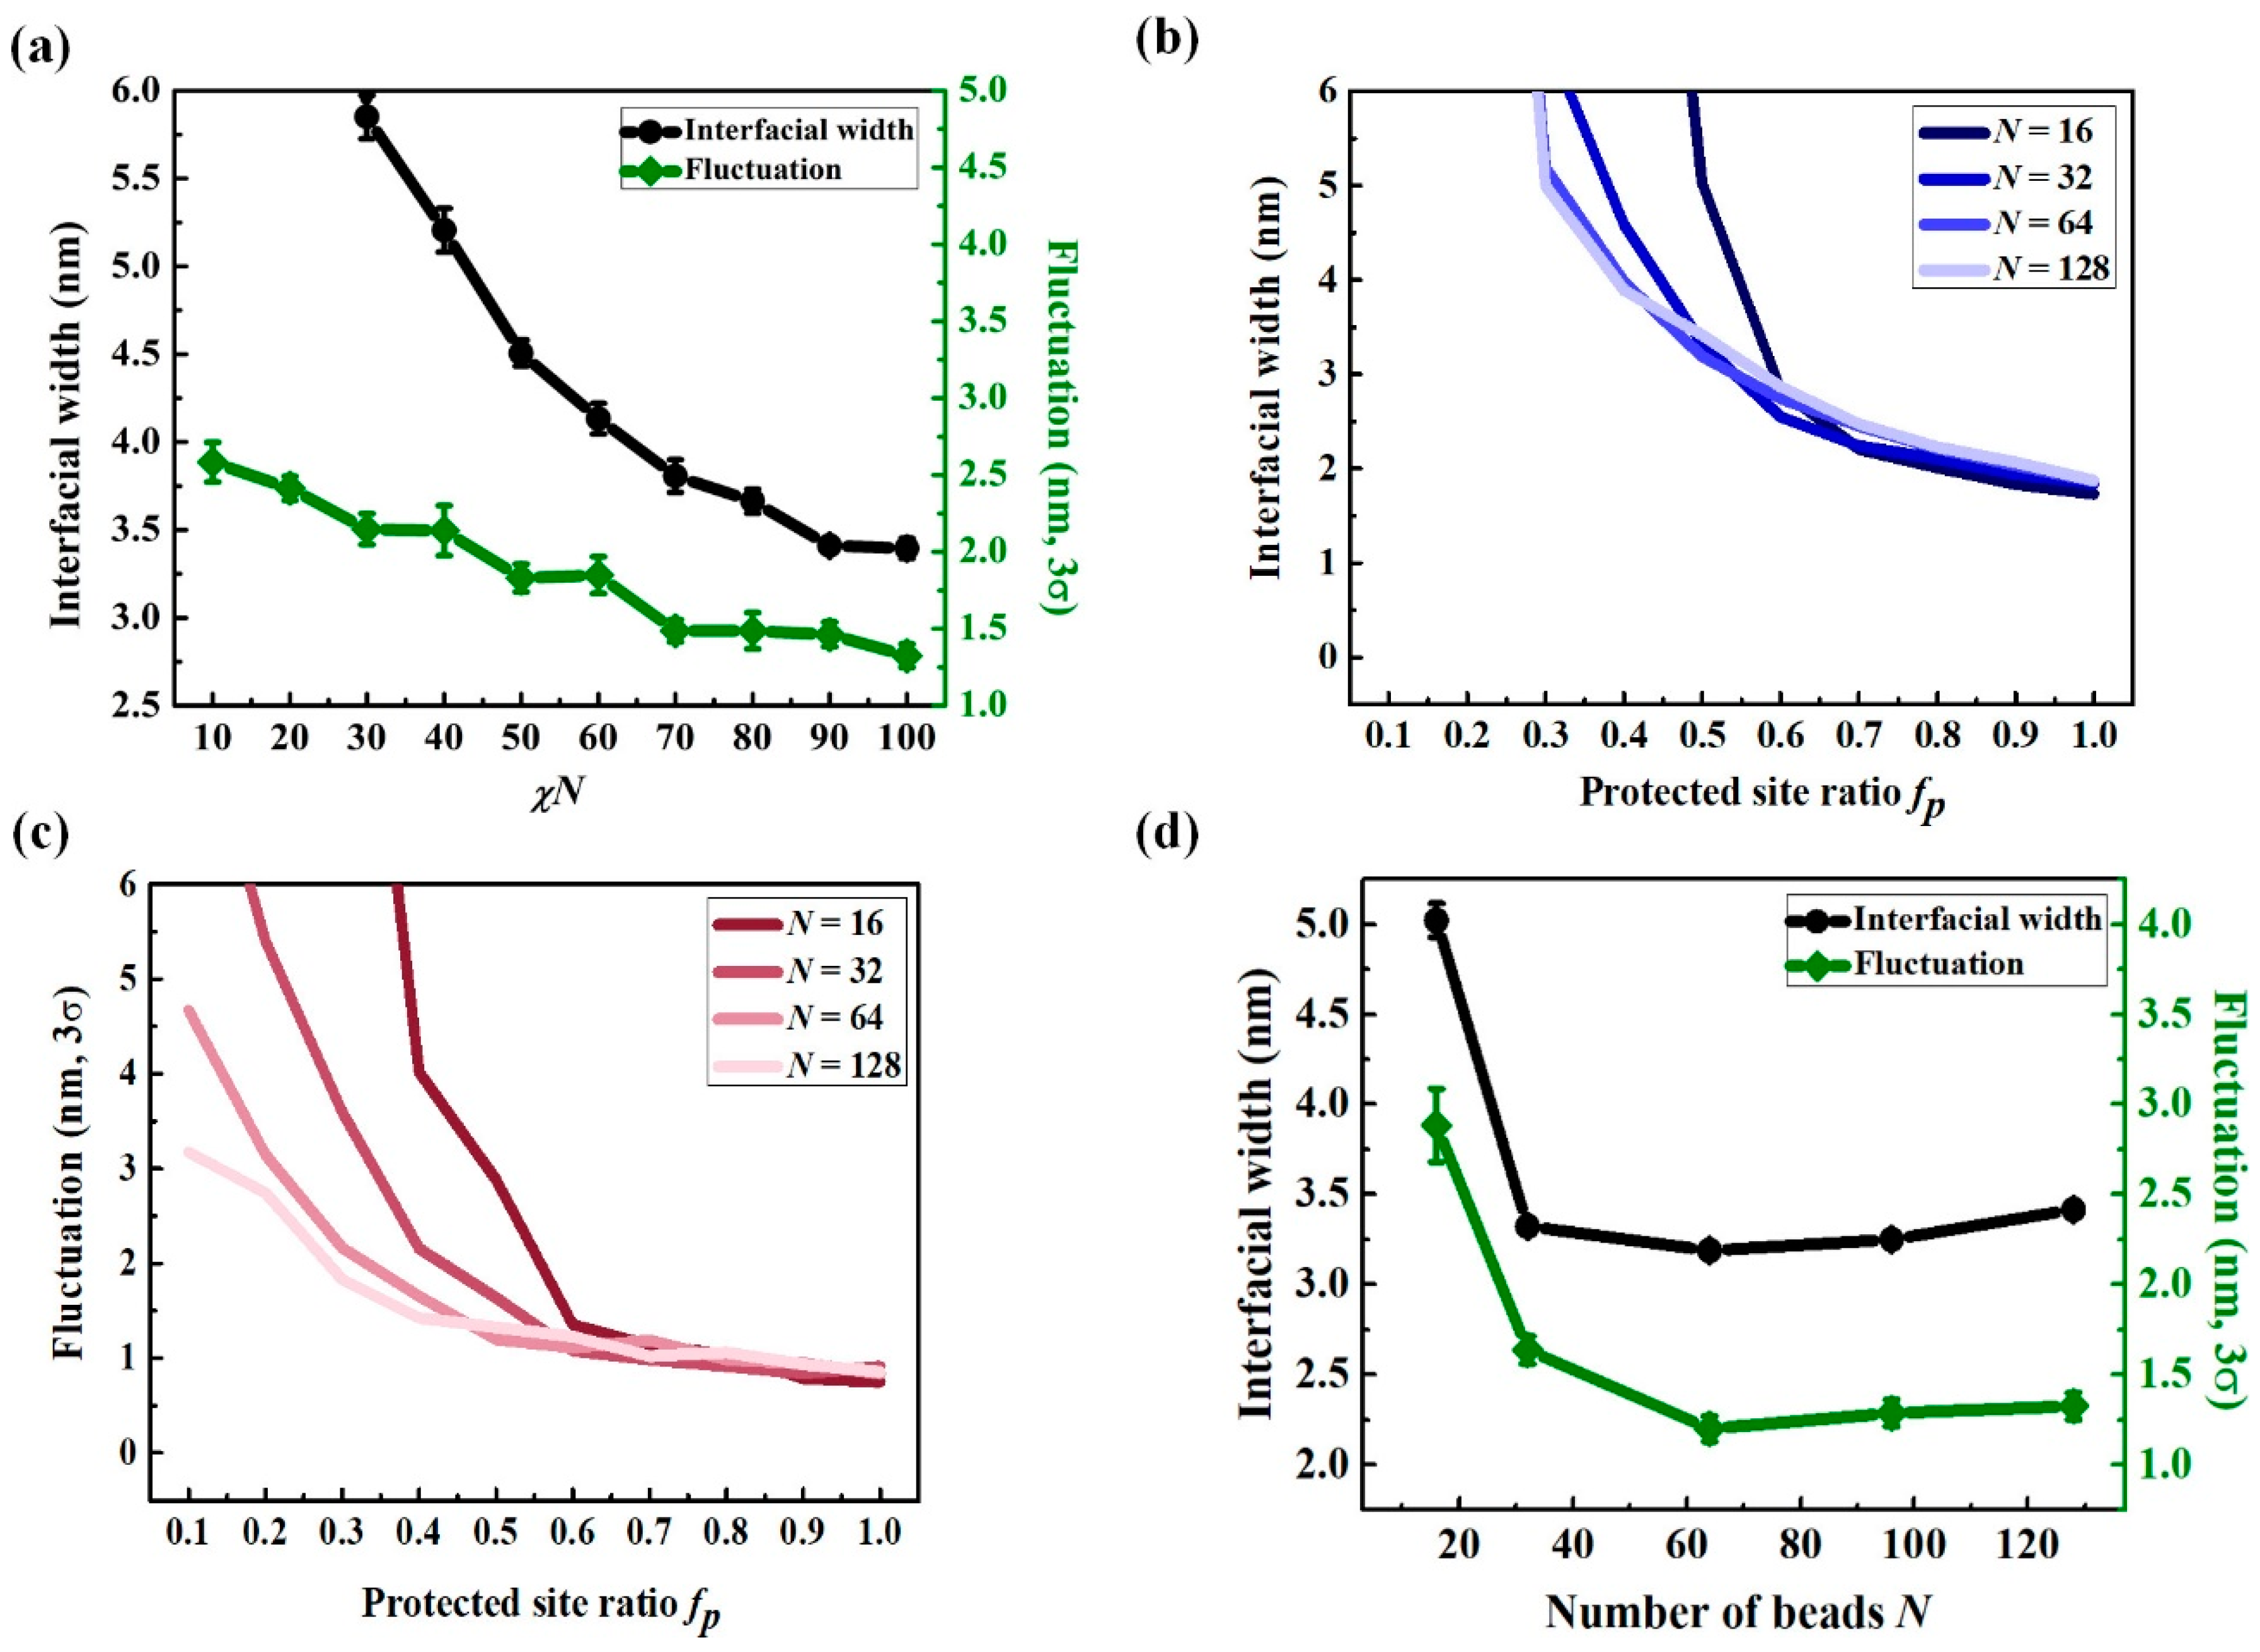
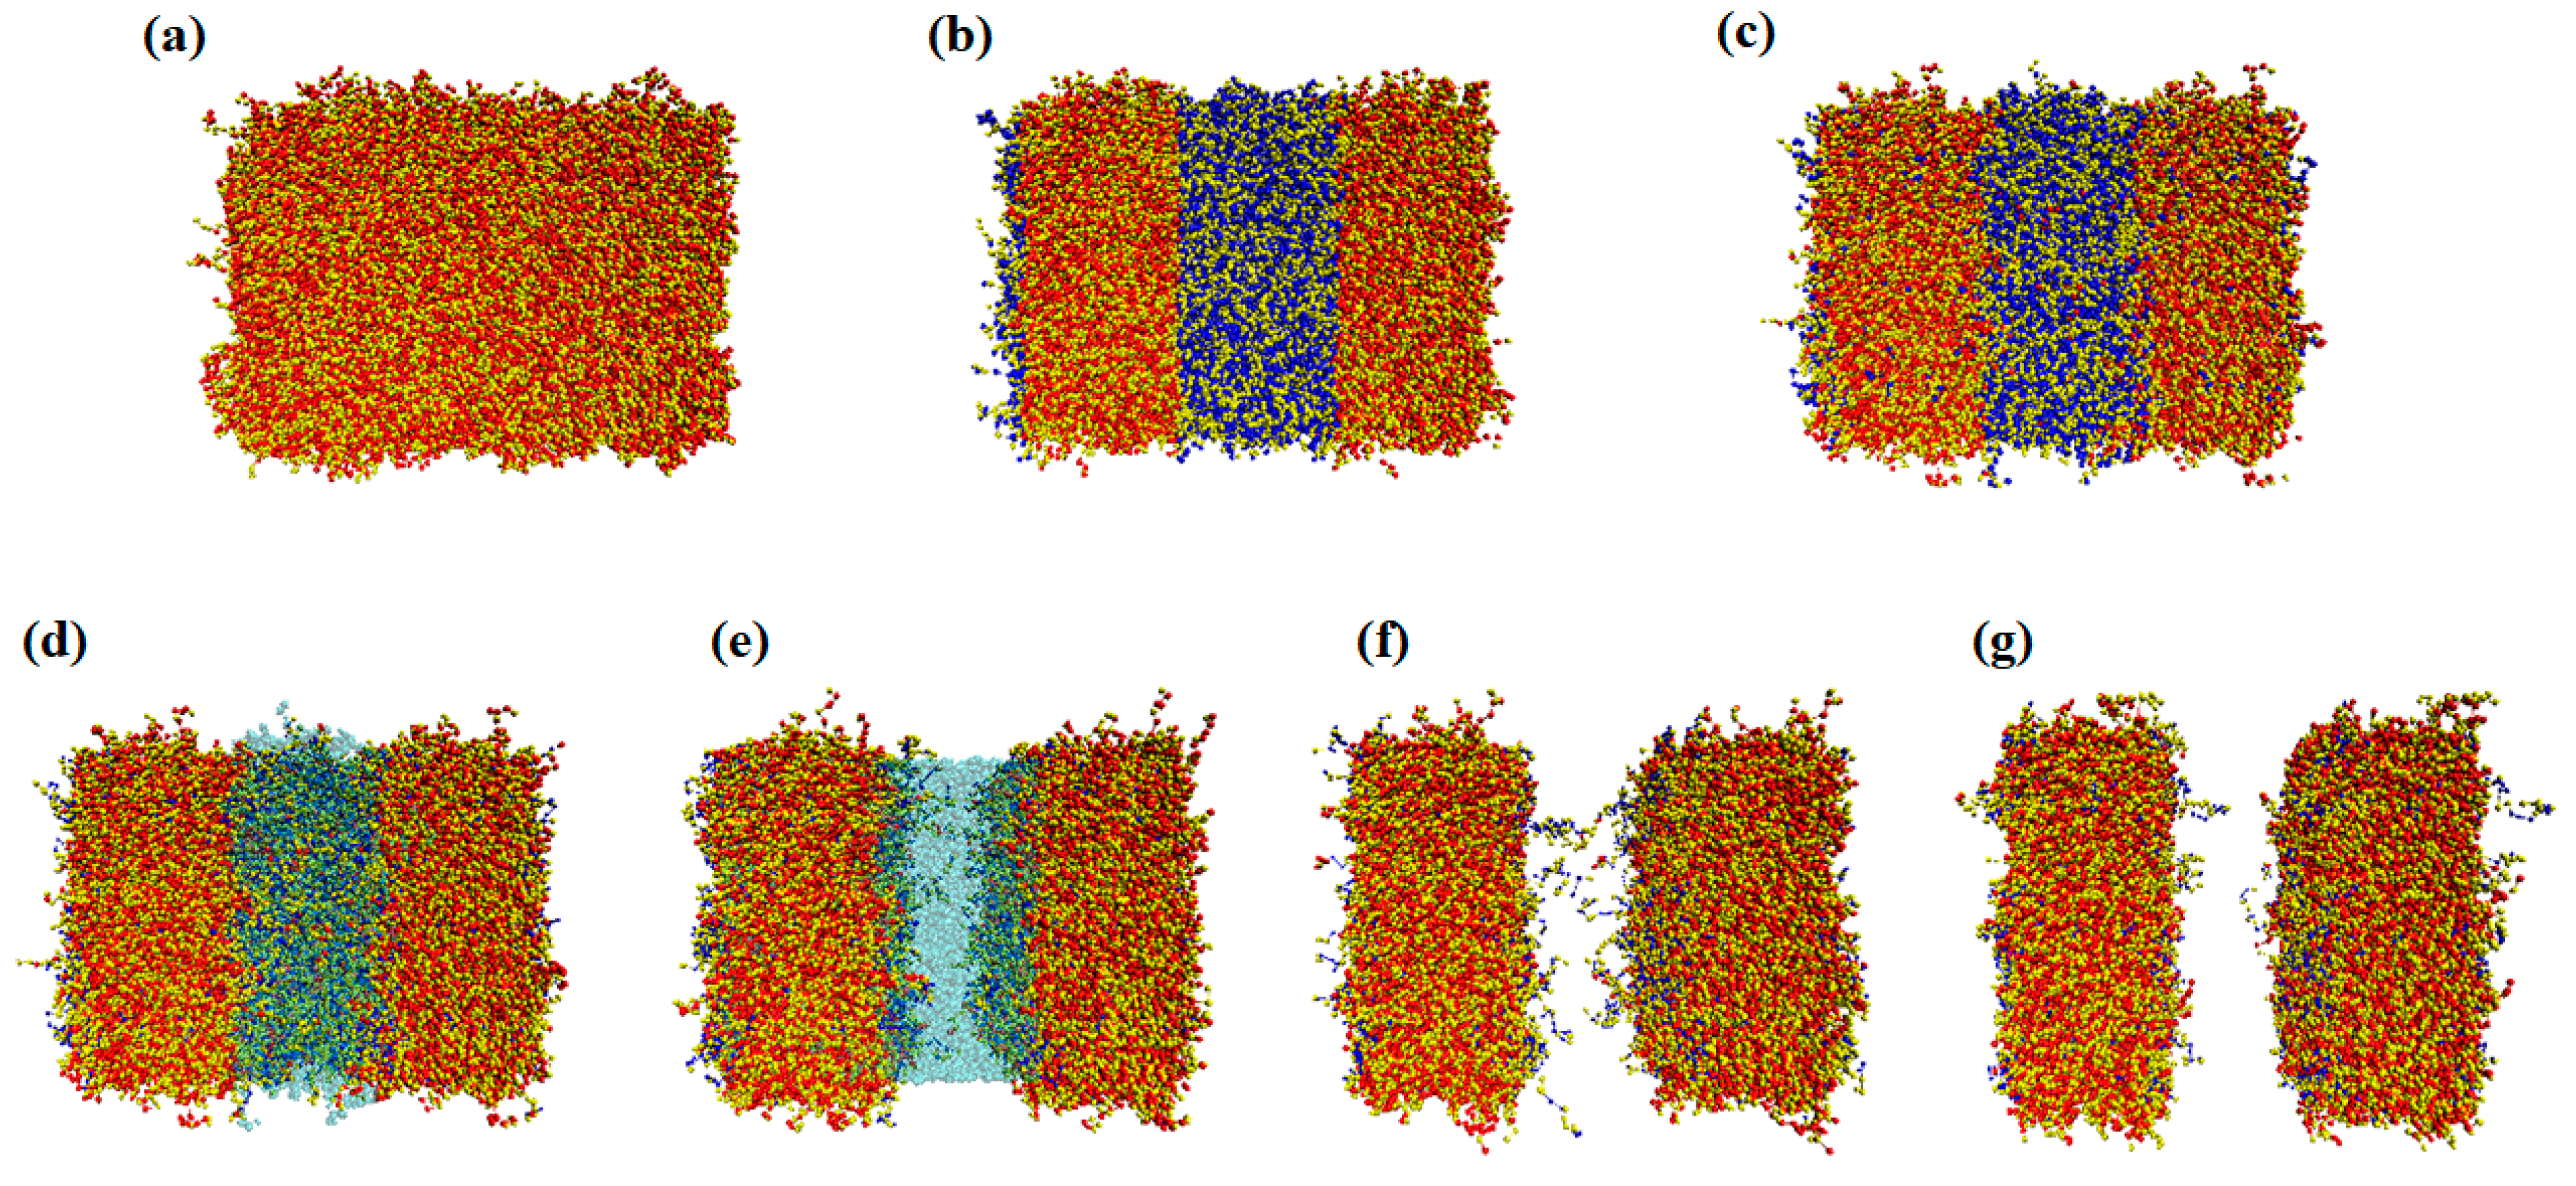
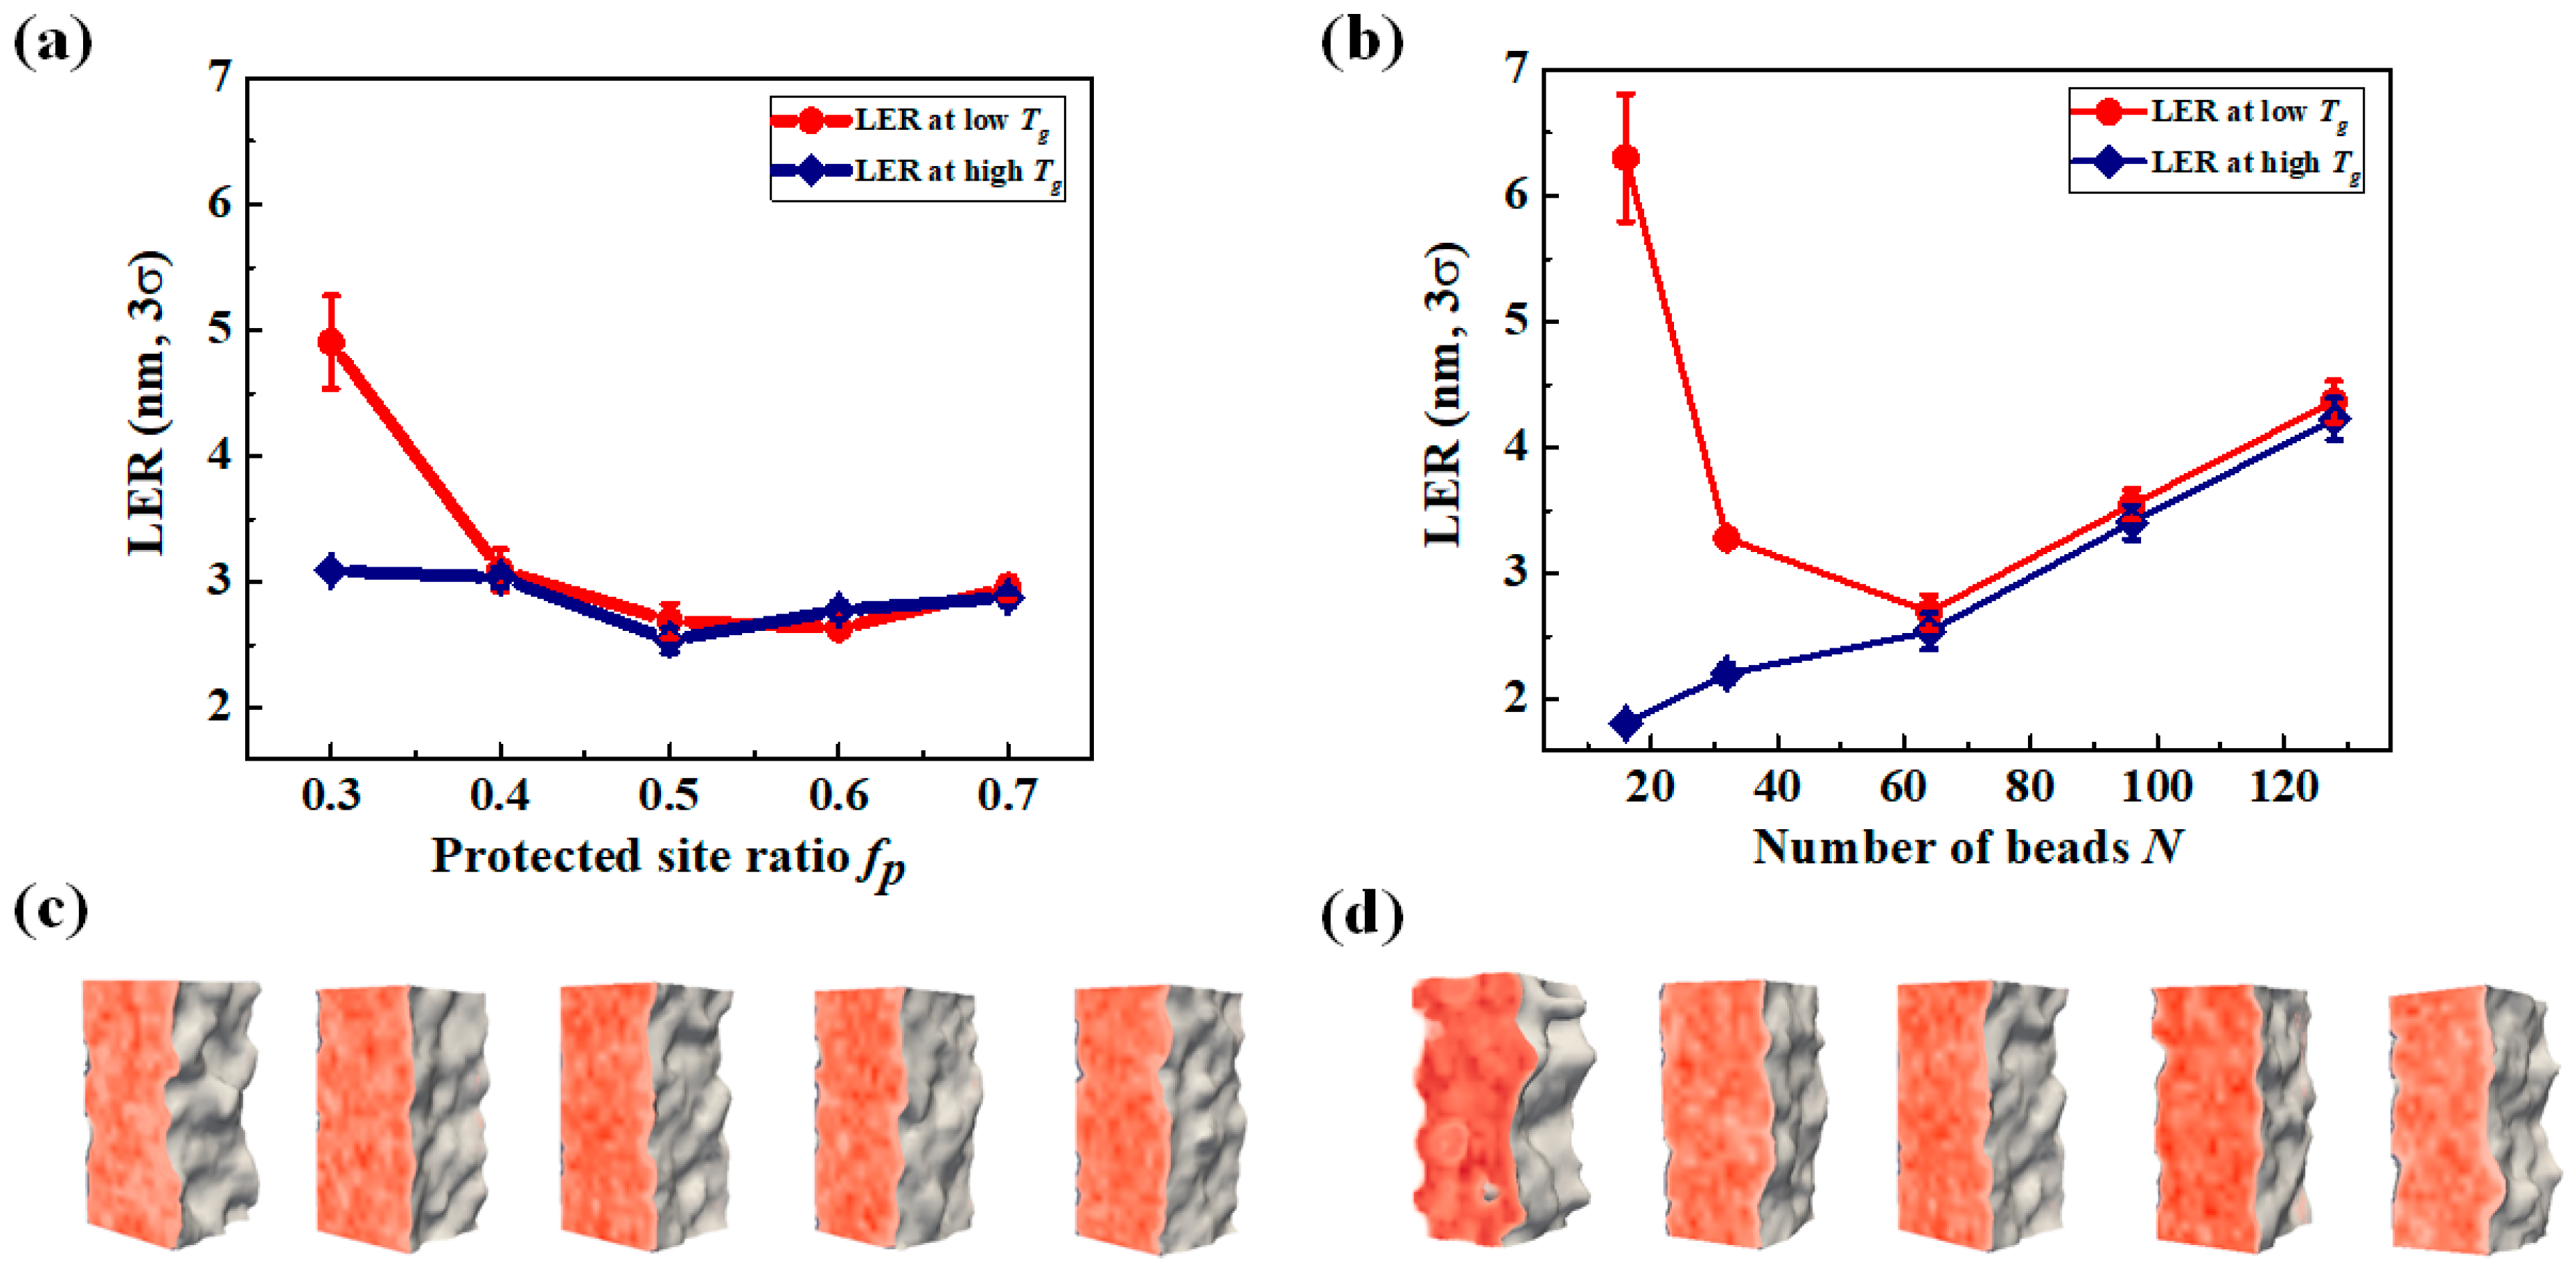
3.3. LER Formation after Development
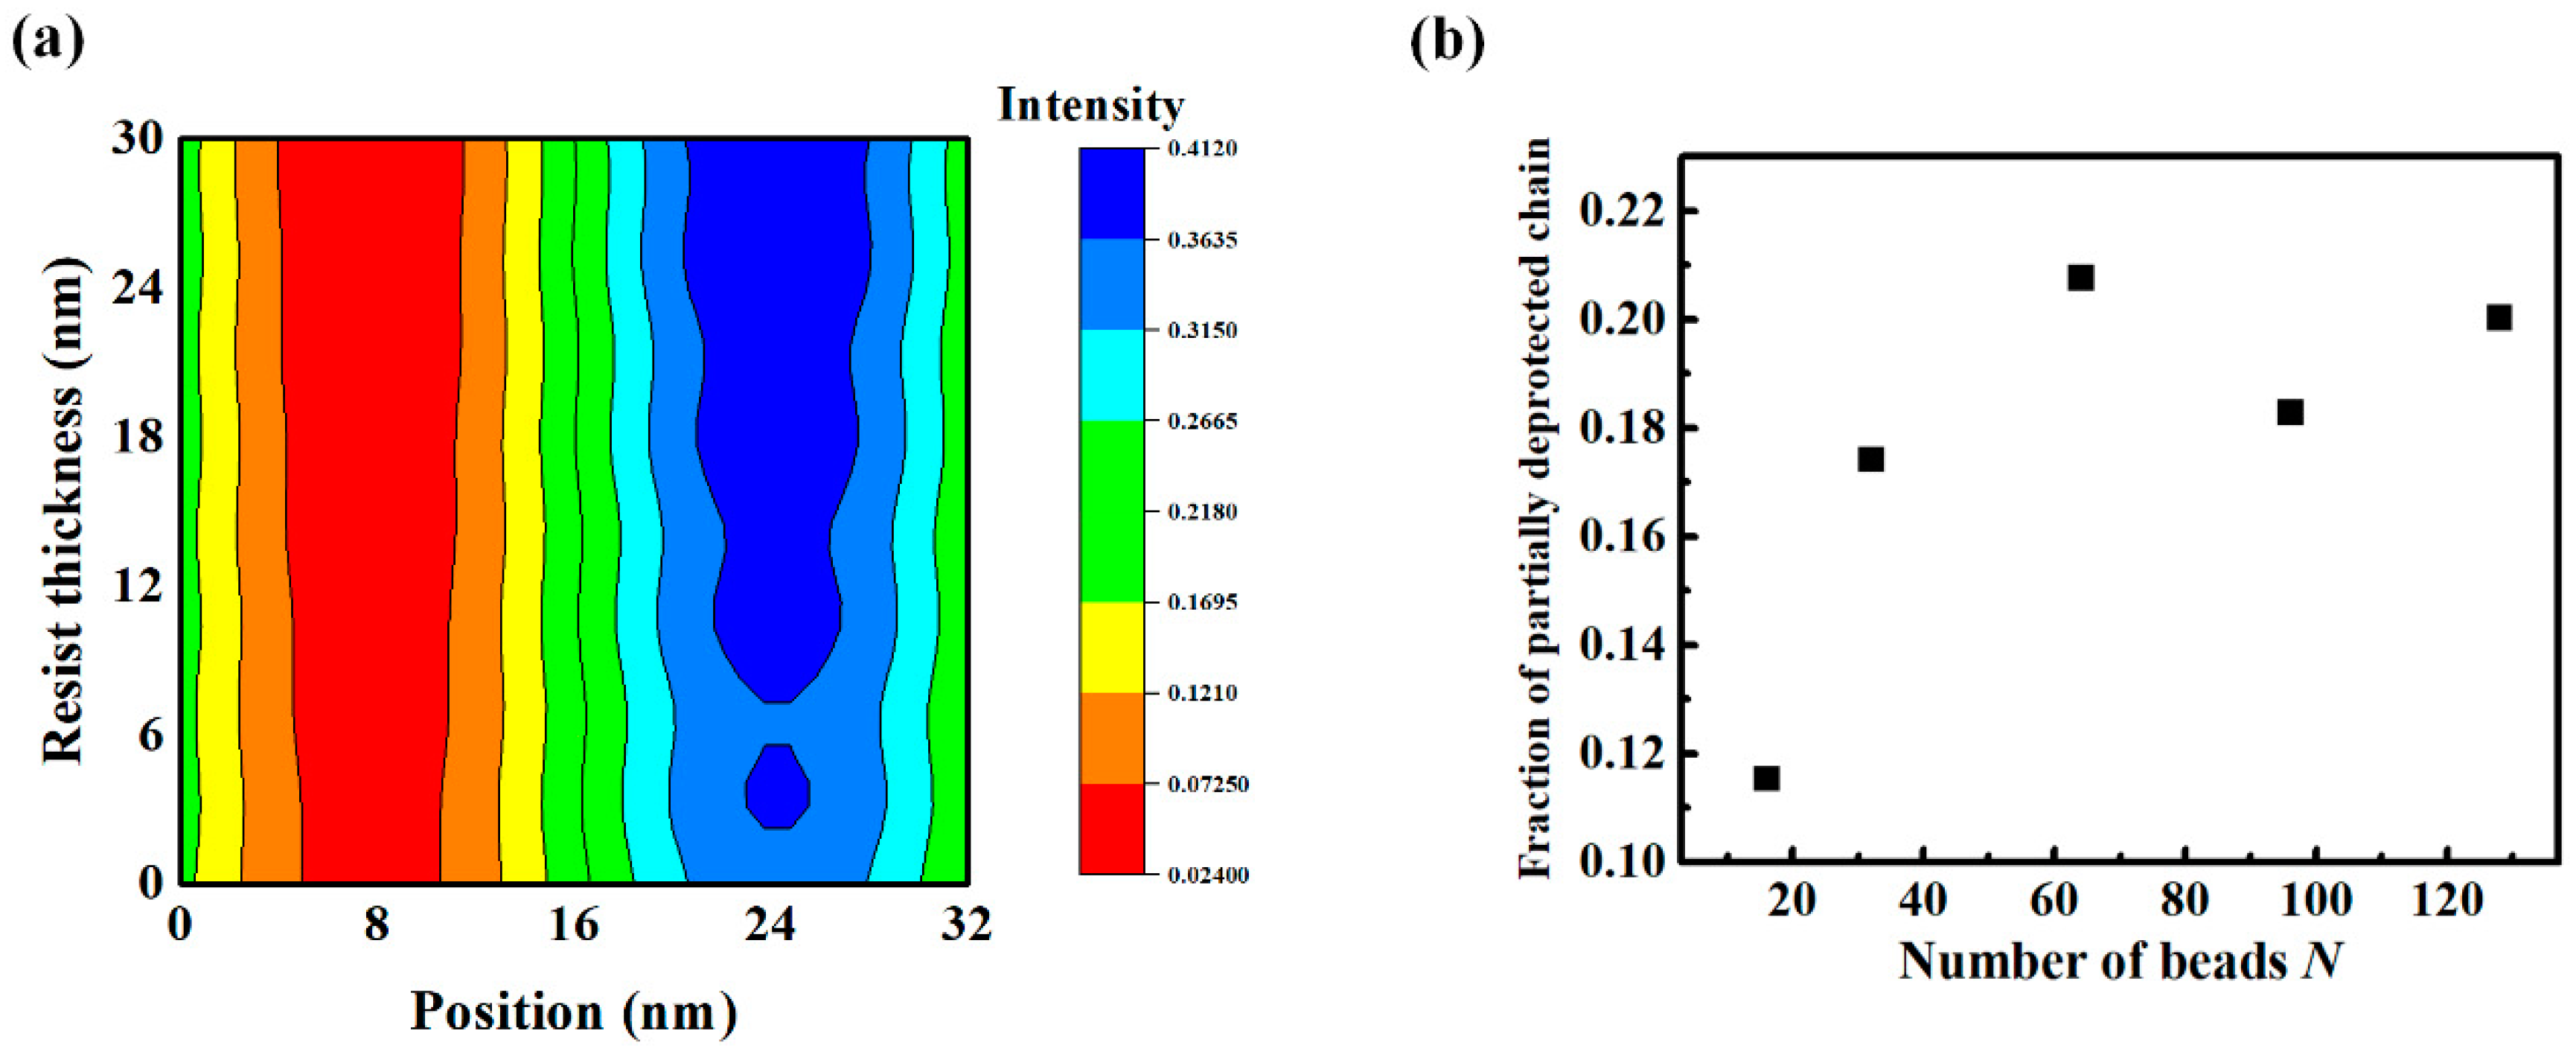
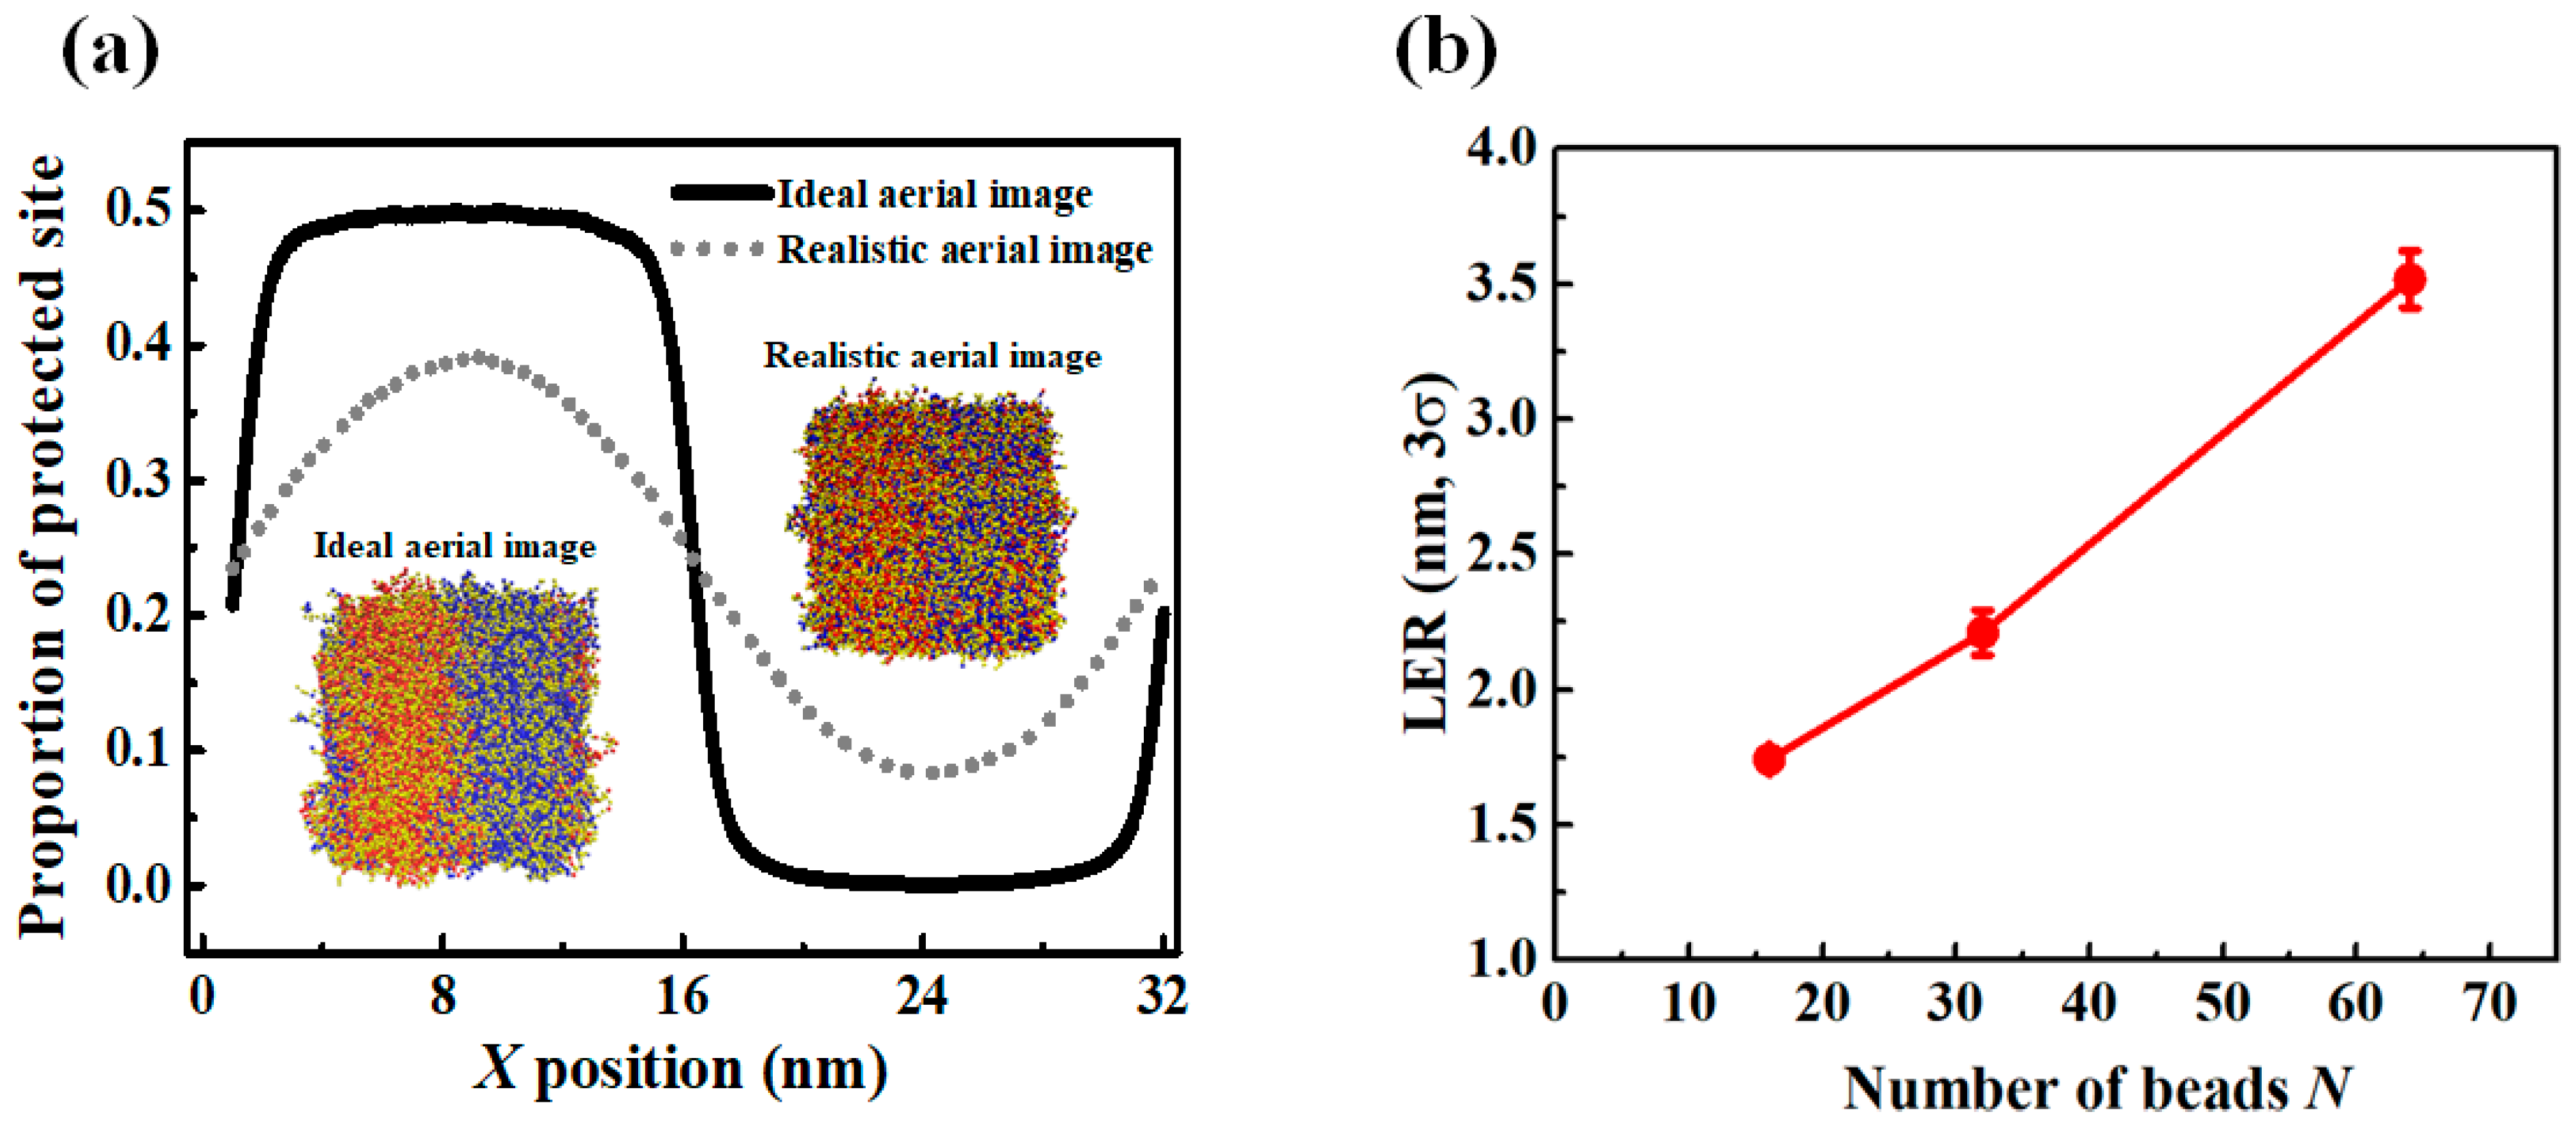
3.4. Effect of the Aerial Image on Polymer Chain Conformation
4. Conclusions
Author Contributions
Funding
Conflicts of Interest
References
- Levinson, H.J. Alternative Lithography Techniques. In Principle of Lithography; SPIE-The International Society for Optical Engineering: Washington, DC, USA, 2001; pp. 341–347. [Google Scholar]
- Bakshi, V. EUV Lithography: An Historical Perspective. In EUV Lithography, 2nd ed.; SPIE-The International Society for Optical Engineering: Washington, DC, USA, 2018; pp. 1–43. [Google Scholar]
- Samsung’s 7nm EUV Is Ready for Volume Production. Available online: https://wccftech.com/samsung-7nm-euv-volume-produce/ (accessed on 26 August 2019).
- Wurm, S.; Ronse, K. Closing Address. In Proceedings of the International Symposium on Extreme Ultraviolet Lithography, Miami, FL, USA, 17–19 October 2011. [Google Scholar]
- Wurm, S.; Naulleau, P. Closing Address. In Proceedings of the International Symposium on Extreme Ultraviolet Lithography, Washington, DC, USA, 27–29 October 2014. [Google Scholar]
- Ronse, K. Closing Address. In Proceedings of the International Symposium on Extreme Ultraviolet Lithography, Maastricht, The Netherlands, 4–7 October 2015. [Google Scholar]
- Itani, T.; Gargini, P.; Ronse, K.; Naulleau, P. Closing Address. In Proceedings of the International Symposium on Extreme Ultraviolet Lithography, Hiroshima, Japan, 24–26 October 2016. [Google Scholar]
- Itani, T.; Gargini, P.; Ronse, K.; Naulleau, P. Closing Address. In Proceedings of the Conference on Photomask Technology and Extreme Ultraviolet Lithography, Monterey, CA, USA, 11–14 September 2017. [Google Scholar]
- Van Es, R.; van de Kerkhof, M.; Minnaert, A.; Fisser, G.; de Klerk, J.; Smits, J.; Moors, R.; Verhoeven, E.; Levasier, L.; Peeters, R.; et al. EUV for HVM: Towards an industrialized scanner for HVM NXE3400B performance update. Proc. SPIE 2018, 10583, 1–12. [Google Scholar]
- Mack, C.A. Chemically Amplified Resist: Exposure and Bake Chemistry. In Fundamental Principles of Optical Lithography: The Science of Microfabrication; John Wiley and Sons Ltd.: Chichester, UK, 2011; pp. 223–254. [Google Scholar]
- Saeki, A.; Kozawa, T.; Tagawa, S. Monte carlo simulation of chemical intermediates in CARs. In Proceedings of the International Workshop on Extreme Ultraviolet Lithography, Oahu, HI, USA, 13–17 July 2009. [Google Scholar]
- Hishiro, Y. Novel EUV resist development for sub-14 nm half pitch. In Proceedings of the International Workshop on Extreme Ultraviolet Lithography, Maui, HI, USA, 15–19 June 2015. [Google Scholar]
- Goldfarb, D.L.; Ardakani, A.A.; Glodde, M. Acid generation efficiency: EUV photons versus photoelectrons. Proc. SPIE 2016, 9779, 1–13. [Google Scholar]
- Kozawa, T.; Tagawa, S. Radiation Chemistry in Chemically Amplified Resists. Jpn. J. Appl. Phys. 2010, 49, 1–19. [Google Scholar] [CrossRef]
- Okoroanyanwu, U. Positive Resists. In Chemistry and Lithography; SPIE-The International Society for Optical Engineering: Washington, DC, USA, 2010; pp. 285–393. [Google Scholar]
- De Simone, D.; Vesters, Y.; Vandenberghe, G. Photoresists in extreme ultraviolet lithography (EUVL). Adv. Opt. Technol. 2017, 6, 163–172. [Google Scholar] [CrossRef]
- Narasimhan, A.; Grzeskowiak, S.; Ostrander, J.; Schad, J.; Rebeyev, E.; Neisser, M.; Ocola, L.E.; Denbeaux, G.; Brainard, R.L. Studying electron-PAG interactions using electron-induced fluorescence. Proc. SPIE 2016, 9779, 1–16. [Google Scholar]
- Grzeskowiak, S.; Kaminsky, J.; Gibbons, S.; Narasimhan, A.; Brainard, R.L.; Denbeaux, G. Electron trapping: A mechanism for acid production in extreme ultraviolet photoresists. J. Micro Nanolith. MEMS MOEMS 2018, 17, 033501. [Google Scholar] [CrossRef]
- Kozawa, T.; Tagawa, S.; Cao, H.B.; Deng, H.; Leeson, M.J. Acid distribution in chemically amplified extreme ultraviolet resist. J. Vac. Sci. Technol. B 2007, 25, 2481–2485. [Google Scholar] [CrossRef]
- Kozawa, T.; Tagawa, S. Effect of Acid Generator Decomposition during Exposure on Acid Image Quality of Chemically Amplified Extreme Ultraviolet Resists. Jpn. J. Appl. Phys. 2011, 50, 1–16. [Google Scholar] [CrossRef]
- Itani, T.; Kozawa, T. Resist Materials and Processes for Extreme Ultraviolet Lithography. Jpn. J. Appl. Phys. 2013, 52, 1–14. [Google Scholar] [CrossRef]
- Kozawa, T. Theoretical Study on Acid Diffusion Length in Chemically Amplified Resists Used for Extreme Ultraviolet Lithography. Jpn. J. Appl. Phys. 2013, 52, 1–5. [Google Scholar] [CrossRef]
- Patsis, G.P.; Constantoudis, V.; Gogolides, E. Effects of photoresist polymer molecular weight on line-edge roughness and its metrology probed with Monte Carlo simulations. Microelectron. Eng. 2004, 75, 297–308. [Google Scholar] [CrossRef]
- Patsis, G.P.; Drygiannakis, D.; Constantoudis, V.; Raptis, I.; Gogolides, E. Stochastic modeling and simulation of photoresist surface and line-edge roughness evolution. Eur. Polym. J. 2010, 46, 1988–1999. [Google Scholar] [CrossRef]
- Kim, M.; Moon, J.; Choi, J.; Lee, B.; Jeong, C.; Kim, H.; Cho, M. Theoretical modeling of PEB procedure on EUV resist using FDM formulation. Proc. SPIE 2018, 10583, 1–6. [Google Scholar]
- Kim, M.; Moon, J.; Choi, J.; Park, S.; Lee, B.; Cho, M. Multiscale Simulation Approach on Sub-10 nm Extreme Ultraviolet Photoresist Patterning: Insights from Nanoscale Heterogeneity of Polymer. Macromolecules 2018, 51, 6922–6935. [Google Scholar] [CrossRef]
- Lee, H.; Kim, M.; Moon, J.; Park, S.; Lee, B.; Jeong, C.; Cho, M. Multiscale approach for modeling EUV patterning of chemically amplified resist. Proc. SPIE 2019, 10960, 1–6. [Google Scholar]
- Hur, S.-M.; Thapar, V.; Ramírez-Hernández, A.; Khaira, G.; Segal-Peretz, T.; Rincon-Delgadillo, P.A.; Li, W.; Müller, M.; Nealey, P.F.; de Pablo, J.J. Molecular pathways for defect annihilation in directed self-assembly. Proc. Natl. Acad. Sci. USA 2015, 112, 14144–14149. [Google Scholar] [CrossRef]
- Nagpal, U.; Müller, M.; Nealey, P.F.; de Pablo, J.J. Free Energy of Defects in Ordered Assemblies of Block Copolymer Domains. ACS Macro Lett. 2012, 1, 418–422. [Google Scholar] [CrossRef]
- Detcheverry, F.A.; Pike, D.Q.; Nagpal, U.; Nealey, P.F.; de Pablo, J.J. Theoretically informed coarse grain simulations of block copolymer melts: Method and applications. Soft Matter 2009, 5, 4858. [Google Scholar] [CrossRef]
- Pike, D.Q.; Detcheverry, F.A.; Müller, M.; de Pablo, J.J. Theoretically informed coarse grain simulations of polymeric systems. J. Chem. Phys. 2009, 131, 084903. [Google Scholar] [CrossRef]
- Detcheverry, F.A.; Pike, D.Q.; Nealey, P.F.; Müller, M.; de Pablo, J.J. Simulations of theoretically informed coarse grain models of polymeric systems. Faraday Discuss. 2010, 144, 111–125. [Google Scholar] [CrossRef]
- Ramírez-Hernández, A.; Müller, M.; de Pablo, J.J. Theoretically informed entangled polymer simulations: Linear and non-linear rheology of melts. Soft Matter 2013, 9, 2030. [Google Scholar] [CrossRef]
- Hur, S.-M.; Khaira, G.S.; Ramírez-Hernández, A.; Müller, M.; Nealey, P.F.; de Pablo, J.J. Simulation of Defect Reduction in Block Copolymer Thin Films by Solvent Annealing. ACS Macro Lett. 2015, 4, 11–15. [Google Scholar] [CrossRef]
- Peter, S.; Meyer, H.; Baschnagel, J. Thickness-dependent reduction of the glass-transition temperature in thin polymer films with a free surface. J. Polym. Sci. B Polym. Phys. 2006, 44, 2951–2967. [Google Scholar] [CrossRef]
- Bäumchen, O.; McGraw, J.D.; Forrest, J.A.; Dalnoki-Veress, K. Reduced Glass Transition Temperatures in Thin Polymer Films: Surface Effect or Artifact? Phys. Rev. Lett. 2012, 109, 055701. [Google Scholar] [CrossRef]
- Kim, J.H.; Jang, J.; Zin, W.-C. Thickness Dependence of the Glass Transition Temperature in Thin Polymer Films. Langmuir 2001, 17, 2703–2710. [Google Scholar] [CrossRef]
- Broseta, D.; Fredrickson, G.H.; Helfand, E.; Leibler, L. Molecular weight and polydispersity effects at polymer-polymer interfaces. Macromolecules 1990, 23, 132–139. [Google Scholar] [CrossRef]
- Sferrazza, M.; Xiao, C.; Bucknall, D.G.; Jones, R.A.L. Interface width of low-molecular-weight immiscible polymers. J. Phys. Condens. Matter 2001, 13, 10269–10277. [Google Scholar] [CrossRef]
- Fujii, T.; Matsumaru, S.; Yamada, T.; Komuro, Y.; Kawana, D.; Ohmori, K. Patterning performance of chemically amplified resist in EUV lithography. Proc. SPIE 2016, 9776, 1–6. [Google Scholar]
- Vesters, Y.; Jiang, J.; Yamamoto, H.; De Simone, D.; Kozawa, T.; De Gendt, S.; Vandenberghe, G. Sensitizers in EUV chemically amplified resist: Mechanism of sensitivity improvement. Proc. SPIE 2018, 10583, 1–11. [Google Scholar]


| Parameters | Value |
|---|---|
| 100 | |
| 150 | |
| −150 | |
| 200 | |
| 200 | |
| 128 |
© 2019 by the authors. Licensee MDPI, Basel, Switzerland. This article is an open access article distributed under the terms and conditions of the Creative Commons Attribution (CC BY) license (http://creativecommons.org/licenses/by/4.0/).
Share and Cite
Park, J.; Lee, S.-G.; Vesters, Y.; Severi, J.; Kim, M.; De Simone, D.; Oh, H.-K.; Hur, S.-M. Molecular Modeling of EUV Photoresist Revealing the Effect of Chain Conformation on Line-Edge Roughness Formation. Polymers 2019, 11, 1923. https://doi.org/10.3390/polym11121923
Park J, Lee S-G, Vesters Y, Severi J, Kim M, De Simone D, Oh H-K, Hur S-M. Molecular Modeling of EUV Photoresist Revealing the Effect of Chain Conformation on Line-Edge Roughness Formation. Polymers. 2019; 11(12):1923. https://doi.org/10.3390/polym11121923
Chicago/Turabian StylePark, Juhae, Sung-Gyu Lee, Yannick Vesters, Joren Severi, Myungwoong Kim, Danilo De Simone, Hye-Keun Oh, and Su-Mi Hur. 2019. "Molecular Modeling of EUV Photoresist Revealing the Effect of Chain Conformation on Line-Edge Roughness Formation" Polymers 11, no. 12: 1923. https://doi.org/10.3390/polym11121923
APA StylePark, J., Lee, S.-G., Vesters, Y., Severi, J., Kim, M., De Simone, D., Oh, H.-K., & Hur, S.-M. (2019). Molecular Modeling of EUV Photoresist Revealing the Effect of Chain Conformation on Line-Edge Roughness Formation. Polymers, 11(12), 1923. https://doi.org/10.3390/polym11121923