3.1. Foam Characterization
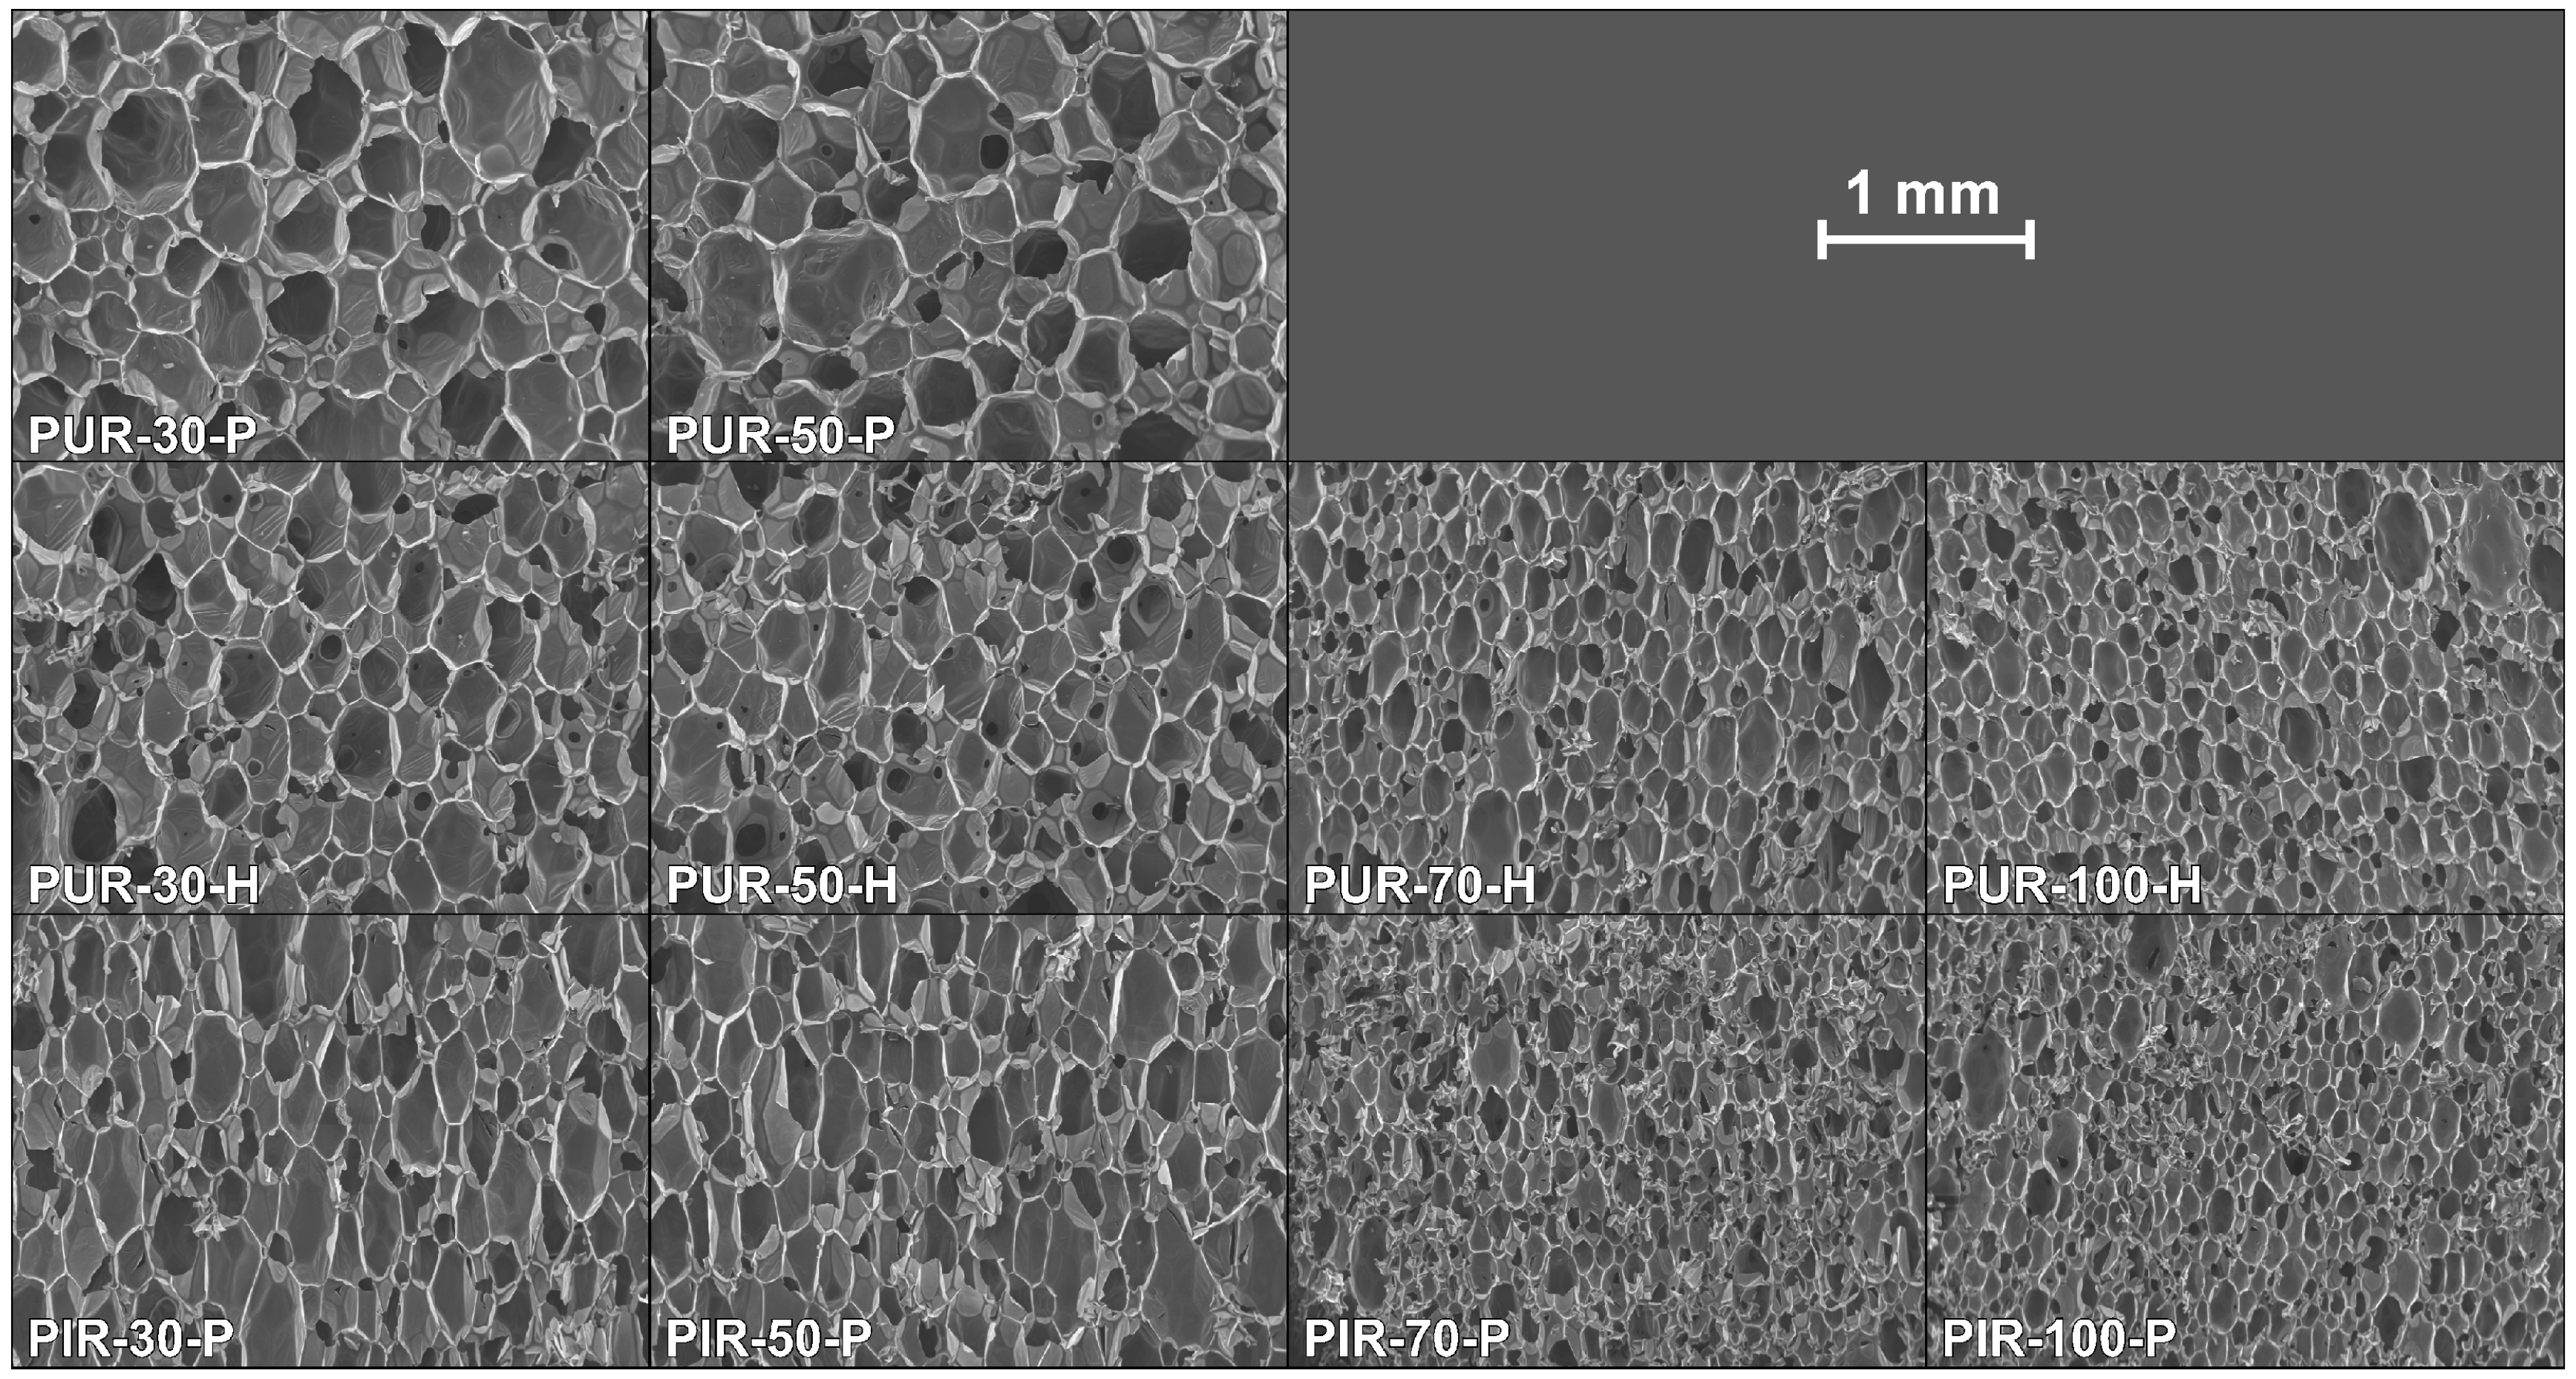
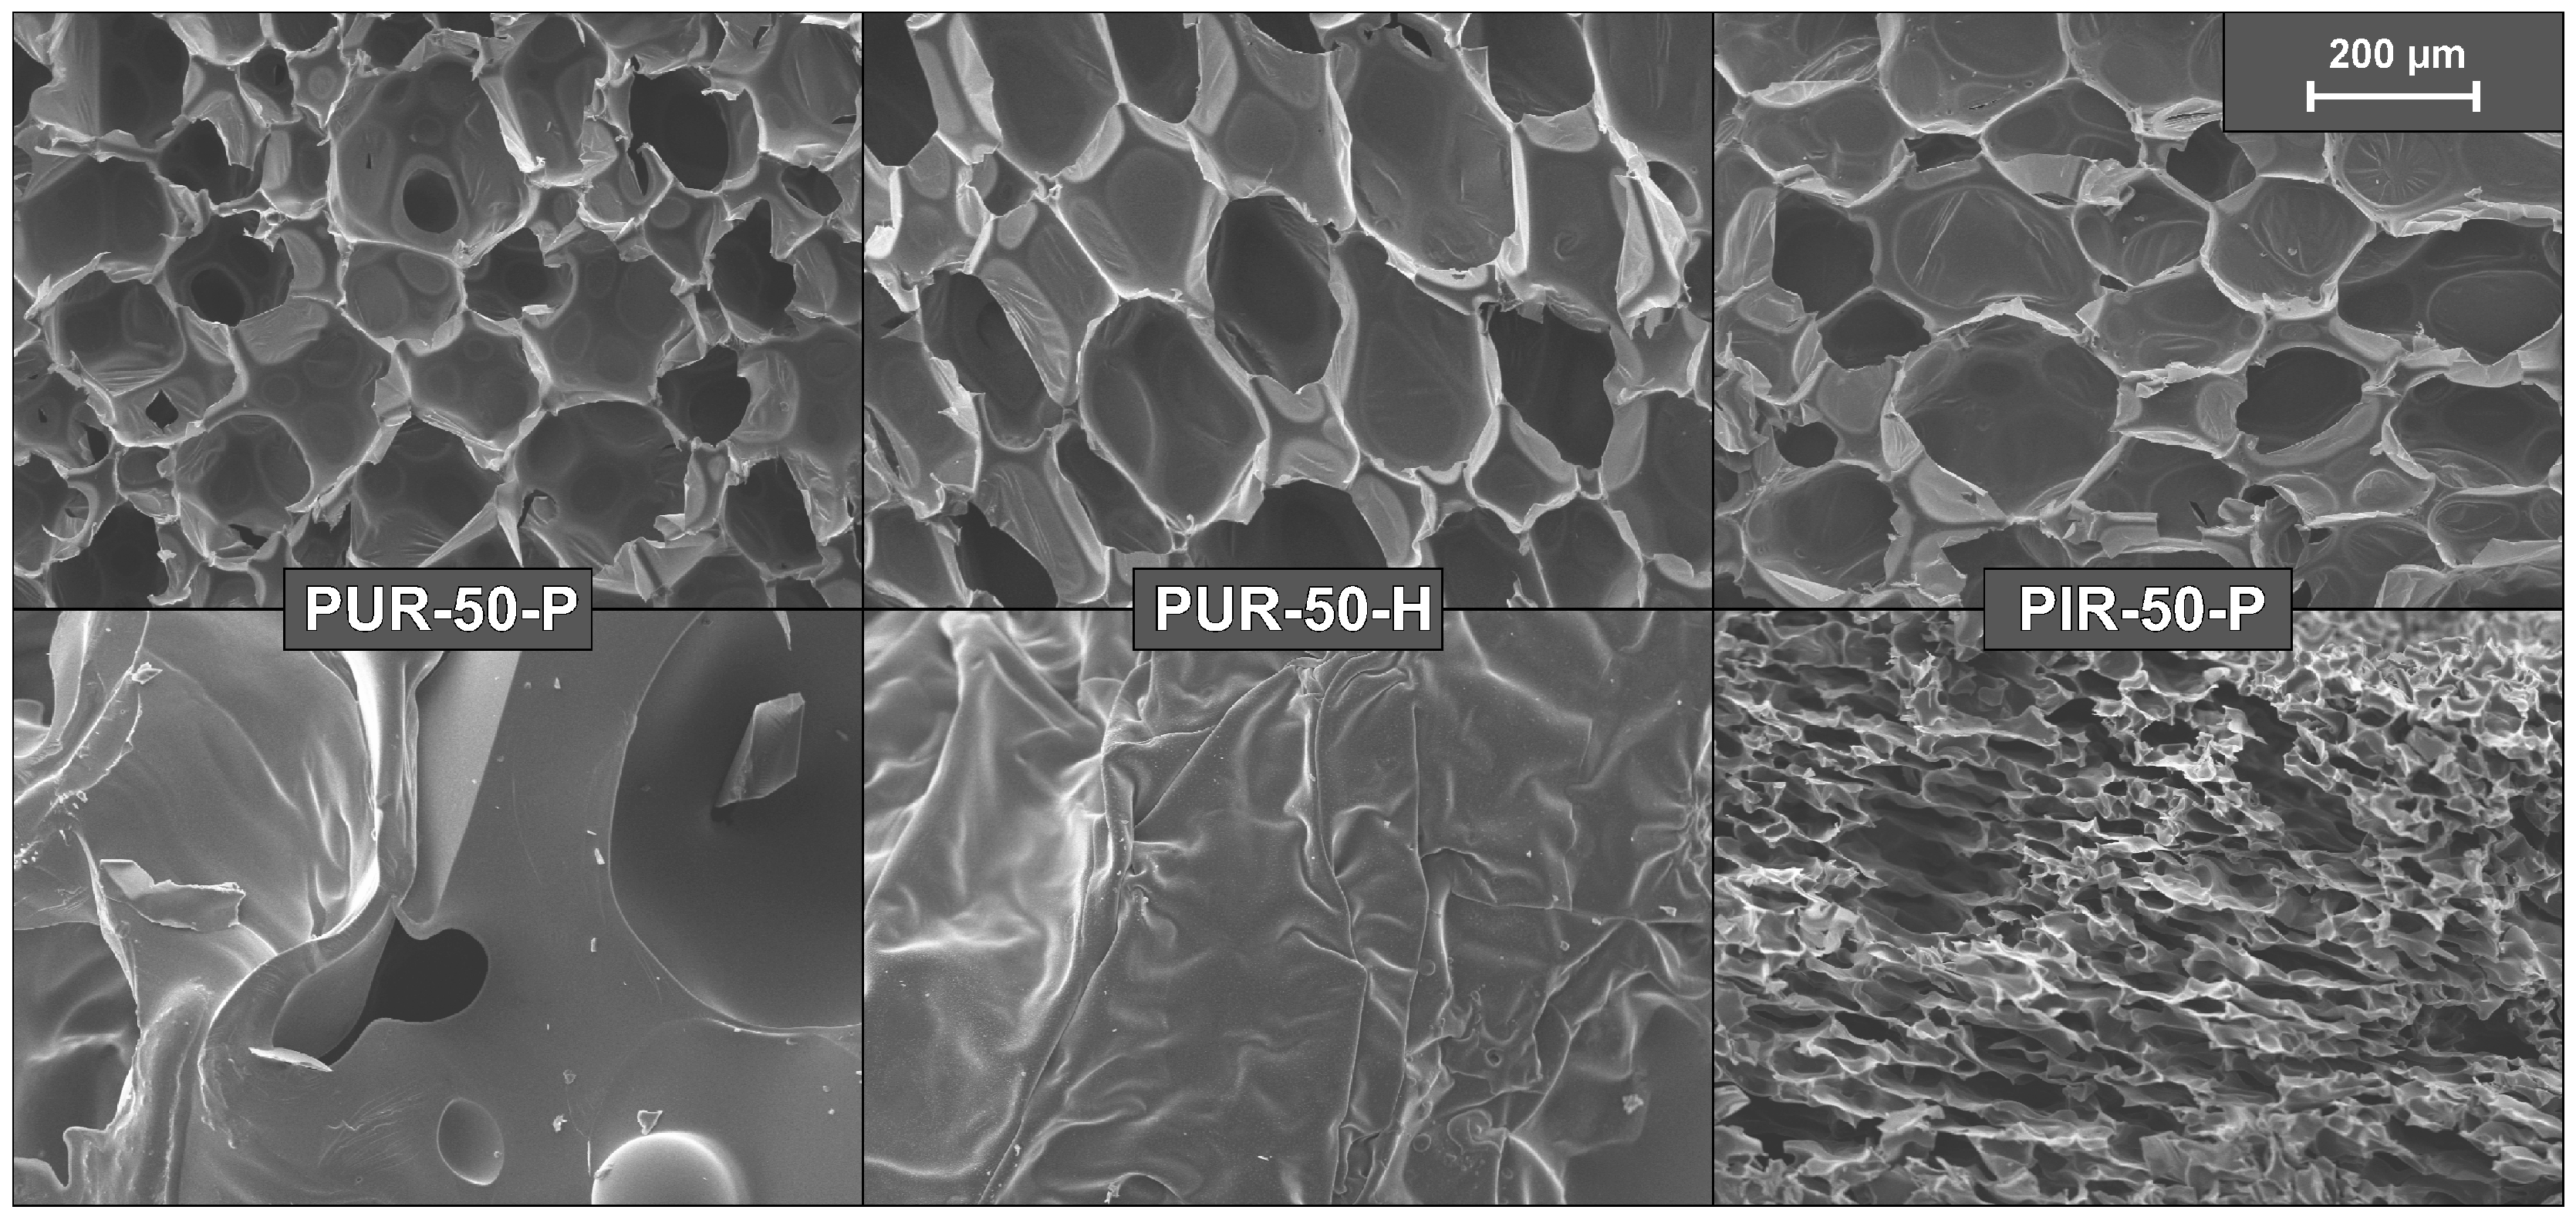
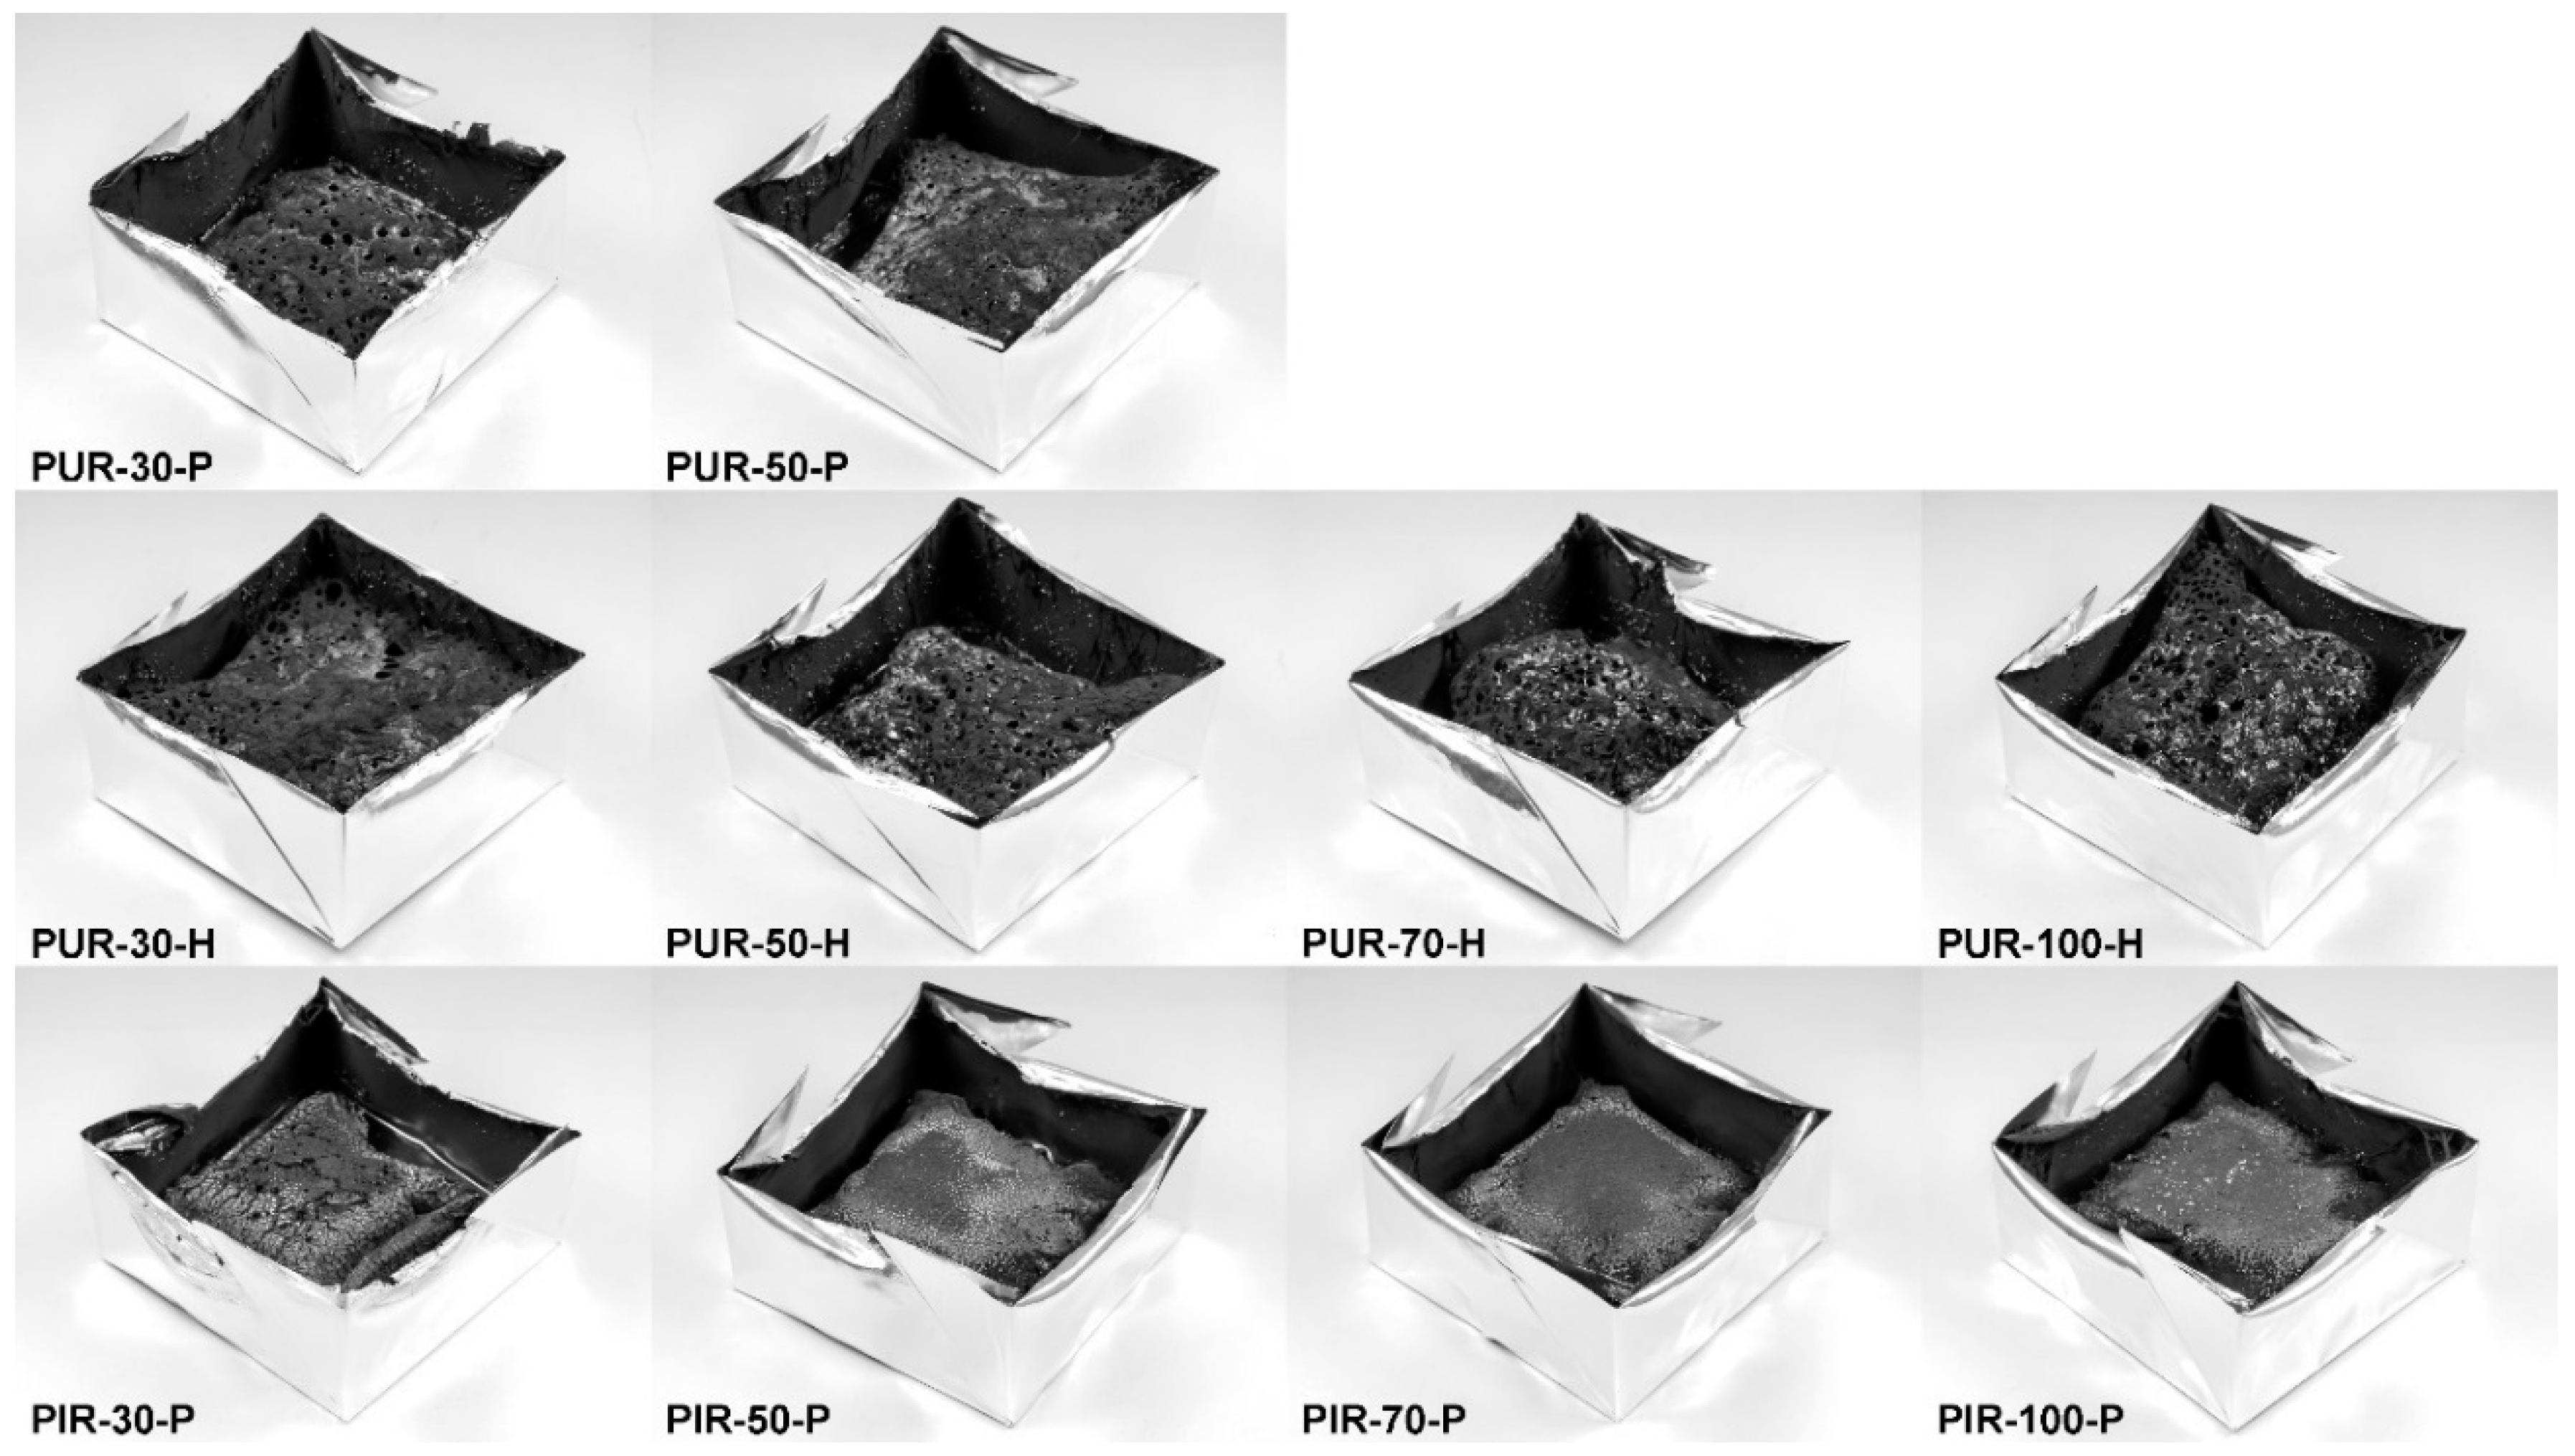
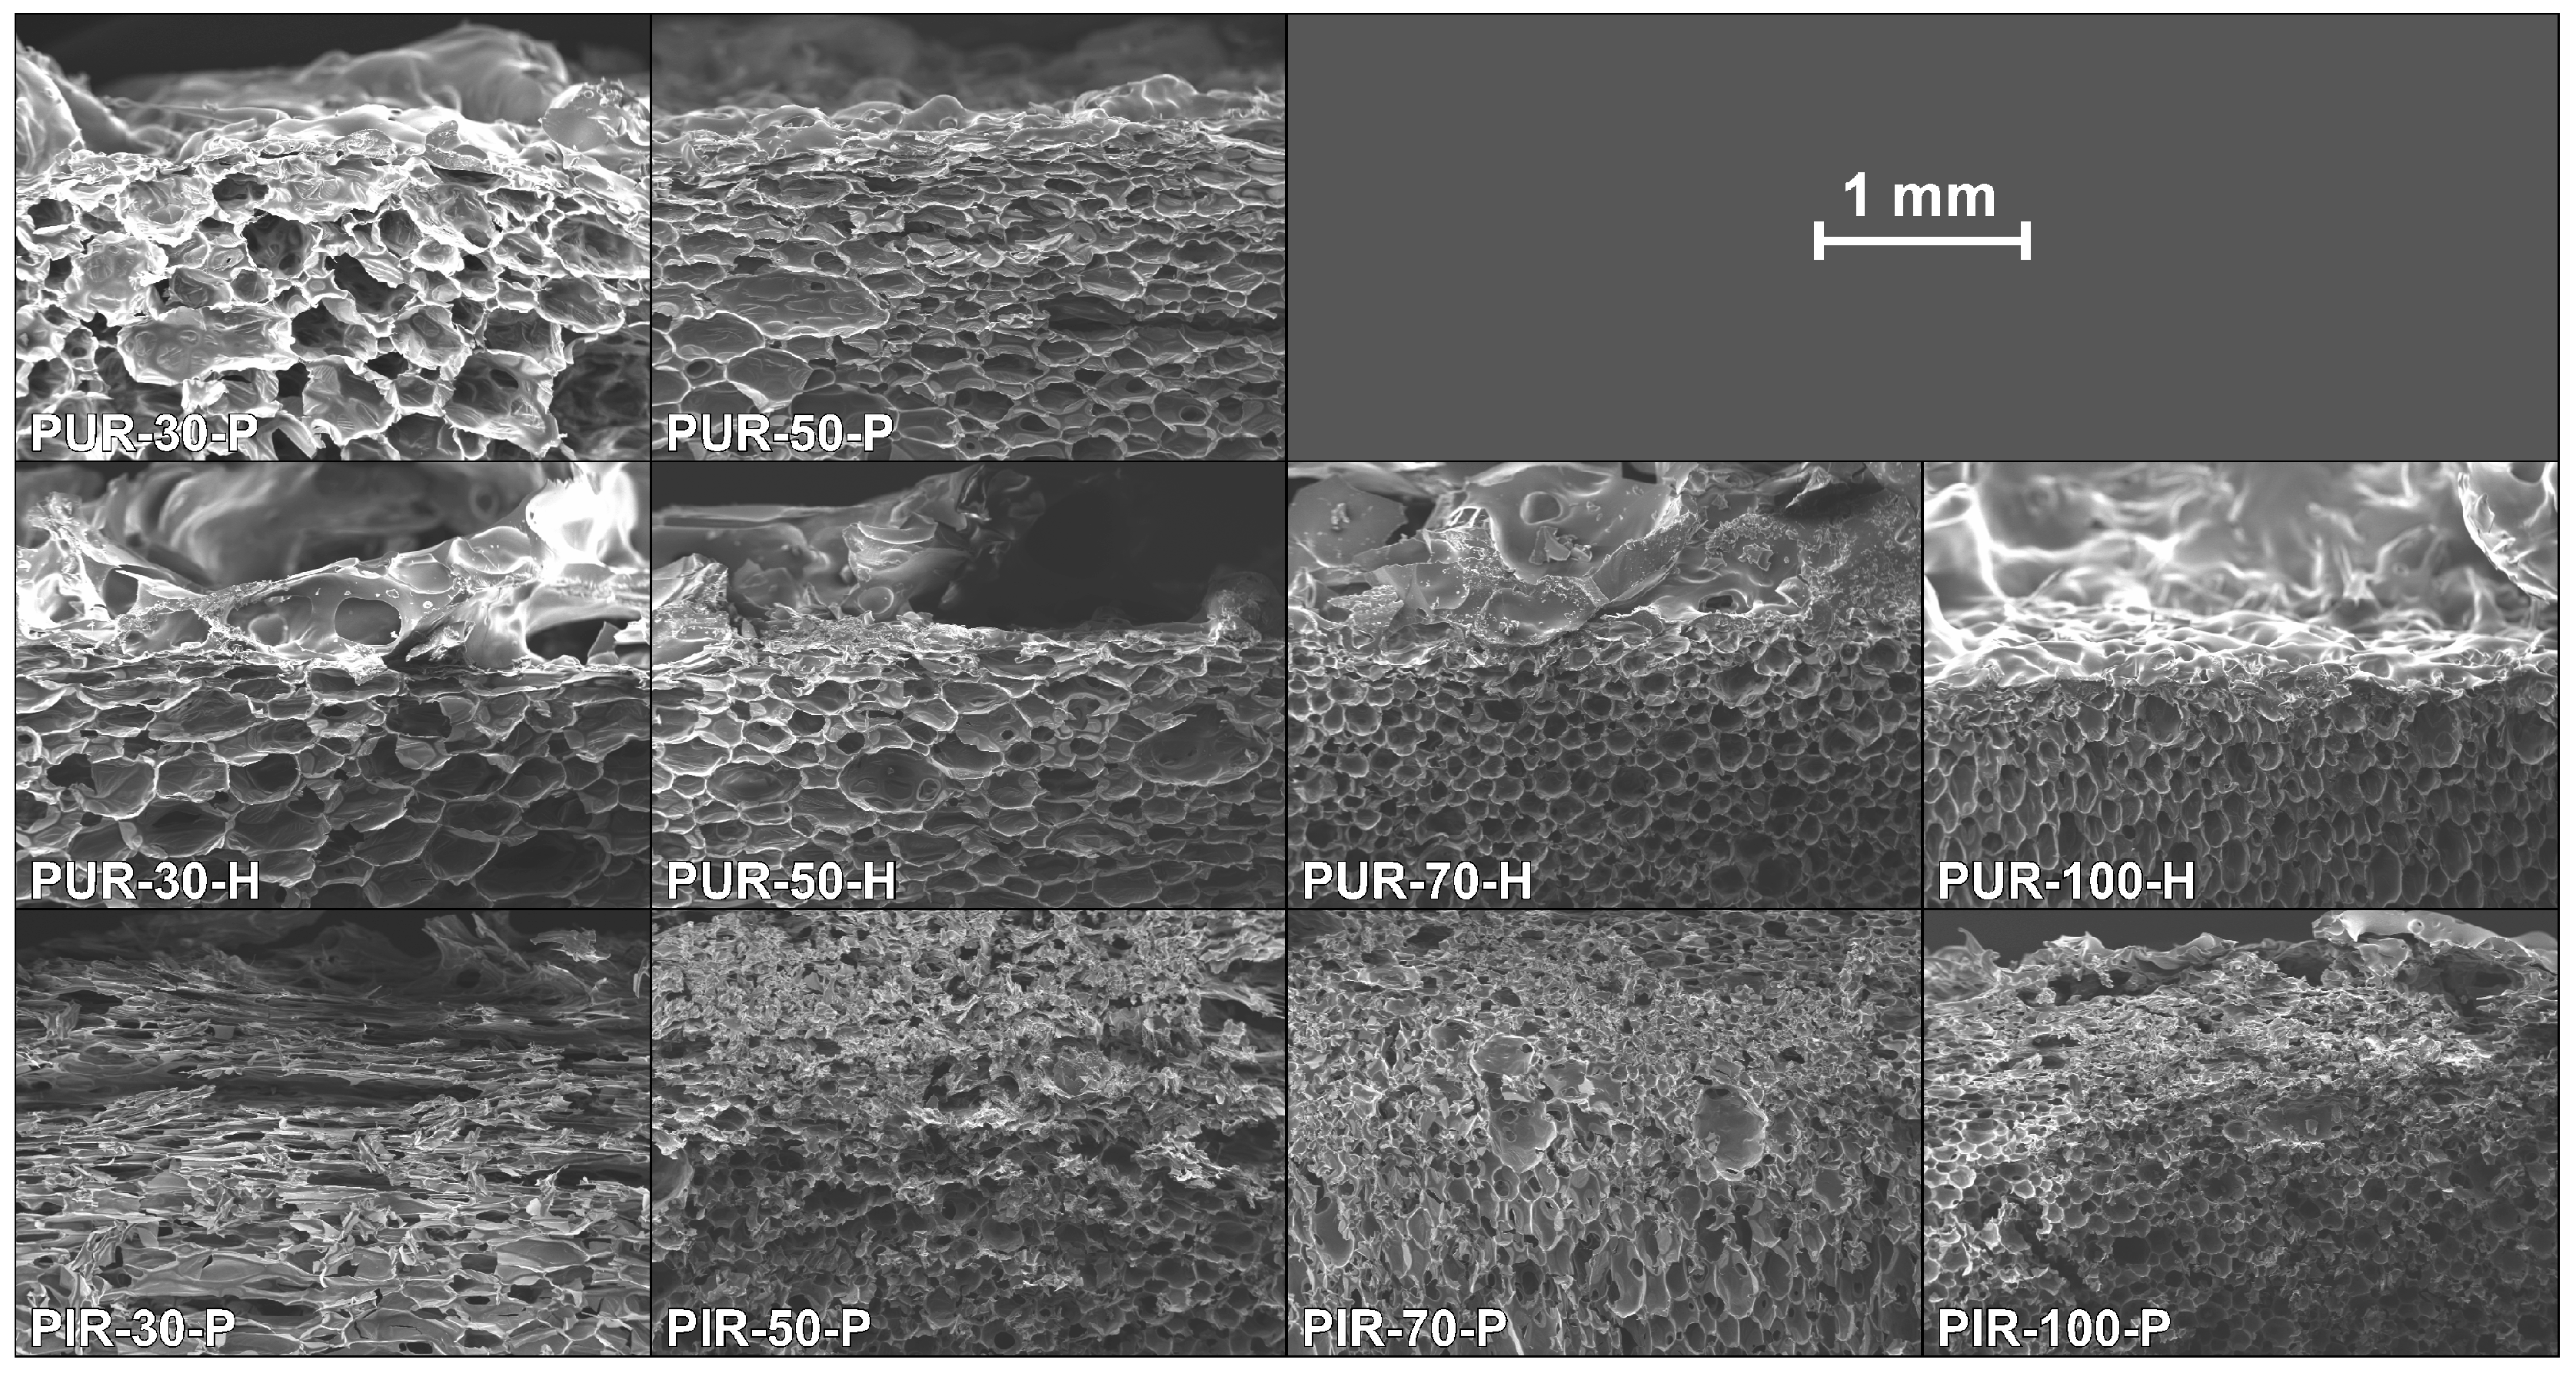
SEM micrographs of each foam’s cross sections were taken at a magnification of 100 and are displayed in
Figure 1. All materials show a homogeneous cell structure as well as mainly closed cells. This is typical for rigid polyurethane foams and desirable for most purposes since closed cell walls cause not only low water absorption and low moisture permeability but also the retention of the blowing agent, which is responsible for their low thermal conductivity. RPUF with a density of approximately 30 kg/m
2 often has a closed cell content of 85–95% [
1]. The investigated foams show rather homogenous cell sizes, which increase with decreasing foam density. Furthermore, different foams have comparable cell morphology at similar densities, rendering them comparable when referring to their burning behaviour.
Table 2 lists the results for thermal conductivity and compression strength. The thermal conductivity of closed cell foams depends on the density, the cell size, and the gas inside the cells of the foam and is not a linear relation. In fact, the thermal conductivity is determined by the thermal conductivity of the solid and of the gas as well as the radiation heat transfer from between the cell walls [
37]. The data reported in
Table 2 show that thermal conductivity generally tends to have a minimum in the range of 50–70 kg/m
3. This is in agreement with the literature [
37] and due to an increase of solid conduction, a decrease of radiation contribution, and a slight decrease of gas conduction with increasing density. In the literature it was reported that pentane-blown RPUF exhibits lower thermal conductivity than water-blown RPUF [
38]. This was confirmed by the measurements. Common RPUFs used for construction have a density around 30 kg/m
3, and their thermal conductivity can be as low as 24 mW/m·K [
2]. Since the formulation of the foams investigated in this study was not optimized in regard to their thermal conductivity,
is increased compared to commercial systems. Due to the increased stability of higher-density foam structures, the compressive strength increased with density [
1]. While PUR-P and PUR-H exhibited similar values for compressive strength at the same densities, PIR-30-P had a significantly increased compressive strength of 348 kPa, compared with 195 kPa for PUR-30-P and 170 kPa for PUR-30-H. However, the compressive strength at a density of 100 kg/m
3 was similar for PUR and PIR foams.
3.4. Temperature Development Inside Burning Specimens
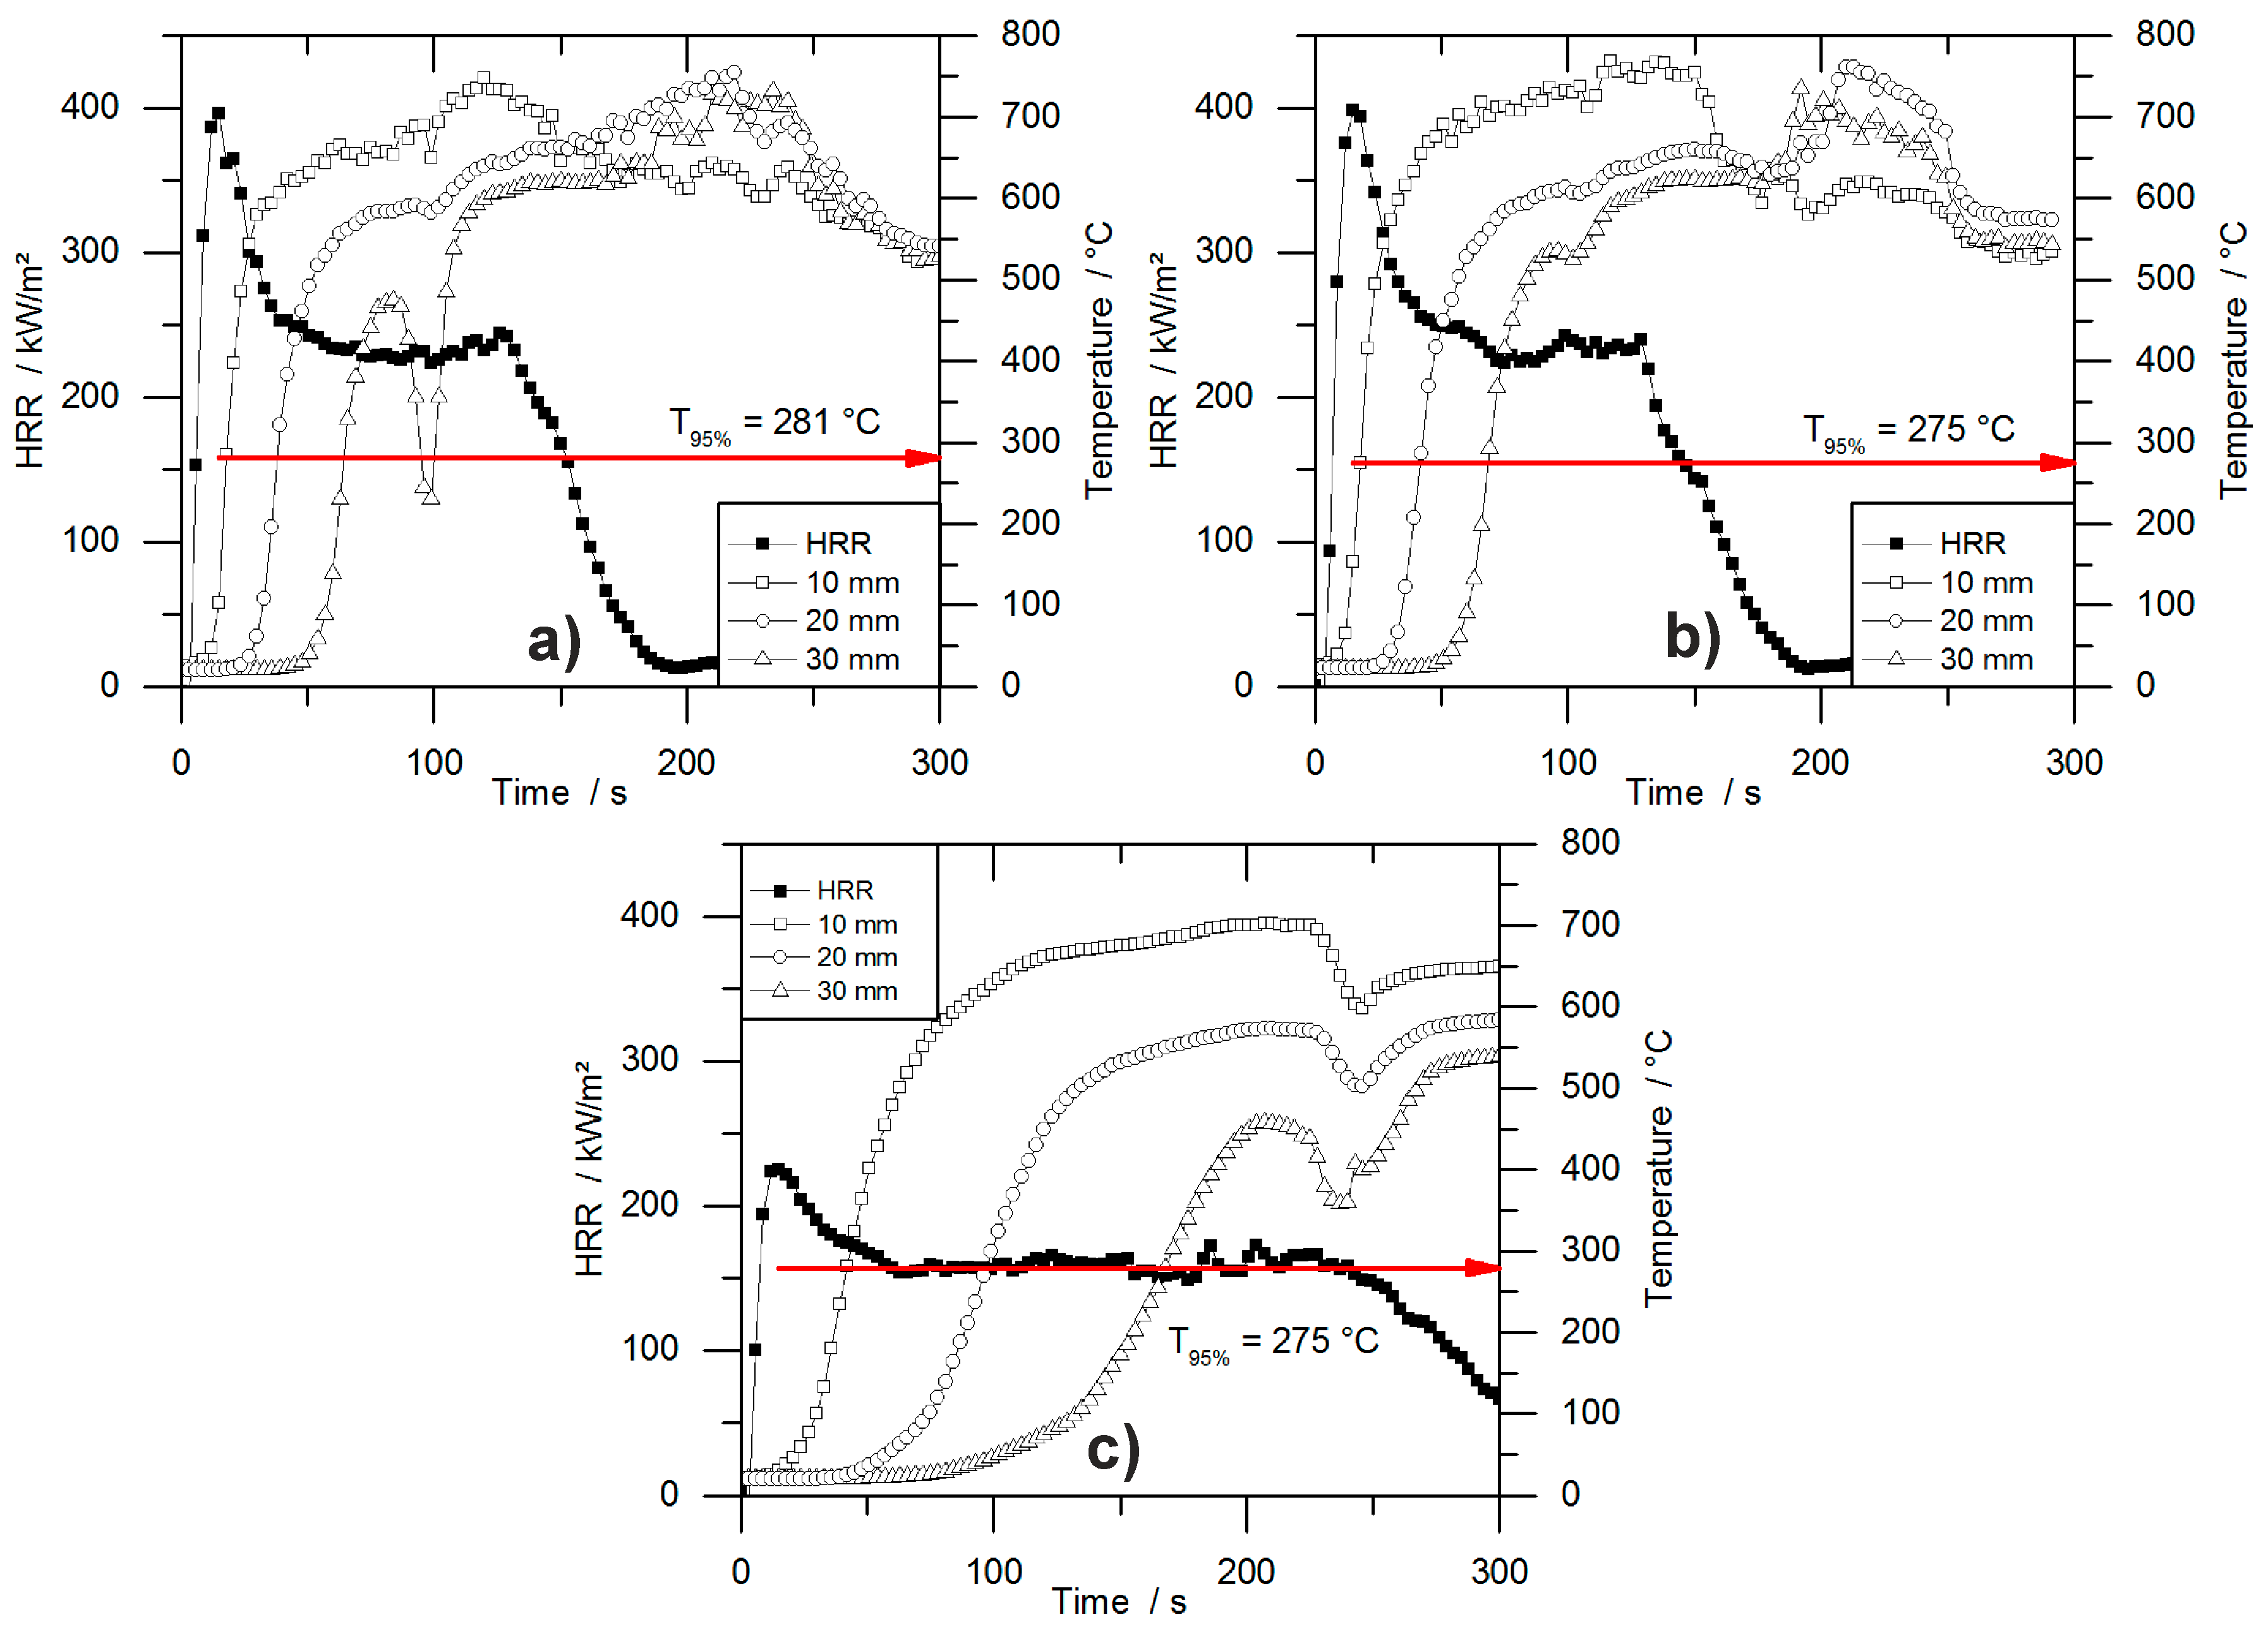
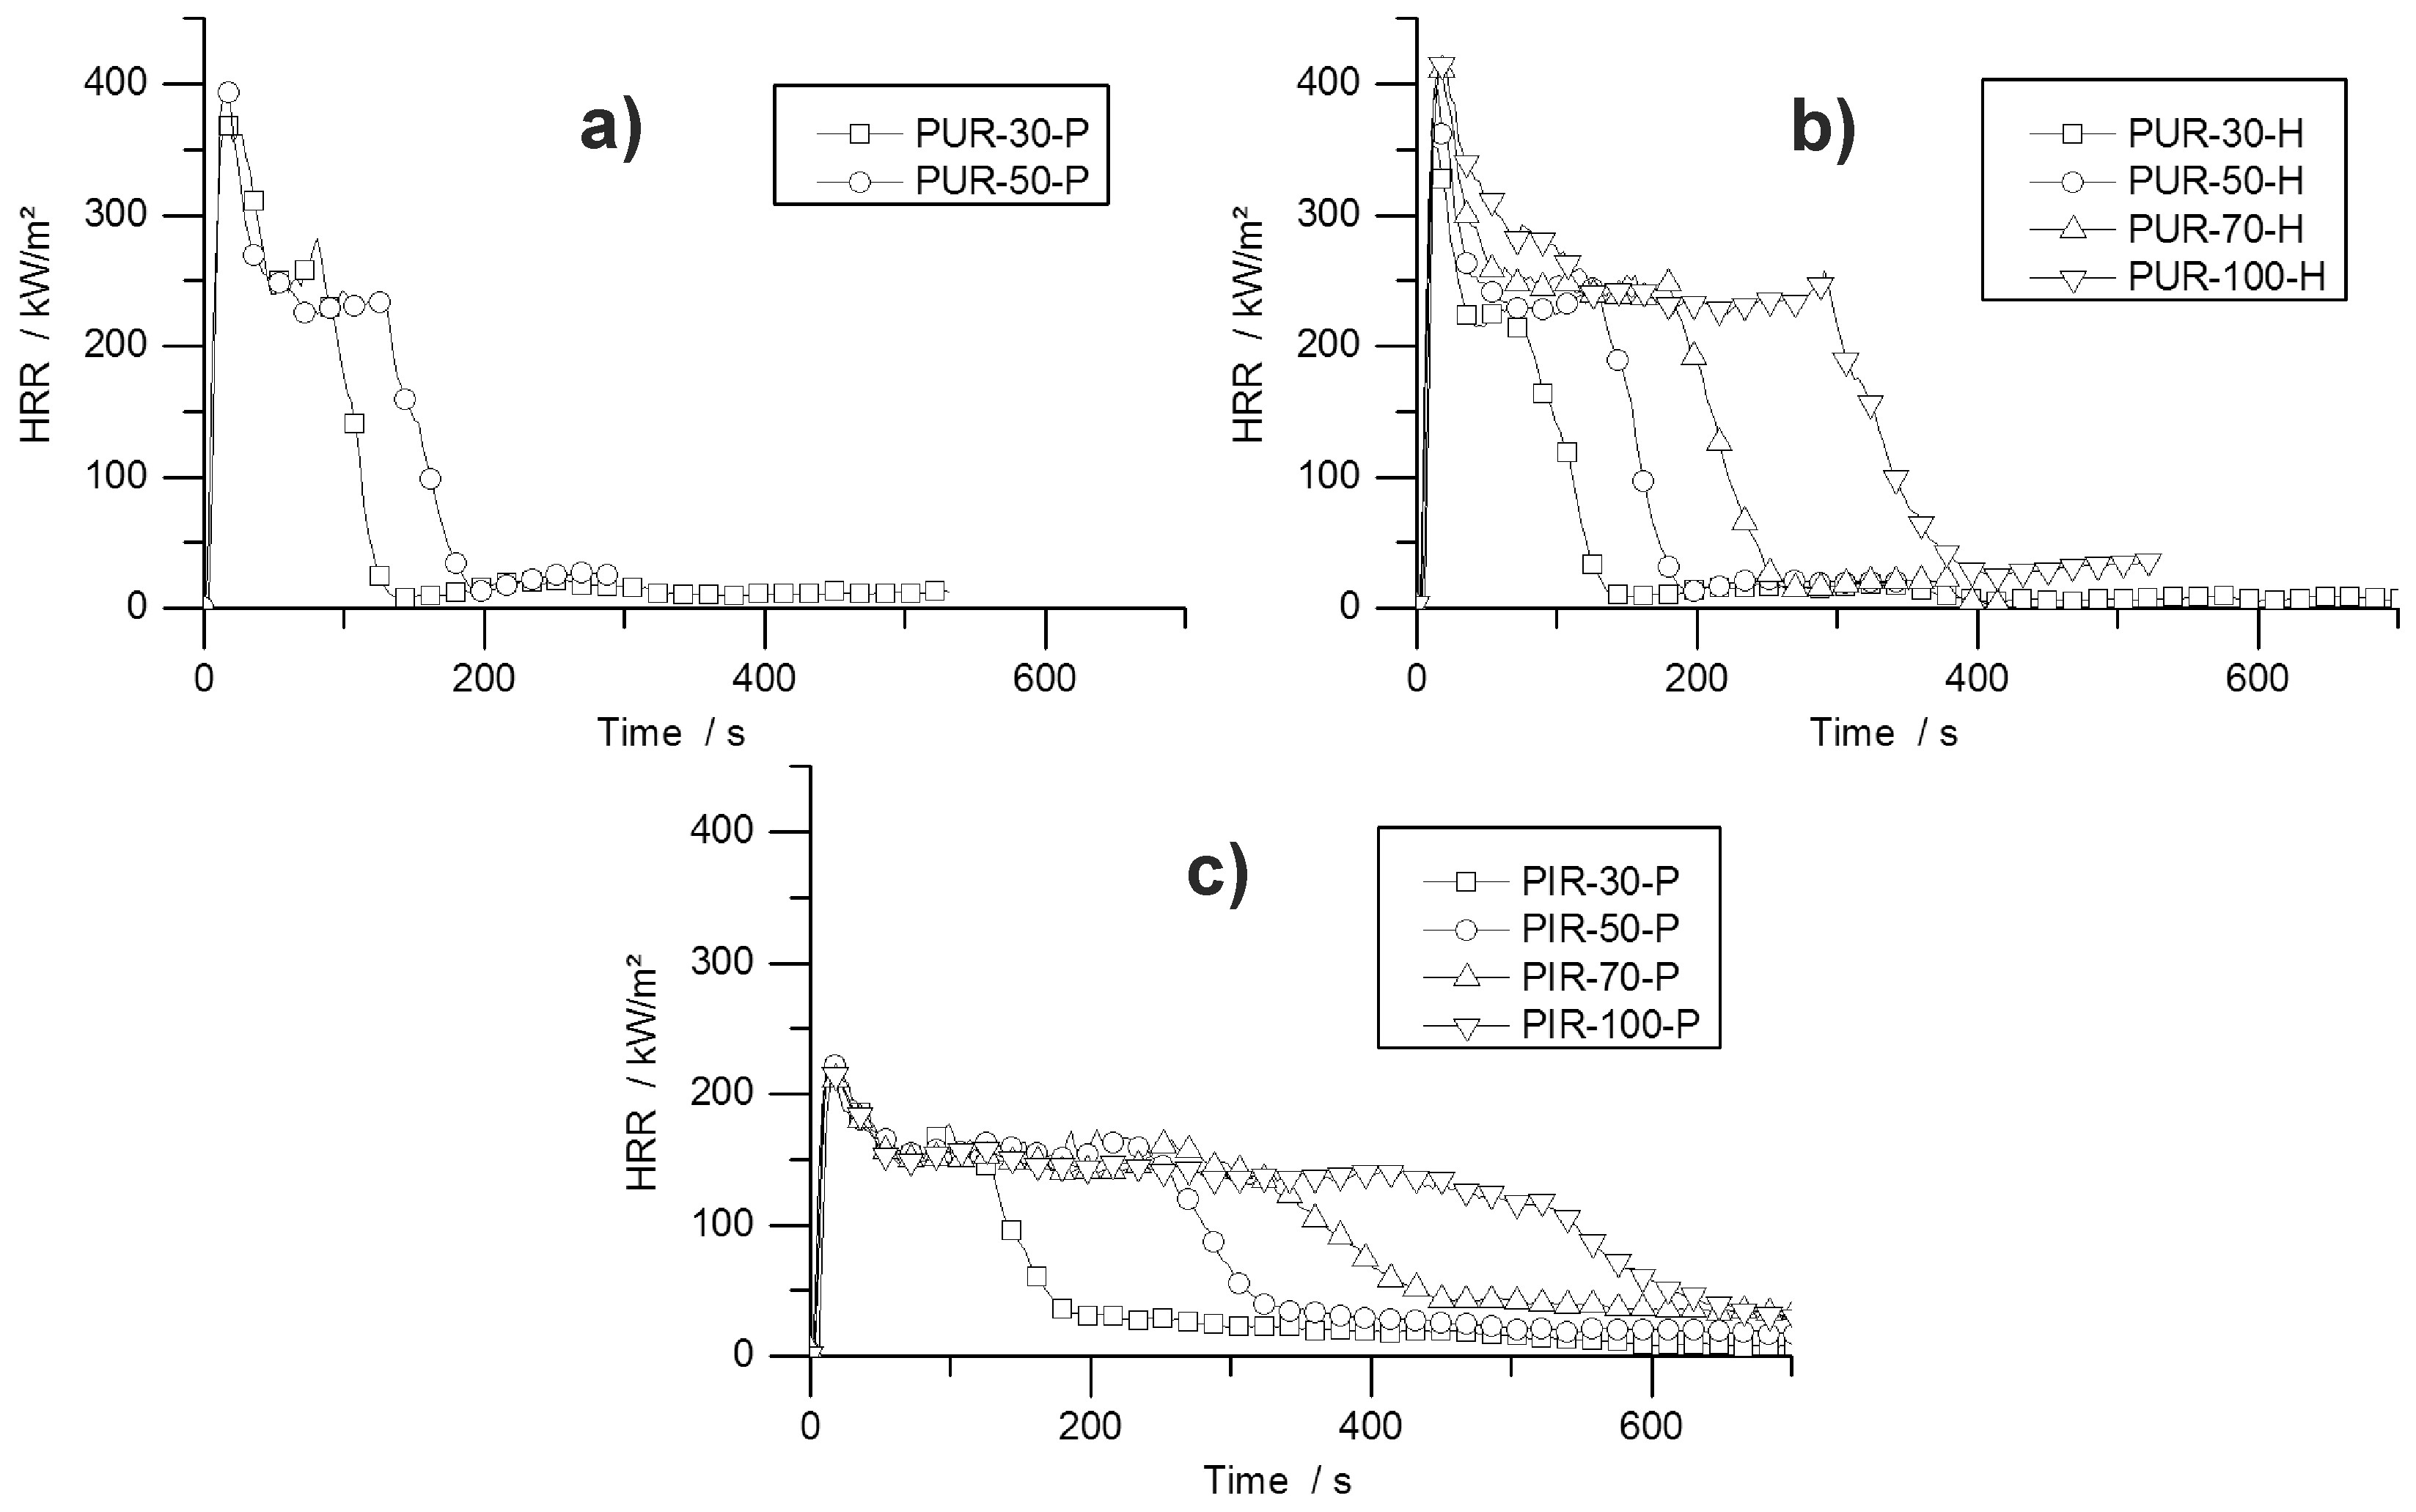
During the cone calorimeter test, the temperature development inside burning specimens was monitored at depths of 10, 20, and 30 mm. The HRR curve and the temperature development inside the specimens were plotted over time and are displayed in
Figure 7 for PUR-50-P, PUR-50-H, and PIR-50-P. The graphs show the excellent thermal insulating properties of the foams. Even though the PHRR of the burning top layer was already reached after 16.5 s for both materials, the temperature measured at a depth of 10 mm remained low. As soon as the pyrolysis front approached the thermocouple there was a steep rise in temperature. By the time the T
95% was reached at a depth of 10 mm, the protective layer on the surface had already formed and HRR began to drop to the steady burning HRR. After passing the thermocouple, the foam was consumed by the fire such that the thermocouple was partially covered by residue and partially exposed. Thus, it was measuring the temperature of the flame, which is the reason for the erratic temperature signal above 500 °C. The drop in temperature displayed in
Figure 7b for the 30 mm signal was caused by cracking of the residue. Something similar happened in
Figure 7c.
Comparing the temperature signals to those of PIR-50-P, the times to reach T
95% at each depth of measurement increased significantly for PIR-50-P. This is caused by the lower MLR under cone calorimeter test conditions and by the better fire performance of this material. For PIR foams those observations correlate well with the reduced PHRR, reduced average HRR, and their increased char yield, and therefore improved protective layer compared to PUR-P and PUR-H foams. Additionally, approaching the first thermocouple at a depth of 10 mm for the pyrolysis front still takes longer than for PUR foams. This also correlates well with the results from the cone calorimeter like PHRR, average HRR and residue. The graphs for temperature signal in
Figure 7c are smoother, since the thermocouple was fully covered with char.
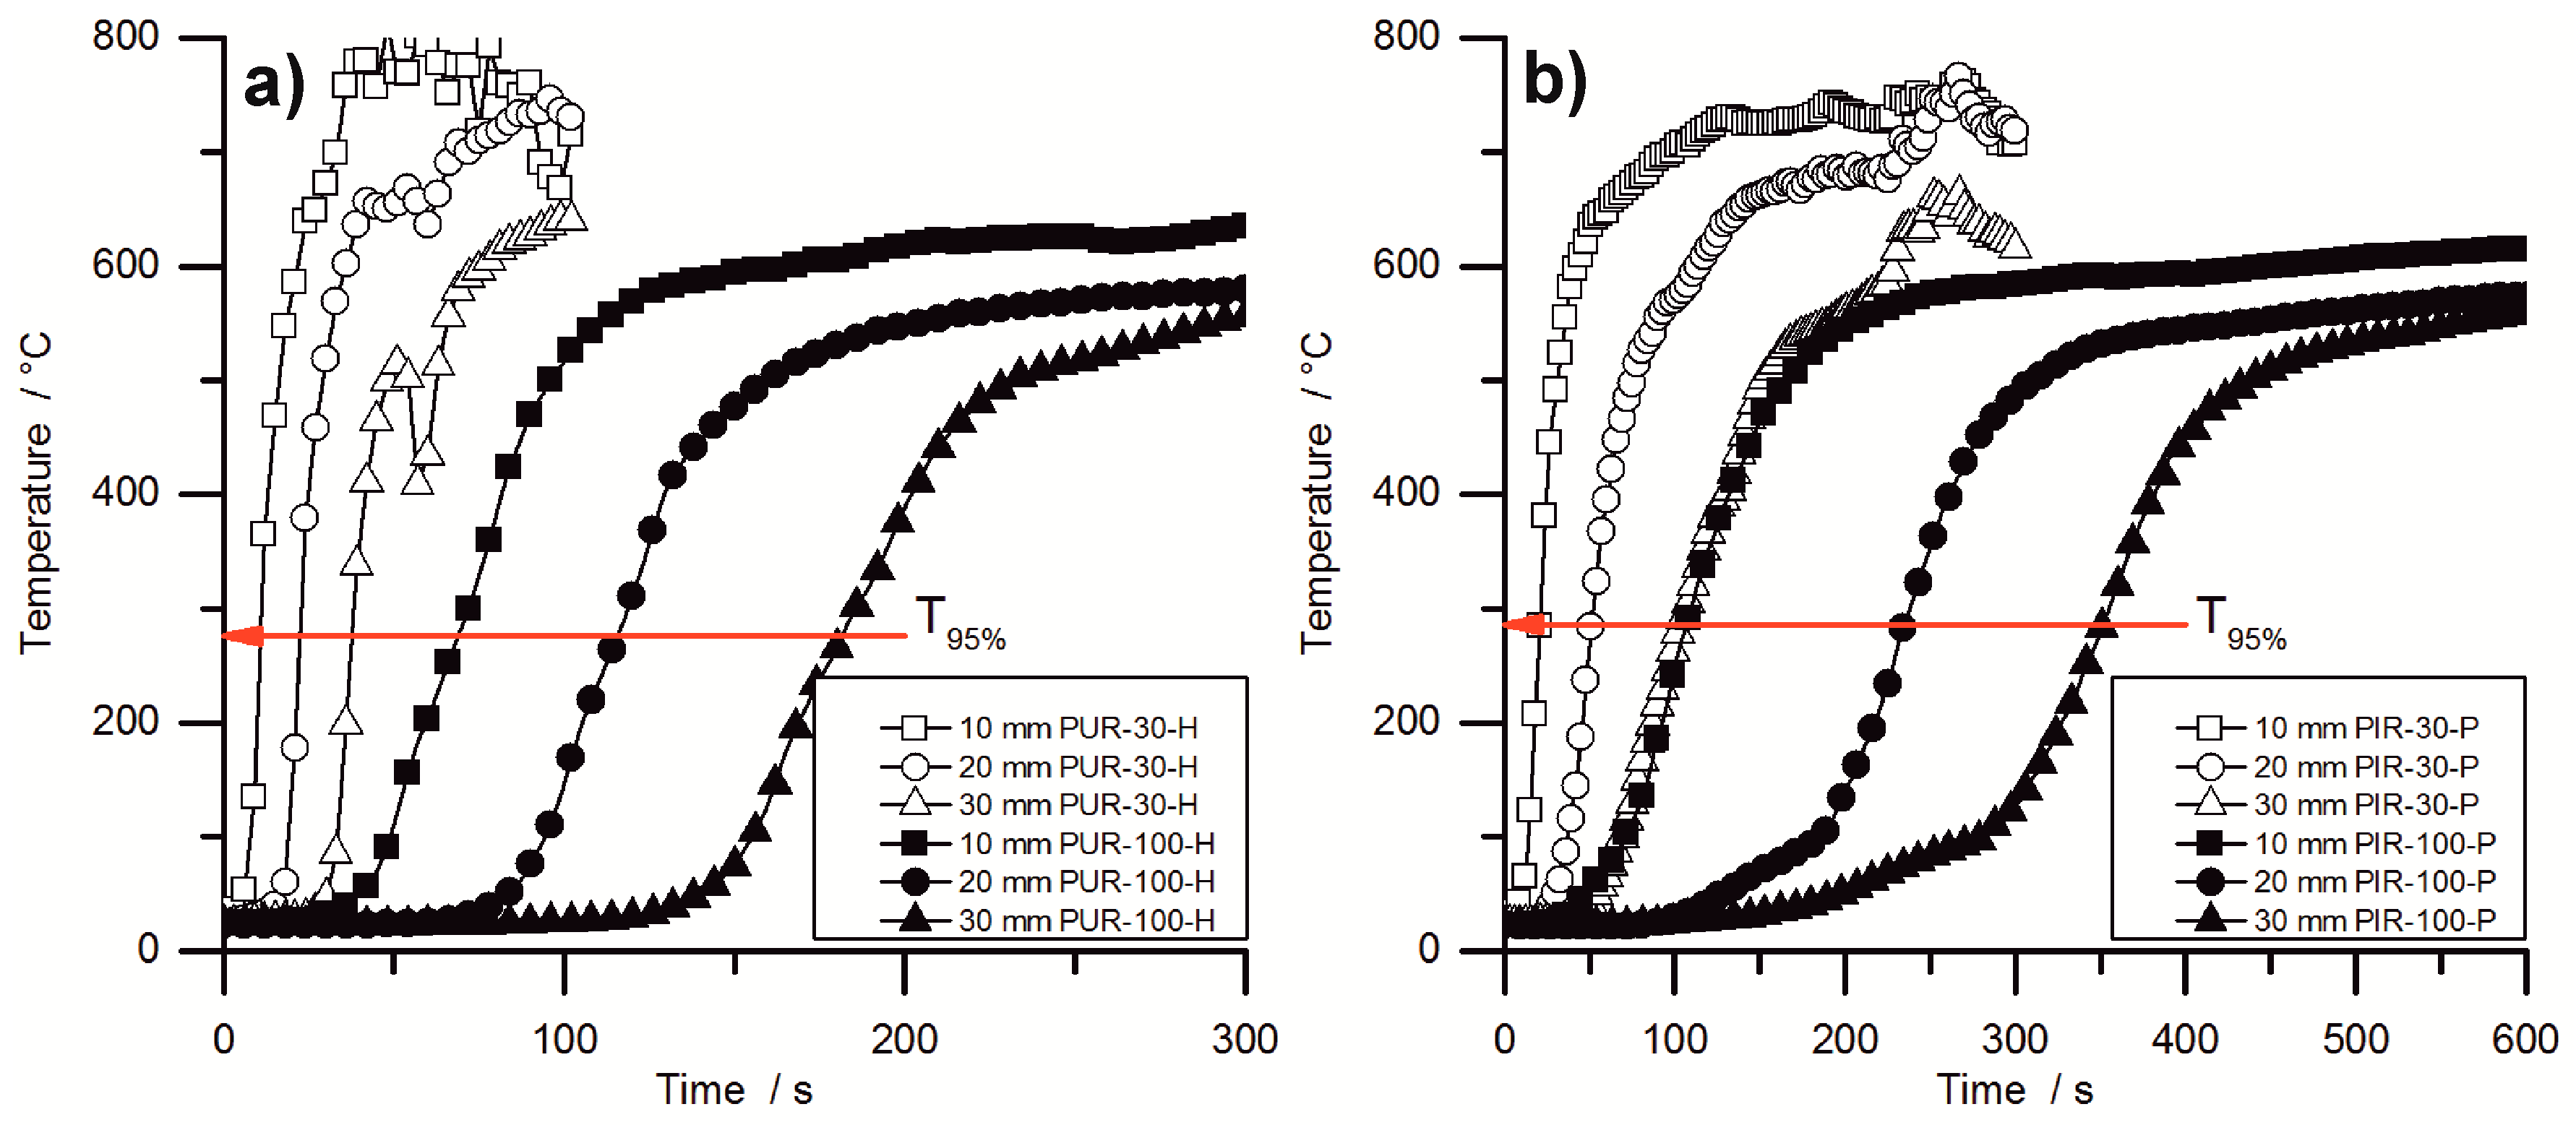
Figure 8 shows the temperature development inside burning specimens for PUR-H and PIR-P foams, for the lowest and highest densities, respectively. The slopes of the graphs are investigated by determining the maximum of the first derivation, which is defined here as the maximum heating rate (MHR). In the graphs, it is clear that the slope of the temperature curves is steeper with lower density.
Figure 8 makes clear that the onset of temperature rise at a depth of 10 mm is delayed crucially by increasing the density. Although
obtained from cone calorimeter test is hardly affected by the density, the velocity of the pyrolysis front is. This proves that the formation of the protective carbonaceous layer depends only on the amount of combustible material that is consumed by the fire. The increasing density of the foam leads to an earlier formation of char. The MHRs shown in
Table 7 were recorded within the first 100 s for PIR-30-P, while the pyrolysis front passed the last thermocouple only after more than 300 s for PIR-100-P. Thermocouple signals for PIR-100-P at depths of 20 mm and 30 mm showed an obvious rise in temperature from ambient temperature to approximately 100 °C, which was caused by conduction of heat during combustion through the foam. Following this, a slight kink in the signal occurred and subsequently a steeper increase of temperature took place, which can be attributed to the approach of the pyrolysis front. The drop of temperature as displayed for the 30 mm signal of PUR-30-H was caused by cracking of the residue.
Table 7 contains the maxima of heating rates (MHR) deduced from the temperature curves as well as the time at which the MHR occurred (
) for every depth of measurement (10, 20 and 30 mm). In general, within each group of materials the MHR exhibited a decrease with increasing density and with increasing depth of measurement. Most probably, this is an effect of the cone calorimeters’ decreasing heat flux at increasing distance from the thermocouple, but also a result of the chars’ growing thickness and therefore better protective layer. Lower MHR and longer
indicate a better protective layer with increasing depth of measurement, but not necessarily a lower velocity of the pyrolysis front since there is an overlapping effect of heat conduction through the sample. Therefore the MHR decreased at depths of 20 mm and 30 mm compared to 10 mm.
PUR-P and PUR-H foams exhibited the highest heating rates with respect to density. MHR for pentane-blown foams were slightly higher at 10 mm, which is probably an effect of the highly combustible blowing agent, although the overall fire performance determined with the cone calorimeter was not affected compared to water-blown RPUF. However, compared to PUR foams, a significant difference was observed for PIR-P. The MHR that was measured at a depth of 10 mm decreased from 89 °C/s for PUR-30-H by 52% to 43 °C/s for PIR-30. This phenomenon is a consequence of the better fire performance of PIR-P foams under forced flaming conditions, which has been discussed previously. PIR foams generally exhibited the lowest MHR and longest .
In general, the measured increase in temperature slowed down with rising density and increasing depth of measurement. Furthermore, the maximum heating rates decreased and the times to maximum heating rates increased. While this is probably an effect of heat conduction through the sample, and is not significant for determining the actual velocity of the pyrolysis front, it indicates crucial variation in the burning behaviour of the foam with increasing density. For low-density foams the temperature signal exhibited a steep increase as soon as the pyrolysis front approached the thermocouple. In contrast, for high-density foams a more moderate rise was observed, including a minor rise in the temperature inside the specimen prior to pyrolysis, caused by thermal conduction through the bulk of the foam. This implies a shift of the burning behaviour toward the behaviour of a solid, non-cellular material with increasing density.
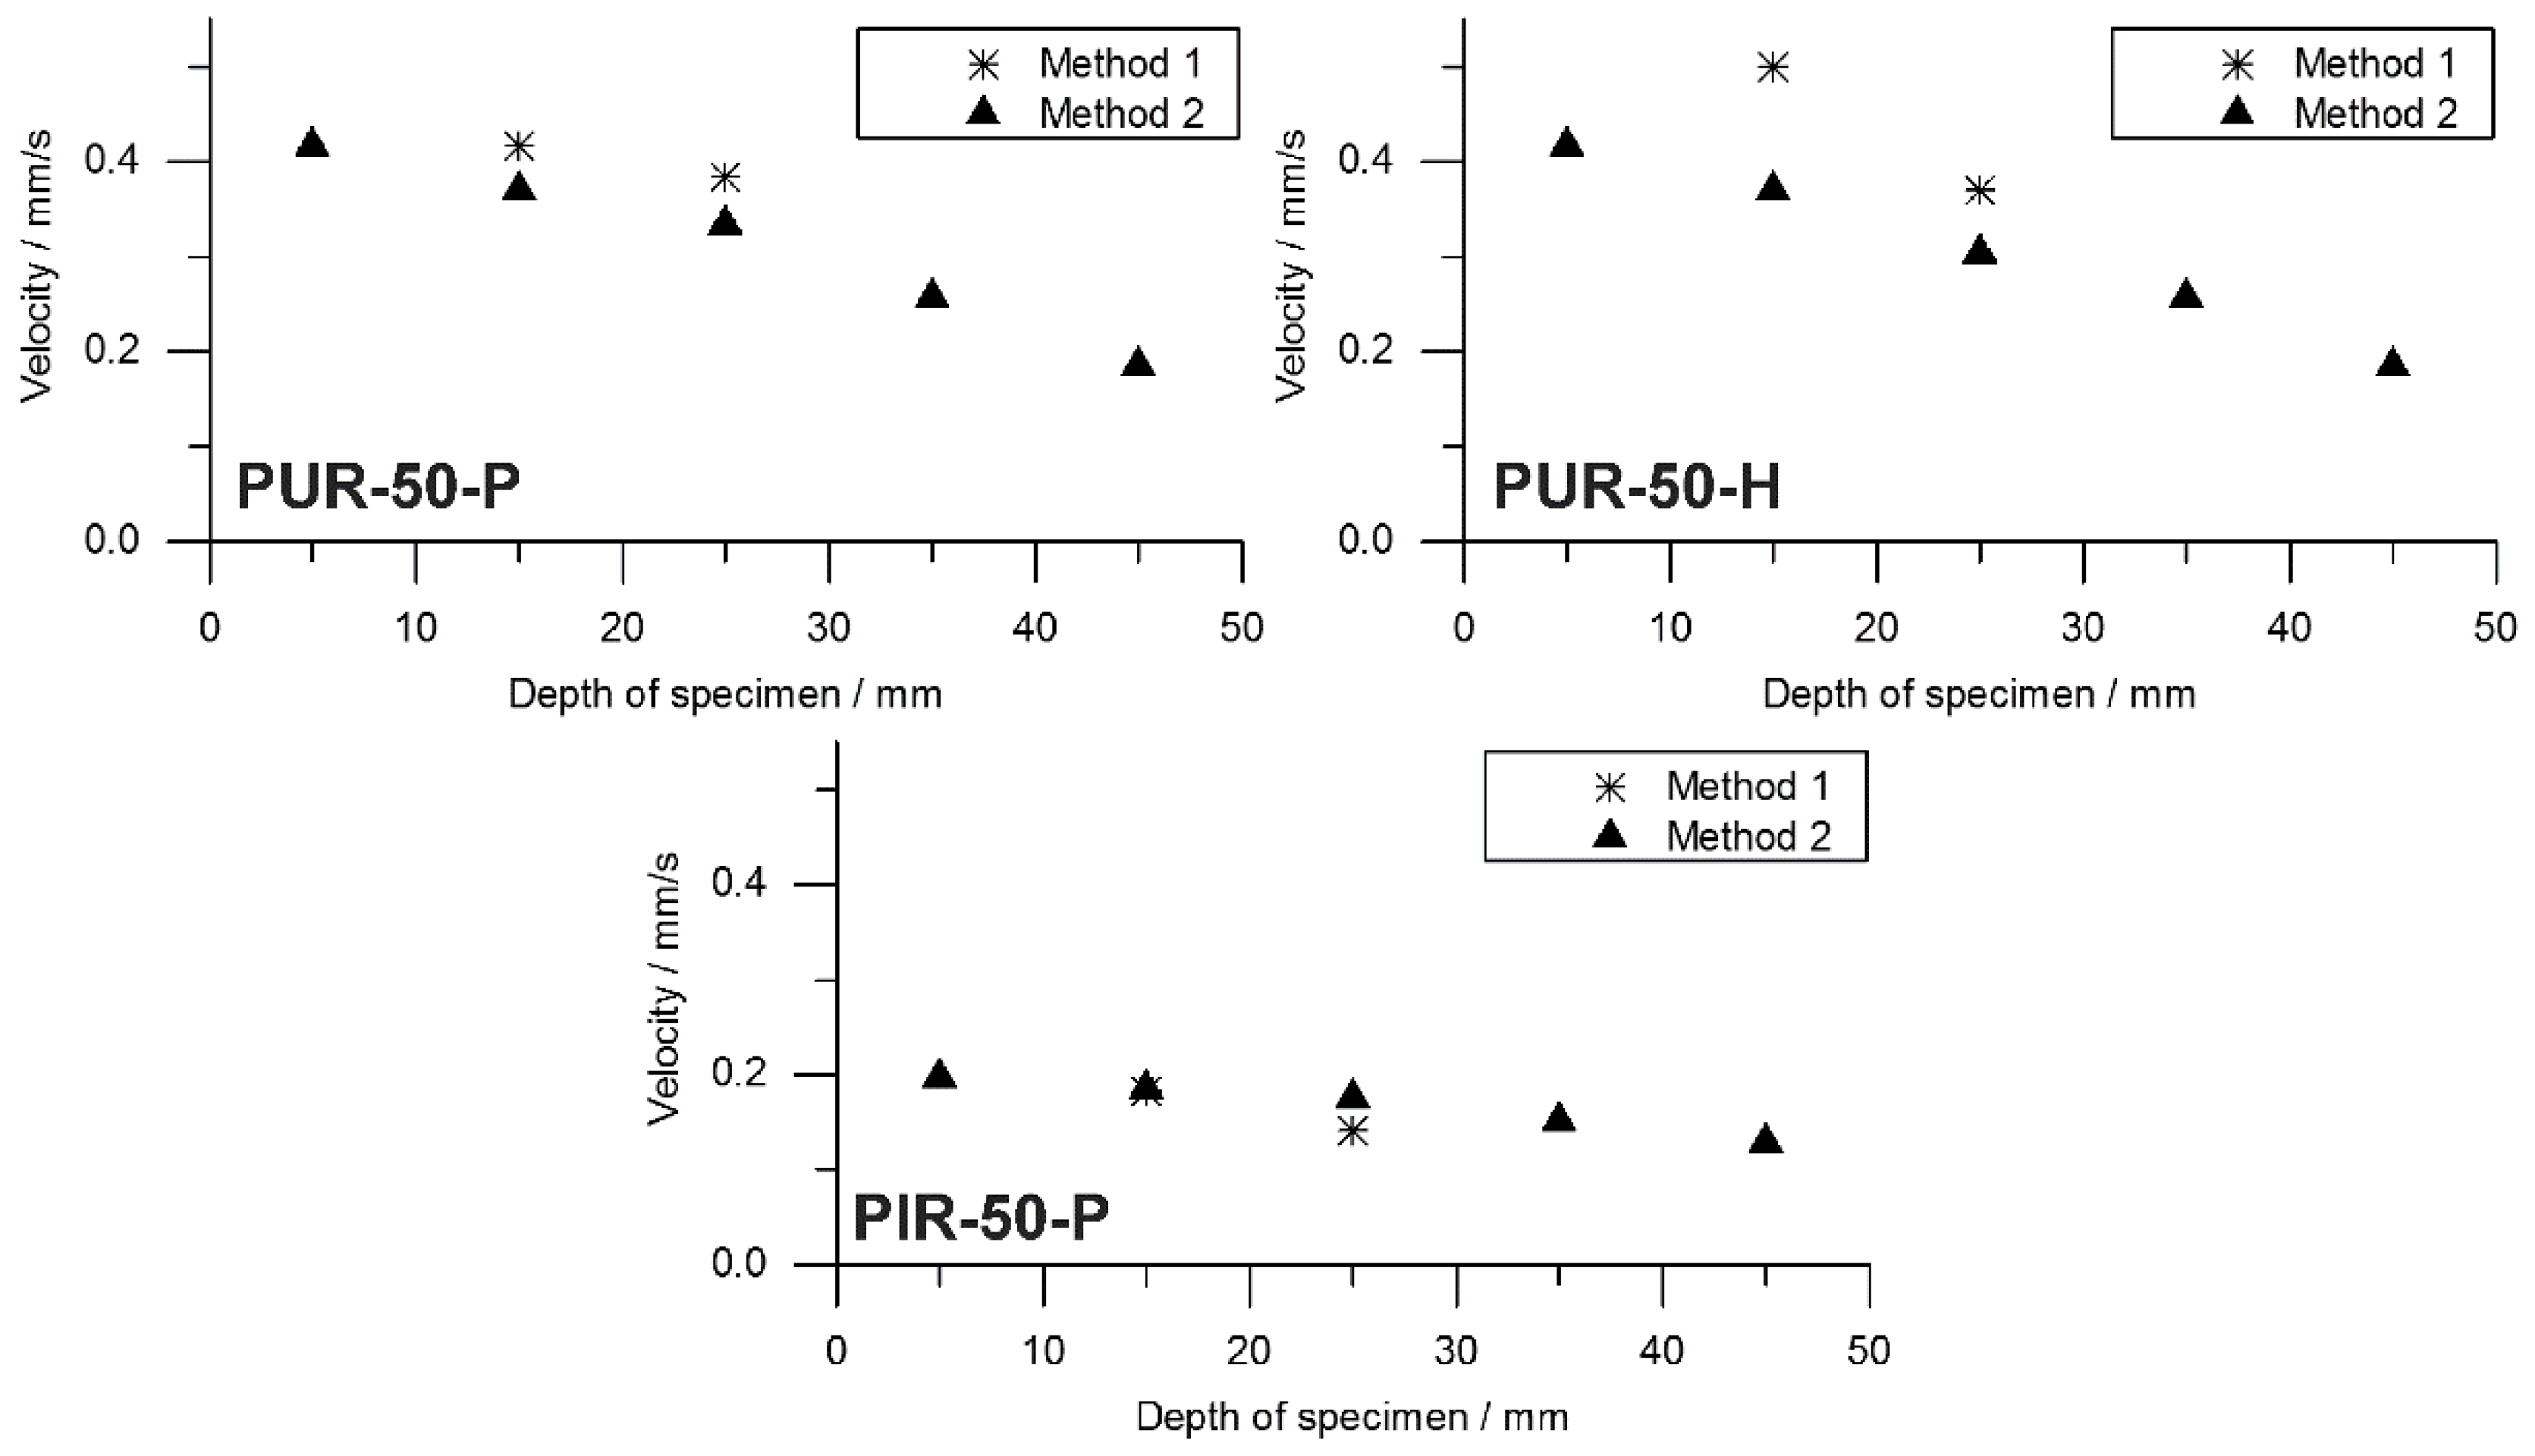
Information on the velocity of the pyrolysis front can be taken from the temperature development measured inside the burning specimens. The T
95% obtained from TG was consulted to define the time at which the pyrolysis front reached the depth of temperature measurement. A prolonged phase of steady burning in the cone calorimeter test while the specimens’ size is held constant is associated with a decreased velocity of the pyrolysis front. To investigate this phenomenon, the velocity was calculated by considering the times to T
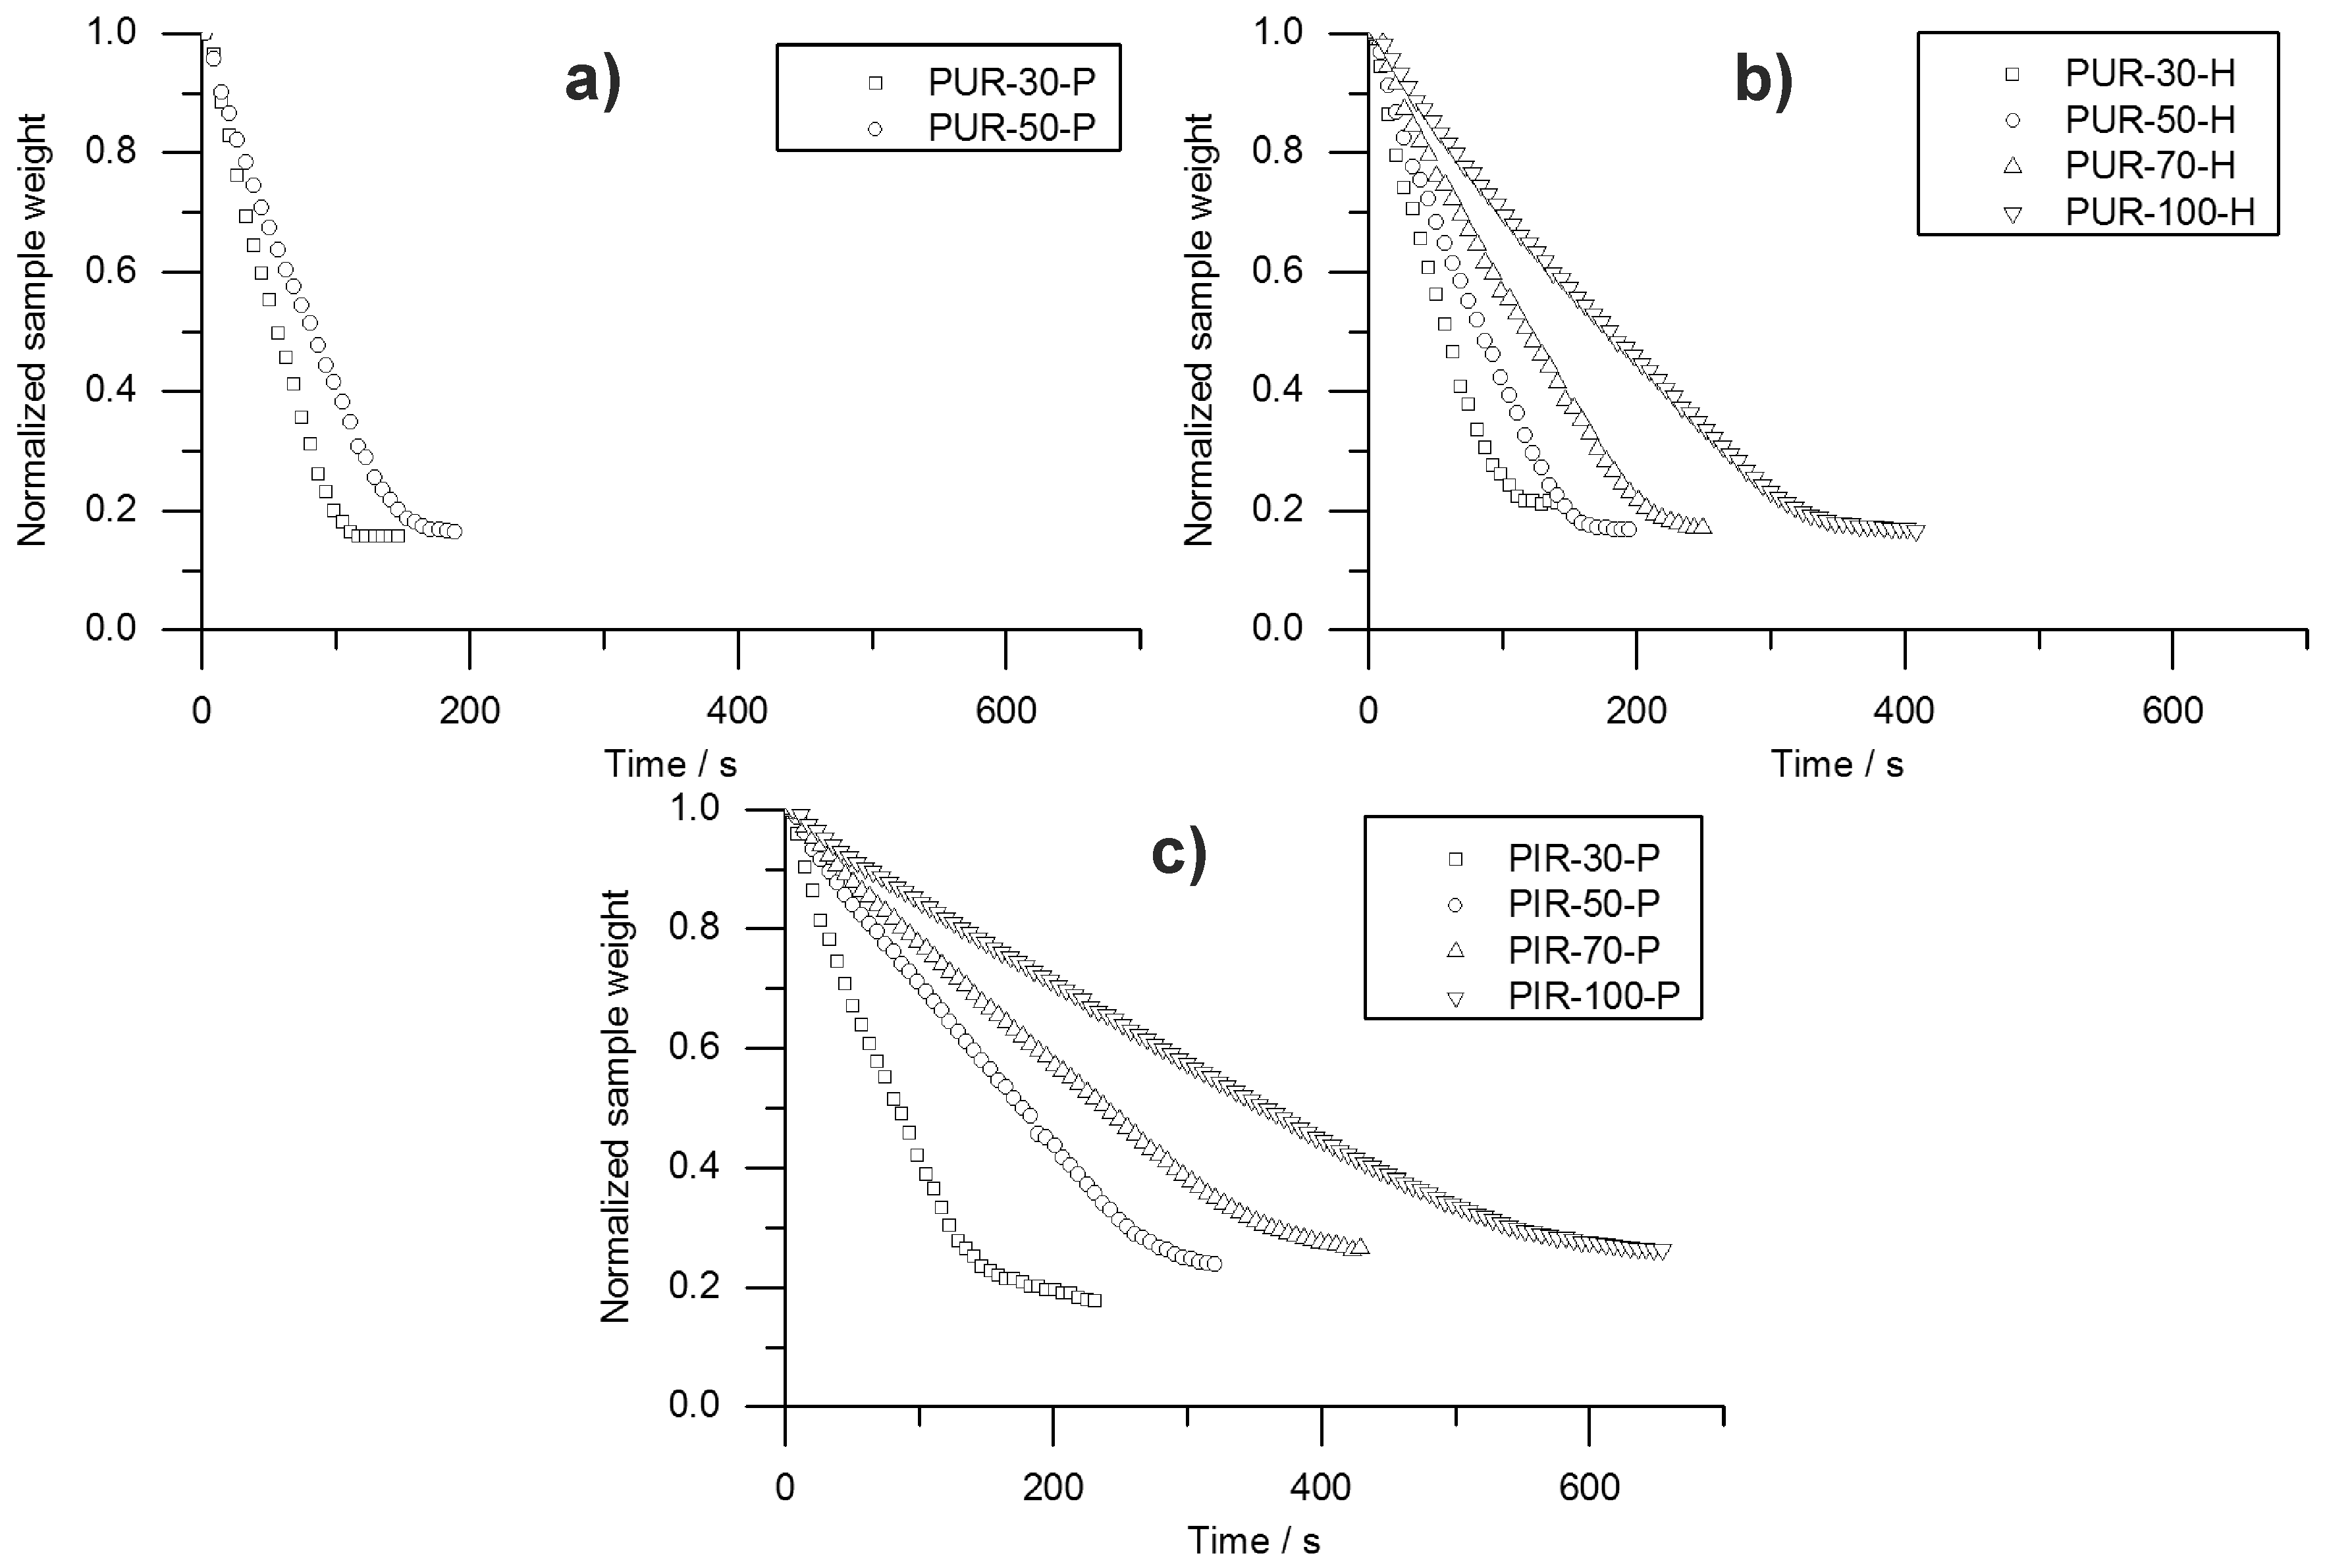
95%. Hence, velocity was determined from sample depths of 10 to 20 mm and from 20 to 30 mm. This was defined as Method 1. Interestingly, the mass loss obtained from the cone calorimeter test indicates linear behaviour throughout the test until flame out. The normalized sample weight plotted over time is shown for each tested material in
Figure 9. Measurement data start at
and were recorded until briefly after flame out. For each material, a kink in the mass loss curve was observed. This marks the transition from flaming combustion and pyrolytic decomposition to afterglow of the carbonaceous residue. The normalized sample weights were fitted starting from
to flame out and the resulting pyrolysis front velocity was calculated. Therefore, the assumption was made that the decrease of mass is proportional to the decrease of volume and that the amount of residue formed during combustion was consistent over time. This was defined as Method 2. Results from Method 1 and Method 2 were compared and plotted over depth of specimen. This comparison was done for each foam at a density of 50 kg/m
3 and is shown in
Figure 10.
Both Method 1 and Method 2 revealed decreasing pyrolysis front velocities for all foams. As already discussed above, this is probably an effect of the increasing thickness of the char layers and the decreasing intensity of radiation from the conical heater with greater distance [
34]. Additionally, the appearance of the PHRR directly following ignition at the very beginning of the cone calorimeter measurement gives evidence of the thickest pyrolysis zone or the fastest velocity of the front, respectively [
35]. While the cone calorimeter mass loss data indicates a constant velocity of the pyrolysis front (
Figure 9), thermocouple measurements actually prove that the velocity decreases slightly with increasing depth of measurement. The reason for the mass loss data remaining constant may be additional smouldering of the residue already during flaming combustion as experienced in a previous study of PIR and phenolic foams [
52]. Nevertheless, the two signals show good correlation of Method 1 and Method 2 for PUR-50-P and PUR-50-H, both of which burned down more erratically than PIR foams. In fact, there was an even stronger correlation between the results of PIR-50-P since the burning behaviour was smoother.
The average velocities of the pyrolysis fronts of foams with a density of 50 kg/m
3 are listed in
Table 8. The results were averaged from depths of 10 to 30 mm for both methods in order to cover the same area of measurement. Method 2 gives a decrease of velocity of 13% for PUR-50-P and 23% for PUR-50-H, respectively. In contrast, the velocity of PIR-50-P increased by 13% with respect to Method 1. The reasons for this are probably the limitations of both methods. Results of Method 1 suffered from an unevenly burning sample whose decomposing surface layer is not a perfect plane. This causes the pyrolysis front to reach the thermocouples at various times. Pyrolysis front velocity as derived from mass loss in the cone calorimeter test is subject to system-related scatter effects since the samples weight is very low. Comparing the velocity of the investigated foams with the one of a bulk polymer elucidates how quick the cellular materials are consumed by the fire due to their low density. For PMMA, as a non-charring polymer exhibiting a thermally thick burning behaviour, an average velocity of the pyrolysis front of 0.025 mm/s (1.51 mm/min) was measured [
53]. For an epoxy resin (hardly charring) and its layered silicate nanocomposite, which formed a protection layer, values of 0.012–0.023 mm/s (0.7–1.4 mm/min) and 0.008–0.012 (0.5–0.7 mm/min) were measured, respectively [
54]. Pyrolysis front velocities of the investigated foams exceeded those of bulk polymers by more than 10-fold.


