Article

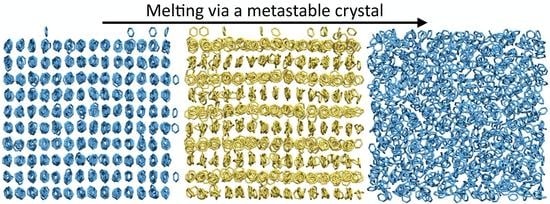
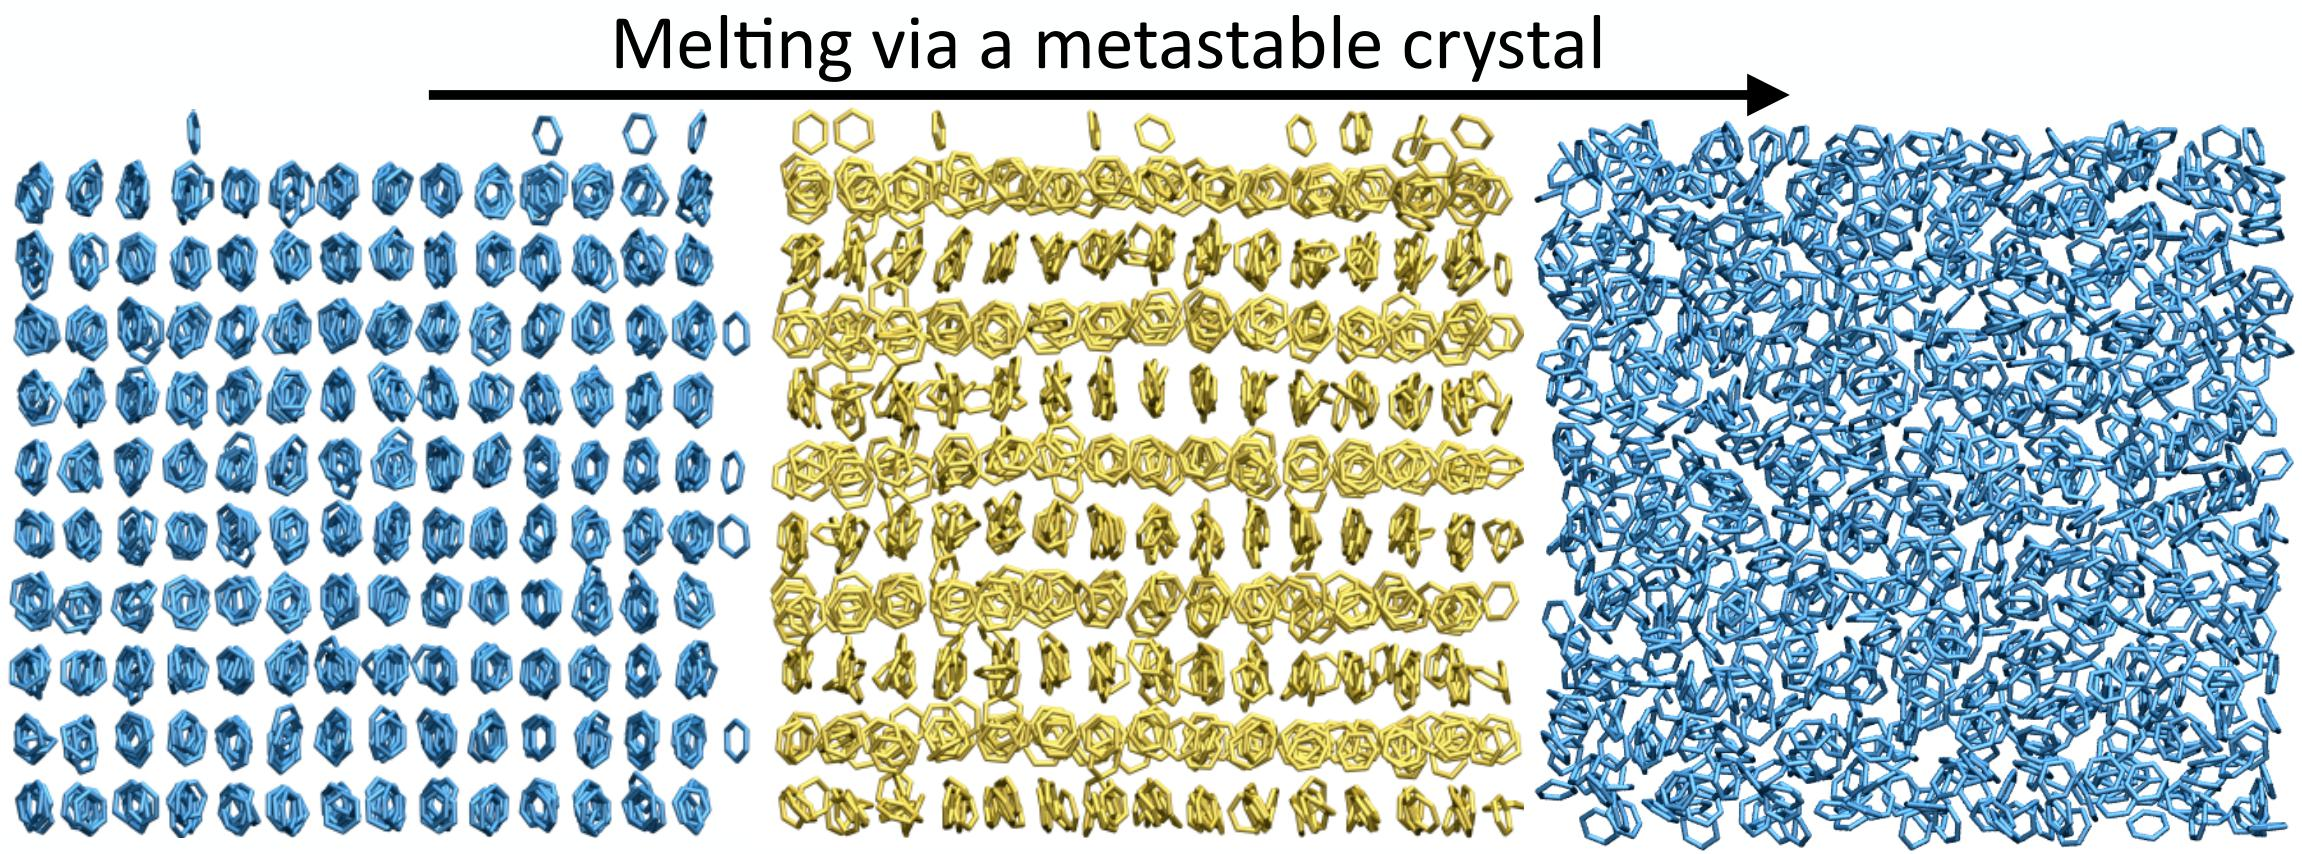
Stepwise Homogeneous Melting of Benzene Phase I at High Pressure

1
Department of Chemistry and Materials, Faculty of Textile Science and Technology, Ueda 386-8567, Japan
2
Institute for Fiber Engineering, Shinshu University, Ueda 386-8567, Japan
*
Author to whom correspondence should be addressed.
Crystals 2019, 9(6), 279; https://doi.org/10.3390/cryst9060279
Submission received: 26 April 2019 / Revised: 24 May 2019 / Accepted: 27 May 2019 / Published: 28 May 2019
(This article belongs to the Special Issue Pressure-Induced Phase Transformations)

Abstract

:
We investigate, using molecular dynamics simulations, the spontaneous homogeneous melting of benzene phase I under a high pressure of 1.0 GPa. We find an apparent stepwise transition via a metastable crystal phase, unlike the direct melting observed at ambient pressure. The transition to the metastable phase is achieved by rotational motions, without the diffusion of the center of mass of benzene. The metastable crystal completely occupies the whole space and maintains its structure for at least several picoseconds, so that the phase seems to have a local free energy minimum. The unit cell is found to be unique—no such crystalline structure has been reported so far. Furthermore, we discuss the influence of pressure control on the melting behavior.

Graphical Abstract

1. Introduction

Benzene is a renowned small and simple molecule. Regardless, its polymorphism [1,2,3] and local liquid structure [4,5,6] have been extensively explored until now. Five crystalline phases of pure benzene have been reported so far experimentally [7,8,9,10,11,12,13,14], and computational studies predicted many other potential crystalline structures [1,15,16,17,18]. Although the phase diagram shows the most stable phase at a given condition, there can be rich intermediate phases on the transition pathway from the initial to the finally prevailed phase [19,20,21,22,23]. Ostwald argued that a phase transition can proceed via an intermediate metastable phase due to the reduction in the surface energy of nucleation (Ostwald’s step rule) [24] in contrast to the direct nucleation described in the classical nucleation theory [25]. Indeed, a metastable phase or structure has been shown to play a key role in the melting of colloids [26], copper and aluminum [27], and ice [28]. Further, under high pressures, the melting pathway can be much more complicated, because of the competition between potential energy, entropy, and packing effect (negligible at ambient pressure).
The existence of intermediate metastable phase in the melting of benzene phase I is still controversial, although the phase transition dynamics of benzene has been investigated [29,30,31]. Tohji et al. claimed the existence of a premelting stage at 10 K below melting point using powder X-ray diffraction [30]. Furthermore, they predicted that a plastic crystal transiently appears in the melting. This premelting stage was later disproven by the investigation over the complete temperature range of 4 to 280 K [31]. Very recently, we performed the molecular dynamics (MD) simulations for the homogeneous melting of benzene phase I crystal near the limit of superheating and statistically demonstrated that there is no intermediate transient state between the crystal and liquid phases [32]. While these studies have been conducted under ambient pressure, the melting dynamics under high pressure have not been explored.
In this study, we perform MD simulations of the homogeneous melting of benzene phase I at a high pressure of 1.0 GPa and observe the stepwise transition via a metastable crystal phase. We show that the formation of the metastable phase is achieved by rotational motions, and the unit cell structure differs from any other crystalline phases reported so far.

2. Methods

2.1. Force Field

Benzene was modelled with full atomistic detail using CHARM22 [33,34]. This force field reproduces the crystal structure of benzene phase I [29,35] and the physical properties of liquid benzene, such as density and self-diffusion coefficient [36]. The intermolecular nonbonded interactions were described by Lennard–Jones plus Coulomb potential. The intermolecular interactions were truncated at 1.20 nm. The Lennard–Jones parameters for cross-interactions were obtained using Lorentz–Berthelot mixing rules and the long-range Coulombic interactions were evaluated using particle-mesh Ewald algorithm [37].

2.2. MD Simulations

MD simulations were performed using GROMACS 2019 package [38], in which the equations of motion are integrated using leapfrog algorithm with a time step of 2 fs. The temperature T for equilibration was controlled using a Berendsen thermostat [39] with a damping constant of 1.0 ps, while a Nose-Hoover thermostat [40,41] was used for the production runs. The pressure p was isotropically controlled by a Berendsen barostat [39] for both equilibration and production runs, with a damping constant of 2.0 ps. The pressure was set to 1.0 GPa for all the simulations. The periodic boundary condition was applied in all three directions.
To evaluate the influence of pressure control on the melting behavior, we performed some additional simulations using anisotropic pressure control, where the box dimensions and the box angles can change.

2.3. Crystals

The structure of benzene phase I was obtained from Cambridge Structural Database (refcode: BENZEN) [42]. Phase I is the most stable crystalline phase up to 1.2 GPa [9,14]. The unit cell consists of four benzene molecules with space group Pbca. The lattice parameters are a = 0.7460 nm, b = 0.9666 nm, and c = 0.7034 nm at 270 K [11]. Lattice axes a, b, and c corresponded to x, y, and z axes, respectively, in this study.
For the spontaneous homogeneous melting, we replicated the unit cell to manufacture an approximately cubic system with a box size of 5.21 nm × 4.78 nm × 4.84 nm. The number of molecules, N, was 980. To equilibrate the crystal structure, energy minimization was first carried out using the steepest descent algorithm. Subsequently, an isochoric isothermal (NVT) MD simulation was performed at 270 K for 500 ps. Thereafter, an isobaric isothermal (NpT) MD simulation for 5 ns at 270 K and 0.1 MPa was performed, followed by a 5 ns NpT MD simulation at 270 K and 1.0 GPa. Furthermore, an NpT MD simulation at 500 K and 1.0 GPa was performed for 5 ns. The final configuration obtained was used as the initial structure for the following heating simulations.
To determine the equilibrium melting temperature we used the two-phase method [43,44,45,46]. First, we developed two identical boxes of benzene phase I crystal containing 448 molecules with a box size of 2.68 nm × 6.45 nm × 2.86 nm. We randomly erased 48 molecules from one of these crystal structures, and we melted it by performing a short NVT MD simulation at 800 K. Then, we joined these crystal and liquid boxes. The box dimension was 2.68 nm × 13.5 nm × 2.86 nm. To equilibrate the solid-liquid coexistence structure, energy minimization was first carried out using the steepest descent algorithm. Subsequently, an NVT MD simulation was performed at 200 K for 20 ps. Thereafter, the system was gradually heated up by performing each 20 ps NpT MD simulations at two temperatures of 200 and 400 K and at 1.0 GPa, and the equilibrated configuration was used for the production runs at 1.0 GPa. The configuration equilibrated at 200 K and 1.0 GPa was gradually decompressed from 1.0 to 0.0 GPa in increments of 0.2 GPa at 200 K by performing each 20 ps NpT MD simulations. The systems were further equilibrated at 400 K for 0.8 GPa, at 300 K for 0.6 and 0.4 GPa, and at 200 K for 0.2 and 0.0 GPa by performing each 20 ps NpT MD simulation, then the obtained configurations were used for the production runs at each pressure.

3. Results and Discussion

We initially evaluated the equilibrium melting temperature Tm of benzene phase I at 1.0 GPa in our model using the two-phase method [43,44,45,46]. The initial configuration for production runs was the coexistence between liquid and phase I crystal, as shown in Figure 1A. We performed each 10 ns NpT MD simulation at 430K, 435K, and 440 K and at 1.0 GPa. Figure 1B depicts the time evolution of the volume for these runs. At Tm, the phase I crystal and liquid exhibit the same stability in free energy, and the total volume does not change. On the other hand, the volume increases at T > Tm due to melting, while it decreases at T < Tm. The results show that Tm is 435 ± 5 K at 1.0 GPa for our computational model, which is approximately 20 K lower than the experimental estimation of 457 K [9]. We also computed Tm at 0.0, 0.2, 0.4, 0.6, 0.8, 1.0, and 1.2 GPa in the same manner. Figure 1C shows that the melting curve for our computational model qualitatively reproduces the experimental result [9,47].
Benzene phase I, equilibrated at 500 K, was heated up in the increments of 10 K at 1.0 GPa, and an NpT MD simulation was performed for 10 ns at each T. We first observed the melting of crystal at 590 K. This result indicates that the limit of superheating achieved by our heating rate (1 K/ns) is 590 K, which is considerably higher than the equilibrium melting temperature of 435 K for our computational model. The large superheating for homogeneous melting has also been reported for other materials both experimentally [26,48,49] and computationally [28,50,51,52,53,54,55], because of the absence of an apparent trigger, such as surfaces and impurities, to initiate the disordering. To observe the melting under moderate conditions, we focused on the melting at 584 K, heated up from 580 K. At 584 K, 6 of 95 independent trajectories melted within 10 ns when we gave different momenta to the same configuration.
Figure 2A,B present the time evolution of potential energy (PE) and density for a typical melting trajectory at 584 K. We find a plateau between 490 and 510 ps (shown by green shade), where both the PE and density remain constant. The preservation of these properties over a time range implies the existence of a metastable phase. Figure 3A–C depicts the molecular structures at each stage of 100, 490, and 575 ps, respectively. In contrast to the disordered liquid structure in Figure 3C, layered structures along the y axis are depicted in Figure 3A,B. However, their molecular orientations are clearly different. The same structure as that in Figure 3B was also observed in all the other melting trajectories at 584 K, although the structure sometimes did not fill the whole space of the simulation box and its lifetime was in the order of several 10 picoseconds.
Although the metastable structure exists for a very short time in the melting pathway at 584 K, the same structure might be (meta) stable at different pT conditions. To explore such a pT region, we performed NpT MD simulations for each 10 ns at pressures ranging from 0.8 to 1.2 GPa and at temperatures ranging from 450 to 550 K. At a given pT condition, we gave 10 different momenta to the structure obtained at 490 ps in the melting trajectory (Figure 3B). The metastable structure was found to be preserved for 10 ns in the all trajectories at several thermodynamic conditions: 450 K and 0.8, 0.9, 1.0, 1.1, and 1.2 GPa; 500 K and 0.9, 1.0, 1.1, and 1.2 GPa; 550 K and 1.1 and 1.2 GPa. At the other conditions, the metastable structure melted into liquid. These stable and unstable T-p conditions for the metastable structure are plotted in Figure 1C. These results imply that the metastable structure can be a “phase” rather than a transiently appearing fragile structure. Its free energy is likely to be between phase I and liquid benzene, in accordance with Ostwald’s step rule [23].
In contrast to the short lifetime of the metastable phase, the waiting times for the phase transition from phase I to the metastable phase range from hundreds of picoseconds to several nanoseconds at 584 K. The significant difference in their lifetimes indicates that the free energy barrier from the metastable phase to liquid is much lower than that from phase I to the metastable phase at 584 K.
To characterize the self-diffusion over melting, we computed the mean square displacement (MSD) of center of mass (COM) of benzene from the initial configuration at 584 K (t = 0 ps), using the expression of | r ( t ) r ( 0 ) | 2 (Figure 2C). The time-dependent MSD shows a small hump at around 490 ps, arising from the re-organization of molecules to form the metastable phase. The difference in the MSD of COM is negligibly small (0.04 nm2). The MSD does not change between 490 and 510 ps, where the PE and density are also preserved. After 510 ps, the MSD gradually increases, during which a liquid nucleus forms and erodes the metastable phase. Finally, the MSD increases rapidly after 530 ps, at which point the liquid structure covers approximately half the space of the simulation box. Figure 4 shows the radial distribution functions (RDFs) between COMs of benzene molecules in the three phases. The results show that the metastable phase maintains a long-range order structure in comparison with the liquid phase. Although the metastable phase exhibits broader peaks than phase I, the peaks in the two phases are located at a similar radial distance. This indicates that there is only a minor change in the position of COM between phase I and the metastable phases. Hence, the analyses of MSD and RDF demonstrate that the transition from phase I to the metastable phase arises from the rotational motion, and COM in the metastable phase exhibits an ordered structure.
We next characterize the molecular orientation in the metastable phase. Figure 3B demonstrates that benzene molecules in every other layer of the metastable phase (we name them M1 and M2 layers) tend to have the same alignment. We project the probability density of the normal vector on a sphere using HEALPix algorithm [56,57,58], in which the order parameter (θ, φ) is used to define the vector orientation (Figure 5A). In phase I, benzene molecules are most likely to orient at (90°, 40°) and (90°, 140°), as shown in Figure 5B. It is to be noted that the molecular orientations of (90°, 40°) and (90°, 140°) are identical to (90°, −140°) and (90°, −40°), respectively. The molecular orientation in phase I is slightly different from that obtained experimentally [11] (see the green circles in Figure 5B); the difference probably arises from the limitations of the force field or the effect of high pressure. In the metastable phase, there are distinct orientations in both M1 and M2 layers (Figure 5C,D). More specifically, the molecules in the M1 layer are most likely to orient at (90°, 0°) and (90°, 180°) (or (90°, −180°)), while those in the M2 layer are most likely to orient at (90°, 90°) and (90°, −90°). These preferential orientations are obviously different from those for phase I. These results indicate that all molecules change the orientations in the transition from phase I to the metastable phase. In the previous study, we have shown that at ambient pressure the flipping motion played an important role in the formation of the critical nucleus [32]. Hence, the rotational motion triggers the melting transition of phase I at both the pressures. Further, it is primarily the high pressure that induces the formation of the metastable phase in the melting dynamics, because there is no intermediate metastable phase at ambient pressure.
Furthermore, we find that the probability densities in the metastable phase are more broadly distributed than phase I. The loose orientation results in the increase of conformational entropy, which may compensate for the increase in PE (Figure 2A) and stabilize the metastable phase in term of free energy. Thus, based on the preferential orientation in each layer and the negligible diffusivity of COM, we conclude that the metastable phase is a crystal.
Using the same method, we evaluated the probability density for the two-fold axis of the benzene molecule, which is in parallel to the molecular plane and determined its most probable orientation. The average box size was calculated between 490 and 510 ps. Based on the repeating structural pattern, we determined that the unit cell is tetragonal and contains two molecules with a dimension of 0.51 nm × 0.51 nm × 0.96 nm (Figure 6). The space group is P42nm. Interestingly, as far as we know, the obtained unit cell structure is different from any other crystalline structures of benzene reported so far [1,7,8,9,10,11,12,13,14,15,16,17,18]
It is worth investigating the influence of pressure control on the melting behavior. In the above simulations, we used the isotropic pressure control, where the dimension of box was isotropically changed. For comparison, we performed some NpT MD simulations using anisotropic pressure control, which allows the deformation of the simulation box. First, we performed 10 independent NpT MD simulations at 500 K for each 10 ns under the anisotropic pressure control, initiated from the metastable structure obtained under the isotropic pressure control. In all the trajectories, the metastable structure transformed into a different crystal form—phase III with line defect [16]. The formed phase III structure was preserved for 10 ns. Note that on the pT phase diagram, the phase III locates at very high pressures over 4 GPa and does not have the phase boundary with phase I [9,14]. Our results imply that the phase III can be a metastable phase between phase I and liquid. Second, we heated up the phase I crystal under the anisotropic pressure control until it melted at 580K. However, we did not observe a stepwise homogeneous melting via phase III at the limit of superheating. The phase III may appear on the melting pathway at lower temperatures. These comparisons indicate that the metastable structure that we found in this study is likely to appear under the isotropic pressure control, which can be realized by the recently developed experimental techniques [59,60,61].

4. Summary

We carried out the MD simulations to investigate the homogeneous melting of benzene phase I under a high pressure of 1.0 GPa. We found a stepwise change in the PE, density, and MSD in the melting trajectories. The metastable phase preserves the layered structure as phase I but the molecular orientations are obviously different from those of phase I. The formation of the metastable phase is attributable to the flipping motion of benzene rather than the diffusion of COM. Although the flipping motion has been previously shown to lead the formation of the critical nucleus, no intermediate metastable phase was observed at ambient pressure. Furthermore, the probability density of the normal vector demonstrates the preferential orientation in the metastable phase. Their orientations are more relaxed than those in phase I, indicating the gain of conformational entropy compensates the increase of potential energy. We further determined the unit cell and found that such a crystalline structure has not been reported so far.

Author Contributions

Conceptualization, K.M.; molecular simulations, R.M.; writing, K.M. and R.M.; funding acquisition, K.M.

Funding

We acknowledge the support from the Japan Society for the Promotion of Science (KAKENHI 18K19060) and Inoue Foundation for Science (Inoue Science Research Award).

Acknowledgments

We thank M. Matsumoto for determining the unit cell. A part of calculations was performed at the Research Center for Computational Science in Okazaki, Japan.

Conflicts of Interest

The authors declare no conflict of interests.

References

  1. Raiteri, P.; Martoňák, R.; Parrinello, M. Exploring Polymorphism: The Case of Benzene. Angew. Chem. Int. Ed. 2005, 44, 3769–3773. [Google Scholar] [CrossRef] [PubMed]
  2. Chanyshev, A.D.; Litasov, K.D.; Rashchenko, S.V.; Sano-Furukawa, A.; Kagi, H.; Hattori, T.; Shatskiy, A.F.; Dymshits, A.M.; Sharygin, I.S.; Higo, Y. High-Pressure–High-Temperature Study of Benzene: Refined Crystal Structure and New Phase Diagram up to 8 GPa and 923 K. Cryst. Growth Des. 2018, 18, 3016–3026. [Google Scholar] [CrossRef]
  3. Wen, X.-D.; Hoffmann, R.; Ashcroft, N.W. Benzene under High Pressure: a Story of Molecular Crystals Transforming to Saturated Networks, with a Possible Intermediate Metallic Phase. J. Am. Chem. Soc. 2011, 133, 9023–9035. [Google Scholar] [CrossRef]
  4. Headen, T.F.; Howard, C.A.; Skipper, N.T.; Wilkinson, M.A.; Bowron, D.T.; Soper, A.K. Structure of pi-pi interactions in aromatic liquids. J. Am. Chem. Soc. 2010, 132, 5735–5742. [Google Scholar] [CrossRef] [PubMed]
  5. Yoshida, K.; Fukuyama, N.; Yamaguchi, T.; Hosokawa, S.; Uchiyama, H.; Tsutsui, S.; Baron, A.Q.R. Inelastic X-ray scattering on liquid benzene analyzed using a generalized Langevin equation. Chem. Phys. Lett. 2017, 680, 1–5. [Google Scholar] [CrossRef]
  6. Nagasaka, M.; Yuzawa, H.; Mochizuki, K.; Rühl, E.; Kosugi, N. Temperature-Dependent Structural Changes in Liquid Benzene. J. Phys. Chem. Lett. 2018, 9, 5827–5832. [Google Scholar] [CrossRef]
  7. Pravica, M.; Grubor-Urosevic, O.; Hu, M.; Chow, P.; Yulga, B.; Liermann, P. X-ray Raman Spectroscopic Study of Benzene at High Pressure. J. Phys. Chem. B 2007, 111, 11635–11637. [Google Scholar] [CrossRef]
  8. Piermarini, G.J.; Mighell, A.D.; Weir, C.E.; Block, S. Crystal Structure of Benzene II at 25 Kilobars. Science 1969, 165, 1250–1255. [Google Scholar] [CrossRef]
  9. Akella, J.; Kennedy, G.C. Phase Diagram of Benzene to 35 kbar. J. Chem. Phys. 1971, 55, 793–796. [Google Scholar] [CrossRef]
  10. Block, S.; Weir, C.E.; Piermarini, G.J. Polymorphism in benzene, naphthalene, and anthracene at high pressure. Science 1970, 169, 586–587. [Google Scholar] [CrossRef] [PubMed]
  11. Cox, E.G.; Smith, J.A.S. Crystal Structure of Benzene at −3 °C. Nature 1954, 173, 75. [Google Scholar] [CrossRef]
  12. Cansell, F.; Fabre, D.; Petitet, J. Phase transitions and chemical transformations of benzene up to 550 °C and 30 GPa. J. Chem. Phys. 1993, 99, 7300–7304. [Google Scholar] [CrossRef]
  13. Ciabini, L.; Santoro, M.; Bini, R.; Schettino, V. High pressure crystal phases of benzene probed by infrared spectroscopy. J. Chem. Phys. 2001, 115, 3742–3749. [Google Scholar] [CrossRef]
  14. Thiéry, M.M.; Léger, J.M. High pressure solid phases of benzene. I. Raman and x-ray studies of C6H6 at 294 K up to 25 GPa. J. Chem. Phys. 1988, 89, 4255–4271. [Google Scholar] [CrossRef]
  15. Schneider, E.; Vogt, L.; Tuckerman, M.E. Exploring polymorphism of benzene and naphthalene with free energy based enhanced molecular dynamics. Acta Crystallogr. B Struct. Sci. Cryst. Eng. Mater. 2016, 72, 542–550. [Google Scholar] [CrossRef]
  16. Yu, T.-Q.; Tuckerman, M.E. Temperature-accelerated method for exploring polymorphism in molecular crystals based on free energy. Phys. Rev. Lett. 2011, 107, 015701. [Google Scholar] [CrossRef] [PubMed]
  17. Van Eijck, B.P.; Spek, A.L.; Mooij, W.T.M.; Kroon, J. Hypothetical Crystal Structures of Benzene at 0 and 30 kbar. Acta Crystallogr. B 1998, 54, 291–299. [Google Scholar] [CrossRef]
  18. Shoda, T.; Yamahara, K.; Okazaki, K.; Williams, D.E. Molecular packing analysis: prediction of experimental crystal structures of benzene starting from unreasonable initial structures. J. Mol. Struct. THEOCHEM 1994, 313, 321–334. [Google Scholar] [CrossRef]
  19. Yagasaki, T.; Matsumoto, M.; Tanaka, H. Phase Diagrams of TIP4P/2005, SPC/E, and TIP5P Water at High Pressure. J. Phys. Chem. B 2018, 122, 7718–7725. [Google Scholar] [CrossRef] [PubMed]
  20. Jacobson, L.C.; Hujo, W.; Molinero, V. Amorphous precursors in the nucleation of clathrate hydrates. J. Am. Chem. Soc. 2010, 132, 11806–11811. [Google Scholar] [CrossRef]
  21. Wolde, P.R.T.; Frenkel, D. Enhancement of Protein Crystal Nucleation by Critical Density Fluctuations. Science 1997, 277, 1975–1978. [Google Scholar] [CrossRef] [Green Version]
  22. Hirata, M.; Yagasaki, T.; Matsumoto, M.; Tanaka, H. Phase Diagram of TIP4P/2005 Water at High Pressure. Langmuir 2017, 33, 11561–11569. [Google Scholar] [CrossRef]
  23. Mochizuki, K.; Himoto, K.; Matsumoto, M. Diversity of transition pathways in the course of crystallization into ice VII. Phys. Chem. Chem. Phys. 2014, 16, 16419–16425. [Google Scholar] [CrossRef]
  24. Ostwald, W. Studien über die Bildung und Umwandlung fester Körper. Z. Phys. Chem. 1897, 22, 289. [Google Scholar] [CrossRef]
  25. Karthika, S.; Radhakrishnan, T.K.; Kalaichelvi, P. A Review of Classical and Nonclassical Nucleation Theories. Cryst. Growth Des. 2016, 16, 6663–6681. [Google Scholar] [CrossRef]
  26. Wang, Z.; Wang, F.; Peng, Y.; Zheng, Z.; Han, Y. Imaging the homogeneous nucleation during the melting of superheated colloidal crystals. Science 2012, 338, 87–90. [Google Scholar] [CrossRef]
  27. Samanta, A.; Tuckerman, M.E.; Yu, T.-Q.; Weinan, E. Microscopic mechanisms of equilibrium melting of a solid. Science 2014, 346, 729–732. [Google Scholar] [CrossRef]
  28. Mochizuki, K.; Matsumoto, M.; Ohmine, I. Defect pair separation as the controlling step in homogeneous ice melting. Nature 2013, 498, 350–354. [Google Scholar] [CrossRef]
  29. Shah, M.; Santiso, E.E.; Trout, B.L. Computer simulations of homogeneous nucleation of benzene from the melt. J. Phys. Chem. B 2011, 115, 10400–10412. [Google Scholar] [CrossRef]
  30. Tohji, K.; Murata, Y. X-Ray Diffraction Study of the Melting of Benzene. Jpn. J. Appl. Phys. 1982, 21, 1199–1204. [Google Scholar] [CrossRef]
  31. Craven, C.J.; Hatton, P.D.; Howard, C.J.; Pawley, G.S. The structure and dynamics of solid benzene. I. A neutron powder diffraction study of deuterated benzene from 4 K to the melting point. J. Chem. Phys. 1993, 98, 8236–8243. [Google Scholar] [CrossRef]
  32. Mochizuki, K. Computational Study on Homogeneous Melting of Benzene Phase I. Crystals 2019, 9, 84. [Google Scholar] [CrossRef]
  33. MacKerell, A.D.; Bashford, D.; Bellott, M.; Dunbrack, R.L.; Evanseck, J.D.; Field, M.J.; Fischer, S.; Gao, J.; Guo, H.; Ha, S.; et al. All-atom empirical potential for molecular modeling and dynamics studies of proteins. J. Phys. Chem. B 1998, 102, 3586–3616. [Google Scholar] [CrossRef]
  34. MacKerell, A.D.; Wiorkiewicz-Kuczera, J.; Karplus, M. An all-atom empirical energy function for the simulation of nucleic acids. J. Am. Chem. Soc. 1995, 117, 11946–11975. [Google Scholar] [CrossRef]
  35. Nemkevich, A.; Bürgi, H.-B.; Spackman, M.A.; Corry, B. Molecular dynamics simulations of structure and dynamics of organic molecular crystals. Phys. Chem. Chem. Phys. 2010, 12, 14916–14929. [Google Scholar] [CrossRef] [PubMed]
  36. Fu, C.-F.; Tian, S.X. A Comparative Study for Molecular Dynamics Simulations of Liquid Benzene. J. Chem. Theory Comput. 2011, 7, 2240–2252. [Google Scholar] [CrossRef]
  37. Darden, T.; York, D.; Pedersen, L. Particle mesh Ewald: An N⋅log(N) method for Ewald sums in large systems. J. Chem. Phys. 1993, 98, 10089–10092. [Google Scholar] [CrossRef]
  38. Berendsen, H.J.C.; van der Spoel, D.; van Drunen, R. GROMACS: A message-passing parallel molecular dynamics implementation. Comput. Phys. Commun. 1995, 91, 43–56. [Google Scholar] [CrossRef]
  39. Berendsen, H.J.C.; Postma, J.P.M.; van Gunsteren, W.F.; DiNola, A.; Haak, J.R. Molecular dynamics with coupling to an external bath. J. Chem. Phys. 1984, 81, 3684–3690. [Google Scholar] [CrossRef] [Green Version]
  40. Hoover, W.G. Canonical dynamics: Equilibrium phase-space distributions. Phys. Rev. A Gen. Phys. 1985, 31, 1695–1697. [Google Scholar] [CrossRef] [PubMed] [Green Version]
  41. Nosé, S. A molecular dynamics method for simulations in the canonical ensemble. Mol. Phys. 2002, 100, 191–198. [Google Scholar] [CrossRef]
  42. Bacon, G.E.; Curry, N.A.; Wilson, S.A. A crystallographic study of solid benzene by neutron diffraction. Proc. R. Soc. Lon. A. 1964, 279, 98–110. [Google Scholar]
  43. Fernández, R.G.; Abascal, J.L.F.; Vega, C. The melting point of ice Ih for common water models calculated from direct coexistence of the solid-liquid interface. J. Chem. Phys. 2006, 124, 144506. [Google Scholar] [CrossRef]
  44. Belonoshko, A.B. Molecular Dynamics of MgSiO3 perovskite at high pressures: Equation of state, structure, and melting transition. Geochim. Chosmochim. Acta 1994, 58, 4039–4047. [Google Scholar] [CrossRef]
  45. Belonoshko, A.B.; Ahuja, R.; Johansson, B. Quasi-Ab initio molecular dynamic study of Fe melting. Phys. Rev. Lett. 2000, 84, 3638–3641. [Google Scholar] [CrossRef] [PubMed]
  46. Belonoshko, A.B.; Arapan, S.; Martonak, R.; Rosengen, A. MgO phase diagram from first principles in a wide pressure-temperature range. Phys. Rev. B 2010, 81. [Google Scholar] [CrossRef]
  47. Bridgman, P.W. The Technique of High Pressure Experimenting. Proc. Am. Acad. Arts Sci. 1914, 49, 627. [Google Scholar] [CrossRef]
  48. Mo, M.Z.; Chen, Z.; Li, R.K.; Dunning, M.; Witte, B.B.L.; Baldwin, J.K.; Fletcher, L.B.; Kim, J.B.; Ng, A.; Redmer, R.; et al. Heterogeneous to homogeneous melting transition visualized with ultrafast electron diffraction. Science 2018, 360, 1451–1455. [Google Scholar] [CrossRef] [PubMed] [Green Version]
  49. Wang, F.; Zhou, D.; Han, Y. Melting of Colloidal Crystals. Adv. Funct. Mater. 2016, 26, 8903–8919. [Google Scholar] [CrossRef]
  50. Bai, X.-M.; Li, M. Nature and extent of melting in superheated solids: Liquid-solid coexistence model. Phys. Rev. B 2005, 72. [Google Scholar] [CrossRef]
  51. Stegailov, V. Homogeneous and heterogeneous mechanisms of superheated solid melting and decay. Comput. Phys. Commun. 2005, 169, 247–250. [Google Scholar] [CrossRef]
  52. Delogu, F. Mechanistic Aspects of Homogeneous and Heterogeneous Melting Processes. J. Phys. Chem. B 2006, 110, 12645–12652. [Google Scholar] [CrossRef] [PubMed]
  53. Burakovsky, L.; Burakovsky, N.; Cawkwell, M.J.; Preston, D.L.; Errandonea, D.; Simak, S.I. Ab initio phase diagram of iridium. Phys. Rev. B 2016, 94. [Google Scholar]
  54. Errandonea, D.; MacLeod, S.G.; Ruiz-Fuertes, J.; Burakovsky, L.; McMahon, M.I.; Wilson, C.W.; Ibañez, J.; Daisenberger, D.; Popescu, C. High-pressure/high-temperature phase diagram of zinc. J. Phys. Condens. Matter 2018, 30, 295402. [Google Scholar] [CrossRef]
  55. Burakovsky, L.; Burakovsky, N.; Preston, D.; Simak, S. Systematics of the Third Row Transition Metal Melting: The HCP Metals Rhenium and Osmium. Crystals 2018, 8, 243. [Google Scholar] [CrossRef]
  56. Gorski, K.M.; Hivon, E.; Banday, A.J.; Wandelt, B.D.; Hansen, F.K.; Reinecke, M.; Bartelmann, M. HEALPix: A Framework for High-Resolution Discretization and Fast Analysis of Data Distributed on the Sphere. Astrophys. J. 2005, 622, 759–771. [Google Scholar] [CrossRef]
  57. Kovačević, T.; Reinhold, A.; Briesen, H. Identifying Faceted Crystal Shape from Three-Dimensional Tomography Data. Cryst. Growth Des. 2014, 14, 1666–1675. [Google Scholar] [CrossRef]
  58. Wise, P.K.; Ben-Amotz, D. Interfacial Adsorption of Neutral and Ionic Solutes in a Water Droplet. J. Phys. Chem. B 2018, 122, 3447–3453. [Google Scholar] [CrossRef] [PubMed]
  59. Alexeev, A.D.; Revva, V.N.; Alyshev, N.A.; Zhitlyonok, D.M. True triaxial loading apparatus and its application to coal outburst prediction. Int. J. Coal Geol. 2004, 58, 245–250. [Google Scholar] [CrossRef]
  60. Jonsson, H.; Gråsjö, J.; Nordström, J.; Johansson, N.; Frenning, G. An apparatus for confined triaxial testing of single particles. Powder Technol. 2015, 270, 121–127. [Google Scholar] [CrossRef] [Green Version]
  61. Jonsson, H.; Frenning, G. Investigations of single microcrystalline cellulose-based granules subjected to confined triaxial compression. Powder Technol. 2016, 289, 79–87. [Google Scholar] [CrossRef]
Figure 1. Two-phase method for Tm: (A) initial configuration consisting of liquid and phase I structures, (B) time evolution of the total volumes in NpT MD simulations at 1.0 GPa and at three different temperatures (430, 435 and 440 K), (C) the resulting melting curve (Tm) for the phase I (blue filled circles) with the experimental data by Bridgman (open triangles) [47] and by Akella et. al (open squares) [9]. The panel C also presents the homogeneous melting temperature (red sharp), and the stable (filled diamonds) and unstable (open diamonds) conditions for the metastable phase, estimated in this study.
Crystals 09 00279 g001
Figure 2. Time dependence of (A) PE, (B) density, and (C) MSD for the melting of benzene phase I at 584 K. The time range when the metastable phase is formed is shaded in green.
Crystals 09 00279 g002
Figure 3. Molecular structures of (A) phase I (100 ps), (B) metastable phase (490 ps), and (C) liquid phase (575 ps). The two distinct layers, M1 and M2, and the y axis are shown in (B).
Crystals 09 00279 g003
Figure 4. RDFs, g(r), of the COM of benzene molecule for phase I, metastable phase, and liquid phase, computed in the time range 100–150 ps, 490–510 ps, and 9000–9050 ps, respectively.
Crystals 09 00279 g004
Figure 5. Probability density of the normal benzene vector (A) whose orientation is defined by angles θ and φ. The normalized distributions for (B) phase I (100–120 ps), (C) M1, and (D) M2 layers in the metastable phase (490–510 ps) are depicted using HEALPix, such that each pixel represents an equal area on the spherical surface. The experimentally obtained orientation for phase I [11] is shown in green circles.
Crystals 09 00279 g005
Figure 6. Schematic representation of the metastable phase and its unit cell (dashed black lines). Every other layer along the y axis has the same color code. The x, y, and z for the simulation box and the a, b, and c parameters for the unit cell are shown.
Crystals 09 00279 g006

