Article

Pressure Effects on the Optical Properties of NdVO4

1
Departamento de Física Aplicada-ICMUV, Universitat de València, Calle Dr. Moliner 50, 46100 Burjassot, Spain
2
Laboratorio Materiali Luminescenti, Dipartimento di Biotecnologie, Università di Verona, and INSTM, UdR Verona, Strada Le Grazie 15, 37134 Verona, Italy
*
Author to whom correspondence should be addressed.
Crystals 2019, 9(5), 237; https://doi.org/10.3390/cryst9050237
Submission received: 25 April 2019 / Revised: 2 May 2019 / Accepted: 4 May 2019 / Published: 6 May 2019
(This article belongs to the Special Issue Pressure-Induced Phase Transformations)

Abstract

:
We report on optical spectroscopic measurements in pure NdVO4 crystals at pressures up to 12 GPa. The influence of pressure on the fundamental absorption band gap and Nd3+ absorption bands has been correlated with structural changes in the crystal. The experiments indicate that a phase transition takes place between 4.7 and 5.4 GPa. We have also determined the pressure dependence of the band-gap and discussed the behavior of the Nd3+ absorption lines under compression. Important changes in the optical properties of NdVO4 occur at the phase transition, which, according to Raman measurements, corresponds to a zircon to monazite phase change. In particular, in these conditions a collapse of the band gap occurs, changing the color of the crystal. The changes are not reversible. The results are analyzed in comparison with those deriving from previous studies on NdVO4 and related vanadates.

1. Introduction

Trivalent metal orthovanadates have been constantly studied during the last decade because of their optical properties, which makes them appropriate for many different technological applications. Such applications go from photocatalytic water purification and hydrogen production to scintillators, phosphors, solid-state lasers, magnetoelectric, and medical applications [1,2,3,4,5,6]. Neodymium vanadate (NdVO4) is one of the most promising orthovanadates for the development of technological applications [1,2,3,4,5,6], for which an accurate knowledge of NdVO4 optical properties is a fundamental requisite. Several studies have been carried out on the optical properties of NdVO4 [6,7,8,9,10,11], mainly focused on the study of the band-gap energy and the optical absorptions associated to internal transitions of Nd3+ ions from 4I9/2 to 4G5/2, 4F7/2, 4F5/2, and 4F3/2 [12]. Discrepancies on the value of the fundamental band gap (Egap) can be found in the literature [6,7,8,9,10,11], with values of the Egap ranging from 2.95 to 3.72 eV. Consequently, new studies are needed to accurately determine this parameter, which is crucial for the understanding of the properties of this wide gap semiconductor.
A second focus of research on NdVO4 has been the influence of pressure on its properties and crystal structure. Numerous studies have been carried out, reporting the existence of a phase transition around 5–6 GPa [13,14,15,16]. Interestingly, it has been found that the crystal structure of the high-pressure (HP) phase strongly depends on the conditions of the experiment (namely, hydrostatic or non-hydrostatic conditions). On the other hand, a second phase transition has been found to occur at 18–20 GPa, according to Raman and X-ray diffraction (XRD) experiments [13,14]. In contrast, optical-absorption experiments located this transition at 12 GPa. These results also suggest that additional studies of the pressure effects on the optical properties of NdVO4 are required. This could give not only information about the pressure dependence of the band gap but also on the structural stability. In particular, the study of the behavior under compression of the internal absorption transitions of Nd3+ ions, which strongly depend on their local environment, can be useful to characterize the HP phase transitions [17,18].
Here we report a systematic study of the optical properties on NdVO4 in the ultraviolet (UV)–visible (VIS) range. The studies have been carried on single crystals growth by the flux growth method. The maximum pressure achieved is 12 GPa. Our results confirm that NdVO4 is a wide-gap semiconductor with Egap = 3.72(2) eV. The pressure dependence of Egap is reported and discussed, as well as the pressure dependence of the absorption bands associated to internal transition of Nd3+. We demonstrate the existence of only one phase transition in the pressure range covered by the experiment. This transition is non-reversible and causes a band-gap collapse, along with important changes in the absorption bands associated to Nd3+, as shown and discussed in the following.

2. Materials and Methods

NdVO4 single crystals, up to 10 mm long, were obtained by the flux growth method [19,20,21]. A 1:1.923 mol. mixture of V2O5 and PbO (99%, Carlo Erba, Val-De-Reuil, France, and 99.9%, Sigma Aldrich, St. Louis, MO, USA, respectively) plus borax (Na2B4O7·10H2O, > 99%, JT Baker, Waltham, Waltham, MA, USA) was used as the flux. Borax was added as a flux modifier, in order to increase the size of the crystals [22]. Nd2O3 (0.7394 g, purity 99.99%, Sigma Aldrich, St. Louis, MO, USA) was added as the crystal precursor. All the reagents were in form of fine powders. The flux composition was 21.3082 g of PbO, 9.1235 g of V2O5, and 1.25 g of Na2B4O7·10H2O. Platinum crucibles were filled with the flux and the precursor, sealed with a platinum lid, and put in a programmable oven. To dehydrate the mixture, the temperature was ramped up at 0.6 °C/hour and kept at 250 °C for 2 hours. Afterwards, the temperature was kept fixed for 15 hours at 1300 °C, after a gradual increment at a rate of 105 °C/hour. During this step, the flux melts and acts as a solvent for Nd2O3. The temperature was then slowly decreased until 950 °C (−1.8 °C/hour), in order to promote the formation of the crystals by precipitation and spontaneous nucleation. The crucible was then removed from the oven, rapidly reversed (to facilitate the recovery of the crystals) and allowed to cool down to room temperature. Subsequently, the platinum lid was removed and the crucible was immersed in hot nitric acid (1.5 M), which was continuously stirred and renewed multiple times until the complete dissolution of the flux. Finally, the clean crystals were washed with deionized water and recovered using a paper filter.
In order to characterize the growth of NdVO4 crystals we performed energy-dispersive X-ray spectroscopy (EDXS) in a transmission electron microscopy (TEM, FEI Company, Hillsboro, OR, USA) operated at 200 kV (TECNAI G2 F20 S-TWIN, Waltham, MA, USA), powder XRD measurements using a Rigaku D/Max diffractometer (Tokyo, Japan) with Cu-Kα radiation (λ = 1.5406 Å), and Raman measurements in backscattering geometry with a Jobin Yvon THR1000 single spectrometer (Kyoto, Japan) equipped with an edge filter, a 10X objective (Mitutoyo, Kawasaky, Japan) with a numerical aperture of 0.28, and a thermoelectric-cooled multichannel charge-coupled device (CCD) detector, using a 632.8 nm HeNe laser (10 mW power).
Optical-absorption experiments were accomplished in the UV–VIS range using the optical set-up previously described by Segura et al. [23], which is equipped with Cassegrain objectives (6X magnification and 0.60 numerical aperture, Edmund Optics, Mainz Germany) and an UV–VIS spectrometer (USB4000-UV–VIS - Ocean Optics, Duiven, Netherlands). Optical absorption spectra were obtained from the transmittance of the sample, measured using the sample-in sample-out method [24]. For these measurements, platelets of size 60 × 60 μm and approximately 5 μm thick were cleaved along the {110} plane. The experiments were carried out both at ambient and at high pressure. The HP experiments were performed using a diamond anvil cell (DAC, Chervin-type, Sorbonne University, Paris, France) equipped with IIA-type diamonds with a culet size of 480 μm. The crystals were loaded in a 200 μm hole of a steel gasket, pre-indented to a thickness of 50 μm. As the pressure medium, we employed a 16:3:1 methanol–ethanol–water mixture, which remains quasi-hydrostatic up to 10.5 GPa [25]. The NdVO4 crystals were carefully located at the center of the gasket hole to avoid bridging [26]. Small ruby chips were loaded next to the sample for pressure determination [27] with an accuracy of 0.05 GPa. The full width half maximum of R1 and R2 lines of ruby fluorescence and the splitting between them confirm the quasi-hydrostatic conditions of the experiments [28].

3. Results and Discussion

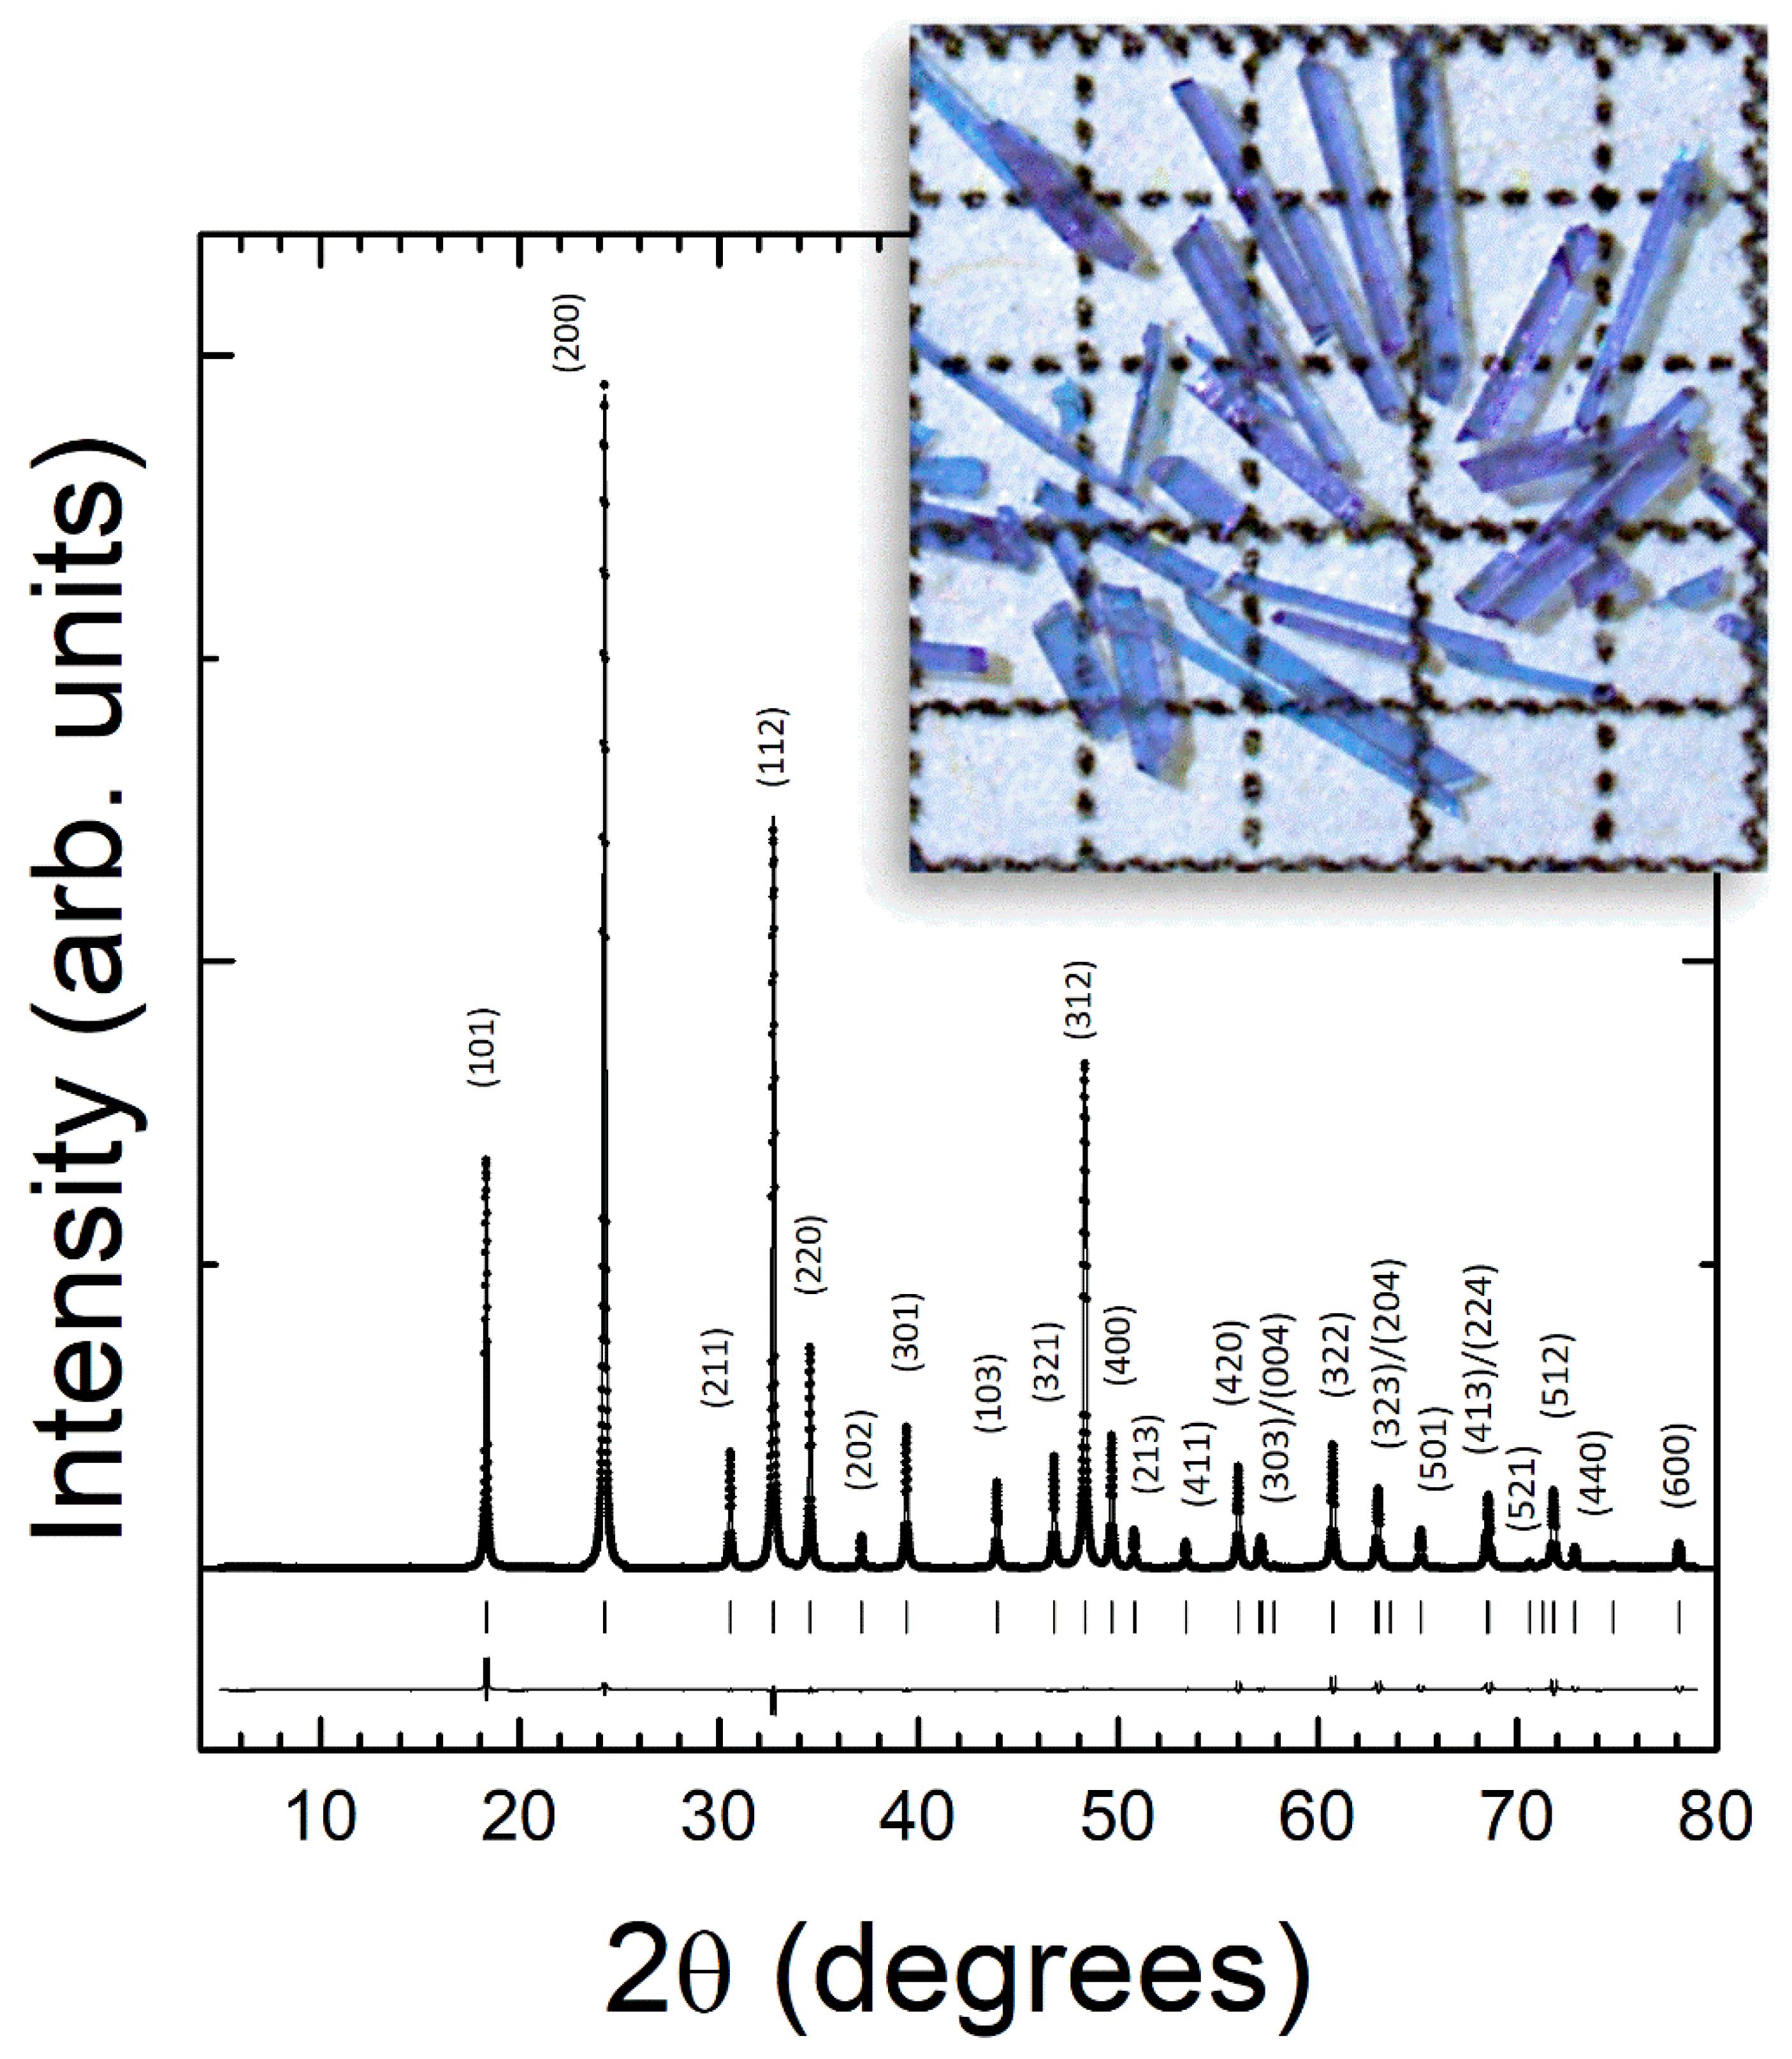
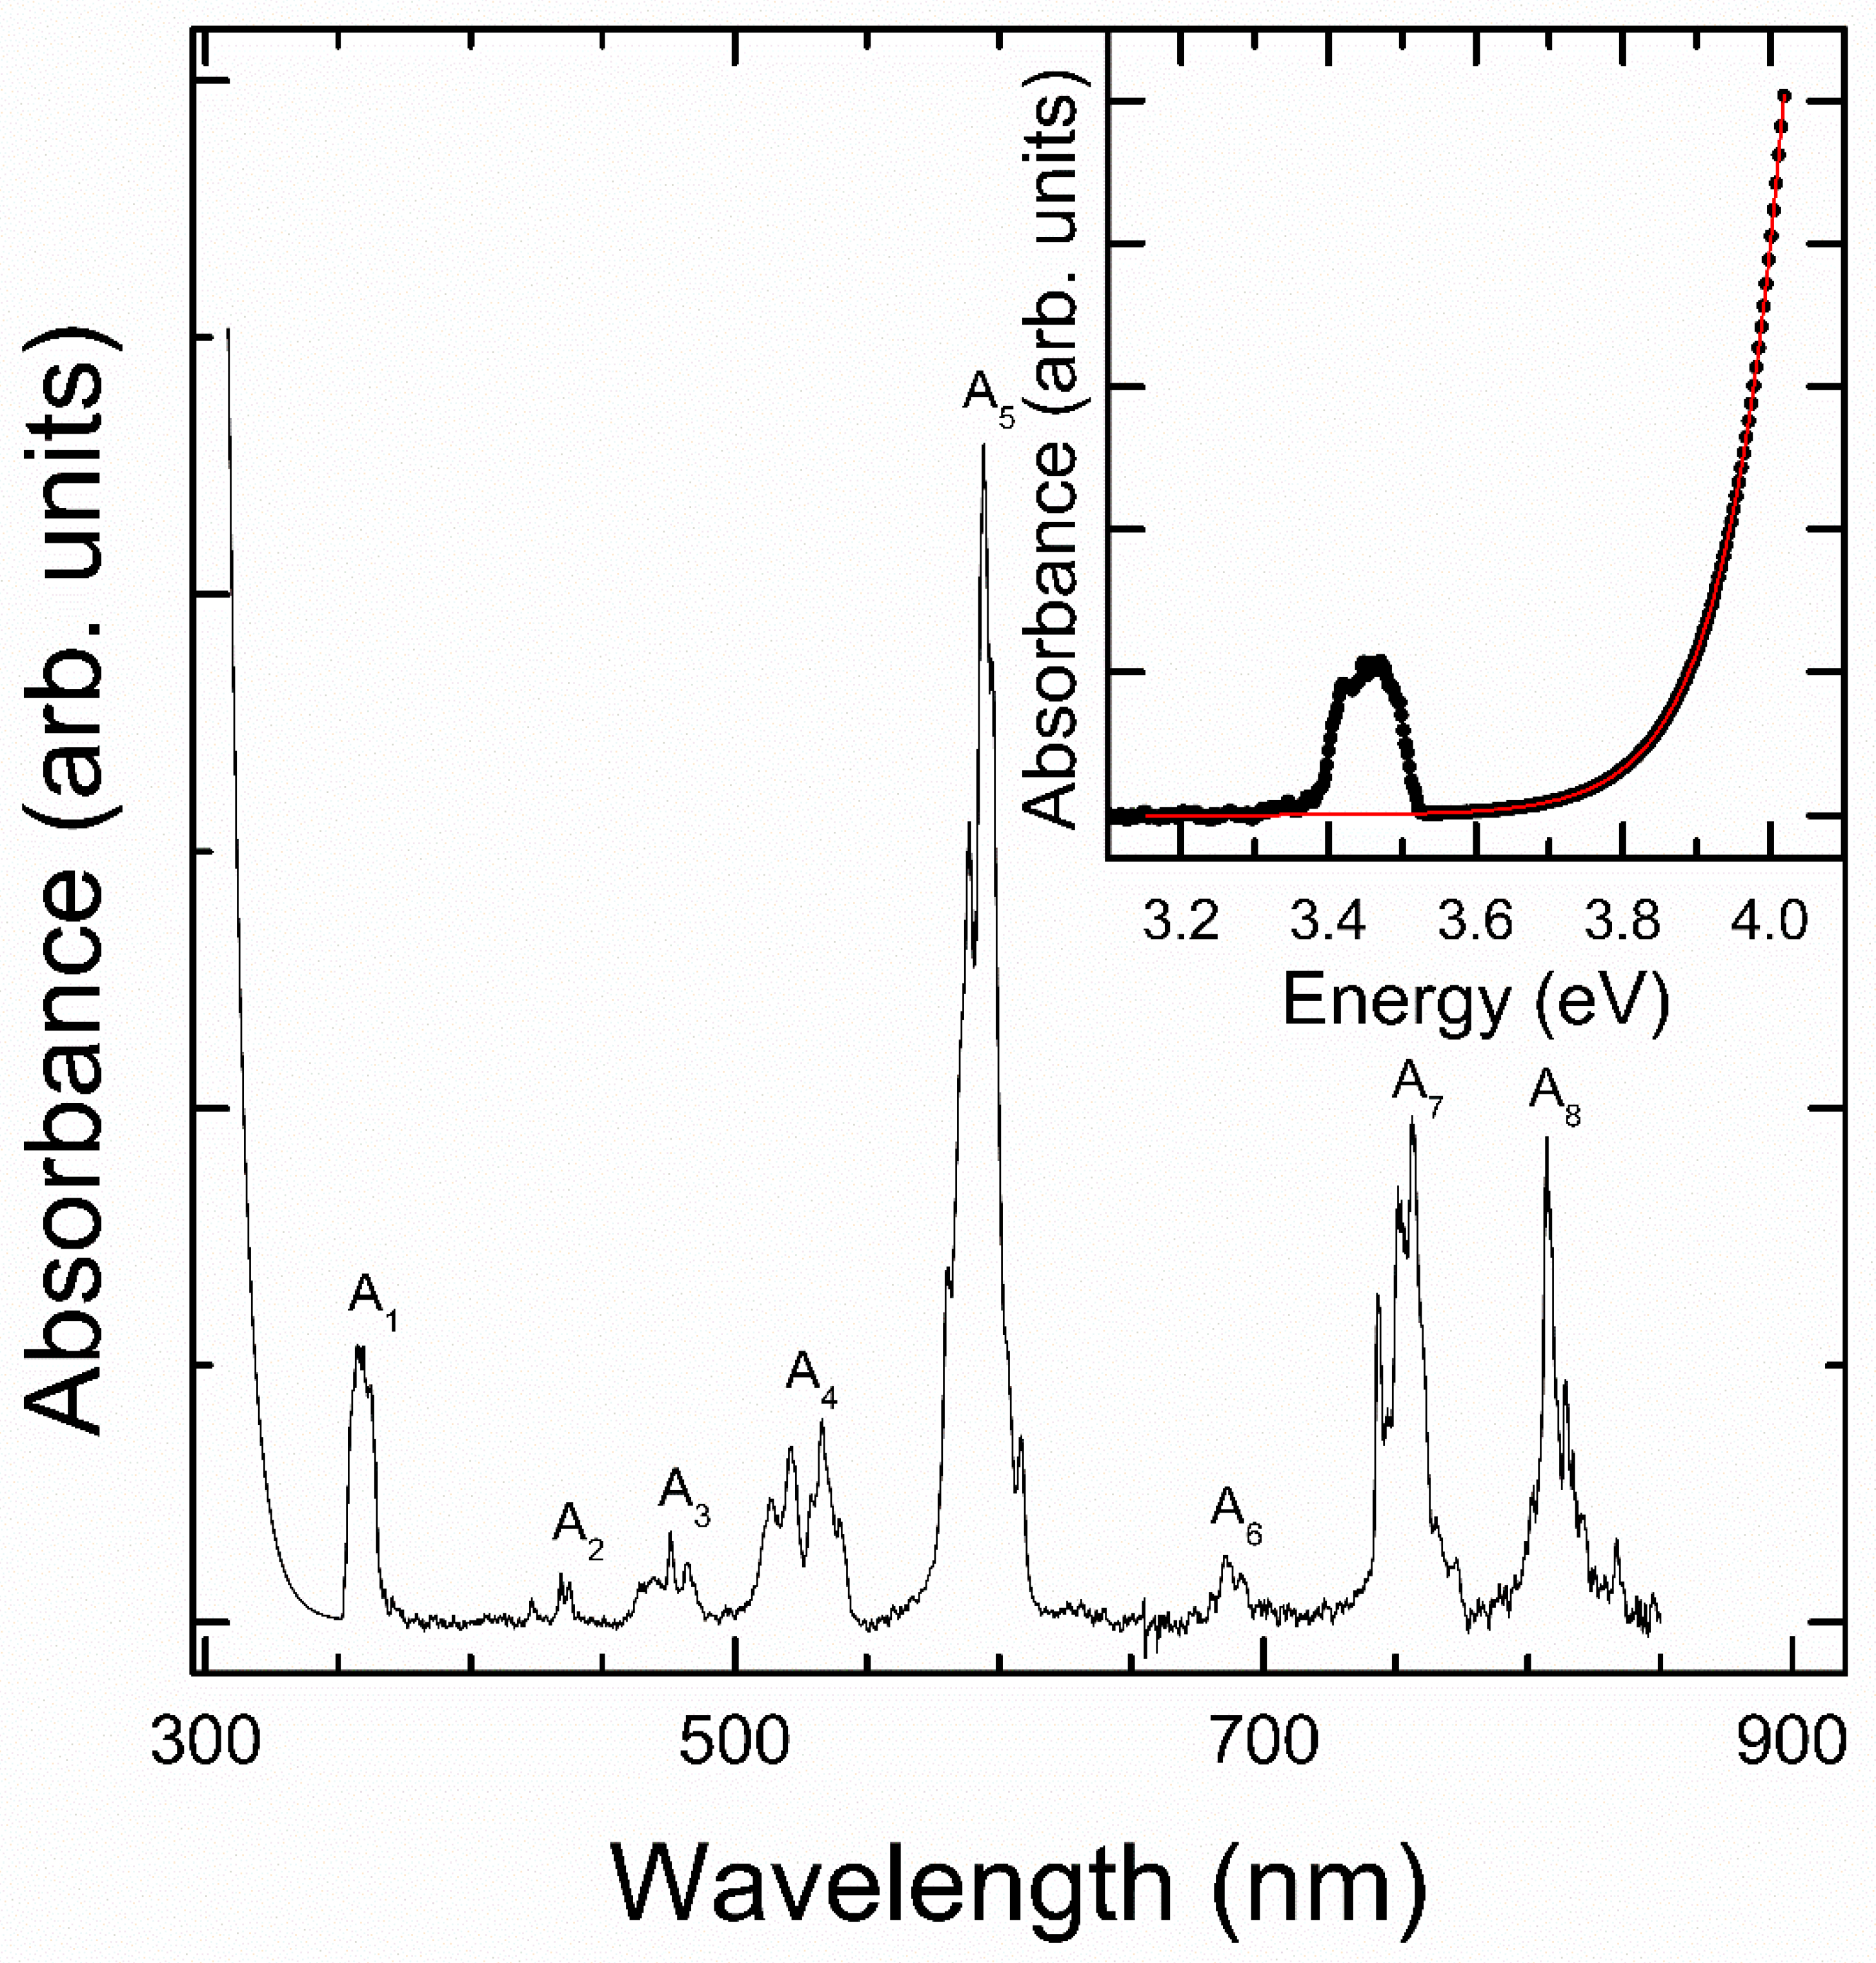
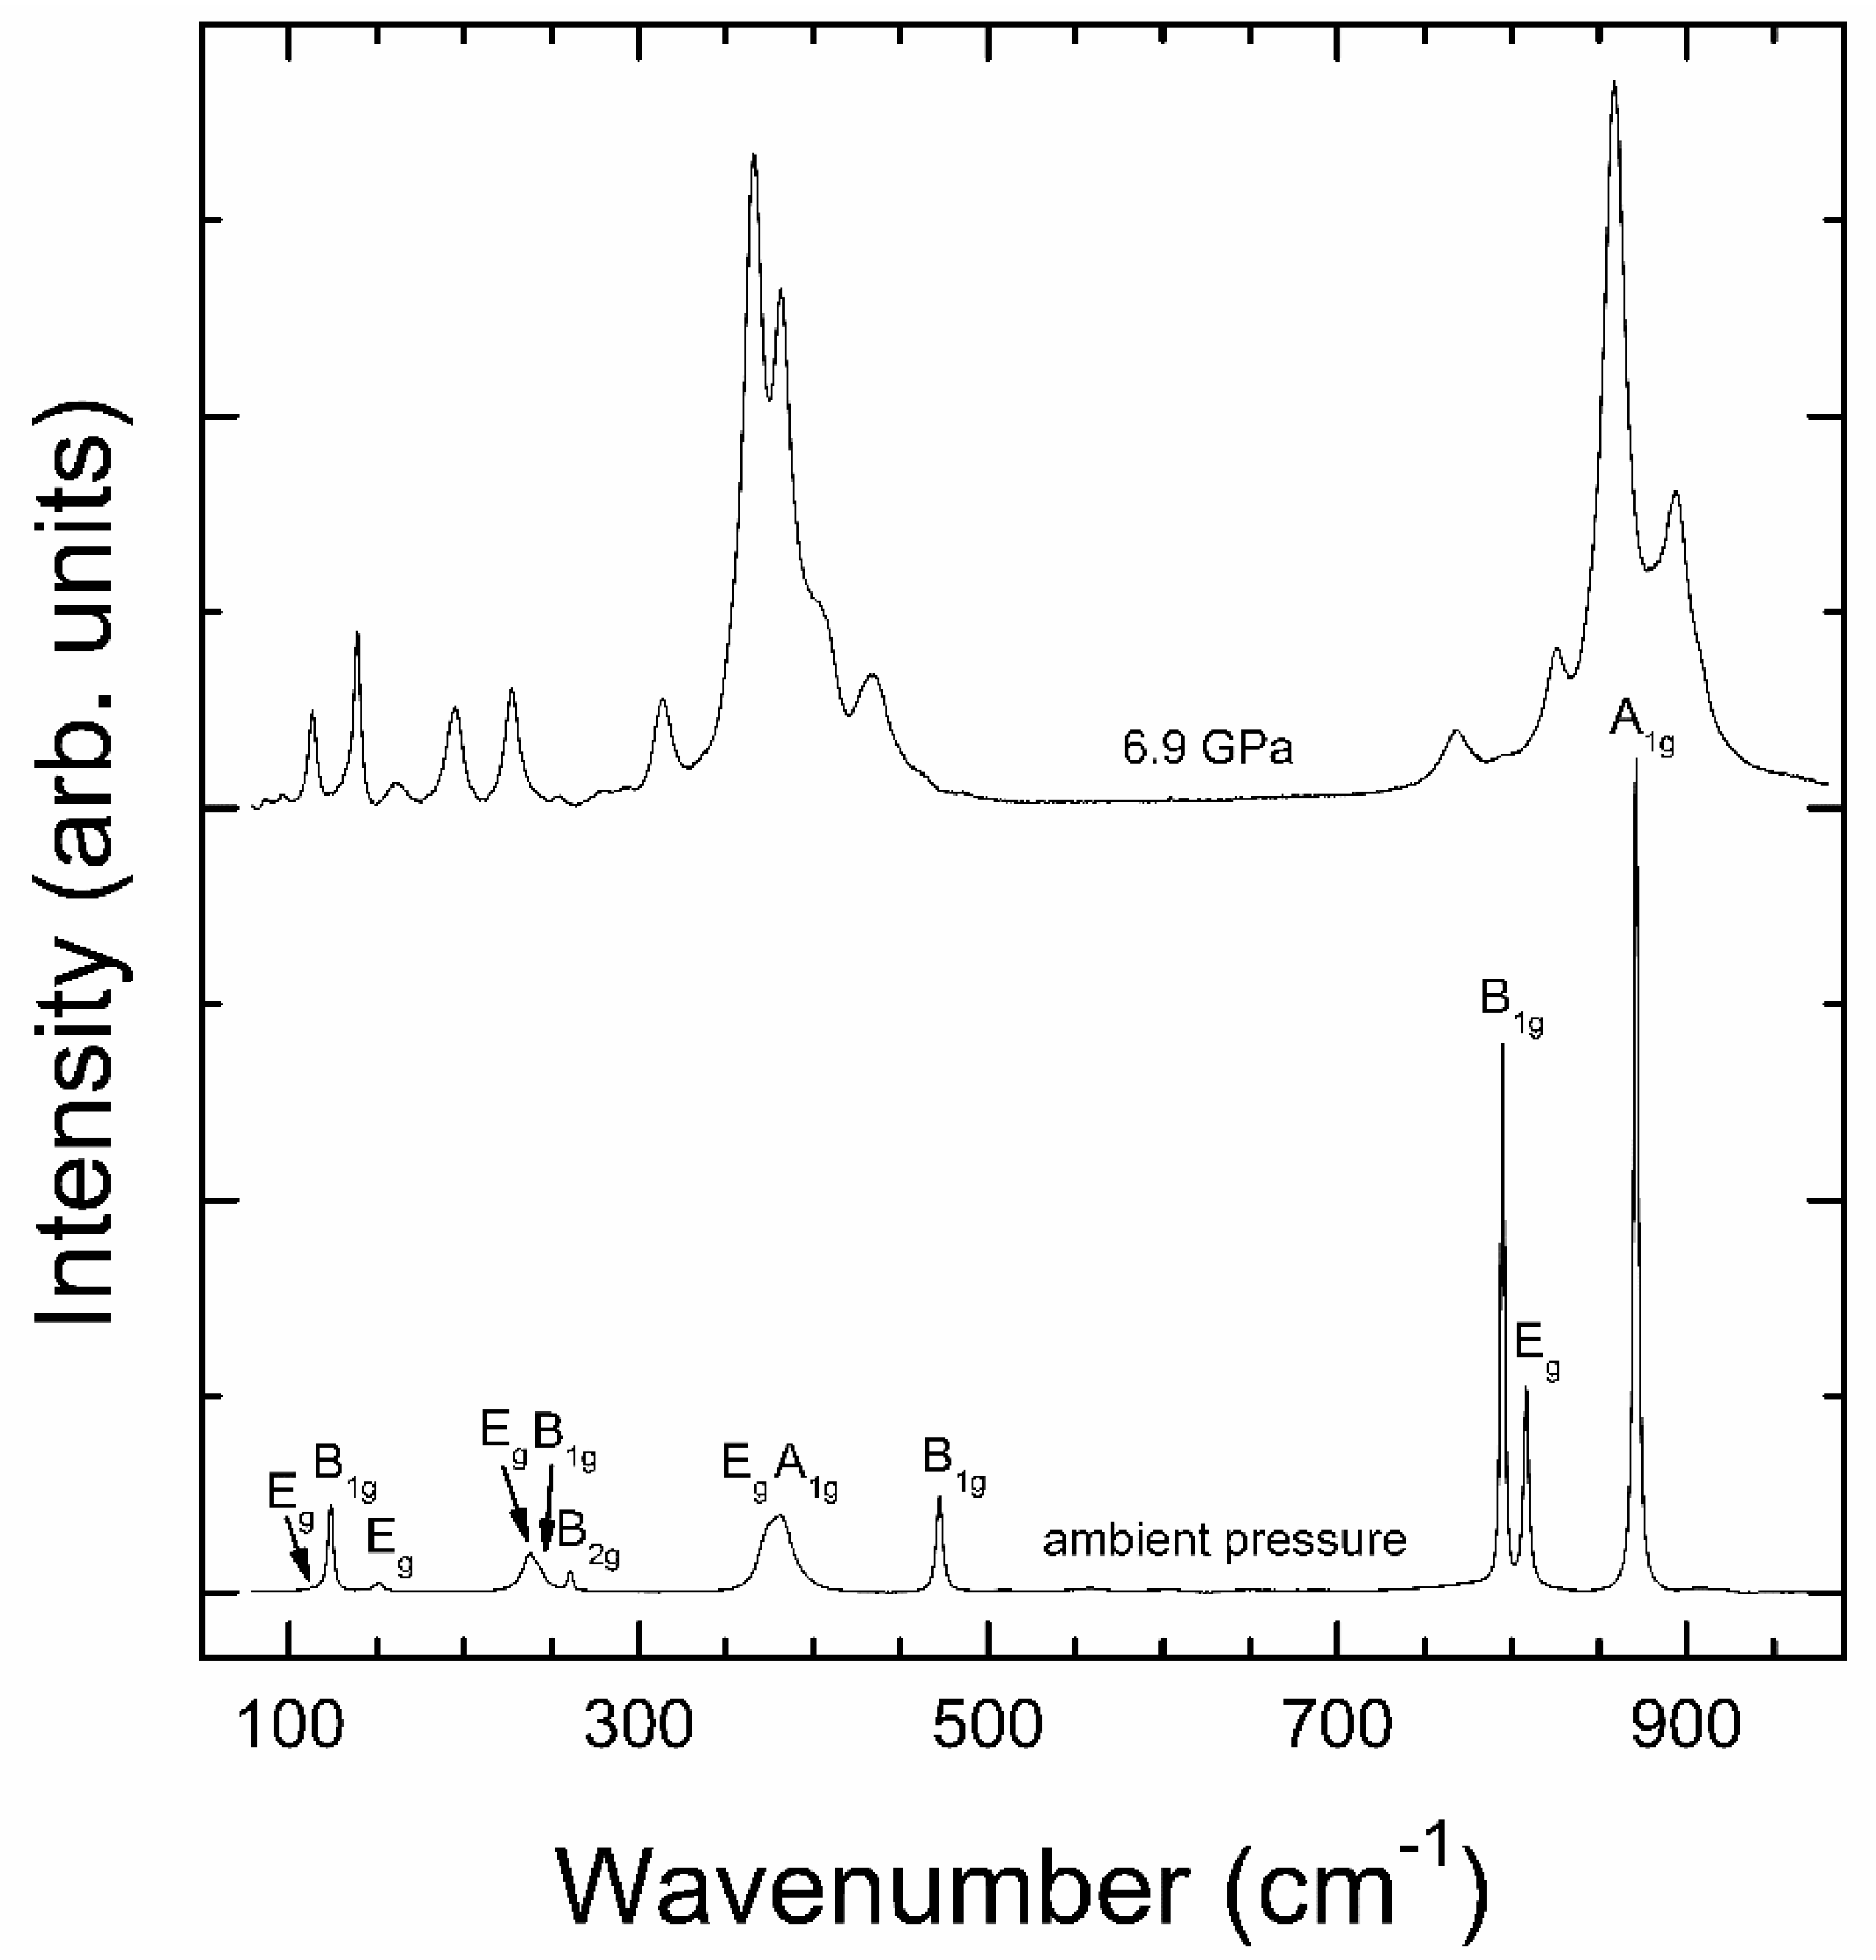
3.1. Ambient-Pressure Characterization

The obtained single crystals are transparent with a strong violet hue. The growth is preferentially along the c-axis, with size of the order of 5 × 1 × 0.2 mm (see inset in Figure 1). EDXS shows the presence of only Nd, O, and V, indicating that the grown crystals are free from impurities. According to EDXS analysis, the ratio of Nd to V is found to be ~1, confirming the formation of stoichiometric NdVO4. Results from powder XRD measurements are shown in Figure 1 together with the results of the structural refinement and residuals. The phase purity of NdVO4 has been confirmed by the Rietveld refinement, along with the expected zircon-type crystal structure (space group I41/amd) [29]. A total number of 31 reflections have been observed and all of them have been used in the refinement. Nd and V are located at high-symmetry atomic positions 4a (0, 3/4, 1/8) and 4b (0, 1/4, 3/8), respectively. This facilitates the determination of the positions of oxygen atoms, which were established to be at 16 h (0, 0.4292(5), 0.2055(5)). The unit-cell parameters are a = 7.3311(8) Å and c = 6.4359(7) Å. According to these results, the zircon structure is composed of regular VO4 tetrahedral units with a V-O distance of 1.7076(6) Å and NdO8 dodecahedra with two different Nd-O distances, 2.4082(9) and 2.5001(9) Å. These results are in full agreement with the literature [4,29]. The small residuals in Figure 1 and the R-factors of the refinement (RP = 5.8% and RWP = 7.11%) fully support the assignment of the zircon-type structure.
Results from the Raman experiment at ambient pressure are shown in Figure 2. Group theory predicts 12 Raman active modes for the zircon-type structure, whose irreducible representation is 2A1g + 4B1g + B2g + 5Eg [30]. All the expected Raman active modes could be identified in our experiment. Notice that the two broadest peaks (those at ~240 and 378 cm−1) are doublets consistent of modes very close in frequency (see Table 1). No other modes than those representative of zircon-type NdVO4 have been observed. This supports that only the stable polymorph of NdVO4 is present in our crystals, a conclusion that agrees with the results of XRD experiments. The wavenumbers of the different modes are summarized in Table 1. They agree with those reported by Santos et al. [30], Nguyen et al. [31], and Panchal et al. [13]. The mode assignment was done according to these previous works.
Results from optical-absorption experiments are shown in Figure 3. The absorption spectrum has an abrupt absorption edge at low wavelengths plus eight absorption bands, named as A1 to A8. These bands resemble those of the transitions between the levels of Nd3+, while the strong low-wavelength absorption corresponds to the fundamental band gap of NdVO4, with the typical Urbach-tail shape of this family of compounds [32,33]. This can be clearly seen in the inset of the figure, where the absorption is plotted as a function of the photon energy (E). In particular, it closely resembles the absorption edges of the direct band gap of zircon-type YVO4, LuVO4, and YbVO4 [11]. By assuming that the absorption coefficient (α) of NdVO4 obeys an Urbach-tail energy dependence, α ( E ) = α 0 e ( E g a p E ) / E u , we have been able to explain the observed strong low-wavelength (high-energy) absorption edge. In the equation, E u is the Urbach energy, which is related to the steepness of the absorption edge. In the inset of Figure 3 we show the goodness of this dependence fit for the high-energy part of the absorption spectrum (red line). The best fit has been obtained with Egap = 3.72(2) eV and Eu = 0.081(5) eV. The value of the band-gap agrees with the results reported by Panchal et al. [11] and the value of Eu is comparable with the values reported for related oxides [34].
The rest of the absorption features observed in our experiment (A1 to A8 in Figure 3) can be correlated to transitions between 4f3 levels of Nd3+. All the absorption bands are composed by several overlapping peaks, due to the expected broadening at room temperature. They are centered at 359, 439, 474, 528, 593, 688, 753, and 817 nm. They likely correspond to transitions from 4I9/2 to 4G11/2, 4G9/2, 4G7/2, 4F9/2, 4G5/2, 4F7/2, 4F5/2, and 4F3/2, respectively [35]. The features at long wavelengths are the strongest and have been previously reported [6,7,8,9,10]. Among the others, only the absorption band centered at 359 nm has been previously reported, even if mistakenly assigned to the fundamental band-gap of NdVO4 [8]. This leads to the underestimation of the band gap, with values from ranging 2.95 to 3.5 eV [6,7,8,9,10]. The band gap of NdVO4 measured in our experiment is larger (3.72 eV), compatible with the band gap of rare-earth vanadates, and its value is determined by the classical field splitting of the VO43− ion [26], the top of the valence band and bottom of the conduction band being dominated by V 3d and O 2p states. A possible cause for the aforementioned underestimation of the band-gap can be the fact that the previous studies were carried out on nanoparticles and nanowires and not on single crystals. The diffusion of light through nanomaterials used in previous experiments, along with the poorer crystallinity, would lead to a larger Urbach energy, making the fundamental absorption edge less steep and causing it to merge with the highest energy absorption band of Nd3+, therefore leading to an underestimation of Egap.

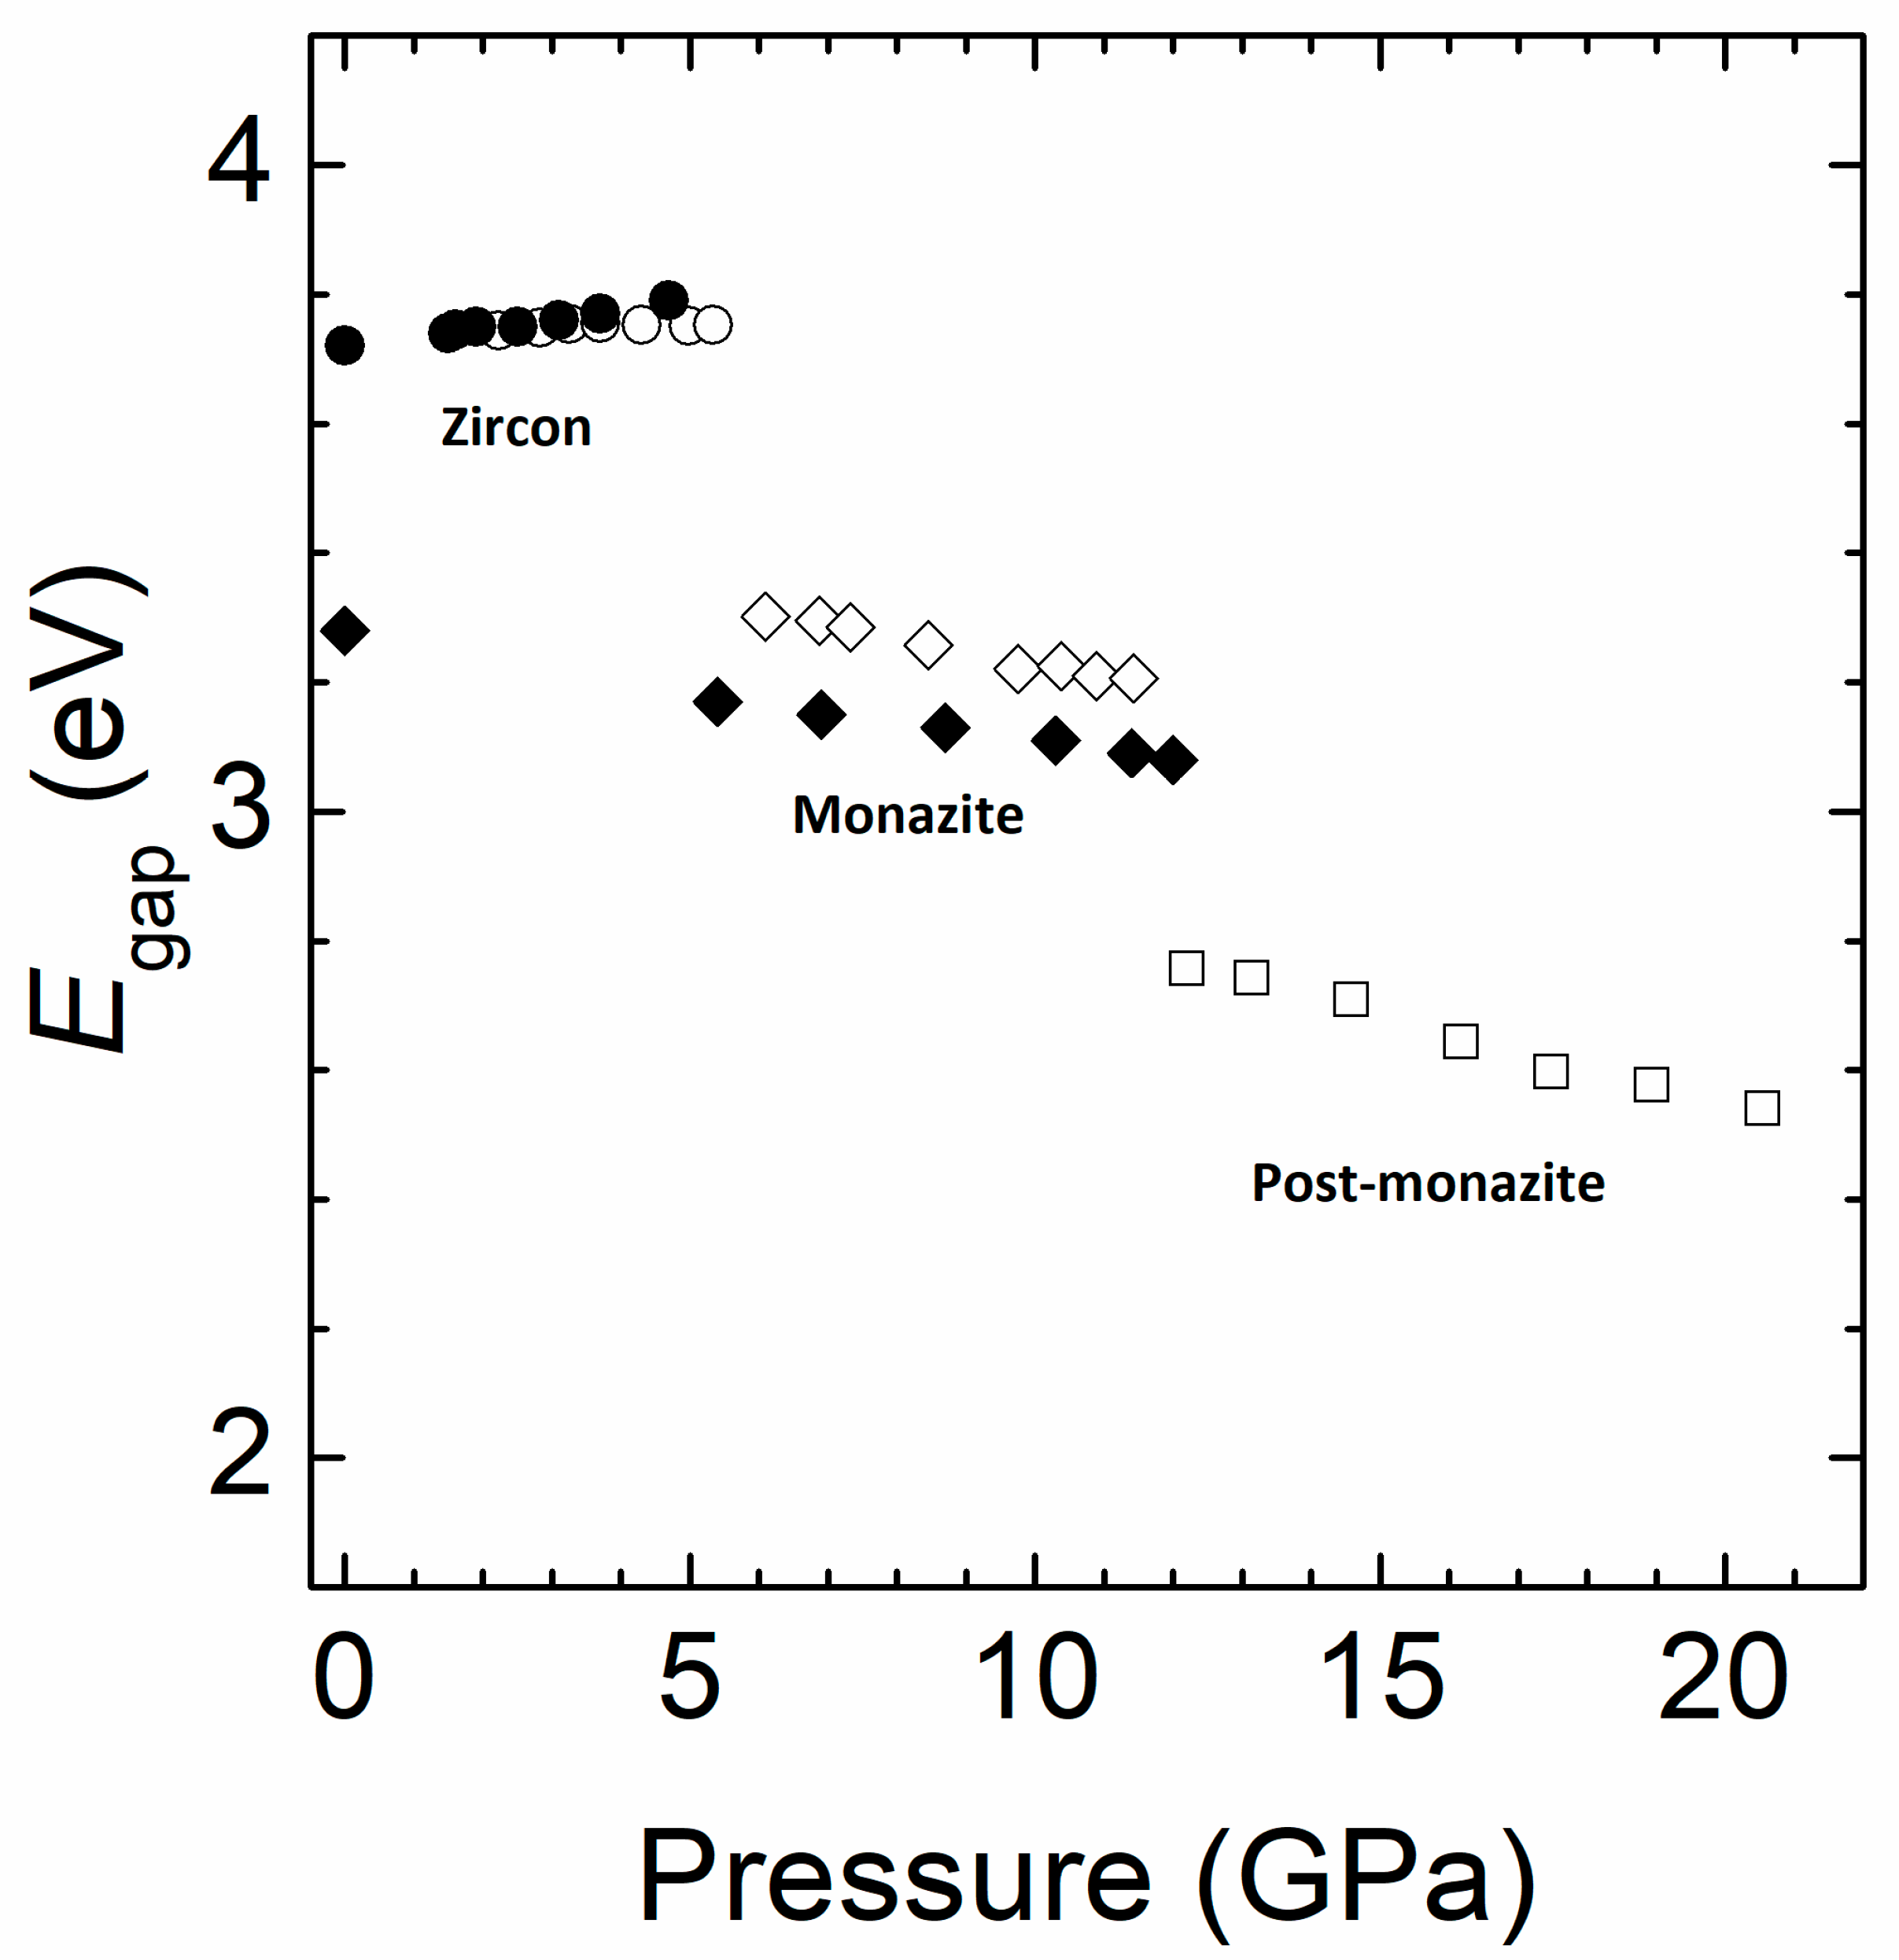
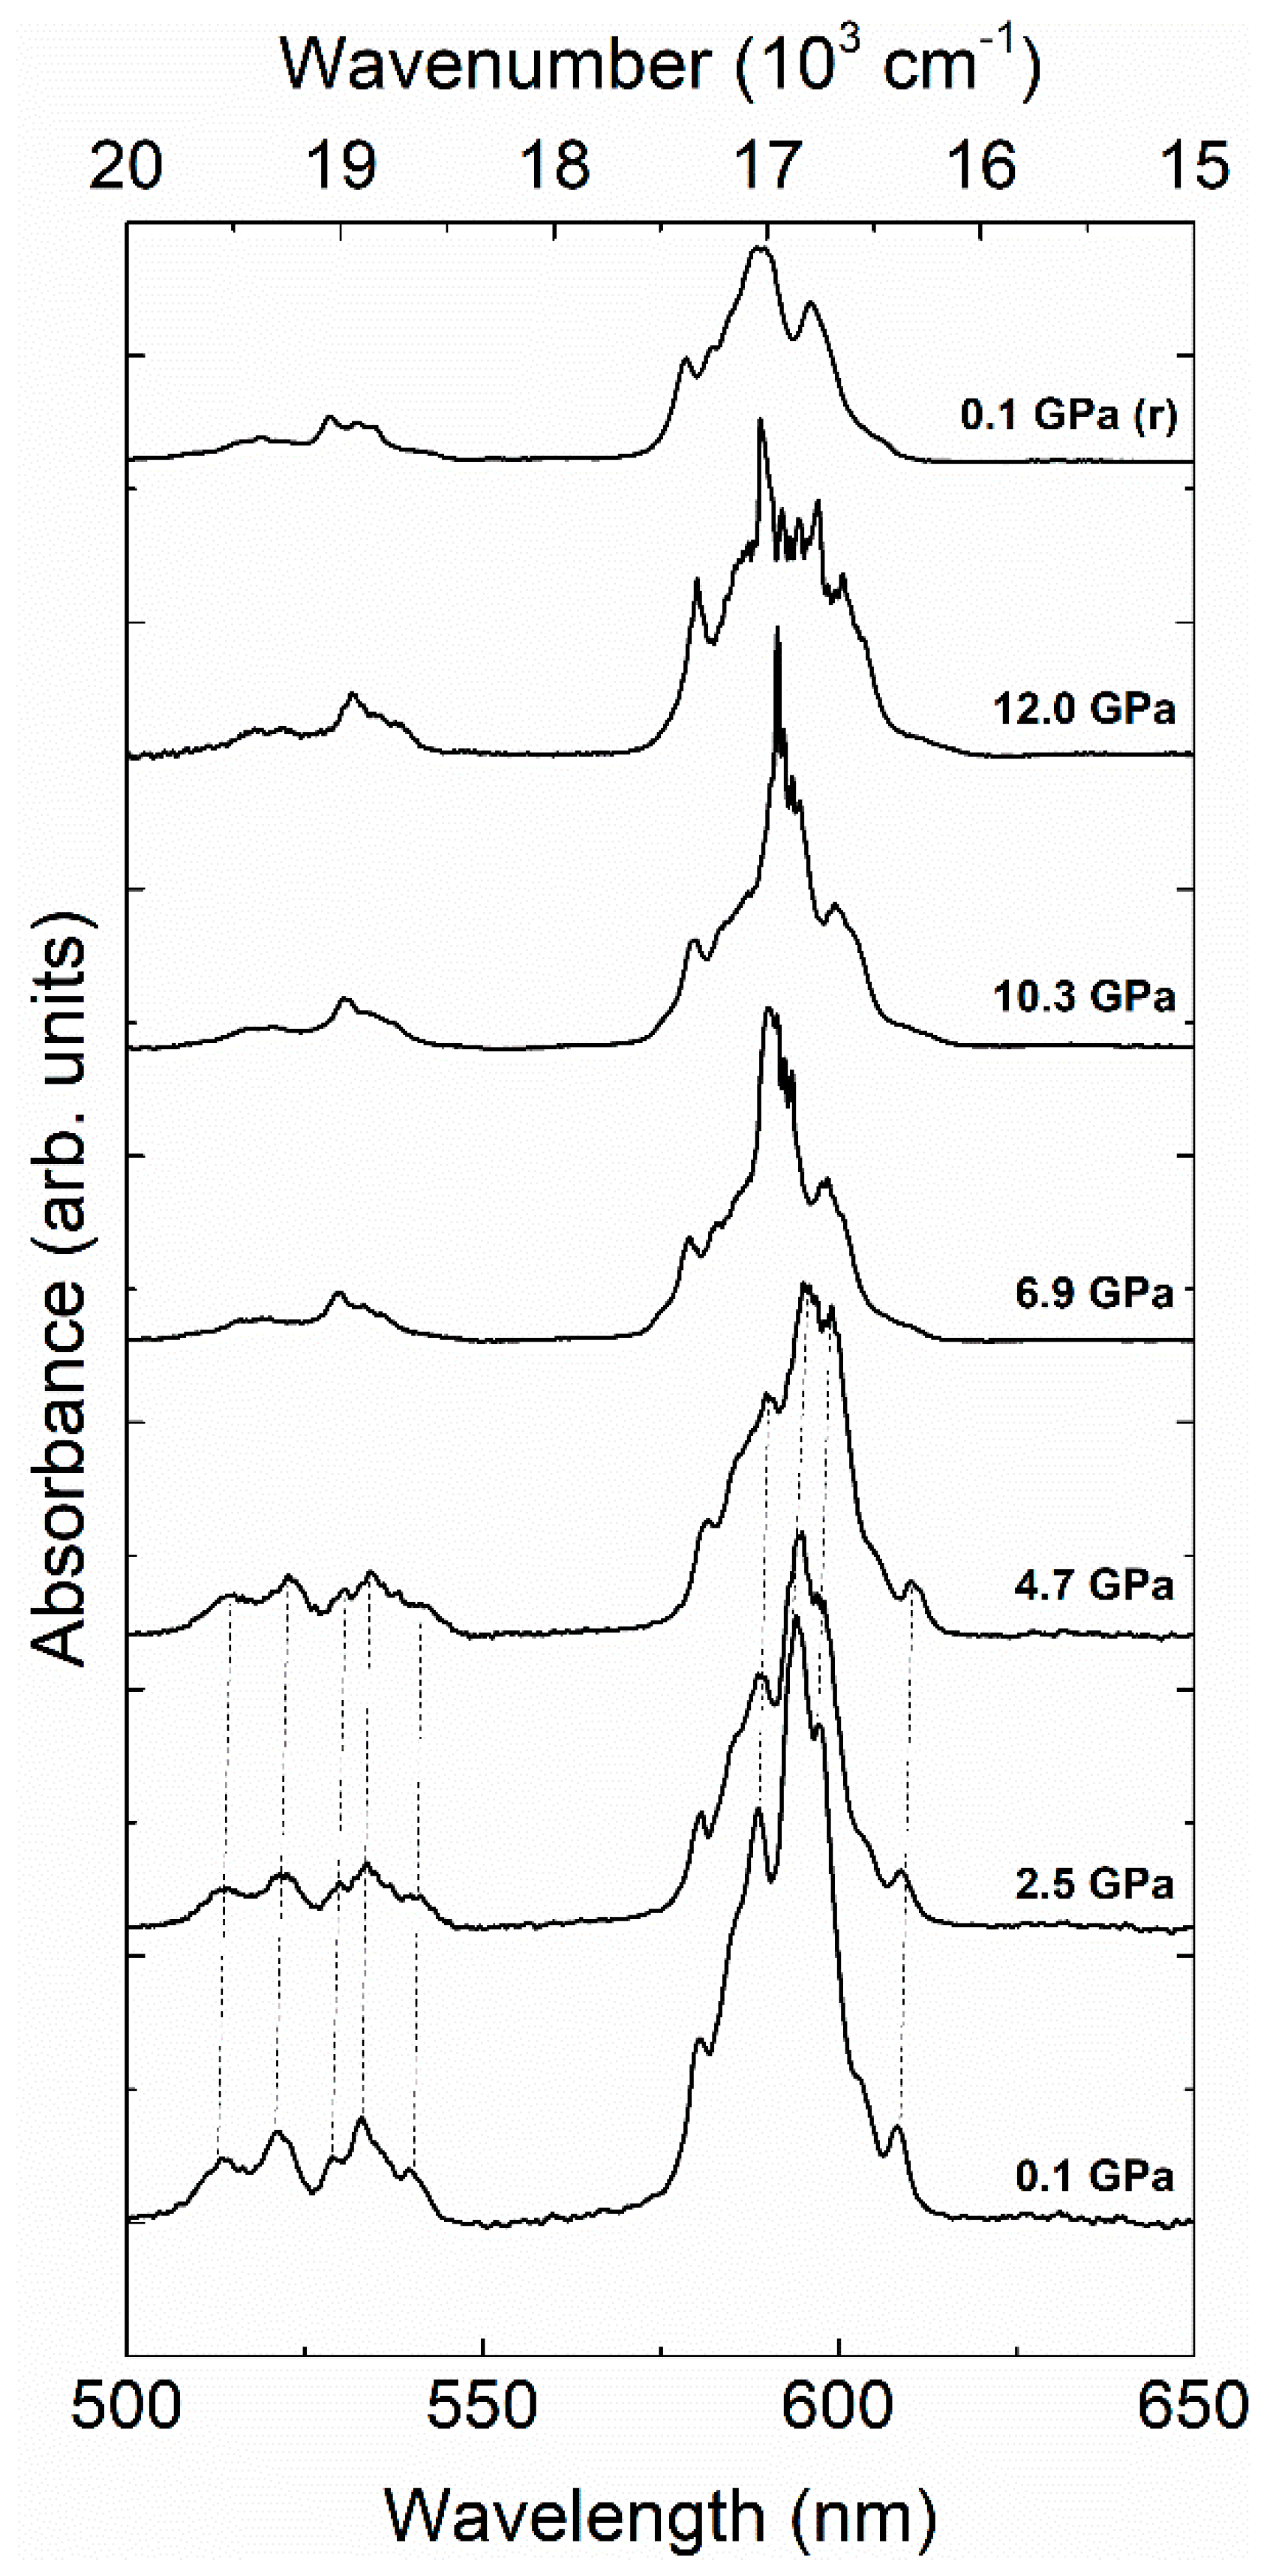
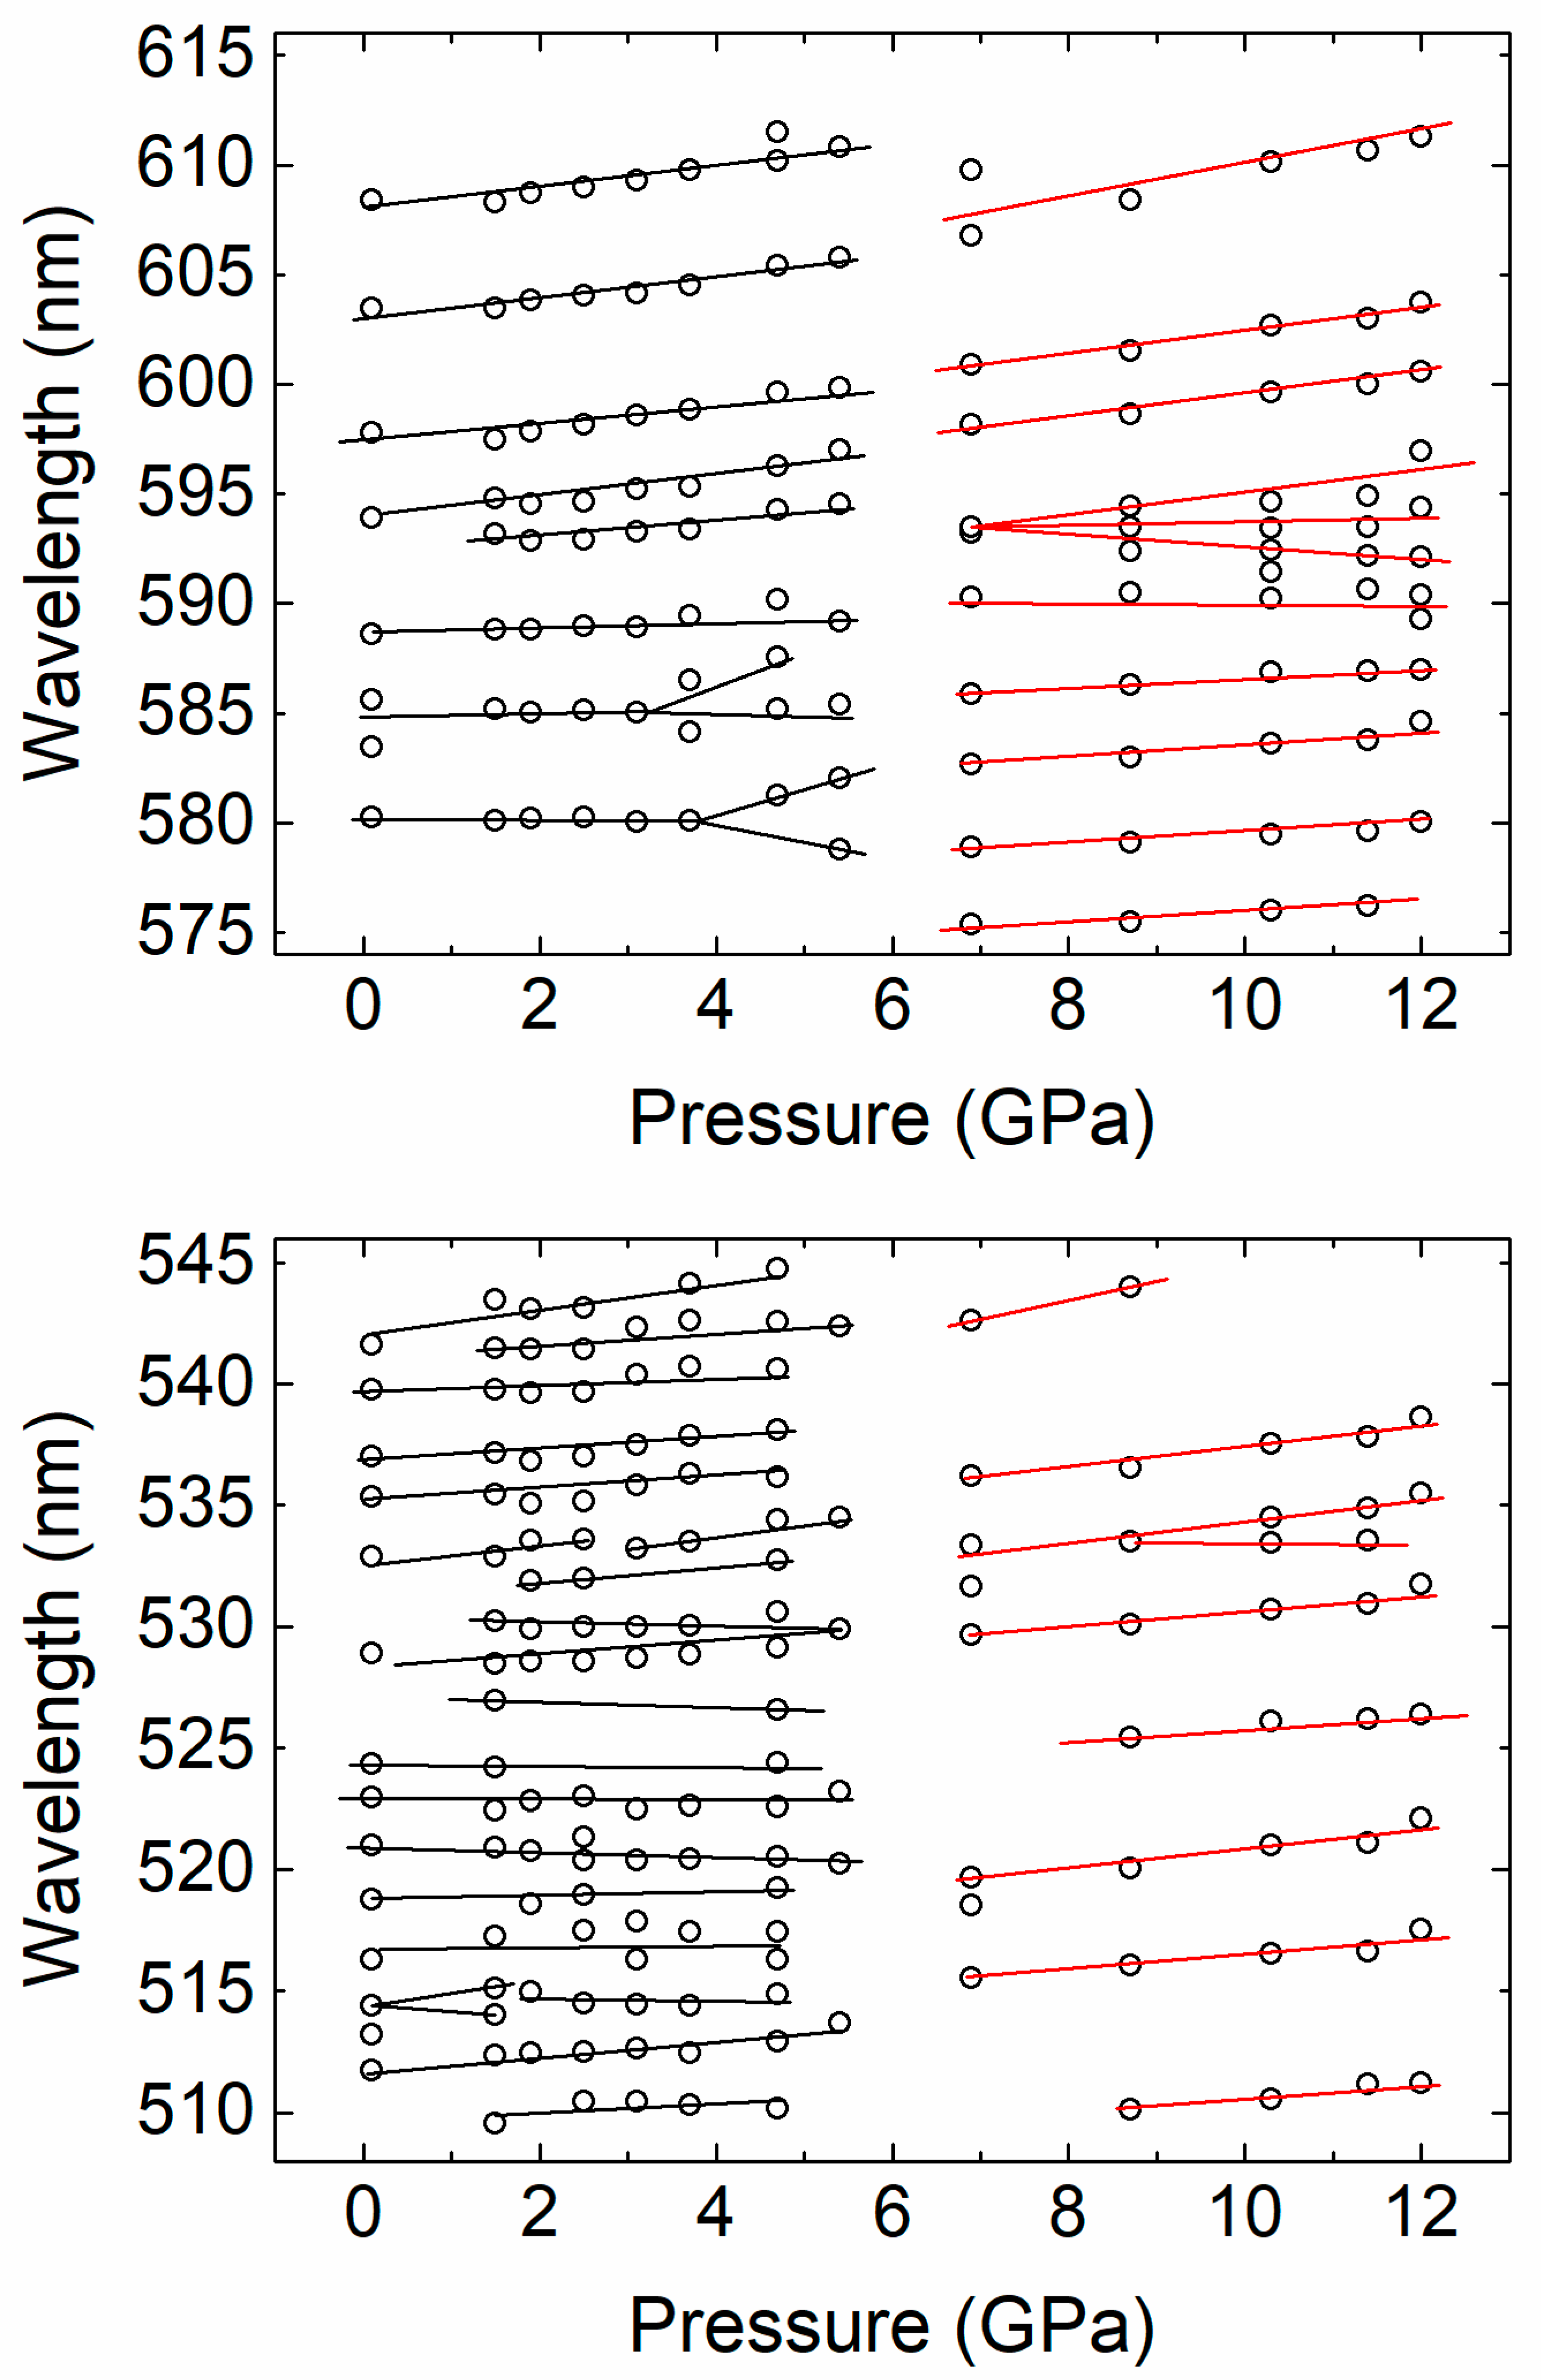
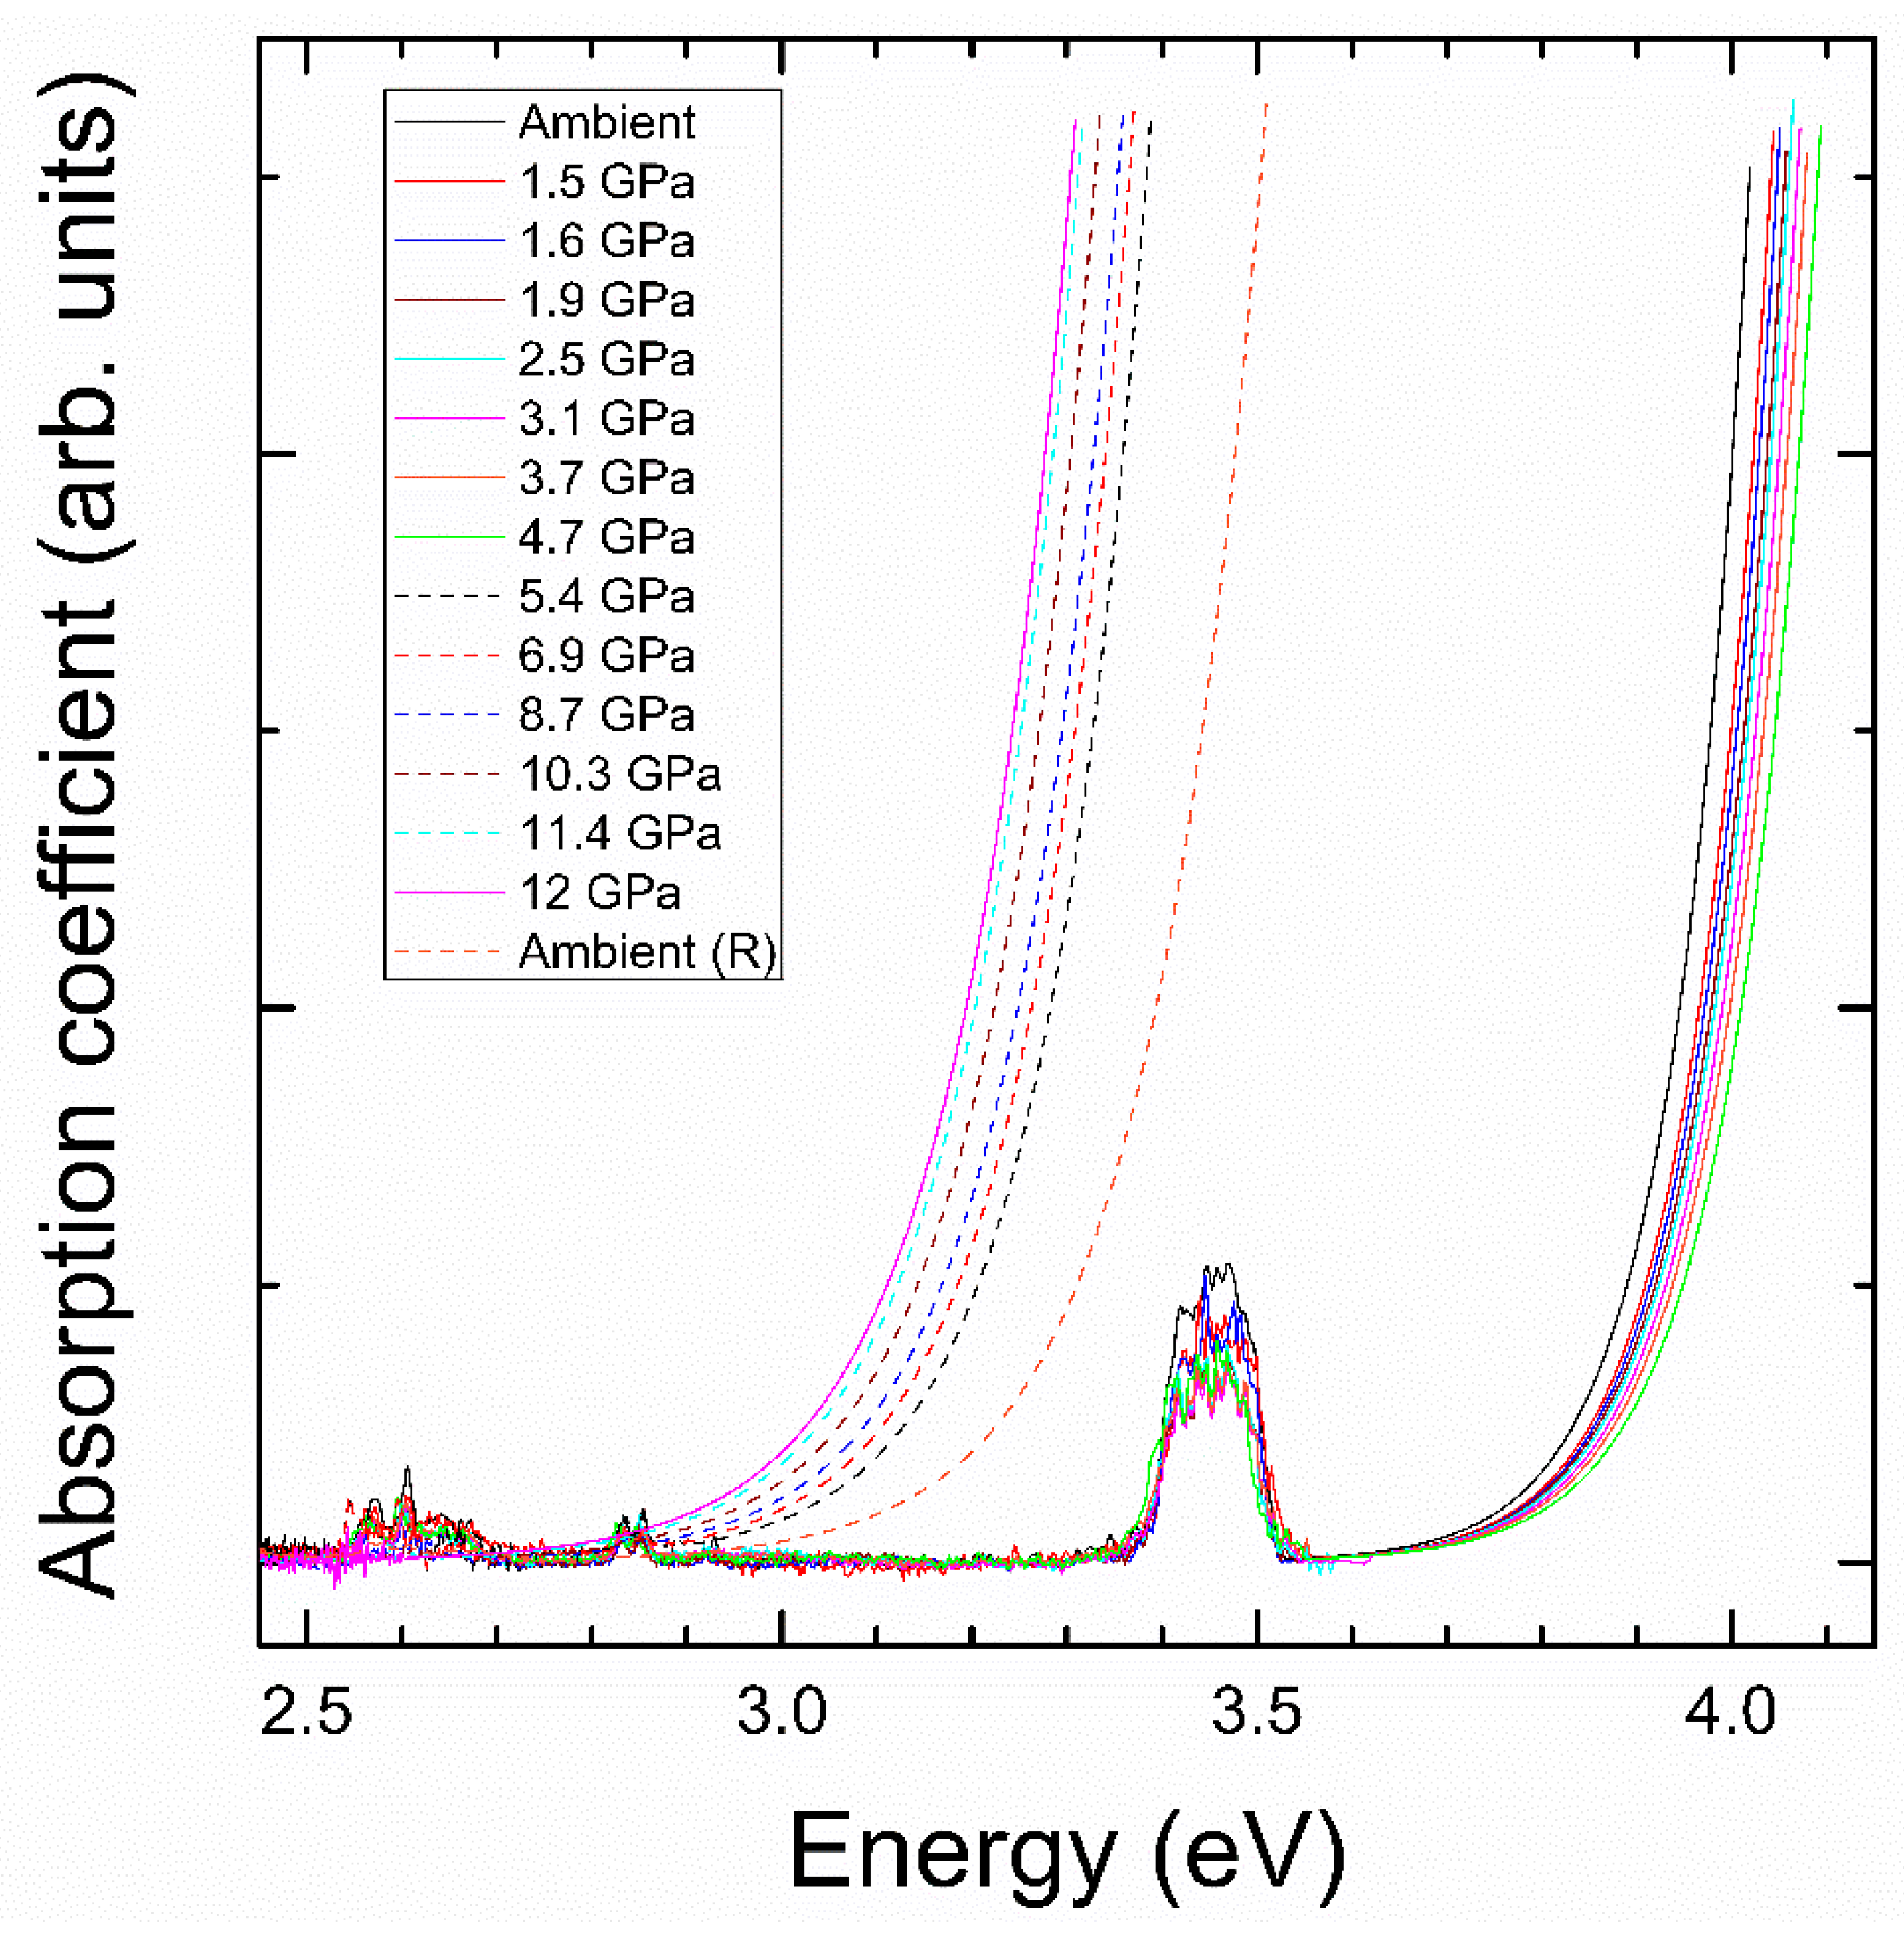
3.2. High-Pressure Studies

We will now present the results from HP experiments. In Figure 4, we show the high-energy portion of the absorption spectrum, which we will use first to discuss the effect of pressure on the band gap. Afterwards, we will focus on the influence of pressure on the absorptions related to Nd3+. These results will be correlated with the information known on the HP behavior of the crystal structure and Raman modes of NdVO4 [13,14,15,16]. The first phenomenon we observe is that the absorption edge gradually blue-shifts from ambient pressure to 4.7 GPa. In particular, we found that in this range of pressure Egap increases from 3.72(2) eV to 3.79(2) eV. The shape of the absorption edge does not change with pressure, which indicates that the band gap remains a direct one. This result is in good agreement with the report by Panchal et al. [11]. In Figure 5, we present the pressure dependence of Egap and compare it with the literature [11]. Both experiments show a linear increase of Egap, which is a consequence of the increase of the repulsion of bonding and anti-bonding states as the V-O distances of the VO4 tetrahedron are reduced upon compression [13].
At 5.4 GPa we found an abrupt decrease of Egap. This can be seen in Figure 4 by the sudden red-shift of the absorption edge when moving from 4.7 to 5.4 GPa. This corresponds to a decrease of the band gap from 3.79(2) eV to 3.17(2) eV. This fact is indicative of the occurrence of a phase transition. From 5.4 up to 12 GPa, the absorption edge gradually red-shifts, with no indication of the existence of a second phase transition. Upon decompression, the transition is found to be irreversible in our experiment, being Egap = 3.26(2) eV at ambient pressure in the recovered sample. According to the literature, the observed transition can be either from zircon to scheelite or monazite [13,14,15,16]. In order to clarify this issue, we have carried out a Raman experiment at 6.9 GPa. The results are shown in Figure 2. For the scheelite phase, according to group theory, 13 Raman-active modes are expected (3Ag + 5Bg + 5Eg) [36]. For the monazite phase, 36 Raman-active modes are expected (18Ag + 18Bg) [14]. The difference in number of modes is very noticeable in the high-frequency region, where scheelite has a very characteristic feature with only three modes. In our experiment, the Raman spectrum has manifestly more than thirteen peaks. In addition, it very much resembles the Raman spectrum associated to monazite-type NdVO4 by Panchal et al. [14]. Therefore, the changes observed in the absorption spectrum are likely to be triggered by the occurrence of the zircon–monazite transition. This is a first-order reconstructive transition that involves a volume collapse and an increase in the coordination number of Nd from 8 to 9. In the HP monazite phase, Nd is surrounded by nine oxygens forming NdO9 pentagonal interpenetrating tetrahedral units, while in zircon Nd has eight neighboring oxygens forming NdO8 dodecahedral units.
From the absorption spectra shown in Figure 4 we obtained the pressure dependence of Egap, using the same procedure to determine it at ambient pressure. The results are shown in Figure 5 and compared with those reported by Panchal et al. [11]. For the zircon-type phase we obtained a very similar linear pressure dependence. In our case dEgap/dP = 11.2(9) meV/GPa. In the figure, the abrupt collapse of the band gap from 4.7 to 5.4 GPa can be seen, which is associated to the zircon–monazite transition. This transition involves a collapse of the volume, a lowering of the crystal symmetry, and a distortion of the VO4 tetrahedron [16]. These changes of the crystalline structure are reflected in the electronic structure of NdVO4, producing the above described collapse of Egap. Notice that the variation of the electronic band gap is much more rapid and sharp than the changes observed in the Raman and XRD experiments, suggesting that optical experiments at the intrinsic absorption edge are more accurate for the determination of the transition pressures. This is because the electronic properties are much more sensitive than the structural and vibrational properties to the influence of pressure. A small change in the crystal structure can induce large changes in the band structure and consequently in the electronic properties. In our case, the band-gap collapse at the transition is 0.1 eV larger than in previous experiments [11].
After the phase transition, the band gap follows a linear behavior but red-shifts under compression with a rate dEgap/dP = 19.5(9) meV/GPa. The HP monazite phase remains stable up to 12 GPa, the highest pressure covered by our experiments. Notice that we did not find evidence of the second transition reported by Panchal et al. [11]. However, we observed the formation of cracks in the crystal at 12 GPa, which allowed the diffusion of light and precluded the performance of accurate experiments at higher pressure. We consider the formation of cracks a possible precursor effect of the second transition reported by Panchal et al. [11] at 11. 4 GPa [37], which could be triggered at a lower pressure than in our experiment because of the use of a thicker crystal, causing the bridging of the crystal between diamonds [23]. Interestingly, we found that after releasing pressure, our samples remain in the HP phase. This allows us to determine the band gap of the metastable monazite-type polymorph at ambient pressure, with Egap = 3.26(2) eV. This value is probably more suitable for many photocatalytic applications than that of zircon-type NdVO4. The red-shift of the band gap in the HP phase is consistent with the results obtained for monazite-type LaVO4 [18]. The explanation for the closing of the gap with pressure in monazite (in contrast to the opening of the gap in zircon) comes from the contribution of Nd 4f and 5d orbitals to the bottom of the conduction band in monazite NdVO4. These states are much more localized than O 2p and V 3d states. As a consequence, the bottom of the conduction band does not shift with pressure, but the top of the valence band moves toward higher energies, causing the observed band gap decrease.
We will comment now on the absorption bands related to Nd3+. In Figure 4, it can be seen that at the phase transition the absorption band around 359 nm (A1 in Figure 3) assigned to 4I9/2 to 4G11/2 disappears because the band gap of the HP phase is at a lower energy (longer wavelength). In the low-pressure zircon phase, the effect of pressure on the A1–A8 absorption bands is qualitatively the same for all of them. We will therefore focus on bands A4 and A5 (4I9/2 to 4F9/2 and 4I9/2 to 4F5/2 transitions), two of the better resolved bands, to illustrate the pressure behavior of internal Nd3+ transitions. Their pressure dependence is shown in Figure 6. The absorption bands consist of several multiplets caused by the Stark splitting. In the low-pressure phase (pressure ≤ 4.7 GPa), there are no qualitative changes as pressure increases. Basically, the absorption bands show the typical red shift which can be attributed to an increase of the covalence in NdVO4 [37]. The position of each of the identified peaks as function of pressure is presented in Figure 7. The behavior is qualitatively similar to related oxides doped with Nd3+ or other lanthanides [17,18,38,39]. In particular, our results suggest that the increase of the crystal field interaction with pressure in NdVO4 is qualitatively similar to that of isomorphic Nd-doped YVO4 [38].
It is noteworthy that, for pressures below the phase transition, some band splitting and merging is present in the 1.5–3.8 GPa range. This may be caused by the well-established distortion of the NdO8 tetrahedron under high-pressure conditions [16]. For pressures higher than 4.7 GPa, the absorption bands are totally different, confirming the phase transition. The optical spectroscopy associated to Nd3+ is thus quite sensitive to pressure, proving also to be a very efficient tool for the detection of phase transitions. Again, the changes induced by pressure in the absorption spectra are not reversible upon decompression (see Figure 4). The changes of the absorption bands are consistent with the coordination change of Nd3+ at the zircon-monazite transition. In the HP monazite phase Nd3+ is coordinated by nine oxygen atoms forming a distorted polyhedron. As in the low-pressure phase, in the HP phase the absorption bands also mainly red shift under compression. However, the pressure shift is slightly reduced, which is caused by the decrease of the compressibility due to the density increase associated to the transition [16]. To conclude, we would like to add that in both phases we observed the splitting of some of the multiplets. We believe this is the results of enhancement of exchange interaction in Nd3+-Nd3+ pairs as pressure increases [18,40].

4. Conclusions

In this study, single crystals of NdVO4 where synthetized and characterized by XRD, UV–VIS absorption, and Raman spectroscopy at ambient conditions and at high pressure (up to 12 GPa). In particular, optical spectroscopy allowed a precise determination of the band-gap energy of NdVO4 (3.72(2) eV), which is found to be larger than that reported in previous studies. We compared the pressure evolution of the fundamental band-gap and of the absorption bands associated with transitions of Nd3+ energy levels. The shape of the fundamental absorption edge does not change with pressure and a phase transition around 5 GPa is evidenced by a sudden collapse of the band gap (∆Eg = −0.69 eV). These HP experiments are thus an accurate tool for establishing the band gap. On the other hand, the absorption bands of Nd3+ show a more gradual evolution but the phase transition is equally put in evidence by their reduced number in the high-pressure phase. The band-gap collapse near 5 GPa can be correlated to the well-known zircon–monazite transition of NdVO4. The transition is irreversible, as the HP phase could be recovered at ambient pressure, with a band gap of 3.26(2) eV. The obtained results have been compared with previous studies. We hope that these conclusions will contribute to deepening the understanding of the optical properties of NdVO4 and its behavior in high-pressure conditions.

Author Contributions

All authors contributed equally to this work; being all involved in experiments, analysis, interpretation of results, and writing of the manuscript.

Funding

This work was supported by the Spanish Ministry of Science, Innovation and Universities, the Spanish Research Agency, and the European Fund for Regional Development under grant MAT2016-75586-C4-1-P and by Generalitat Valenciana under grant Prometeo/2018/123 (EFIMAT). E. Bandiello thanks the Generalitat Valenciana for his postdoctoral contract (ValI+D, APOSTD2017).

Acknowledgments

The authors thank Erica Viviani (Department of Biotechnology, University of Verona) for the technical assistance in the synthesis of NdVO4 crystals.

Conflicts of Interest

The authors declare no conflict of interest.

References

  1. Fujimoto, Y.; Yanagida, T.; Yokota, Y.; Chani, V.; Kochurikhin, V.V.; Yoshikawa, A. Comparative study of optical and scintillation properties of YVO4, (Lu0.5Y0.5)VO4, and LuVO4 single crystals. Nucl. Instrum. Methods Phys. Res. A 2011, 635, 53–56. [Google Scholar] [CrossRef]
  2. Oshikiri, M.; Ye, J.; Boero, M. Inhomogeneous RVO4 Photocatalyst Systems (R = Y, Ce, Pr, Nd, Sm, Eu, Gd, Tb, Dy, Ho, Er, Tm, Yb, Lu). J. Phys. Chem. C 2014, 118, 8331–8841. [Google Scholar] [CrossRef]
  3. Wang, F.; Liu, X. Multicolor tuning of lanthanide-doped nanoparticles by single wavelength excitation. Acc. Chem. Res. 2014, 47, 1378–1385. [Google Scholar] [CrossRef]
  4. Errandonea, D.; Garg, A.B. Recent progress on the characterization of the high-pressure behaviour of AVO4 orthovanadates. Prog. Mater. Sci. 2018, 97, 123–169. [Google Scholar] [CrossRef]
  5. Palacios, E.; Evangelisti, M.; Sáez-Puche, R.; Dos Santos-García, A.J.; Fernández-Martínez, F.; Cascales, C.; Castro, C.; Burriel, R.; Fabelo, O.; Rodríguez-Velamazán, J.A. Magnetic structures and magnetocaloric effect in RVO4 (R = Gd, Nd). Phys. Rev. B 2018, 97, 214401. [Google Scholar] [CrossRef]
  6. Monsef, R.; Ghiyasiyan-Arani, M.; Salavati-Niasari, M. Utilizing of neodymium vanadate nanoparticles as an efficient catalyst to boost the photocatalytic water purification. J. Environ. Manag. 2019, 230, 266–281. [Google Scholar] [CrossRef]
  7. Xu, J.; Hu, C.; Liu, G.; Liu, H.; Du, G.; Zhang, Y. Synthesis and visible-light photocatalytic activity of NdVO4 nanowires. J. Alloy Compd. 2011, 509, 7968–7972. [Google Scholar] [CrossRef]
  8. Wu, X.; Tao, Y.; Dong, L.; Zhu, J.; Hu, Z. Preparation of Single-Crystalline NdVO4 Nanorods, and Their Emissions in the Ultraviolet and Blue under Ultraviolet Excitation. J. Phys. Chem. B 2005, 109, 11544–11547. [Google Scholar] [CrossRef]
  9. Dragomir, M.; Valant, M. Room-Temperature Synthesis and Optical Properties of NdVO4 Nanoneedles. Acta Chim. Slov. 2018, 65, 679–686. [Google Scholar] [CrossRef]
  10. Dragomir, M.; Arcon, I.; Gardonio, S.; Valant, M. Phase relations and optoelectronic characteristics in the NdVO4-BiVO4 system. Acta Mater. 2013, 61, 1126–1135. [Google Scholar] [CrossRef]
  11. Panchal, V.; Errandonea, D.; Segura, A.; Rodriguez-Hernandez, P.; Muñoz, A.; Lopez-Moreno, S.; Bettinelli, M. The electronic structure of zircon-type orthovanadates: Effects of high-pressure and cation substitution. J. Appl. Phys. 2011, 110, 043723. [Google Scholar] [CrossRef]
  12. Shur, J.W.; Kochurikhin, V.V.; Borisova, A.E.; Ivanov, M.A.; Yoon, D.H. Photoluminescence properties of Nd:YVO4 single crystals by multi-die EFG method. Opt. Mater. 2004, 26, 347. [Google Scholar] [CrossRef]
  13. Marqueño, T.; Monteseguro, V.; Cova, F.; Errandonea, D.; Santamaria-Perez, D.; Bandiello, E.; Bettinelli, M. High-pressure phase transformations in NdVO4 under hydrostatic, conditions: A structural powder x-ray diffraction study. J. Phys. Condens. Matter 2019, 31, 235401. [Google Scholar] [CrossRef]
  14. Panchal, V.; Errandonea, D.; Manjón, F.J.; Muñoz, A.; Rodríguez-Hernández, P.; Achary, S.N.; Tyagi, A.K. High-pressure lattice-dynamics of NdVO4. J. Phys. Chem. Solids 2017, 100, 126–133. [Google Scholar] [CrossRef]
  15. Panchal, V.; Errandonea, D.; Manjon, F.J.; Muñoz, A.; Rodriguez-Hernandez, P.; Bettinelli, M.; Achary, S.N.; Tyagi, A.K. High Pressure phase transitions in NdVO4. AIP Conf. Proc. 2015, 1665, 030006. [Google Scholar]
  16. Errandonea, D.; Popescu, C.; Achary, S.N.; Tyagi, A.K.; Bettinelli, M. In situ high-pressure synchrotron X-ray diffraction study of the structural stability in NdVO4 and LaVO4. Mater. Res. B 2014, 50, 279–284. [Google Scholar] [CrossRef]
  17. Errandonea, D.; Tu, C.; Jia, G.; Martın, I.R.; Rodrıguez-Mendoza, U.R.; Lahoz, F.; Torres, M.E.; Lavın, V. Effect of pressure on the luminescence properties of Nd3+ doped SrWO4 laser crystal. J. Alloy Compd. 2008, 451, 212–214. [Google Scholar] [CrossRef]
  18. Muñoz-Santiuste, J.E.; Lavín, V.; Rodríguez-Mendoza, U.R.; Ferrer-Roca, Ch.; Errandonea, D.; Martínez-García, D.; Rodríguez-Hernández, P.; Muñoz, A.; Bettinelli, M. Experimental and theoretical study on the optical properties of LaVO4 crystals under pressure. Phys. Chem. Chem. Phys. 2018, 20, 27314–27328. [Google Scholar] [CrossRef]
  19. Feigelson, R. Flux Growth of Type RVO4 Rare-Earth Vanadate Crystals. J. Am. Ceram. Soc. 1968, 51, 538–539. [Google Scholar] [CrossRef]
  20. Garton, G.; Smith, S.; Wanklyn, B.M. Crystal Growth from the Flux Systems PbO-V2O5 and Bi2O3-V2O5. J. Cryst. Growth 1972, 13–14, 588–592. [Google Scholar] [CrossRef]
  21. Wanklyn, B.M. Two New Flux Systems, PbO-V2O5 and Bi2O3-V2O5. Part I. J. Cryst. Growth 1970, 7, 368–370. [Google Scholar] [CrossRef]
  22. Smith, S.H.; Wanklyn, B.M. Flux Growth of Rare Earth Vanadates and Phosphates. J. Cryst. Growth 1974, 21, 23–28. [Google Scholar] [CrossRef]
  23. Segura, A.; Sanz, J.A.; Errandonea, D.; Martinez-Garcia, D.; Fages, V. High conductivity of Ga-doped rock-salt ZnO under pressure: Hint on deep-ultraviolet-transparent conducting oxides. Appl. Phys. Lett. 2006, 88, 011910. [Google Scholar] [CrossRef]
  24. Lacomba-Perales, R.; Errandonea, D.; Segura, A.; Ruiz-Fuertes, J.; Rodriguez-Hernandez, P.; Radescu, S.; Lopez-Solano, J.; Mujica, A.; Munoz, A. A combined high-pressure experimental and theoretical study of the electronic band-structure of scheelite-type AWO4 (A = Ca, Sr, Ba, Pb) compounds. J. Appl. Phys. 2011, 110, 043703. [Google Scholar] [CrossRef]
  25. Klotz, S.; Chervin, J.-C.; Munsch, P.; Le Marchand, G. Hydrostatic limits of 11 pressure transmitting media. J. Phys. D Appl. Phys. 2009, 42, 075413. [Google Scholar] [CrossRef]
  26. Errandonea, D.; Muñoz, A.; Gonzalez-Platas, J. Comment on “High-pressure x-ray diffraction study of YBO3/Eu3+, GdBO3, and EuBO3: Pressure-induced amorphization in GdBO3”. J. Appl. Phys. 2014, 115, 216101. [Google Scholar] [CrossRef]
  27. Mao, H.K.; Xu, J.; Bell, P.M. Calibration of the ruby pressure gauge to 800 kbar under quasi-hydrostatic conditions. J. Geophys. Res. 1986, 91, 4673. [Google Scholar] [CrossRef]
  28. Piermarini, G.J.; Block, S.; Barnett, J.D. Hydrostatic limits in liquids and solids to 100 kbar. J. Appl. Phys. 1973, 44, 5377. [Google Scholar] [CrossRef]
  29. Chakoumakos, B.C.; Abraham, M.M.; Boatner, L.A. Crystal Structure Refinements of Zircon-Type MVO4 (M = Sc, Y, Ce, Pr, Nd, Tb, Ho, Er, Tm, Yb, Lu). J. Solid State Chem. 1994, 109, 197–202. [Google Scholar] [CrossRef]
  30. Santos, C.C.; Silva, E.N.; Ayala, A.P.; Guedes, I.; Pizani, P.S.; Loong, C.-K.; Boatner, L.A. Raman investigations of rare earth orthovanadates. J. Appl. Phys. 2007, 101, 053511. [Google Scholar] [CrossRef]
  31. Nguyen, A.-D.; Murdoch, K.; Edelstein, M.; Boatner, L.A.; Abraham, M.M. Polarization dependence of phonon and electronic Raman intensities in PrVO4 and NdVO4. Phys. Rev. B 1997, 56, 7974–7987. [Google Scholar] [CrossRef]
  32. Errandonea, D.; Martínez-García, D.; Lacomba-Perales, R.; Ruiz-Fuertes, J.; Segura, A. Effects of high pressure on the optical absorption spectrum of scintillating PbWO4 crystals. Appl. Phys. Lett. 2006, 89, 091913. [Google Scholar] [CrossRef]
  33. Botella, P.; Errandonea, D.; Garg, A.B.; Rodriguez-Hernandez, P.; Muñoz, A.; Achary, S.N.; Vomiero, A. High-pressure characterization of the optical and electronic properties of InVO4, InNbO4, and InTaO4. SN Appl. Sci. 2019, 1, 389. [Google Scholar] [CrossRef]
  34. Hakeem, M.A.; Jackson, D.E.; Hamlin, J.J.; Errandonea, D.; Proctor, J.E.; Bettinelli, M. High Pressure Raman, Optical Absorption, and Resistivity Study of SrCrO4. Inorg. Chem. 2018, 57, 7550–7557. [Google Scholar] [CrossRef]
  35. Carnall, W.T.; Crosswhite, H. Energy Level Structure and Transition Probabilities in the Spectra of the Trivalent Lanthanides in LaF3; Technical Report ANL-78-XX-95; Argonne National Lab.: Argonne, IL, USA, 1978. [CrossRef]
  36. Manjón, F.J.; Rodríguez-Hernández, P.; Muñoz, A.; Romero, A.H.; Errandonea, D.; Syassen, K. Lattice dynamics of YVO4 at high pressures. Phys. Rev. B 2010, 81, 075202. [Google Scholar] [CrossRef]
  37. Manjón, F.J.; Errandonea, D.; Segura, A.; Chervin, J.C.; Muñoz, V. Precursor effects of the Rhombohedral-to-Cubic Phase Transition in Indium Selenide. High Press. Res. 2002, 22, 261–266. [Google Scholar]
  38. Manjón, F.J.; Jandl, S.; Riou, G.; Ferrand, B.; Syassen, K. Effect of pressure on crystal-field transitions of Nd-doped YVO4. Phys. Rev. B 2004, 69, 165121. [Google Scholar] [CrossRef]
  39. Mahlik, S.; Grinberg, M.; Cavalli, E.; Bettinelli, M.; Boutinaud, P. High pressure evolution of YVO4:Pr3+ luminescence. J. Phys. Condens. Matter 2009, 21, 105401. [Google Scholar] [CrossRef]
  40. Rivera-Lopez, F.; Lavin, V. Upconversion/back-transfer losses and emission dynamics in Nd3+-Yb3+ co-doped phosphate glasses for multiple pump channel laser. J. Non-Cryst. Solids 2018, 489, 84–90. [Google Scholar] [CrossRef]
Figure 1. Powder XRD pattern measured in NdVO4. The dots are the experiment. The solid lines the refinement and residual. Ticks indicate the positions of Bragg peaks. The most intense peaks are labeled with their indexes. A picture of the grown crystals is show in the inset, showing their size and transparency. For reference, the squares are 1 × 1 mm.
Crystals 09 00237 g001
Figure 2. Raman spectrum of low-pressure zircon NdVO4 at ambient pressure (bottom) and high-pressure NdVO4 at 6.9 GPa (top). The modes of the zircon phase are identified.
Crystals 09 00237 g002
Figure 3. Optical-absorption of zircon-type NdVO4. The inset shows the high-energy region as a function of energy including the fir to the step fundamental absorption described in the text (red line).
Crystals 09 00237 g003
Figure 4. Optical-absorption NdVO4 at different pressures (indicated in the figure). The spectra assigned to the low(high)-pressure phase are represented with solid (dashed) lines.
Crystals 09 00237 g004
Figure 5. Pressure dependence of the band-gap energy of NdVO4. Circles (diamonds) correspond to the zircon (monazite) phase. Squares correspond to the post-monazite phase. Results from the present study are shown with solid symbols and results from the literature [11] are shown with empty symbols.
Crystals 09 00237 g005
Figure 6. Absorbance relative to the 4I9/2 to 4G11/2 and 4I9/2 to 4F9/2 transitions measured at room temperature at different pressures. The spectrum collected after pressure release is marked with (r). The spectra are plotted as function of wavenumber (top) and wavelength (bottom). They have been vertically shifted to facilitate comparison.
Crystals 09 00237 g006
Figure 7. Peak positions observed under pressure increase. Lines are a guide for the eye.
Crystals 09 00237 g007
Table 1. Frequencies (ω) in cm−1 of the Raman-active phonon modes at room conditions in NdVO4.
ModeωModeωModeω
Eg113(1)B1g244(1)B1g472(1)
B1g124(1)B2g261(1)B1g795(1)
Eg151(1)Eg374(1)Eg808(1)
Eg238(1)A1g381(1)A1g871(1)

