Article

Insight into the Optoelectronic and Thermoelectric Properties of Mn Doped ZnTe from First Principles Calculation

1
Department of Physics, Bacha Khan University, Charsadda 24420, KPK, Pakistan
2
Faculty of Engineering and Applied Sciences, Department of Physics, RIPHAH International University I-14 Campus, Islamabad 44000, Pakistan
3
Department of Physics, The University of Lahore, Sargodha Campus 40100, Pakistan
4
Condensed Matter Physics Lab, Department of Physics, The Women University, Multan 66000, Pakistan
5
Laser Matter Interaction and Nanosciences Lab, Department of physics, University of Agriculture Faisalabad, Faisalabad 38040, Pakistan
6
Institute of Optoelectronics and Measuring Systems, Electrical Engineering Department, Czestochowa University of Technology, Armii Krajowej 17, 42-201 Czestochowa, Poland
*
Author to whom correspondence should be addressed.
Crystals 2019, 9(5), 247; https://doi.org/10.3390/cryst9050247
Submission received: 2 April 2019 / Revised: 23 April 2019 / Accepted: 7 May 2019 / Published: 13 May 2019
(This article belongs to the Special Issue First-Principles Prediction of Structures and Properties in Crystals)

Abstract

:
Using DFT band structure simulations together with semi-classical Boltzmann transport kinetics equations, we have explored the optoelectronic and transport features of MnxZn1−xTe (x = 8% and 16%) crystals. Optimization of the doping and related technological processes it is extremely important for optimization of the technological parameters. The Generalized Gradient Approximation is applied to compute the corresponding band structure parameters. We have applied the Generalized Gradient Approximation Plus U (GGA+U). We have demonstrated that MnxZn1−xTe (x = 8% and 16%) is a direct type band semiconductor with principal energy gap values equal to 2.20 and 2.0 eV for x = 8% and 16%, respectively. The energy gap demonstrates significant decrease with increasing Mn content. Additionally, the origin of the corresponding bands is explored from the electronic density of states. The optical dispersion functions are calculated from the spectra of dielectric function. The theoretical simulations performed unambiguously showed that the titled materials are simultaneously promising optoelectronic and thermoelectric devices. The theoretical simulations performed showed ways for amendment of their transport properties by replacement of particular ions.

Graphical Abstract

1. Introduction

It is well known that the pure ZnTe, crystals are direct type semiconductors (with Eg = 2.26 eV). More importantly, due to specific electronic and phonon features these materials have abundant potential for thermoelectric and optoelectronic applications [1,2,3,4]. Moreover, recently, ZnTe was doped by different transition metals that caused a huge attention due to their attractive magnetic properties, high fluorescence and structural compatibility with II–VI semiconductors and some essential III–V semiconductors, for example, GaAs [5,6,7,8,9,10,11]. In 2010, Mn-doped ZnTe was proposed due to its good theoretical band gap [12,13]. Thus, it can be used as a spintronic material and for studies of its magnetic properties.
For practical applications, the existence and optimization of the existing technology is a very hot topic. However, without reliable band structure parameters it is not possible to predict the ways in which the technology will further improve.
Addition of the transition metals opens a rare opportunity to vary their optoelectronic and thermal features in the desired directions. This is caused by a high flexibility of the 3d TM orbitals effectively interacting with the p orbitals of the anionic dopants. Many of them possess the localized d-states within the energy gap. Very interesting is use of ZnTe for the fabrication of green LED (light emitting diodes) [14] and various devices like THz emitters and detectors. The principal parameters are determined by the valence band state features originating from p Te states and their coordination by the cationic environment possessing space localized d-states. Today the main detectors in the visible spectral rage are based on Si. However, the band dispersion near the top of the valence band with respect to the bottom of conduction band is not very suitable for such applications. Conversely, the ZnTe has a suitable band energy gap and relatively high quantum efficiency. However, a strong density-functional theory (DFT) band structure calculation is absent, and most of the research in this direction are based on the oversimplified models without the band structure dispersion in k-space. Therefore, focusing on studies on ZnTe band dispersion and its changes after d-states doping is extremely important for the design of optoelectronic and thermoelectric devices of photodetectors [15].
Among a lot of technological approaches for thin-film ZnTe production, like molecular beam epitaxy, thermal vacuum evaporation, vapor phase epitaxy, physical vapor transport, hot wall evaporation, metallic--organic vapor phase epitaxy and electrodeposition [16,17,18,19,20,21,22,23,24,25], it is clear that the only way to amend these methods is knowledge about the principal changes of the hyperfine band structure after doping by 3d elements, and the origin of electronic states. In several works [26,27], the optoelectronic features of ZnX (X = O, S, Se, Te) have been studied within a framework of a DFT approach. However, the influence of doping has not been explored yet.
The goal of our manuscript is to study the effect of Mn impurities on optical and thermoelectric properties. Using first principles, and the total energy method, we have firstly applied the Generalized Gradient Approximation (GGA) in order to study the MnxZn1−xTe (x = 8% and 16%) band structure dispersion. It is shown that, indicates that GGA method is not enough get the exit gap therefore we have included a Hubbard-like contribution of the Mn d states, according to the so-called Generalized Gradient Approximation Plus U (GGA+U) is able to open the big band gap.
Following the reasons presented above in the present work we present studies of the band structure for the ZnTe single crystals doped by Mn using the first principle DFT method for the bulk material of MnxZn1−xTe (x = 8% and 16%), The results obtained may be very useful for the further materials engineering optimization of the technological doping processes to achieve enhanced optoelectronic and thermoelectric features.

2. DFT Calculation Technique

MnxZn1−xTe (x = 8% and 18%) possesses tetragonal symmetry. The basic lattice unit cell structures are depicted in Figure 1. We have applied the Full Potential Linear Augmented Plane wave method (FP-LAPW) method and at the beginning we optimized the initial structures within a framework of the one-electron WIEN2k package. GGA+U was used to evaluate the band electronic structure dispersion and the related optical function dispersion of the titled MnxZn1−xTe (x = 8% and 16%) materials.
We extended the primitive cell of ZnTe to 2 × 2 × 2 supercell containing 32 atoms (Zn and Te contains both 16 atoms), and used the supercell to simulate Mn doped systems. For the Mn doped ZnTe, one Zn atom substitutes for one/two (8/16 %) Zn, and denoted such systems as MnxZn1−xTe (x = 8% and 18%). For the MnxZn1−xTe (x = 8% and 18%) the muffin tin (MT) spheres radii were assumed to be equal to 1.8 and 2.0 Bohr, respectively. The values used for plane cutoff and harmonic expansion were lmax = 10 and RMTKmax = 8.0. The condition for the energy convergence in the self-consistent iteration was set to be equal to about 0.00001 eV. BoltzTrap code (which works with constant relaxation time) was used to calculate thermoelectric Seebeck coefficient, power factor, electrical and thermal conductivities using semi classical Boltzmann transport theory, based on the electronic band structure.

3. Results and Discussion

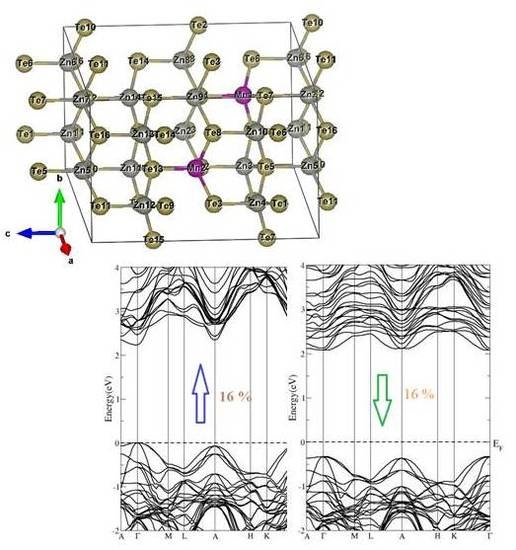
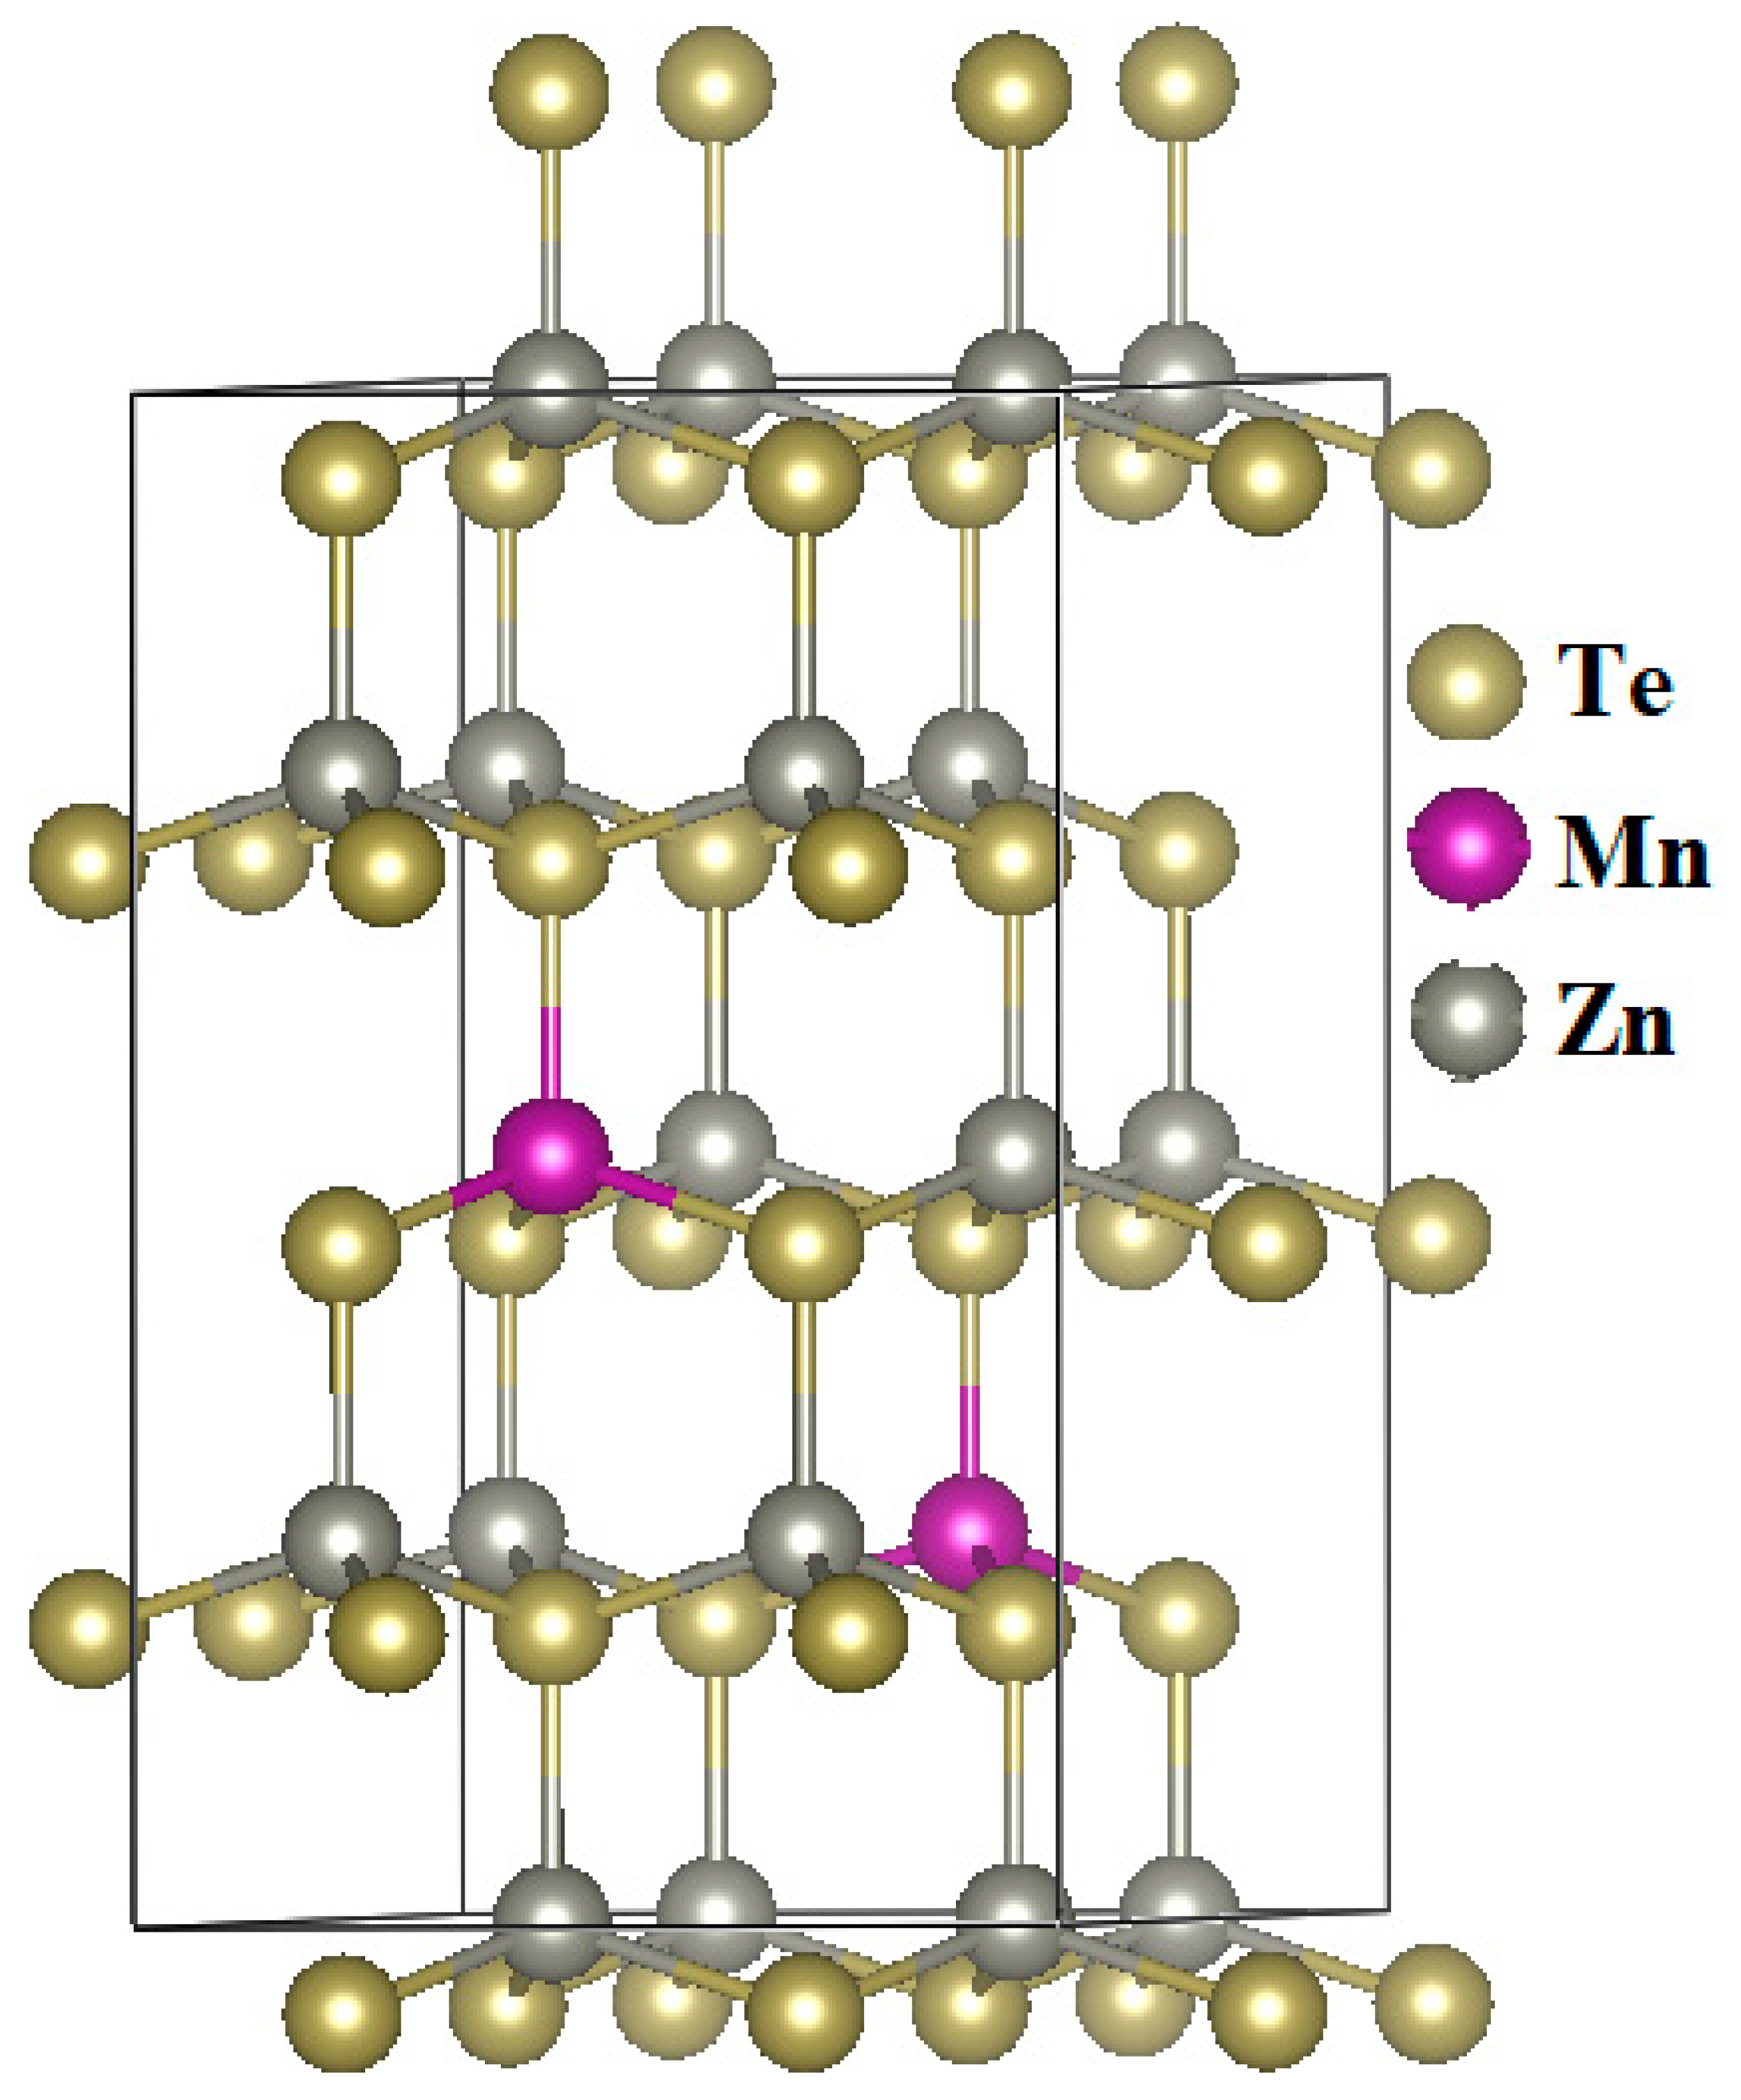
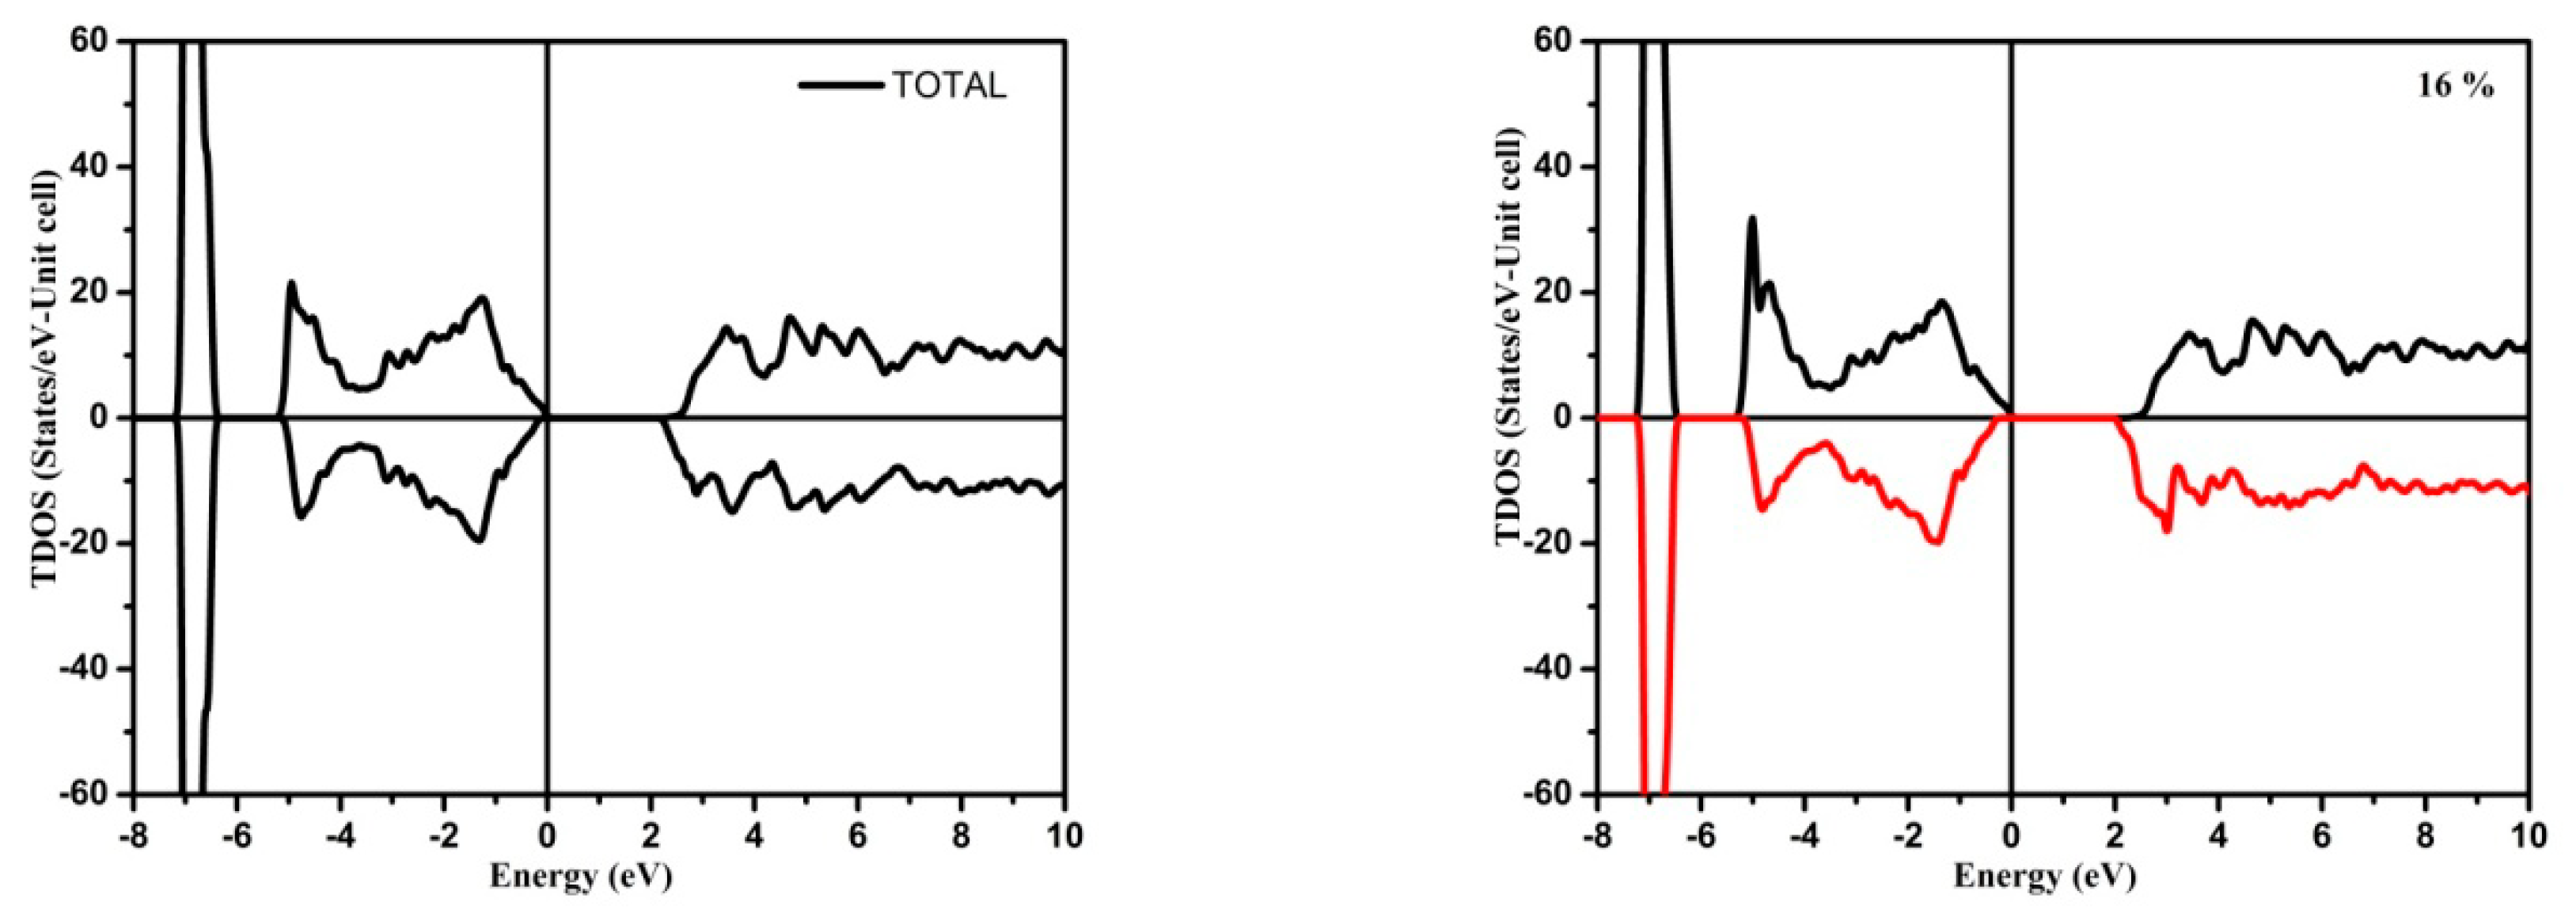
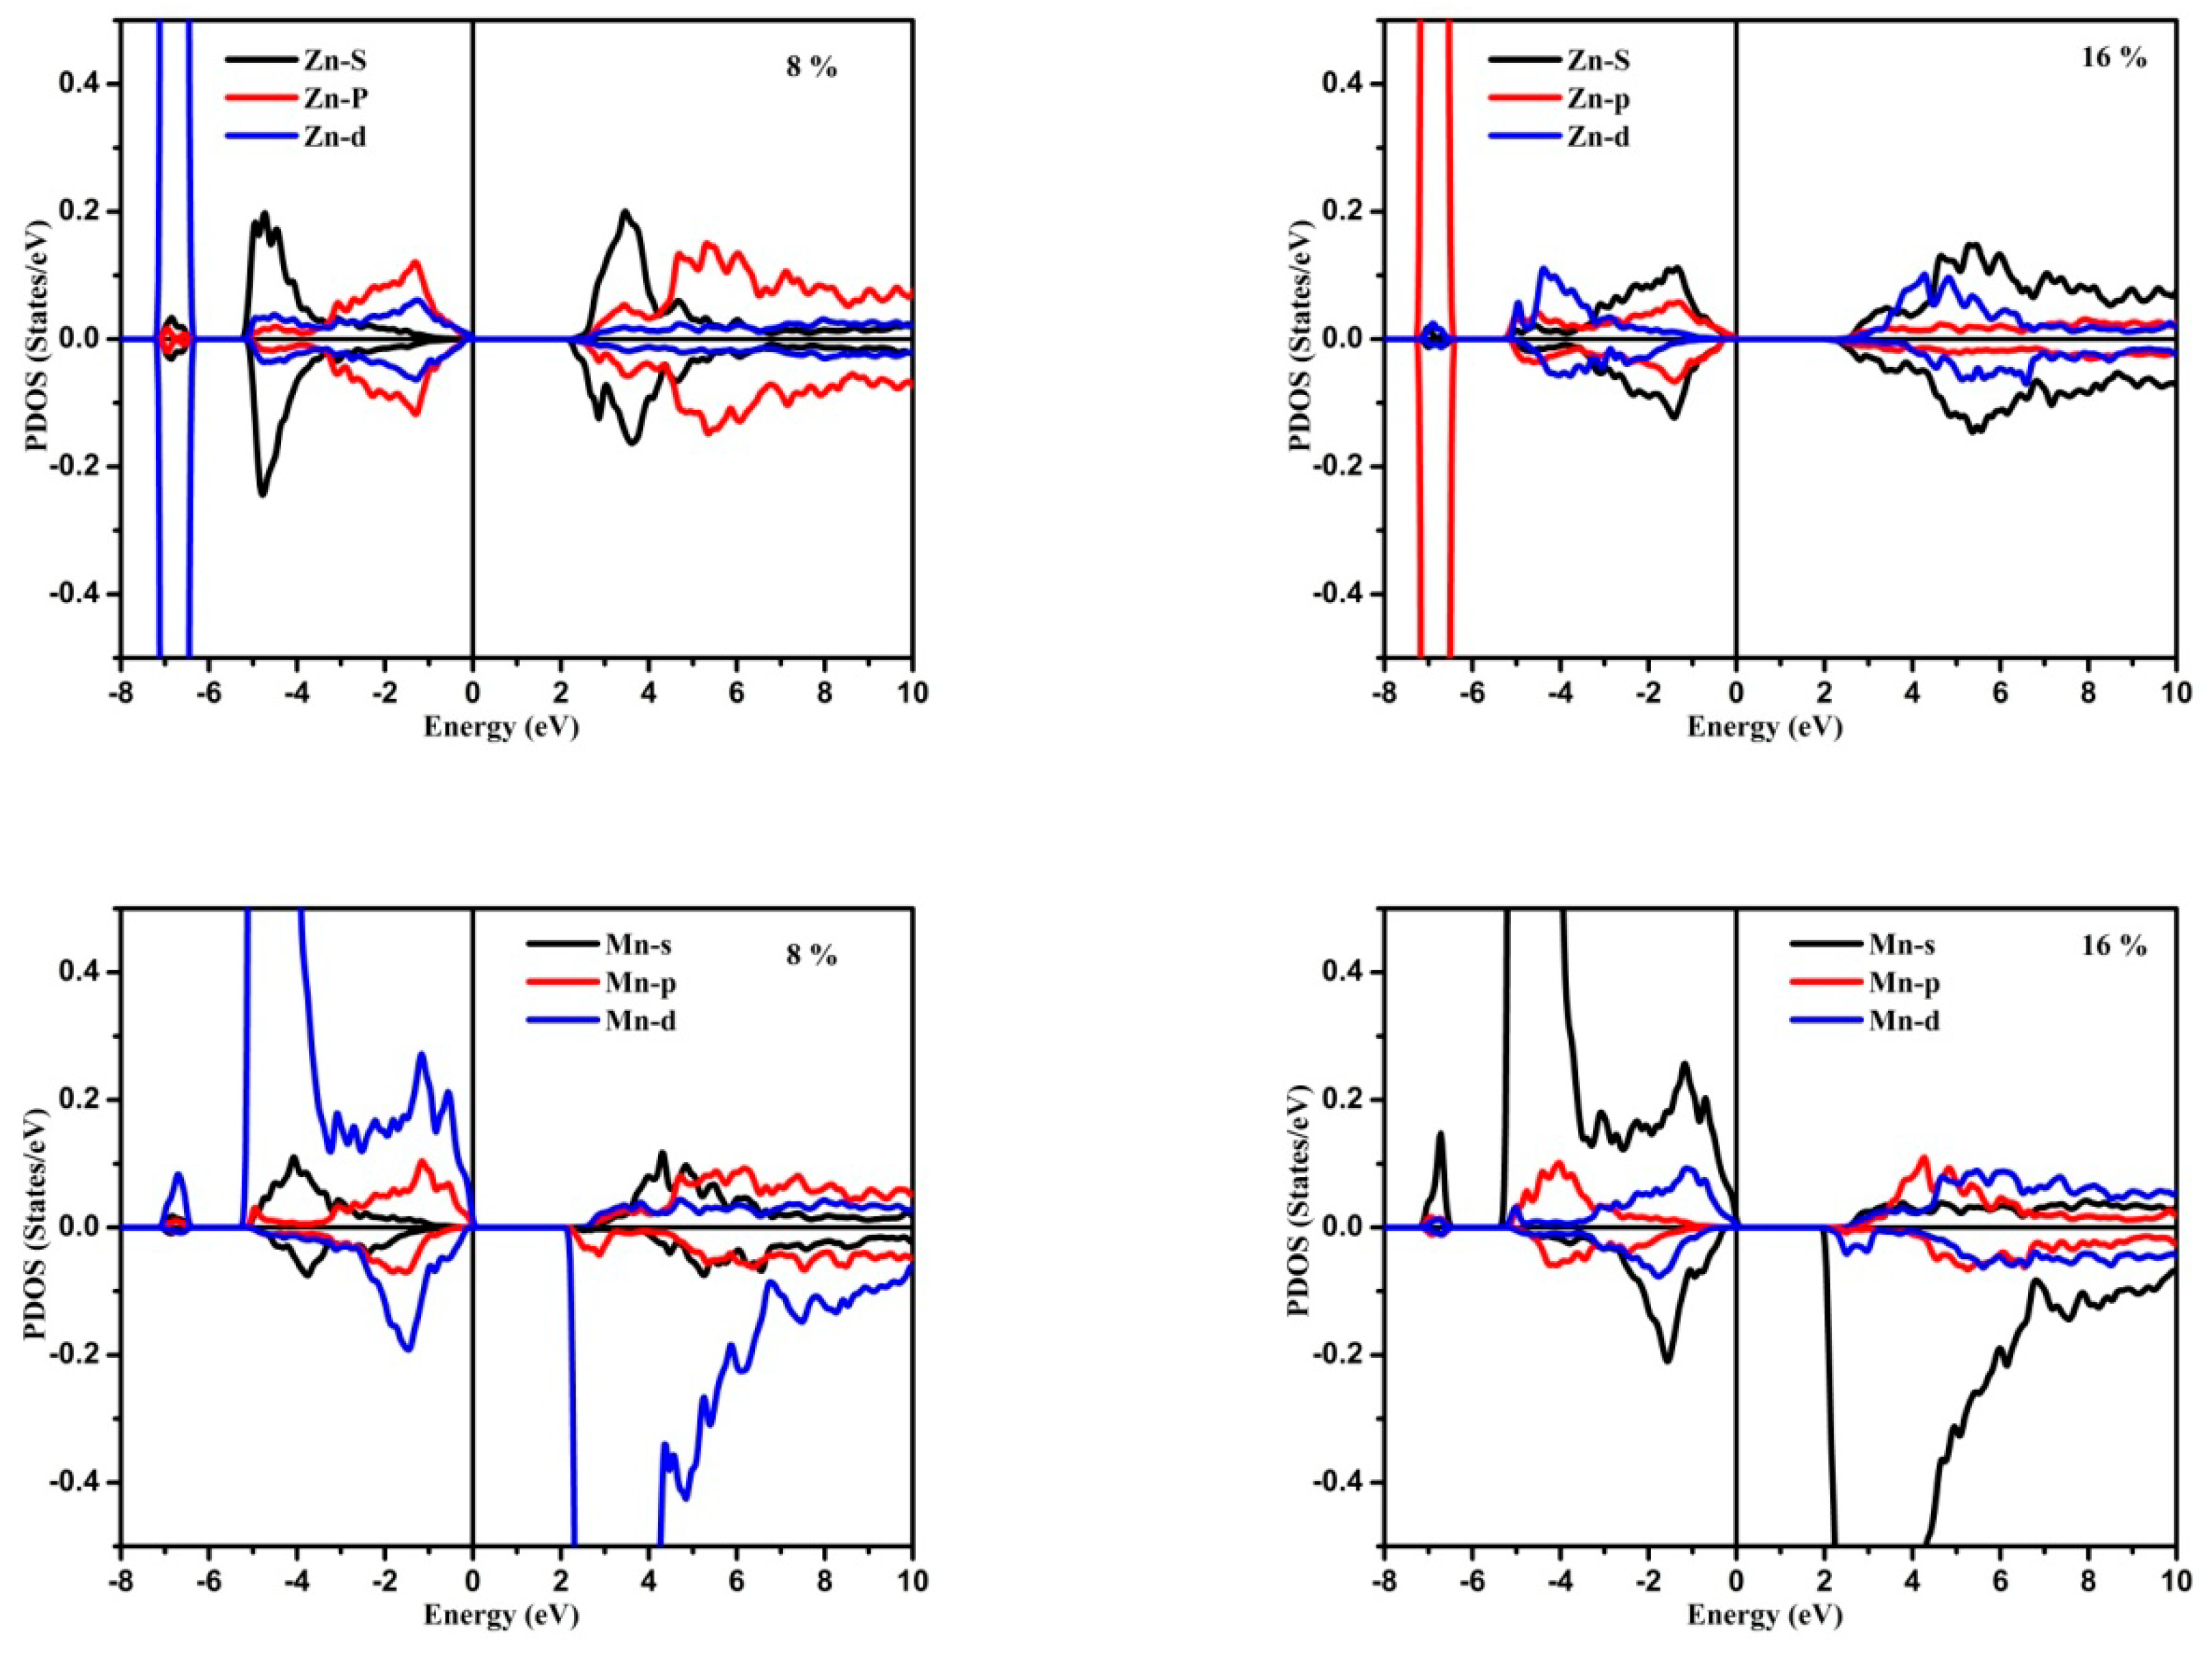
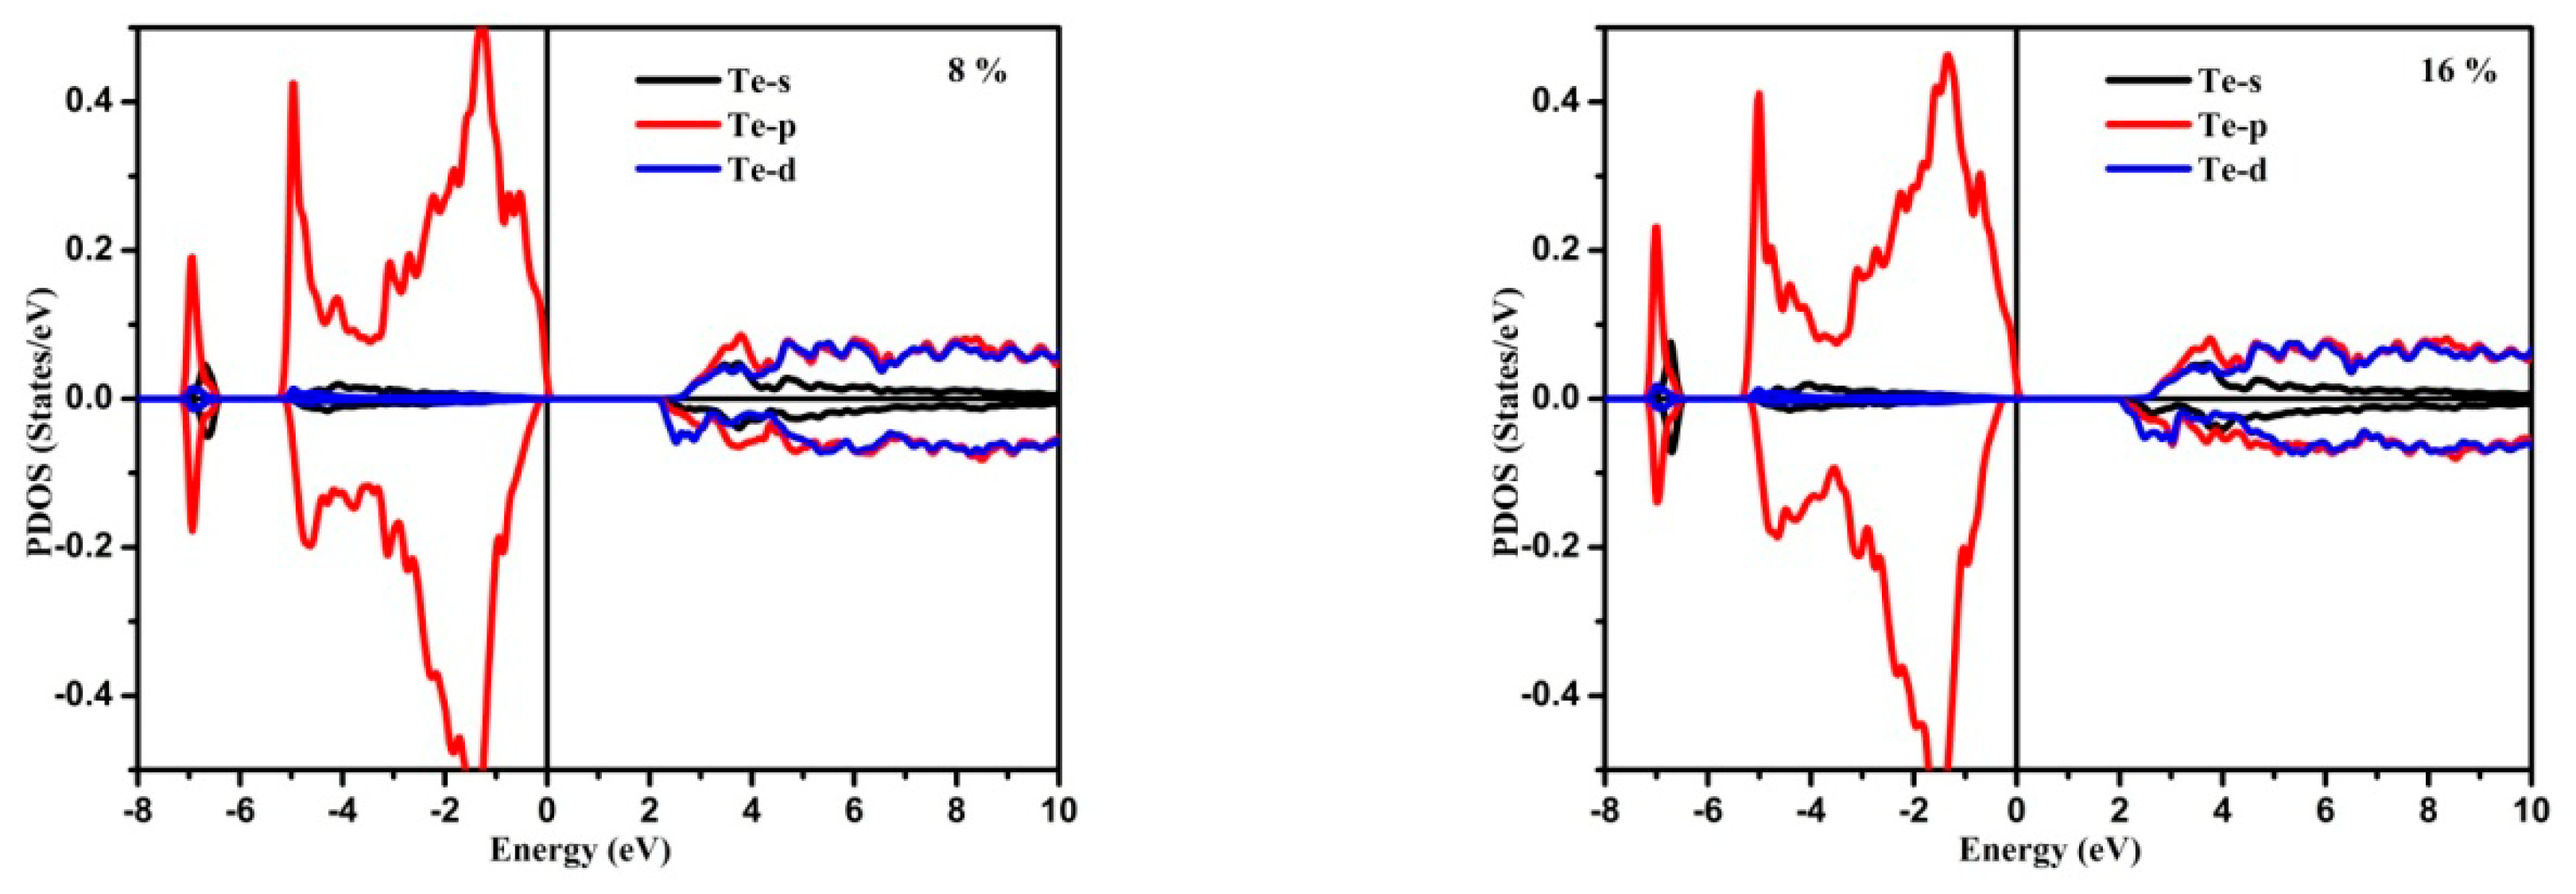
3.1. Electronic Structure

Using the modified Becke Johnson (mBJ) potential for high symmetry points [A→Γ→M→L→A→H→K→Γ] of the irreducible Brillouin zone (BZ), the electronic band energy diagrams for Up and Down states of MnxZn1−xTe (x = 8% and 16%) are depicted in the Figure 2. The spin-polarized calculations have been performed, in which the majority and minority spin electrons were treated separately. We applied the Generalized Gradient Approximation Plus U (GGA+U). Here the Fermi level is indicated by dashed line separating the valance band maximum and conduction band minimum.
It is obvious that these crystals have different band dispersion in the k-space. From the band structure, it was established that all the titled compounds were direct band semiconductors with energy band gap magnitudes equal to 2.20 and 2.0 eV for MnxZn1−xTe (x = 8% and 16%), respectively. These calculated band gap values were in sufficiently good agreement with the experimental values calculated from UV-vis diffuse reflectance spectra.
For all the band structures, principal contributions to the valance band minimum originated from 3d orbitals of Mn and p Zn orbitals, while the unoccupied states originated from 3p orbitals of S with a small admixture of other states of different atoms.
The spin polarized total density of states (TDOS) and partial density of states (PDOS) in a wide energy range is extended within −12.0 eV ~ 14.0 eV for the electronic states of MnxZn1−xTe (x = 8% and 16%) compounds depicted in the Figure 3 and Figure 4. We saw only minor changes at the conduction band minimum for both percentages.
Following Figure 3, it is clear that for the 8% doped crystal the density of states (DOS) is comparable to the 16% doped crystals. Also, the energy separation between occupied and unoccupied states was established to be higher for 8% with respect to 16%.
The (PDOS) for the electronic states of MnxZn1−xTe (x = 8% and 16%) can be subdivided into three separate energy regions. For the compounds MnxZn1−xTe (x = 8% and 16%), a major contribution is s orbitals of Te with a small admixture coming from Zn s/p/d. For an energy interval extending within −7.2 … 6.5 eV, the PDOS, for the compounds MnxZn1−xTe (x = 8% and 18%) had a major contribution due to d and p originated Zn band states, along with the small contribution Te-p and Mn-s atoms.
In Mn, doped ZnTe Mn-s/p/d stats played a crucial role for reported energy range (−4.0–4.0 eV). A strong hybridization was observed between Zn s/p and d states along with the Mn s/p/d states. Its role in conduction bands became more prominent than the valence band.

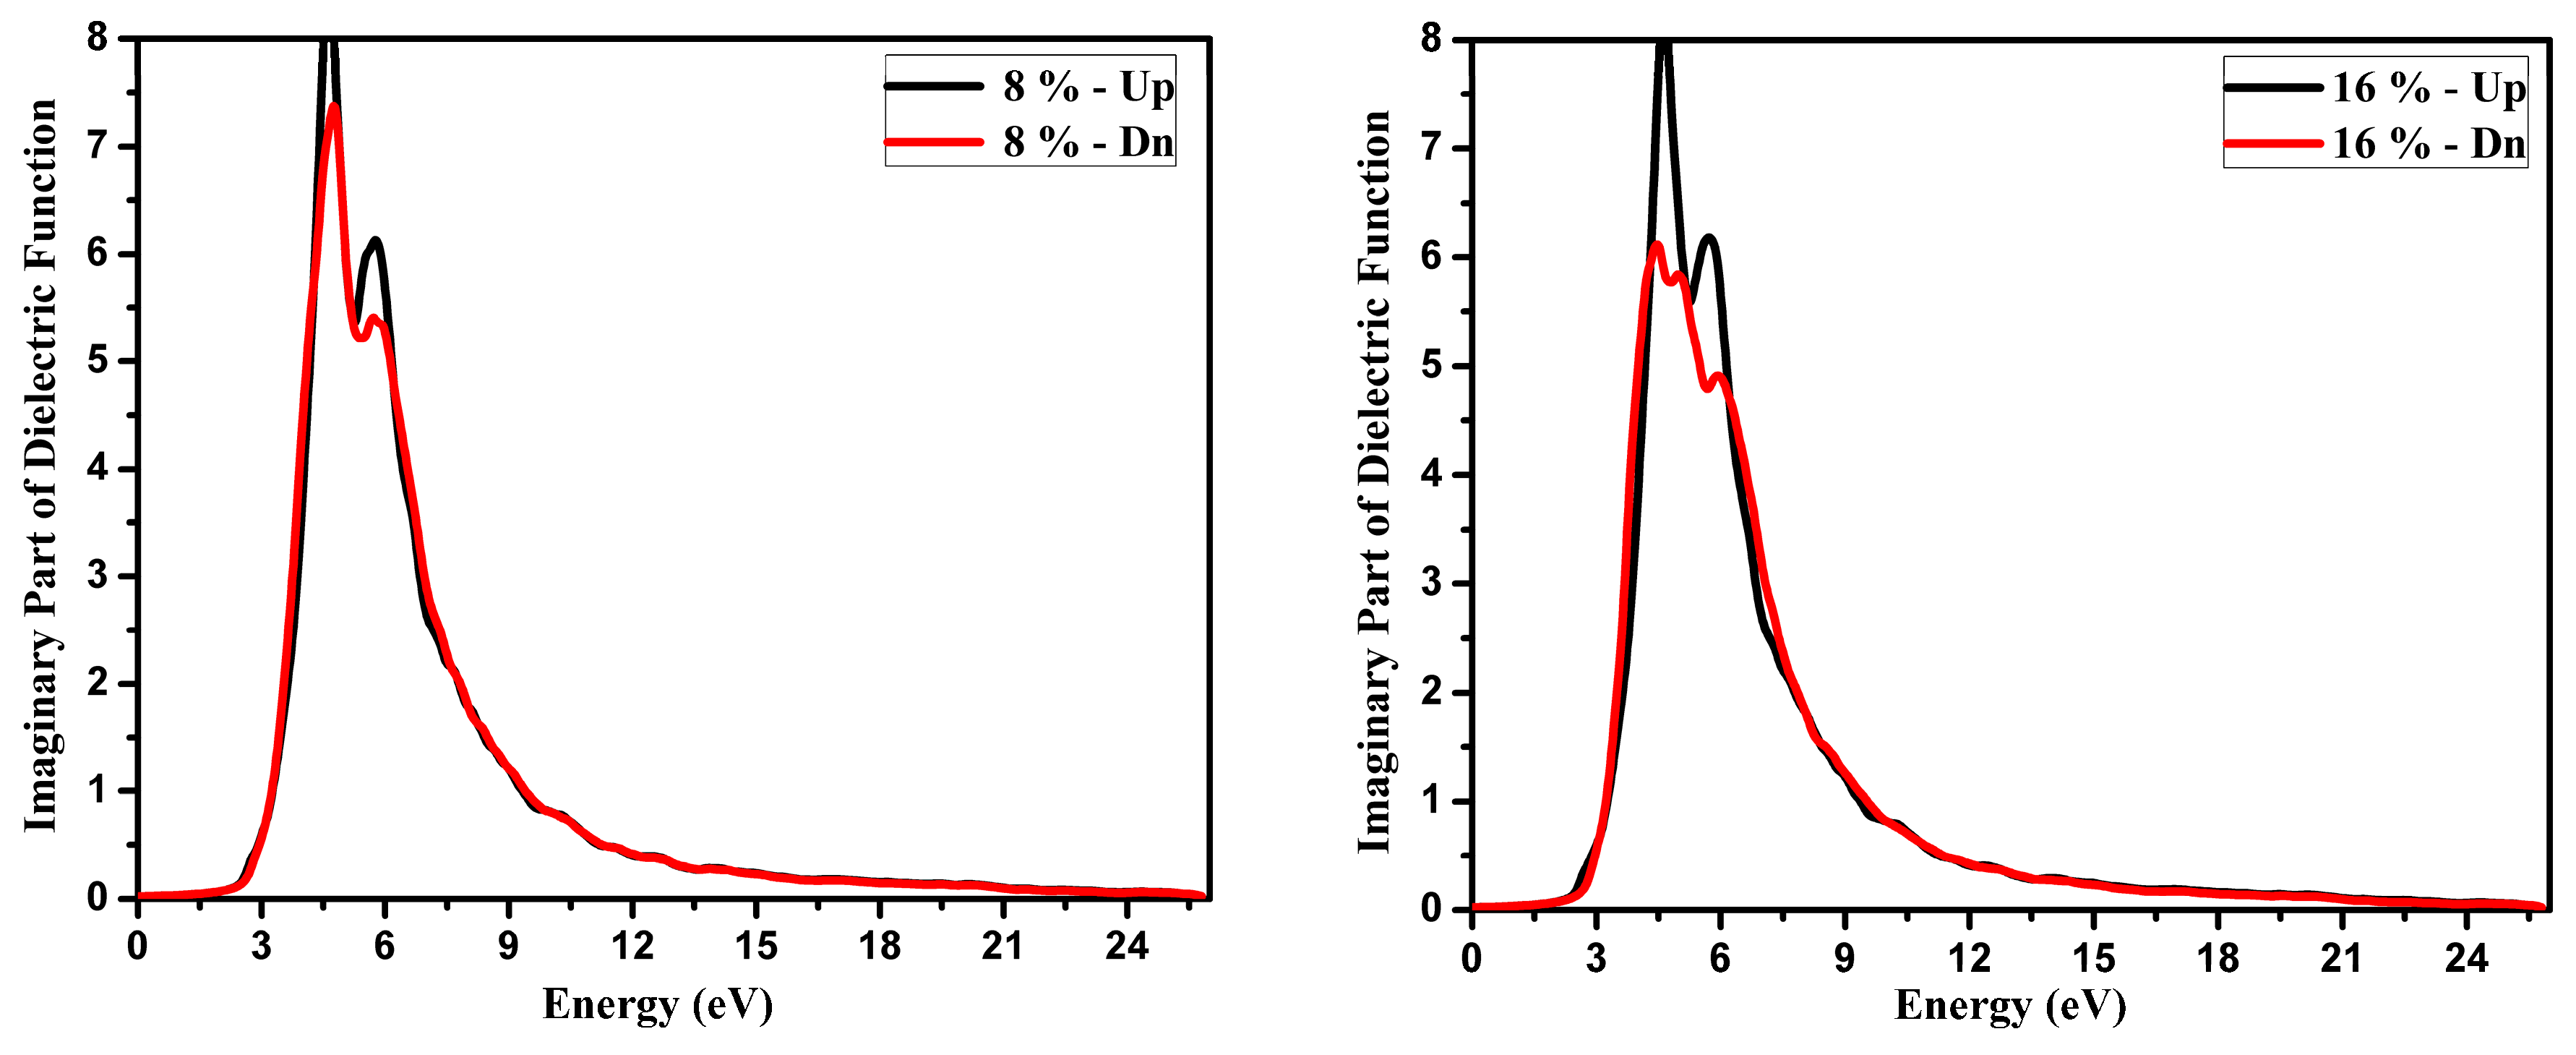
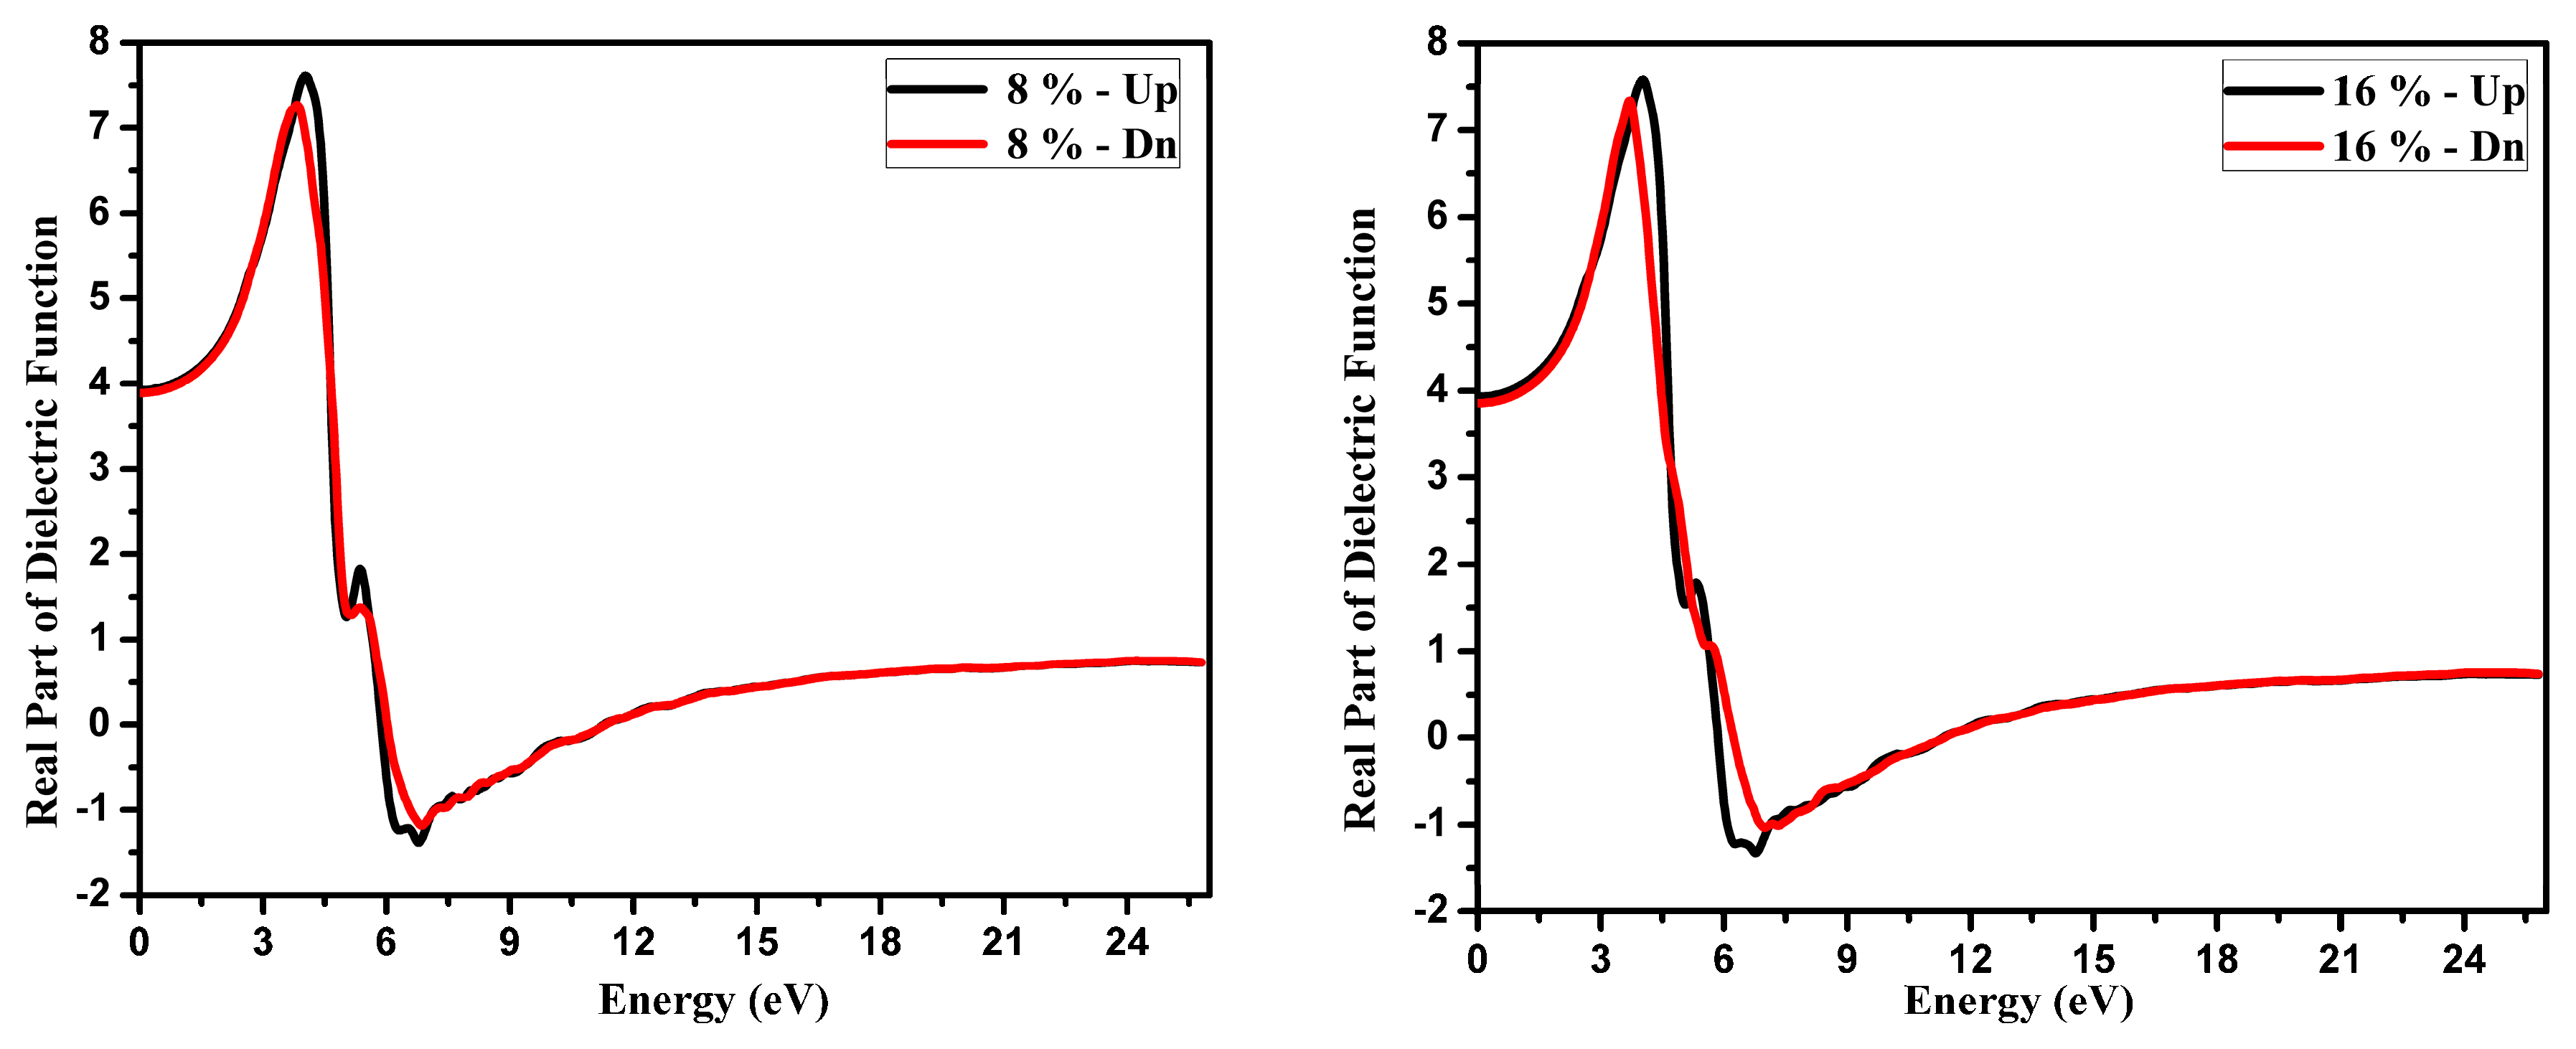
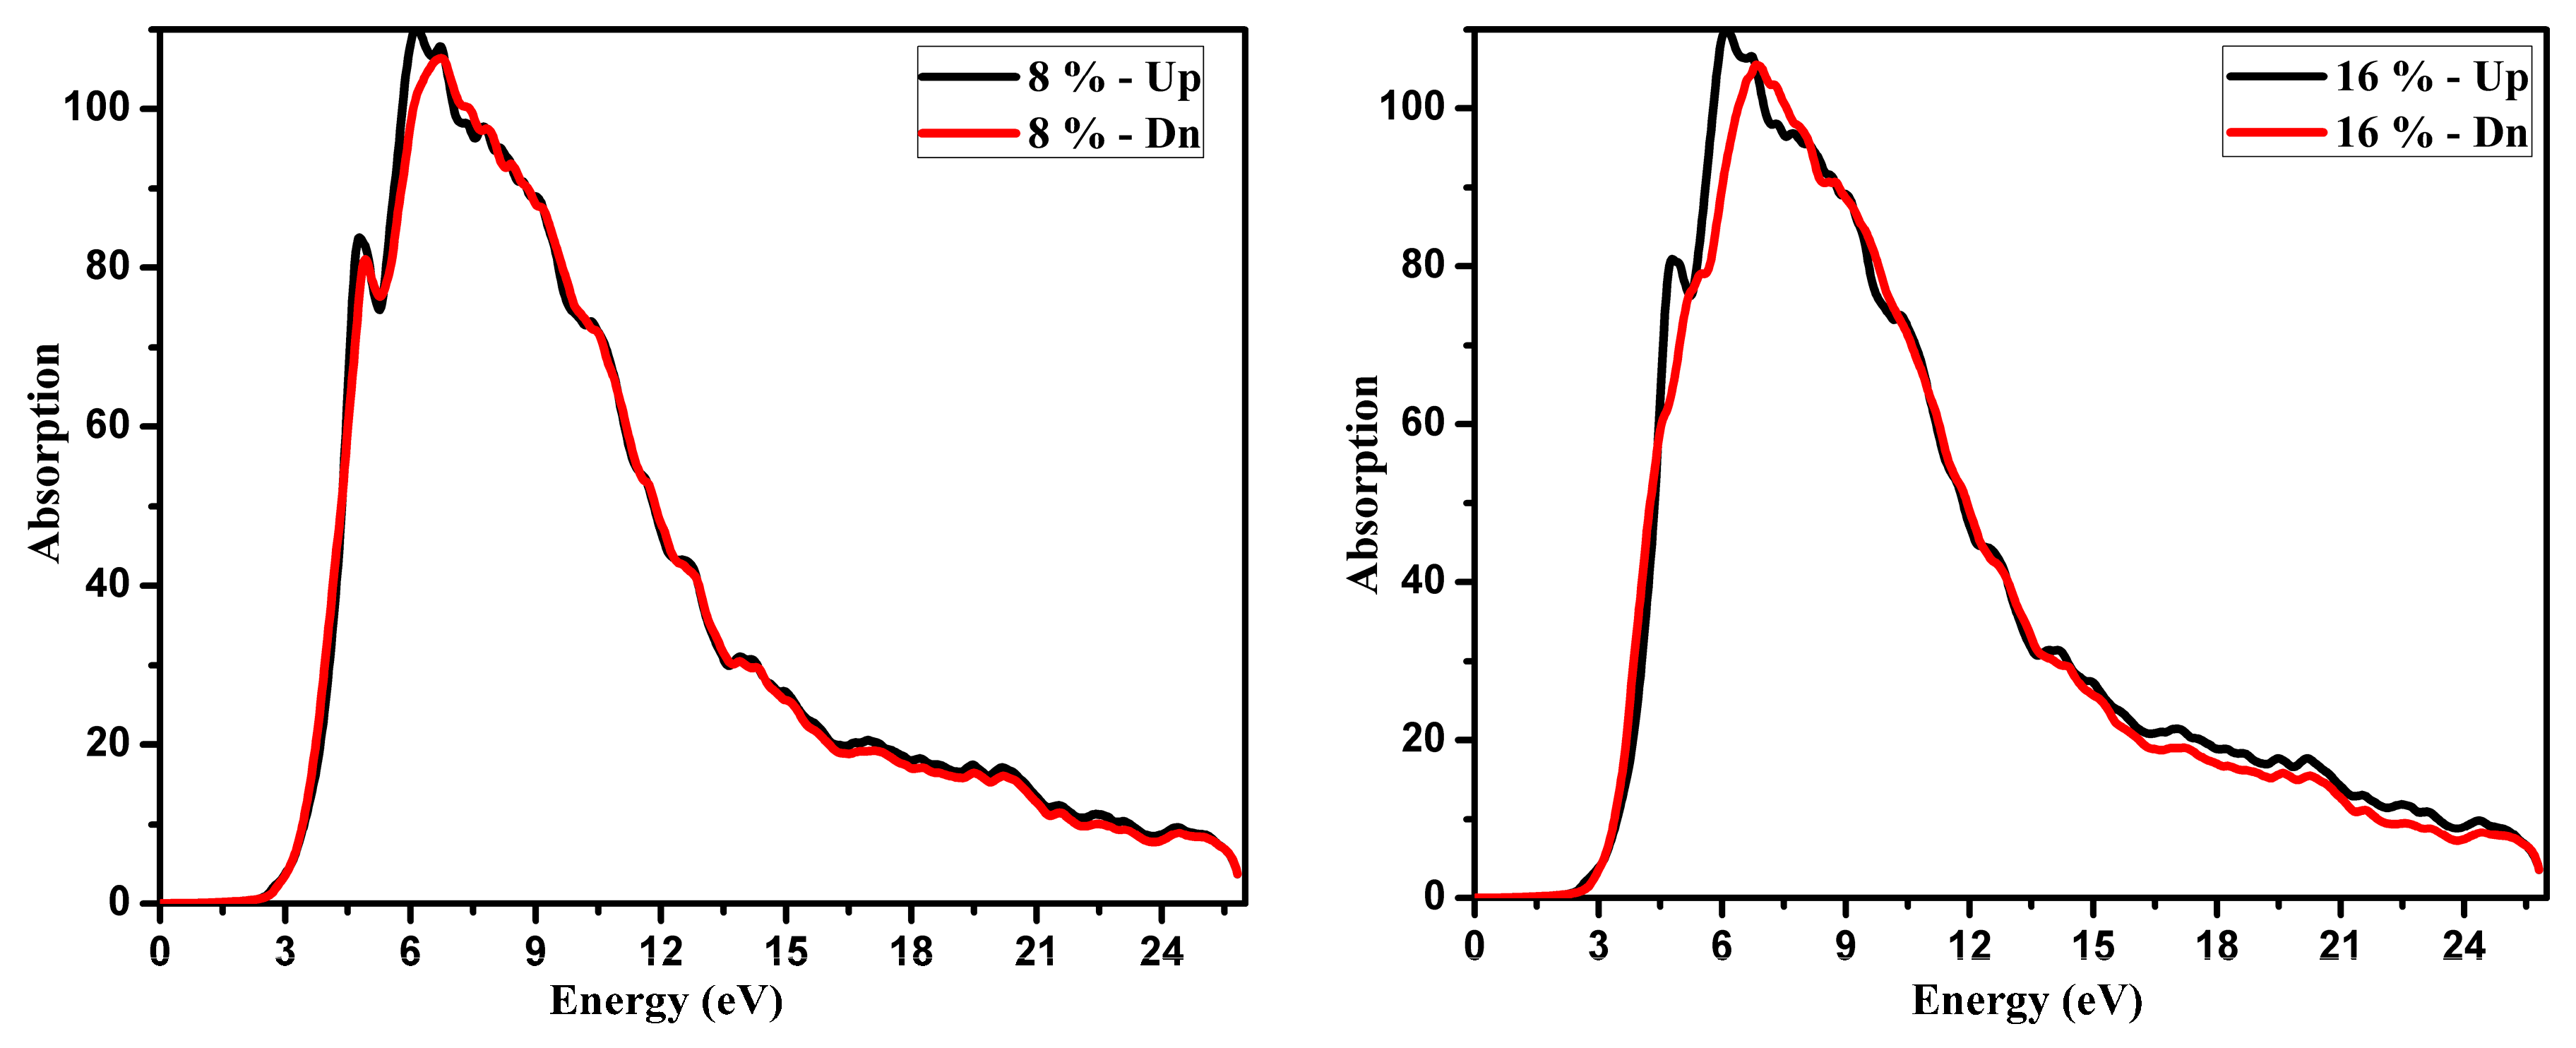
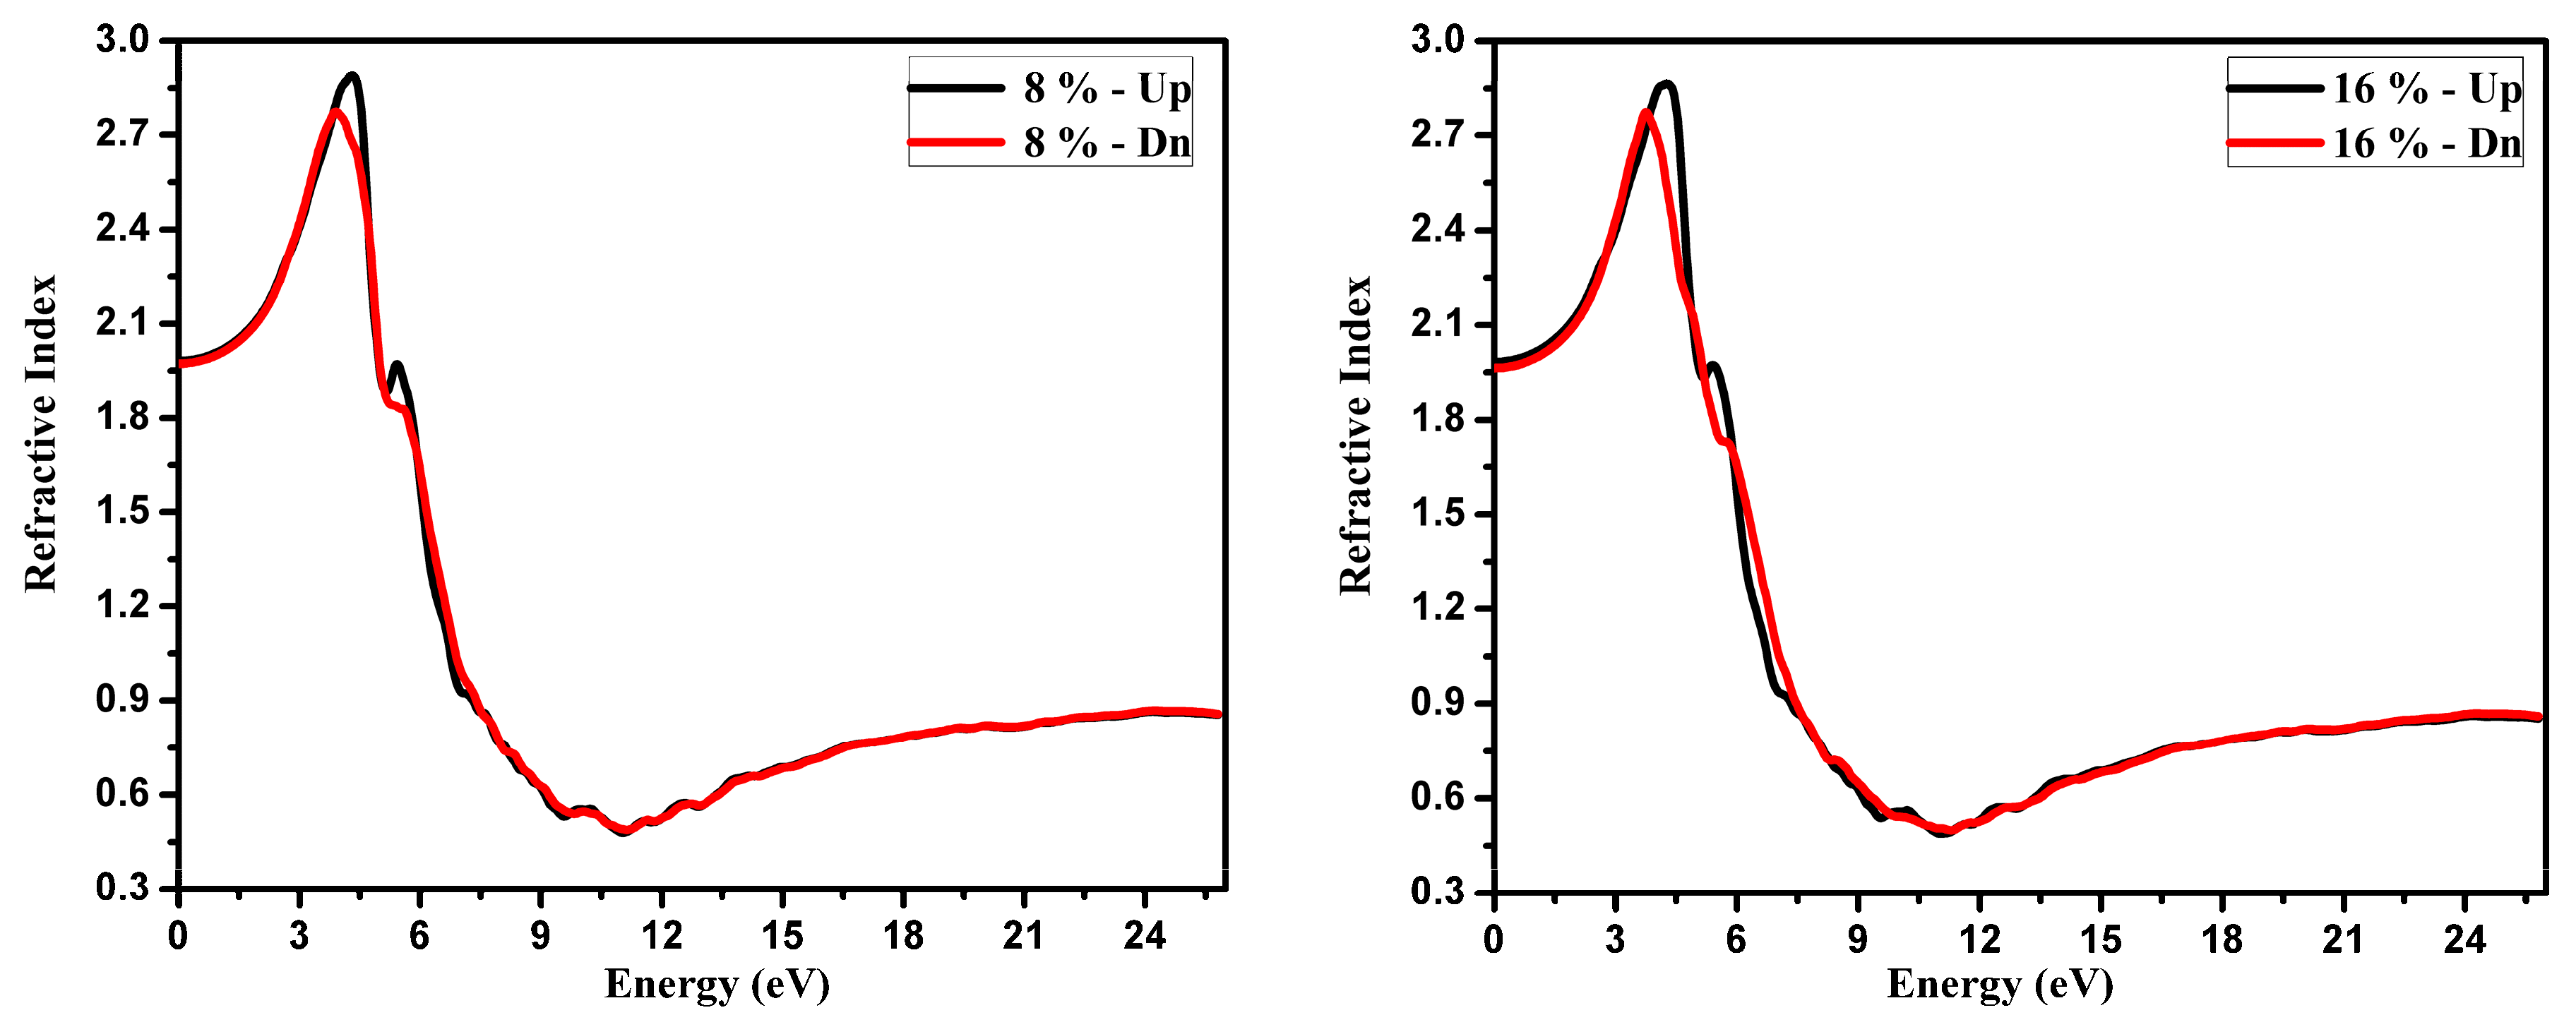
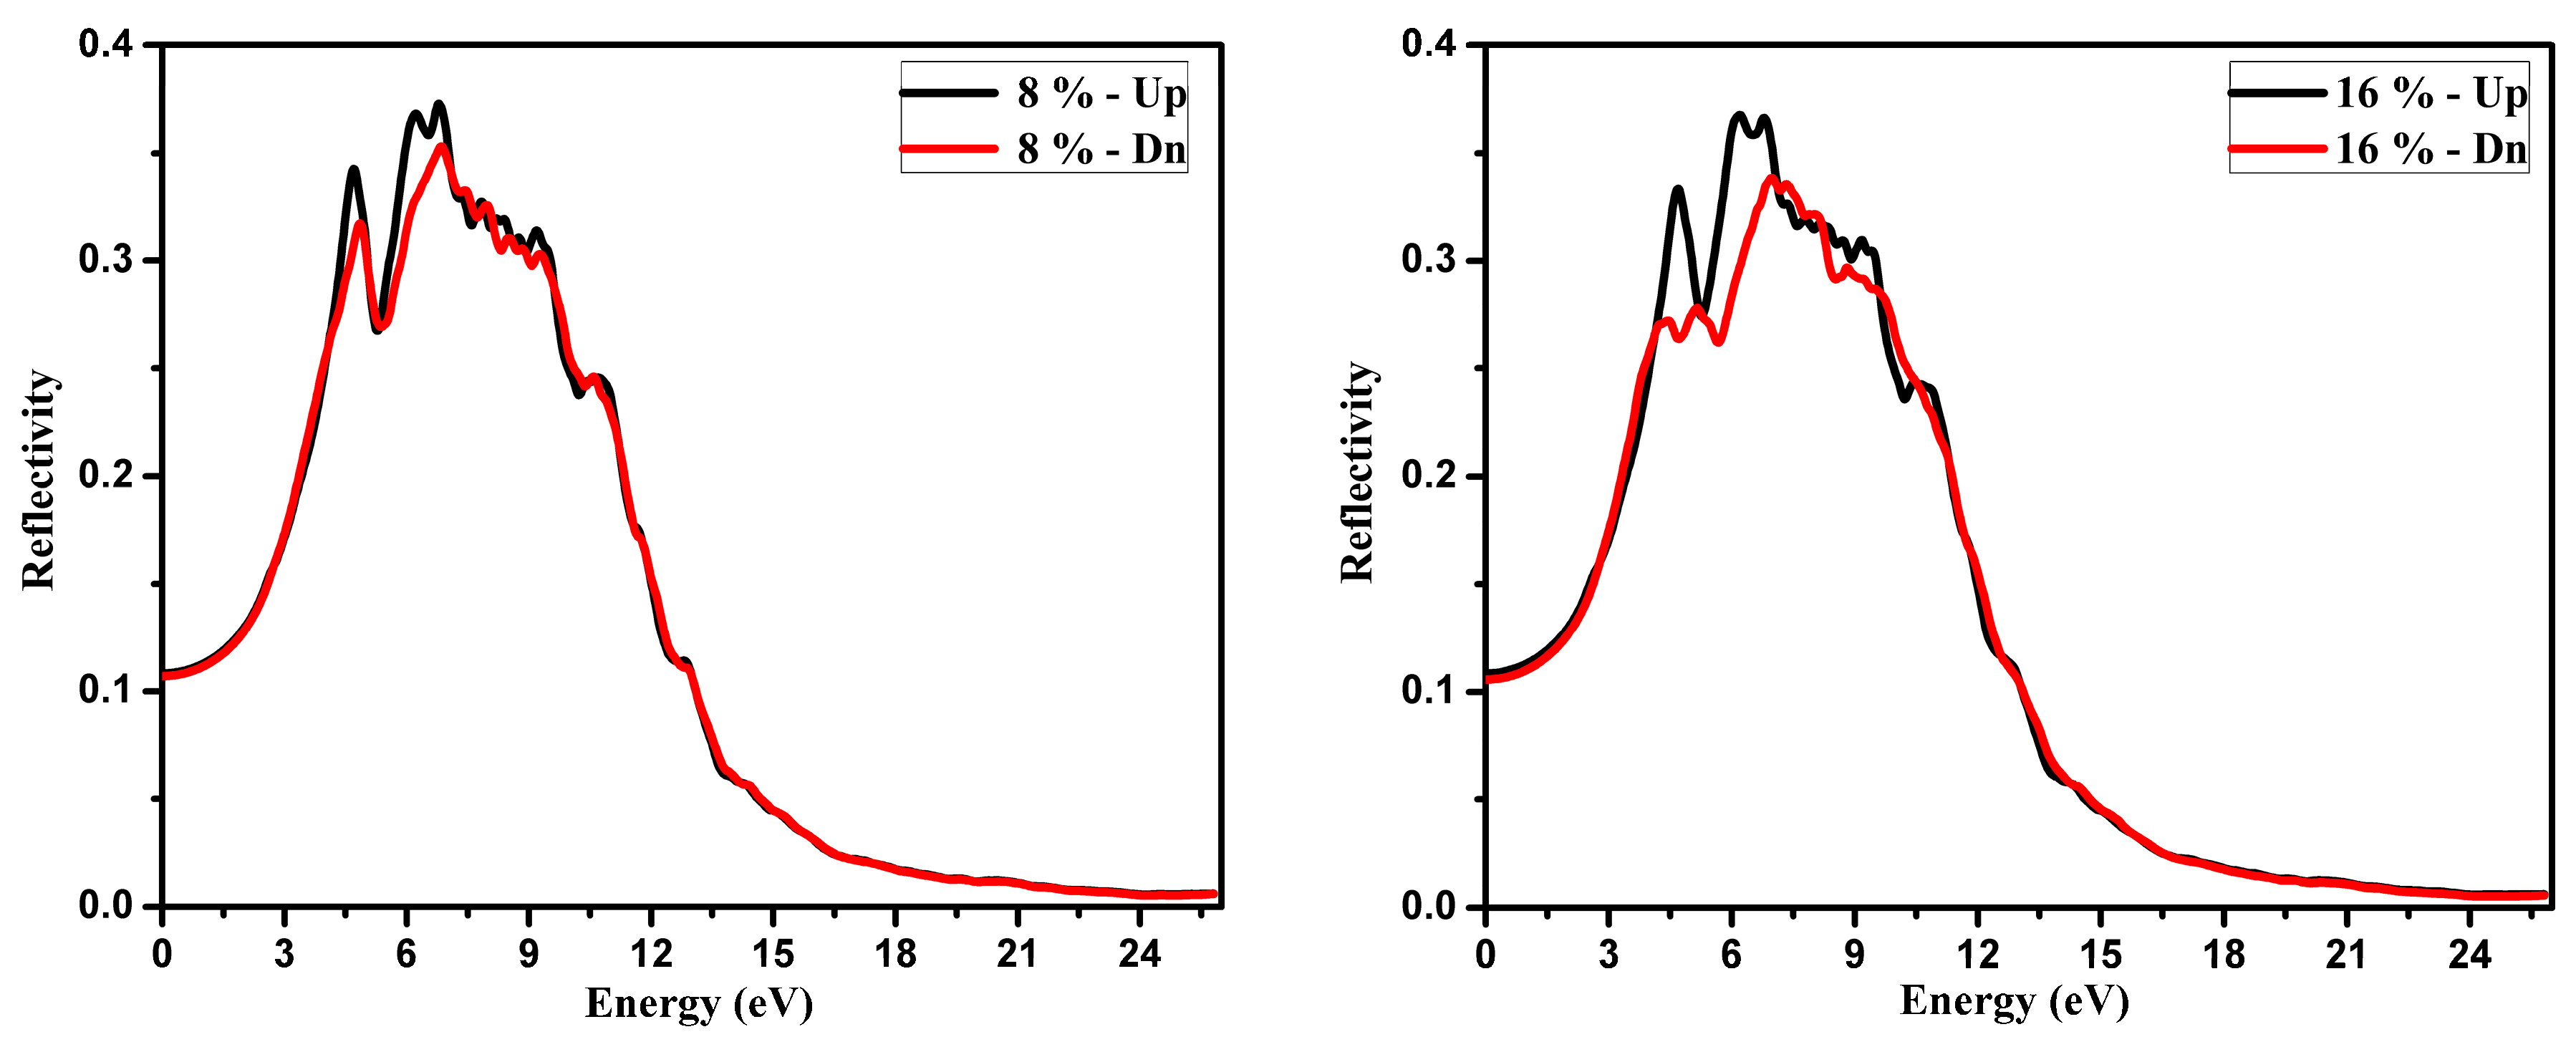
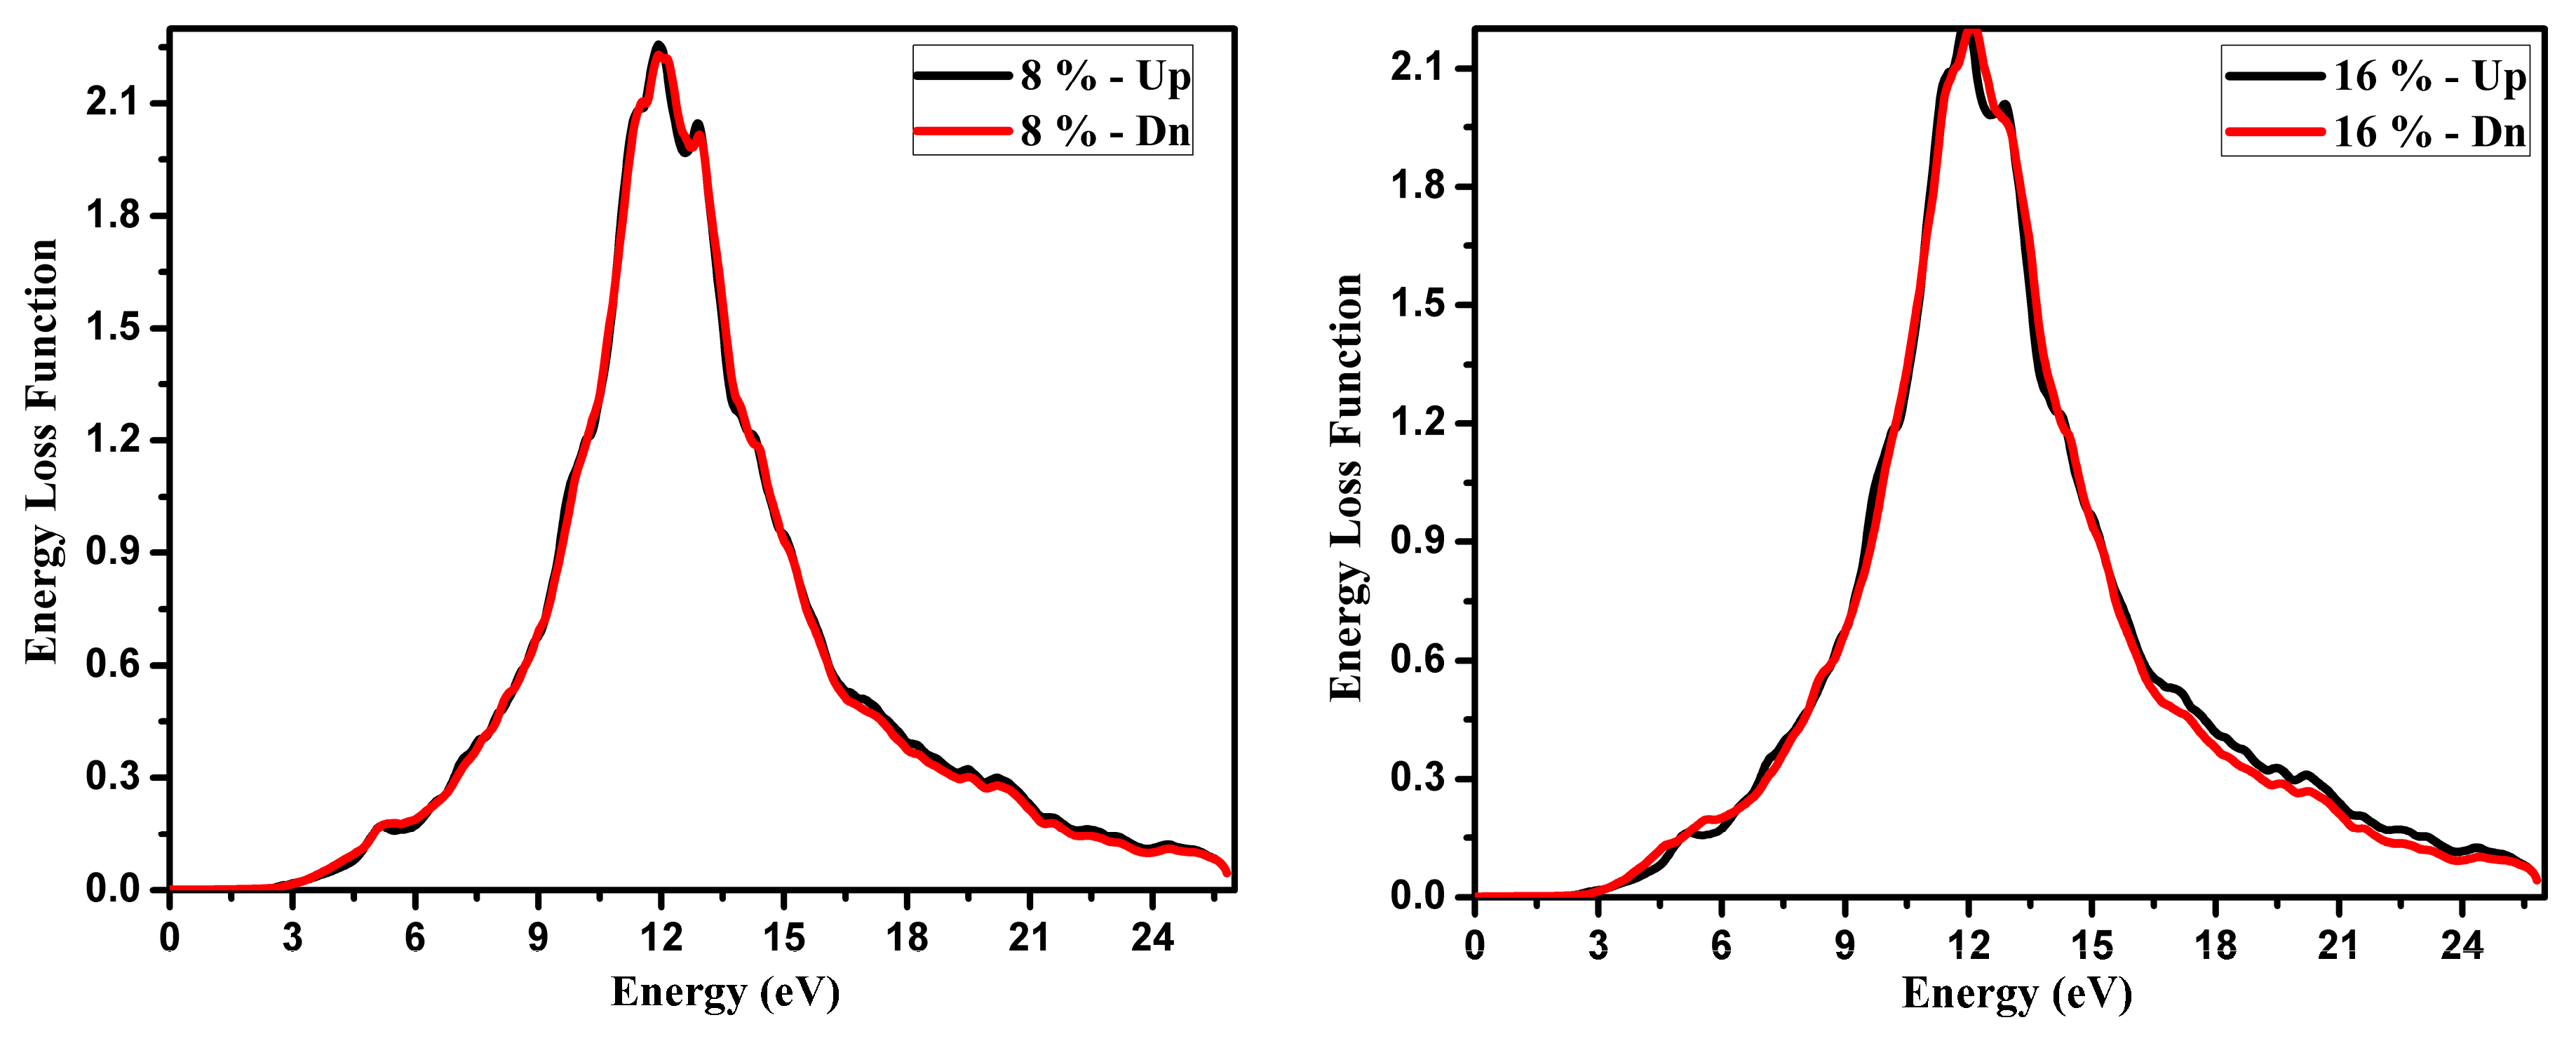
3.2. Optical Function Dispersion

Study of the optical properties is important for understanding the electronic structure of the materials. These can be attained from the complex dielectric function ε ( ω ) which is expressed as
ε ( ω ) = ε 1 ( ω ) + i ε 2 ( ω )
The imaginary part ε 2 ( ω ) is found from the momentum dipole transition matrix elements between the occupied and the unoccupied electronic states, and has been computed using Equation (1) [28],
ε 2 i j ( ω ) = 4 π 2 e 2 V m 2 ω 2 × k n n σ k n σ | p i | k n σ k n σ | p j | k n σ × f k n ( 1 f k n ) σ ( E k n Ε k n ω )
The dispersion of the real part of the dielectric function ε ( ω ) was computed using the imaginary part by using Kramer’s- Kronig relations.
ε 1 ( ω ) = 1 + 2 π P 0 ω ε 2 ( ω ) ω 2 ω 2 d ω
The symbol P represents the principal value of the integral.
With the help of real and imaginary part dispersions for dielectric function, other optical properties were calculated. The complex index of refraction is written as
n ˜ ( ω ) = n ( ω ) + i k ( ω )
Here n ( ω ) is refractive index and k ( ω ) is extinction coefficient can be obtained from dielectric function.
n ( ω ) = ( ε 1 ( ω ) + ( ε 1 2 ( ω ) + ε 2 2 ( ω ) ) 1 / 2 2 ) 1 / 2
At low frequency (i.e., ω = 0), the real part of the refractive index is called the static refractive coefficient n 0 = [ ε ( 0 ) ] 1 2 .
So, from the complex dielectric function dispersion which contains both real and imaginary parts all the other optical functions were also calculated, such as absorption coefficient I ( ω ) , energy loss function L(ω) and reflectivity R ( ω ) . As the reflectivity is the percentage of reflected ray intensity on the incident ray intensity of electromagnetic waves on the system, it can be expressed as
R ( ω ) = ( n ( ω ) 1 ) 2 K ( ω ) 2 ( n ( ω ) + 1 ) 2 K ( ω ) 2
The absorption coefficient is the power absorbed in a unit length of solid, and is calculated by using this formula
I ( ω ) = 4 π P ( ω ) λ 0
The energy loss function has been calculated as
L ( ω ) = ε 2 ( ω ) ε 1 2 ( ω ) + ε 2 2 ( ω )
The optical absorption spectra may be considered an effective experimental tool to identify the hyperfine band electronic structure of crystalline solid state materials. At the beginning we explored the optical absorption spectra for MnxZn1−xTe (x = 8% and 18%). To describe the optical function dispersions of the titled crystals possessing tetragonal symmetry, only two tensor components (εxx(ω) = εyy(ω) and εzz(ω)) are sufficient following the general symmetry. But in the present work, we consider an average value of the two tensor components, both for the real part as well as in the imaginary part dispersion of the dielectric constant. The optical properties (the real (ε1ave (ω)) and imaginary (ε2ave (ω)) part of dielectric functions and other associated optical properties) have been investigated at the equilibrium constant at energies up to 25.0 eV and are illustrated in Figure 5 and Figure 6. Real and imaginary parts of the dielectric function dispersion for MnxZn1−xTe (x = 8% and 18%) are shown in Figure 5.
The determination of the imaginary part ε2ave (ω) confirms that the threshold energy of the dielectric function (i.e., first optical critical point) exists at energy equal to about at 2.6 eV for MnxZn1−xTe (x = 8% and 18%) compounds. This point is MV-MC splitting or ΓV-ΓC transition, which is in accordance with the threshold for direct optical inter-band transitions known as the fundamental absorption edge existing in the middle of the highest CBM and VBM BZ points. The spectra demonstrated a relatively fast increase in the fundamental absorption edge caused by the abrupt surpassing of many points which are contributing towards ε2ave (ω). The number of spectral peaks increased as the energy increased and we have detected the highest peaks at energy about 3.5 eV for MnxZn1−xTe (x = 8% and 18%). Weak anisotropy was noticed in spectra of MnxZn1−xTe (x = 8% and 18%) within the energy range situated between 3.2 ~ 7.0 eV. So, applying the Kramer-Kronieg relations [19,20], the real part dispersion is computed following the imaginary part dispersion (this is shown in Figure 6).
The principle spectral peaks of the real part, having a magnitude of < 7.0 for MnxZn1−xTe (x = 8% and 18%) compounds, were observed at energies about 3.5 eV. But the spectra curves were decreasing as the energy was increasing and crossed the zero line at about 6.0 eV for MnxZn1−xTe (x = 8% and 18%). The calculated values of static dielectric constant ( ε 1 a v e ( 0 ) ) were found to be equal to about 3.8 and 3.7 for MnxZn1−xTe (x = 8% and 18%) at the conditions of equilibrium lattice constant. We also studied the dispersions of associated optical constant like refractive index nave (ω), absorption spectra Iave (ω), reflectivity Rave (ω), and energy loss function Lave (ω). So, following the results obtained it is clear that the Mn doping may effectively vary the resonance position of the spectral maxima for the titled crystals.
The principal method to find out how deeply light penetrates into the material is the determination of absorption coefficient I (ω) dispersion. The highly localized inter-band transitions mainly gave rise to absorption spectra. The calculated absorption coefficients dispersions are plotted in Figure 7. The spectra showed similar behaviors for the investigated materials, but also illustrated a few differences with significant optical anisotropy. The absorption edges were closely related to their band gaps and have been found to be equal to 2.5 eV for MnxZn1−xTe (x = 8% and 18%) compounds. In addition, as the energy increased, the absorption coefficient values obtained also were increasing and the maximum spectral peaks were situated in the spectral range situated within 5.0 ~ 9.0 eV. The spectra showed a sharp drop at 15.0 eV, which may be caused by electronic inter-band transitions, appearing only when a photon of specific energy is resonantly absorbed. The sharp decrease in the spectrum also shows a possibility of forbidden in dipole approached inter-band transitions in the band structure. Generally, it is necessary to have a direct band gap type for any crystalline material that may be considered as a promising candidate for photovoltaic, photoelectrical and even photo-thermal applications [20,21].
The refractive index n(ω) dispersion is shown in Figure 8. In this work we pay particular attention only to the average refractive index magnitudes. It is crucial there exists weak anisotropy between MnxZn1−xTe (x = 8% and 18%). In Figure 8, we have established that the highest refractive index peaks for MnxZn1−xTe (x = 8% and 18%) compounds are situated near the spectral energy equal to about 3.5 eV. After the energy limit mentioned, the titled peaks were substantially spectrally shifted toward lower energies as we moved from 8% to 16%, but as the energy increased from 3.5 eV a decrease in the spectral peaks was observed.
Figure 9 shows that with the energy increases, we have an inverse relation with energy loss function (as shown in Figure 10), but it still shows minimal reflectivity in the visible region. It is also very important that at higher energies, all the three materials have a slightly higher reflectivity.

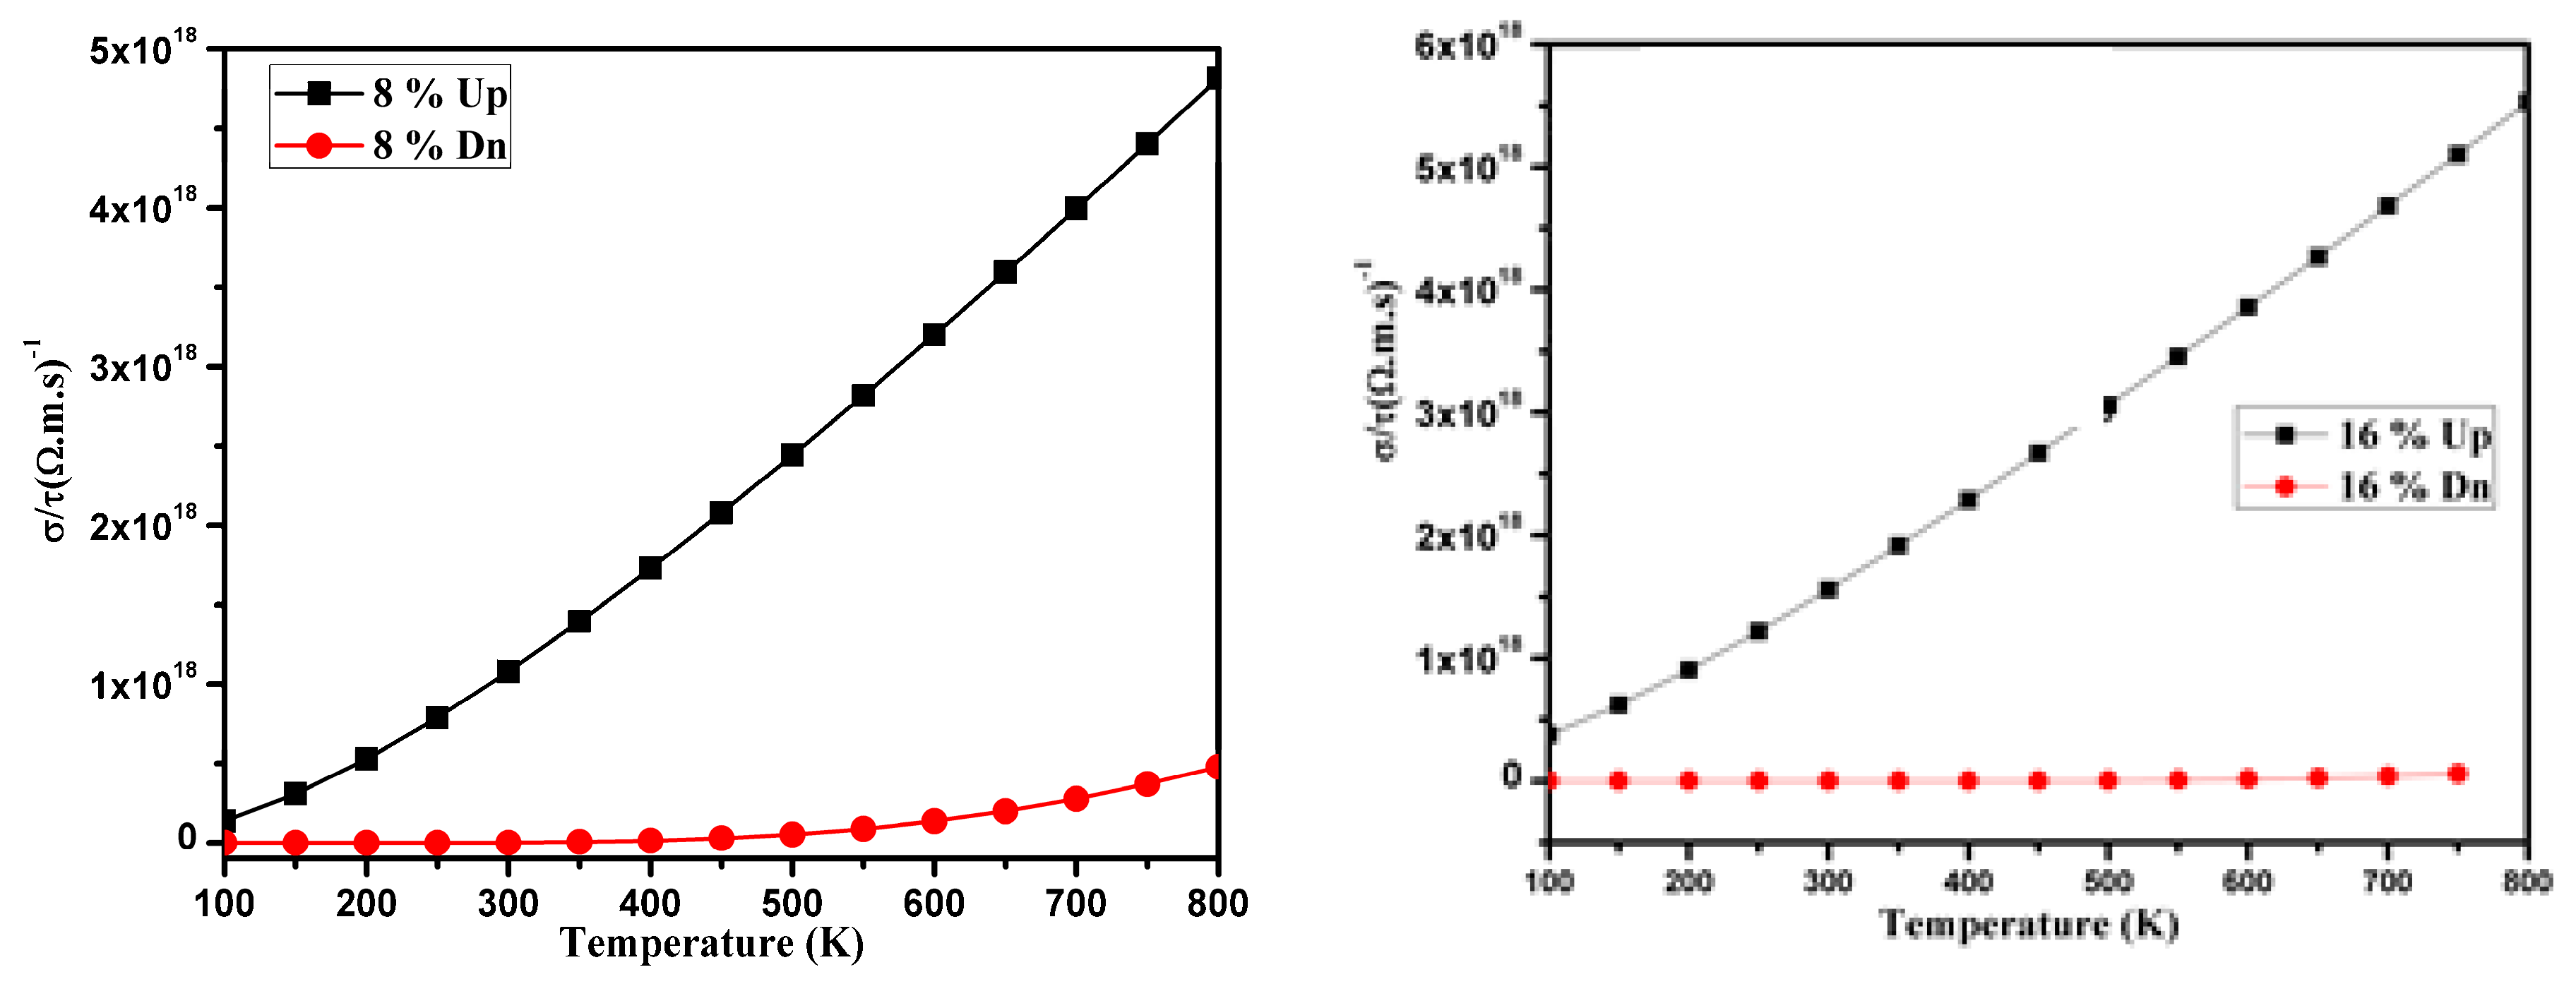
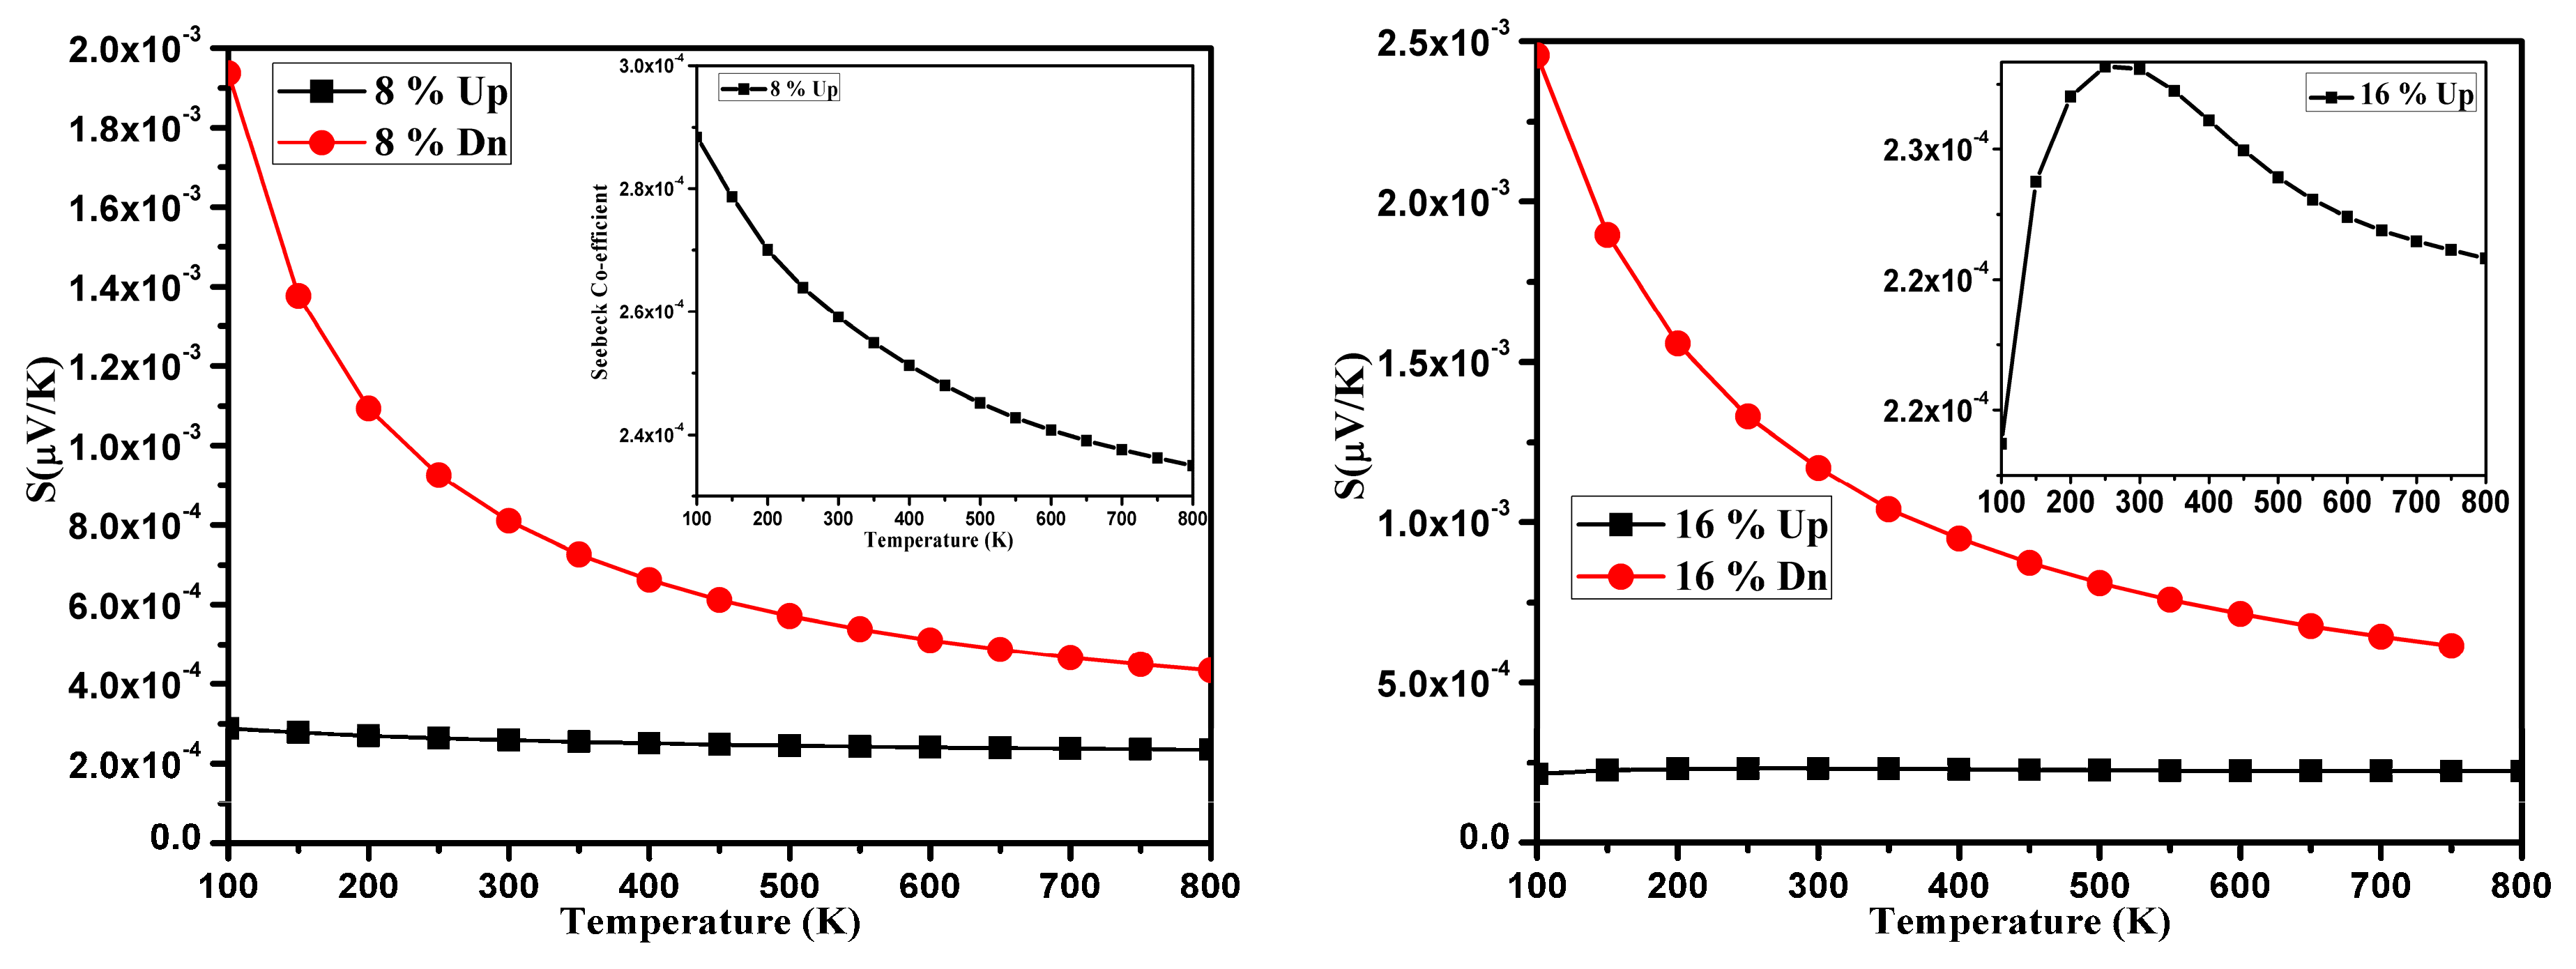
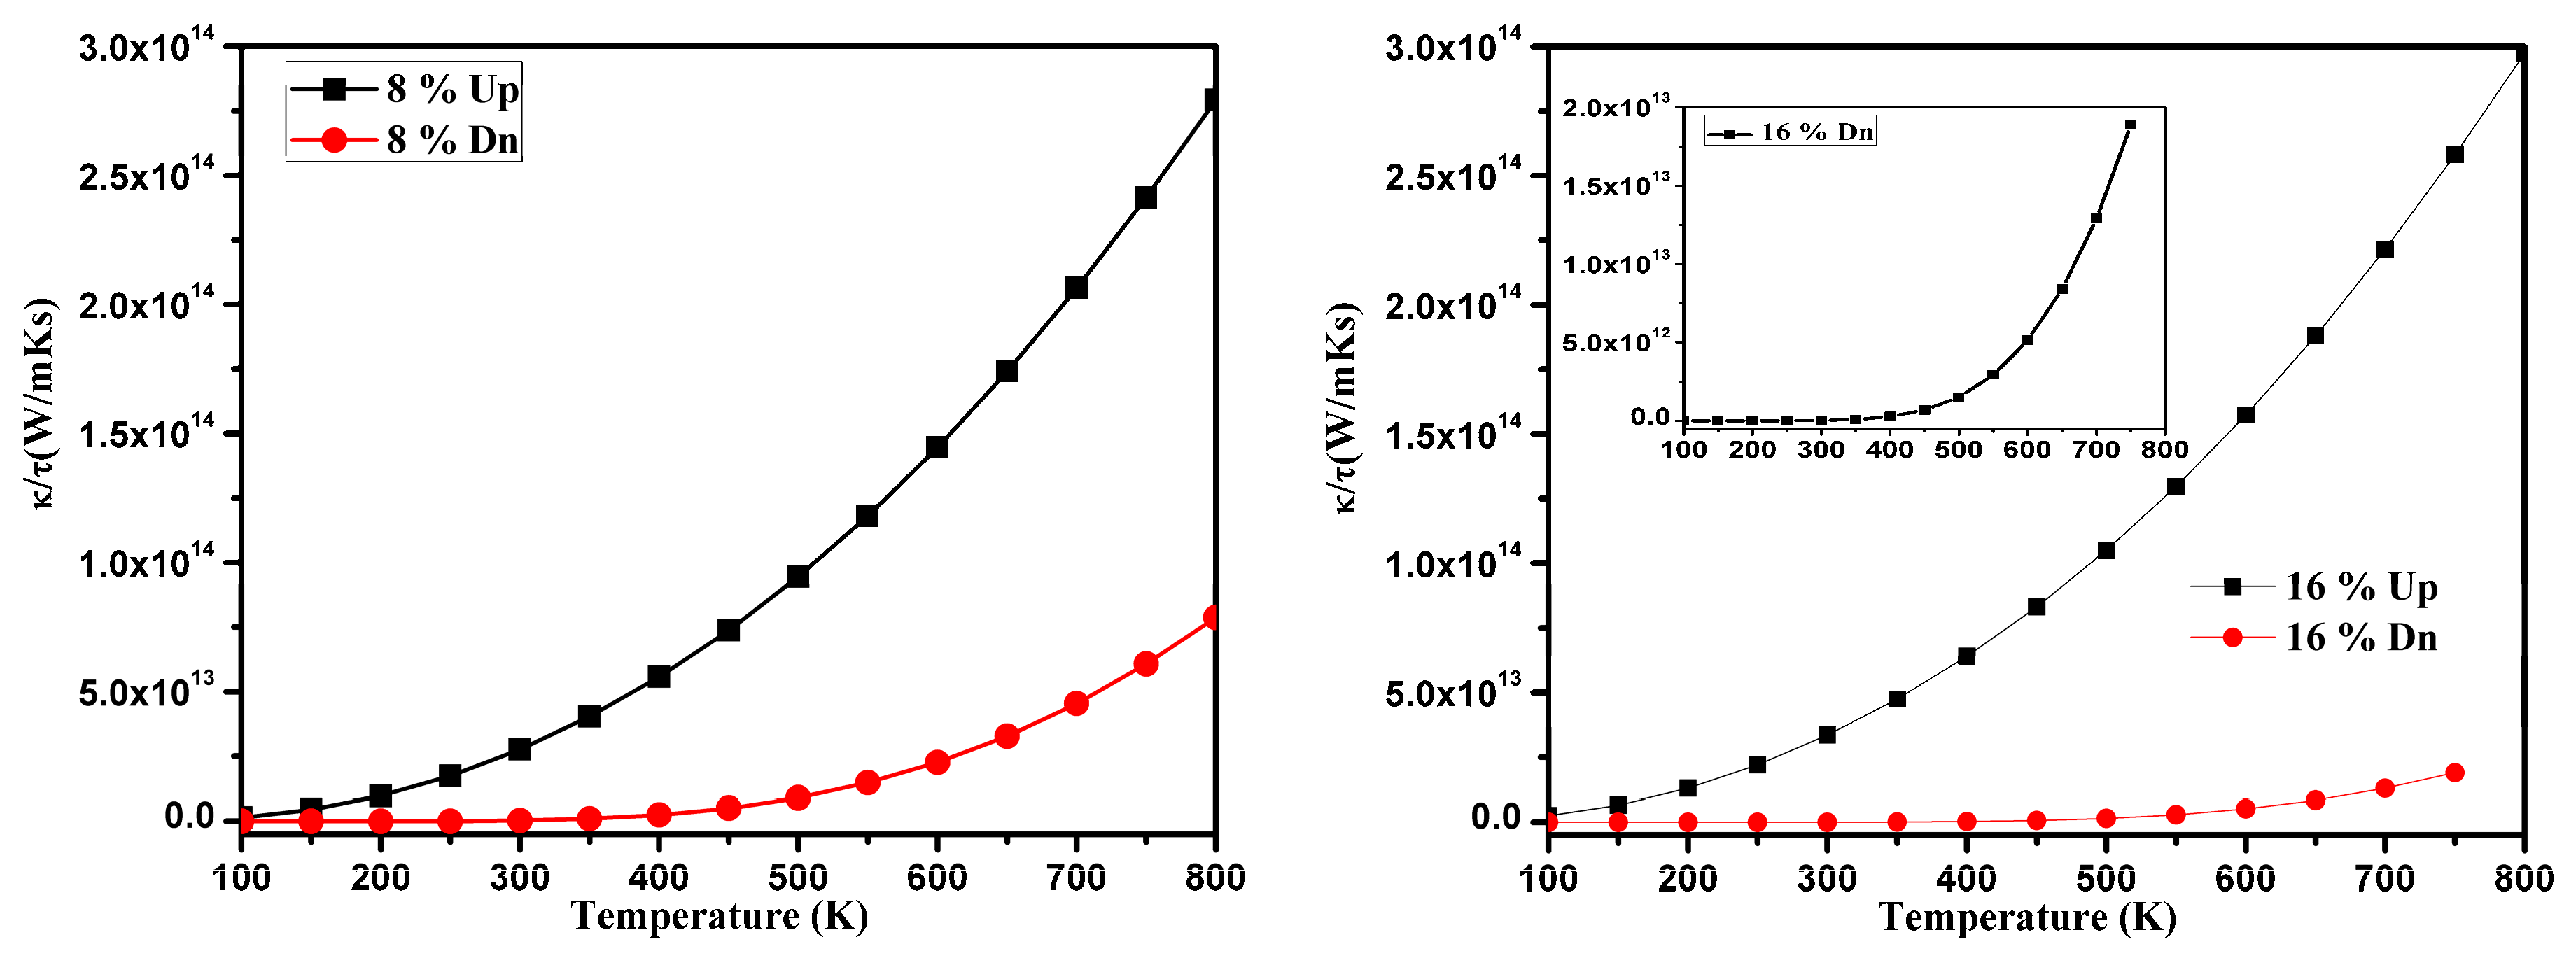
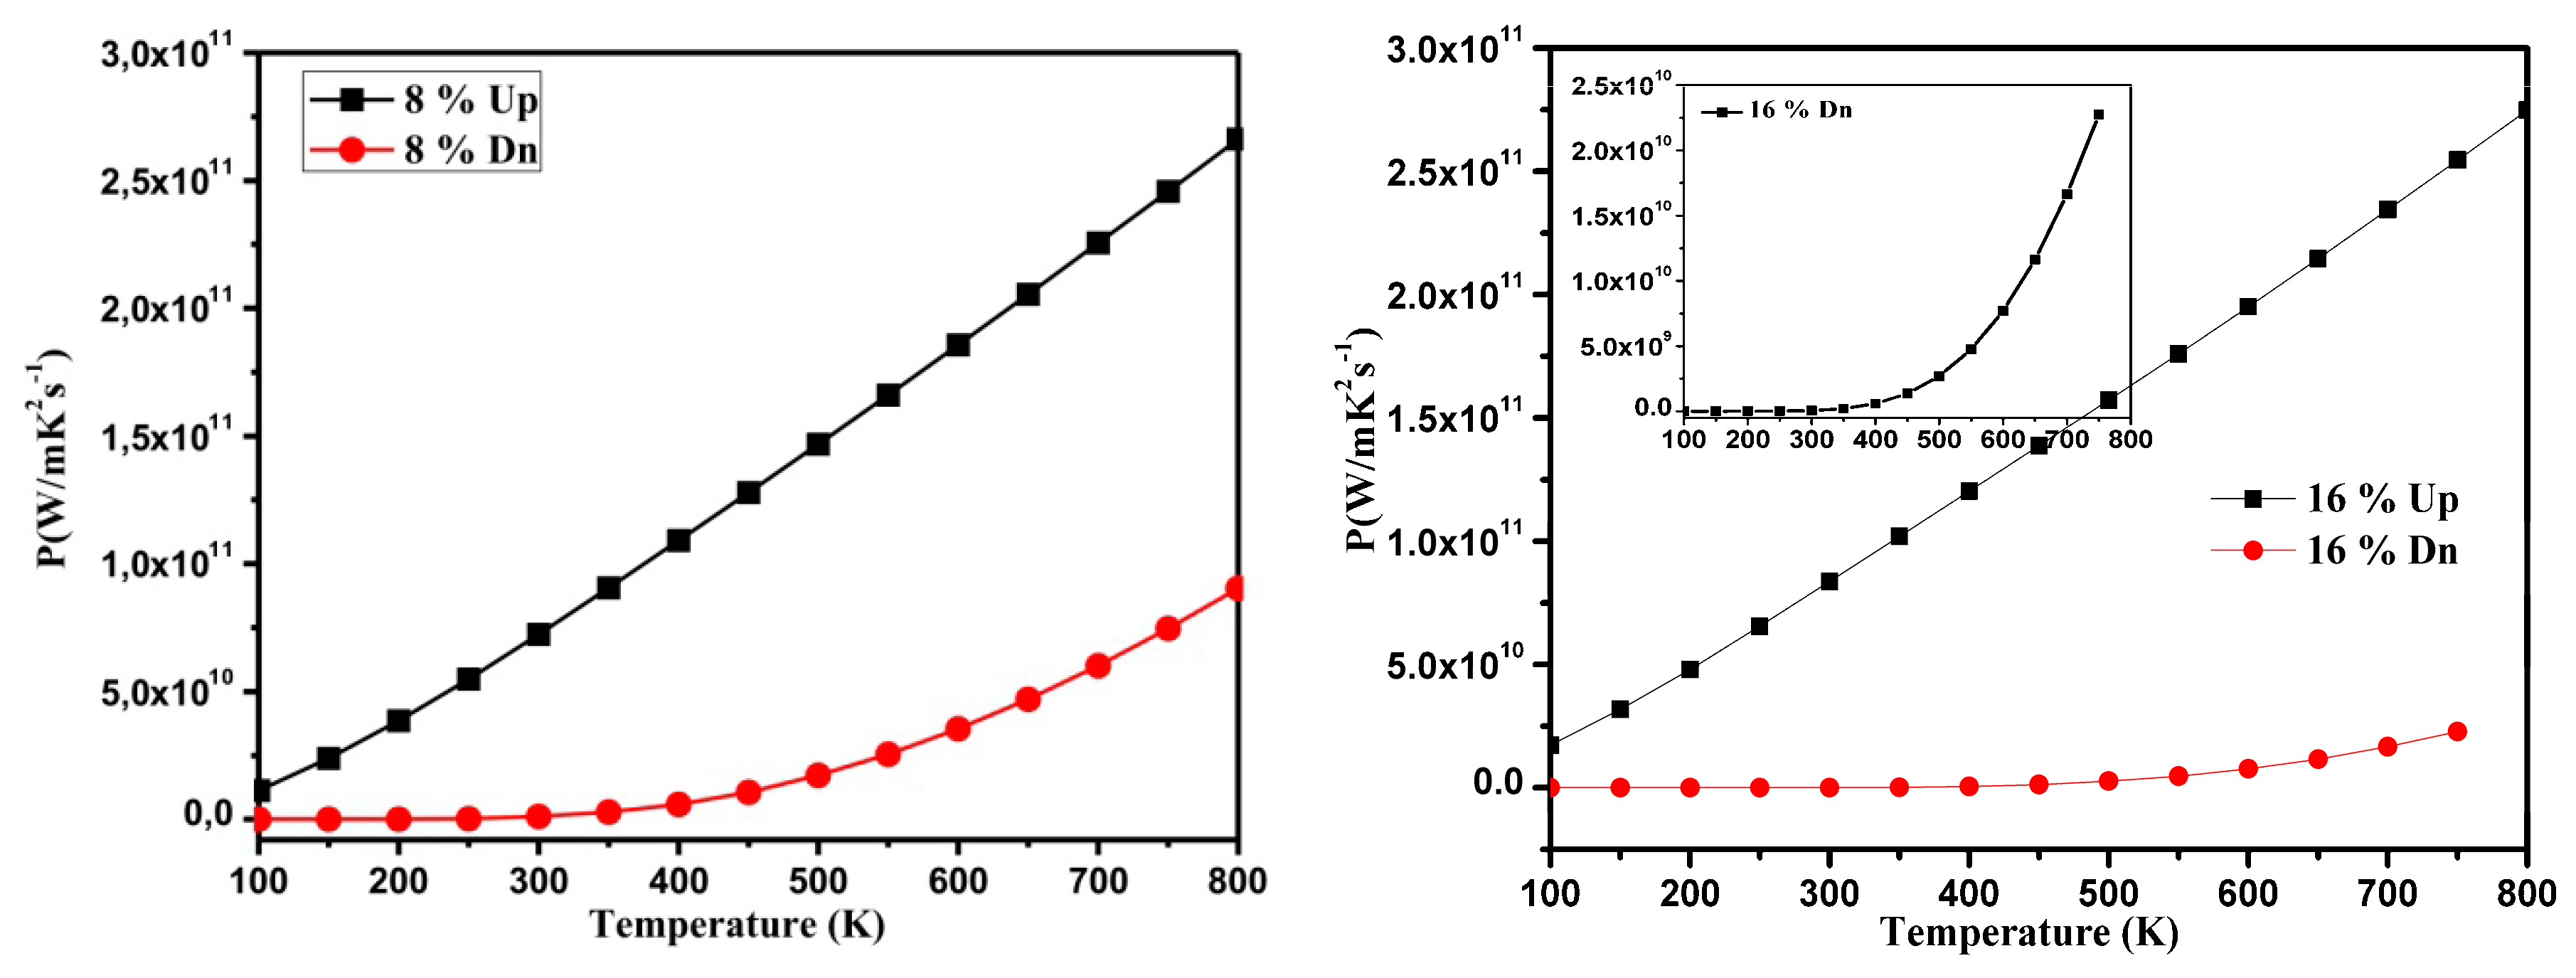
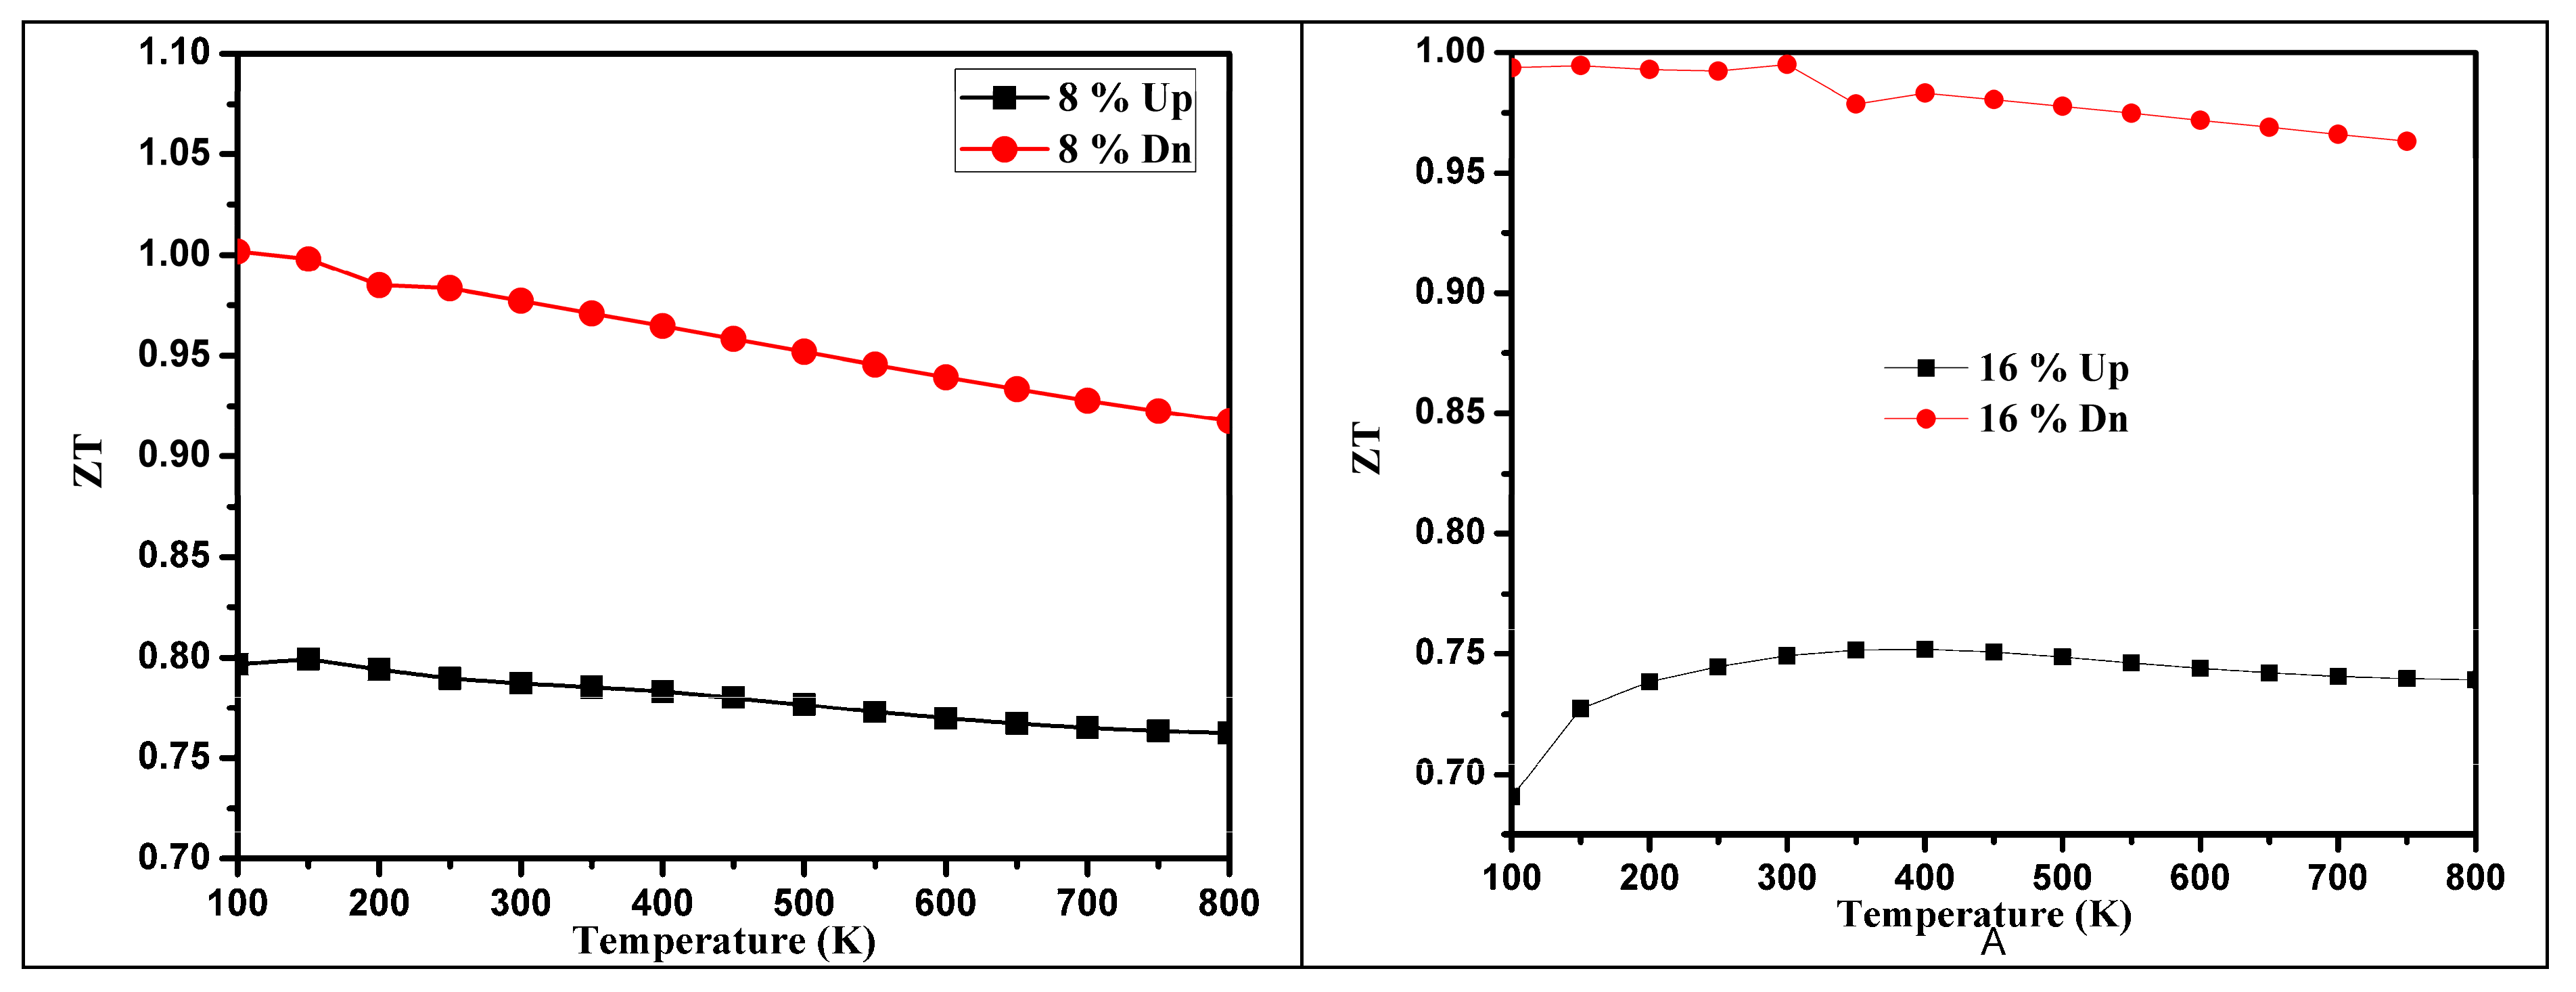
3.3. Thermoelectric Properties

We calculated and analyzed the electrical conductivity (σ), thermal conductivity (κ), Seebeck coefficient (S), power factor (PF), and figure of merit (ZT) as a function of temperature in the range 100–800 K. The average values of the electrical conductivity (σave) were computed for three compounds, as shown in Figure 11. It is evident from the figure that all of the compounds showed different behavior with increasing temperature. In fact, average electrical conductivity (σave (T)) of MnxZn1-xTe (x = 8 and 16%) is shown in Figure 11, and clearly demonstrates the fact that doping by 8% lead to a significant increase of electrical conductivity and temperature for spin up case, and for 8% spin down case we had a lower value of electrical conductivity obtained even at higher temperature. When the doping was enhanced up to 16% then there was a linear increase of conductivity versus electrical conductivity and temperature for up case, but at down case there was no change in electrical conductivity even at higher temperatures. These results may serve as an independent confirmation of the semi-conducting nature of these doped chalcogenides. At 100 K the values of σave (T) for MnxZn1−xTe (x = 8% and 16%) considered were found to be equal to 0 and 0.45 × 10¹⁸(Ω s)−1 for up and down cases, while for 16% the value of σave (T) is 0 × 1018 and 0.5 × 10¹⁸(Ω s)−1. With increase of temperature, that is, at 800 K, there was a substantial rise in σave (T). The maximum value for MnxZn1−xTe (x = 8%) is 4.8 × 10¹⁸(Ω ms)−1 and 0.4 × 10¹⁸(Ω ms)−1 for up and down case and for MnxZn1−xTe (x = 16%) was 5.6 × 10¹⁸(Ω ms)−1 and 0 × 1018 (Ω ms)−1 for up and down, respectively. At the same temperature (800 K) the compound having doping 16% showed the maximum value of electrical conductivity.
The calculated value of the Seebeck coefficient Save (T) is plotted as a function of T (100–800 K) as shown in Figure 12. The Seebeck coefficient has an inverse relation with carrier concentration, which is represented by the following formula
S = ( 8 π 2 K B / 3 e h 2 )   m T   ( π / 3 n ) 2 / 3
In the equation above, n is carrier concentration while m* means effective mass, KB is Boltzmann constant, h is Planks constant. The Seebeck coefficient of MnxZn1−xTe (x = 8% and 16%) compound shows a significant anisotropy in the all-inclusive within 100–800 K temperature range. These changes in Save (T) are caused by the band anisotropies of the electronic band structure. As the value of the Seebeck coefficient was positive, it demonstrated p-type semiconductor features (see Figure 12). With the increase of T from 100–800 K, the Seebeck coefficient of MnxZn1−xTe (x = 8%) decreased from 1.9 × 10⁻³–8 × 10⁻⁴ μVK−1 up case and for down case there was no change in the Seebeck coefficient as in the variation in the temperature. For MnxZn1−xTe (x = 16%) Save (T) for 100–350 K, they had an inverse relationship with temperature.
The calculated average electronic thermal conductivity σave (T) (the inset figure shows the zoom up state) is shown in Figure 13 for MnxZn1−xTe (x = 8% and 16%). It is clear from Figure 6 that σave (T) for these three chalcogenides increased with T and demonstratied a huge anisotropy within the entire temperature range from 100 K to 800 K (the inset figure shows the zoom 16% down state). Figure 6 confirms that the crystal MnxZn1−xTe (x = 8%) showed minimal changes of σave (T) for down 8% with respect to Up. σave (T) was enhanced with increasing temperature from 100–800 K and achieved its maximal value, that is, 2.8 × 10¹⁴ W/mKs for MnxZn1−xTe (x = 8% Up) and 0.5 × 10¹⁴ W/mKs MnxZn1−xTe (x = 8% Dn) when the rate of doping was increased up to 16%. Then the value of thermal conductivity was increased in the up case, as shown Figure 13. For MnxZn1−xTe (x = 16%) the σave (T) displays the highest value at 800 K with respect to the MnxZn1−xTe (x = 8%) 3 × 10¹⁴ W/mKs (Up) and 0.25 × 10¹⁴ W/mKs (Dn).
Figure 14 presents the calculated average power factor S2σave (T) for all materials (the inset figure shows the zoom 16% down state). It was observed that the PF increases linearly for MnxZn1−xTe (x = 8% Up) with temperature, while for the down case PF only slowly varied with temperature. At 100 K, MnxZn1−xTe (x = 8%) had a magnitude 0.27 × 10¹¹ W/mK2s (Up) and 0.0 × 10¹¹ W/mK2s (Dn) case, when temperature increases to 800 K. Power factors in case of up and down have magnitudes 2.6 × 10¹¹ W/mK2s and 5.5 × 10¹⁰ W/mK2s, respectively. For MnxZn1−xTe (x = 16%), power factor increased for the up case with increase in temperature, as shown in Figure 14. Hence, this might reflect the fact that this crystal may be promising for cooling devices and MnxZn1−xTe (x = 8% and 16%) shows higher greater value of S2σave (T) at higher temperatures only for up case.
The figure of merit ZT = S2σT/k has been calculated by including the electrical conductivity and Seebeck coefficient times T over thermal conductivity, as shown in Figure 15. For temperature range within 100 … 800 K, ZT for MnxZn1−xTe (x = 8% and 16%) compounds exhibit different behavior, firstly both materials demonstrate a decrease with increasing T up to 800 K and after we had almost temperature-independent behavior. From the results obtained the figure of merit ZT = 1 (Up 8%) and 0.80 (Dn 8%) and for 16% its values were 0.90 and 0.60 for Up and down cases, respectively. The larger value of ZT generally is caused by lower thermal conductivity and higher electrical conductivity. In general, our calculations confirm that at higher temperatures MnxZn1−xTe (x = 8% and 16%) possess better thermoelectric efficiencies and have more potential for thermoelectric devices.
It is necessary to emphasize that a huge role for the chalcogenides begins to be played by the anharmonic phonons, as was shown using photo-induced optical methods [29,30,31].

4. Conclusions

The optoelectronic and transport features of the MnxZn1−xTe (x = 8% and 16%) crystals have been simulated within the DFT approach using the GGA+U approximation. It was shown that the materials studied are semiconductors with a direct type band energy gap (Γ-Γ) with magnitudes equal to 2.20 eV and 2.0 eV for MnxZn1−xTe (x = 8% and 16%), respectively. The calculated dispersions of optical functions within the energy range 0 … 25 eV show that the up states of 8 and 16% possess strong optical response in the energy range covering the visible light and extreme UV regions. Thus, the direct band gap and strong absorption in this region of energy make these materials excellent candidates for optoelectronic devices. From the transport kinetics calculations, we have shown also that both the MnxZn1−xTe (x = 8% and 16%) crystals show promising thermoelectric properties. Finally, we expect that the current study can give several supportive hints for additional experimental investigations for the materials considered.

Author Contributions

Conceptualization, S.A.; methodology, W.K.; software, W.K.; investigation, M.I.; data curation, W.K. and S.A.; writing—original draft preparation, I.U. and M.I.; writing—review A.Y. and M.R.; and editing, I.V.K. and P.C.; supervision, I.V.K.; project administration, W.K.; funding acquisition, W.K.

Funding

This research received no external funding.

Acknowledgments

The work was supported by Project CEDAMNF, Reg. No. CZ.02.1.01/0.0/0.0/15_003/0000358, co-funded by the ERDF, GACR (Proj. 17-1484OS) and EU-COST action MP1306 (EUspec).

Conflicts of Interest

The authors declare no conflict of interest.

References

  1. Mingo, N. Thermoelectric figure of merit of II-VI semiconductor nanowires. Appl. Phys. Lett. 2004, 85, 5986. [Google Scholar] [CrossRef]
  2. Ghosh, B.; Ghosh, D.; Hussain, S.; Bhar, R.; Pal, A.K. Growth of ZnTe films by pulsed laser deposition technique. J. Alloys Compd. 2012, 541, 104–110. [Google Scholar] [CrossRef]
  3. Ko, H.; Park, S.; An, S.; Lee, C. Intense near-infrared emission from undoped ZnTe nanostructures synthesized by thermal evaporation. J. Alloys Compd. 2013, 580, 316–320. [Google Scholar] [CrossRef]
  4. Yang, X.H. Enhancing thermoelectric properties of semiconductors by heavily doping isoelectronic elements with electronegativities distinct from the host atoms. J. Alloys Compd. 2014, 594, 70–75. [Google Scholar] [CrossRef]
  5. Liu, Y.; Liu, B.G. Ferromagnetism in transition-metal-doped II-VI compounds. J. Magn. Magn. Mater. 2006, 307, 245–249. [Google Scholar] [CrossRef]
  6. Guo, M.; Gao, G.; Hu, Y. Magnetism and electronic structure of Mn- and V-doped zinc blende ZnTe from first-principles calculations. J. Magn. Magn. Mater. 2011, 323, 122–126. [Google Scholar] [CrossRef]
  7. Saito, H.; Zayets, V.; Yamagata, S.; Ando, K. Room-Temperature Ferromagnetism in a II-VI Diluted Magnetic Semiconductor ZN1-CrxTe. Phys. Rev. Lett. 2003, 90, 207202. [Google Scholar] [CrossRef]
  8. Reddy, D.R.; Reddy, B.K. Laser-like mechanoluminescence in ZnMeTe-diluted magnetic semiconductor. Appl. Phys. Lett. 2002, 81, 460–462. [Google Scholar] [CrossRef]
  9. Imamura, M.; Okada, A. Magnetooptical Properties of ZnMeTe Films Grown on Sapphire Substrates. IEEE Trans. Magn. 2006, 42, 3078–3080. [Google Scholar] [CrossRef]
  10. Kulatov, E.; Uspenskii, Y.; Mariette, H.; Cilbert, J.; Ferrand, D.; Nakayama, H.; Ohta, H. Ab Initio study of Magnetism in III-V- and II-VI-Based Diluted Magnetic Semiconductors. J. Supercond. Nov. Magn. 2003, 16, 123–126. [Google Scholar] [CrossRef]
  11. Cheng, J.; Li, D.; Cheng, T.; Ren, B.; Wang, G.; Li, J. Aqueous synthesis of high-fluorescence ZdZnTe alloyed quantum dots. J. Alloys Compd. 2014, 589, 539–544. [Google Scholar] [CrossRef]
  12. Sandratskii, L.M.; Bruno, P. Density functional theory of high-TC ferromagnetism of (ZnCr)Te. J. Phys. Condens. Matter. 2003, 15, 585–590. [Google Scholar] [CrossRef]
  13. Wang, X.L.; Dou, S.X.; Zhang, C. Zero-gap materials for future spintronics, electronics and optics. NPG Asia Mater. 2010, 2, 31–38. [Google Scholar] [CrossRef] [Green Version]
  14. Shan, C.X.; Fan, X.W.; Zhang, J.Y.; Zhang, Z.Z.; Wang, X.H.; Ma, J.G.; Lu, Y.M.; Liu, Y.C.; Shen, D.Z.; Kong, X.G.; et al. Structural and luminescent properties of ZnTe film grown on silicon by metalorganic chemical vapor deposition. J. Vac. Sci. Technol. A 2002, 20, 1886–1890. [Google Scholar] [CrossRef]
  15. Rao, G.K.; Bangera, K.V.; Shivakumar, G.K. Studies on the photoconductivity of vacuum deposited ZnTe thin films. Mater. Res. Bull. 2010, 45, 1357–1360. [Google Scholar] [CrossRef]
  16. Raju, K.N.; Vijayalakshmi, R.P.; Venugopal, R.; Reddy, D.R.; Reddy, B.K. Effect of substrate temperature on the structural, optical and electrical properties of vacuum-evaporated ZnTe films. Mater. Lett. 1992, 13, 336–341. [Google Scholar] [CrossRef]
  17. Su, C.H.; Volz, M.P.; Gillies, D.C.; Szofran, F.R.; Lehoczky, S.L.; Dudley, M.; Yao, G.D.; Zhou, W. Growth of ZnTe by physical vapor transport and traveling heater method. J. Cryst. Growth 1993, 128, 627–632. [Google Scholar] [CrossRef]
  18. Khan, M.R.H. Interface properties of a CdTe-ZnTe heterojunction. J. Phys. D Appl. Phys. 1994, 27, 2190–2193. [Google Scholar] [CrossRef]
  19. Tao, I.W.; Jurkovic, M.; Wang, W.I. Doping of ZnTe by molecular beam epitaxy. Appl. Phys. Lett. 1994, 64, 1848. [Google Scholar] [CrossRef]
  20. Maiti, B.; Gupta, P.; Chaudhuri, S.; Pal, A.K. Grain boundary effect in polycrystalline ZnTe films. Thin Solid Films 1994, 239, 104–111. [Google Scholar] [CrossRef]
  21. Wolf, K.; Stanzl, H.; Naumov, A.; Wagner, H.P.; Kuhn, W.; Hahn, B.; Gebhardt, W. Growth and doping of ZnTe and ZnSe epilayers with metalorganic vapour phase epitaxy. J. Cryst. Growth 1994, 138, 412–417. [Google Scholar] [CrossRef]
  22. Neumann-Spallart, M.; Konigstein, C. Electrodeposition of zinc telluride. Thin Solid Films 1995, 265, 33–39. [Google Scholar] [CrossRef]
  23. Bozzini, B.; Lenardi, C.; Lovergine, N. Electrodeposition ofstoichiometric polycrystalline ZnTe on n+-GaAs and Ni-P. Mater. Chem. Phys. 2000, 66, 219–228. [Google Scholar] [CrossRef]
  24. Jun, Y.; Kim, K.J.; Kim, D. Electrochemical synthesis of cu-doped znte films as back contacts to cdte solar cells. Met. Mater. 1999, 5, 279–285. [Google Scholar] [CrossRef]
  25. Arico, A.S.; Silvestro, D.; Antonucci, P.L.; Giordano, N.; Antonucci, V. Electrodeposited Thin Film ZnTe Semiconductors for Photovoltaic Applications. Adv. Perform. Mater. 1997, 4, 115–125. [Google Scholar] [CrossRef]
  26. Karazhanov, S.Z.; Ravindran, P.; Kjekshus, A.; Fjellvag, H.; Svensson, B.G. Electronic structure and optical properties of Zn X (X = O, S, Se, Te): A density functional study. Phys. Rev. B 2007, 75, 155104. [Google Scholar] [CrossRef]
  27. Huang, M.Z.; Ching, W.Y. Calculation of optical excitations in cube semiconductors. I. Electronic structure and linear response. Phys. Rev. B 1993, 47, 9449. [Google Scholar] [CrossRef]
  28. Subhan, F.; Azam, S.; Khan, G.; Irfan, M.; Muhammad, S.; Al-Sehemi, A.G.; Naqib, S.H.; Khenata, R.; Khan, S.; Kityk, I.V.; et al. Elastic and optoelectronic properties of CaTa2O6 compounds: Cubic and orthorhombic phases. J. Alloys Compd. 2019, 785, 232–239. [Google Scholar] [CrossRef]
  29. Kityk, I.V. IR-induced Second Harmonic Generation in Sb2Te3-BaF2-PbCl2 Glasses. J. Phys. Chem. B 2003, 107, 10083–10087. [Google Scholar] [CrossRef]
  30. Kityk, I.V. IR-stimulated second harmonic generation in Sb2Te2Se-BaF2-PbCl2 glasses. J. Mod. Opt. 2004, 51, 1179–1189. [Google Scholar]
  31. Shpotyuk, O.I.; Kityk, I.V.; Kasperczyk, J. Mechanism of reversible photoinduced optical effects in amorphous As2S3. J. Non Cryst. Solids 1997, 215, 218–225. [Google Scholar] [CrossRef]
Figure 1. Representation and labeling of unit cell structure for MnxZn1−xTe (x = 8% and 16%) crystalline solid state alloys.
Crystals 09 00247 g001
Figure 2. Electronic band structure along high symmetry points for MnxZn1−xTe (x = 8% and 16%).
Crystals 09 00247 g002
Figure 3. Total Density Up and Down of states for MnxZn1−xTe crystals (x = 8% and 16%).
Crystals 09 00247 g003
Figure 4. Up and Down states of the PDOS for MnxZn1−xTe crystals (x = 8% and 16%).
Crystals 09 00247 g004aCrystals 09 00247 g004b
Figure 5. Calculated imaginary part (dark solid curve-black color for up spin) and (long solid curve-red color for down spin) spectra of MnxZn1−xTe (x = 8% and 16%).
Crystals 09 00247 g005
Figure 6. Calculated real part dispersion (dark solid curve-black color for up spin) and (long solid curve-red color for down) spectra of MnxZn1−xTe (x = 8% and 16%).
Crystals 09 00247 g006
Figure 7. Calculated absorption spectrum (long solid curve-black color for up) and (long solid curve-red color for down) spectra for MnxZn1−xTe (x = 8% and 16%) crystals.
Crystals 09 00247 g007
Figure 8. Calculated refractive index (long solid curve-black color for up) and (long solid curve-red color for down) spectra of MnxZn1−xTe (x = 8% and 16%) crystals.
Crystals 09 00247 g008
Figure 9. Calculated reflectivity (long solid curve-black color for up) and (long solid curve-red color for down) spectra of MnxZn1−xTe (x = 8% and 16%).
Crystals 09 00247 g009
Figure 10. Calculated energy-loss spectrum (long solid curve-black color for up) and (long solid curve-red color for down) spectra for MnxZn1−xTe (x = 8% and 16%).
Crystals 09 00247 g010
Figure 11. Electrical conductivity (long solid curve-black color for up) and (long solid curve-red color for down) for MnxZn1−xTe (x = 8% and 16%) versus temperature.
Crystals 09 00247 g011
Figure 12. Temperature dependences of Seebeck coefficient (long solid curve-black color for up) and (long solid curve-red color for down) for MnxZn1−xTe (x = 8% and 16%).
Crystals 09 00247 g012
Figure 13. Thermal conductivity (long solid curve-black color for up) and (long solid curve-red color for down) dependences versus temperature for MnxZn1−xTe (x = 8% and 16 %).
Crystals 09 00247 g013
Figure 14. Temperature dependences of power factors (long solid curve-black color for up) and (long solid curve-red color for down) for MnxZn1-xTe (x = 8% and 16 %).
Crystals 09 00247 g014
Figure 15. Temperature dependence Figure of merit (long solid curve-black color for up) and (long solid curve-red color for down) for MnxZn1−xTe (x = 8% and 16%).
Crystals 09 00247 g015

