Article

On Crystal Mosaicity in Single Crystal Ni-Based Superalloys

1
Institute for Materials (IFM), Ruhr University Bochum, Universitätsstraße 150, 44801 Bochum, Germany
2
Interdisciplinary Centre for Advanced Materials Simulation (ICAMS), Ruhr University Bochum, Universitätsstraße 150, 44801 Bochum, Germany
*
Author to whom correspondence should be addressed.
Crystals 2019, 9(3), 149; https://doi.org/10.3390/cryst9030149
Submission received: 22 February 2019 / Revised: 7 March 2019 / Accepted: 8 March 2019 / Published: 13 March 2019
(This article belongs to the Special Issue Fundamentals of Superalloys)

Abstract

:
In the present work, we investigate the evolution of mosaicity during seeded Bridgman processing of technical Ni-based single crystal superalloys (SXs). For this purpose, we combine solidification experiments performed at different withdrawal rates between 45 and 720 mm/h with advanced optical microscopy and quantitative image analysis. The results obtained in the present work suggest that crystal mosaicity represents an inherent feature of SXs, which is related to elementary stochastic processes which govern dendritic solidification. In SXs, mosaicity is related to two factors: inherited mosaicity of the seed crystal and dendrite deformation. Individual SXs have unique mosaicity fingerprints. Most crystals differ in this respect, even when they were produced using identical processing conditions. Small differences in the orientation spread of the seed crystals and small stochastic orientation deviations continuously accumulate during dendritic solidification. Direct evidence for dendrite bending in a seeded Bridgman growth process is provided. It was observed that continuous or sudden bending affects the growth directions of dendrites. We provide evidence which shows that some dendrites continuously bend by 1.7° over a solidification distance of 25 mm.

Graphical Abstract

1. Introduction

Single crystal Ni-based superalloys (SXs) are high-temperature materials which can withstand mechanical loads at temperatures above 1000 °C. They are used to manufacture first stage blades in gas turbines for energy production and aero engines [1,2,3]. Creep research throughout the last few decades has shown that mechanical high-temperature properties strongly depend on microstructure [2,4,5,6,7]. Therefore, the evolution of the microstructure during processing of SXs is important because processing strongly affects the microstructure [2,8,9,10,11]. It is also well known that the production of high-quality SX components is no trivial task [6,12,13,14].
Careful control of solidification and heat treatment conditions is required to understand how dendritic and interdendritic regions form, and how the well-known γ/γ’ microstructure evolves [11,15,16,17,18,19,20]. In the present work, we focus on the evolution of the cast microstructure. While there is a good understanding on how large-scale (cast microstructure: dendritic and interdendritic regions, cast microporosity [21], segregation [15,17,18,19], and defects such as freckles [22,23,24], stray grains [25,26] and slivers [27]) and small-scale heterogeneities (γ’ volume fractions, γ’ sizes, γ channel widths, [15,28,29,30]) affect performance and how they can be controlled, there is one aspect which has received insufficient attention. With other single crystals, SXs share the phenomenon of mosaicity, which was first described by C.G. Darwin [31]. Experimental bulk SXs do not represent perfect single crystals. Instead, they exhibit a substructure which consists of individual crystalline regions which are slightly misoriented with respect to each other. In SXs these zones represent subgrains containing one or several dendrites which are separated by low angle grain boundaries (LAGBs) [32,33,34]. The corresponding misorientation angles are small (e.g., < 2°) and they are not always considered. However, the physical nature of mosaicity needs to be clarified for a full understanding of SX microstructures. Technical SXs always show dendritic microstructures which are associated with mosaicity. The scientific objective of the present work, therefore, is to rationalize SX mosaicity on the basis of elementary processes associated with the formation and evolution of dendritic microstructures [35,36,37].
Mosaicity, as shown in Figure 1, is a general microstructural feature of SXs as has been documented by Klam and Blank [33] as early as 1989. Since then, various studies on mosaicity have been conducted considering different types of samples, including cylindrical laboratory specimens [11,32,33], complex superalloy turbine blades [38,39,40,41] and other geometries [42,43,44,45,46]. It has been suggested that SX mosaicity is caused by the deformation of dendrites in the mushy zone during solidification [38,42,43,46,47,48,49]. In a directional solidification process SXs form by the growth of dendritic arrays. Each primary dendrite grows in a <001> direction. The formation of SX without mosaicity would require that all dendrites grow in a parallel manner. This is not the case in a realistic solidification scenario where slight misorientations up to several degrees are not unusual [11]. The mechanical deformation of individual dendrites during solidification results in crystal lattice rotations and thus in misorientations. A detailed overview of dendrite deformation phenomena has been published by Doherty [50]. In several publications, thermal and shrinkage stresses were invoked to explain the deformation of dendrites [38,50,51,52,53]. Other explanations, such as convective forces [54,55,56], precipitation-related phenomena [45], interactions with the mold wall [47,48,49], gravity [49] and asymmetric distributions of the solute around dendrite stems [46] have also been put forward.
Although it is widely accepted that dendrite bending represents the main origin of mosaicity in SXs [38,42,43,46,47,48,49], experimental evidence which supports this claim is scarce. Most previous studies used diffraction-based methods, such as the Laue method [33], (multi-axial) X-ray diffraction analysis [34,57,58,59], orientation imaging in the scanning electron microscope (SEM) by electron back scatter diffraction (EBSD) [38,42,43,48,53], X-ray topography [39,40,41,44,46,47,49,57,60] and γ-ray characterization [44,45]. Most of these techniques only reveal crystallographic information but do not provide information on the morphology of dendritic microstructures. Only three studies reported the direct observation of dendrite deformation [47,48,49]. These studies involve in-situ solidification experiments in a synchrotron beamline. Aveson et al. [47,48] considered SXs, while Reinhart et al. [49] obtained comparable results from an Al-Cu-based alloy. All previous studies document deformation processes like elastic forward and backward bending of dendrite parts during solidification [49]. However, the underlying solidification conditions in these experiments differ from conventional, unconstrained solidification. For the sake of X-ray transparency, the samples were thinner than a typical average dendrite spacing in an SX [61]. Thus, the mechanical interaction with the mold wall could directly affect dendrite growth and cause dendrite deformation.
In the present work, we investigate the formation and evolution of crystal mosaicity in a seeded Bridgman solidification process [11]. We use advanced optical microscopy in combination with quantitative image analysis and orientation imaging in the SEM. Efforts were made to evaluate the evolution of dendrite growth directions for large sampling fields (>50 dendrites), to investigate the effects of different solidification velocities, and to document the occurrence of dendrite bending events. The results are discussed in light of the present understanding of superalloy solidification and dendrite deformation processes.

2. Materials and Methods

Crystal growth/solidification experiments. A Bridgman furnace of type KZV-A40-400/161G-V from Gero GmbH (Neuhausen, Germany) was used to prepare 12-mm diameter ERBO1 (a CMSX-4 type alloy) single crystal cylinders with a length of 120 mm. A seed method was used to impose a precise <001> growth direction. All details describing the melting feedstock, seeds, crucibles, furnace geometries and process parameters are given in the literature [11]. Prior to solidification, the Bridgman furnace was heated to 1550 °C. Bridgman solidification was performed under a thermal gradient close to 11 K/mm [11], imposing solidification rates of 45, 180 and 720 mm/h. Precisely oriented seeds were obtained from a laboratory slab which was carefully characterized [15] using an interactive procedure involving Laue orientation and spark erosion machining. The material which was used as feedstock was purchased from Alcoa Howmet (Whitehall, USA). Further experimental details are given in Reference [11]. Figure 2a–f show optical micrographs of the cast material states.
The left column of Figure 2 (Figure 2a,c,e) presents cross-sectional micrographs where the viewing direction is parallel to the macroscopic solidification direction. The right column of Figure 2 (Figure 2b,d,f) contains longitudinal cross-sections. The three rows in Figure 2 correspond to three different withdrawal rates: Figure 2a,b (45 mm/h), Figure 2c,d (180 mm/h) and Figure 2e,f (720 mm/h). The direction of the longitudinal axis zS of the cylindrical bar is indicated on all micrographs. Figure 2 clearly shows that increasing withdrawal rates result in finer cast microstructures, especially in smaller primary and secondary dendrite arm spacings. Table 1 lists values for primary dendrite arm spacings (PDASs) for the three different material states.
Microstructural characterization. In the present study, an effort was made to quantify the evolution of individual dendrite growth directions. Dendrite growth directions were measured on longitudinal cross-sections as illustrated in Figure 3. Figure 3a shows how the projected angles δM (angle between central axis of the cylindrical bar and the dendrite growth direction) and δGB (angle between two neighboring dendrites) were determined. Angles were measured using the graphics software package Corel Draw X5 [62]. Figure 3b presents an optical micrograph with a reference line perpendicular to the central axis of the cylindrical bar which intersects with 8 dendrites. The two diagrams next to the optical micrograph show the δM and δGB angles for these 8 dendrites. We will use this simple 2D method later to identify specific trends in the evolution of microstructures during solidification. For the interpretation of our microstructural data, it is important to quantify the accuracy of our manual method. For this purpose, distributions of δM and δGB angles were evaluated for 52 dendrites in a large sampling field. These measurements were performed six times by one user on six different days. The results presented in Figure 4 show how the results vary. This is illustrated by plotting the difference between each individual measurement from days 2 to 6 and the measurement from day 1 (reference measurement yielding δMref and δGBref). As can be seen from Figure 4, the deviations—in a first order approximation—can be well represented by Gauss distributions. The corresponding standard deviations are smaller than 0.5°, which is sufficiently low. A second type of quantitative image analysis was performed on micrographs of the type shown in Figure 2b,d,f to trace specific dendrite growth paths. With help of the software ImageJ [63,64], the positions of individual dendrites were determined along their growth paths. The resulting coordinates were evaluated by applying a numerical fit procedure. This allowed to identify positions where individual growth paths deviated from straight lines, indicating dendrite bending. All optical micrographs were obtained from as-cast SXs which were etched using a solution consisting of 100 mL H2O, 100 mL HCl, 100 mL HNO3 and 3 g MoO3. The different material states were characterized using an optical microscope of type Zeiss Axio. Samples for metallographic characterization were cut from the cylindrical SX bars using a high precision cutting machine of type Struers Secotom-10. Specimen surfaces were prepared by common metallographic procedures. The final polishing step was performed using a 1 μm diamond suspension. In addition to optical microscopy, superalloy microstructures were characterized by orientation imaging SEM using a new correlative EBSD method with a high angular resolution (RVB-EBSD method [65]). This technique yields a significantly higher angular resolution as conventional EBSD. For the visualization of RVB-EBSD data, a new type of color-code was used, which allows to appreciate small changes in crystallographic orientation. SEM was performed at 30 kV using an FEI Quanta FEG 650 equipped with an EBSD detector of type EDAX Ametek Hikari. Orientation imaging was performed using a step size of 3.3 μm, which was significantly smaller than the spacing between primary dendrites (of the order of 200 µm).
Numerical simulations. In the present study, the finite element modeling (FEM) software package Wincast Expert from RWP GmbH in Roetgen, Germany, was used to calculate temperature profiles during processing. The derived liquidus and solidus isotherms are important as their shapes affect dendrite growth competition and thus the evolution of dendrite growth directions during solidification. The geometry and thermal properties (best available data from References [66,67,68,69]) of all relevant elements of the furnace/crucible-assembly (e.g., heaters, crucible, feedstock, baffle, cooling chamber, …) were considered and a model consisting of more than 7 million nodes was used for the calculations [11]. While previous FEM calculations were performed based on a static scenario, in the present work, dynamic aspects associated with varying withdrawal rates are considered. Figure 5 illustrates our FEM procedure and compiles relevant results. Figure 5a contains a simplified schematic drawing of our setup. Two coordinate systems are used to specify positions. The coordinates xS and zS represent the sample coordinate system which is fixed to the solidifying sample. zS is parallel to the longitudinal axis of the SX cylinder. The position zS = 0 mm corresponds to the lower end of the cylinder, i.e., the lower part of the seed crystal. A second coordinate system is fixed to the moving furnace, where zBF = 0 corresponds to the upper end of the baffle. Figure 5b contains color-coded FEM results which show how slow (45 mm/h) and fast (720 mm/h) withdrawal rates affect temperature profiles. Most importantly, the solidification rate affects the positions and shapes of the liquidus and solidus isotherms (red and blue lines in Figure 5b). Experimental results supporting the FEM data are presented in Figure 5c,d. Figure 5c shows an optical micrograph obtained from a polycrystalline superalloy sample which was heated to 1550 °C, held in the liquid state for 30 min, and then rapidly cooled. The resulting microstructure of the region which was fully liquid prior to rapid cooling differs from what could be observed in the remaining part of the superalloy bar. The crosses mark the transition region between the prior mushy zone and the melt, which corresponds to the liquidus isotherm. The same position data are presented in Figure 5d together with predictions of the FEM calculations, which were performed for the same conditions as the experiment. The good agreement between the two data sets in Figure 5d confirms the reliability of our FEM method. The two dashed horizontal lines in Figure 5d represent the upper and lower end of the baffle which was used in the process.

3. Results

Evolution of dendrite growth directions.Figure 6 compiles microstructural information which was collected from different height positions of a cylindrical SX bar which solidified under a withdrawal rate of 180 mm/h. Four sets of images are presented, each consisting of one optical micrograph and two distributions, showing how the angles δM (dendrite growth direction) and δGB (angle between two neighboring dendrites) vary across the SX bar. Figure 6a represents the seed crystal. The majority of δM values have small negative numbers which proves that the seed was slightly misoriented. The data in Figure 6a also indicate that the seed is characterized by some scatter in δM and δGB over the cross-section of the bar. Figure 6b,d illustrate how the parameters which characterize the dendritic microstructure change as one moves up the bar to zS positions of 14, 41 and 100 mm. Figure 6a shows that the seed material has a relatively coarse primary dendrite arm spacing close to 500 µm. In contrast, all parts of the newly-grown SX cylinder show much finer dendrite spacings (Figure 6b–d). This is related to the high-temperature gradient which characterizes our method [11].
The δM and δGB data in Figure 6b–d allow to identify two important trends. First, as we move from the lower to the upper part of the cylinder, the scatter in δM and δGB angles increases. The standard deviations for both parameters, σ0M) and σ0GB), and the maximum and minimum angles listed in the rectangular inserts in the evaluation plots of Figure 6 describe this trend which can easily be appreciated by the wider data spreads for later solidification stages. The results presented in Figure 6 suggest that the single crystal quality decreases during solidification. Second, the micrographs, as well as the evolution of the δM distributions, suggest that dendrites have a tendency to grow outwards, away from the central bar axis. This effect is known as fanning in the literature [46]. Figure 7 compiles raw data presented in Figure 6 and shows how average, minimum/maximum values and standard deviations evolve during solidification, i.e., when moving from the lower to the upper end of the technical single crystal (increasing zS-values). The vertical dashed lines in Figure 7a,b separate the back melted seed (on the left) and the newly grown crystal (right sides of the lines). The data presented in Figure 7a highlight one key feature of crystal mosaicity: While the average orientation of all dendrites remains almost constant, the scatter in dendrite orientations increases. However, this does not hold for the max./min. values and the standard deviation. The same trend was observed for the misorientations between individual dendrites (Figure 7b). Figure 8 presents results obtained from another crystal which was grown at a higher velocity of 720 mm/h. The optical micrographs, the distributions of δM and δGB angles in Figure 8a,b and the data compilations in Figure 8c,d indicate qualitative similar trends as reported above for the slower solidification rate of 180 mm/h. There is, however, one important difference: at a higher solidification rate, the microstructural scatter with respect to δGB angles is less pronounced.
Figure 9 represents a compilation of dendrite orientation data for seven SX cylinders. Figure 9a shows how standard deviations of dendrite growth angles σ0M) evolve during solidification. The data are plotted as a function of the longitudinal specimen coordinate zS. Data points on the left of the dashed vertical line are seed data, while data points on the right were measured on longitudinal sections of the newly-grown crystals. The results show that as solidification proceeds, the scatter in dendrite orientations increases. It is interesting to see, that in one case, for an SX bar which solidified at a rate of 720 mm/h, the high starting scatter in the seed was (apparently) not passed on to the new crystal (one of the blue curves in Figure 9a connecting the blue triangular symbols). In case of one ingot prepared at a solidification rate of 45 mm/h, a local maximum followed by a decrease in the dendrite orientation spread was observed in the later solidification stages (one of the three black curves in Figure 9a, with full circular symbols). While there is a large scatter in Figure 9a, one can see that there is a general trend: scatter in dendrite directions increases during solidification. Figure 9b shows how the standard deviations of angles between neighboring dendrites σ0GB) of the seven SX ingots evolve during solidification at different growth rates. The two SX bars which were processed at a high solidification rate of 720 mm/h show low scatter in misorientations, which does not change during solidification. For the five other ingots, it was observed that the σ0GB) values characterizing the material states obtained from the late stages of crystal growth (corresponding to high zS positions) are larger than in the case of the seed material. From Figure 7 and Figure 8 we know that the actual angular scatter is not really large. However, the results presented in Figure 9 reveal that there is scatter in the growth directions and misorientation angles of dendrites, which can differ between most SX bars, even when they were prepared under identical experimental boundary conditions.
Dendrite bending during solidification and crystallographic analysis. In the previous sections, crystal mosaicity has been analyzed evaluating dendrite growth directions. We now switch to a different type of analysis which focusses on dendrite growth paths (Figure 10). The optical micrograph in Figure 10a shows a longitudinal cross-section of an SX cylinder which was prepared at a withdrawal rate of 45 mm/h. We keep in mind that the left and right parts of Figure 10a correspond to the early and later stages of the solidification. The micrograph in Figure 10a represents a rare case, where all dendrites lie in the cross-section, such that specific dendrites can be traced over relatively large distances. Three dendrites are highlighted by blue, brown and green arrows in Figure 10a. The growth trajectories of these dendrites were investigated by image analysis as illustrated in Figure 10b. The small crosses in Figure 10b indicate the centers of the primary dendrite arms, for which coordinates were determined. For the three selected dendrites, these coordinates are plotted in Figure 10c as a function of the local image coordinate zi, which is parallel to the longitudinal axis of the SX cylinder. Figure 10c allows us to prove that the growth paths of the three dendrites do not precisely follow straight lines. The start and end regions of the different data sets are characterized by different growth angles which can vary from 1.4° to 3.1° during the ≈25 mm of crystal growth. In Figure 10d the deviation Δxi between the measured data (symbols) from linearity (red line in Figure 10c) is plotted for each of the three growth paths. From the results, one must conclude that there is continuous dendrite bending during solidification.
Figure 11 presents more metallographic evidence for dendrite bending. Figure 11a is an optical micrograph taken from the same type of longitudinal cross-section as introduced in Figure 10 (left part of micrograph: early stage of the solidification; right part: later solidification stage). In Figure 11a, one dendrite is marked by three white arrows. A closer look at this dendrite reveals that it has suffered two bending events during solidification at the locations marked by the two red arrows. These bending events cause the non-linear solidification path shown in Figure 11b. The growth path does not follow the straight dashed blue line shown in Figure 11b. Three straight red line segments which intersect at angles close to 1.6° better describe the dendrite coordinates. We note that the intersection points of the straight lines correspond to the regions where dendrite bending occurs. Figure 11c documents how the deviation from linearity evolves as we move from the left to the right side of Figure 11a along the local image coordinate zi. The data presented in Figure 11 prove that the growth path of the dendrite cannot simply be rationalized by one straight line (blue dashed reference line). However, a three-line fit (red lines) matches the growth path quite well. These results clearly show that the corresponding dendrite has experienced a back-and-forth type of bending within a growth interval close to 16 mm.
The microstructural results in Figure 12 confirm that different dendrite orientations correlate with different crystal orientations. Figure 12a shows an SEM back scatter electron (BSE) micrograph with dendrites growing from the left to the right. Two dendritic regions are marked by arrows. Their subgrain structure is presented in the RVB-EBSD/OIM plot of Figure 12b, where crystal orientations are mapped using the color-coding specified in the pole figure of Figure 12c. RVB-ESBD can identify full crystallographic details and is not restricted to projected 2D orientation data as in the case of the dendrite growth angle analysis (Figure 3, Figure 6 and Figure 8). The pole figure shows the distribution of the primary [001] crystal directions which are very close to the longitudinal axis zS. The pole figure was rotated 90° towards the viewing direction which characterizes the BSE and EBSD micrographs presented in Figure 12. The color-coded orientation mapping in Figure 12b proves that specific dendrites with different growth directions are characterized by different crystal orientations.
In order to interpret the morphology of the as-cast dendrite structures in the cylindrical bar, one has to know how the positions and shapes of liquidus and solidus isotherms evolve during casting, and how they depend on withdrawal rates. The corresponding results are important, as liquidus and solidus isotherms generally affect dendrite growth competition/selection processes, and thus the evolution of dendrite growth directions during solidification. Different casting stages (early, intermediate and late) correspond to different zS-values in the bar (low: 14 mm; intermediate: 50 mm; high: 100 mm). The corresponding information for liquidus line data is given in Figure 13a–c, which corresponds to solidification rates of 45, 180 and 720 mm/h. In all three figures, there are two horizontal dashed lines which represent the upper and lower ends of the baffle. For slow solidification rates, the location of the liquidus temperature with respect to the baffle, zBF (see definition in Figure 5a), hardly changes and the curves which correspond to different solidification stages are close to each other. For a withdrawal rate of 45 mm/h, the isotherms show a convex curvature, Figure 13a. This is in agreement with similar data reported in the literature [70,71]. As the withdrawal rate increases, the distance between the upper end of the baffle and the solidus isotherm increases (Figure 13b,c). It should be outlined that for a solidification rate of 180 mm/h all curves remain convex. In contrast, for a solidification rate of 720 mm/h, a transient behavior can be observed. Note that for high solidification rates, the concave liquidus isotherms associated with intermediate and later stages of solidification are close to the lower end of the baffle (Figure 13c).

4. Discussion

Evolution of mosaicity. In the present work, we study the evolution of crystal mosaicity in SX using optical microscopy in combination with quantitative image analysis. In contrast to other studies, mosaicity is analyzed on the basis of projected dendrite growth directions, Figure 3. The comparison between this type of microstructural data and crystallographic EBSD results in Figure 12 confirms that deviations of dendrite orientation are directly associated with deviations in crystal orientation. However, our procedure can only assess projected 2D data. Thus, it does not allow us to measure the real angle between dendrites, neither does it reflect 3D aspects of dendrite growth. As a consequence, there is a need to further investigate the evolution of dendritic microstructures and crystal mosaicity using 3D serial sectioning techniques.
The results presented in Figure 6, Figure 7, Figure 8 and Figure 9 allow us to identify specific aspects of crystal mosaicity, which are related to two factors. First, the quality of the seed plays a role. The newly grown crystal not only inherits its crystallographic orientations from the seed crystal, additionally, the seed also passes its mosaicity on. The preparation and analysis of high-quality single crystals require that this aspect is considered. Second, a continuous deformation of dendrites also is a factor which contributes to mosaicity. Figure 6, Figure 7, Figure 8 and Figure 9 document that the degree of mosaicity progressively increases during solidification. This is in agreement with previous diffraction results reported in the literature [45,46]. The results obtained in the present work suggest that the major part of mosaicity is associated with continuous dendrite deformation by bending (Figure 10). The microstructural results presented in Figure 6, Figure 7, Figure 8 and Figure 9 suggest that misalignments in dendritic superalloy microstructures are characterized by two components: First, the orientation deviations between individual neighbor dendrites (corresponding to δGB angles in Figure 6, Figure 7b, Figure 8 and Figure 9b seem to be randomly distributed. These deviations do not give rise to projected angles in excess of 4°. Second, the observed outward growth of dendrites shown in Figure 6, Figure 7 and Figure 8 is systematic. This phenomenon was observed for all material states considered in the present work and did not depend on the solidification rate. All crystals prepared in the present study feature mosaicity. Our results suggest that mosaicity represents an inherent feature of SXs, which is directly related to the elementary processes which govern dendritic solidification. It is important to highlight that while mosaicity progressively increases during solidification, the average dendrite orientations remain nearly unaffected (Figure 7 and Figure 8). Another interesting observation is that each SX bar shows its own individual crystal mosaicity which always differs between different SXs, even when they were prepared using identical processing conditions (Figure 9). Dendritic solidification has a stochastic and chaotic nature, which accounts for this finding. Small initial differences in local dendrite orientations accumulate during solidification and it is difficult to predict the mosaicity fingerprint of a microstructure which forms in the late solidification stages.
Dendrite deformation and mosaicity.Figure 14 schematically illustrates elementary mechanisms which account for crystal mosaicity. The different growth directions of dendrites result in the formation of subgrains and LAGBs. The results obtained in the present work suggest that dendrite misorientations mainly result from primary dendrite bending. Moreover, bending of secondary dendrite arms can be observed from which misoriented tertiary dendrites emanate, as proposed by Bogdanovicz et al. [39] (Figure 14). This process was only rarely observed in the present study. Further work is required to experimentally address such branching events.
The present study provides direct evidence for dendrite bending during regular Bridgman solidification (Figure 10 and Figure 11). Differences in dendrite growth directions do not always need to be associated with variations in local crystal orientation. Doherty [50] subdivided dendrite bending into mechanical bending and morphological bending. He attributed mechanical bending to mechanical forces arising from thermal [45], shrinkage [51,52] or convective stresses [54,55,56,72,73]. These stress driven processes result in crystal lattice rotations. As discussed by Schaefer et al. [46], the mechanisms which cause dendrite bending operate on fairly large length scales. Figure 10 documents that dendrites bend by 1.7° within a growth interval of 25 mm. Morphological bending [50,74], on the other hand, represents a phenomenon where the alloy chemistry of the liquid phase locally affects undercooling conditions. This alters the preferential growth direction such that it deviates from the ideal direction promoted by crystallography [75,76]. Morphological bending only has a weak effect on the crystal lattice orientation.
It is not easy to clarify whether dendrite bending, as observed in Figure 10 and Figure 11, is governed by mechanical or morphological bending. Efforts to clarify this by using EBSD were not in all cases successful. The absolute accuracy of our EBSD/SEM hardware setup is insufficient to reliably detect angular differences of the order of 1° over larger distances (here: several centimeters). Nevertheless, preliminary results (not shown here) suggest that the type of dendrite deformation observed in Figure 10 represents mechanical bending. In contrast, no significant change in crystal orientation could be observed for the case of the sample region presented in Figure 11, where one isolated dendrite bends back and forth by 1.6° during several millimeters of growth. This is probably the result of a pure morphological bending which resulted from chemical interactions between neighboring dendritic regions during solidification. We finally consider the outward growth of dendrites, Figure 6 and Figure 8. One may feel that this macroscopic phenomenon is related to the presence of convex liquidus/solidus isotherms during solidification (Figure 5b and Figure 13c). It is not unreasonable to assume that the convex shape of the isotherms promotes the outward growth of dendrites. But since outward growth is also observed for high solidification rates where solidification is governed by concave isotherms, Figure 13c, this cannot be the explanation. The results presented in Figure 10 suggest that outward growth is governed by dendrite bending. This can be related to mechanical interactions between the mushy zone microstructure and the crucible wall. Siredey et al. [45] suggested that the precipitation of secondary γ’ particles, which occurs during Bridgman processing, significantly affect thermal expansion coefficients. When the resulting non-uniform shrinkage is large enough it may well affect dendrite growth in the mushy zone. By combining diffraction experiments with FEM calculations, Siredey et al. [45] predicted the type of geometrical distortion which we observed in our solidification experiments (Figure 6 and Figure 8 (see Figure 14 in Reference [45])).
How to minimize crystal mosaicity. The results of the present study allow us to discuss measures which could help to minimize mosaicity. The microstructural data presented in Figure 9b suggest that the two SX bars prepared with a solidification rate of 720 mm/h yield the lowest misorientations between dendrites. This indicates that faster solidification rates are beneficial because they result in less dendrite deformation. For a complete understanding of microstructure evolution during processing of SXs superalloys, this aspect is well worth further consideration. It seems surprising that a fast solidification rate of 720 mm/h results in low dendrite misorientations. After all, the corresponding solidification conditions are associated with finer/thinner dendrite stems which can more easily bend. Additionally, the more intense microscale partitioning of alloy elements and the resulting stronger convective forces in the melt should result in the opposite behavior. Further work is required to analyze and to rationalize these findings on a sound statistical basis.
One possible option to minimize crystal mosaicity is to apply a rejuvenation treatment. Figure 15 shows different solidification scenarios which are associated with different levels of crystal mosaicity. In Figure 15a, dendrites grow in a tube-shaped crucible. In agreement with our observations (Figure 9, Figure 10 and Figure 11) dendrite misorientations continuously increase during solidification and thus there is a high degree of mosaicity in regions which solidified in the late processing stages. In Figure 15b a different scenario is shown. Here solidification occurs in a crucible with a constrained region. Only one dendrite manages to pass through this bottleneck part of the crucible. Further solidification is governed by dendrite branching events which establish a rejuvenated microstructure with low dendrite misalignments. Although this is a way to control mosaicity, it may not be applicable in Bridgman single crystal processing. Another possibility which may help to decrease mosaicity is presented in Figure 15c, where all dendrites have the same misalignment. During solidification, branching events continuously promote the formation of new dendrites. Due to geometrical constraints, these dendrites do not reach the critical lengths which go hand in hand with higher misorientation angles. This type of process may well operate in industrial turbine blade production when slightly misaligned dendrite arrays grow through thin-walled parts of a mold, where dendrites cannot reach critical lengths. The scenarios considered above are hypothetical, but the discussion shows that they are governed by highly interesting mechanisms which merit further study.

5. Conclusions

In the present study, we investigate the evolution of crystal mosaicity in Ni-based superalloy single crystals during seeded Bridgman processing. We interpret crystal mosaicity by invoking variations of dendrite growth directions which were carefully determined using advanced optical microscopy in combination with quantitative image analysis. The following key findings were obtained:
1)
Crystal mosaicity represents an inherent feature of dendritic single crystal superalloy microstructures related to elementary stochastic processes which govern solidification.
2)
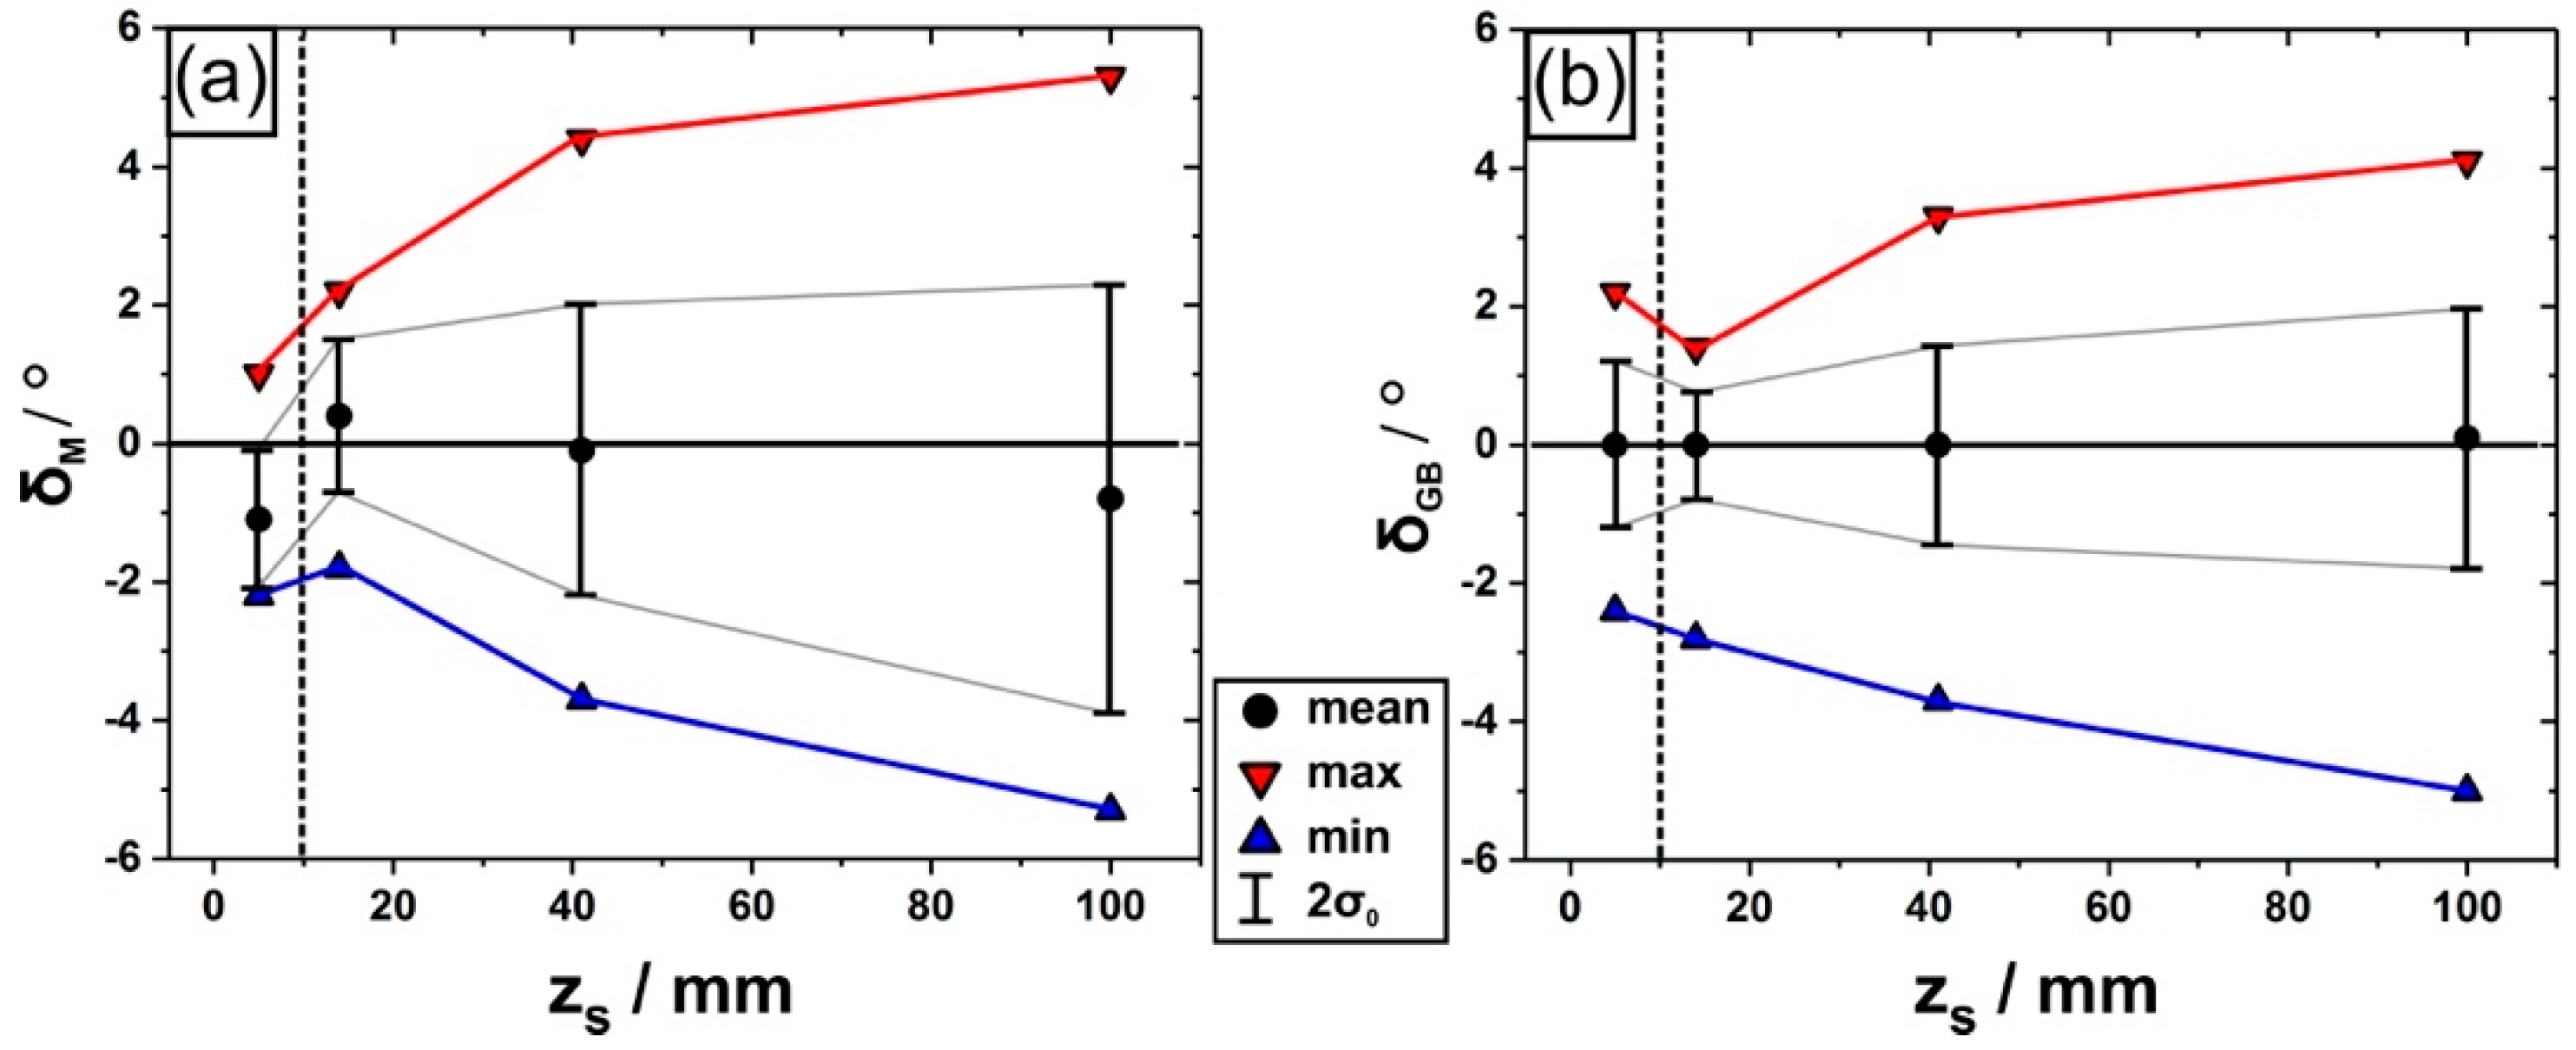
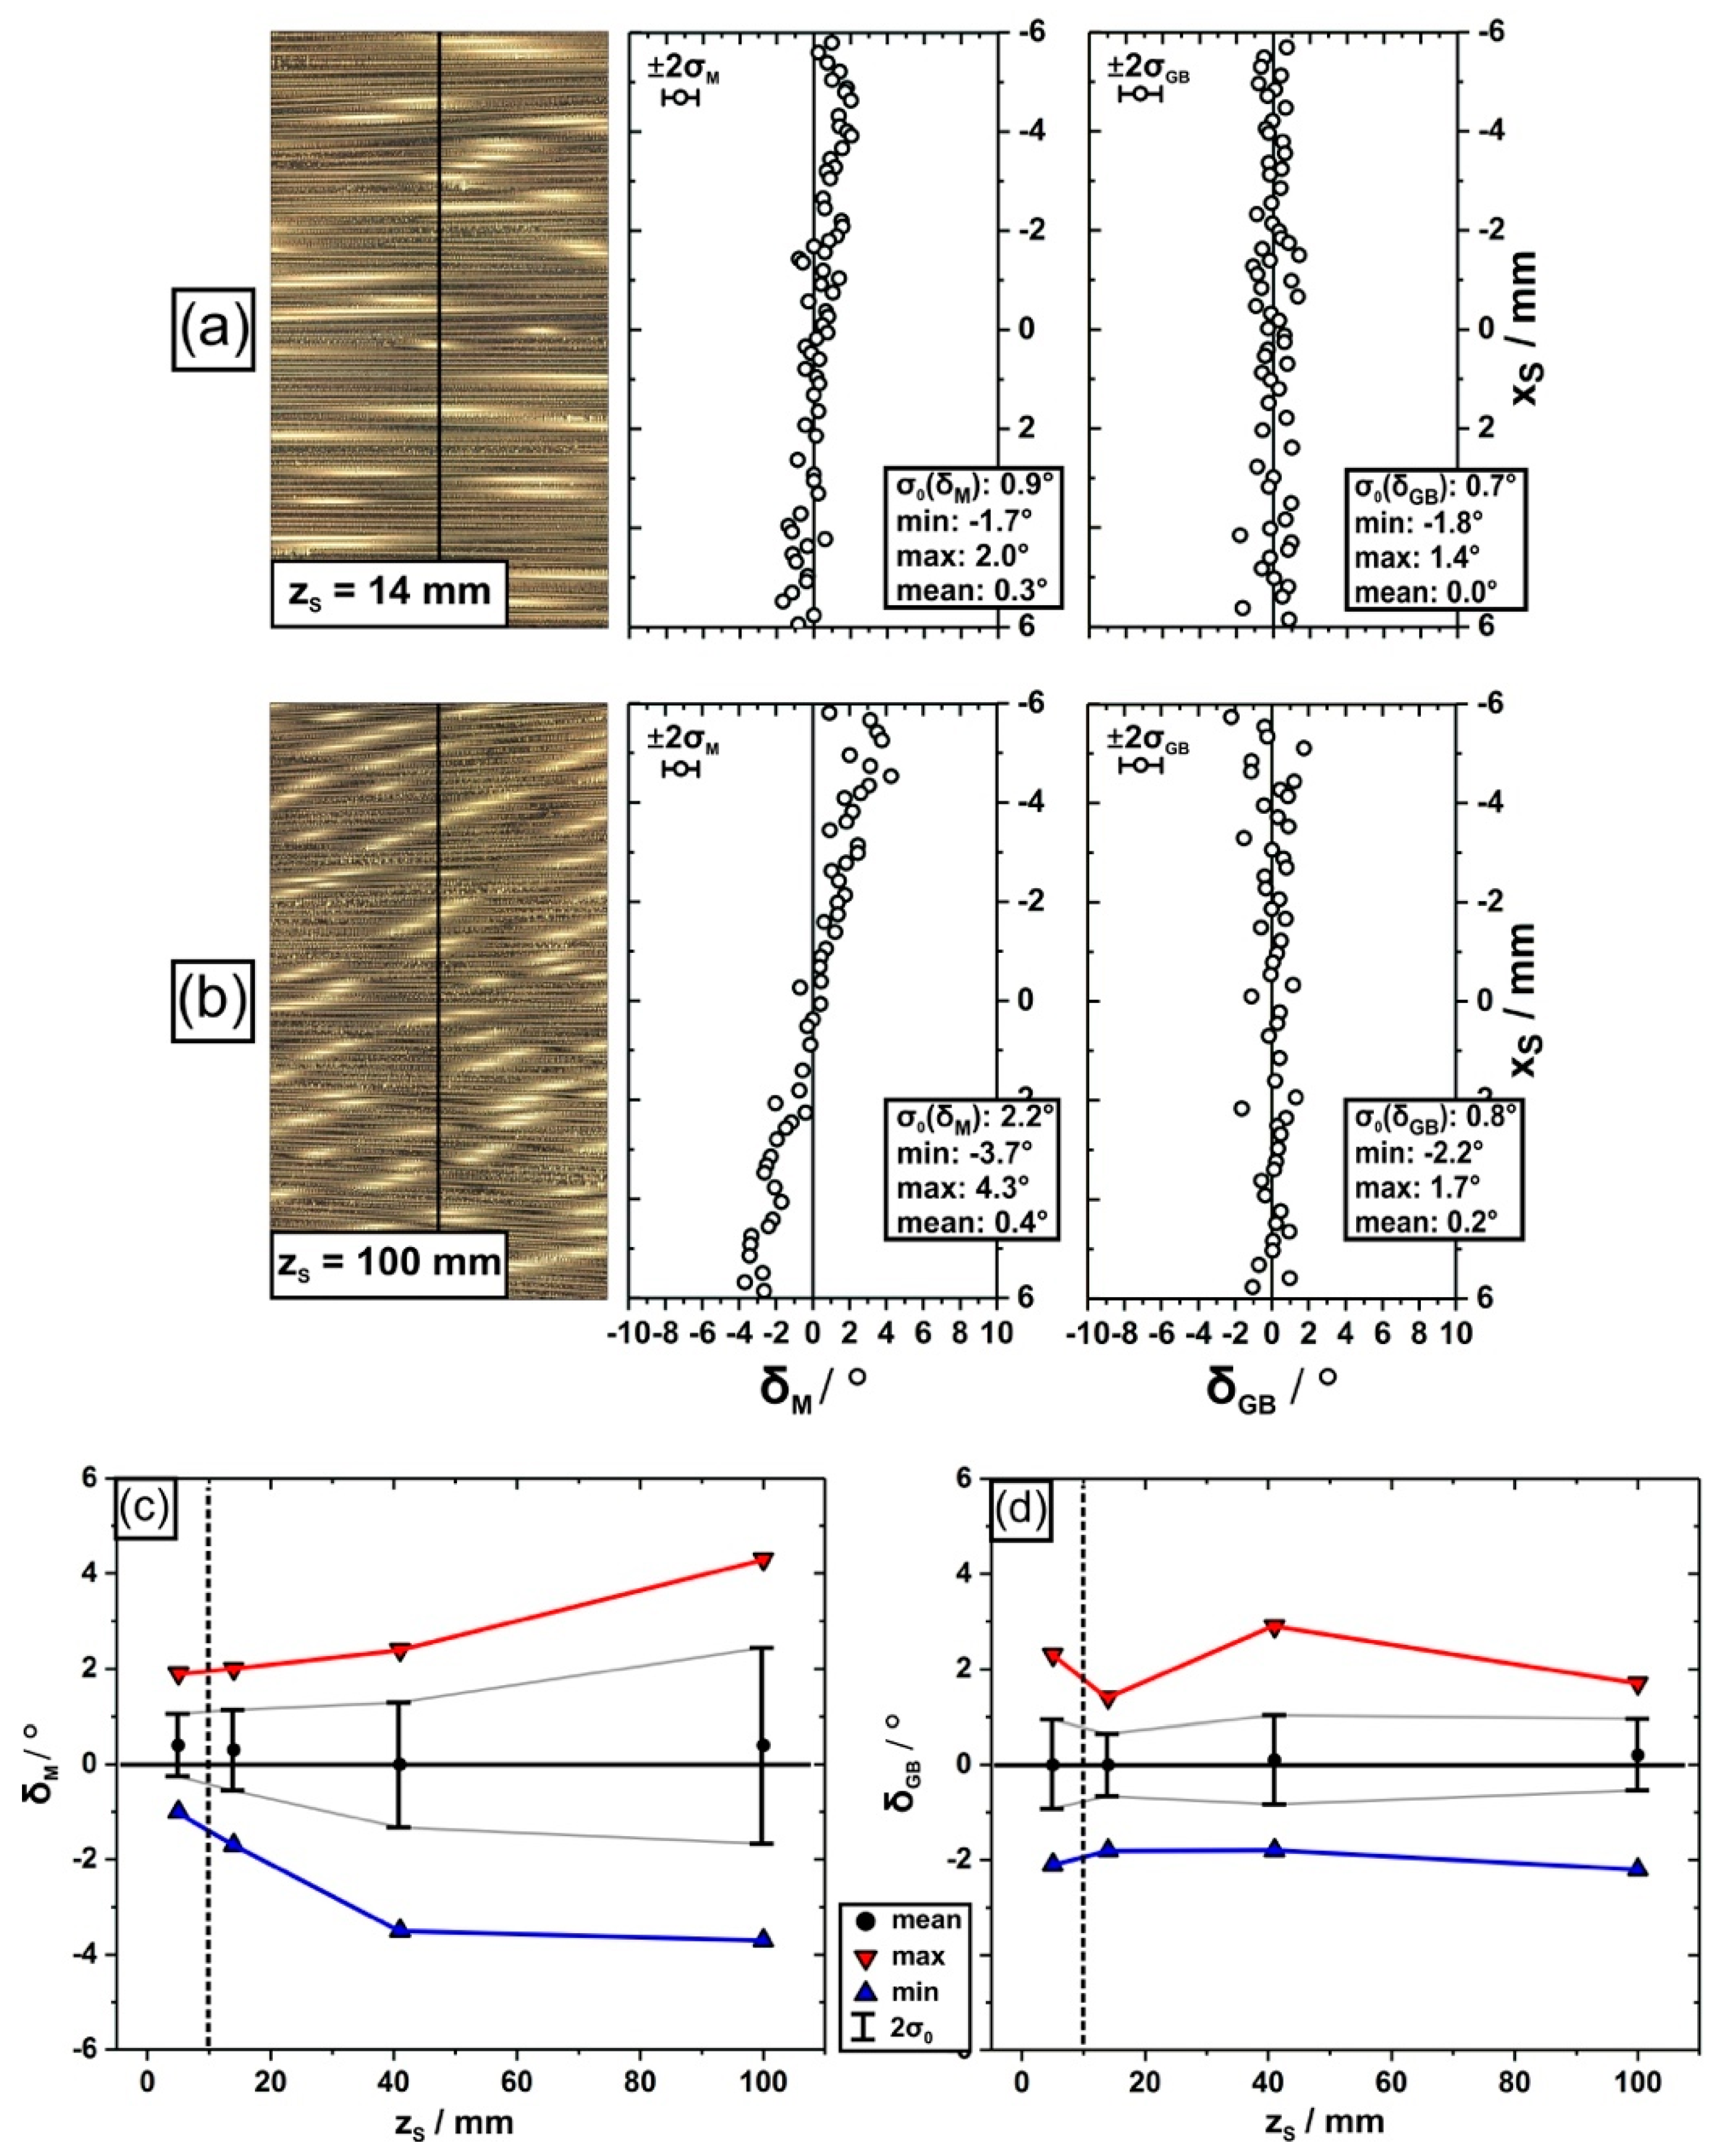
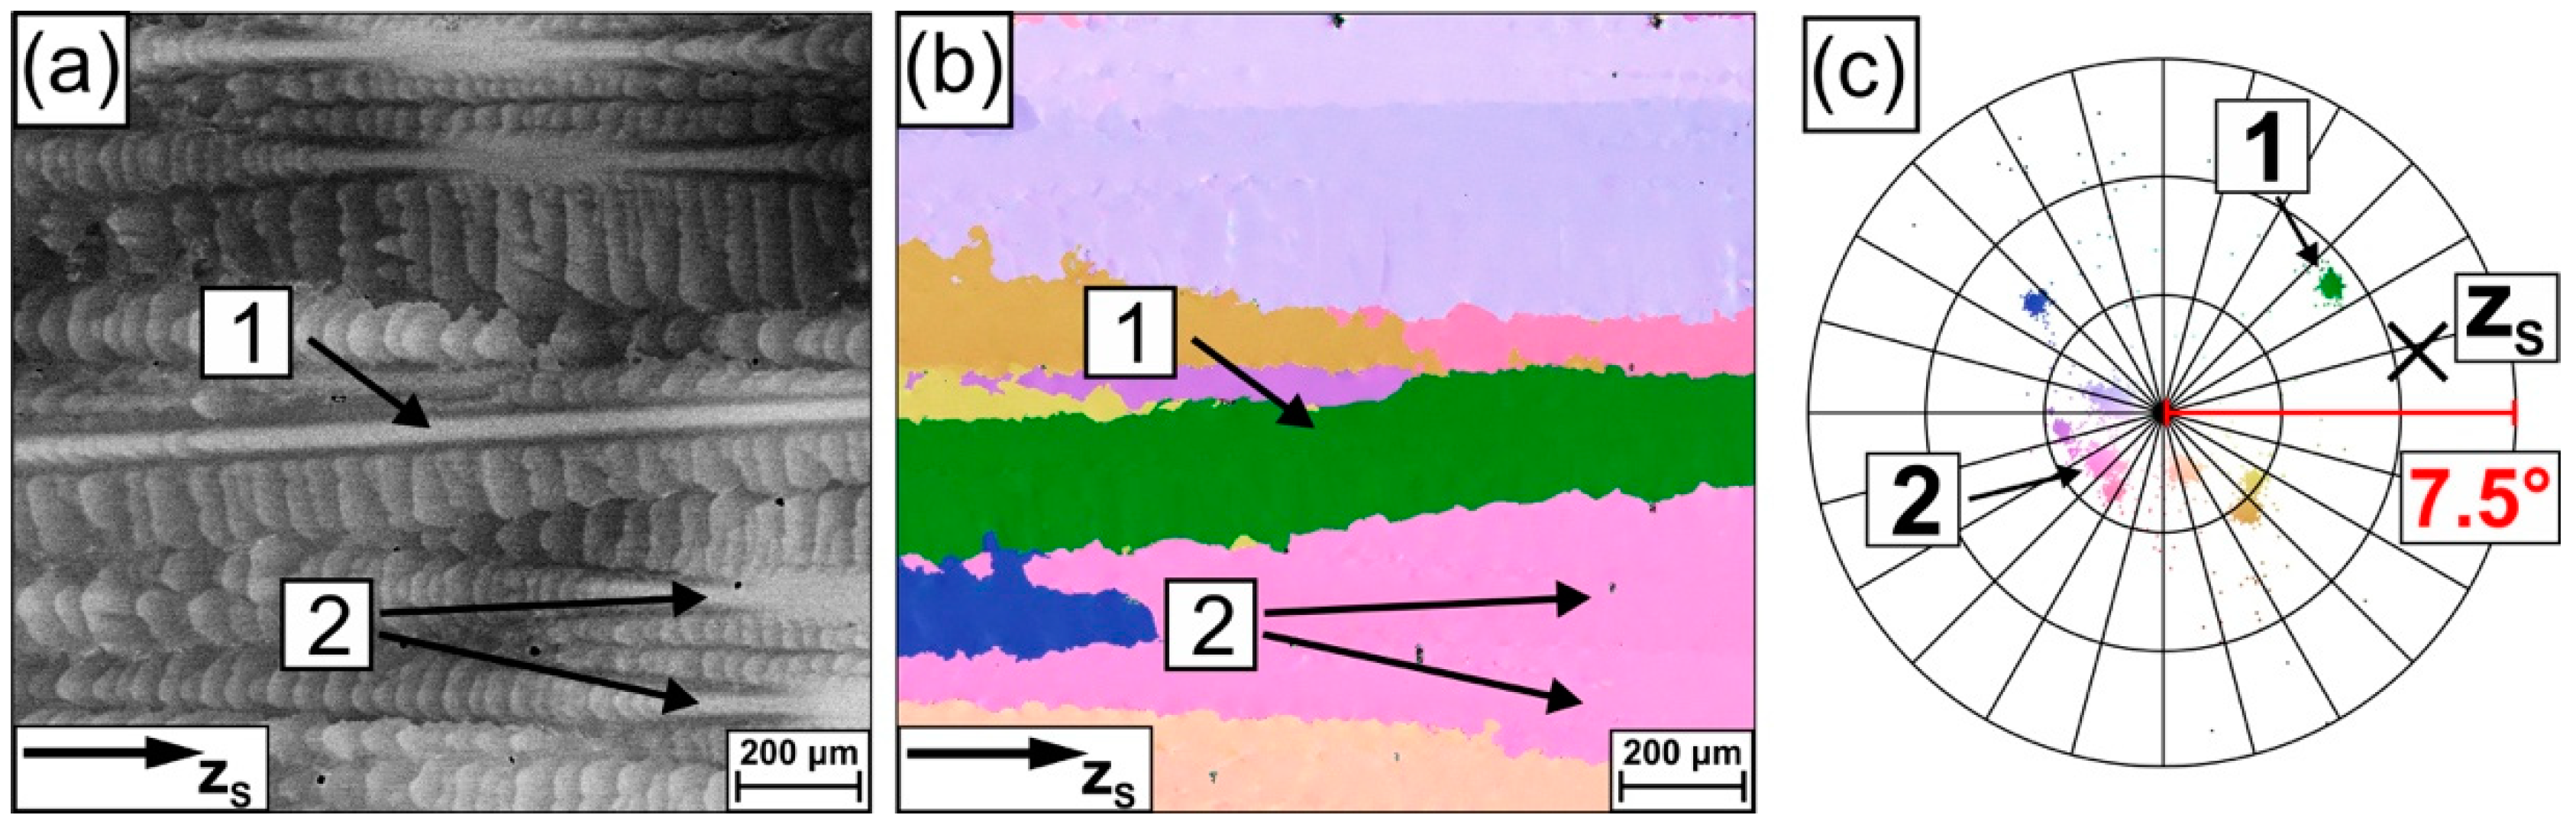
Two sources of mosaicity have been identified: First, mosaicity is inherited from the seed crystal which is used to impose crystallographic target directions. Second, the degree of mosaicity increases by dendrite deformation, while the average dendrite/crystal orientations remain constant.
3)
Almost every single crystal investigated in the present study has its own mosaicity fingerprint. Two crystals always differ in this respect, even when they were made using identical processing conditions. Small differences in the orientation spread of the seed crystals, as well as small stochastic orientation deviations, continuously accumulate during solidification. This eventually results in individual misorientation types and it represents an experimental evidence for the chaotic nature of mosaicity evolution.
4)
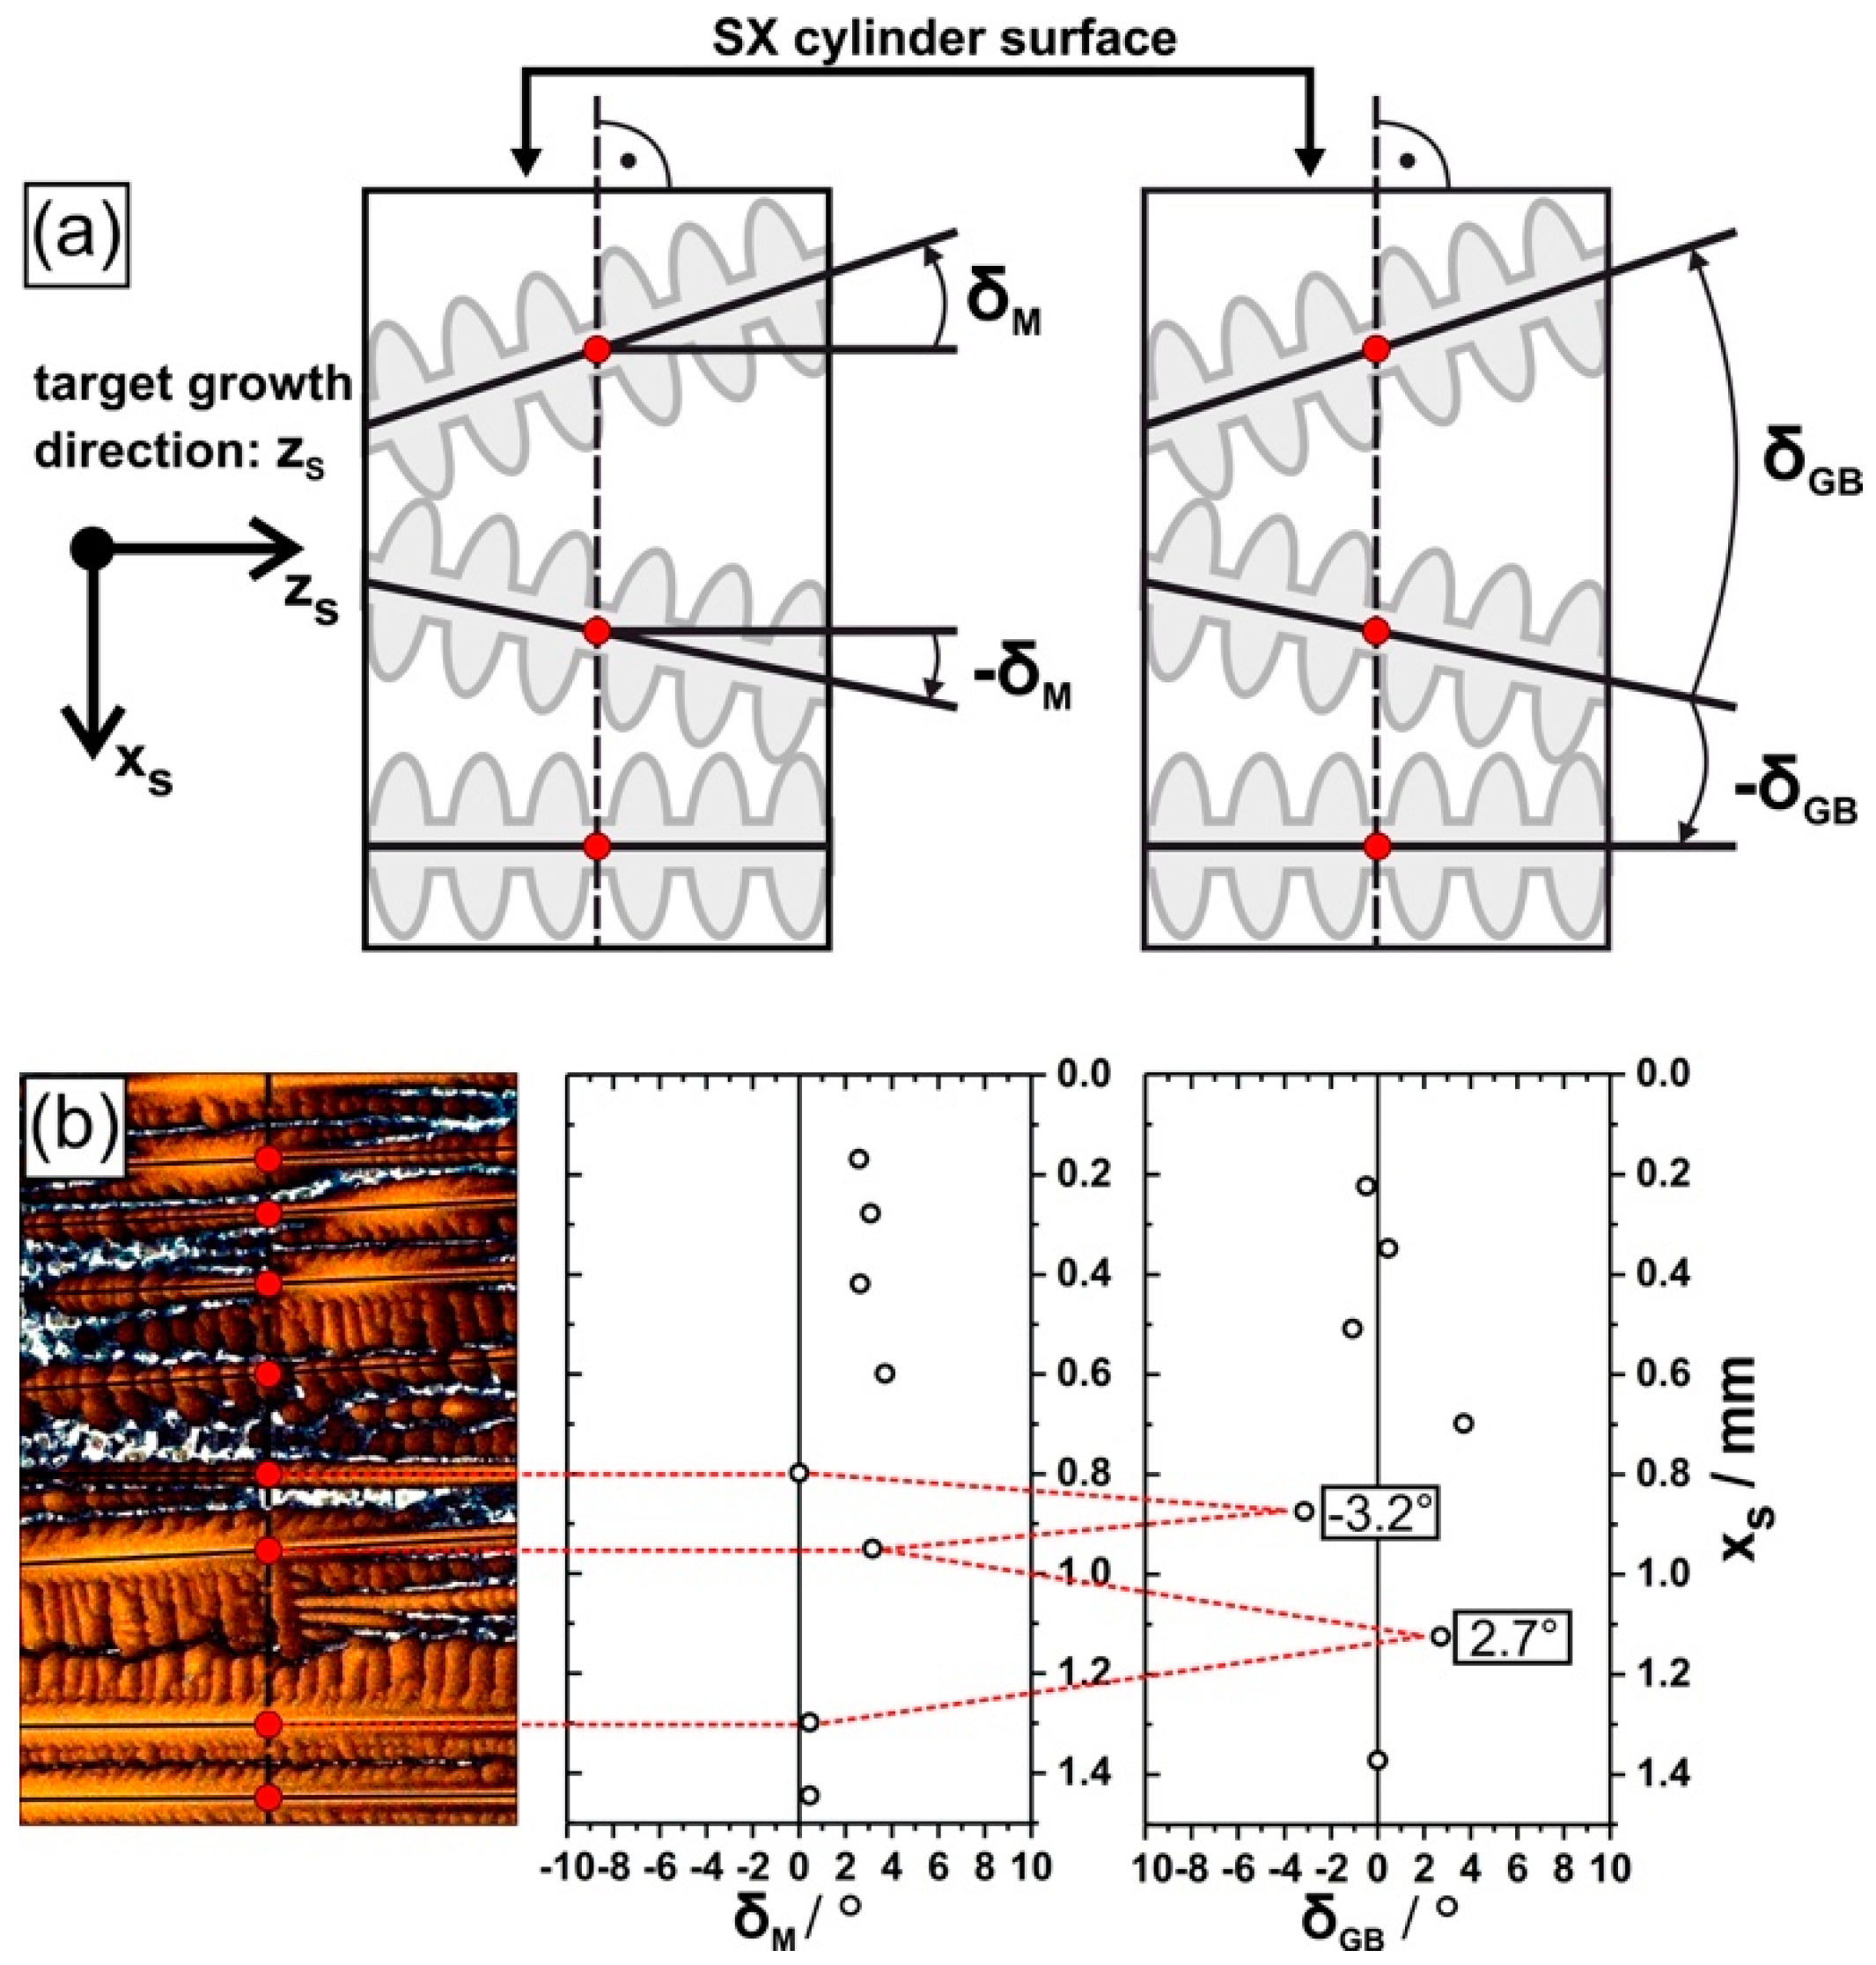
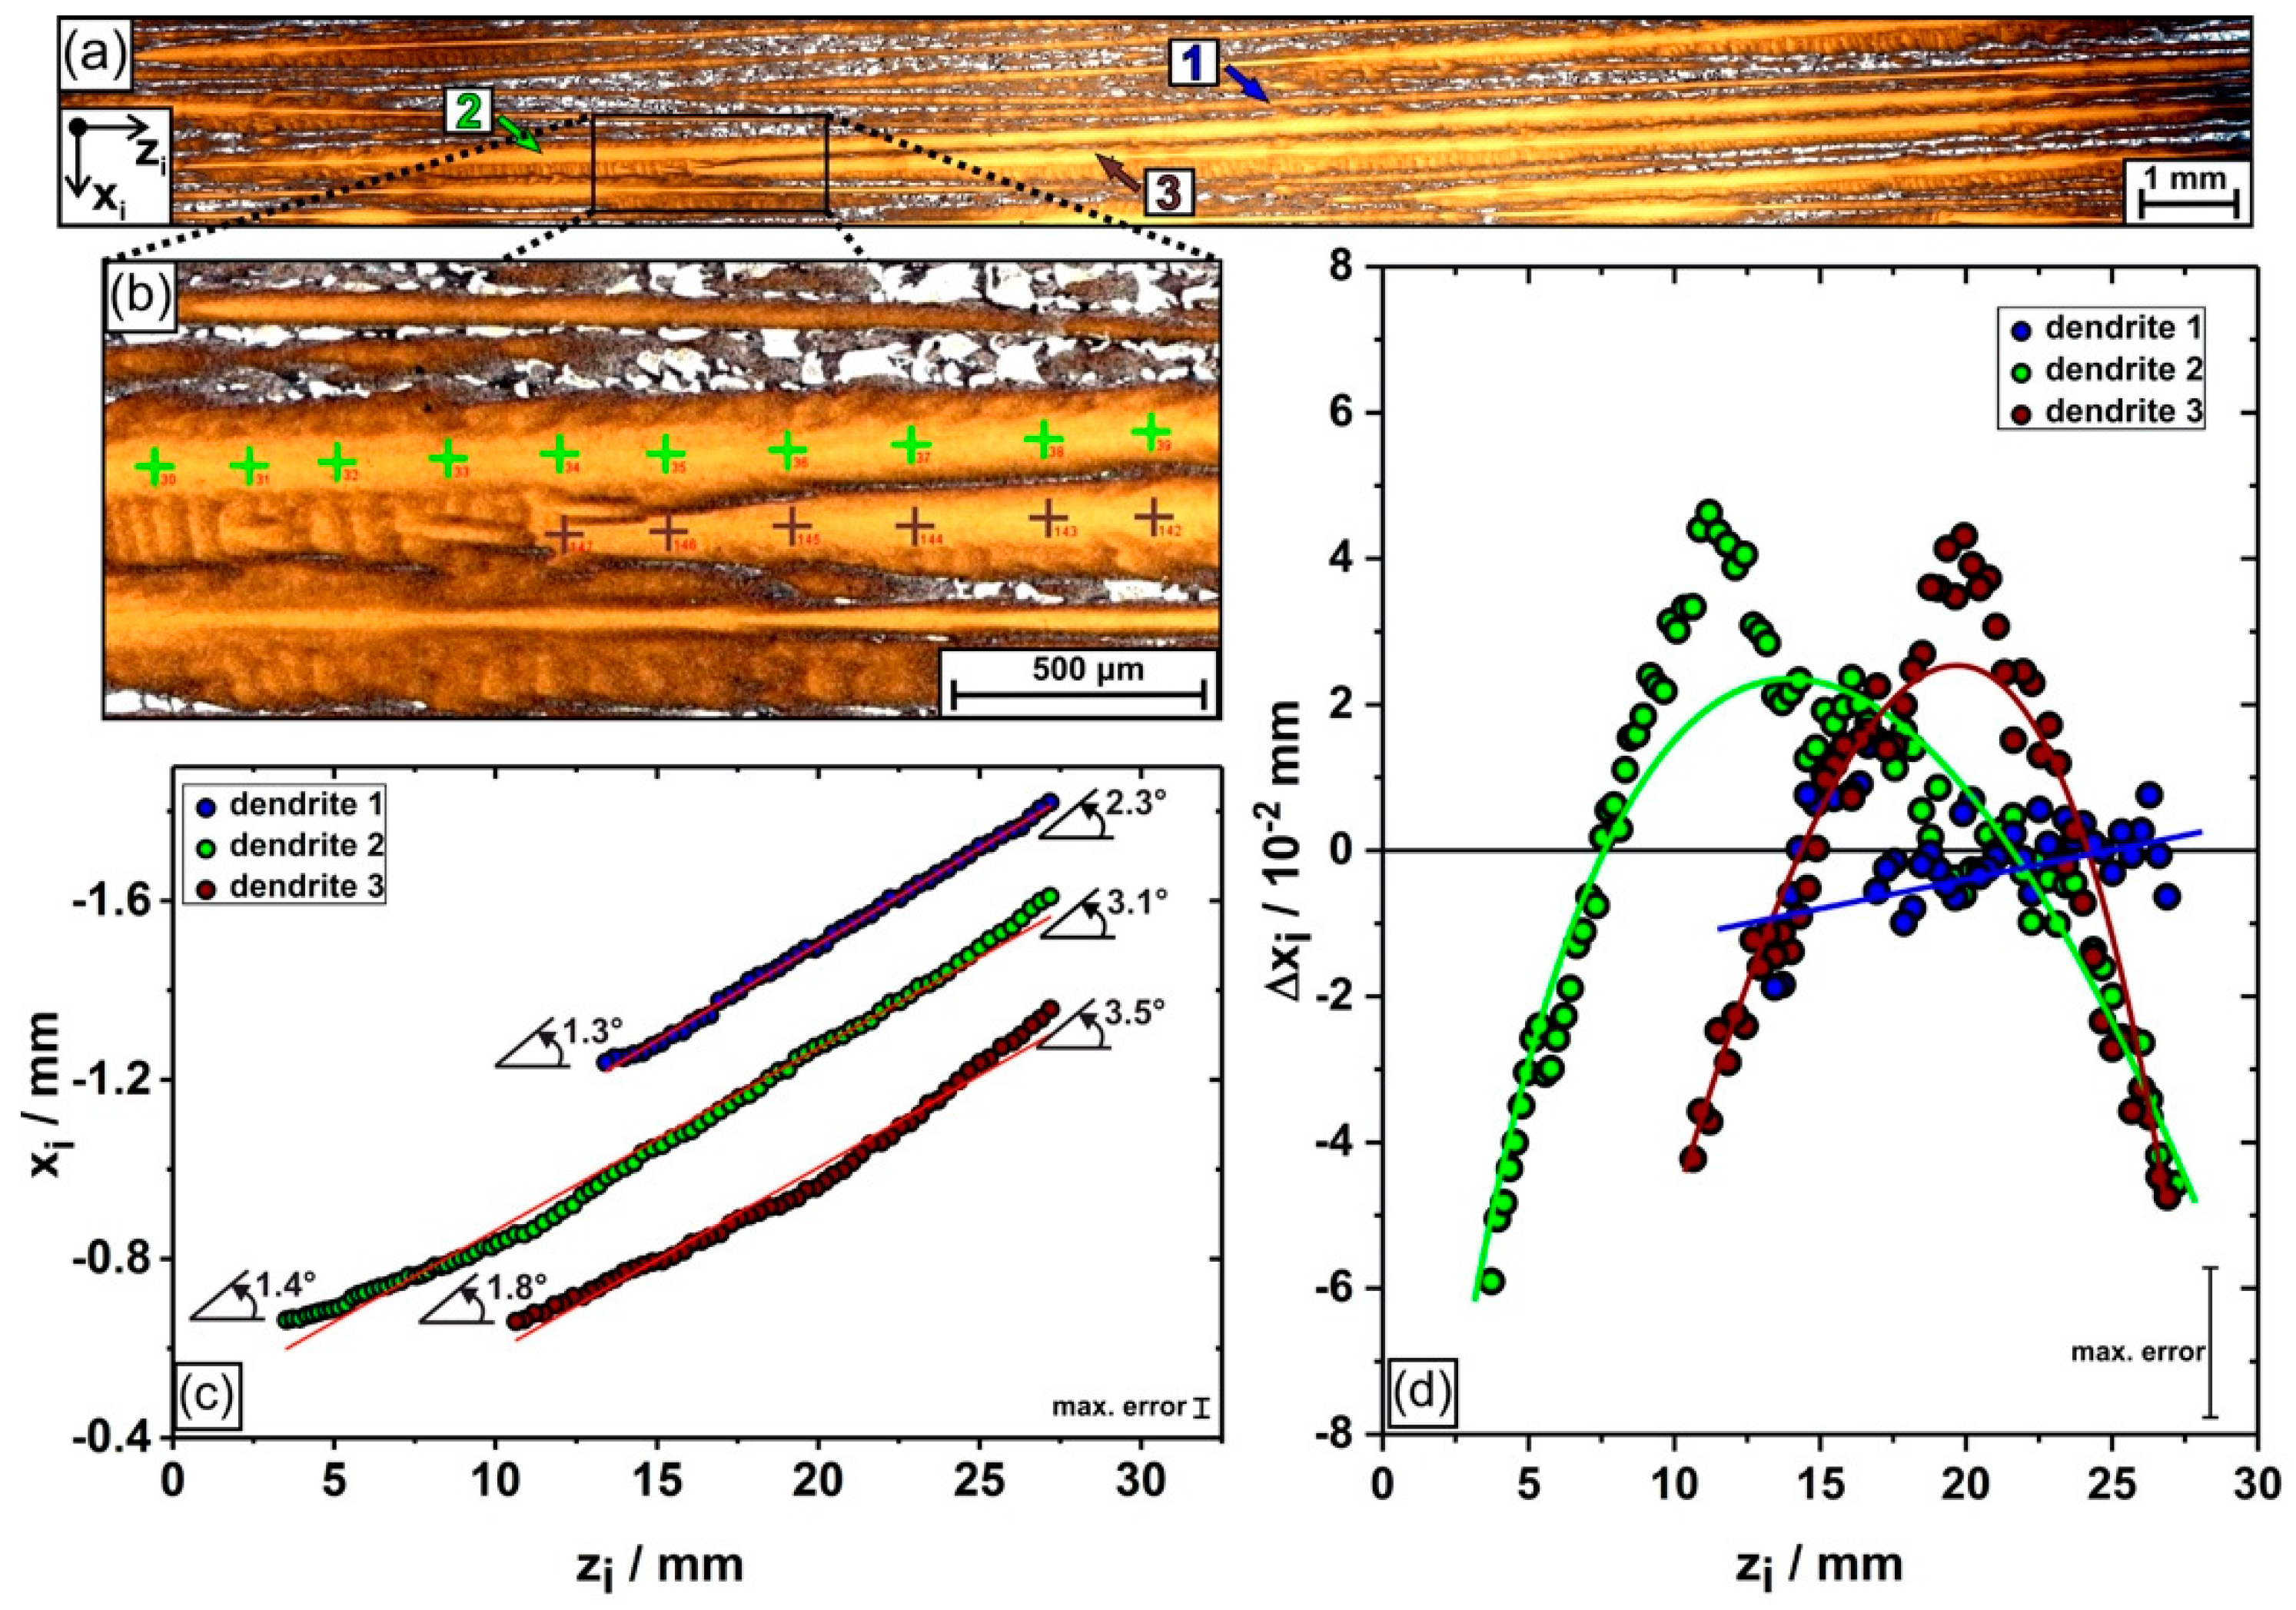
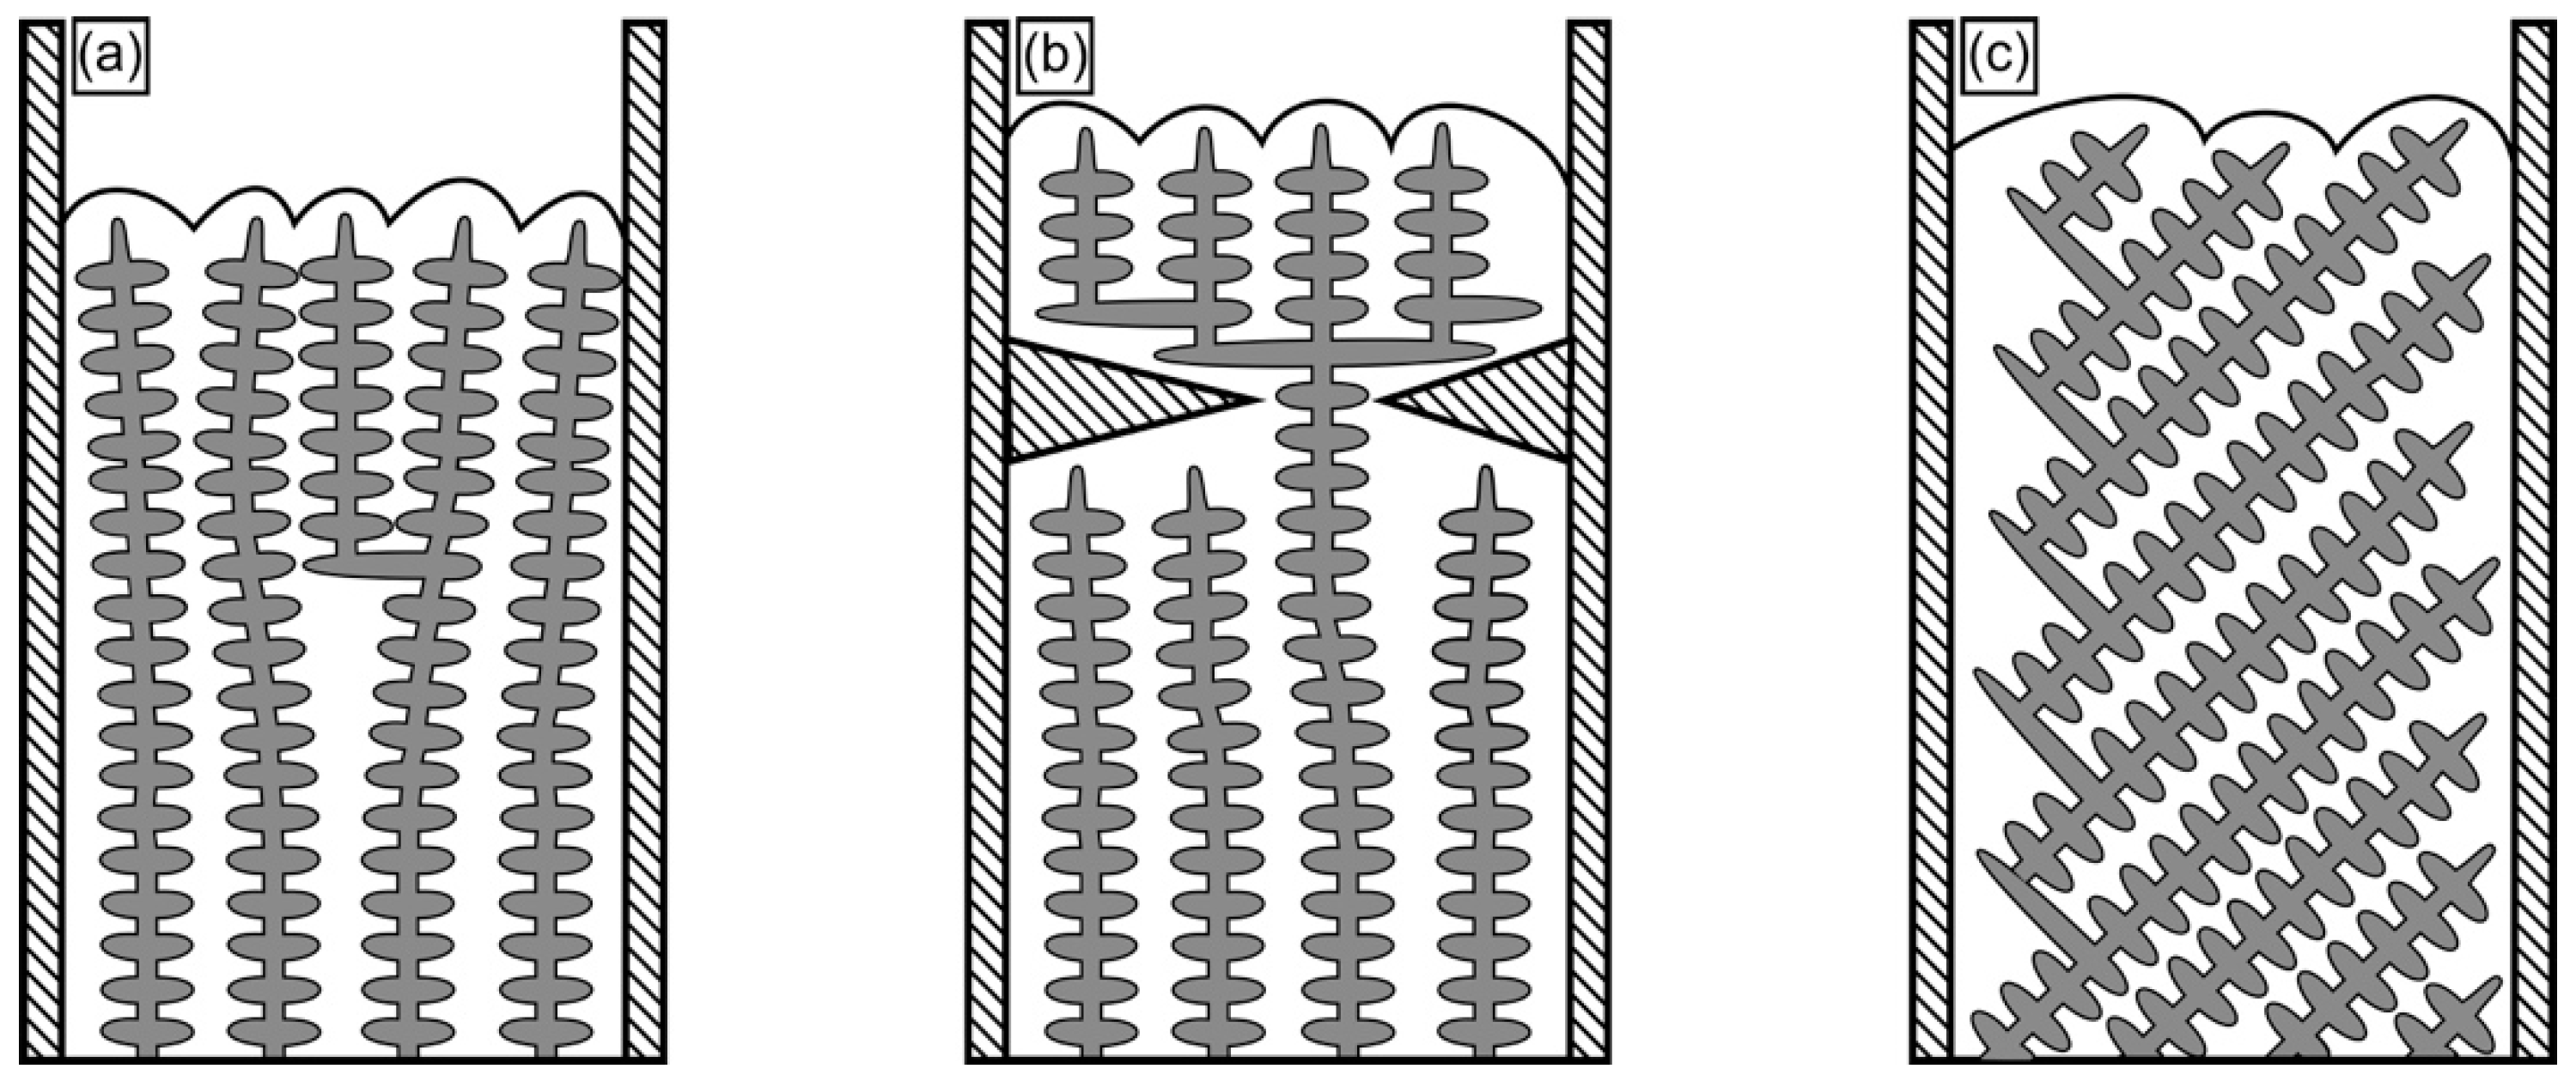
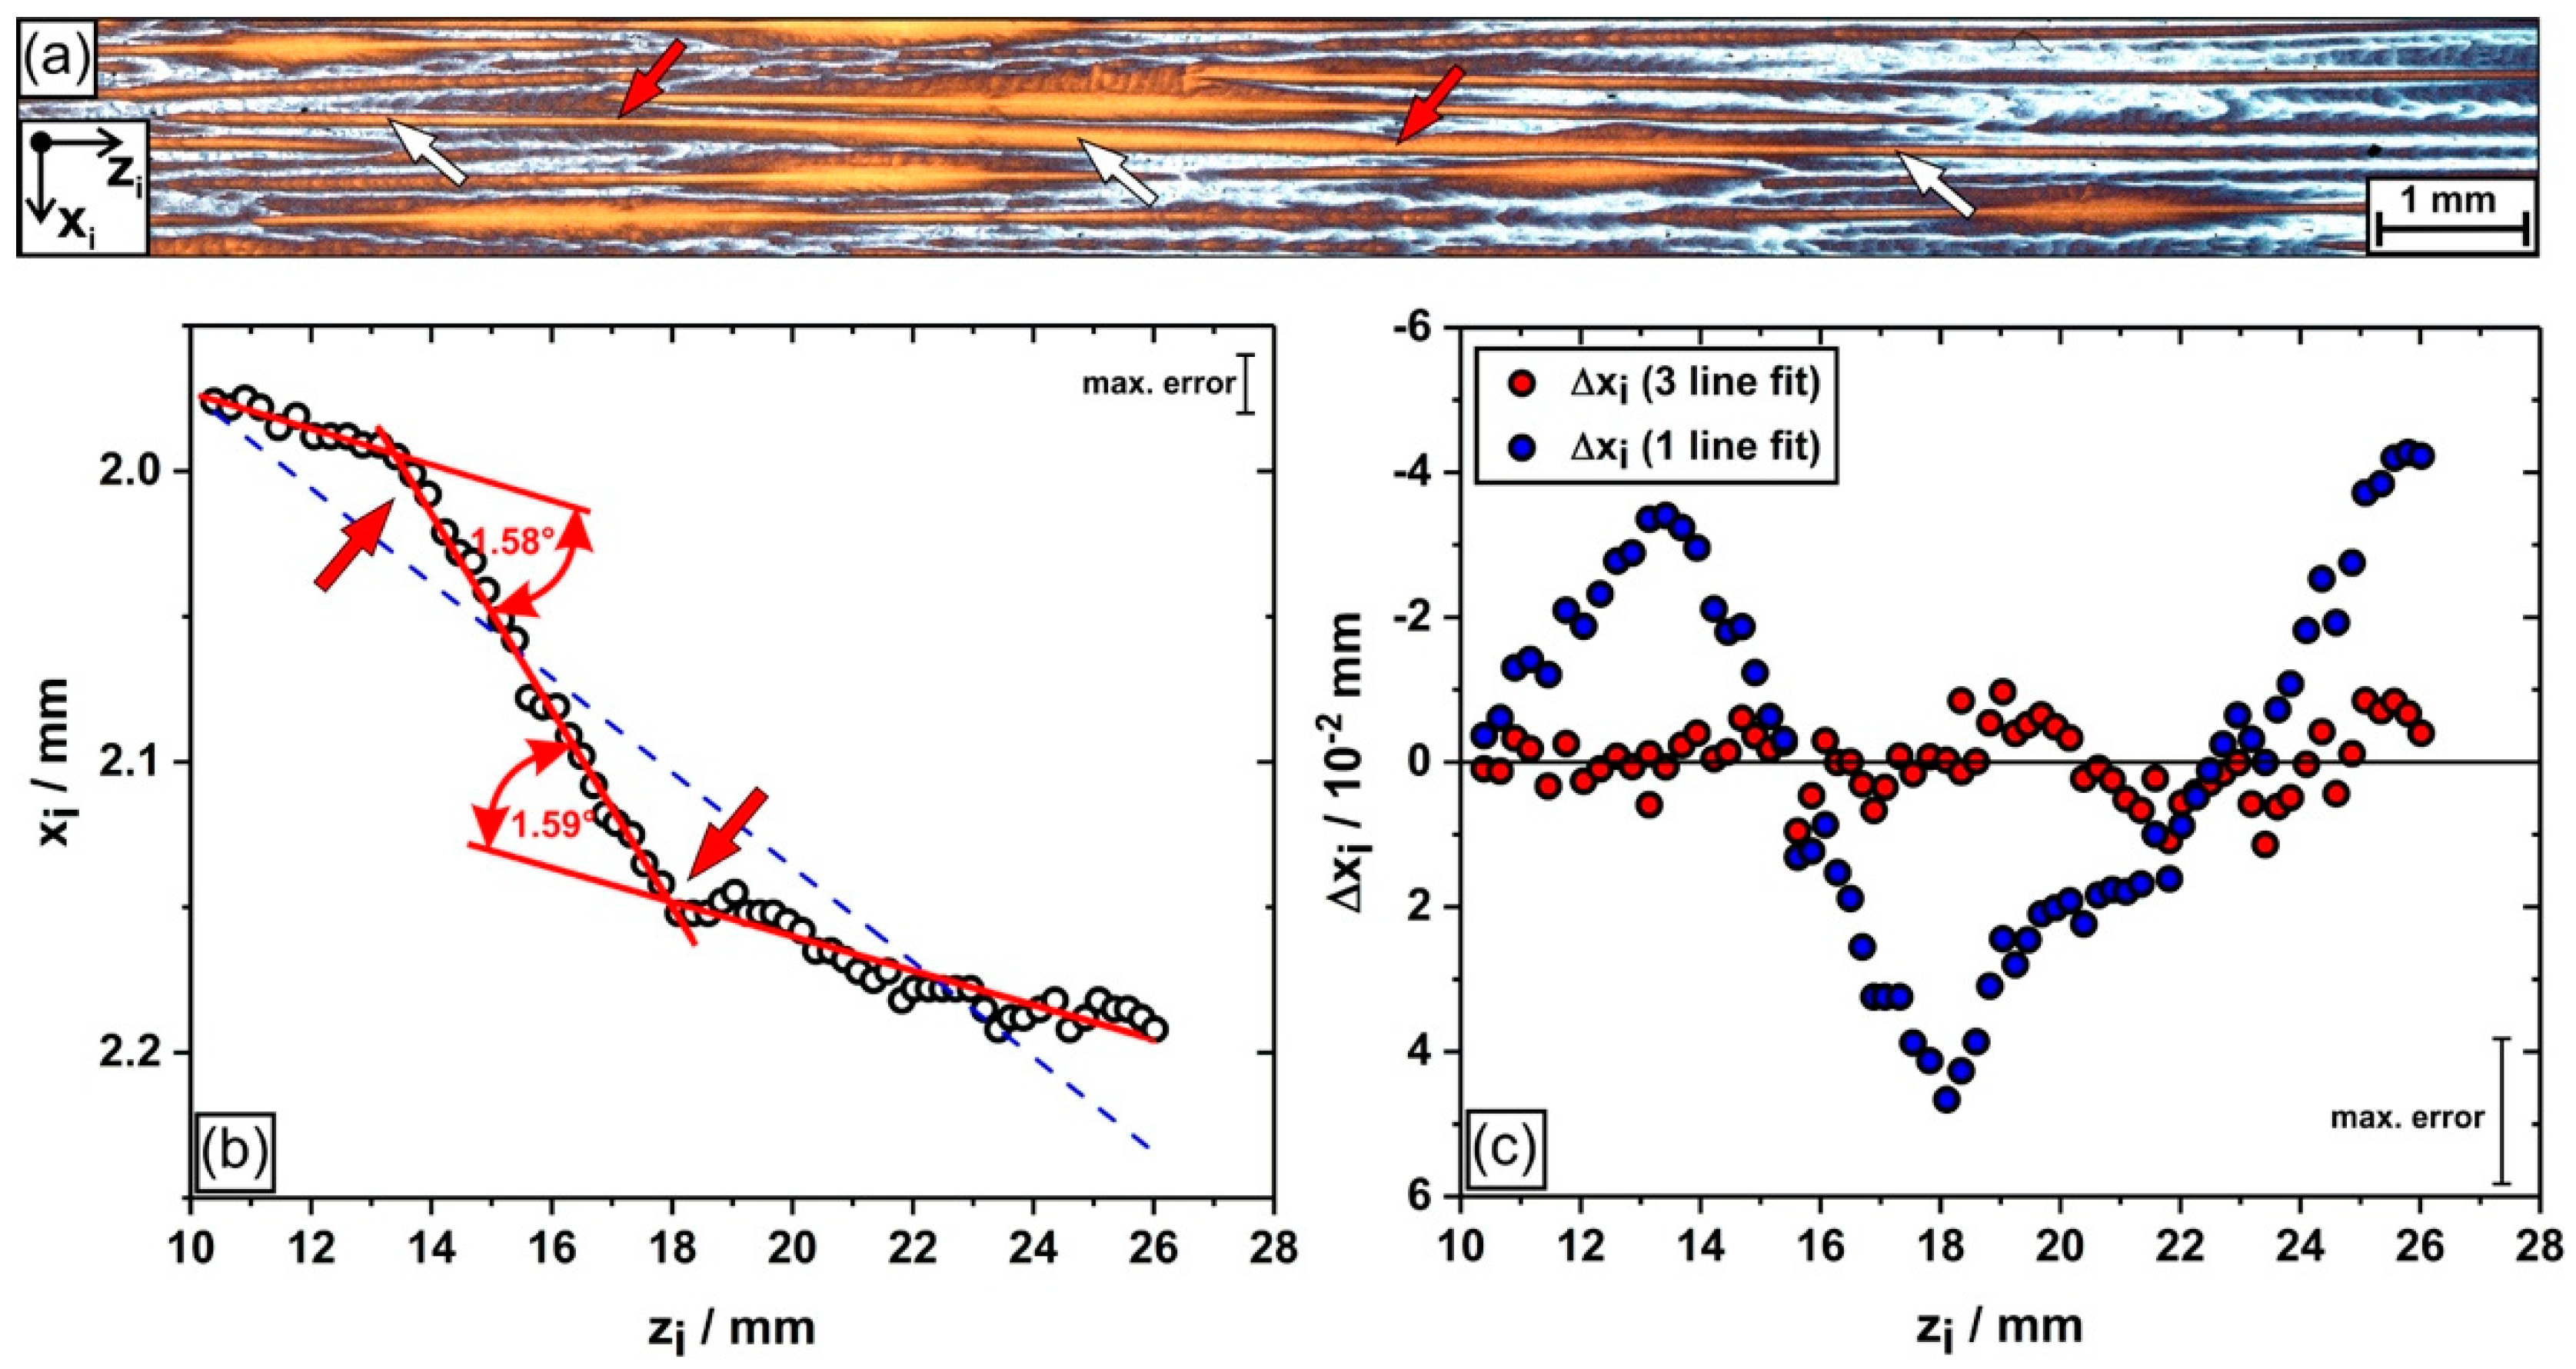
We provide direct evidence for dendrite bending in a seeded Bridgman growth process. It was observed that continuous or sudden bending affects the growth directions of dendrites. It was observed that some dendrites continuously bend by ≈1.7° within a 25-mm growth interval.

Author Contributions

P.H. prepared the different single crystal bars and analyzed dendrite growth angles. F.S. and P.T. analyzed dendrite bending by optical microcopy, quantitative image analysis and EBSD. H.S. performed numerical simulations. G.E., J.F. and I.S. are principal investigators of projects A1, B7 (leading project) and C5 in SFB/TR 103.

Funding

The authors acknowledge funding by the Deutsche Forschungsgemeinschaft (DFG) through projects A1, B7 (leading project) and C5 of the collaborative research center SFB/TR 103 on single crystal superalloys (see: www.sfb-transregio103.de).

Acknowledgments

The authors appreciate help from RWP GmbH for their assistance with the FEM calculations. The authors also appreciate help from Ali Jafarizadeh for metallography.

Conflicts of Interest

The authors declare no conflict of interest.

References

  1. Reed, R.C. The Superalloys—Fundamentals and Applications; Cambridge University Press: Cambridge, UK, 2006. [Google Scholar]
  2. McLean, M. Directionally Solidified Materials for High Temperature Service; The Metals Society: London, UK, 1983. [Google Scholar]
  3. Pollock, T.M.; Tin, S. Nickel-based superalloys for advanced turbine engines: Chemistry, microstructure and properties. J. Propuls. Power 2006, 22, 361–374. [Google Scholar] [CrossRef]
  4. Evans, R.W.; Wilshire, B. Creep of Metals and Alloys; Institute of Metals: London, UK, 1985. [Google Scholar]
  5. Ilschner, B. Hochtemperatur-Plastizität: Warmfestigkeit und Warmverformbarkeit Metallischer und Nichtmetallischer Werkstoffe; Springer: Berlin/Heidelberg, Germany; New York, NY, USA, 1973; Volume 23. [Google Scholar]
  6. Bürgel, R.; Maier, H.J.; Niendorf, T. Hochtemperaturlegierungen. In Handbuch Hochtemperatur-Werkstofftechnik; Bürgel, R., Maier, H.J., Niendorf, T., Eds.; Vieweg+Teubner Verlag: Wiesbaden, Germany, 2011; pp. 340–484. [Google Scholar]
  7. Cadek, J. Creep in Metallic Materials; Elsevier Science Ltd.: Amsterdam, The Netherlands, 1988. [Google Scholar]
  8. Quested, P.N.; McLean, M. Solidification morphologies in directionally solidified superalloys. Mater. Sci. Eng. 1984, 65, 171–180. [Google Scholar] [CrossRef]
  9. Versnyder, F.I.; Shank, M.E. The development of columnar grain and single crystal high temperature materials through directional solidification. Mater. Sci. Eng. 1970, 6, 213–247. [Google Scholar] [CrossRef]
  10. Kubiak, K.; Szeliga, D.; Sieniawski, J.; Onyszko, A. The unidirectional crystallization of metals and alloys (turbine blades). In Handbook of Crystal Growth (Second Edition)—Bulk Crystal Growth: Growth Mechanisms and Dynamics; Rudolph, P., Ed.; Elsevier: Amsterdam, The Netherlands, 2015. [Google Scholar]
  11. Hallensleben, P.; Schaar, H.; Thome, P.; Jöns, N.; Jafarizadeh, A.; Steinbach, I.; Eggeler, G.; Frenzel, J. On the evolution of cast microstructures during processing of single crystal Ni-base superalloys using a Bridgman seed technique. Mater. Des. 2017, 128, 98–111. [Google Scholar] [CrossRef]
  12. Pollock, T.M.; Murphy, W.H. The breakdown of single-crystal solidification in high refractory nickel-base alloys. Metall. Mater. Trans. A 1996, 27, 1081–1094. [Google Scholar] [CrossRef]
  13. Hobbs, R.A.; Tin, S.; Rae, C.M.F. A castability model based on elemental solid-liquid partitioning in advanced nickel-base single-crystal superalloys. Metall. Mater. Trans. A 2005, 36, 2761–2773. [Google Scholar] [CrossRef]
  14. Zhou, Y.Z.; Volek, A.; Singer, R.F. Influence of solidification conditions on the castability of nickel-base superalloy IN792. Metall. Mater. Trans. A 2005, 36, 651–656. [Google Scholar] [CrossRef]
  15. Parsa, A.B.; Wollgramm, P.; Buck, H.; Somsen, C.; Kostka, A.; Povstugar, I.; Choi, P.P.; Raabe, D.; Dlouhy, A.; Müller, J.; et al. Advanced scale bridging microstructure analysis of single crystal Ni-base superalloys. Adv. Eng. Mater. 2015, 17, 216–230. [Google Scholar] [CrossRef]
  16. Nörtershäuser, P.; Frenzel, J.; Ludwig, A.; Neuking, K.; Eggeler, G. The effect of cast microstructure and crystallography on rafting, dislocation plasticity and creep anisotropy of single crystal Ni-base superalloys. Mater. Sci. Eng. A 2015, 626, 305–312. [Google Scholar] [CrossRef]
  17. Lopez-Galilea, I.; Huth, S.; Fries, S.G.; Warnken, N.; Steinbach, I.; Theisen, W. Microsegregation and Secondary Phase Formation During Directional Solidification of the Single-Crystal Ni-Based Superalloy LEK94. Metall. Mater. Trans. A 2012, 43, 5153–5164. [Google Scholar] [CrossRef]
  18. Steinbach, I. Effect of interface anisotropy on spacing selection in constrained dendrite growth. Acta Mater. 2008, 56, 4965–4971. [Google Scholar] [CrossRef]
  19. Matache, G.; Stefanescu, D.M.; Puscasu, C.; Alexandrescu, E.; Buhrig-Polaczek, A. Investigation of solidification microstructure of single crystal CMSX-4 superalloy—experimental measurements and modelling predictions. Int. J. Cast Met. Res. 2015, 28, 323–336. [Google Scholar] [CrossRef]
  20. Pyczak, F.; Devrient, B.; Neuner, F.; Mughrabi, H. The influence of different alloying elements on the development of the γ/γ′ microstructure of nickel-base superalloys during high-temperature annealing and deformation. Acta Mater. 2005, 53, 3879–3891. [Google Scholar] [CrossRef]
  21. Qu, S.; Fu, C.M.; Dong, C.; Tian, J.F.; Zhang, Z.F. Failure analysis of the 1st stage blades in gas turbine engine. Eng. Fail. Anal. 2013, 32, 292–303. [Google Scholar] [CrossRef]
  22. Hong, J.P.; Ma, D.X.; Wang, J.; Wang, F.; Dong, A.P.; Sun, B.D.; Bührig-Polaczek, A. Geometrical effect of freckle formation on directionally solidified superalloy CM247 LC components. J. Alloy Compd. 2015, 648, 1076–1082. [Google Scholar] [CrossRef]
  23. Ma, D.X.; Zhou, B.; Buhrig-Polaczek, A. Investigation of freckle formation under various solidification conditions. In Euro Superalloys 2010; Heilmaier, M., Ed.; Trans Tech Publications Ltd.: Stafa-Zurich, Switzerland, 2011; Volume 278, pp. 428–433. [Google Scholar]
  24. Auburtin, P.; Wang, T.; Cockcroft, S.L.; Mitchell, A. Freckle formation and freckle criterion in superalloy castings. Metall. Mater. Trans. B 2000, 31, 801–811. [Google Scholar] [CrossRef]
  25. Yang, C.; Liu, L.; Zhao, X.; Zhang, J.; Sun, D.; Fu, H. Formation of stray grains during directional solidification of a superalloy AM3. Appl. Phys. A 2013, 114, 979–983. [Google Scholar] [CrossRef]
  26. Zhou, Y.Z. Formation of stray grains during directional solidification of a nickel-based superalloy. Scr. Mater. 2011, 65, 281–284. [Google Scholar] [CrossRef]
  27. Aveson, J.W.; Tennant, P.A.; Foss, B.J.; Shollock, B.A.; Stone, H.J.; D’Souza, N. On the origin of sliver defects in single crystal investment castings. Acta Mater. 2013, 61, 5162–5171. [Google Scholar] [CrossRef]
  28. Yardley, V.; Povstugar, I.; Choi, P.P.; Raabe, D.; Parsa, A.B.; Kostka, A.; Somsen, C.; Dlouhy, A.; Neuking, K.; George, E.P.; et al. On local phase equilibria and the appearance of nanoparticles in the microstructure of single-crystal Ni-base superalloys. Adv. Eng. Mater. 2016, 18, 1556–1567. [Google Scholar] [CrossRef]
  29. Fan, X.; Guo, Z.; Wang, X.; Yang, J.; Zou, J. Morphology evolution of γ′ precipitates in a powder metallurgy Ni-base superalloy. Mater. Charact. 2018, 139, 382–389. [Google Scholar] [CrossRef]
  30. Serin, K.; Göbenli, G.; Eggeler, G. On the influence of stress state, stress level and temperature on gamma-channel widening in the single crystal superalloy CMSX-4. Mater. Sci. Eng. A 2004, 387, 133–137. [Google Scholar] [CrossRef]
  31. Darwin, C.G. XCII. The reflexion of X-rays from imperfect crystals. Lond. Edinb. Dublin Philos. Mag. J. Sci. 1922, 43, 800–829. [Google Scholar] [CrossRef]
  32. Bellet, D. Etude Des Textures des Superalliages Monocristallins Par Diffraction et Diffusion Des Rayonnements: X,[Gamma] et Neutrons. Ph.D. Thesis, Université Joseph Fourier (Grenoble), Grenoble, France, 1990. [Google Scholar]
  33. Klam, H.; Blank, E. The growth of modern superalloy single crystals. In Proceedings of the First Conference on Advanced Materials and Processes (EUROMAT’89), Aachen, Germany, 22–24 November 1989; pp. 407–412. [Google Scholar]
  34. Brückner, U.; Epishin, A.; Link, T. Local X-ray diffraction analysis of the structure of dendrites in single-crystal nickel-base superalloys. Acta Mater. 1997, 45, 5223–5231. [Google Scholar] [CrossRef]
  35. Kurz, W.; Fisher, D.J. Fundamentals of Solidification, 4th ed.; Trans Tech Publ.: Aedermannsdorf, Switzerland, 2005. [Google Scholar]
  36. Boettinger, W.J.; Coriell, S.R.; Greer, A.L.; Karma, A.; Kurz, W.; Rappaz, M.; Trivedi, R. Solidification microstructures: Recent developments, future directions. Acta Mater. 2000, 48, 43–70. [Google Scholar] [CrossRef]
  37. Dantzig, J.A.; Rappaz, M. Solidification; EFPL Press: Lausanne, France, 2009. [Google Scholar]
  38. D’Souza, N.; Newell, M.; Devendra, K.; Jennings, P.A.; Ardakani, M.G.; Shollock, B.A. Formation of low angle boundaries in Ni-based superalloys. Mater. Sci. Eng. A 2005, 413, 567–570. [Google Scholar] [CrossRef]
  39. Bogdanowicz, W.; Albrecht, R.; Sieniawski, J.; Kubiak, K. The subgrain structure in turbine blade roots of CMSX-4 superalloy. J. Cryst. Growth 2014, 401, 418–422. [Google Scholar] [CrossRef]
  40. Bogdanowicz, W.; Albrecht, R.; Onyszko, A.; Sieniawski, J. Characterization of Single-Crystal Turbine Blades by X-Ray Diffraction Methods. In Applied Crystallography Xxii; Stroz, D., Dercz, G., Eds.; Trans Tech Publications Ltd.: Stafa-Zurich, Switzerland, 2013; Volume 203–204, pp. 63–66. [Google Scholar]
  41. Onyszko, A.; Bogdanowicz, W.; Sieniawski, J. Structural perfection of a single crystal nickel-based CMSX-4 superalloy. In Electron Microscopy Xiv; Stroz, D., Prusik, K., Eds.; Trans Tech Publications Ltd.: Stafa-Zurich, Switzerland, 2012; Volume 186, pp. 151–155. [Google Scholar]
  42. Newell, M.; D’Souza, N.; Green, N.R. Formation of low angle boundaries in Ni-based superalloys. Int. J. Cast Met. Res. 2009, 22, 66–69. [Google Scholar] [CrossRef]
  43. Newell, M.; Devendra, K.; Jennings, P.A.; D’Souza, N. Role of dendrite branching and growth kinetics in the formation of low angle boundaries in Ni–base superalloys. Mater. Sci. Eng. A 2005, 412, 307–315. [Google Scholar] [CrossRef]
  44. Siredey, N.; Lesoult, G.; Lacaze, J. Evolution during Solidification of the Array of Dendritic Primary Axes of Am1 Superalloy Single Grains in Relation with Their Crystalline Quality. In High Temperature Materials for Power Engineering; Springer: Dordrecht, The Netherlands, 1990; Parts 1–2; pp. 1309–1318. [Google Scholar]
  45. Siredey, N.; Boufoussi, M.B.; Denis, S.; Lacaze, J. Dendritic growth and crystalline quality of nickel-base single grains. J. Cryst. Growth 1993, 130, 132–146. [Google Scholar] [CrossRef]
  46. Schaefer, R.; Black, D.; Vaudin, M.; Mueller, B.; Giamei, A. Geometry and mechanisms of dendrite misalignments in superalloy single crystals. In Proceedings of the 4th Decennial International Conference on Solidification Processing, Sheffield, UK, 7–10 July 1997; pp. 37–40. [Google Scholar]
  47. Aveson, J.W.; Reinhart, G.; Nguyen-Thi, H.; Mangelinck-Noël, N.; Tandjaoui, A.; Billia, B.; Goodwin, K.; Lafford, T.A.; Baruchel, J.; Stone, H.J.; et al. Dendrite bending during directional solidification. In Superalloys 2012; John Wiley & Sons, Inc.: Hoboken, NJ, USA, 2012; pp. 615–624. [Google Scholar]
  48. Aveson, J.W.; Reinhart, G.; Nguyen-Thi, H.; Mangelinck-Noel, N.; D’Souza, N.; Stone, H.J. Origins of misorientation defects in single crystal castings:aA time resolved in situ synchrotron x-ray radiography study. In Eurosuperalloys 2014—2nd European Symposium on Superalloys and Their Applications; Guedou, J.Y., Chone, J., Eds.; EDP Sciences: Les Ulis, France, 2014; Volume 14. [Google Scholar]
  49. Reinhart, G.; Nguyen-Thi, H.; Mangelinck-Noël, N.; Baruchel, J.; Billia, B. In Situ Investigation of Dendrite Deformation During Upward Solidification of Al-7wt.%Si. JOM-US 2014, 66, 1408–1414. [Google Scholar] [CrossRef]
  50. Doherty, R.D. Comments on “Mechanical deformation of dendrites by fluid flow during the solidification of undercooled melts”. Scr. Mater. 2003, 49, 1219–1222. [Google Scholar] [CrossRef]
  51. Uehara, T.; Tsujino, T. Phase field simulation of stress evolution during solidification. J. Cryst. Growth 2005, 275, e219–e224. [Google Scholar] [CrossRef]
  52. Uehara, T.; Fukui, M.; Ohno, N. Phase field simulations of stress distributions in solidification structures. J. Cryst. Growth 2008, 310, 1331–1336. [Google Scholar] [CrossRef]
  53. Wagner, A.; Shollock, B.A.; McLean, M. Grain structure development in directional solidification of nickel-base superalloys. Mater. Sci. Eng. A 2004, 374, 270–279. [Google Scholar] [CrossRef]
  54. Dragnevski, K.; Mullis, A.M.; Walker, D.J.; Cochrane, R.F. Mechanical deformation of dendrites by fluid flow during the solidification of undercooled melts. Acta Mater. 2002, 50, 3743–3755. [Google Scholar] [CrossRef]
  55. Mullis, A.M.; Walker, D.J.; Battersby, S.E.; Cochrane, R.F. Deformation of dendrites by fluid flow during rapid solidification. Mater. Sci. Eng. A 2001, 304–306, 245–249. [Google Scholar] [CrossRef]
  56. Pilling, J.; Hellawell, A. Mechanical deformation of dendrites by fluid flow. Metall. Mater. Trans. A 1996, 27, 229–232. [Google Scholar] [CrossRef]
  57. Rappaz, M.; Blank, E. Combined X-ray microdiffraction and topography experiment for microstructural analysis of heterogeneous materials. J. Mater. Sci. 1987, 22, 896–906. [Google Scholar] [CrossRef]
  58. Brückner, U.; Epishin, A.; Link, T.; Dressel, K. The influence of the dendritic structure on the γ/γ’-lattice misfit in the single-crystal nickel-base super-alloy CMSX-4. Mater. Sci. Eng. A 1998, 247, 23–31. [Google Scholar] [CrossRef]
  59. Husseini, N.S.; Kumah, D.P.; Yi, J.Z.; Torbet, C.J.; Arms, D.A.; Dufresne, E.M.; Pollock, T.M.; Wayne Jones, J.; Clarke, R. Mapping single-crystal dendritic microstructure and defects in nickel-base superalloys with synchrotron radiation. Acta Mater. 2008, 56, 4715–4723. [Google Scholar] [CrossRef]
  60. Bogdanowicz, W.; Albrecht, R.; Sieniawski, J.; Kubiak, K.; Onyszko, A. Correlation between SEM and X-Ray diffraction imaging of structure in single-crystal Ni-based superalloy. Solid State Phenom. 2012, 186, 135–138. [Google Scholar] [CrossRef]
  61. Whitesell, H.S.; Li, L.; Overfelt, R.A. Influence of solidification variables on the dendrite arm spacings of Ni-based superalloys. Met. Mater. Trans. B 2000, 31, 546–551. [Google Scholar] [CrossRef]
  62. Corel Draw X5. Available online: https://www.coreldraw.com (accessed on 12 January 2019).
  63. Rueden, C.T.; Schindelin, J.; Hiner, M.C.; DeZonia, B.E.; Walter, A.E.; Arena, E.T.; Eliceiri, K.W. ImageJ2: ImageJ for the next generation of scientific image data. BMC Bioinform. 2017, 18, 529. [Google Scholar] [CrossRef]
  64. Schneider, C.A.; Rasband, W.S.; Eliceiri, K.W. NIH Image to ImageJ: 25 years of image analysis. Nat. Methods 2012, 9, 671–675. [Google Scholar] [CrossRef] [PubMed]
  65. Thome, P.; Medghalchi, S.; Frenzel, J.; Schreuer, J.; Eggeler, G. Ni-Base Superalloy Single Crystal (SX) Mosaicity Characterized by the Rotation Vector Base Line Electron Back Scatter Diffraction (RVB-EBSD) Method. Ultramicroscopy 2019. Submitted. [Google Scholar]
  66. Quested, P.N.; Brooks, R.F.; Chapman, L.; Morrell, R.; Youssef, Y.; Mills, K.C. Measurement and estimation of thermophysical properties of nickel based superalloys. Mater. Sci. Technol. 2009, 25, 154–162. [Google Scholar] [CrossRef]
  67. Chase, M.W., Jr. NIST-JANAF Thermochemical Tables, Monograph No. 9, 4th ed.; NIST: Washington, DC, USA, 1998.
  68. Picard, S.; Burns, D.T.; Roger, P. Measurement of the Specific Heat Capacity of Graphite, Rapport BIPM-2006/01; International Bureau of Weights and Measures: Sèvres, France, 2006. [Google Scholar]
  69. Material data sheets/personal communications from/with furnace component manufacturers. 2016.
  70. Chang, C.E.; Wilcox, W.R. Control of interface shape in the vertical bridgman-stockbarger technique. J. Cryst. Growth 1974, 21, 135–140. [Google Scholar] [CrossRef]
  71. Potts, H.; Wilcox, W.R. Thermal fields in the Bridgman-Stockbarger technique. J. Cryst. Growth 1985, 73, 350–358. [Google Scholar] [CrossRef]
  72. Hellawell, A.; Sarazin, J.R.; Steube, R.S. Channel Convection in partially solidified Systems. Philos. Trans. R. Soc. A 1993, 345, 507–544. [Google Scholar] [CrossRef]
  73. Liu, S.; Lu, S.-Z.; Hellawell, A. Dendritic array growth in the systems NH4Cl–H2O and [CH2 CN]2–H2O: The detachment of dendrite side arms induced by deceleration. J. Cryst. Growth 2002, 234, 740–750. [Google Scholar] [CrossRef]
  74. Mullis, A.M. Growth induced dendritic bending and rosette formation during solidification in a shearing flow. Acta Mater. 1999, 47, 1783–1789. [Google Scholar] [CrossRef]
  75. Warren, J. Dendritic Crystals: Rule of thumb breaks down. Nat. Mater. 2006, 5, 595–596. [Google Scholar] [CrossRef] [PubMed]
  76. Lee, D.N.; Kim, K.-H.; Lee, Y.-G.; Choi, C.-H. Factors determining crystal orientation of dendritic growth during solidification. Mater. Chem. Phys. 1997, 47, 154–158. [Google Scholar] [CrossRef]
Figure 1. Crystal mosaicity in a Ni-based superalloy which was prepared by seeded Bridgman processing in the present study. The varying contrasts of dendrites are related to small misorientations (scanning electron microscopy image, back scatter contrast).
Crystals 09 00149 g001
Figure 2. Effect of withdrawal rates on dendritic microstructures. (a,b) 45 mm/h; (c,d) 180 mm/h; (e,f) 720 mm/h. Left column: sections perpendicular to the solidification direction. Right column: sections parallel to the solidification direction.
Crystals 09 00149 g002
Figure 3. Evaluation of dendrite growth directions. (a) Determination of projected dendrite growth directions and projected angles between adjacent dendrites. (b) Example for quantification of in-plane dendrite misorientations.
Crystals 09 00149 g003
Figure 4. Precision of the applied orientation analysis. For details see text.
Crystals 09 00149 g004
Figure 5. Analysis of temperature distributions during seeded Bridgman solidification. (a) Key elements of the Bridgman furnace and local coordinate systems. (b) Color-coded FEM results for withdrawal rates of 45 and 720 mm/h. Liquidus (short thick red lines) and solidus isotherms (short thick blue lines). (c) Optical micrograph which documents the position of the liquidus isotherm (marked by black crosses). (d) Liquidus isotherms: comparison of experimental and calculated data. The two dashed lines correspond to the upper and lower ends of the baffle.
Crystals 09 00149 g005
Figure 6. Evaluation of dendrite misorientations for various zS positions in an SX cylinder prepared with a withdrawal rate of 180 mm/h. (a) Seed crystal: zS = 5 mm. Newly-grown crystal: (b) zS = 14 mm, (c) zS = 41 mm, (d) zS = 100 mm.
Crystals 09 00149 g006
Figure 7. Evolution of dendrite growth directions during solidification with a withdrawal rate of 180 mm/h (same ingot as considered in Figure 6). (a) Dendrite growth direction angle δM. (b) Angle δGB between adjacent dendrites. The vertical dashed lines indicate the position of the transition zone between seed and newly grown crystal.
Crystals 09 00149 g007
Figure 8. Evolution of dendrite growth directions during solidification for an SX ingot prepared at a fast withdrawal rate of 720 mm/h. (a) Optical micrograph together with the corresponding dendrite growth angles δM and δGB for a bar position of zS = 14 mm. (b) Same information as in the previous figure for bar position zS = 100 mm. (c) Evolution of dendrite growth direction angles δM (mean, max., min. and standard deviation). (d) Evolution of angle δGB between adjacent dendrites. The vertical dashed lines in Figure 8c,d indicate the position of the transition zone between seed and newly grown crystal.
Crystals 09 00149 g008
Figure 9. Evolution of scattering in dendrite orientations for seven different SX ingots along their longitudinal axes. (a) Standard deviation of dendrite growth direction angles δM. (b) Standard deviation of angles between adjacent dendrites δGB. The dashed vertical lines indicate the transition zone between seeds and newly grown crystals.
Crystals 09 00149 g009
Figure 10. Experimental evidence for dendrite bending. Withdrawal rate: 45 mm/h. (a) Overview micrograph; for details, see text. (b) Higher magnification image of the rectangular region in Figure 10a. The small crosses represent data points where dendrite coordinates were determined. (c) Growth paths of the three dendrites marked in Figure 10a. (d) Deviation from linearity of dendrite growth paths.
Crystals 09 00149 g010
Figure 11. Evidence for two sudden bending events. (a) Overview micrograph. The white arrows highlight one single dendrite which suffered two sharp bending events marked by red arrows. (b) Dendrite growth path. (c) Deviation from linearity. For details see text.
Crystals 09 00149 g011
Figure 12. Correlation between dendrite growth directions and crystal orientations. (a) SEM back scatter electron (BSE) micrograph. (b) Corresponding RVB-EBSD map of the [001] direction; for color-coding, see next figure. (c) Pole figure with color-coding for the previous figure. The same dendrites are marked in each figure.
Crystals 09 00149 g012
Figure 13. Effect of withdrawal rates on the evolution of liquidus isotherm curvatures and positions during Bridgman processing. Different casting stages (early, intermediate and late) correspond to different zS-values in the bar (low: 14 mm; intermediate: 50 mm; high: 100 mm). (a) v = 45 mm/h, (b) v = 180 mm/h (c) v = 720 mm/h. For details see text.
Crystals 09 00149 g013
Figure 14. Schematic illustration on the evolution of crystal mosaicity in SX superalloys: bending of primary and secondary dendrite arms. LAGBs are highlighted by arrows.
Crystals 09 00149 g014
Figure 15. Potential scenarios which result in different levels of crystal mosaicity. (a) Formation of a high degree of mosaicity during directional solidification. (b) Formation of a low mosaicity microstructure after overcoming a growth obstacle. (c) Continuous branching followed by continuous re-emerging.
Crystals 09 00149 g015
Table 1. Effect of the withdrawal rate on the average primary dendrite arm spacing (PDAS).
Withdrawal Rate (mm/h)PDAS (µm)
45243
180205
720148

