Parameter Space Design of a Guest-Host Liquid Crystal Device for Transmittance Control

 , ,
, ,
Abstract
1. Introduction
2. Experimental and Calculation Conditions
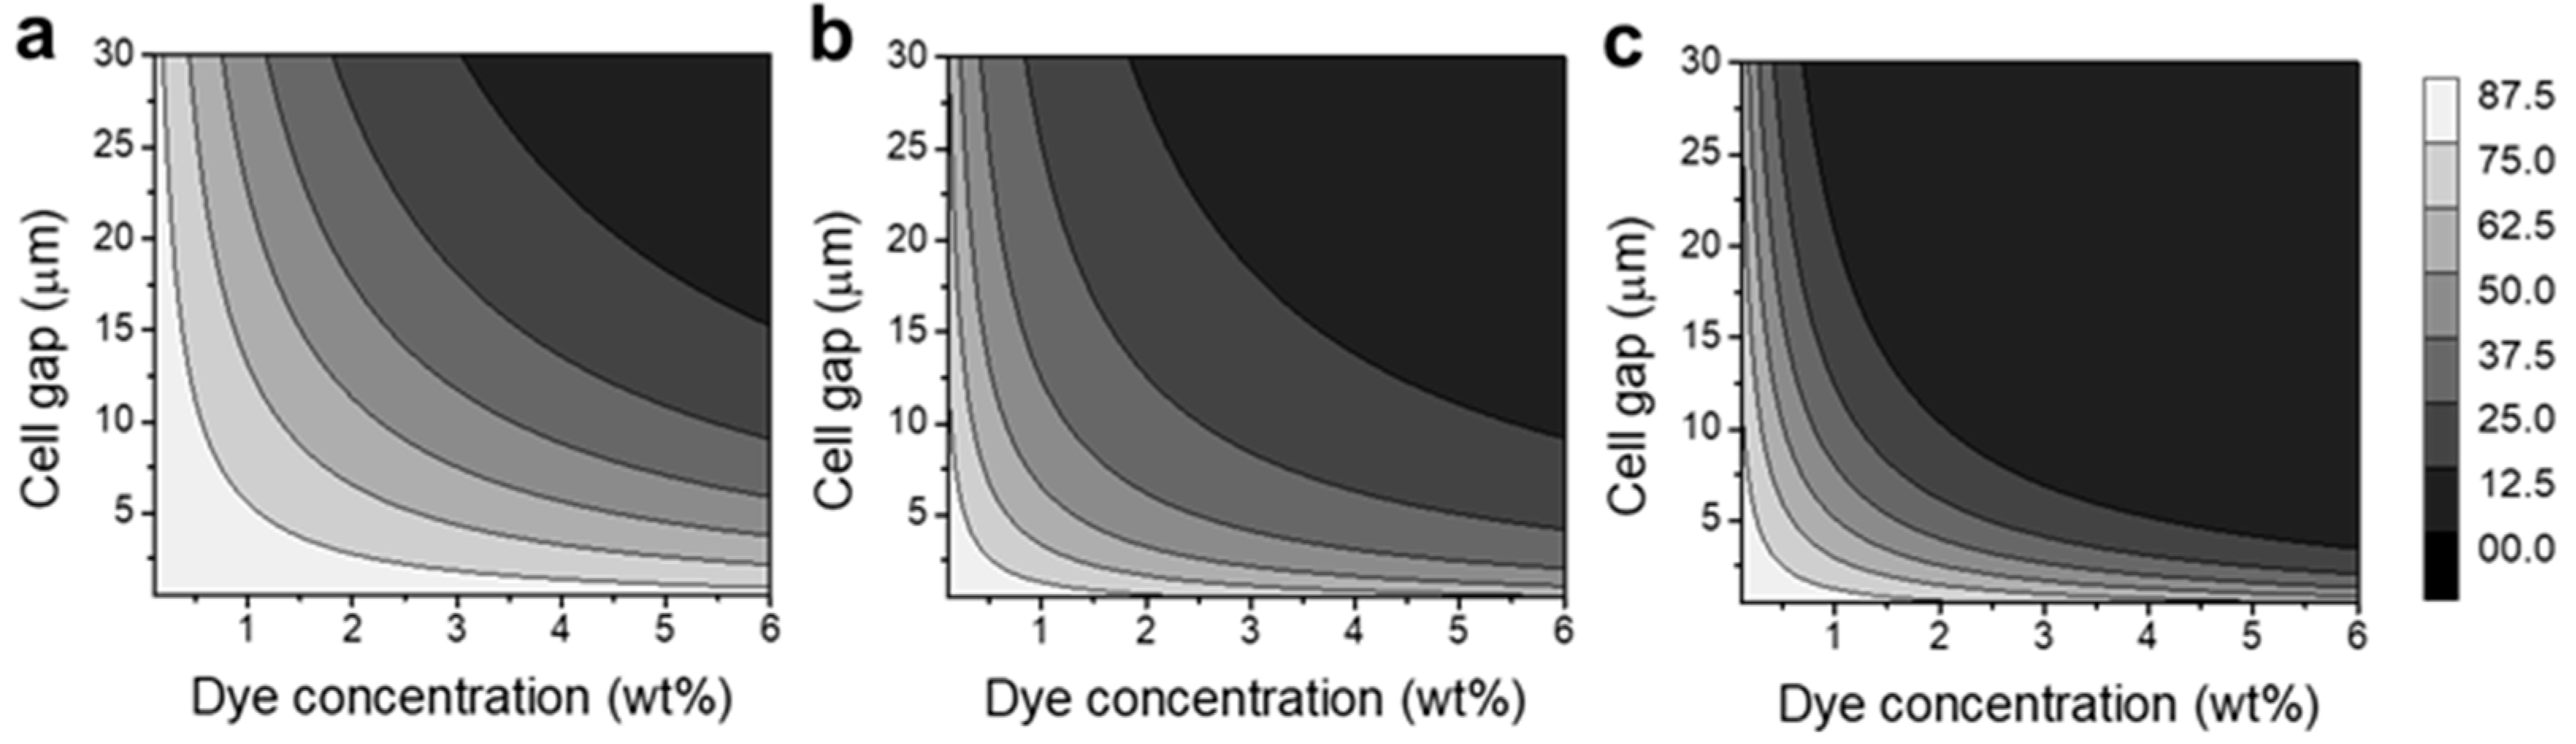
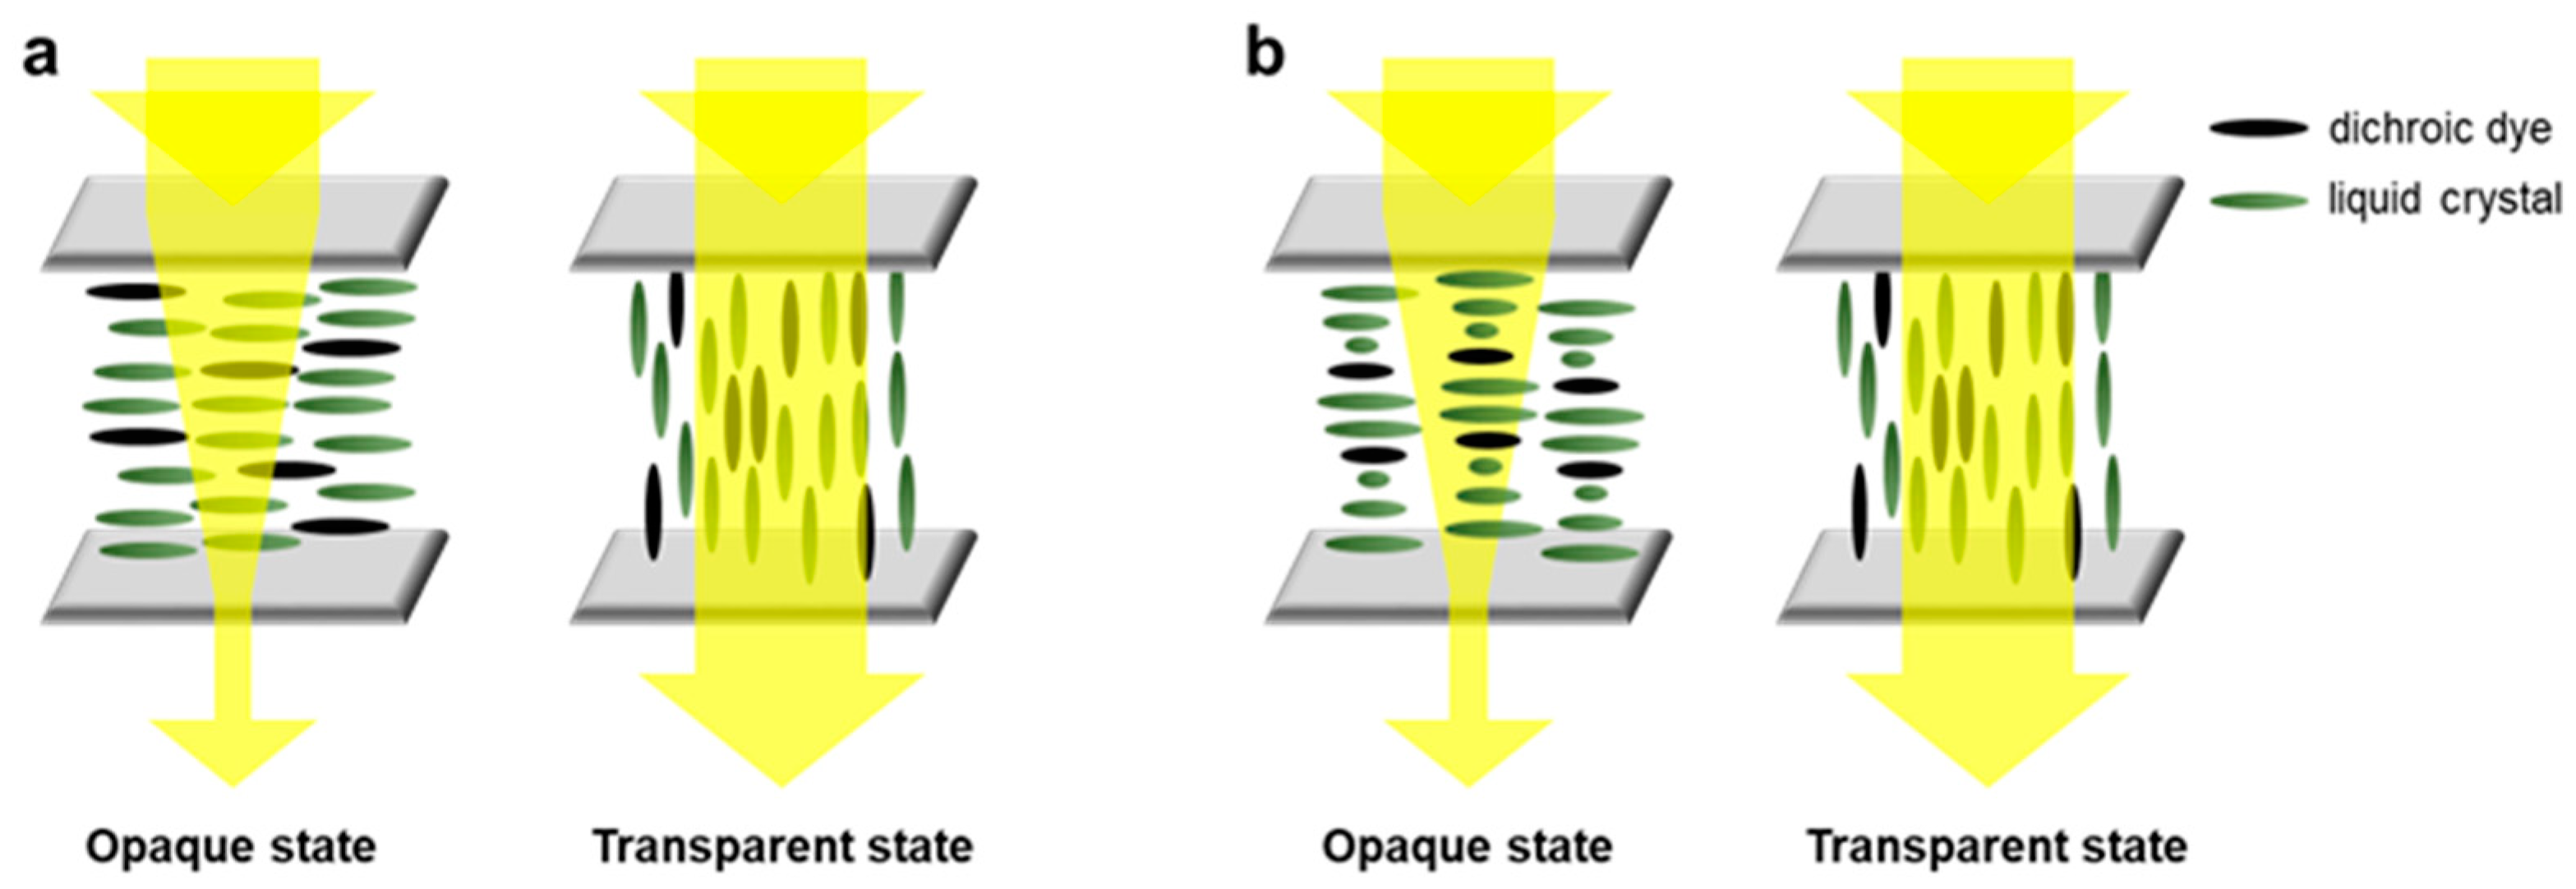
3. The Transmittance of Guest-Host Liquid Crystal Cells
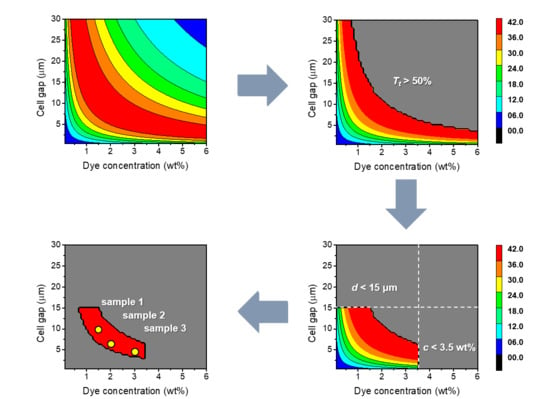
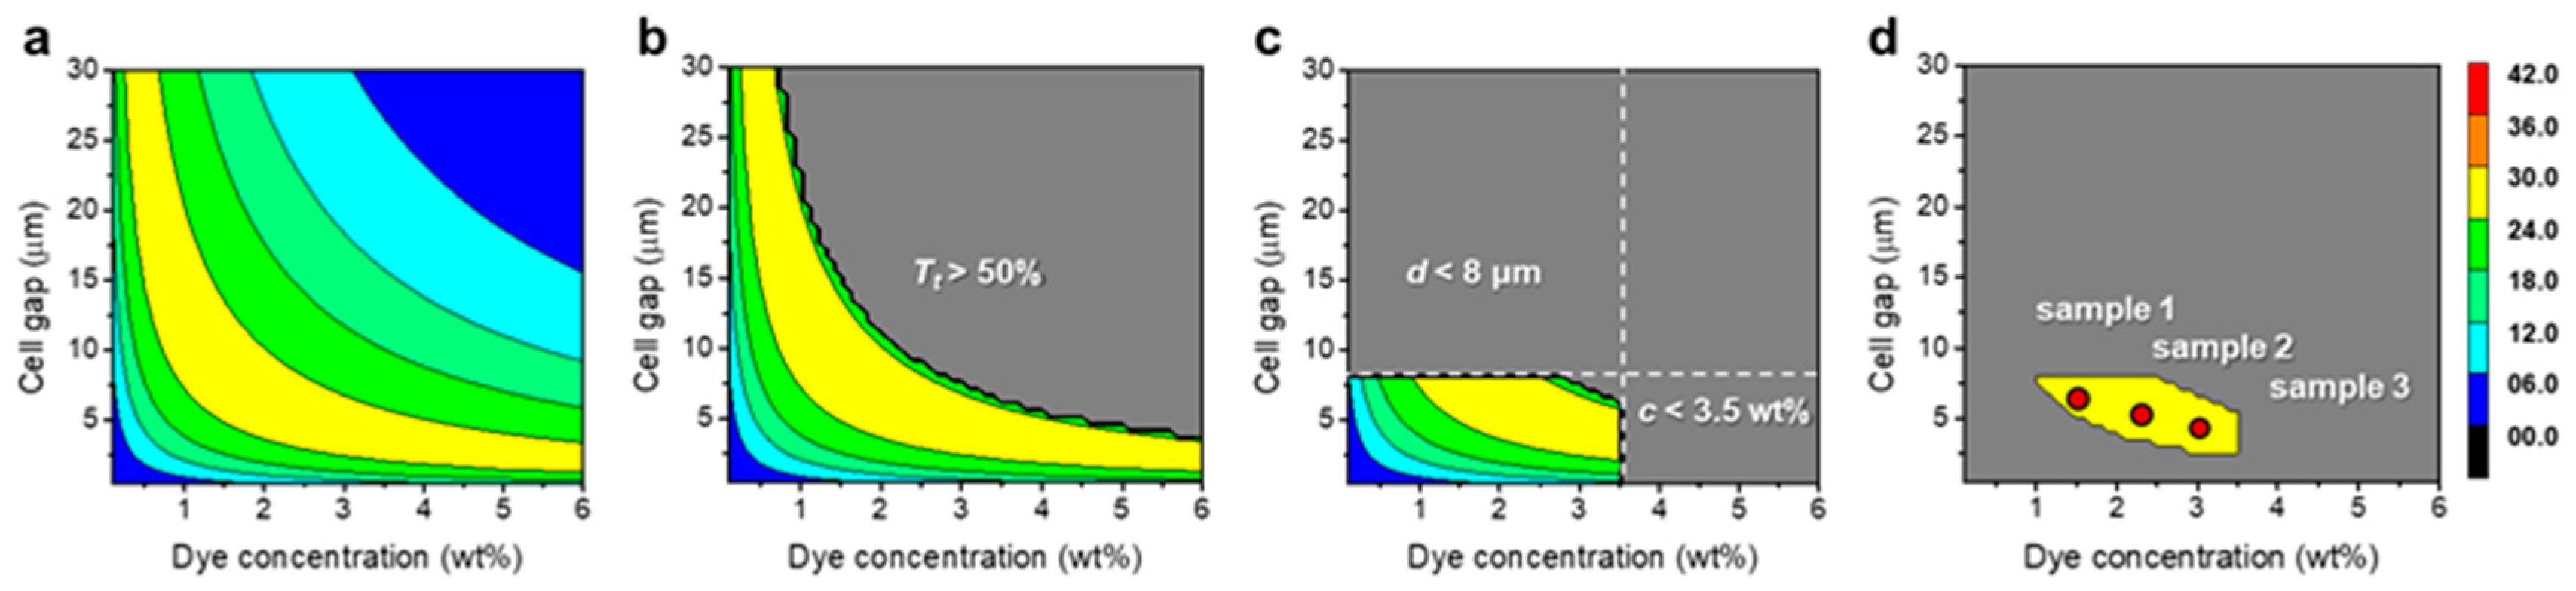
4. Design and Fabrication Process
5. Conclusions
Author Contributions
Funding
Conflicts of Interest
References
- Granqvist, C.G.; Wittwer, V. Materials for solar energy conversion: An overview. Sol. Energy Mater. Sol. Cells 1998, 54, 39–48. [Google Scholar] [CrossRef]
- Granqvist, C.G. Oxide electrochromics: An introduction to devices and materials. Sol. Energy Mater. Sol. Cells 2012, 99, 1–13. [Google Scholar] [CrossRef]
- Jensen, J.; Hösel, M.; Dyer, A.L.; Kerbs, F.C. Development and manufacture of polymer-based electrochromic devices. Adv. Funct. Mater. 2015, 25, 2073–2090. [Google Scholar] [CrossRef]
- Xia, X.; Ku, Z.; Zhou, D.; Zhong, Y.; Zhang, Y.; Wang, Y.; Huang, M.J.; Tu, J.; Fan, H.J. Perovskite solar cell powered electrochromic batteries for smart windows. Mater. Horiz. 2016, 3, 588–595. [Google Scholar] [CrossRef]
- Vergaz, R.; Sanchez-Pena, J.M.; Barrios, D.; Vazquez, C.; Contreras- Lallana, P. Modelling and electro-optical testing of suspended particle devices. Sol. Energy Mater. Sol. Cells 2008, 92, 1483–1487. [Google Scholar] [CrossRef]
- Barrios, D.; Vergaz, R.; Sanchez-Pena, J.M.; Garcia-Camara, B.; Granqvist, C.G.; Niklasson, G.A. Simulation of the thickness dependence of the optical properties of suspended particle devices. Sol. Energy Mater. Sol. Cells 2015, 143, 613–622. [Google Scholar] [CrossRef]
- Yoo, S.-H.; Park, M.-K.; Park, J.-S.; Kim, H.-R. Enhanced adhesion and transmittance uniformity in laminated polymer-dispersed liquid crystal films. J. Opt. Soc. Korea 2014, 18, 753–761. [Google Scholar] [CrossRef]
- Smith, G.W. Cure parameters and phase behavior of an ultraviolet-cured polymer-dispersed liquid crystal. Mol. Cryst. Liq. Cryst. 1991, 196, 89–102. [Google Scholar] [CrossRef]
- White, D.L.; Taylor, G.N. New absorptive mode reflective liquid-crystal display device. J. Appl. Phys. 2003, 45, 4718. [Google Scholar] [CrossRef]
- Oh, S.-W.; Baek, J.-M.; Heo, J.; Yoon, T.-H. Dye-doped cholesteric liquid crystal light shutter with a polymer-dispersed liquid crystal film. Dyes Pigments 2016, 134, 36–40. [Google Scholar] [CrossRef]
- Gutierrez-Cuevas, K.G.; Wang, L.; Zheng, Z.; Bisoyi, H.K.; Li, G.; Tan, L.-S.; Vaia, R.A.; Li, Q. Frequency-driven self-organized helical superstructures loaded with mesogen-grafted silica nanoparticles. Angew. Chem. 2016, 128, 13284–13288. [Google Scholar] [CrossRef]
- Wang, L.; Bisoyi, H.K.; Zheng, Z.; Gutierrez-Cuevas, K.G.; Singh, G.; Kumar, S.; Bunning, T.J.; Li, Q. Stimuli-directed self-organized chiral superstructures for adaptive windows enabled by mesogen-functionalized graphene. Mater. Today 2017, 20, 230–237. [Google Scholar] [CrossRef]
- Li, Q. Liquid Crystals beyond Displays: Chemistry, Physics, and Applications; John Wiley & Sons: Hoboken, NJ, USA, 2012. [Google Scholar]
- Heilmeier, G.H.; Zanoni, L.A. Guest-host interactions in nematic liquid crystals. A new electro-optic effect. Appl. Phys. Lett. 1968, 13, 91–92. [Google Scholar] [CrossRef]
- Huh, J.-W.; Yu, B.-H.; Heo, J.; Yoon, T.-H. Double-cell light shutter using long-pitch cholesteric liquid crystal cells. Appl. Opt. 2015, 54, 3792–3795. [Google Scholar] [CrossRef]
- Huh, J.-W.; Ji, S.-M.; Heo, J.; Yu, B.-H.; Yoon, T.-H. Bistable light shutter using dye-doped cholesteric liquid crystals driven with crossed patterned electrodes. J. Disp. Technol. 2016, 8, 779–783. [Google Scholar] [CrossRef]
- Baek, J.-M.; Oh, S.-W.; Kim, S.-H.; Yoon, T.-H. Fabrication of an initially-focal-conic cholesteric liquid crystal cell without polymer stabilization. Displays 2018, 52, 55–58. [Google Scholar] [CrossRef]
- Huh, J.-W.; Kim, J.-H.; Oh, S.-W.; Ji, S.-M.; Yoon, T.-H. Ion-doped liquid-crystal cell with low opaque-state specular transmittance based on electro-hydrodynamic effect. Dyes Pigments 2018, 150, 16–20. [Google Scholar] [CrossRef]
- Kim, S.-H.; Oh, S.-W.; Yoon, T.-H. Enhancement of absorption and haze with hybrid anchoring of dye-doped cholesteric liquid crystals. Opt. Express. 2018, 26, 14259. [Google Scholar] [CrossRef] [PubMed]
- Uchida, T.; Katagishi, T.; Onodera, M.; Shibata, Y. Reflective multicolor liquid-crystal display. IEEE Trans. Electron Devices 1986, 33, 1207–1211. [Google Scholar] [CrossRef]
- Huh, J.-W.; Yu, B.-H.; Heo, J.; Ji, S.-M.; Yoon, T.-H. Technologies for display application of liquid crystal light shutters. Mol. Cryst. Liq. Cryst. 2017, 664, 120–129. [Google Scholar] [CrossRef]
- Yang, D.-K.; Wu, S.-T. Fundamentals of Liquid Crystal Devices; John Wiley & Sons: Chichester, UK, 2006. [Google Scholar]
- Wu, S.T.; Yang, D.-K. Reflective Liquid Crystal Displays; John Wiley & Sons: New York, NY, USA, 2001. [Google Scholar]
- Ivashchenko, A.V. Dichroic Dyes for Liquid Crystal Displays; CRC Press: London, UK, 1994. [Google Scholar]
- Yu, B.-H.; Huh, J.-W.; Kim, K.-H.; Yoon, T.-H. Light shutter using dichroic-dye-doped long-pitch cholesteric liquid crystals. Opt. Express 2013, 21, 29332–29337. [Google Scholar] [CrossRef] [PubMed]
- Swinehart, D.F. The beer-lambert law. J. Chem. Educ. 1962, 39, 333–335. [Google Scholar] [CrossRef]
- Scheffer, T.J. Optimized three-component dye mixtures for achromatic guest-host liquid-crystal displays. J. Appl. Phys. 1982, 53, 257. [Google Scholar] [CrossRef]
- Yu, B.-H.; Huh, J.-W.; Heo, J.; Yoon, T.-H. Simultaneous control of haze and transmittance using a dye-doped cholesteric liquid crystal cell. Liq. Cryst. 2015, 42, 1460–1464. [Google Scholar] [CrossRef]
- Kim, K.-H.; Song, D.H.; Shen, Z.-G.; Park, B.W.; Park, K.-H.; Lee, J.-H.; Yoon, T.-H. Fast switching of long-pitch cholesteric liquid crystal device. Opt. Express 2011, 19, 10174–10179. [Google Scholar] [CrossRef] [PubMed]
- Ji, S.-M.; Oh, S.-W.; Jo, Y.-S.; Nam, S.-M.; Kim, S.-H.; Huh, J.-W.; Lim, E.; Kim, J.; Yoon, T.-H. Optimization of dye mixing for achromatic transmittance control with a dye-doped cholesteric liquid crystal cell. Dyes Pigment. 2019, 160, 172–176. [Google Scholar] [CrossRef]
- Yeh, P.; Gu, C. Optics of Liquid Crystal Displays, 2nd ed.; John Wiley & Sons: Hoboken, NJ, USA, 2010. [Google Scholar]


| d (μm) | c (wt %) | ΔT (%) | Tt (%) | τd (ms) | τr (ms) | Vd (V) | |
|---|---|---|---|---|---|---|---|
| Sample 1 | 6.5 | 1.5 | 25.8 | 60.4 | 14.1 | 0.54 | 12.5 |
| Sample 2 | 5.5 | 2.25 | 26.0 | 62.8 | 12.9 | 0.46 | 12.5 |
| Sample 3 | 4.5 | 3.0 | 25.7 | 67.6 | 9.5 | 0.41 | 12.5 |
| d (μm) | c (wt %) | ΔT (%) | Tt (%) | τd (ms) | τr (ms) | Vd (V) | |
|---|---|---|---|---|---|---|---|
| Sample 1 | 10 | 1.5 | 40.0 | 58.7 | 452 | 1.6 | 35.0 |
| Sample 2 | 6.5 | 2.0 | 39.1 | 62.4 | 385 | 1.6 | 21.0 |
| Sample 3 | 4.5 | 3.0 | 39.2 | 62.2 | 295 | 1.5 | 14.0 |
© 2019 by the authors. Licensee MDPI, Basel, Switzerland. This article is an open access article distributed under the terms and conditions of the Creative Commons Attribution (CC BY) license (http://creativecommons.org/licenses/by/4.0/).
Share and Cite
Nam, S.-M.; Oh, S.-W.; Kim, S.-H.; Huh, J.-W.; Lim, E.; Kim, J.; Yoon, T.-H. Parameter Space Design of a Guest-Host Liquid Crystal Device for Transmittance Control. Crystals 2019, 9, 63. https://doi.org/10.3390/cryst9020063
Nam S-M, Oh S-W, Kim S-H, Huh J-W, Lim E, Kim J, Yoon T-H. Parameter Space Design of a Guest-Host Liquid Crystal Device for Transmittance Control. Crystals. 2019; 9(2):63. https://doi.org/10.3390/cryst9020063
Chicago/Turabian StyleNam, Seung-Min, Seung-Won Oh, Sang-Hyeok Kim, Jae-Won Huh, Eunjung Lim, Jinhong Kim, and Tae-Hoon Yoon. 2019. "Parameter Space Design of a Guest-Host Liquid Crystal Device for Transmittance Control" Crystals 9, no. 2: 63. https://doi.org/10.3390/cryst9020063
APA StyleNam, S.-M., Oh, S.-W., Kim, S.-H., Huh, J.-W., Lim, E., Kim, J., & Yoon, T.-H. (2019). Parameter Space Design of a Guest-Host Liquid Crystal Device for Transmittance Control. Crystals, 9(2), 63. https://doi.org/10.3390/cryst9020063