Abstract
The growth interface instability of large-size SiC growth in top-seeded solution growth (TSSG) is a bottleneck for industrial production. The authors have previously simulated the growth of 4-inch SiC crystals and found that the interface instability in TSSG was greatly affected by the flow field. According to our simulation of the flow field, we proposed a new stepped structure that greatly improved the interface stability of large-size crystal growth. This stepped structure provides a good reference for the growth of large-sized SiC crystals by TSSG in the future.
1. Introduction
With the rapid development of electric vehicles and smart grids, power devices using silicon carbide as a raw material have received increasing attention [1,2]. The commonly used method of growing silicon carbide ingots in the industry is the physical vapor transport (PVT) method [3], and remarkable achievements have been successfully obtained in the industrial production of 200 mm (8-inch) wafers [4].
Although the PVT method has received wide recognition due to its rapid growth speed and low cost, there are always quality problems in silicon carbide wafers fabricated using the PVT method, such as a high number of microtubule defects and low-angle boundaries. An increasing amount of attention has been paid to the top-seed solution growth (TSSG) method for the past ten years because it is closer to the thermodynamic growth equilibrium and produces low defect crystals [5,6]. The challenges of this growth method are as follows. First, the growth temperature is as high as 2000 K, and the silicon solution is opaque. Therefore, it is very difficult to measure the flow of solution in a crucible in real-time. Second, there are multiple complicated internal forces in the silicon solution, including electromagnetic forces caused by electromagnetic heating, thermal buoyancy caused by temperature differences, forced convection caused by rotation, and Marangoni forces caused by temperature differences at the gas-liquid interface. For this reason, many numerical simulation studies have been performed for the TSSG process of silicon carbide, and numerical simulation is a superior method for inspecting crystal growth [7,8,9,10].
Specifically, Mercier and Dedulle [7] numerically studied the growth of a SiC solution for the first time under the condition of neglecting the effect of the solute on the solution, and investigated the influence of different crucible shapes and different crucible vertical positions on the temperature and the flow patterns. Yamamoto et al. [8] first established a three-dimensional model of TSSG and studied the relationship between the heating coil frequency and the fluid flow. Okano [9] studied the Marangoni forces around the 2-inch seed crystal flow field and observed the flow separation phenomenon under the seed crystal. Liu [10] simulated the dynamic growth of a 4-inch silicon carbide crystal, revealing the relationship between the crystal interface stability and the fluid flow separation.
According to the above study [9,10], we found that the crystal growth stability is closely related to the solution flow. In this paper, we used an appendix and positioned it on the graphite (rod) as an important step towards the interface stability of larger crystals. The results show that the selection of a certain appendix can achieve a comparatively higher growth rate and stability.
2. Numerical Analysis
The simplified furnace structure of the simulation model and the partial schematic used in this simulation are shown in Figure 1. The external graphite crucible (called a furnace) is directly heated by induction (30 kHz). The inner crucible (called a crucible) is not only a container for solution, but also a carbon source in the growth process. The crucible is mainly heated by radiation from the furnace. Pure liquid silicon of 11N (Mitsubishi Materials Corporation, Tokyo, Japan) is placed in the internal crucible as a solution [11,12]. The inner diameter of graphite crucible is 100 mm, and it is filled with Si which, depth after melting, is 72 mm. A seed with a radius of 50 mm is mounted on a graphite rod rotating at 20 rpm and dipped into the liquid to a depth of approximately 3 mm. The appendix, which is 5mm thick made by graphite as a connection between the graphite and the seed, is shown in Figure 1b. The basic physical properties of the materials required in this study are listed in Table 1.
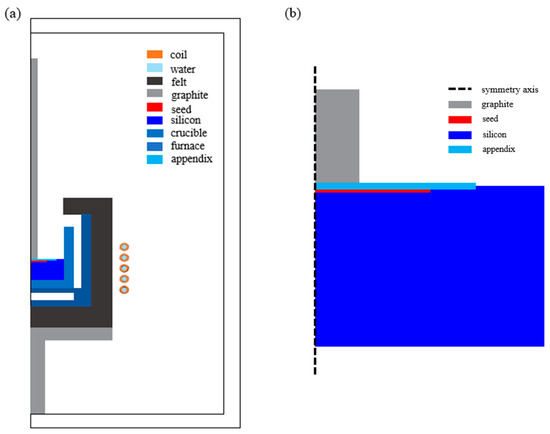
Figure 1.
(a) The simplified furnace structure of the simulation model. (b) Partial schematic of the simulation.

Table 1.
The basic physical properties of the materials [7,10,13].
We used OpenFoam in the present study, and simulations were studied respectively for (1) the electromagnetic field, (2) the temperature field of the entire system, and (3) the transport structures (temperature, concentration, and fluid flow) in the melt. The computation orders are as follows. The Lorentz force and the heat generation densities due to induction heating are obtained by computing the electromagnetic field. We then execute the simulation in the second step (2), substituting the current density calculated in the previous step into the second step calculation. Finally, in step (3), the Lorentz force of the first step and the temperature generated by the second step are used to calculate the temperature field, flow field, and concentration field in the silicon solution.
The main governing equations are shown below, and the detailed boundary conditions were introduced in a previous study [7,9]. In addition, the no-slip boundary condition and the same speed as the rod (20 rpm) are applied to the appendix.
2.1. Electromagnetic Field
The electromagnetic field equations in this system are as follows:
where Ce is the in-phase amplitude of the magnetic stream function, r is the radial coordinate (m), z is the axial coordinate (m), σe is the electrical conductivity (S m−1), μe is the magnetic permeability (H m−1), ω is the frequency (rads−1), and Se is the out-of-phase amplitude of the magnetic stream function.
The period-averaged heat generation and Lorentz force densities are calculated by using these amplitudes as follows:
where Q is the Joule heat generation density (W m−3), FE is the Lorentz force density (N m−3), J is the current density (A m−2), B is the static magnetic field (T), J0 is the peak value of electric current (A), and t is the time (s).
2.2. Heat Field
The energy equation and the radiation heat transfer equation are expressed as follows:
where k is the thermal conductivity (W m−1 K−1), T is the temperature (K), Ji is the radiosity (w m−2), εi is the emissivity, Fij is the view factor, Eb,i is the emissive power of a black body (W m−2), and q/A is the heat flux (W m−2).
2.3. Fluid Flow in the Si Solution
The relevant equations of transport phenomena in the melt are expressed in the following forms, which include mass, momentum, energy and carbon transport:
where u is the velocity vector (m s−1), ρ is the density of pure silicon (kg m−3), p is the pressure (Pa), ν is the kinematic viscosity (m2 s−1), β is the thermal expansion coefficient (K−1), g is the gravitational acceleration (m s−2), α is the thermal diffusivity (m2 s−1), Cp is the specific heat (J kg−1 K−1), and T0 is the reference temperature of 1687 K. The convection-diffusion equation and the growth rate equation are introduced as follows:
where c is the carbon concentration (mol m−3), the value of D is 1.7 × 10⁻⁸ m2/s, which is the diffusion coefficient of carbon in silicon solution [11]. ρSi is the liquid silicon density (kg m−3), Ceq is the carbon equilibrium concentration (mol m−3), xCeq is the carbon molar fraction, MSi is the molar weight of silicon, MSiC is the molar weight of silicon carbide, ρSiC is the density of silicon carbide (kg m−3), n is the unit vector perpendicular to the crystal surface, and Vg is the growth rate. In addition, supersaturation S is defined as deviation from equilibrium concentration in order to show dissolution and crystallization zones [12]:
2.4. Numerical Method
Referring to previous studies [14,15], turbulence is selected because its value is greater than the critical Rayleigh number (Rac = 4 × 10⁴) [16,17]. The Rayleigh number is defined by the following formula:
where T is the temperature of the silicon solution, Tcrystal = 1970 K, h is the height of the liquid (m), κ is the thermal diffusivity (m2 s−1), and ν is the kinematic viscosity (m2 s−2).
3. Results and Discussion
3.1. Flow Field and Growth Rate without the Appendix
Although some studies [9,10] have investigated the flow and temperature fields of different sizes of silicon carbide crystals, this study first repeats the flow field of a 4-inch silicon carbide crystal without an appendix to better illustrate the role of the appendix. Figure 2 shows the temperature field, flow field, and growth rate of the 4-inch silicon carbide ingot.
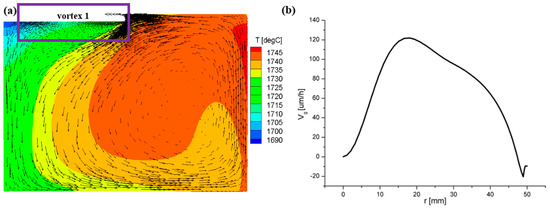
Figure 2.
(a) Temperature and velocity distributions under a frequency of 30 kHz. (b) Growth rate along the radius.
The lowest temperature of 1690 °C is located on the left side of Figure 2a (i.e., the center of the seed), and the highest temperature of 1745 °C appears on the right side of the wall. The phenomenon is due to the uneven heating caused by the increase of crucible and seed size. Figure 2b shows the growth rate curve along the radius. It can be known from previous studies [9,10] that the formation of vortex 1 is closely bound up with this growth curve and this kind of vortex is an important factor affecting the growth stability of large-scale crystals.
3.2. Flow Field and Growth Rate with the Appendix
As the existence of vortex 1 under the seed seriously interferes with the growth of the crystal, if the new stepped structure (consists of the rod and the appendix) proposed in this paper makes vortex 1 deviate from the bottom of the seed, its growth stability can be significantly improved. Figure 3 shows the addition of an appendix to improve the 4-inch growth interface instability. An appendix is inserted between the seed and the graphite, and the length ratio of the appendix to the seed is chosen as 1.2:1, 1.4:1, and 1.6:1 as shown in Figure 3a–c. Besides, Figure 3(d1,d2) respectively correspond to the enlarged figures of vortex 1 and vortex 2.
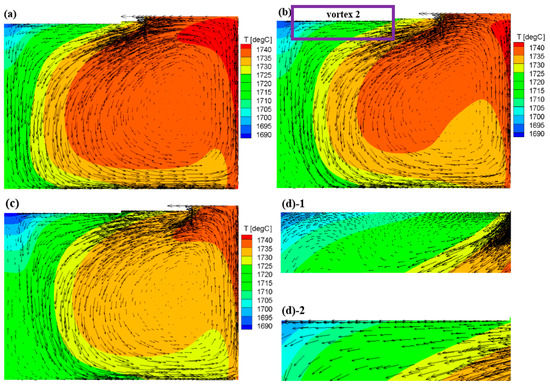
Figure 3.
Temperature field for different length ratios of the appendix to the seed. (a) 1.2:1, (b) 1.4:1, (c) 1.6:1, (d)-1 the expanded figure of vortex 1, (d)-2 the expanded figure of vortex 2.
For the temperature field from Figure 3a to Figure 3c, as the length of the appendix increases, the internal temperature of the entire solution decreases, as seen in the red area on the right side and the green area on the left side inside the solution. For the flow field of Figure 3(d1,d2), we can observe that the flow near the wall of the seed crystal becomes smooth with the addition of the appendix and the size change, and vortex 1 gradually deviates from the seed crystal growth region. Figure 4 describes the relationship between the flow velocity and the crystal growth rate (Vg).
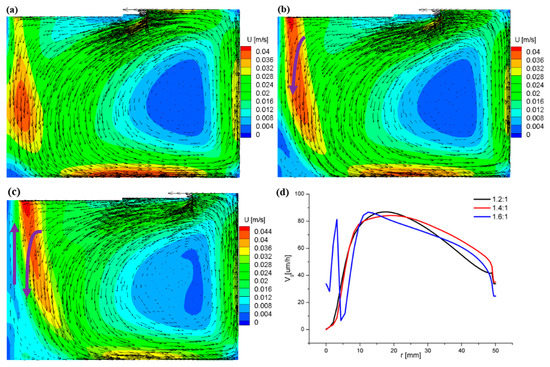
Figure 4.
Velocity field and flow field for different length ratios of the appendix to the seed. (a) 1.2:1, (b) 1.4:1, (c) 1.6:1, (d) growth rate along the radius.
As the size of the appendix increases, the change in the flow velocity in the right region (e.g., blue area) of the flow field is small, but the velocity in the left region (e.g., red and yellow areas) increases significantly, with the maximum velocity region gradually moving upwards. This is related to the tangent flow formed in the central region (purple arrow). Comparing Figure 4d with Figure 2b, we can see that with the addition of the appendix, the velocity curve in the radial direction becomes smooth, but when the appendix size exceeds a certain value (1.6:1), the speed stability decreases slightly. For the above reasons, although the temperature in the flow field region decreases, the longitudinal temperature gradient does not change much. Therefore, at (1.6:1), the centre portion is further driven by the temperature difference to form an upward flow, while the adjacent region is still flowing downwards, thus causing fluctuations. In addition, it can be seen from Figure 4b,c that an upwards flow direction is favorable for an increase in the growth rate of the seed crystal.
Figure 5 shows the supersaturation S, which is driven by the convective phenomena in the liquid. According to Equation (14), warm colors correspond to the supersaturated region (S > 0), meaning that crystallization may occur. Cool colors indicate the undersaturated area (S < 0), where the dissolution of carbon from the crucible should occur. Compared with Figure 5a, we can see that the supersaturated area is significantly enlarged after the appendix is added, which indicates that the addition of an appendix is beneficial to crystal growth. However, when the size of the attachment exceeds a certain length, the area of the crystallization changes significantly, as shown in Figure 5d. The above changes are caused by the separation of fluid in the center, as shown in Figure 4c. Therefore, choosing the appropriate appendix length is important for the stability of the growth rate and for the crystallization efficiency.
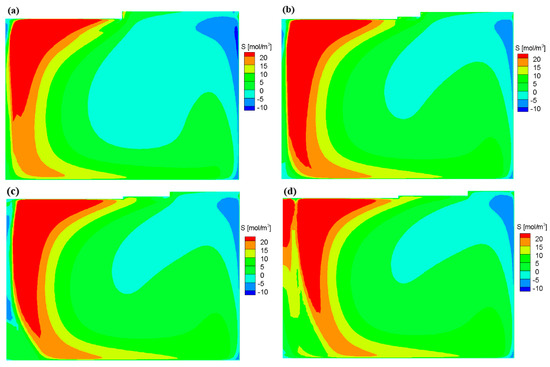
Figure 5.
The supersaturation S for different appendix ratios. (a) Without appendix, (b) 1.2:1, (c) 1.4:1, (d) 1.6:1.
4. Conclusions
The TSSG of large-sized silicon carbide crystals with a diameter of four inches was studied using the Si solvent. In order to control the flow of the solution, we proposed a new convection control technique to stabilize the growth interface. The flow field under the crystal can be greatly improved with the optimized length ratio of the inserted appendix to the seed, and a larger supersaturation can be obtained compared to ordinary growth. This research provides a good reference for the growth of large-sized silicon carbide by solution growth.
Author Contributions
Conceptualization, B.L. and B.G.; methodology, B.L.; software, Y.Y.; validation, X.T., Y.Y. and B.L.; formal analysis, Y.Y.; investigation, X.T.; supervision, B.G.
Funding
This research received no external funding.
Acknowledgments
Thanks to Wenqing Ju for understanding and support of this research.
Conflicts of Interest
The authors declare no conflict of interest.
References
- Nee, H.P.; Rabkowski, J. High-efficiency power conversion using silicon carbide power electronics. Mater. Sci. Forum. 2014, 1083, 778–780. [Google Scholar]
- Biela, J.; Schweizer, M.; Waffler, S.; Kolar, J.W. SiC versus Si—Evaluation of potentials for performance improvement of inverter and DC–DC converter systems by SiC power semiconductors. IEEE Trans. Ind. Electron. 2011, 58, 2872. [Google Scholar] [CrossRef]
- Tairov, Y.M.; Tsvetkov, V.F. Investigation of growth processes of ingots of silicon carbide single crystals. J. Cryst. Growth 1978, 43, 209–212. [Google Scholar] [CrossRef]
- Powell, A.R.; Sumakeris, J.J.; Khlebnikov, Y.; Paisley, M.J.; Leonard, R.T.; Deyneka, E.; Gangwal, S.; Ambati, J.; Tsevtkov, V.; Seaman, J.; et al. Bulk Growth of Large Area SiC Crystals. Mater. Sci. Forum. 2016, 858, 5–10. [Google Scholar] [CrossRef]
- Hofmann, D.H.; Muller, M.H. Prospects of the use of liquid phase techniques for the growth of bulk silicon carbide crystals. Mater. Sci. Eng. B 1999, 61, 29–39. [Google Scholar] [CrossRef]
- Yamamoto, Y.; Harada, S. Low-dislocation-density 4H-SiC crystal growth utilizing dislocation conversion during solution method. Appl. Phys. Express. 2014, 7, 065501. [Google Scholar] [CrossRef]
- Mercier, F.; Dedulle, J.M.; Chaussende, D.; Pons, M. Coupled heat transfer and fluid dynamics modeling of high-temperature SiC solution growth. J. Cryst. Growth 2010, 312, 155–163. [Google Scholar] [CrossRef]
- Yamamoto, T.; Adkar, N.; Okano, Y.; Ujihara, T.; Dost, S. Numerical investigation of the transport phenomena occurring in the growth of SiC by the induction heating TSSG method. J. Cryst. Growth 2017, 474, 50–54. [Google Scholar] [CrossRef]
- Yamamoto, T.; Okano, Y.; Ujihara, T.; Dost, S. Global simulation of the induction heating TSSG process of SiC for the effects of Marangoni convection, free surface deformation and seed rotation. J. Cryst. Growth 2017, 470, 75–88. [Google Scholar] [CrossRef]
- Liu, B.; Yu, Y.; Tang, X.; Gao, B. Influence of silicon melt convection on interface instability in large-size silicon carbide solution growth. J. Cryst. Growth 2019, 527, 125248. [Google Scholar] [CrossRef]
- Mercier, F.; Nishizawa, S. Numerical Investigation of the Growth Rate Enhancement of SiC Crystal Growth from Silicon Melts. Jpn. J. Appl. Phys. 2011, 50, 035603. [Google Scholar] [CrossRef]
- Lefebure, J.; Dedulle, J.M.; Ouisse, T.; Chaussende, D. Modeling of the growth rate during top seeded solution growth of SiC using pure silicon as a solvent. Cryst. Growth Des. 2011, 12, 909–913. [Google Scholar] [CrossRef]
- Ha, M.T.; Yu, Y.J.; Shin, Y.J.; Bae, S.Y.; Lee, M.H.; Kim, C.J.; Jeong, S.M. Flow modification enhancing the growth rate in top seeded solution growth of SiC crystals. RSC Adv. 2019, 9, 26327–26337. [Google Scholar] [CrossRef]
- Kusunoki, K.; Okada, N.; Kamei, K.; Moriguchi, K.; Daikoku, H.; Kado, M.; Sakamoto, T.; Ujihara, T. Top-seeded solution growth of three-inch-diameter 4H-SiC using convection control technique. J. Cryst. Growth 2014, 395, 68–73. [Google Scholar] [CrossRef]
- Tsunooka, Y.; Kokubo, N.; Hatasa, G.; Harada, S.; Tagawa, M.; Ujihara, T. High-speed prediction of computational fluid dynamics simulation in crystal growth. CrystEngComm 2018, 20, 6546–6550. [Google Scholar] [CrossRef]
- Muller, G.; Neumann, G.; Weber, W. Natural convection in vertical Bridgman configurations. J. Cryst. Growth 1984, 70, 78–93. [Google Scholar] [CrossRef]
- Touihri, R.; Hadid, H.B.; Henry, D. On the onset of convective instabilities in cylindrical cavities heated from below. Phys. Fluids. 1999, 11, 2078. [Google Scholar] [CrossRef]


© 2019 by the authors. Licensee MDPI, Basel, Switzerland. This article is an open access article distributed under the terms and conditions of the Creative Commons Attribution (CC BY) license (http://creativecommons.org/licenses/by/4.0/).