Article

Crystallization of CaCO3 in Aqueous Solutions with Extremely High Concentrations of NaCl

School of Chemistry and Molecular Engineering, Nanjing Tech University, Nanjing 211816, China
*
Authors to whom correspondence should be addressed.
These authors contributed equally.
Crystals 2019, 9(12), 647; https://doi.org/10.3390/cryst9120647
Submission received: 20 November 2019 / Revised: 1 December 2019 / Accepted: 5 December 2019 / Published: 6 December 2019
(This article belongs to the Special Issue Carbonates Volume II)

Abstract

:
The effect of NaCl at extremely high concentrations from 3.5 to 14 wt. % on the crystallization of CaCO3 was investigated in depth. The static test experiment verified that the Ca2+ retention efficiency (η) of NaCl on CaCO3 scale increased from 31.06% (3.5 wt. %) to 41.56% (14 wt. %). Based on the calculation of supersaturation rations, the high concentration of NaCl could reduce the activity coefficients of [Ca2+] and [CO32−], thus reducing the actual concentration of CaCO3. The CaCO3 deposition rate constants (k) showed that NaCl slowed down the rate of CaCO3 crystallization. The X–ray diffraction (XRD) testing disclosed that the growth of (1 0 4) and (1 1 0) faces from calcite was impeded, while the formation of (1 1 1) face from aragonite was induced by the increasing concentration of NaCl. The inductively coupled plasma optical emission spectrometry (ICP–OES) results indicated that Na+ could be doped into CaCO3, leading to the one–dimensional crystal growth. It was further proved that NaCl heightens the efficiency of the typical phosphate inhibitors (2–phosphonobutane–1,2,4–tricarboxylic acid (PBTCA) and 1–hydroxyethane–1,1–diphosphonic acid (HEDP)) on prohibiting the scale of CaCO3.

1. Introduction

Seawater is widely used in the reverse osmosis desalination plants [1,2,3,4,5,6], multi-stage-flash desalination process [7], circulating cooling water systems, and other water treatment systems [8]. In these processes, seawater is inevitably concentrated by two to four times. In particular, the NaCl concentration can reach the level of 3.5–14 wt.% [9,10]. As the excessive inspissation of the saline water, scaling would occur when the ionic activity product of precipitation was larger than its solubility product [11,12,13]. The disaster was occurring as scaling shortens the lifespan of membranes, reducing their overall efficiency of the heat transfer tubes and increasing the maintenance and operational costs as well [14,15].
Despite this, the superiorities of increasing the concentration factor of the system was particularly significant in sealed circulating cooling water systems, such as reducing the amount of make–up water, declining sewage discharge, and even achieving zero emission [16,17]. Moreover, the salt stress could inhibit the growth of bacteria in the tubes [18]. Actually, Na+ and Cl are the main components and CaCO3 was the major scale type in concentrated seawater [19]. Earlier, Choi et al. and Sheikholeslami et al. discovered that NaCl at high concentrations (3.5–5.2 wt.%) delayed the crystallization of CaSO4 [20,21]. It is of great importance if the CaCO3 scaling could be delayed when seawater is concentrated by 2–4 times. Therefore, a better understanding about the crystallization of CaCO3 in the extremely high salinity brines was rather urgent. However, until now, only Visscher et al. critically evaluate the CaCO3 solubility data at extreme concentrations of NaCl [22] In addition, no one had studied the scale inhibition effect of characteristic inhibitor in NaCl solution with such high concentrations.
Herein, the effect of NaCl solution (3.5 wt.%–14 wt.%) on CaCO3 crystallization and the combined effect of NaCl and typical phosphate scaling inhibitors (2–phosphonobutane–1,2,4–tricarboxylic acid (PBTCA) and 1–hydroxyethane–1,1–diphosphonic acid (HEDP)) were evaluated for the first time. The static test showed that the Ca2+ retention efficiency (η) was raised with the NaCl concentration increase. The prompt addition test and the calculation of the deposition rate constants proved that high salinity prolonged the CaCO3 crystallization. The X–ray diffraction (XRD) test clearly showed that NaCl mainly prohibited the growth of (1 0 4) and (1 1 0) facets of calcite and induced the formation of (1 1 1) facets of aragonite. The inductively coupled plasma optical emission spectrometry (ICP–OES) tests indicated that Na+ could be doped into CaCO3, inducing crystallization of CaCO3 to one–dimensional forms. The quantum calculation and morphology analysis verified that Na+ could not only enhance the chelate effect between the selected inhibitor and Ca2+, but also accelerate the lattice distortion of CaCO3 combining with the inhibitor. Thereby, the η values of HEDP and PBTCA in NaCl solution improved enormously, and they were as high as 83.50% and 92.16%, respectively, under the optimal conditions.

2. Experimental Section

2.1. Materials and Instruments

NaCl and CaCl2 were purchased from Xilong Chemical Co., Ltd. (Guangdong, China). NaHCO3 and Na2CO3 were obtained from Lingfeng Chemical Reagent Co., Ltd. (Shanghai, China). HEDP (50 wt.%) and PBTCA (50 wt.%) were got from Taihe Water Treatment Co., Ltd. (Shandong, China). All reagents used in the experiments were of analytical grade, and they were applied without further purification. The ultrapure water with 18.2 MΩ cm (Hitech, Medium–E400, Shanghai, China) was used thorough the experiment.
The precipitated solids were characterized by X–ray diffraction (XRD) analysis after three times of rinsing with ultrapure water and air drying at 40 °C. The XRD patterns were recorded on a Bruker D8 Advanced X–ray powder diffraction diffractometer (Bruker AXS, Karlsruhe, Germany). The scanning electron microscopy (SEM) analysis was performed on a FEI 400FEG (FEI, Hillsboro, Oregon, USA) device. The Nitrogen Adsorption (BET method) was carried out with a Gemini VII2390 (Micromeritics, Norcross, GA, USA) instrument. The inductively coupled plasma optical emission spectrometry (ICP–OES) was performed on a Varian 720–ES (Varian Medical Systems, Palo Alto, California, USA) spectrometer.

2.2. Static Test Experiment

The evaluation of the inhibition effect against CaCO3 deposits under static conditions was carried out according to Chinese National Standard (GB/T16632–2008) [23].The testing solution containing 0.006 mol/L Ca2+ and 0.012 mol/L HCO3 was prepared in a 250 mL volumetric flask, and, then the different concentrations of NaCl (3.5 wt.%–14 wt.%) were added into the parallel testing solutions. The pH level of the solutions was adjusted to 9.0 with 0.01 mol/L Na2B4O7 buffer solution. Then, the specimens were maintained at 80 °C for 10 h in thermostat water bath. After cooling to room temperature, these supersaturated solutions were filtered and then dried in vacuum at 50 °C for 12 h. The concentration of Ca2+ was titrated by an Ethylenediaminetetraacetic acid (EDTA) standard solution. The Ca2+ retention efficiency was determined by the formula [24]:
η % = C final C blank C initial C blank × 100 ,
where Cfinal and Cblank represented the Ca2+ in the filtrate with and without inhibitors, respectively. Cinitial was the initial concentration of Ca2+.

2.3. The Precipitation of CaCO3 by Prompt Addition

The testing was performed as follows [25]. First, 25 mL of 0.04 mol/L CaCl2 solution and 200 mL of NaCl (3.5 wt.%–14 wt.%) were prepared in advance. Then, the mixture was introduced into a three–necked glass reactor which was equipped with a calcium ion selective electrode and pH electrode. The reactor was placed in a constant temperature thermostatic water bath at 25 °C with continuous stirring. Before the addition of carbonate, the initial pH value of each solution was adjusted to 6.4 using 0.01 mol/L HCl. In the following stage, 25 mL of 0.04 mol/L Na2CO3 was added rapidly into the vessel. The pH values and the calcium ion concentrations were measured continuously.

2.4. Molecular Dynamics (MD) Simulation

The MD simulation was used to simulate the interaction between calcite surface and molecules. The space group of calcites is R 3(–) C, and its lattice parameters are a = b = 4.99 Å, c = 17.06 Å, α = β = 90°, and γ = 120° [26]. The interaction model was built with the Visualizer module. It would be cleaved with a surface along the 1 0 4 and 1 1 0 planes, setting the depth as 12.14 Å and 9.98 Å. Build the 2D surface into a super cell, adding a vacuum slab (about 30 Å) on the calcite to build a 3D cell for avoiding the influence of other periodic atoms. Then, the energy minimized inhibitor molecule and water molecules could be placed onto a proper position of the surface, ensuring the whole molecule to be inside the vacuum slab. The dimension of the super cell containing the crystal and inhibitor were 32.38 Å × 24.95 Å × 18.90 Å for 1 0 4 plane and 32.38 Å × 31.88 Å × 19.03 Å for 1 1 0 plane. The super cells with periodic boundary conditions were treated as a 3D periodic system for the dynamics simulation, and the same calcite 3D layer was used for all the inhibitor molecules [18]. The crystal grew along with rigid sequence and orientation, to prevent any surface displacements during the simulation. The atoms in the calcite crystal were frozen during simulation, and only the additive molecules could vibrate freely [27]. The equilibration and subsequent simulations were conducted in the canonical (NVT) ensemble. The system temperature was maintained at 298 K using the Andersen thermostat with an integration time step of 1.0 fs [28]. The time step was 1 fs, MD simulation ran for 10 ns: 1 ns for equilibration stage and then 9 ns for production stage. The trajectory was recorded every 1 ps. The interaction energy (Einteraction) between the surface and additive molecules could be calculated as follows:
E interaction = E total E surf + water E add + water + E water ,
where Etotal was the total energy of the optimized surface–additive complex in the presence of water, Esurf+water was the energy of the calcite surface and water, Eadd+water was the energy of the additive and water, and Ewater was the total energy of water. The binding energy (Ebinding) reflected the intermolecular interactions between adsorbent and crystal, which was defined as the inverse value of the interaction energy [29]:
E binding = E interaction .
The quantum calculation was performed to get insight into the interaction between Ca2+ and scale inhibitors. The HEDP and PBTCA molecules were optimized by B3LYP–6–31G (d) method with Gaussian 09 software (Gaussian, Inc., Wallingford, CT, USA). The possible structures of Ca–ions and inhibitor molecules were also simulated by quantum calculation.

3. Results and Discussion

3.1. Supersaturation Ratio and the Ca2+ Retention Efficiency
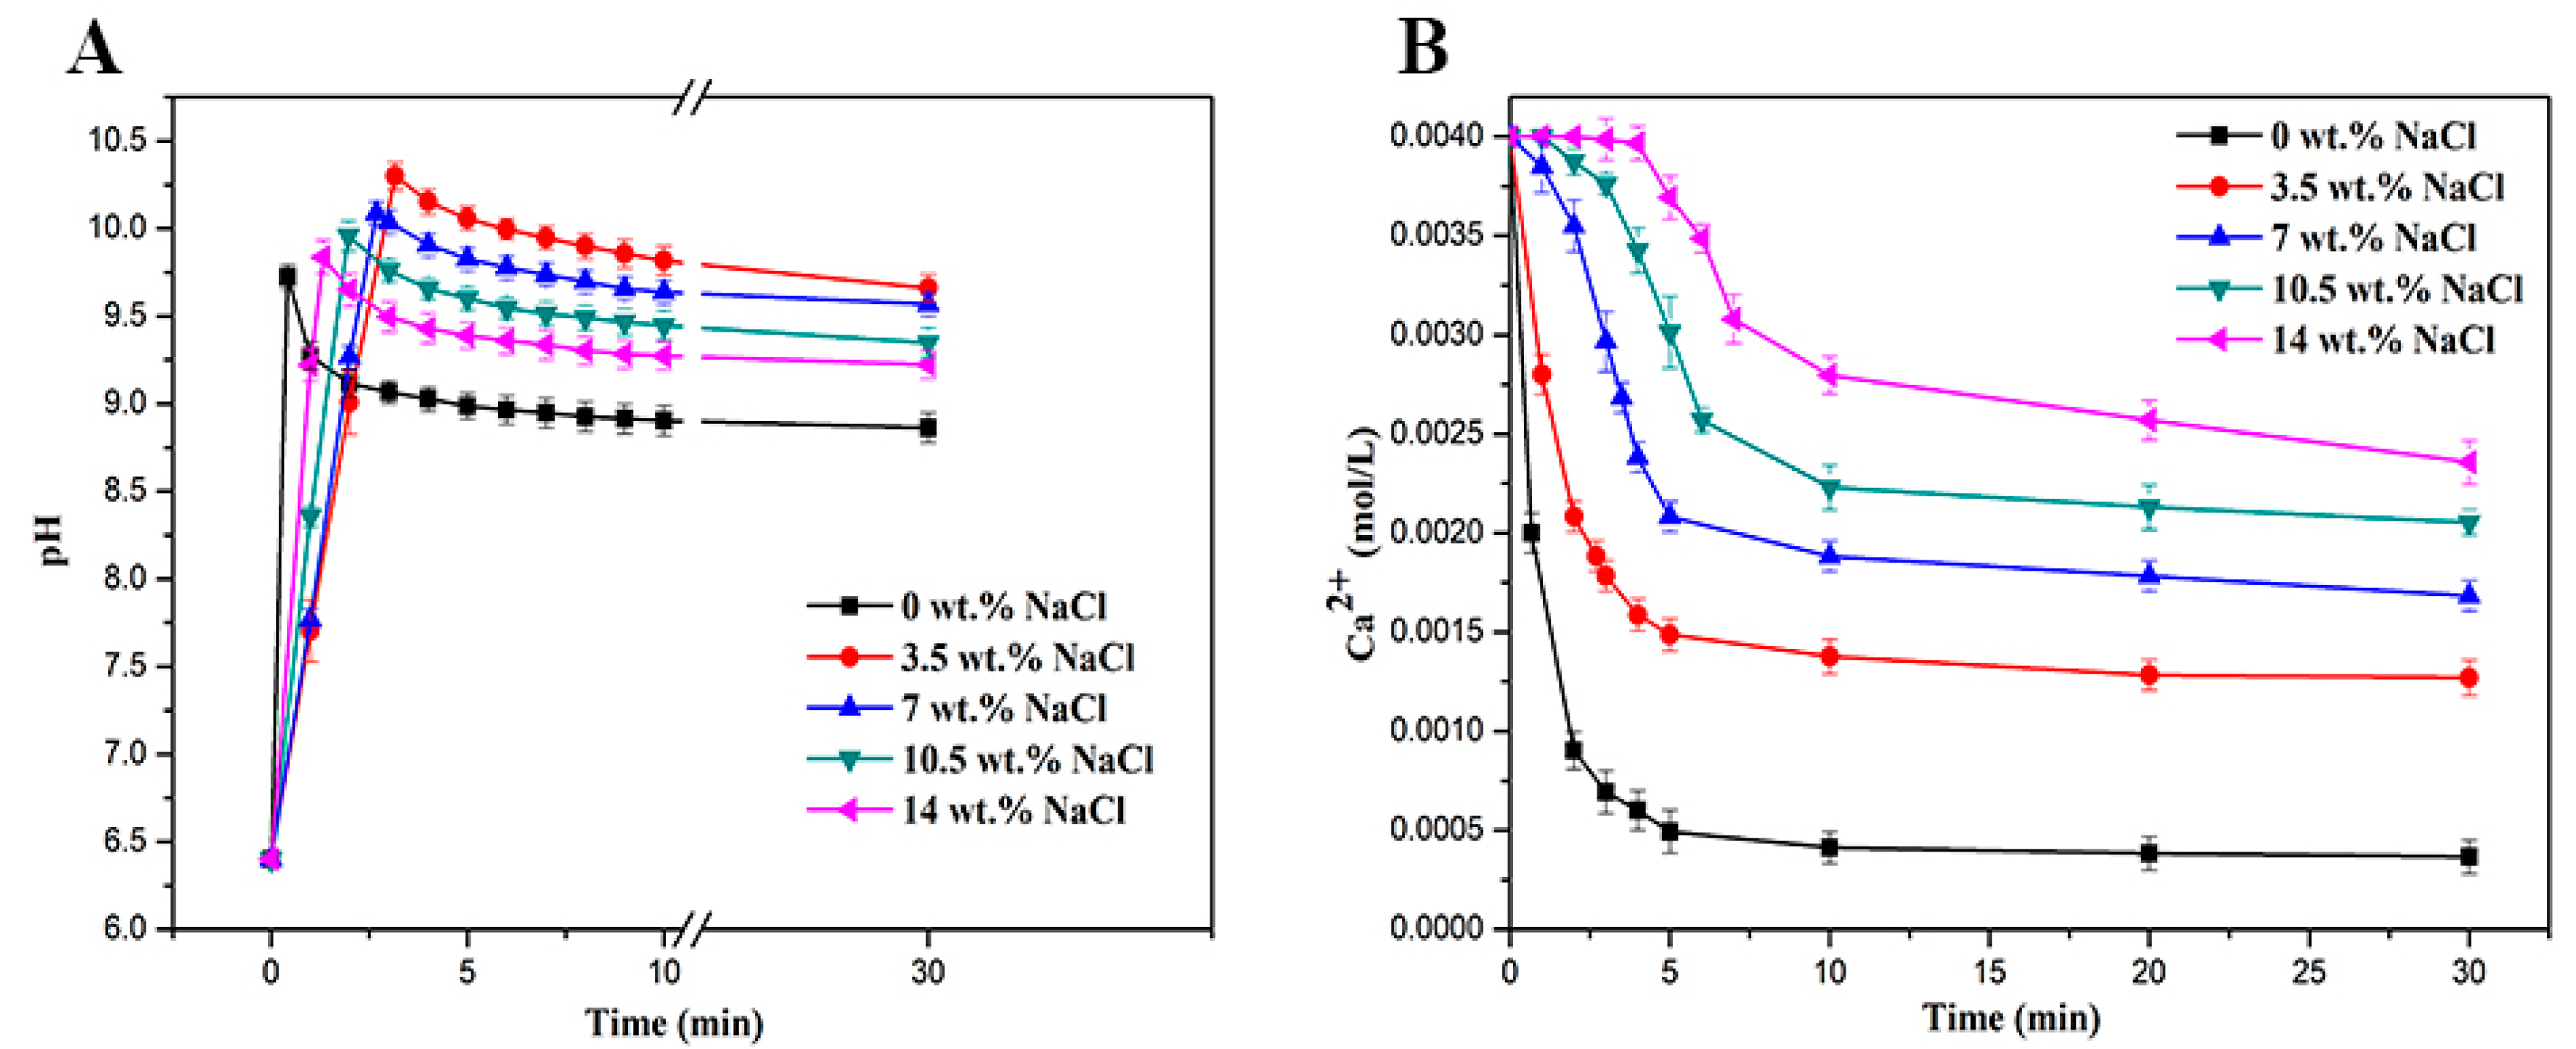
The crystallization process of CaCO3 included nucleation, crystal growth, agglomeration and recrystallization [30]. The crucial driving force for both nucleation and growth was the supersaturation level [31]. The degree of mineral supersaturation could be quantified by the supersaturation ratio (SR), which was the ratio of dissolved CaCO3 ionic activity product (IAP) to the solubility product (Ksp), as shown in Equation (4) [32]:
SR = IAP K sp = γ Ca [ Ca 2 + ] γ CO 3 [ CO 3 2 ] K sp ,
where [Ca2+] and [CO32−] were the concentrations of calcium and carbonate ions, respectively, and γCa and γCO3 were the activity coefficients of [Ca2+] and [CO32−], respectively. The ionic strength of NaCl solution in this study was 0.72–3.75 mol/kg and, thus, γCa and γCO3 could be calculated by the Pitzer model, which was applicable to ionic strength from 0.01 to 6 mol/kg [33].
For SR > 1, there was a thermodynamic potential for precipitation of CaCO3, and the solution was supersaturated with respect to this salt [34]. As shown in Table 1, the values of γCa and γCO3 decreased with the salinity increase, and it showed that the effective concentration and ion interaction of Ca2+ and CO32− in the system decreased correspondingly. SR of CaCO3 was larger than 1 and it decreased dramatically with the salinity increase, which indicated that CaCO3 has less thermodynamic potential to precipitate in high salinity than in pure water. Simultaneously, the effect of concentration of NaCl on CaCO3 crystallization was studied by a static test. The results of η (seen in Table 1) increased with the promotion of the NaCl concentration, which demonstrated that an extremely high concentration of NaCl could hinder the crystallization of CaCO3.

3.2. pH Measurement

As shown in Equation (5), calcium carbonate precipitation reaction was pH–dependent [25]. From the curves of pH versus time, as presented in Figure 1a, it is found that the pH values skyrocketed due to CO32− being hydrolyzed to OH, then a sharp drop existed at the first stage, proving the beginning of the CaCO3 precipitation, and then they became flat as time went on and finally stabilized. The maximal pH value, equivalent to the amount of required supersaturation degree that triggers CaCO3 precipitation, was known as critical pH (pHc), and, when the precipitation reaction reached equilibrium, the pH value was the saturation pH (pHs) [32,33,34,35]:
C a 2 + + H C O 3 + H 2 O C a C O 3 + H 3 O + .
In Figure 1a, it is shown that, without NaCl, pHc achieved the value of 9.71 and decreased sharply. The pHc values increased more and the drops of pH were less abrupt when NaCl was added. It was possible to deduce that, in the presence of NaCl, the system needs to be kept at a higher supersaturated condition to trigger CaCO3 precipitation. The result supported the calculation of SR. From Table 2, the pHs values increased with the addition of NaCl, indicating a less carbonate consumption, which indicated the lesser precipitation of CaCO3. The induction time, the period between the formation of supersaturated condition and nucleation onset, became longer accompanying the supplement of NaCl, as shown in Figure 1b. This delay occurred because the nuclei of CaCO3 were unstable in supersaturated conditions due to the competition between the interfacial energy of the crystal surface and the mutative Gibbs energy on the addition of NaCl in solution [36]. Correspondingly, the decrease of free calcium ions in solutions became slower (seen in Figure 1b) with the NaCl concentration increase, which meant that the binding of Ca2+ to CO32− was hindered.

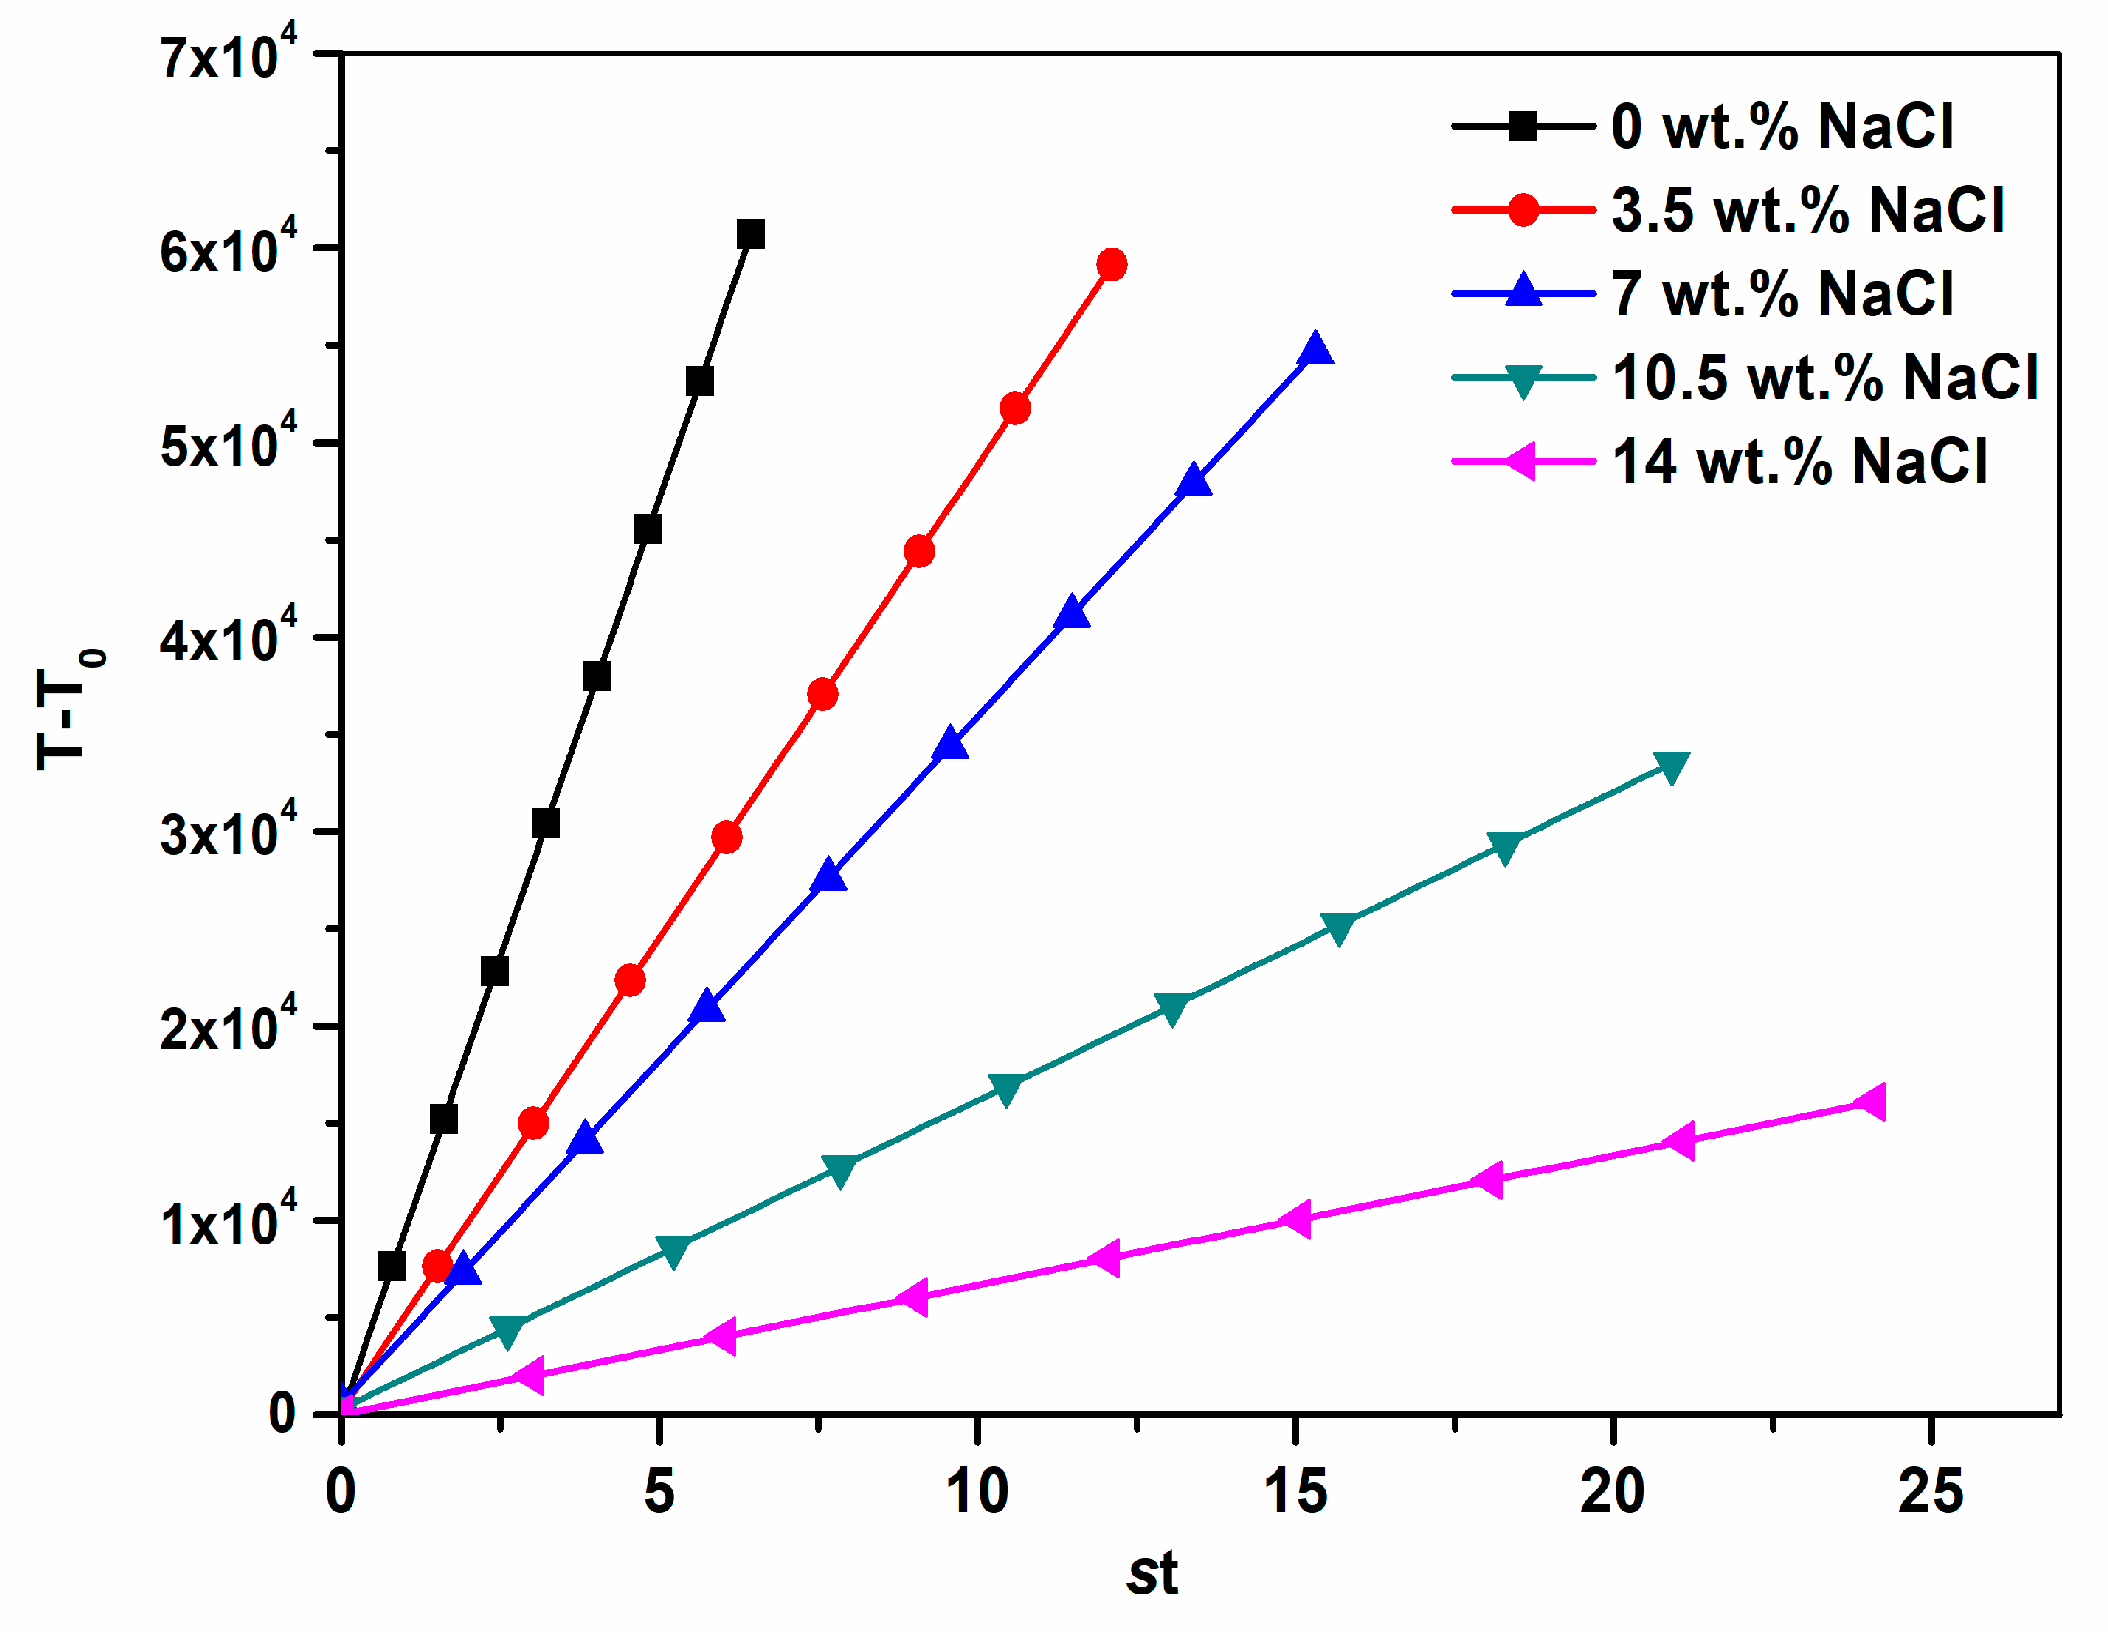
3.3. Reaction Kinetics of CaCO3 Crystal

The kinetic rates and order of reaction for CaCO3 precipitation at various salinities were analyzed using the following kinetics equations [37,38,39]:
( C t C eq ) 1 ( C 0 C eq ) 1 = k s t .
In this equation, ct (mol/L) was the concentration of Ca2+ in solution at time t, ceq (mol/L) was the concentration of Ca2+ at equilibrium, c0 (mol/L) was the initial concentration of Ca2+, k was the rate constant, and s (m2/g) was the surface area of crystal measured by BET tests (seen in Table 2).
Set (ctceq)−1 = T, (c0ceq)−1 = T0, Equation (7) was obtained as follows:
T T 0 = k s t .
The linear plots of T − T0 vs. st are shown in Figure 2. Commonly, the slopes of these curves reflected the crystal growth rates. The fastest crystallization rate constant of CaCO3 was achieved when NaCl was absent in the solution. The k value decreased continuously when NaCl concentration increased from 3.5 to 14 wt. %, which also demonstrated that CaCO3 crystallization became more difficult to occur.

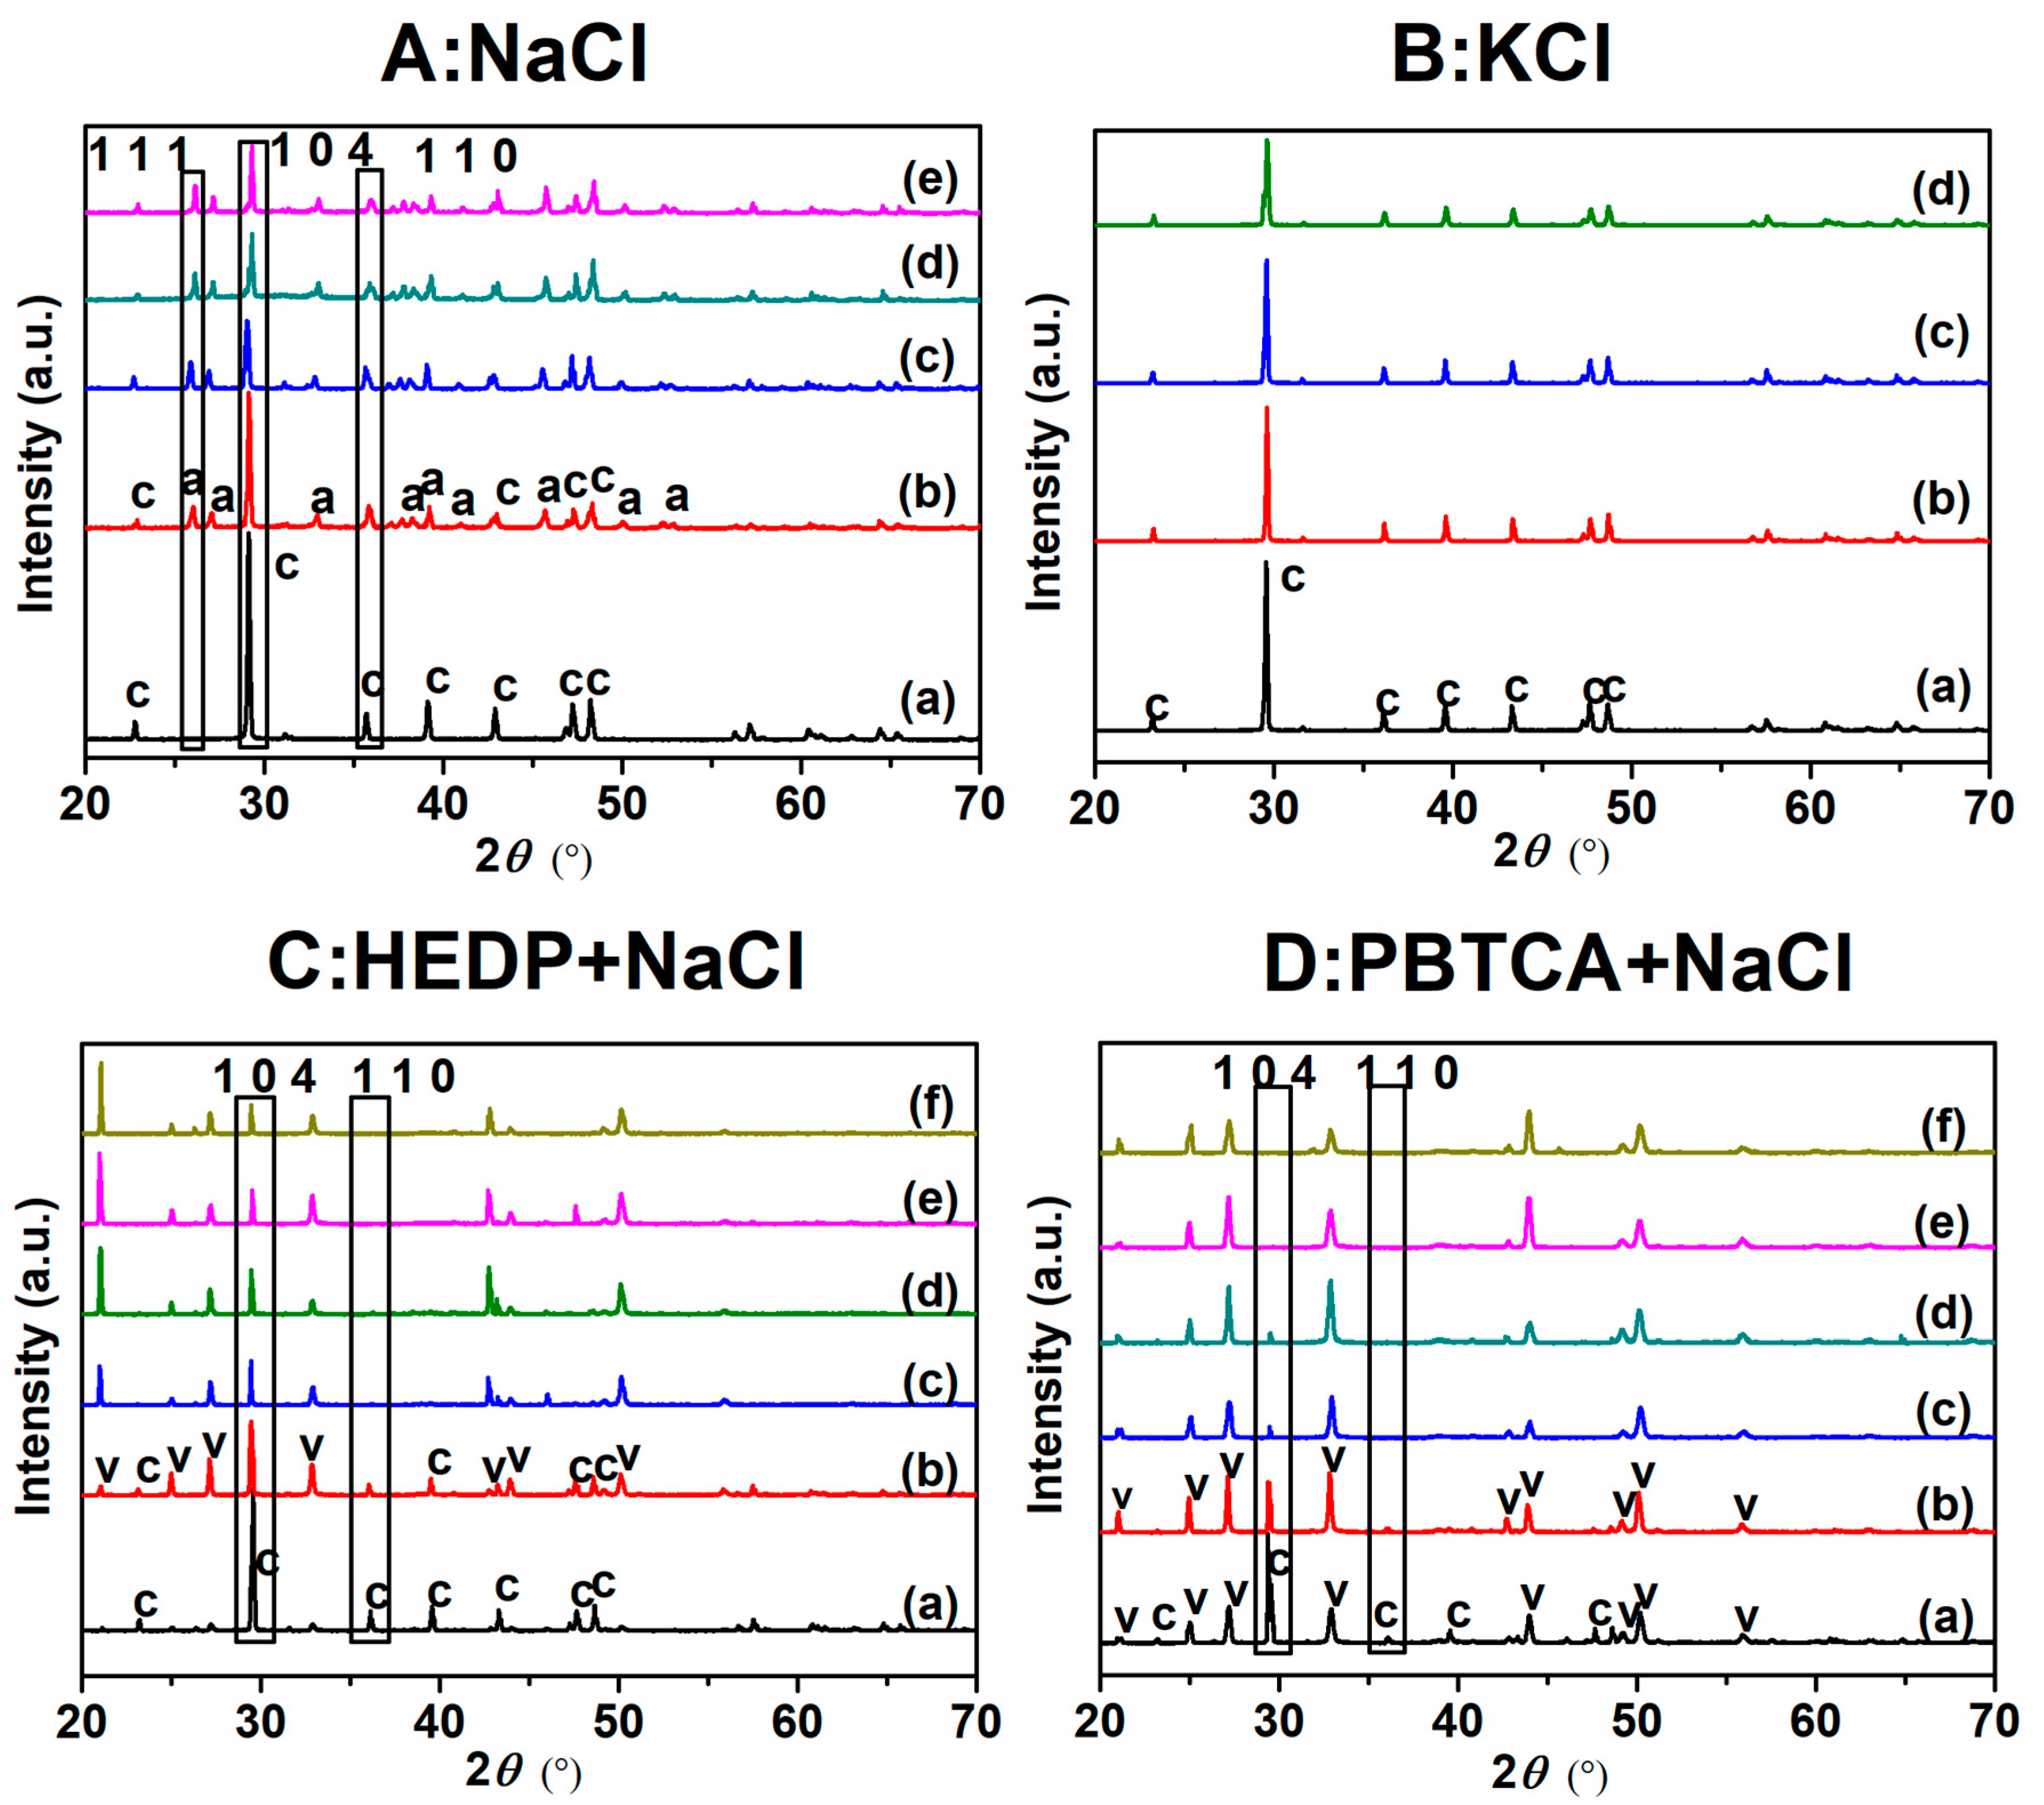
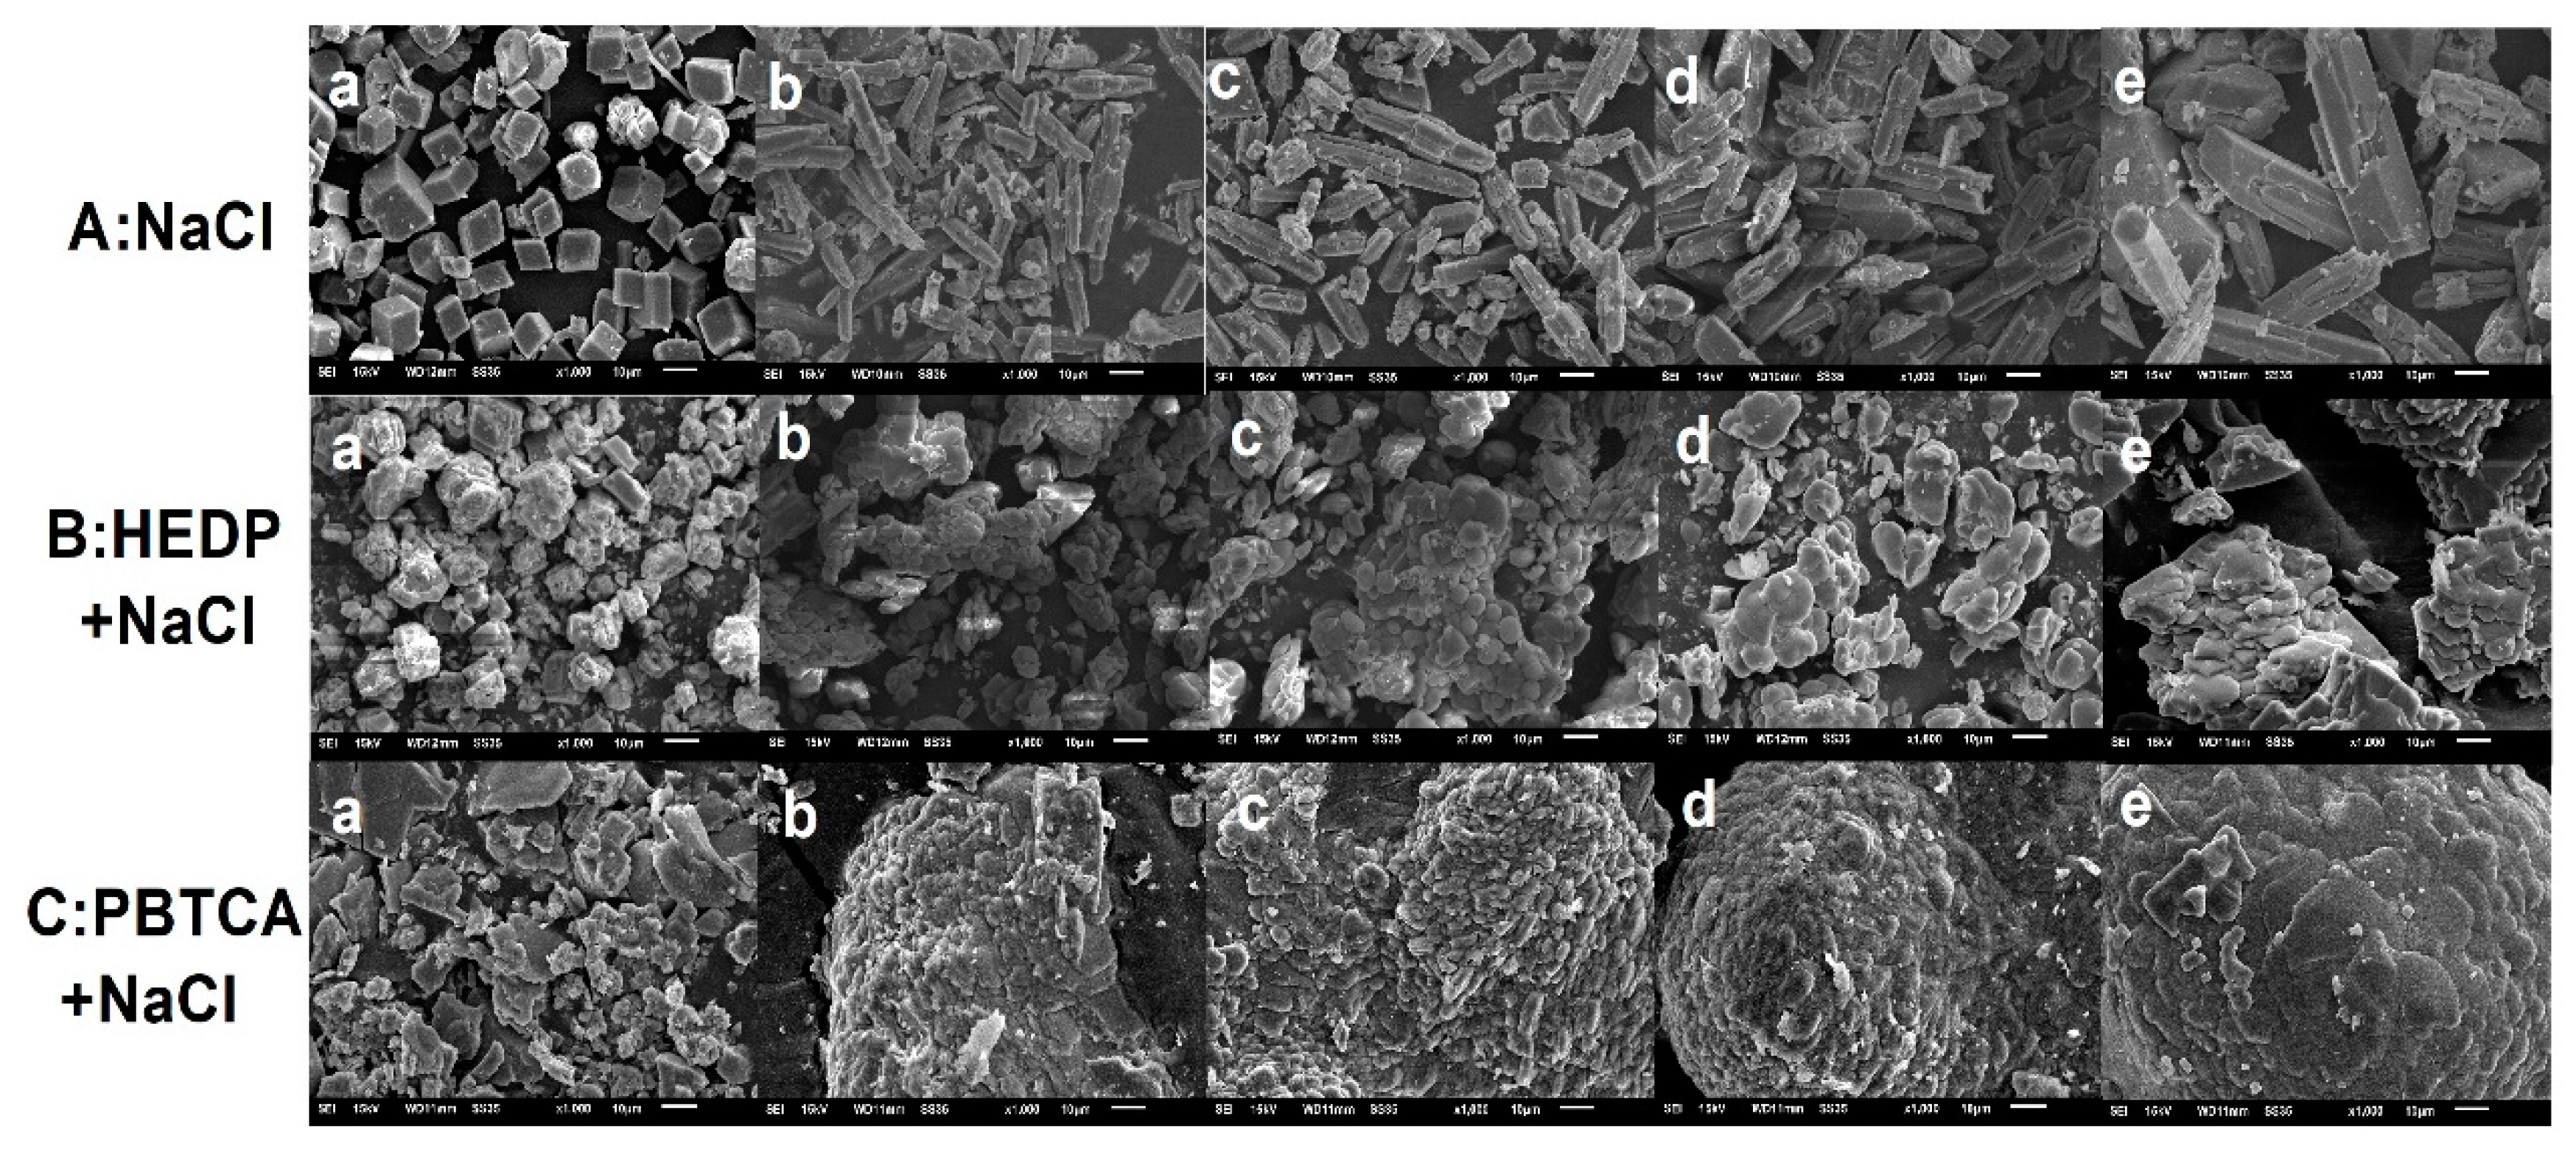
3.4. XRD and SEM Characterization for CaCO3 Crystals
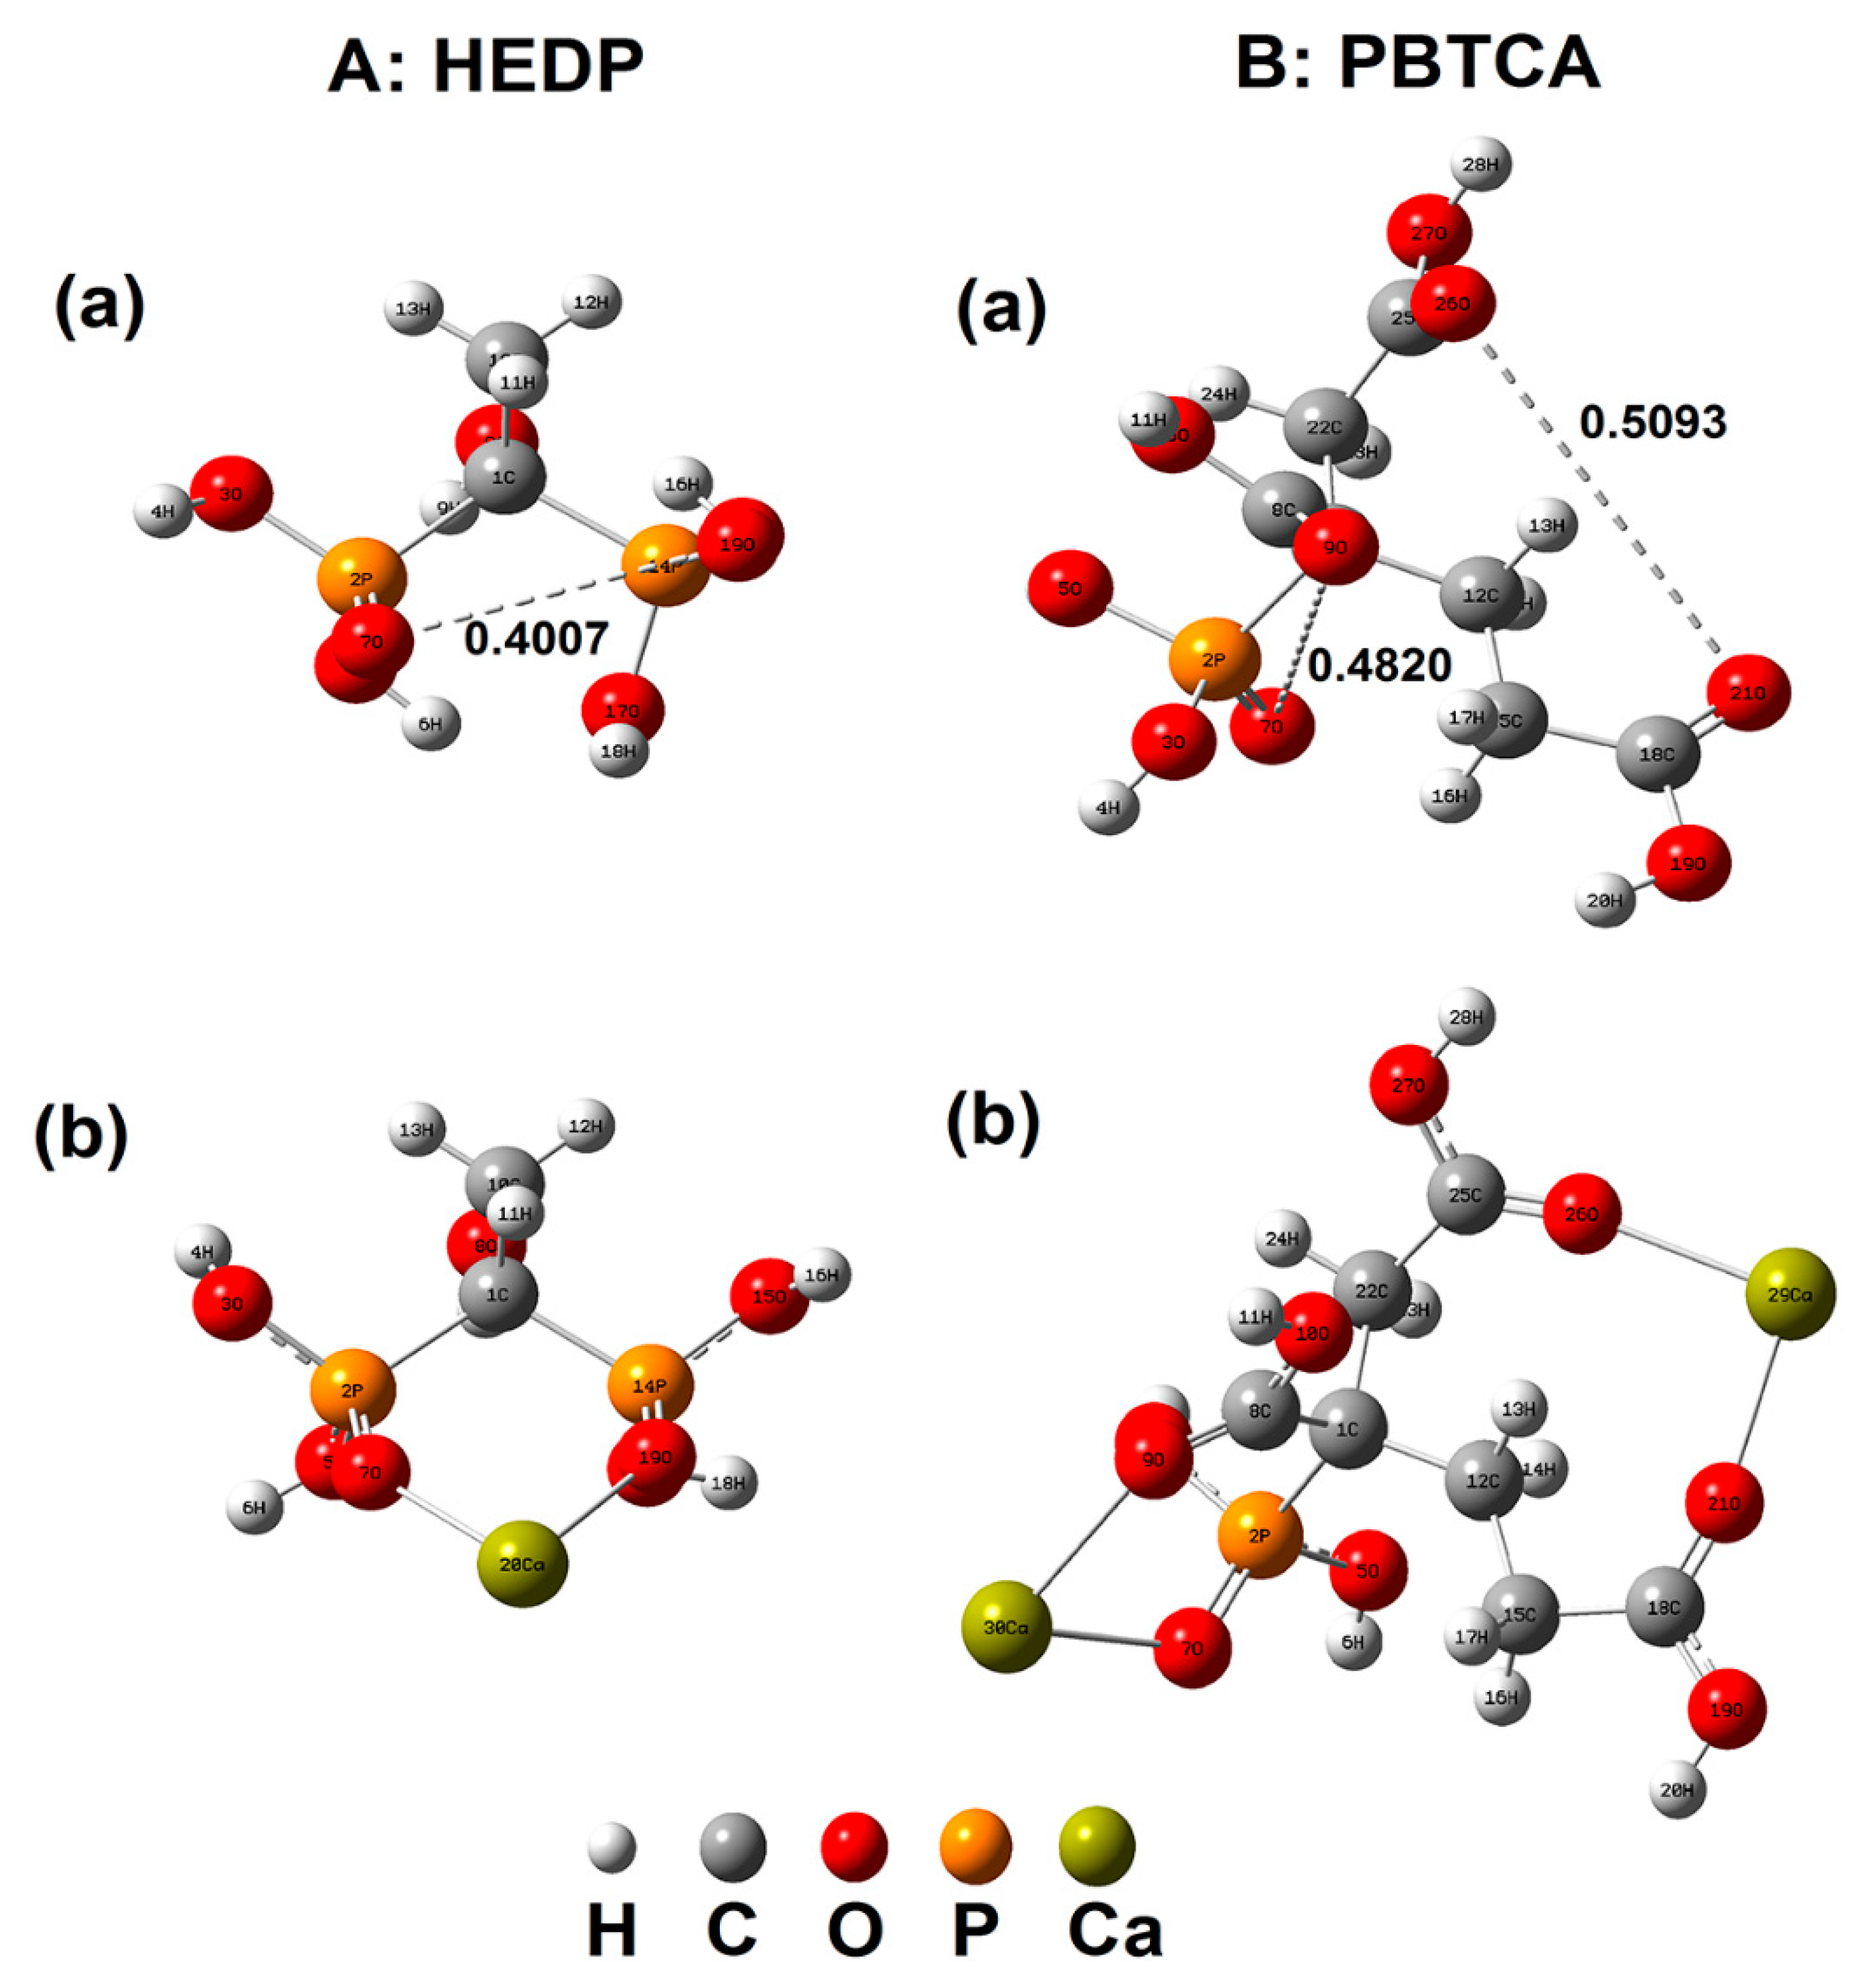
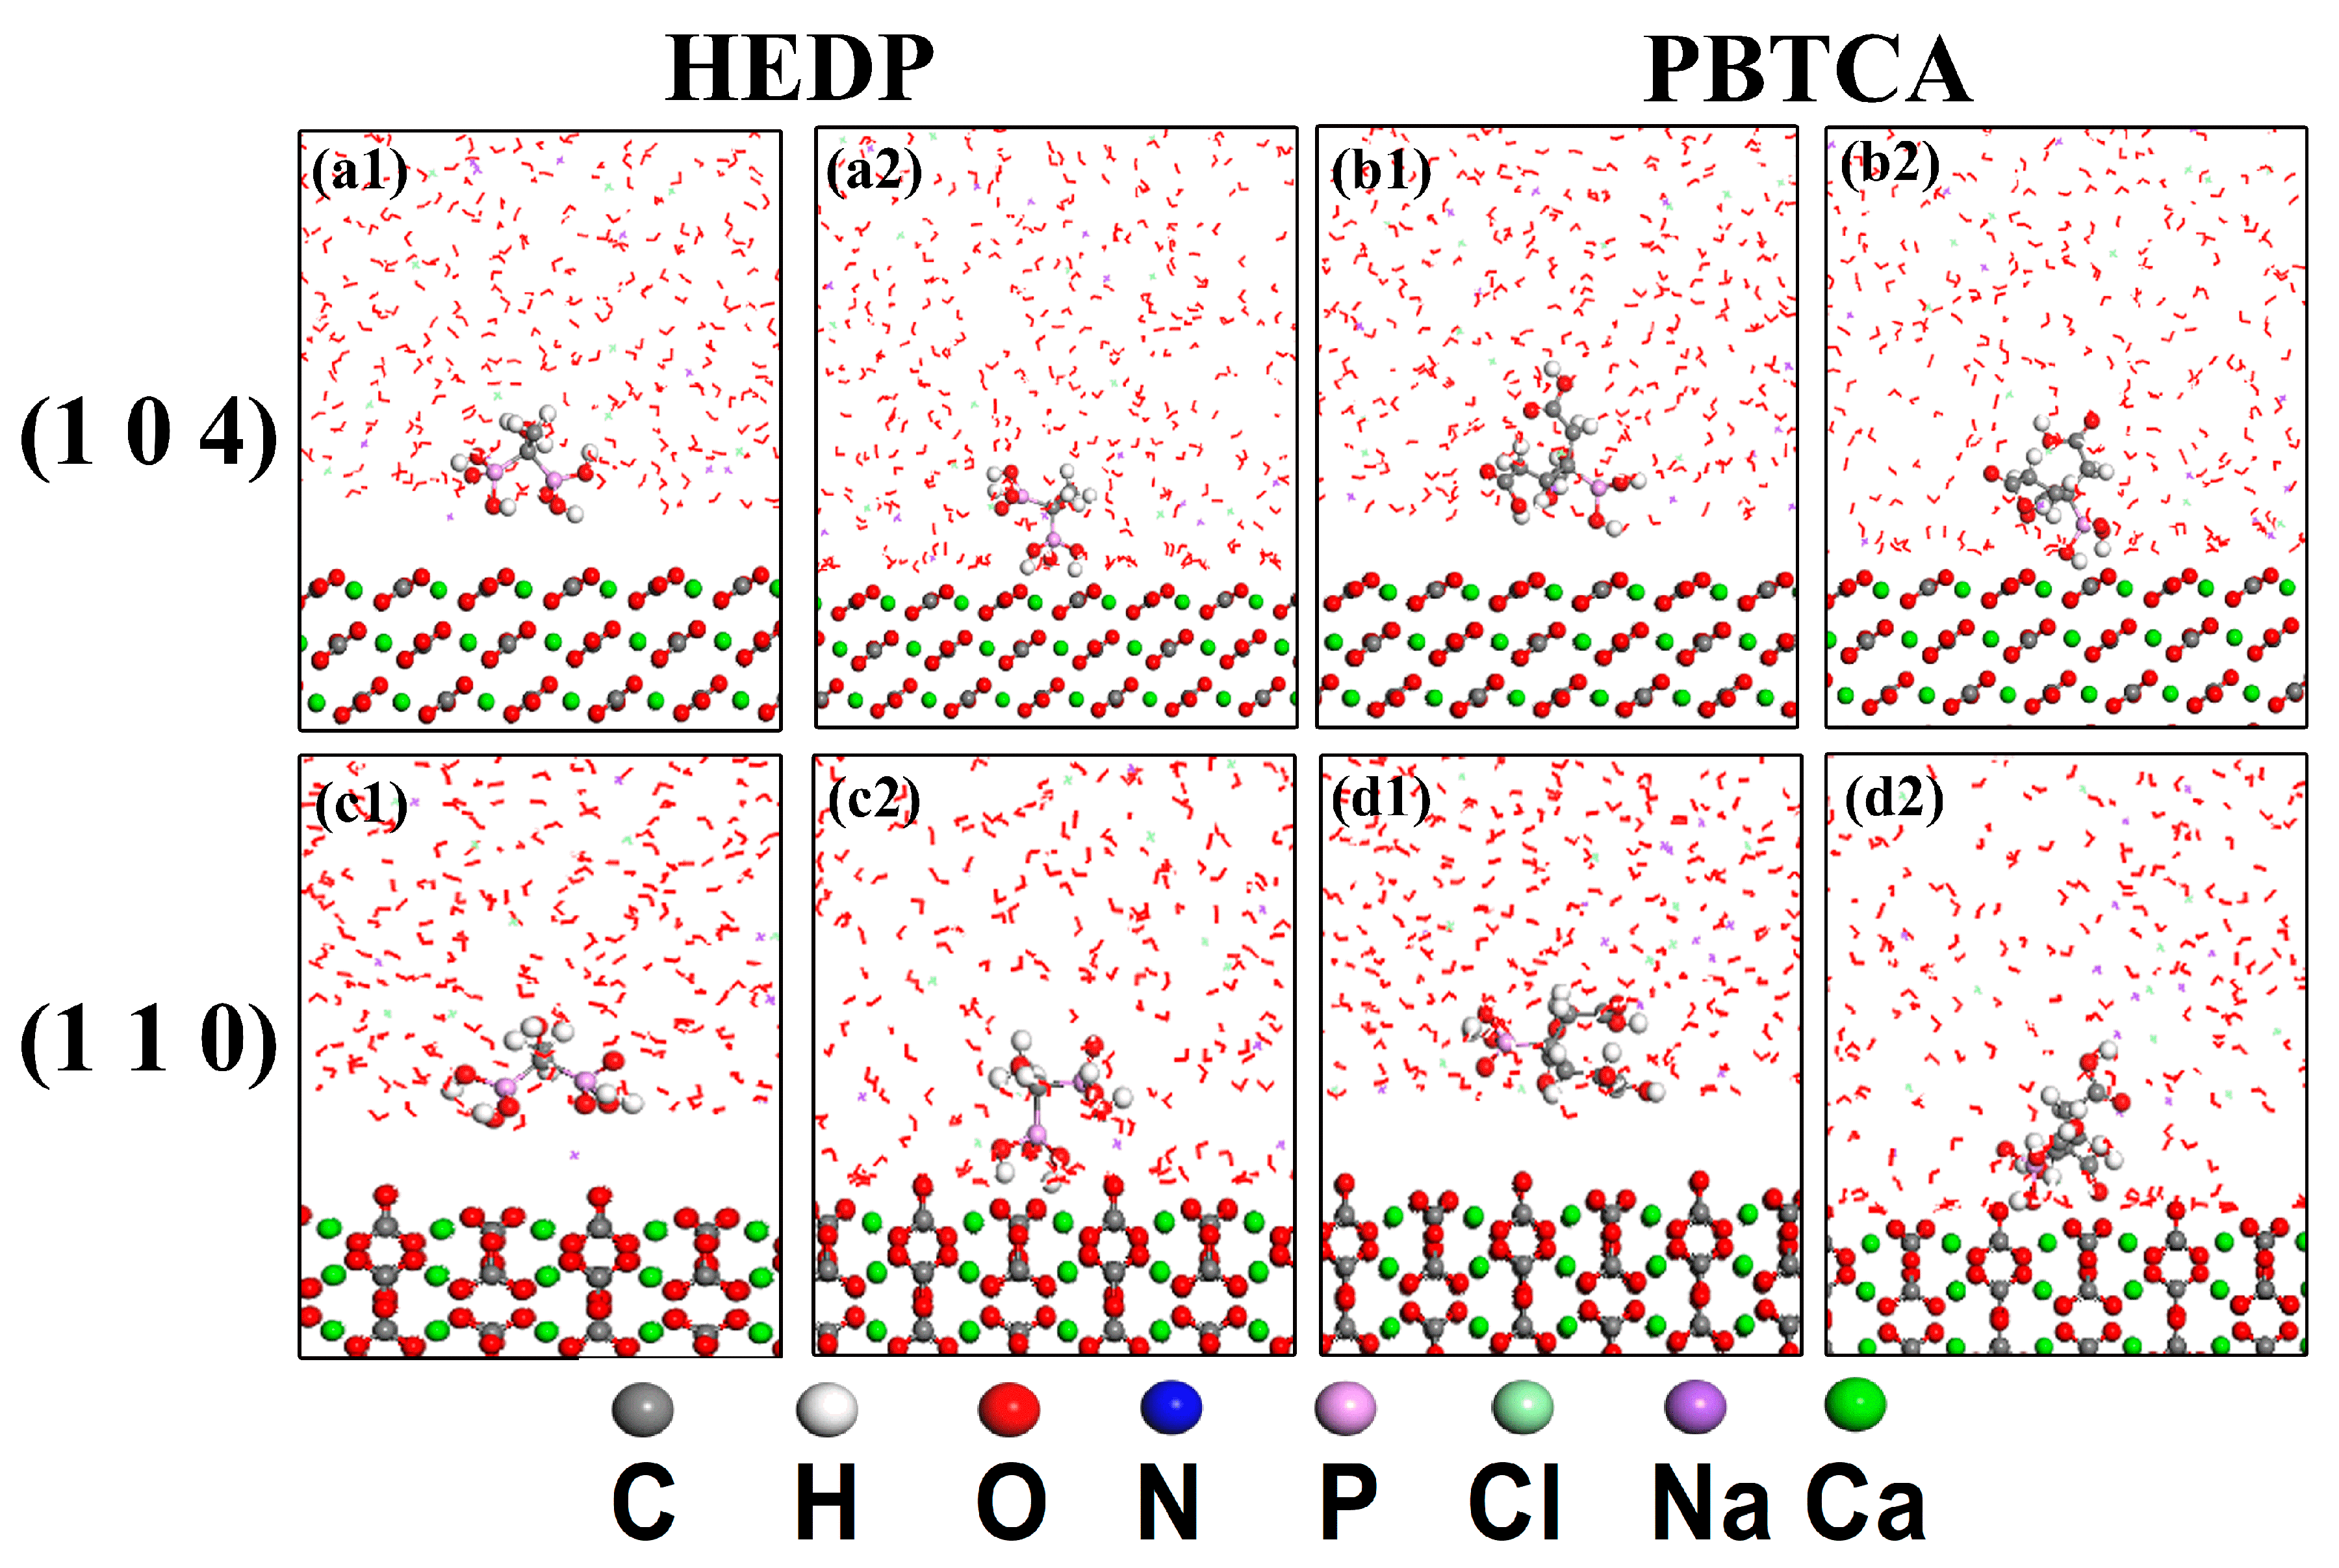
The effect of NaCl on the crystallization of CaCO3 was studied by a XRD test. The XRD patterns of CaCO3 crystals formed in the solution with different concentrations of NaCl are given in Figure 3A. Curve a in Figure 3A showed that the diffraction peaks at 23.0°, 29.4°, 36.1°, 39.4°, 43.1°, 47.5°, and 48.4° were ascribed to 0 1 2, 1 0 4, 1 1 0, 1 1 3, 2 0 2, 0 2 4 and 1 1 6 characteristic planes of calcite, respectively [40]. In the presence of NaCl (from 3.5 wt.% to 14 wt.%), the new diffraction peaks at 26.2°, 27.2°, 33.1°, 36.2°, 37.8°, 38.4°, 42.8°, 45.9°, 50.2°, and 52.5° appeared clearly, which corresponded to 1 1 1, 0 2 1, 0 1 2, 2 0 0, 1 1 2, 1 3 0, 1 2 2, 2 2 1, 1 3 2 and 1 1 3 planes of aragonite, respectively. The 1 0 4 and 1 1 0 planes of calcite declined obviously. In addition, the polymorphic fraction of aragonite in CaCO3 could be evaluated using the following equation in the absence of vaterite [41]:
X A = 3.9 I A I C + 3.9 I A
X C = 1 X A
where XA and XC were the calculated fractions of aragonite and calcite, respectively. IA and IC were the integrated intensities of aragonite 1 1 1 and calcite 1 0 4, respectively.
It could be seen in Table 3 that the calcite fraction decreased distinctly and the aragonite fraction increased significantly on increasing the NaCl concentration. It was well known that calcite is the most stable form, while aragonite is unstable modification of CaCO3 [42,43]. Thus, NaCl could induce lattice distortion of CaCO3, which postponed the scaling of CaCO3 in the solution. For comparison, the XRD test was also performed with the same addition of KCl (3.5–14 wt.%). As shown in Figure 3B, the formed CaCO3 scales exhibited the same crystal configuration after adding various amounts of KCl. These results demonstrated that Na+ could cause aragonite formation indeed.
The XRD results (Figure 3C,D) displayed that, when 8 μM HEDP or 4 μM PBTCA are added to the system, the characteristic peak of vaterite appeared, but 1 0 4 and 1 1 0 peaks of calcite changed indistinctively. When 4 μM HEDP or PBTCA with NaCl are added to the solution, the intensity of 1 0 4 peak decreased significantly and 1 1 0 peak disappeared. In addition, the 1 1 0 peak of calcite was hardly changed in only NaCl solution or only inhibitor solution, but this peak disappeared for complex solutions. Therefore, it could be verified that NaCl accelerated the lattice distortion of CaCO3 in combination with HEDP or PBTCA.
In order to reveal the effect of NaCl on the crystal morphology and growth orientation, SEM observations were carried out, as shown in Figure 4. It was found that, in the absence of NaCl, the morphology of CaCO3 was regular rhombohedrons and glossy calcite particles, while, in NaCl solution (3.5 wt.%–14 wt.%), the CaCO3 particles grew in one direction and formed the rod–shaped grains, which could be identified as aragonite phase [44]. With the addition of NaCl, the crystal size became larger because NaCl decreased the supersaturation with respect to CaCO3 [36]. The ICP–OES measurements were used to further investigate the elemental composition of CaCO3. The Na+ concentrations (mg/L) in the crystallization products prepared in NaCl (3.5 wt. %–14 wt. %) were 1.01, 1.19, 2.33, 3.10, respectively. It was revealed that Na+ could be doped into the crystal lattice due to the similar ionic radius of Ca2+ (1.00 Å) and Na+ (1.02 Å) [45], and, therefore, Na+ could substitute Ca2+ site in the lattice and induce the crystal growth of CaCO3. Moreover, it may induce the transition of the most stable calcite to aragonite [46,47,48,49]. The SEM results also showed that, when HEDP or PBTCA are added in the NaCl solution (Figure 4B,C), the crystals were gathered by many smooth ellipsoidal particles, and, with the NaCl concentration increase, they eventually form spheres. Overall, it could be concluded that inhibitors accelerate the crystal transformation of CaCO3 from calcite to vaterite with the stimulation role of NaCl.

3.5. MD Simulation

The MD simulations were performed to model the interaction between scaling inhibitors and CaCO3 at a micro level. The calcite (1 0 4) and (1 1 0) faces were chosen for the simulation study since HEDP and PBTCA mainly hindered the growth of the (1 0 4) and (1 1 0) faces detected by XRD tests. The initial configurations of inhibitor molecules in NaCl solution on the calcite surface and the MD simulation results are shown in Figure 5. After the end of the program work, the inhibitor molecules moved to right above the calcite surface by overcoming the steric effect and their configurations were changed by a chelating effect. The Ebinding values of HEDP or PBTCA with NaCl (seen in Table 4) were greater than those in water solution, which indicated that both HEDP and PBTCA were more thermodynamically favorable to adsorb on calcite surfaces in high salinity brines.

3.6. The Effect of Inhibitors in NaCl Solutions with Different Concentrations for the Crystallization of CaCO3

The HEDP and PBTCA molecules were optimized by B3LYP–6–31G (d) method and the optimal configurations are shown in Figure 6. It was directly seen that the distance between O (label 7) and O (label 19) of HEDP was 0.4007 nm, which is close to the distance (0.4048 nm) of neatest calcium ions on the calcite surfaces (1 1 0) and (1 0 4) [24]. The length from O (label 21) to O (label 26) and O (label 7) to O (label 9) of PBTCA were 0.5093 nm and 0.4820 nm, respectively, which were close to the distance (0.4990 nm) of nearest calcium ions on the surface of calcite (1 0 4) [24], indicating that the O atoms in HEDP or PBTCA could adsorb on Ca2+ and match the lattice of calcite [50]. The quantum calculation method was also used to investigate the possible structure of Ca2+ and inhibitor molecules. The results, as shown in Figure 6, indicated that a HEDP molecule could chelate with one Ca2+ ion by two phosphonate groups, while PBTCA chelated with two Ca2+ ions by forming chemical bonds with one phosphonate group and two carboxylic acid groups. Moreover, Zhang et al. obtained the binding energies of 19.46 and 18.75 kcal/mol for Ca2+ with phosphonic acid group and carboxylic acid group [51], respectively, from the theoretical DFT calculations, which implied the chelation of between HEDP, PBTCA, and Ca2+. It could be concluded that HEDP and PBTCA showed the inhibition effect on the deposition of CaCO3, which was related to their chelate ability with Ca2+ and the capability of inducing the CaCO3 lattice transformation from calcite to vaterite (Figure 3C,D) [52,53,54,55].
The inhibition effect of two inhibitors on CaCO3 scale at different concentrations of NaCl (3.5 wt. %–14 wt. %) by static test is given in Table 1. The inhibition efficiencies of HEDP and PBTCA in all NaCl solutions were about twice that of the corresponding η in water. Under the optimal conditions, η of HEDP or PBTCA could reach to 83.50% and 92.16% when the concentration of NaCl was 14 wt. %. It was proved that NaCl heightens the efficiency of PBTCA and HEDP on prohibiting the scale of CaCO3.

4. Conclusions

In summary, the delay effect of NaCl solution with extremely high concentration on the crystallization of CaCO3 was investigated. The SR and k calculations showed that a high concentration of NaCl reduced the thermodynamic and kinetic potential of CaCO3 crystallization. The XRD test revealed that a high concentration of NaCl impeded the growth of (1 0 4) and (1 1 0) faces of calcite while inducing the formation of the (1 1 1) face of aragonite. The ICP–OES test verified that Na+ could be doped into CaCO3, resulting in the growth of crystals towards one–dimensional and forming the elongated pseudo-hexagonal crystals. It was further testified that NaCl increased the efficiency of the phosphate inhibitors on prohibiting the scale of CaCO3. Both HEDP and PBTCA could chelate with Ca2+ and induced the lattice distortion of CaCO3. At the same time, NaCl enhanced the binding energy of HEDP or PBTCA absorbed on CaCO3 and accelerated the lattice distortion.

Author Contributions

Conceptualization, W.Y.; Data curation, M.Q.; Formal analysis, M.Q.; Funding acquisition, W.Y.; Investigation, M.Q.; Methodology, M.Q.; Project administration, X.Y., Y.C., Y.L. and Z.C.; Supervision, W.Y.; Visualization, Z.C.; Writing—original draft, M.Q.; Writing—review and editing, M.Q. and Y.Z.

Funding

This research was funded by the National Key R&D Program of China (Grant No. 2017YFC0404100), the National Science & Technology Pillar Program during the Twelfth Five–Year Plan Period for Seawater Desalination Technology (2015BAB08B00), the National Natural Science Foundation of China (Grant No. 21605084), the Natural Science Foundation for Young Scholars of Jiangsu Province, China (Grant No. BK20160983) and support by the Research Start–up Funds for Talent Scholars of Nanjing Tech University (No. 39837104).

Acknowledgments

The authors wish to thank Wenzhong Yang and Haoyun Lu for their kind help. Nanjing Tech University is sincerely acknowledged for providing experimental instruments.

Conflicts of Interest

The authors declare no conflict of interest.

References

  1. Li, X.; Hasson, D.; Semiat, R.; Shemer, H. Intermediate concentrate demineralization techniques for enhanced brackish water reverse osmosis water recovery—A review. Desalination 2019, 466, 24–35. [Google Scholar] [CrossRef]
  2. Matin, A.; Rahman, F.; Shafi, H.Z.; Zubair, S.M. Scaling of reverse osmosis membranes used in water desalination: Phenomena, impact, and control; future directions. Desalination 2019, 455, 135–157. [Google Scholar] [CrossRef]
  3. Oomori, T.; Kaneshima, K.; Kitano, Y. Solubilities of calcite, aragonite and protodolomite in supratidal brines of Minamidaito-Jima Island, Okinawa, Japan. Mar. Chem. 1988, 25, 57–74. [Google Scholar] [CrossRef]
  4. Oshchepkov, M.; Kamagurov, S.; Tkachenko, S.; Ryabova, A.; Popov, K. Insight into the Mechanisms of Scale Inhibition: A Case Study of a Task-Specific Fluorescent-Tagged Scale Inhibitor Location on Gypsum Crystals. ChemNanoMat 2019, 5, 586–592. [Google Scholar] [CrossRef]
  5. Ruiz-Garcia, A.; Melian-Martel, N.; Mena, V. Fouling characterization of RO membranes after 11 years of operation in a brackish water desalination plant. Desalination 2018, 430, 180–185. [Google Scholar] [CrossRef]
  6. Tzotzi, C.; Pahiadaki, T.; Yiantsios, S.G.; Karabelas, A.J.; Andritsos, N. A study of CaCO3 scale formation and inhibition in RO and NF membrane processes. J. Membr. Sci. 2007, 296, 171–184. [Google Scholar] [CrossRef]
  7. Sim, L.N.; Chong, T.H.; Taheri, A.H.; Sim, S.T.V.; Lai, L.; Krantz, W.B.; Fane, A.G. A review of fouling indices and monitoring techniques for reverse osmosis. Desalination 2018, 434, 169–188. [Google Scholar] [CrossRef]
  8. Meng, S.; Ye, Y.; Mansouri, J.; Chen, V. Crystallization behavior of salts during membrane distillation with hydrophobic and superhydrophobic capillary membranes. J. Membr. Sci. 2015, 473, 165–176. [Google Scholar] [CrossRef]
  9. Miyoshi, T.; Hayashi, M.; Shimamura, K.; Matsuyama, H. Important fractions of organic matter causing fouling of seawater reverse osmosis (SWRO) membranes. Desalination 2016, 390, 72–80. [Google Scholar] [CrossRef]
  10. Rahman, F. Calcium sulfate precipitation studies with scale inhibitors for reverse osmosis desalination. Desalination 2013, 319, 79–84. [Google Scholar] [CrossRef]
  11. Antony, A.; Low, J.H.; Gray, S.; Childress, A.E.; Le-Clech, P.; Leslie, G. Scale formation and control in high pressure membrane water treatment systems: A review. J. Membr. Sci. 2011, 383, 1–16. [Google Scholar] [CrossRef]
  12. Bagastyo, A.Y.; Keller, J.; Poussade, Y.; Batstone, D.J. Characterisation and removal of recalcitrants in reverse osmosis concentrates from water reclamation plants. Water Res. 2011, 45, 2415–2427. [Google Scholar] [CrossRef] [PubMed]
  13. Chen, G.; Lu, Y.; Krantz, W.B.; Wang, R.; Fane, A.G. Optimization of operating conditions for a continuous membrane distillation crystallization process with zero salty water discharge. J. Membr. Sci. 2014, 450, 1–11. [Google Scholar] [CrossRef]
  14. Gal, J.-Y.; Fovet, Y.; Gache, N. Mechanisms of scale formation and carbon dioxide partial pressure influence. Part I. Elaboration of an experimental method and a scaling model. Water Res. 2002, 36, 755–763. [Google Scholar] [CrossRef]
  15. Ji, Z.; Wang, J.; Yin, Z.; Hou, D.; Luan, Z. Effect of microwave irradiation on typical inorganic salts crystallization in membrane distillation process. J. Membr. Sci. 2014, 455, 24–30. [Google Scholar] [CrossRef]
  16. Giwa, A.; Dufour, V.; al Marzooqi, F.; al Kaabi, M.; Hasan, S.W. Brine management methods: Recent innovations and current status. Desalination 2017, 407, 1–23. [Google Scholar] [CrossRef]
  17. Naidu, G.; Shim, W.G.; Jeong, S.; Choi, Y.; Ghaffour, N.; Vigneswaran, S. Transport phenomena and fouling in vacuum enhanced direct contact membrane distillation: Experimental and modelling. Sep. Purif. Technol. 2017, 172, 285–295. [Google Scholar] [CrossRef]
  18. Miao, Y.; Liao, R.; Zhang, X.X.; Liu, B.; Li, Y.; Wu, B.; Li, A. Metagenomic insights into salinity effect on diversity and abundance of denitrifying bacteria and genes in an expanded granular sludge bed reactor treating high-nitrate wastewater. Chem. Eng. J. 2015, 277, 116–123. [Google Scholar] [CrossRef]
  19. Peyvandi, K.; Haghtalab, A.; Omidkhah, M.R. Using an electrochemical technique to study the effective variables on morphology and deposition of CaCO3 and BaSO4 at the metal surface. J. Cryst. Growth 2012, 354, 109–118. [Google Scholar] [CrossRef]
  20. Choi, Y.; Naidu, G.; Jeong, S.; Lee, S.; Vigneswaran, S. Effect of chemical and physical factors on the crystallization of calcium sulfate in seawater reverse osmosis brine. Desalination 2018, 426, 78–87. [Google Scholar] [CrossRef] [Green Version]
  21. Sheikholeslami, R.; Lau, G.T. Effect of bacteria and salinity on calcium sulfate precipitation. Desalination 2012, 287, 301–309. [Google Scholar] [CrossRef]
  22. Jan, V. IUPAC-NIST Solubility Data Series. 95. Alkaline Earth Carbonates in Aqueous Systems. Part 2. Ca. J. Phys. Chem. Ref. Data 2012, 41, 023105–023137. [Google Scholar]
  23. Yang, L.; Yang, W.; Xu, B.; Yin, X.; Chen, Y.; Liu, Y.; Ji, Y.; Huan, Y. Synthesis and scale inhibition performance of a novel environmental friendly and hydrophilic terpolymer inhibitor. Desalination 2017, 416, 166–174. [Google Scholar] [CrossRef]
  24. Ji, Y.; Chen, Y.; Le, J.; Qian, M.; Huan, Y.; Yang, W.; Yin, X.; Liu, Y.; Wang, X.; Chen, Y. Highly effective scale inhibition performance of amino trimethylenephosphonic acid on calcium carbonate. Desalination 2017, 422, 165–173. [Google Scholar] [CrossRef]
  25. Sousa, M.F.B.; Signorelli, F.; Bertran, C.A. Fast evaluation of inhibitors for calcium carbonate scale based on pH continuous measurements in jar test at high salinity condition. J. Pet. Sci. Eng. 2016, 147, 468–473. [Google Scholar] [CrossRef]
  26. Shen, C.; Xu, X.; Hou, X.Y.; Wu, D.X.; Yin, J.H. Molecular weight effect on PAA antiscale performance in LT-MED desalination system: Static experiment and MD simulation. Desalination 2018, 445, 1–5. [Google Scholar] [CrossRef]
  27. Alghamdi, A.O.; Alotaibi, M.B.; Yousef, A.A. Atomistic simulation of calcite interaction with ionic species and oil components in water-flooding. Colloids Surf. A: Physicochem. Eng. Asp. 2017, 529, 760–764. [Google Scholar] [CrossRef]
  28. Gao, W.; She, F.; Zhang, J.; Dumée, L.F.; He, L.; Hodgson, P.D.; Kong, L. Understanding water and ion transport behaviour and permeability through poly(amide) thin film composite membrane. J. Membr. Sci. 2015, 487, 32–39. [Google Scholar] [CrossRef]
  29. Shi, W.; Xia, M.; Lei, W.; Wang, F. Molecular dynamics study of polyether polyamino methylene phosphonates as an inhibitor of anhydrite crystal. Desalination 2013, 322, 137–143. [Google Scholar] [CrossRef]
  30. Kezia, K.; Lee, J.; Zisu, B.; Weeks, M.; Chen, G.; Gras, S.; Kentish, S. Crystallisation of minerals from concentrated saline dairy effluent. Water Res. 2016, 101, 300–308. [Google Scholar] [CrossRef]
  31. Coto, B.; Martos, C.; Peña, J.L.; Rodríguez, R.; Pastor, G. Effects in the solubility of CaCO3: Experimental study and model description. Fluid Phase Equilib. 2012, 324, 1–7. [Google Scholar] [CrossRef]
  32. Gal, J.Y.; Bollinger, J.C.; Tolosa, H.; Gache, N. Calcium carbonate solubility: a reappraisal of scale formation and inhibition. Talanta 1996, 43, 1497–1509. [Google Scholar] [CrossRef]
  33. Qian, H.; Wu, F.; Zhang, F.; Zhou, Z.; Zhang, Z. An accurate calculation model for Na+ concentration in seawater desalination solution. Desalination 2013, 313, 12–17. [Google Scholar] [CrossRef]
  34. Jaho, S.; Athanasakou, G.D.; Sygouni, V.; Lioliou, M.G.; Koutsoukos, P.G.; Paraskeva, C.A. Experimental Investigation of Calcium Carbonate Precipitation and Crystal Growth in One- and Two-Dimensional Porous Media. Cryst. Growth Des. 2016, 16, 359–370. [Google Scholar] [CrossRef]
  35. Shin, Y.; Sohn, J. Mechanisms for scale formation in simultaneous membrane distillation crystallization: Effect of flow rate. J. Ind. Eng. Chem. 2016, 35, 318–324. [Google Scholar] [CrossRef]
  36. Çelikbilek, M.; Ersundu, A.E.; Solak, N.; Aydin, S. Crystallization kinetics of the tungsten–tellurite glasses. J. Non-Cryst. Solids 2011, 357, 88–95. [Google Scholar] [CrossRef]
  37. Reddy, M.M. Crystallization of calcium carbonate in the presence of trace concentrations of phosphorus-containing anions: I. Inhibition by phosphate and glycerophosphate ions at pH 8.8 and 25 °C. J. Cryst. Growth 1977, 41, 287–295. [Google Scholar] [CrossRef]
  38. Reddy, M.M.; Hoch, A. Calcium Carbonate Nucleation in an Alkaline Lake Surface Water, Pyramid Lake, Nevada, USA. Aquat. Geochem. 2012, 18, 95–113. [Google Scholar] [CrossRef]
  39. Reddy, M.M.; Nancollas, G.H. The crystallization of calcium carbonate: IV. The effect of magnesium, strontium and sulfate ions. J. Cryst. Growth 1976, 35, 33–38. [Google Scholar] [CrossRef]
  40. Al-Hamzah, A.A.; East, C.P.; Doherty, W.O.S.; Fellows, C.M. Inhibition of homogenous formation of calcium carbonate by poly (acrylic acid). The effect of molar mass and end-group functionality. Desalination 2014, 338, 93–105. [Google Scholar] [CrossRef] [Green Version]
  41. Tang, Y.; Zhang, F.; Cao, Z.; Jing, W.; Chen, Y. Crystallization of CaCO3 in the presence of sulfate and additives: Experimental and molecular dynamics simulation studies. J. Colloid Interface Sci. 2012, 377, 430–437. [Google Scholar] [CrossRef] [PubMed]
  42. Gopi, S.P.; Subramanian, V.K. Polymorphism in CaCO3—Effect of temperature under the influence of EDTA (di sodium salt). Desalination 2012, 297, 38–47. [Google Scholar] [CrossRef]
  43. Setta, F.A.; Neville, A. Efficiency assessment of inhibitors on CaCO3 precipitation kinetics in the bulk and deposition on a stainless steel surface (316L). Desalination 2011, 281, 340–347. [Google Scholar] [CrossRef]
  44. Touati, K.; Alia, E.; Zendah, H.; Elfil, H.; Hannachi, A. Sand filters scaling by calcium carbonate precipitation during groundwater reverse osmosis desalination. Desalination 2018, 430, 24–32. [Google Scholar] [CrossRef]
  45. Mao, X.; Song, X.; Lu, G.; Sun, Y.; Xu, Y.; Yu, J. Effects of Metal Ions on Crystal Morphology and Size of Calcium Sulfate Whiskers in Aqueous HCl Solutions. Ind. Eng. Chem. Res. 2014, 53, 17625–17635. [Google Scholar] [CrossRef]
  46. Busenberg, E.; Plummer, L.N. Kinetic and thermodynamic factors controlling the distribution of SO32−and Na+ in calcites and selected aragonites. Geochim. Et Cosmochim. Acta 1985, 49, 713–725. [Google Scholar] [CrossRef]
  47. Okumura, M.; Kitano, Y. Coprecipitation of alkali metal ions with calcium carbonate. Geochim. Et Cosmochim. Acta 1986, 50, 49–58. [Google Scholar] [CrossRef]
  48. White, A.F. Sodium and potassium coprecipitation in aragonite. Geochim. Et Cosmochim. Acta 1977, 41, 613–625. [Google Scholar] [CrossRef]
  49. Kushnir, J. The coprecipitation of strontium, magnesium, sodium, potassium and chloride ions with gypsum. An experimental study. Geochim. Et Cosmochim. Acta 1980, 44, 1471–1482. [Google Scholar] [CrossRef]
  50. Yang, Q.; Liu, Y.; Gu, A.; Ding, J.; Shen, Z. Investigation of Calcium Carbonate Scaling Inhibition and Scale Morphology by AFM. J. Colloid Interface Sci. 2001, 240, 608–621. [Google Scholar] [CrossRef]
  51. Zhang, S.; Qu, H.; Yang, Z.; Fu, C.-E.; Tian, Z.; Yang, W. Scale inhibition performance and mechanism of sulfamic/amino acids modified polyaspartic acid against calcium sulfate. Desalination 2017, 419, 152–159. [Google Scholar] [CrossRef]
  52. Liang, R.; Li, J.; Liu, M.; Huang, Z.Y. Influence of inhibitors on the adhesion of SRB to the stainless steel in circulating cooling water. Colloids Surf. B Biointerfaces 2018, 172, 1–9. [Google Scholar] [CrossRef] [PubMed]
  53. Ou, H.H.; Hsieh, L.H.C. A synergistic effect of sodium gluconate and 2-phosphonobutane-1,2,4-tricarboxylic acid on the inhibition of CaCO3 scaling formation. Powder Technol. 2016, 302, 160–167. [Google Scholar] [CrossRef]
  54. Popov, K.; Rudakova, R.; Larchenko, V.; Tusheva, M.; Afanas’eva, E.; Kombarova, S.; Kamagurov, S.; Kovaleva, N. A comparative performance ranking of some phosphonates and environmentally friendly polymers on CaCO3 scaling inhibition by NACE protocol. Desalin. Water Treat. 2016, 69, 163–172. [Google Scholar] [CrossRef]
  55. Demadis, K.D.; Chemistry, L.P.J.B. Applications, Chemistry of Organophosphonate Scale Growth lnhibitors: 3. Physicochemical Aspects of 2-Phosphonobutane-1,2,4-Tricarboxylate (PBTC) and its Effect on CaCO3 Crystal Growth. Bioinorg. Chem. Appl. 2005, 3, 135–149. [Google Scholar] [CrossRef] [Green Version]
Figure 1. pH–time curves (A) and [Ca2+]–time curves (B) during the crystallization of CaCO3 in different salinities.
Crystals 09 00647 g001
Figure 2. Rate function (TT0)–time curves of CaCO3 crystallization in different salinities.
Crystals 09 00647 g002
Figure 3. XRD patterns of CaCO3 crystallization in different concentrations of (A) NaCl: (a) without and (b–e) with 3.5 wt.%–14 wt.%; (B) KCl: (a–d) with 3.5 wt.%–14 wt.%; (C) HEDP in NaCl: (a) 4 μM HEDP, (b) 8 μM HEDP and (c–f) 4 μM HEDP with 3.5 wt.%–14 wt.% NaCl. (D) PBTCA in NaCl: (a) 4 μM PBTCA, (b) 8 μM PBTCA and (c–f) 4 μM PBTCA with 3.5 wt.%–14 wt.% NaCl. Among them, c, a, and v represented calcite, aragonite and vaterite, respectively.
Crystals 09 00647 g003
Figure 4. SEM images of CaCO3 crystallization in different solutions: (A) NaCl: (a) without and (b–e) with 3.5 wt.%–14 wt.%; (B) HEDP in NaCl: (a) 4 μM HEDP and (b–e) 4 μM HEDP with 3.5 wt.%–14 wt.% NaCl. (C) PBTCA in NaCl: (a) 4 μM PBTCA and (b–e) 4 μM PBTCA with 3.5 wt.%–14 wt.% NaCl.
Crystals 09 00647 g004
Figure 5. The starting configurations and the optimized results of the two inhibitors on the surfaces of calcite in NaCl solution. For HEDP, (a1) and (c1) represented the starting configurations on the (1 0 4) and (1 1 0) faces, respectively, while (a2) and (c2) meant the optimized simulation results correspondingly; for PBTCA, (b1) and (d1) displayed the starting configurations on the investigated faces and the homologous optimal simulation results were showed in (b2) and (d2).
Crystals 09 00647 g005
Figure 6. A (a) and B (a) are optimal configurations of the HEDP and PBTCA molecules. All the functional groups are freely extended according to the rules. A (b) and B (b) are quantum calculation results of the HEDP and PBTCA substances with calcium ions.
Crystals 09 00647 g006
Table 1. Activity coefficients of [Ca2+] and [CO32−], supersaturation ratio and the Ca2+ retention efficiency of NaCl, 2–phosphonobutane–1,2,4–tricarboxylic acid (PBTCA) and 1–hydroxyethane–1,1–diphosphonic acid (HEDP) in different salinities.
NaCl (wt.%)03.5710.514
γCa (×10−2)80 ± 3%9 ± 1%5 ± 3%2 ± 6%2 ± 7%
γCO3 (×10−2)
SR
80 ± 2%
292 ± 9%
10 ± 3%
20 ± 8%
8 ± 1%
11 ± 9%
5 ± 1%
5 ± 4%
3 ± 8%
4 ± 9%
ηNaCl31 ± 6%35 ± 7%38 ± 4%41 ± 6%
η4 μM HEDP19 ± 7%48 ± 1%54 ± 1%58 ± 1%60 ± 6%
η8 μM HEDP30 ± 3%62 ± 2%67 ± 7%68 ± 1%70 ± 4%
η16 μM HEDP48 ± 1%73 ± 8%78 ± 6%81 ± 1%83 ± 1%
η4 μM PBTCA27 ± 8%56 ± 1%61 ± 1%65 ± 6%70 ± 4%
η8 μM PBTCA42 ± 5%73 ± 8%77 ± 9%80 ± 6%82 ± 3%
η16 μM PBTCA52 ± 7%84 ± 7%88 ± 8%90 ± 8%92 ± 6%
Table 2. Values of pHc, pHs and induction time tested by pH measurement, and the surface areas of crystals measured by the Nitrogen Adsorption (BET method) testing in different salinities.
NaCl(wt.%)03.5710.514
pHc9 ± 1%9 ± 2%9 ± 6%10 ± 2%10 ± 1%
pHs
Induction time (s)
8 ± 6%
25 ± 2%
9 ± 1%
79 ± 8%
9 ± 5%
118 ± 2%
9 ± 8%
160 ± 8%
9 ± 2%
189 ± 6%
s (m2/10 g)1 ± 6%4 ± 4%4 ± 6%7 ± 2%8 ± 5%
Table 3. Fractions of calcite’s and aragonite’s phases in the CaCO3 crystals.
NaCl (wt%)03.5710.514
Calcite (%)10058 ± 7%39 ± 3%38 ± 3%37 ± 7%
Aragonite (%)041 ± 2%60 ± 7%61 ± 6%62 ± 2%
Table 4. The binding energy (kcal/mol) of two inhibitors in NaCl on the calcite (1 0 4) and (1 1 0) surfaces.
SurfaceNaCl (wt.%)Ebinding of HEDP in NaClEbinding of PBTCA in NaCl
(1 0 4)022 ± 3%26 ± 1%
3.548 ± 6%64 ± 7%
760 ± 3%83 ± 9%
10.593 ± 1%103 ± 2%
14123 ± 2%137 ± 7%
064 ± 7%74 ± 2%
(1 1 0)3.5140 ± 6%146 ± 1%
7158 ± 5%147 ± 2%
10.5192 ± 4%173 ± 5%
14216 ± 9%184 ± 1%

