1. Introduction
The potassium dihydrogen phosphate (KH
2PO
4) crystal (KDP) is widely used in non-linear optics and laser technology for the manufacture of optical modulators, Q-switches, and laser frequency converters [
1,
2,
3,
4,
5,
6]. These crystals have high resistance to laser radiation and are not subject to various induced effects. In addition, the KDP crystal, for many years, was a convenient model for the study of the growth from solution due to KH
2PO
4 stability in a wide temperature range and its high solubility in water.
It is known that faces of the prism {100} and the pyramid {101} of the KDP crystal capture impurity ions differently [
7,
8,
9]. Studies of atomic structure of KDP crystal faces have explained this phenomenon: it was found that the prism surface is electrically neutral since it is formed by both potassium cations K
+ and phosphate anions PO
43−, while the pyramid surface is positively charged since it is formed only by cations K
+ [
10]. Adsorbed M
3+ ions, which are one of the main accompanying impurities for KDP crystal, form fixed blockers (so-called Cabrera–Vermilyea fence) and brake movement of the growth steps on the {100}-faces [
11]. So, the dependence of the growth steps velocity on the solution supersaturation for the prism sector of the KDP crystal could be characterized by the existence of so-called "dead zone" σ < σ
d and the critical supersaturation σ*. There is practically no step movement at σ < σ
d and the step velocity increases sharply at the σ*. The further increase in the supersaturation turns this dependence into a straight line. The influence of Fe
3+ cations on the growth steps movement was studied by interference microscopy for the prism faces of KDP crystal [
12]. The analysis of the kinetic curves obtained for solutions with Fe
3+ concentrations (C
Fe) up to 7 ppm showed that, at a low impurity, concentration the supersaturation threshold values (σ
d and σ*) increase linearly with the Fe
3+ concentration in the solution. The surface morphology and kinetics of the {100}-faces growth from aqueous solutions with Fe
3+ content from 0 to 30 ppm were studied using AFM [
13]. It was found that at a high content of Fe
3+ in the solution (~30 ppm) the surface morphology at supersaturation ~σ* changes qualitatively. Instead of the macrosteps formation happening at low Fe
3+ concentration, the so-called supersteps emerge and move over the surface. Supersteps, whose height could be as high as 1500 nm, consist of hundreds of elementary steps. Undoubtedly such morphological changes should affect the ability to capture of impurity atoms by the growing face and, consequently, the features of the real structure of KDP crystals grown from solutions with a high concentration of Fe
3+. Meanwhile, the nature of the impurity distribution in various growth sectors of KDP crystal grown from solution with a high impurity concentration, as well as the processes of defects formation in highly doped water-soluble crystals, have not been previously studied due to low solution stability at high supersaturation.
The aims of this work were to grow the KDP: Fe3+ crystals from solutions with high content of Fe3+ at the different conditions, and to study their real structure as well as features of Fe3+ ions incorporation in the prism growth sector and influence of Fe3+ content on the optical transmission spectra of the grown crystals.
2. Materials and Methods
The potassium KH
2PO
4 (99.99 wt.%) and distilled water were used for solutions preparing. The average pH value of the solutions was 4.0 ± 0.1. The solutions were saturated at 53.5–67.6 °C depending on supersaturation that should be achieved. Preliminary calculation of the equilibrium solutions compositions was carried out according to the formula [
14]:
where c is the solution equilibrium concentration, wt.%, and t is the solution temperature, °C.
The doping impurity Fe3+ in the form of FeCl3·6H2O (99.8 wt.%) was added in the KDP solution overheated above the saturation temperature. The obtained solution was stirred for several days, then its saturation temperature was determined.
The microcrystallization unit was used to refine the solubility for KDP and KDP: Fe
3+. The growth part of the unit consists of a thermostated quartz cell with a stirrer where test solution and seed crystal are placed [
15]. The optical part makes it possible to observe the growth/dissolution processes on the surface of the seed crystal in reflected and transmitted light. The accuracy of determining of the solution saturation temperature was ±0.1 °C.
Before each growth experiment, the solution was overheated 10 °C above the saturation temperature and filtered three times through a track membrane filter with pore diameters of 0.2 µm to remove mechanical impurities from the solution and the growth crystallizer. To increase the solution resistance to spontaneous nucleation, filtered solution was kept overheated for 1–2 days at a temperature of 80–85 °C.
All growth experiments described in this work were carried out in 5 L crystallizers. The accuracy of maintaining of the solution temperature was ±0.02 °C.
The solutions stability to supercooling was evaluated by polythermal studies of the metastable zone width. After preliminary processing (saturation temperature determination, filtration, and overheating), KDP or KDP: Fe
3+ solution saturated at 67–80 °C was cooled with the rate 0.06– 0.14 °C/min until visible crystals appeared in the crystallizer volume. During the experiment, the solution was stirred in a reversible mode with a period—clockwise-stop-counterclockwise—40-8-40 s, the average speed of stirrer rotation was 60 rpm that corresponded to the linear velocity of the stirrer blade end face ~25 cm/s. The width of the metastable zone was calculated by value of the temperature corresponding to registration of the first visible crystal in the volume of the crystallizer (∆
c):
where
c is the real solution concentration, wt.%; and
ct is the equilibrium concentration of the solution corresponding the temperature of the first visible crystal registration, wt.%.
KDP and KDP: Fe
3+ crystals were grown both at constant temperature and supersaturation and by temperature reduction method. The point seed ~4 × 4 × 3 mm
3 in size was fixed on a rotating platform. The growth solutions contained Fe
3+ in amount 0.9–70 ppm. The supersaturation was 0.1–0.45. We studied the crystals growth at high σ, so we used the formula:
where
c is the real solution concentration, wt.%; and
c0 is the equilibrium solution concentration, wt.%.
The Fe content in solutions and crystalline samples was determined by inductively coupled plasma mass spectrometry. Analytical measurements were performed on NexIon 300D (PerkinElmer, Waltham, MA, USA) in collision (kinetic energy discrimination (KED)) mode.
The normal growth rate R101 was calculated from measurement of the crystal height (size along the [001] axis) using a cathetometer.
The study of the real structure features of the crystals was carried out by Lang X-ray projection topography in the MoKα radiation. The samples were (100)-plates of 1–1.5 mm thickness.
The crystals transmission spectra study in the wavelength range of 200–900 nm was performed with the automatic two-channel spectrophotometer Cary 300 UV–VIS (Agilent Technologies, Santa Clara, CA, USA). The samples of 10 × 10 × 10 mm3 were prepared; their working faces were subjected to mechanical grinding and polishing.
3. Theoretical Background of the Layer-by-Layer Crystal Growth
Like other crystals grown from aqueous solutions, the KDP crystal grows layer-by-layer, that is, by propagation of growth steps over the surface. It could be both the dislocation growth mechanism [
16,
17,
18,
19,
20,
21] and the dislocation-free mechanism, which is provided by the formation of two-dimensional nuclei on the crystal face [
22,
23,
24,
25,
26].
Layer-by-layer growth occurs on an atomically smooth surface covered by alternating smooth areas and step ends. The movement of the steps is provided by joining of growth units to their kinks. Each particle on the surface has dangling bonds, which increase the surface energy of the crystal. However, the enter of a particle into the step kink, unlike other possible places, does not change the total number of dangling bonds. So, in case of equilibrium with the medium, the chemical potential of the particle in the kink is equal to the chemical potential of the growth units in the crystal bulk. Moreover after the particle was attached to the kink, the later does not disappear, but moves along the step by a distance equal to the particle size. For this reason, the crystal can grow at arbitrarily small supersaturation , where Δμ is the difference in chemical potentials of the solution and the crystal, k is the Boltzmann constant, and T is the temperature.
For the growth on atomically smooth surface the creation of new layers is necessary. The sources of the layers can be either two-dimensional (2D) nuclei or screw dislocations outcropping on the crystal surface.
Let us consider first the crystal growth by the formation of 2D nuclei. Such nuclei arise as a result of fluctuation acts of the association of growth units adsorbed on the surface. The appearance of a round nucleus of radius
r and thickness
h equal to the lattice parameter is prevented by the appearance of a new surface, with the area equal to the area of the nucleus end. The change in free energy will be
where, α is the surface energy of the step end, Ω is the molecule volume, and h is the height of the elementary step.
The critical radius of such nucleus at ΔG* = 0 is equal to
The normal crystal growth rate for 2D nucleation at high nucleation rate [
26] is
where
δΦc is the formation work of a nucleus,
β is the kinetic coefficient of a step, and
C0 is the equilibrium solution concentration.
Formula (4) predicts a high crystal growth rate at high supersaturations. However, at small supersaturations, it gives extremely low values, which are several orders of magnitude lower than those observed in experiments. For the first time, this contradiction was explained by Frank, who showed [
27] that a screw dislocation forms a non-overgrowing step. The dislocation theory of Barton, Cabrera, and Frank (BCF) [
16] explained crystal growth at low supersaturation for the first time.
A crystal surface with a screw dislocation is a single layer of growth units twisted into a helicoid. The attachment of growth units to the step leads to its rotation around the dislocation outcrop and to the formation of a helicoidal spiral. As a result, vicinal hillock is formed on the crystal surface.
The step velocity is proportional to the supersaturation:
The normal growth rate
R of the face is related to the hillock steepness
p by the ratio
, where
p = tgφ =
h/λ, φ is the angle of the slope of the hillock to the face, and λ is the inter-step distance. The BCF theory predicts that the inter-step distance and hence the hillock slope depend on supersaturation:
Then, the hillock formed on a single dislocation has the slope
, and the normal growth rate is
Growth hillock can form not only from single dislocations, but also from dislocation bunches. If the bunch consists of
N dislocations, and 2
L is its perimeter, then
N-tern spiral is formed with a distance between the turns of λ = 19
rc + 2
L. The slope of such hillock is
p =
Nh/(19
rc + 2
L). Accordingly, the normal growth rate in this case is
It is clear that with increasing supersaturation, the slopes of hillocks of different capacities are changing differently, and the supersaturation change results in the change of leading source.
The hillock structure may change during the growth. Barton et al. [
16] have showed that if
, then the source breaks into several individual ones. Since
rc decreases with increasing σ (Equation (5)), the probability of hillock separation increases, and at very high supersaturations, one should expect that growth will be driven by single dislocation sources.
The growth kinetics is strongly influenced by impurities. The impurity particles in the solution can be adsorbed on the crystal surface and in step kinks. Their incorporation into the crystal surface layer is energetically disadvantageous; therefore, they inhibit the step movement. In the Cabrera–Vermilyea model [
11], such particles are considered as a fence of stoppers firmly adsorbed on the terraces between the steps. If the distance between the stoppers is less than 2
rc, the step stops. Its further movement is possible only with a decrease of
rc due to an increase of σ. Thus, a “dead” supersaturation zone arises at small values of σ < σ
d when the step is unmoved.
Due to the fact that the steps are inhibited by impurities, the doping of crystals grown from solution causes significant difficulties and it is hardly used. If the concentration of impurity particles on the crystal surface is equal to Ci, then the average distance between them is equal to Ci-1/2 (pcs/cm2) and the value of the dead zone is equal to σd = 2ΩαCi1/2/kT. Therefore, at high supersaturation, there is a possibility of significant doping of crystals.
4. Results and Discussion
4.1. The Metastable Zone Width of the KDP and KDP: Fe3+ Aqueous Solutions
Because the KDP: Fe3+ crystals growth must be carried out at high supersaturation, one of the main problems is spontaneous secondary nucleation, which instantaneously reduces supersaturation and makes further crystal growth impossible.
It is known that the stability of KDP solutions to spontaneous nucleation depends on a number of factors: the solutions filtration quality [
28], the duration and the temperature regime of solution overheating [
29,
30], the hydrodynamic conditions of crystal growth [
31], as well as the solution temperature decrease rate [
32].
Different scientific works describe the effect of inorganic impurities on the stability of (NH
4)H
2PO
4 and KH
2PO
4 aqueous solutions in a different way. It was discovered that the impurities which have a common cation or anion with the dissolved salt considerably reduce the induction period [
33,
34]; it is reported that the presence of trivalent cations (Al
3+, Cr
3+, and Fe
3+) with concentrations up to 20 ppm does not effect KDP solutions stability at all [
7]; it was found that the presence of Al
3+ in KDP aqueous solutions significantly increases the induction period, which rises along with the Al
3+ concentration (Al
3+ content varied from 0 to 33 ppm) [
35]. Therefore, it is important to study how the presence of Fe
3+ in solution affects the KDP aqueous solutions stability to secondary nucleation.
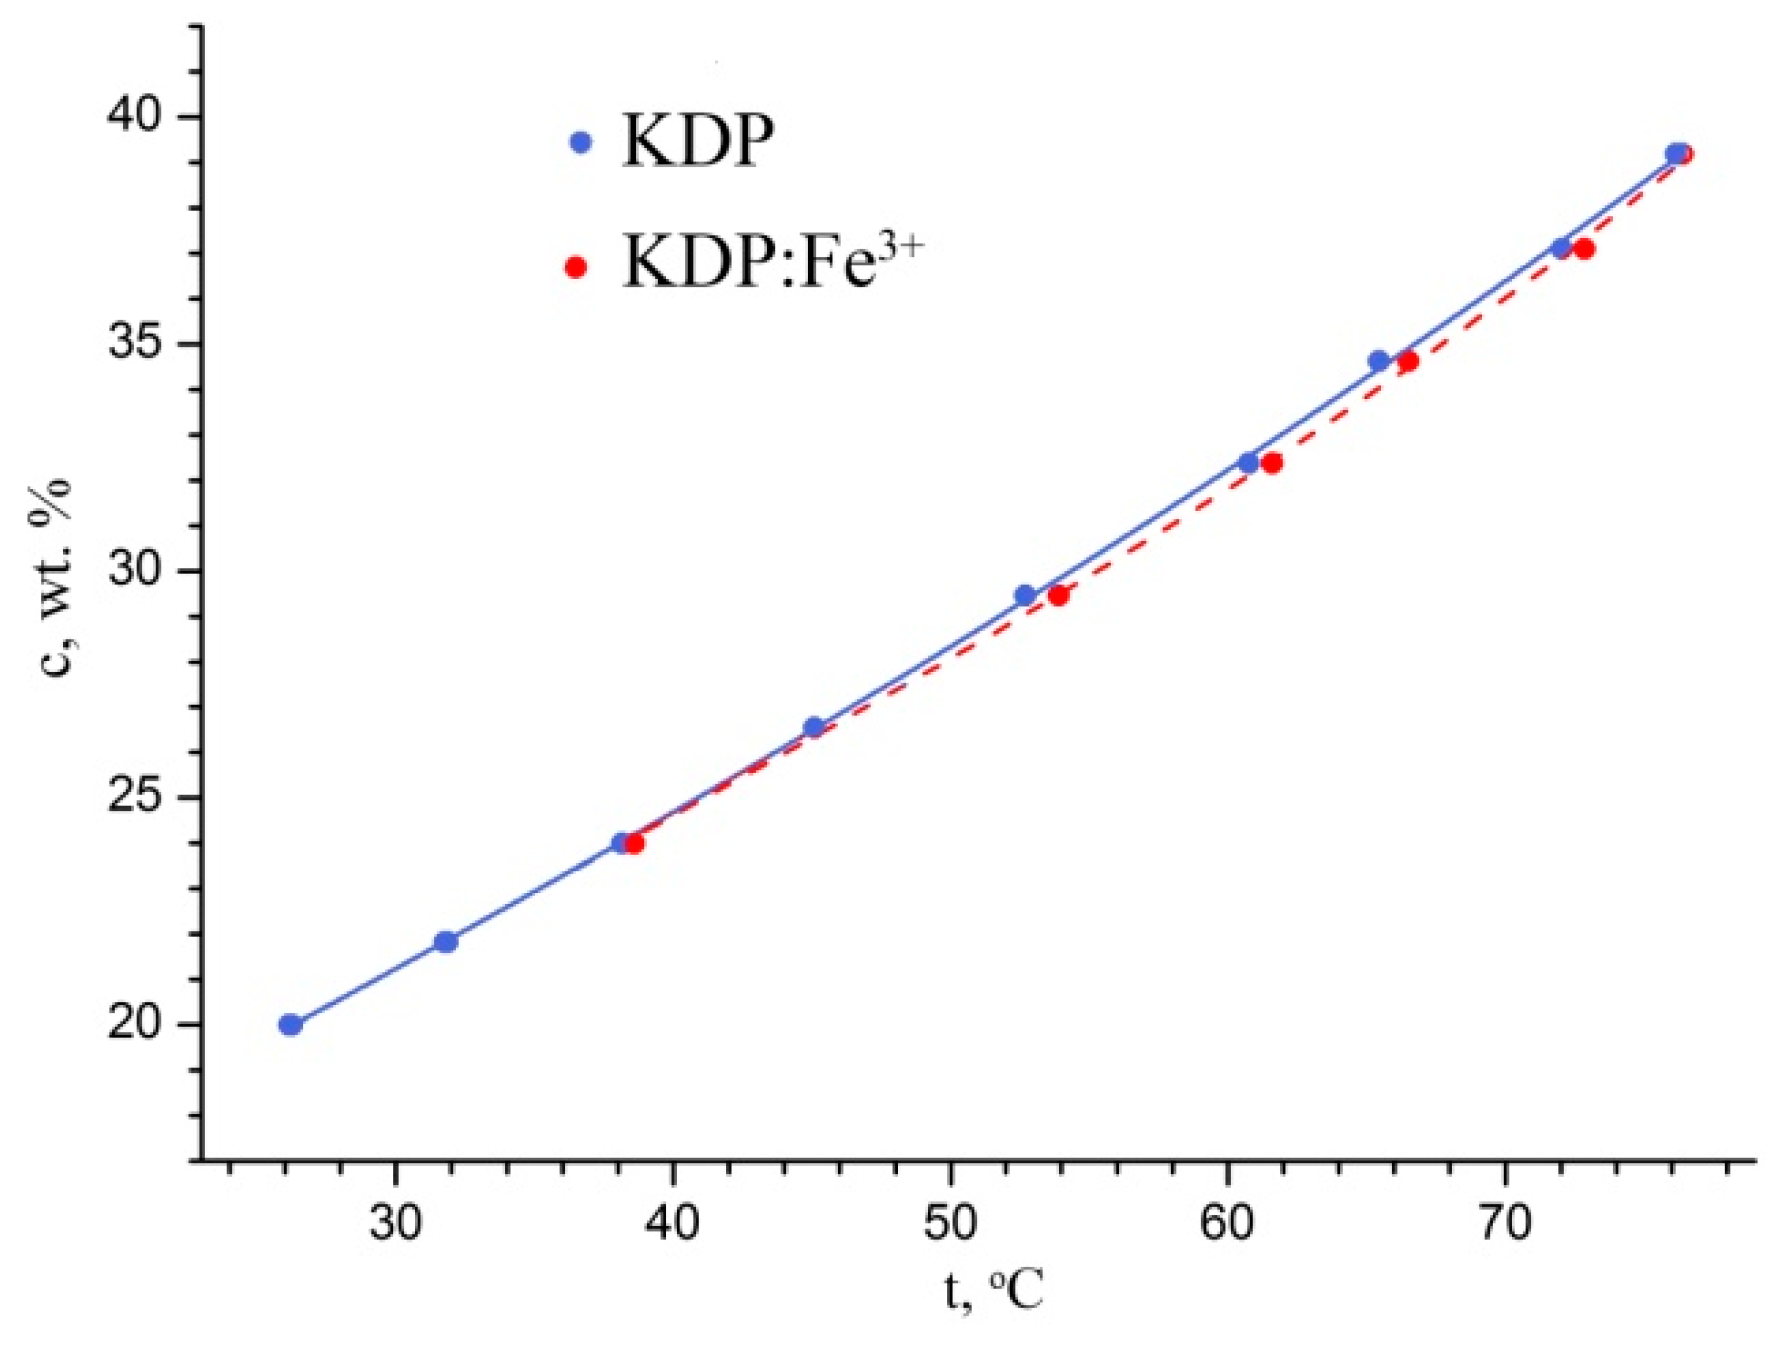
First of all, the KH
2PO
4 solubility curves in pure water and in water with the addition of 50 ppm Fe
3+ were refined. As could be seen (
Figure 1), the introduction of Fe
3+ in such concentration had almost no effect on the KH
2PO
4 solubility in water.
The temperature dependence of solubility of KH
2PO
4 in H
2O could be represented as
and for KH
2PO
4 in H
2O: Fe
3+ as
where
c is the KH
2PO
4 equilibrium concentration, wt.%; and t is the solution temperature, °C.
Our study showed that the Fe
3+ introduction into the KH
2PO
4 solution significantly increases solution stability to spontaneous nucleation throughout the studied temperature range (
Figure 2). The results obtained for the temperature dependence of metastable zone width for undoped KH
2PO
4 solutions are in good agreement with [
36]. It should be noted that in all the experiments the crystal nucleation was observed either at the bottom of the crystallizer or on the surface of the stirrer, that means there was a heterogeneous nucleation, i.e., nuclei formed on the phase boundary, on foreign particles, details of the crystallizer, the crystal surface, etc. [
26].
4.2. Growing of KDP: Fe3+ Crystals
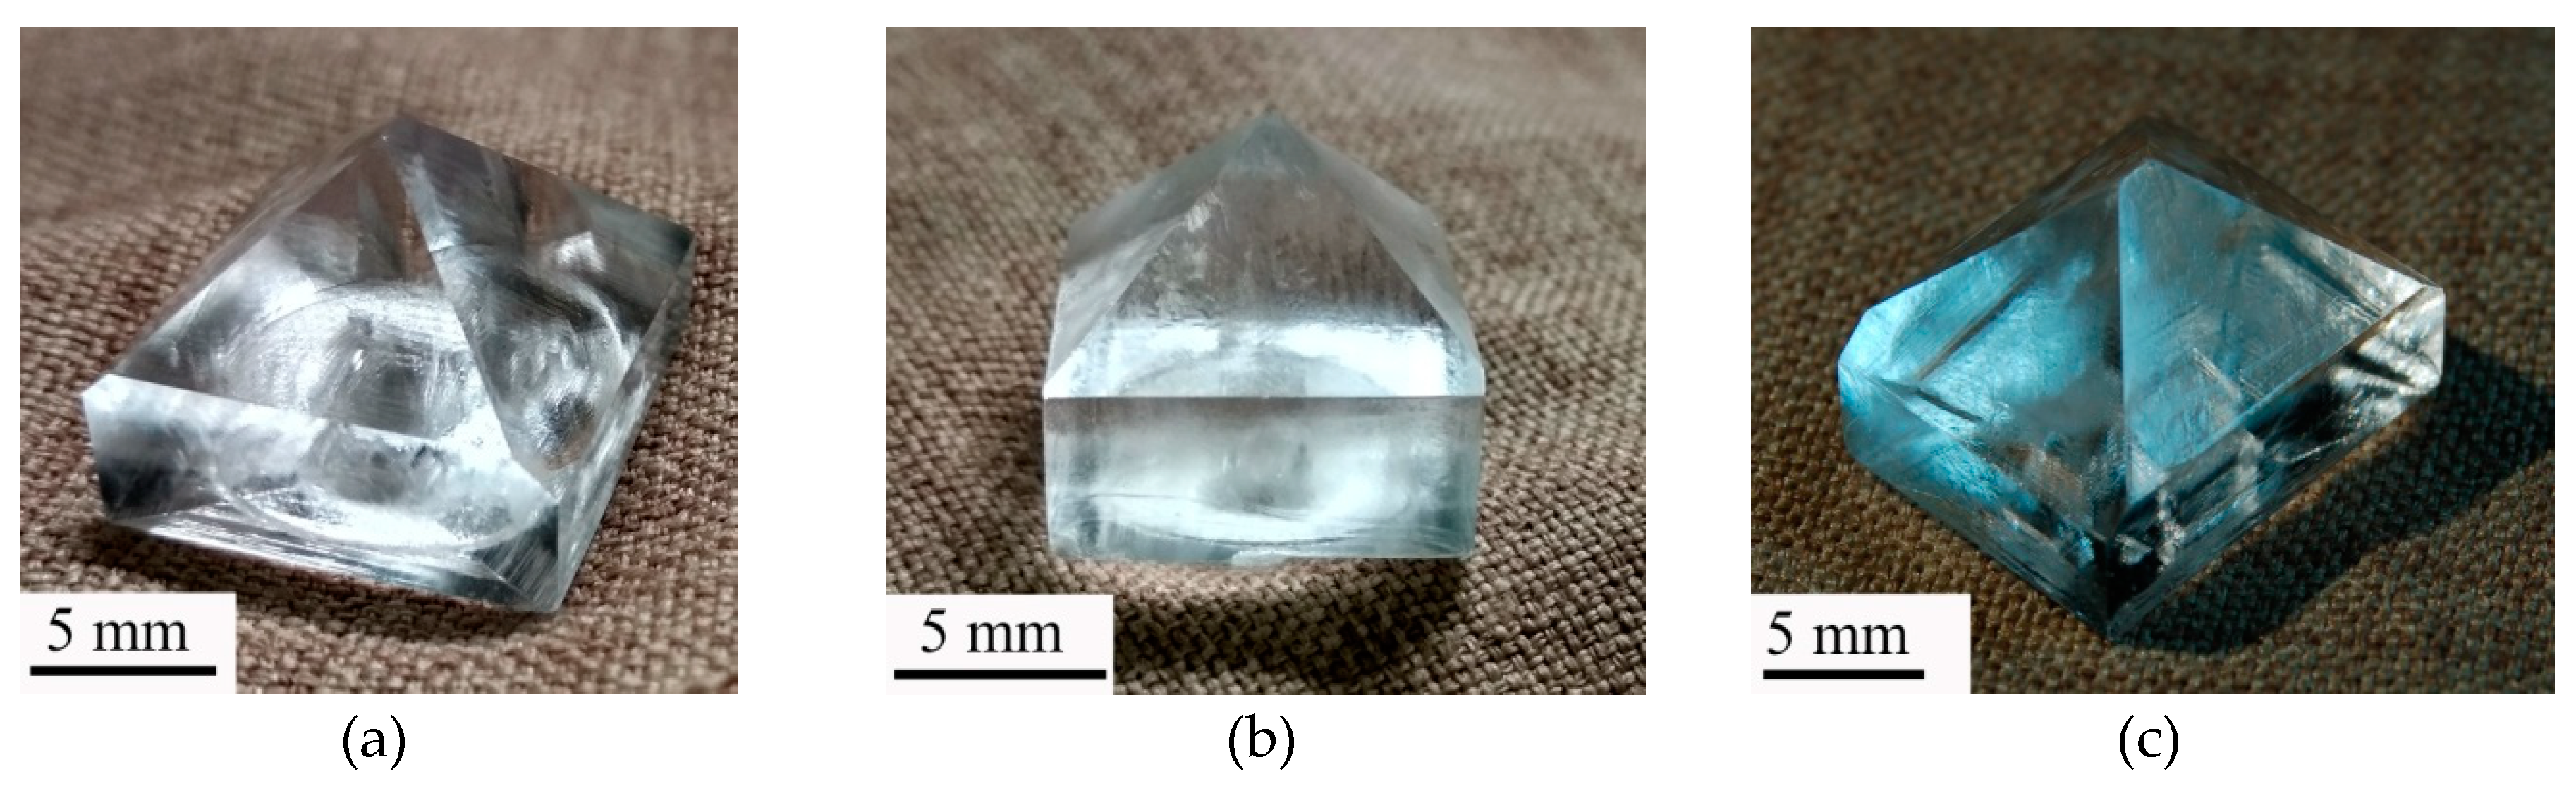
A series of KDP: Fe
3+ crystals up to 23 × 22 × 27 mm
3 in size were grown. Some crystals can be seen in the
Figure 3. They can be divided into three groups depending on the temperature and hydrodynamic growth conditions: grown from fast-cooled solutions at the reversible rotation of crystal; grown from fast-cooled solutions at the one-direction rotation of crystal; grown from slow-cooled solutions at the reversible rotation of crystal. Growing from fast-cooled solutions means that the required supersaturation is achieved at the same time as regeneration of pyramid faces. Growing from slow-cooled solutions means that the temperature decrease average rate is ~0.15 °C/min, and the time to reach the required of supersaturation is 6–8 hours. The idea of crystal growth without forced solution cooling arose because, as was found previously [
32], the higher the rate of forced cooling the less the metastable zone width.
The high stability of doped solutions to spontaneous nucleation was confirmed by a stable growth of KDP: Fe3+ crystals up to σ ≈ 0.45. It was found that the decrease rate of the solution temperature and the stirring character (reversible or not) do not have a significant effect on the solution stability. Carrying out the growth process from oversaturated solutions allowed us to obtain and to study KDP: Fe3+ crystals with Fe3+ content in the prism growth sector about 100 ppm for the first time.
4.3. The Real Structure Study of the KDP: Fe3+ Crystals Grown from Oversaturated Solutions
X-ray topography studies of the grown crystals’ real structure helped us to determine the growth modes preferable for growing KDP: Fe
3+ crystals with a high iron content. The topographs of X-cuts of crystals grown at supersaturation from 0.30 to 0.394 are shown in
Figure 4.
All KDP: Fe3+ crystals under study contained dislocations (D) that arose in both growth sectors during the seed regeneration. Moreover, all crystals showed a large number of dislocations (mainly in the prism growth sector) formed on the pronounced sectorial boundaries (SB) between the prism and pyramid sectors. This indicates a significant difference in the lattice parameters due to the heterogeneous distribution of impurities (primarily Fe3+) in the two sectors. Most crystals demonstrate a zonal inhomogeneity (Z) band in the pyramid sector. In crystals grown from slow-cooled solutions, the zonal inhomogeneity is also occurred in the prism growth sector.
The most obvious vicinal-sectorial boundaries (VSB) and their greatest number are observed in the KDP: Fe3+ crystals grown in single direction stirred solution and in the crystals grown from slow-cooled solutions. This is due to the fact that the crystal growing faces are unevenly washed by the solution in the first case, and the changing supersaturation through time leads to morphological instability of crystal surface in the second case. In KDP: Fe3+ crystals grown at constant σ and reversible rotation, the vicinal-sectorial boundaries are less pronounced, and the sectorial boundaries are less contrasted. So, one can conclude that the growth of KDP: Fe3+ crystals with a high content of Fe3+ is preferable to carry out at constant supersaturation from fast-cooled solutions.
4.4. Spectral Characteristics of KDP: Fe3+ Crystals
There are a number of works devoted to the effect of Fe
3+ dopant on the spectral characteristics of KDP [
37,
38,
39] where the crystal growth was carried out at σ ≤ 0.04 and the Fe
3+ content in the {100} growth sector did not exceed 5 ppm. The transmission spectra of KDP: Fe
3+ solutions with Fe
3+ concentrations 0.07–2.0 ppm and 280 ppm were studied in [
40], the latter solution had an absorption band edge of ~350 nm.
Figure 5a shows the transmission spectra of prism sectors of KDP crystals grown at constant supersaturation σ > 0.3 and different ferric iron concentrations. The Fe
3+ concentration 0.86 ppm corresponds to the crystal grown from undoped solution, whose transmission spectrum is not inferior in its parameters to the transmission spectra of KDP crystals grown at σ ≤ 0.04. All KDP crystals under study with a C
Fe > 60 ppm have an absorption band edge at 330–340 nm and can be used as optical filters to suppress the UV-C and UV-B ranges. But, the structural perfection of the crystals must be improved to increase the transmittance in visible spectrum range: the absence of an unambiguous relationship between the decrease in transparency in this range and the Fe
3+ concentration suggests that, most likely, low transmittance is due to the light scattering on lattice defects. It should be noted that the left edge position of the absorption ranges for KDP: Fe
3+ crystals can be regulated by the Fe
3+ content in the crystal.
The pyramid growth sector of the KDP doped with Fe
3+ crystal has practically the same transmission spectrum as the undoped one (
Figure 5b). This can be explained by the fact that, for the pyramid growth sector, ferric iron does not enter into the crystal lattice due to the features of surface structure of the pyramid faces [
10].
4.5. Evaluation of the σ Corresponding to the Change of the Growth Mechanism
It was shown that supersaturation more than 0.3 corresponded to the growth of the pyramid faces by 2D nucleation and extended areas of the solution inclusions in the {101} growth sectors appeared in most cases [
25]. To find out whether the addition of iron affects the supersaturation, at which there is a change in the growth mechanism, a series of experiments on the growing of pure and doped crystals at different supersaturation were carried out.
The iron concentration in doped solutions was 50 ppm. All crystals were grown at constant supersaturation. The experimental data on normal growth rates were obtained using a cathetometer by in situ measurements of crystal height during crystal growth.
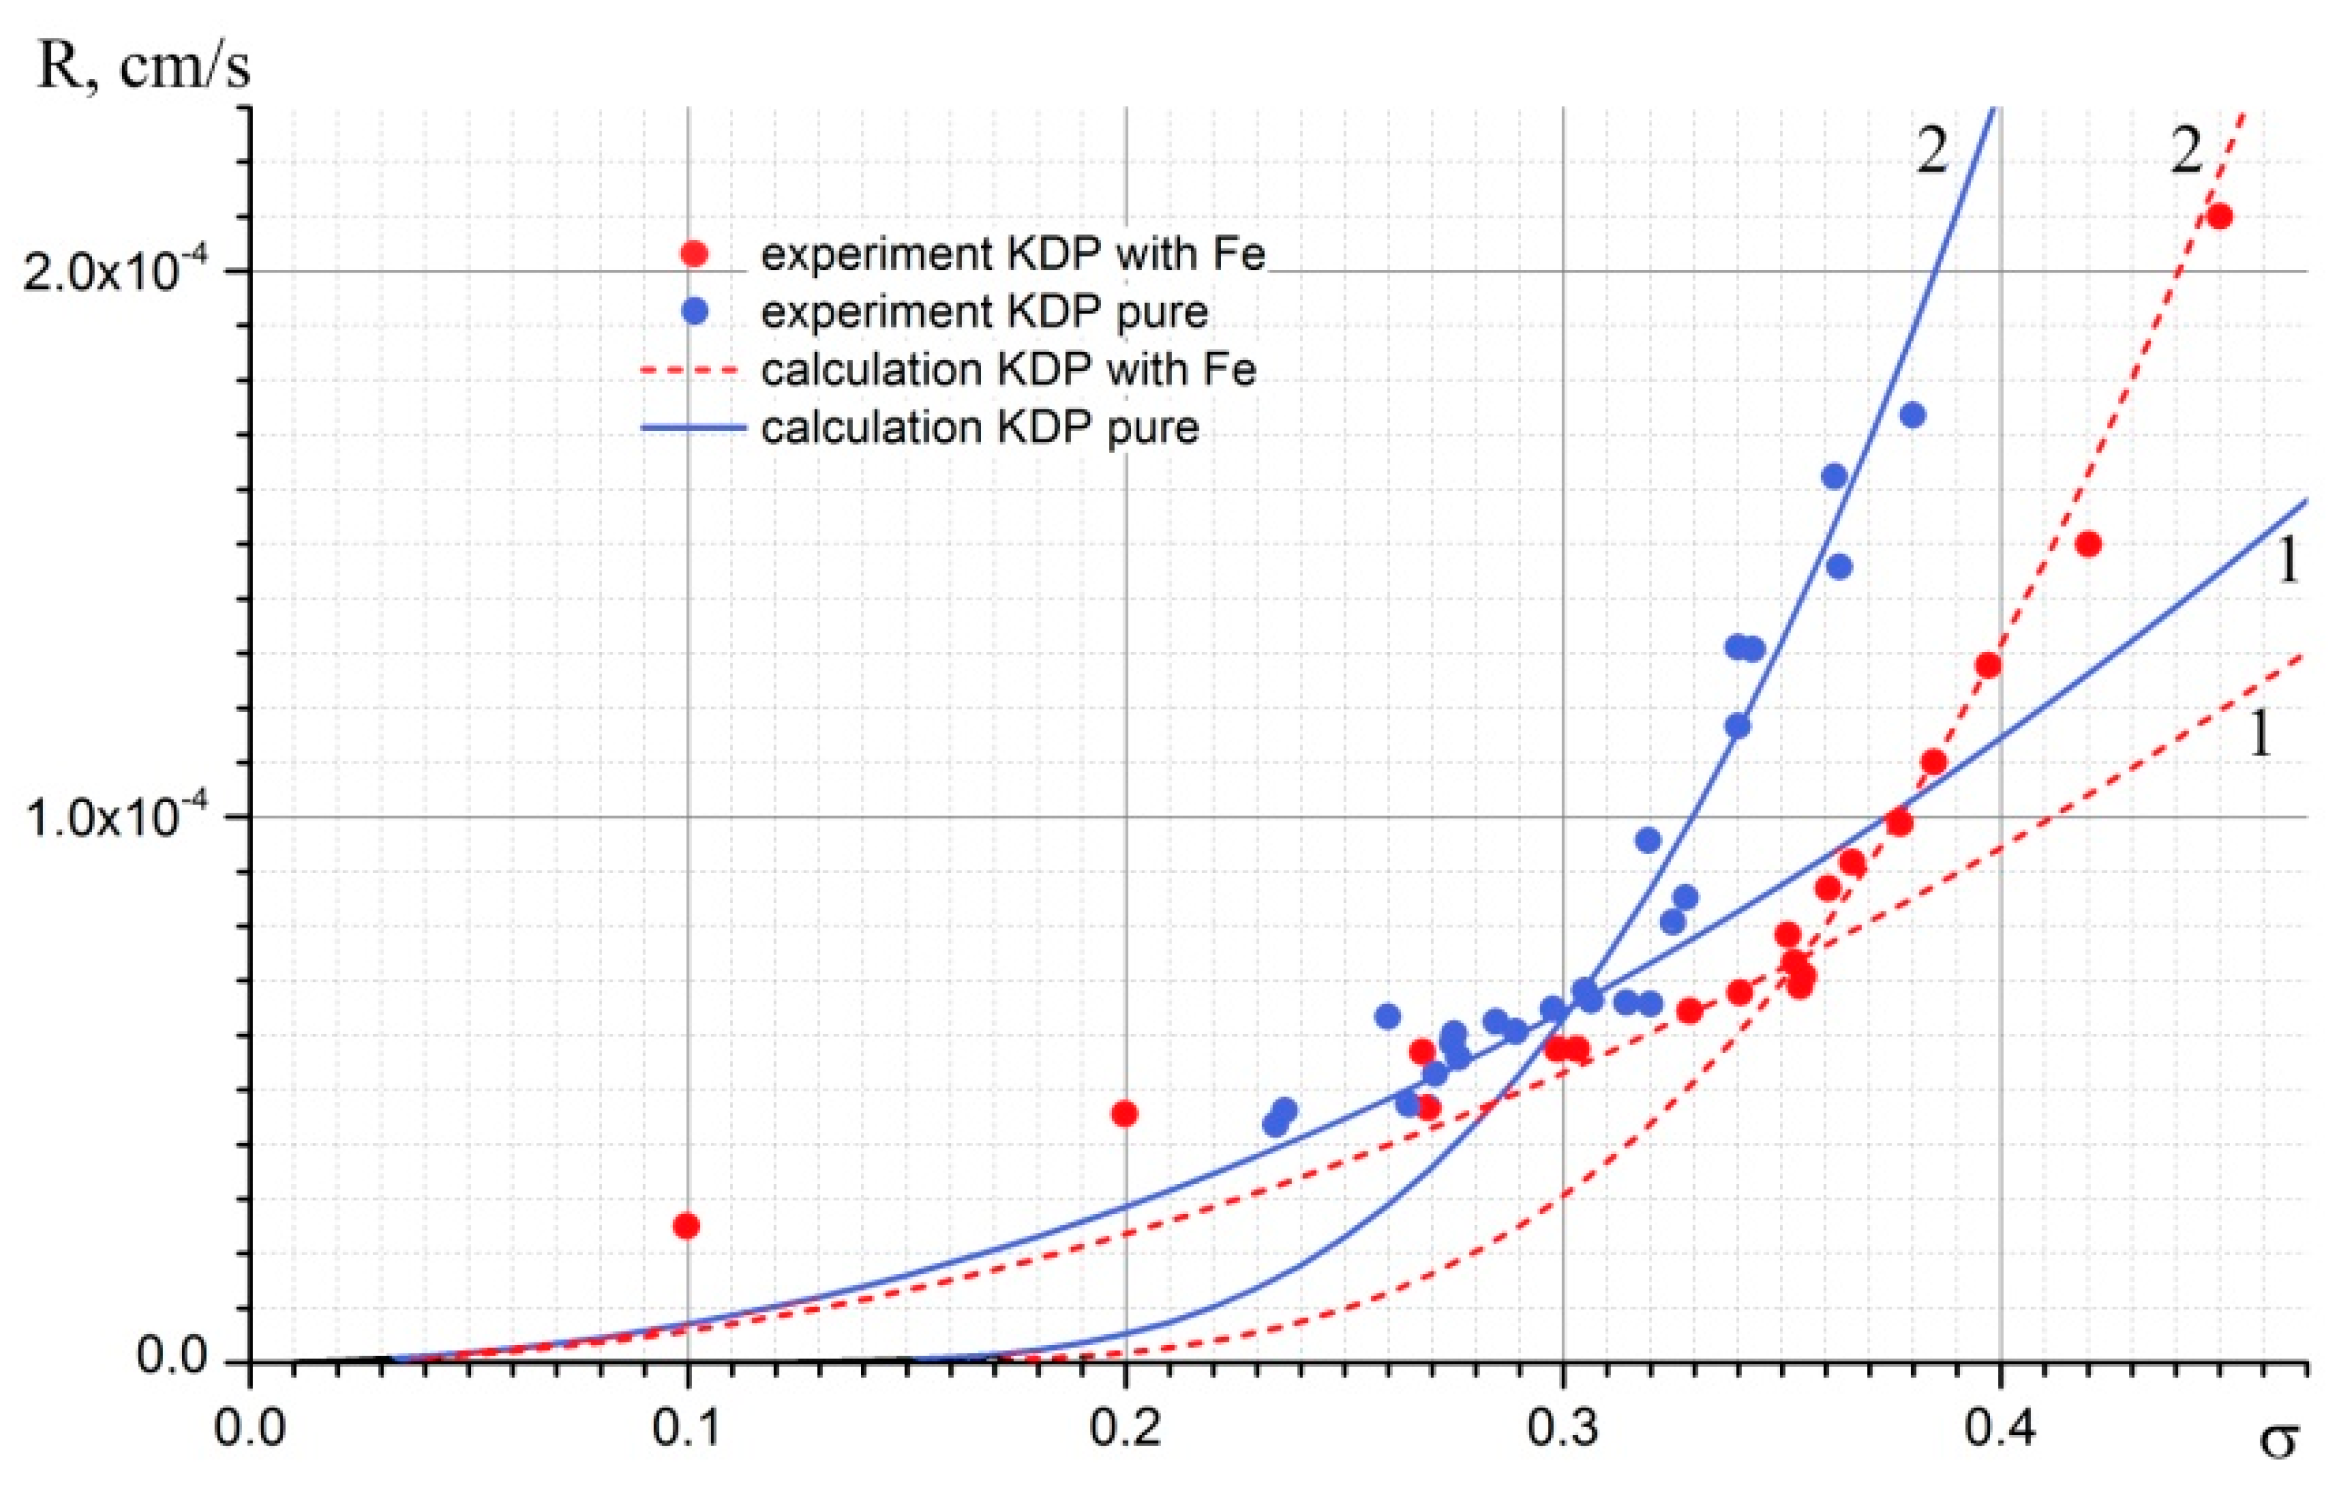
Figure 6 presents experimental data R = f(σ) for pyramid face of KDP crystals grown from pure and Fe-doped aqueous solutions and calculated kinetic curves, which will be discussed later.
The face normal growth rate at 2D nucleation is expressed by the formula (6) [
26]. Ω = 9.68 × 10
−23 cm
3, and for pyramid face h = 5 × 10
−8 cm [
41],
In case of a dislocation–spiral growth mechanism and a complex dislocation source (dislocation beam consists of N dislocations, the perimeter of the source is
2L), the normal growth rate of the face is expressed by formula (10) [
16].
To plot calculated kinetic curves corresponding to the both growth mechanisms, it is necessary to know the kinetic coefficient for the pyramid face (β) and the surface energy of the pyramid face step end (α). But, these values are unknown for the pyramid face of the KDP crystal. In [
41], data are given for the surface energy of the prism faces of KDP and ADP crystals. These values are very close and equal to ~20 erg/cm
2, as well as for the surface energy of the ADP pyramid face (~17 erg/cm
2). So, we can assume that, for the pyramid face of the KDP, the α will be approximately the same. However, the values of the surface energy of the pyramid faces for KDP and ADP crystals may differ, since the surfaces of the pyramid faces in these crystals are formed only by alkaline cations: in the first crystal by potassium cations, in the second by ammonium cations. We can estimate this energy from the dependence of the slope of the vicinal hillock (p) on supersaturation. In [
42], kinetic coefficients were determined for three vicinal sectors of hillock on the pyramid face of the KDP crystal: 0.01 cm/s (for the steepest), 0.026 cm/s (for the middle), 0.53 cm/s (for the most flat), and the dependence p = f(σ) for the steepest vicinal sector was plotted. From the nonlinear nature of this dependence, one can suppose that the hillock was formed by a complex dislocation source. Therefore, we needed to estimate α and the perimeter of the dislocation source L. It turned out that the best matches with experimental data are at the values α: 3.83·N (erg/cm
2) and L = 1.05 × 10
−6·N (cm), where N is an unknown number of dislocations. A reasonable value of the surface energy α of the step ends on the pyramid face is ~19 erg/cm
2 and corresponds to N = 5.
Let us take into account this α value and return to the kinetic curves we obtained. We cannot accurately determine the number of dislocations that form a vicinal hillock at the dislocation mechanism of growth. However, it is known that, at high supersaturation, the critical nucleus radius r
c decreases and, when 19
rc ≤ 2
L/
N, the dislocation hillock disintegrates. At supersaturation σ = 0.3 and t = 35 °C, the critical nucleus radius (formula (5)) is [
26]
= 2.9 nm.
So, with high probability, the calculated curve for the spiral growth should be described by the formula (9) for a simple dislocation source.
As the conditions of all experiments including the Fe concentration were the same, it is possible to determine α and β values suitable for the both formulae (6) and (9). Since the dislocation growth α is in the denominator and β is in the numerator of the formula, for the normal growth rate R of the pyramid face the dependence, R(σ) is approximately similarly sensitive to changes of both α and β parameters. But, in the case of 2D nucleation in the expression for R, the β is a cofactor and α is included in the exponent, so the dependence becomes very sensitive to the change of α. In this case, it was more difficult to choose the values of α and β, but it was possible to do this. For doped solutions, obtained values were β = 0.011 cm/s, α = 22.2 erg/cm2; for undoped solutions the kinetic coefficient for the pyramid face was β = 0.011 cm/s and the surface energy of the step end had differed significantly and was α = 20.8 erg/cm2.
At the obtained values of α and β, the calculated kinetic curves coincide with the experimental data with the least squares. In the case that the α deviates from the obtained values by ±0.4 erg/cm
2, the variation of β is ±0.01 cm/s. Then, the least square criterion is not met, but both kinetic curves (for both growth mechanisms) still lie within intervals of experimental values. If the deviation of α from the obtained values is more than ±0.4 erg/cm
2 then, at any values of β, it is not possible to draw kinetic curves so that both of them fall into the interval of experimental values, i.e., the calculated kinetic curves will go beyond the location of the experimental points. The obtained values of α and β should not be taken as accurate values of the surface energy of the step end and the kinetic coefficient. First, we cannot say for sure that the spiral growth was carried out only on single dislocations; this is just our assumption. Second, formula (6) has never been confirmed experimentally. There are only evidences that it predicts the correct course of the dependence of R on σ [
24,
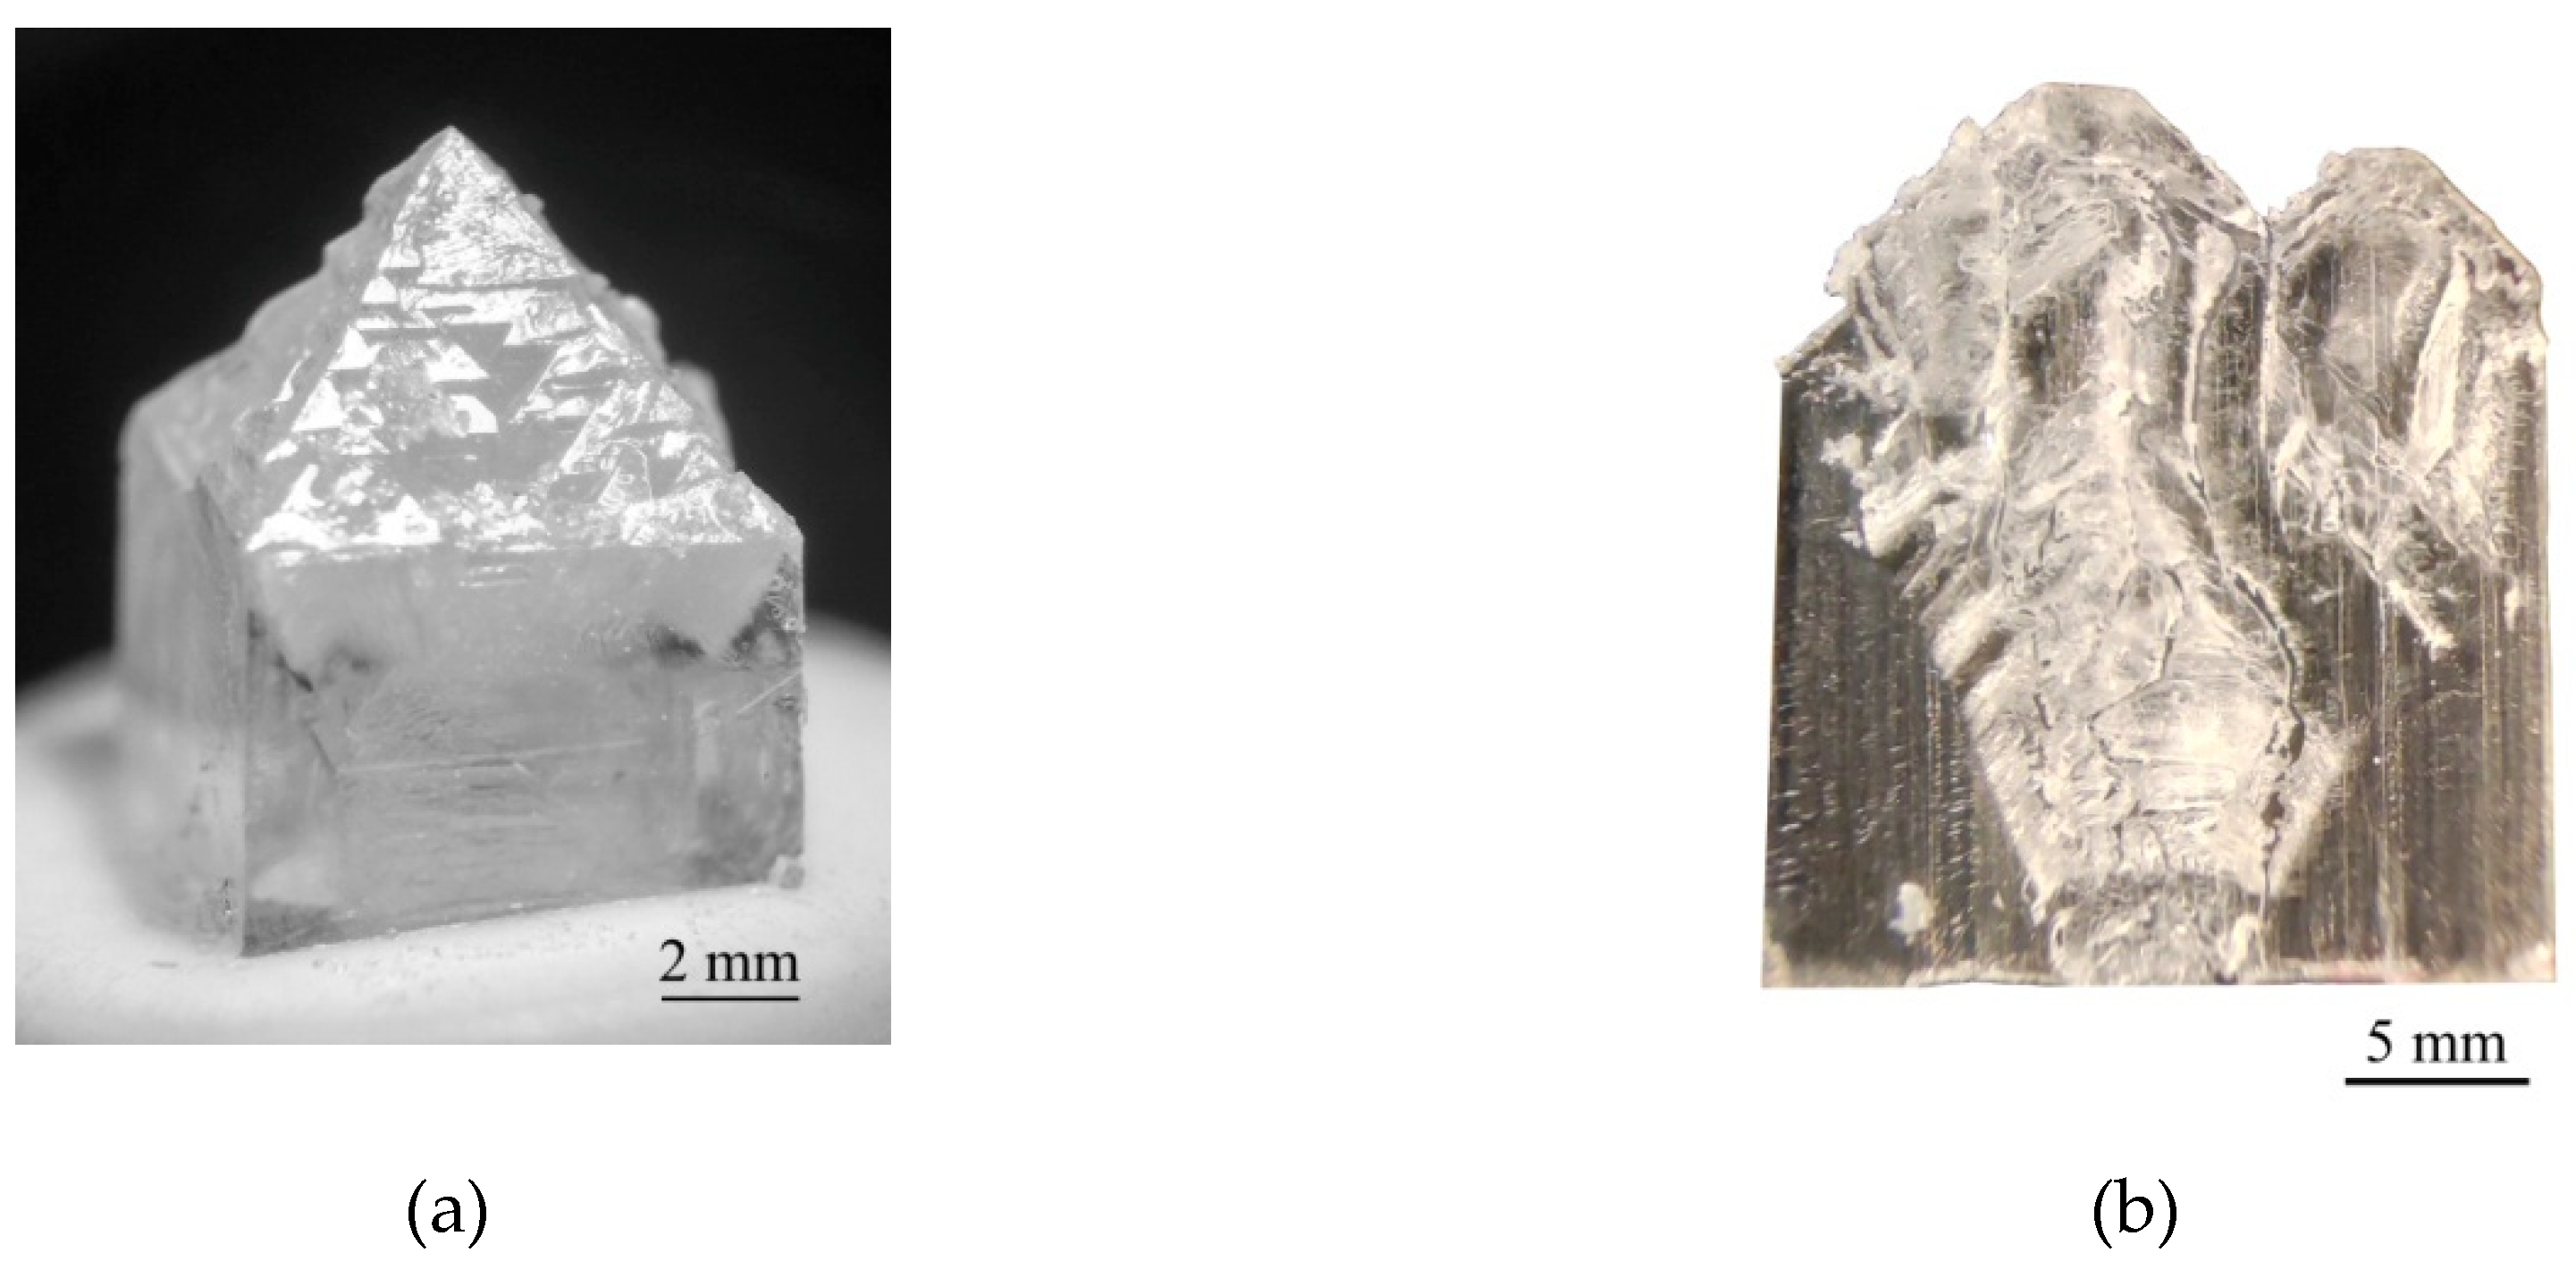
25]. Thirdly, the growth mode was not kinetic (the speed of the solution movement relative to the crystal was ~3 cm/s), so the supersaturation at the growing crystal face was noticeably less than in the volume. The values of α and β were necessary in order to draw kinetic curves and to find the range of supersaturation in which the change of the leading growth mechanism occurs. In addition, a similar way of estimating of these parameters for doped and undoped crystals allows to demonstrate that with the Fe adding to the solution the kinetic coefficient seems to change a little, and the surface energy of the step end changes noticeably. It is for this reason the point of the growth mechanism change for undoped and doped solutions corresponds to different supersaturation. For doped solutions, it was determined as σ = 0.345 (
Figure 7a). At higher supersaturation (
Figure 7b), the structure of the whole pyramid is fully broken. In undoped solutions the pyramid face became fragmentary at σ = 0.325.
The face can become fragmentary because, for 2D nucleation, so many nuclei can fall on the growing face that the steps from them do not have time to reach the edges of the crystal face, while more and more nuclei fall out. This means that the crystal surface will lose its flatness and its relief will correspond to the supersaturation distribution over the face. According to [
25], for the prism faces, the transition to the 2D nucleation occurs at very high supersaturation (~0.46). We failed to achieve stable crystal growth under such conditions, so the kinetic curves for the prism sector have not yet been obtained.
4.6. Study of the Supersaturation Influence on Fe3+ Concentration in the Prism Sector of KDP Crystals
We have found only three papers concerning determination of the Fe
3+ effective distribution coefficients in KDP crystals [
7,
8,
43]. In the described experiments, the maximum Fe
3+ content in the solution did not exceed 3 ppm.
We have determined the values of the trivalent iron (K
Fe3+) effective distribution coefficients in the {100} growth sectors of KDP crystals grown from high-doped Fe
3+ (up to 70 ppm) solutions in a range of supersaturations σ = 0.3–0.4 for the first time. The obtained K
Fe3+ dependence on normal growth rates of the prism sectors shown in
Figure 8a is in good agreement with the dependence obtained by Voronkov for the effective impurity capture coefficient (K) for crystal growth by the dislocation mechanism [
44]:
where
K0 is the impurity equilibrium volume distribution coefficient;
Ks is the equilibrium distribution coefficient of the impurity in the surface crystal layer;
R is the normal rate of growth faces;
h is the height of the elementary step; and
Dic is the diffusion coefficient of impurity in the crystal.
The Voronkov model [
44] takes into account the ratio of the crystal growth rate and the impurity reverse diffusion rate from the near-surface growth layers to the surface ones. At low growth rates, when R <<
Dic/h, the volume distribution coefficient tends to be thermodynamically equilibrium. Otherwise, at high supersaturation values, the role of diffusion relaxation becomes insignificant and almost all the surface impurity immured by growth steps remains in the crystal (
K ≈ Ks).
Our studies of the growth of pyramid sector over a wide range of supersaturations revealed that the morphology of the pyramid surface becomes very unstable when passing to 2D nucleation. It is manifested in inclusion formation and in strong roughness of the faces. So, at ultrahigh supersaturation, ferric iron could be incorporated into solution inclusions, which are many in the pyramid sector. This can explain the absence of interdependence between the normal growth rate and of the effective distribution coefficient Fe
3+ (
Figure 8b).
5. Conclusions
It was determined that high concentration of trivalent iron cations (50 ppm) in the KDP solution significantly increases the metastable zone width of solution. A series of crystals were grown from KDP solutions with Fe3+ concentration from 0.9 to 70 ppm in different temperature and hydrodynamic regimes at supersaturation up to 0.45. KDP: Fe3+ crystals with Fe3+ content in the prism growth sector equal to 102 ppm were grown for the first time.
The real structure study of grown KDP: Fe3+ crystals by X-ray topography made it possible to determine the preferred growth regimes for crystals growing.
The transmittance spectra of prism sectors with ferric concentrations up to 102 ppm were obtained for the first time. It was found that all studied KDP crystals with Fe3+ content of more than 60 ppm have an absorption band edge of 330–340 nm and can be used as optical filters for suppressing UV-C and UV-B ranges.
It was shown that the point of the growth mechanism change for undoped and doped solutions corresponds to different supersaturation. For doped solutions it was determined as σ = 0.345 (CFe = 50 ppm). In undoped solutions, σ = 0.325.
The values of effective distribution coefficients of ferric iron (KFe3+) for the prism growth sector of KDP crystals grown from high-doped Fe3+ solutions (up to 70 ppm) were found for the first time.
So, the possibility of growing high-doped KDP: Fe3+ crystals from oversaturated solutions opens the way to the doping of other water-soluble crystals. The reaching of ultra-high supersaturations makes it possible to grow crystals from highly doped solutions. A high impurity concentration, in turn, leads to an increase in the stability of solutions to spontaneous nucleation, and therefore provides the ability to grow crystals at even higher supersaturations.


