Article

Synthesis and Characterization of Nanocrystalline ZnO Doped with Al3+ and Ni2+ by a Sol–Gel Method Coupled with Ultrasound Irradiation

by
M. J. Robles-Águila
1,*,
J. A. Luna-López
1,
Álvaro D. Hernández de la Luz
1,
J. Martínez-Juárez
1 and
M. E. Rabanal
2
1
Benemérita Universidad Autónoma de Puebla, Instituto de Ciencias, Centro de Investigación en Dispositivos Semiconductores, Ciudad Universitaria, C.P. 72570 Puebla, Mexico
2
Universidad Carlos III de Madrid e IAAB, Av. Universidad 30, 28911 Leganés, Madrid, Spain
*
Author to whom correspondence should be addressed.
Crystals 2018, 8(11), 406; https://doi.org/10.3390/cryst8110406
Submission received: 19 September 2018 / Accepted: 30 September 2018 / Published: 29 October 2018
(This article belongs to the Section Crystalline Materials)

Abstract

:
Zinc oxide is one of the most important semiconducting metal oxides and one of the most promising n-type materials, but its practical use is limited because of both its high thermal conductivity and its low electrical conductivity. Numerous studies have shown that doping with metals in ZnO structures leads to the modification of the band gap energy. In this work, Al-doped ZnO, Ni-doped ZnO, and undoped ZnO nanocrystalline powders were prepared by a sol–gel method coupled with ultrasound irradiation, and the results show the influence of Al3+ and Ni2+ ions in the ZnO network. The doping concentrations in ZnO of 0.99 atom % for ZnO–Al and 0.80 atom % for ZnO–Ni were obtained by X-ray Fluorescence (XRF). X-ray Diffraction (XRD) and Raman Spectroscopy showed a decreased intensity and broadening of main peaks, indicating metallic ions. The crystallite size of the sample was decreased from 24.5 nm (ZnO) to 22.0 nm (ZnO–Al) and 21 nm (ZnO–Ni). The textural and morphological properties were analyzed via Nitrogen Adsorption (BET method) and Field Emission Scanning Electron Microscopy (FESEM).

Graphical Abstract

1. Introduction

Zinc oxide (ZnO) is a binary II–VI semiconductor compound with a hexagonal wurtzite structure and n-type electrical conductivity, with a direct energy wide band of 3.37 eV and an exciton binding energy of 60 meV [1,2]. This semiconductor has high chemical, mechanical, and thermal stabilities at room temperature, a low electrical constant, a high electrochemical coupling index, a wide range of radiation absorption, and high photostability, all of which make it attractive for potential use in electronics, optoelectronics, and laser technology [3].
ZnO is a transparent, ceramic, conducting oxide with interesting electrical and optical properties. Doped ZnO powders have several applications that include their use as photocatalysts, ferromagnets, semiconductors, and piezoelectric and solar cells. This material has low resistivity and good optical gap energy at low temperatures, and is transparent in the visible region of the electromagnetic spectrum [4].
Many studies have been devoted to analyzing doped ZnO due to its several applications: solar cells, sensors, photoelectronic devices, diodes (LEDs), UV lasers, photocatalysts, field emitters, and spintronic and piezoelectric devices. Foreign metallic ions incorporated into the ZnO crystal lattice can modify the electronic properties of this semiconductor. On the other hand, some studies have focused on doped ZnO films and powders prepared by several techniques such as sol–gel processes [5], chemical bath deposition techniques [6], solvothermal methods [7], coprecipitation [8], hydrothermal synthesis [9], sputtering [10], spray pyrolysis methods [11], microwave methods [12], sonochemical methods [13], mechanochemical methods, microemulsion, and combustion synthesis [3]. The incorporation of aluminum and nickel ions into ZnO can be achieved by different methods. Rajeh et al. studied the conductivity of doped ZnO using different metallic ions of groups II and III (In3+, Al3+, Ga3+, B3+, Cu2+, Cd2+, and Ni2+) and suggested that conductivity is attributed to native defects or oxygen vacancies and zinc interstitial defects [14]. Moreover, some authors reported that the presence of Co2+ and Mn2+ in the matrix of ZnO enhances the magnetic properties [7,15,16]. Additionally, the reports show a correlation between the oxide semiconductor doped with transition metals and the metals’ electronic structure in the d orbitals [17]. The transition metals have been potential candidates for use in doped ZnO to modify the electronic band structure and to study their applications in semiconductor spintronic devices, spin-polarized light-emitting diodes, magnetic tunnel junctions, and photovoltaic cells and sensors [18,19]. Metallic ion doping increases the number of free electrons by replacing Zn2+ in the ZnO crystal lattice structure and thereby modifying the electronic properties of the oxide semiconductor.
This paper aims to dope ZnO samples with Al+3 and Ni2+ by a sol–gel method assisted by ultrasound irradiation, also referred to as sonochemistry. The physical phenomenon responsible for the sonochemical process is acoustic cavitation due to sonic-radiation-generated implosive collapse of bubbles, increasing the temperature (5000 to 25,000 K). For this reason, the ultrasound can break the bonds in substances, making reaction times shorter in comparison with conventional heating. The process starts with the creation of the nucleation center for their later growth and to obtain the nanocrystalline materials.
The samples were annealed at 450 °C to improve their physical properties and raise their crystallinity. We studied the effect of metallic ion substitution on the structural network and morphological properties of ZnO as the effect of ultrasound irradiation in the sol–gel process for obtained nanomaterials. By performing a Rietveld refinement of the ZnO crystal structure, we found that incorporating Al3+ and Ni2+ into ZnO slightly changed the cell parameters and network volume.
In this paper, a sol–gel method coupled with ultrasound irradiation was used to obtain ZnO and doped ZnO, decreasing the reaction time and forming nanocrystalline materials. The ultrasound irradiation provides a short reaction time compared with traditional methods and produces high temperatures and pressures that favor the formation of nanostructured materials [20]. We suggest that the use of ultrasound might assist the incorporation of metallic ions into ZnO to change the morphological, electrical, structural, textural, and optical properties.

2. Materials and Methods

2.1. Synthesis of Powders

Every chemical reagent used in the experiments was obtained from commercial sources as guaranteed-grade reagents and used without further purification. The undoped and doped ZnO nanoparticles were synthesized by a sol–gel method coupled with ultrasound. The sources of Zn2+, Al3+, and Ni2+ were zinc acetate dihydrate (Zn(CH3COO)2·2H2O, Baker ACS, NJ, USA), nickel (II) chloride hydrate Puratronic (NiCl2·6H2O, Alfa Aesar, Haverhill, MA, USA, 99.995%), and aluminum chloride (AlCl3, Fermont, Monterrey, México, 99.4%), respectively. The zinc acetate dihydrate was dissolved in methanol (CH3OH, J. T. Baker, NJ, USA 99.96%), and deionized H2O, ratio 1:1 using an ultrasound bath until a clear and homogeneous solution with a molar ratio of 0.5 M was obtained. This solution was adjusted to pH 8 by slow addition of NH4OH until the sol was obtained [21]. Next, this mixture was magnetically stirred for 1 h. Lastly, ultrasound irradiation over 30 min at intervals of 2 s was applied using an ultrasonic processor from Sonics & Materials Inc. (Newton, CT, USA) with a replaceable tapered microtip (3 mm) operated at 750 W and 20 kH. The precipitate was filtered, then washed with deionized water several times; finally, it was washed with ethanol to get rid of any byproducts and excessive start materials, as well as to eliminate salts obtained from precipitation processes. The obtained gel was kept at room temperature to allow gelification over 72 h until a xerogel was attained. Then, the samples were ground in an agate mortar and heated in air in alumina crucibles in a muffle furnace (Prendo model MF) at 450 °C for 12 h. To obtained ZnO doped with Al3+ and Ni2+, the corresponding aqueous metal salt solution was incorporated into the precursor solution ZnO separately. The dopants used were 2.0 atom %, and the same procedure described above was followed to obtain the doped ZnO.

2.2. Characterization

XRD measurements were carried out using a Bruker D8 Discover (Bruker, Billerica, MA, USA) with Cu Kα1 radiation (λα1 = 1.5406 Å). Data were collected over the 2θ range of 20–80° with a step size of 0.02. The phase composition of the samples was determined using the Powder Diffraction File PDF+4 from the ICDD (International Centre of Diffraction Data) [22]. Phase identification and Rietveld refinement of the cell parameters were determined using the High Score Plus Software including Powder Diffraction File PDF+4 from the ICDD. Input data for the Rietveld refinement (space group, cell parameters, and atomic positions) were taken from T. M. Al-Saaid et al. [23]. A background was modeled using a polynomial approach, and a pseudo-Voigt function was used for the profile form. Then, a zero shift; a scale factor; unit cell parameters; U, W, and V profile coefficients; and shape and asymmetric parameters were refined.
Al3+ and Ni2+ content in the doped powders were determined by wavelength-dispersive X-ray fluorescence (WDXRF) using a Bruker S8 Tiger spectrometer Discover (Bruker, Billerica, MA, USA). The quantification of metal ions was realized with the Quant-Express method before calibration of equipment. This measurement was carried out after preparation of 5 mm diameter pellets with an applied pressure of 3.5 t cm2.
Optical transmission spectra were recorded using a Varian Cary 400 Scan Spectrophotometer (Agilent, Santa Clara, CA, USA) equipped with a Harrick DR accessory in a wavelength range of 200–800 nm. Teflon was used as a standard for the baseline. Raman spectra were measured with a Horiba JOBIN-YVON spectrophotometer (Horiba, Kyoto, Japan).
BET surface area was measured by nitrogen adsorption at 77 K using an Autosorb-1 (Quantachrome Instruments, Boynton Beach, FL, USA) after out-gassing at 398 K for 12 h. Morphological evaluation of the samples was carried out with a Field Emission Scanning Electron Microscope (FESEM) (Hitachi SU-70, CREST DIT, Dublin, Ireland). The photoluminescence spectra were obtained using a NanoLog Spectrofluorometer Horiba NanoLog Model FL-1057 (Horiba, Kyoto, Japan). The samples were excited at 375 nm using a He–Cd laser at an angle of 30° and a Newport’s HPF fluorescence filter (Newport Corporation, Owen, CA, USA).

3. Results and Discussion

3.1. Structure from XRD Patterns and Raman Spectra

Figure 1 shows the XRD powder patterns of ZnO, ZnO–Al, and ZnO–Ni compared with PDF files of hexagonal (00-0361451) reported phases for ZnO. Diffraction peak characteristics correspond to the hexagonal wurtzite structure of ZnO in both doped samples with a preferential orientation along the (101) plane in every sample, as reported by Guruvammal et al. [24]. The additional secondary phases of nickel oxides or aluminum oxides were observed, but the intensities of these phases were very low compared with those of ZnO. We suggested that phases are impurities of process because appear in all diffractograms.
The inset in Figure 1 shows the main peak (101), where we can observe a shift towards lower angles and decreased-intensity peaks due to an increased microstrain induced by the presence of foreign ions [25]. Kaneva et al. report variation of the FWHM due to the presence of Ni2+ affecting the crystallization process by inhibiting the aggregation of the ZnO nanocrystals [26].
Similarly, Yadav et al. reported that the peak broadening is attributed to stress or particle size variation due to the presence of other atoms in the network [27]. Theoretically, since the ion radii have a coordination number of 4 (tetragonal site), Al3+ (0.053 nm) and Ni2+ (0.069 nm) radii are smaller than those of Zn2+ (0.074 nm) [28,29]. Therefore, it is easy for Al3+ and Ni2+ ions to substitute for Zn2+ ions in the ZnO lattice due to the slight difference between the ionic radii.
The nominal values of crystallite size were determined with a PDF+4 2018 (Power Diffraction File) module using every diffraction peak. Crystalline sizes of 22.0 nm for ZnO–Al and 21.0 nm for ZnO–Ni, which are smaller than that of ZnO (24.5 nm) obtained under the same conditions, were observed. P.K. Sharma et al. reported a decrease in crystallite size due to the incorporation of a foreign impurity promoting the suppression of nucleation and the subsequent growth rate due to metal ions. These results indicate that the presence of metal ions affects crystallite size [28]. By performing a Rietveld refinement of the crystal structure of the samples, we found that the Al3+ and Ni2+ incorporation into ZnO slightly changed the cell parameters. Furthermore, Table 1 shows the refined cell parameters for doped samples, taking the ZnO sample as a reference point. We consider only the hexagonal phase in carrying out this refinement.
The results of the nominal values of composition of doped ZnO confirmed the obtained undoped and doped ZnO (see Table 1) with Al3+ and Ni2+ respectively.
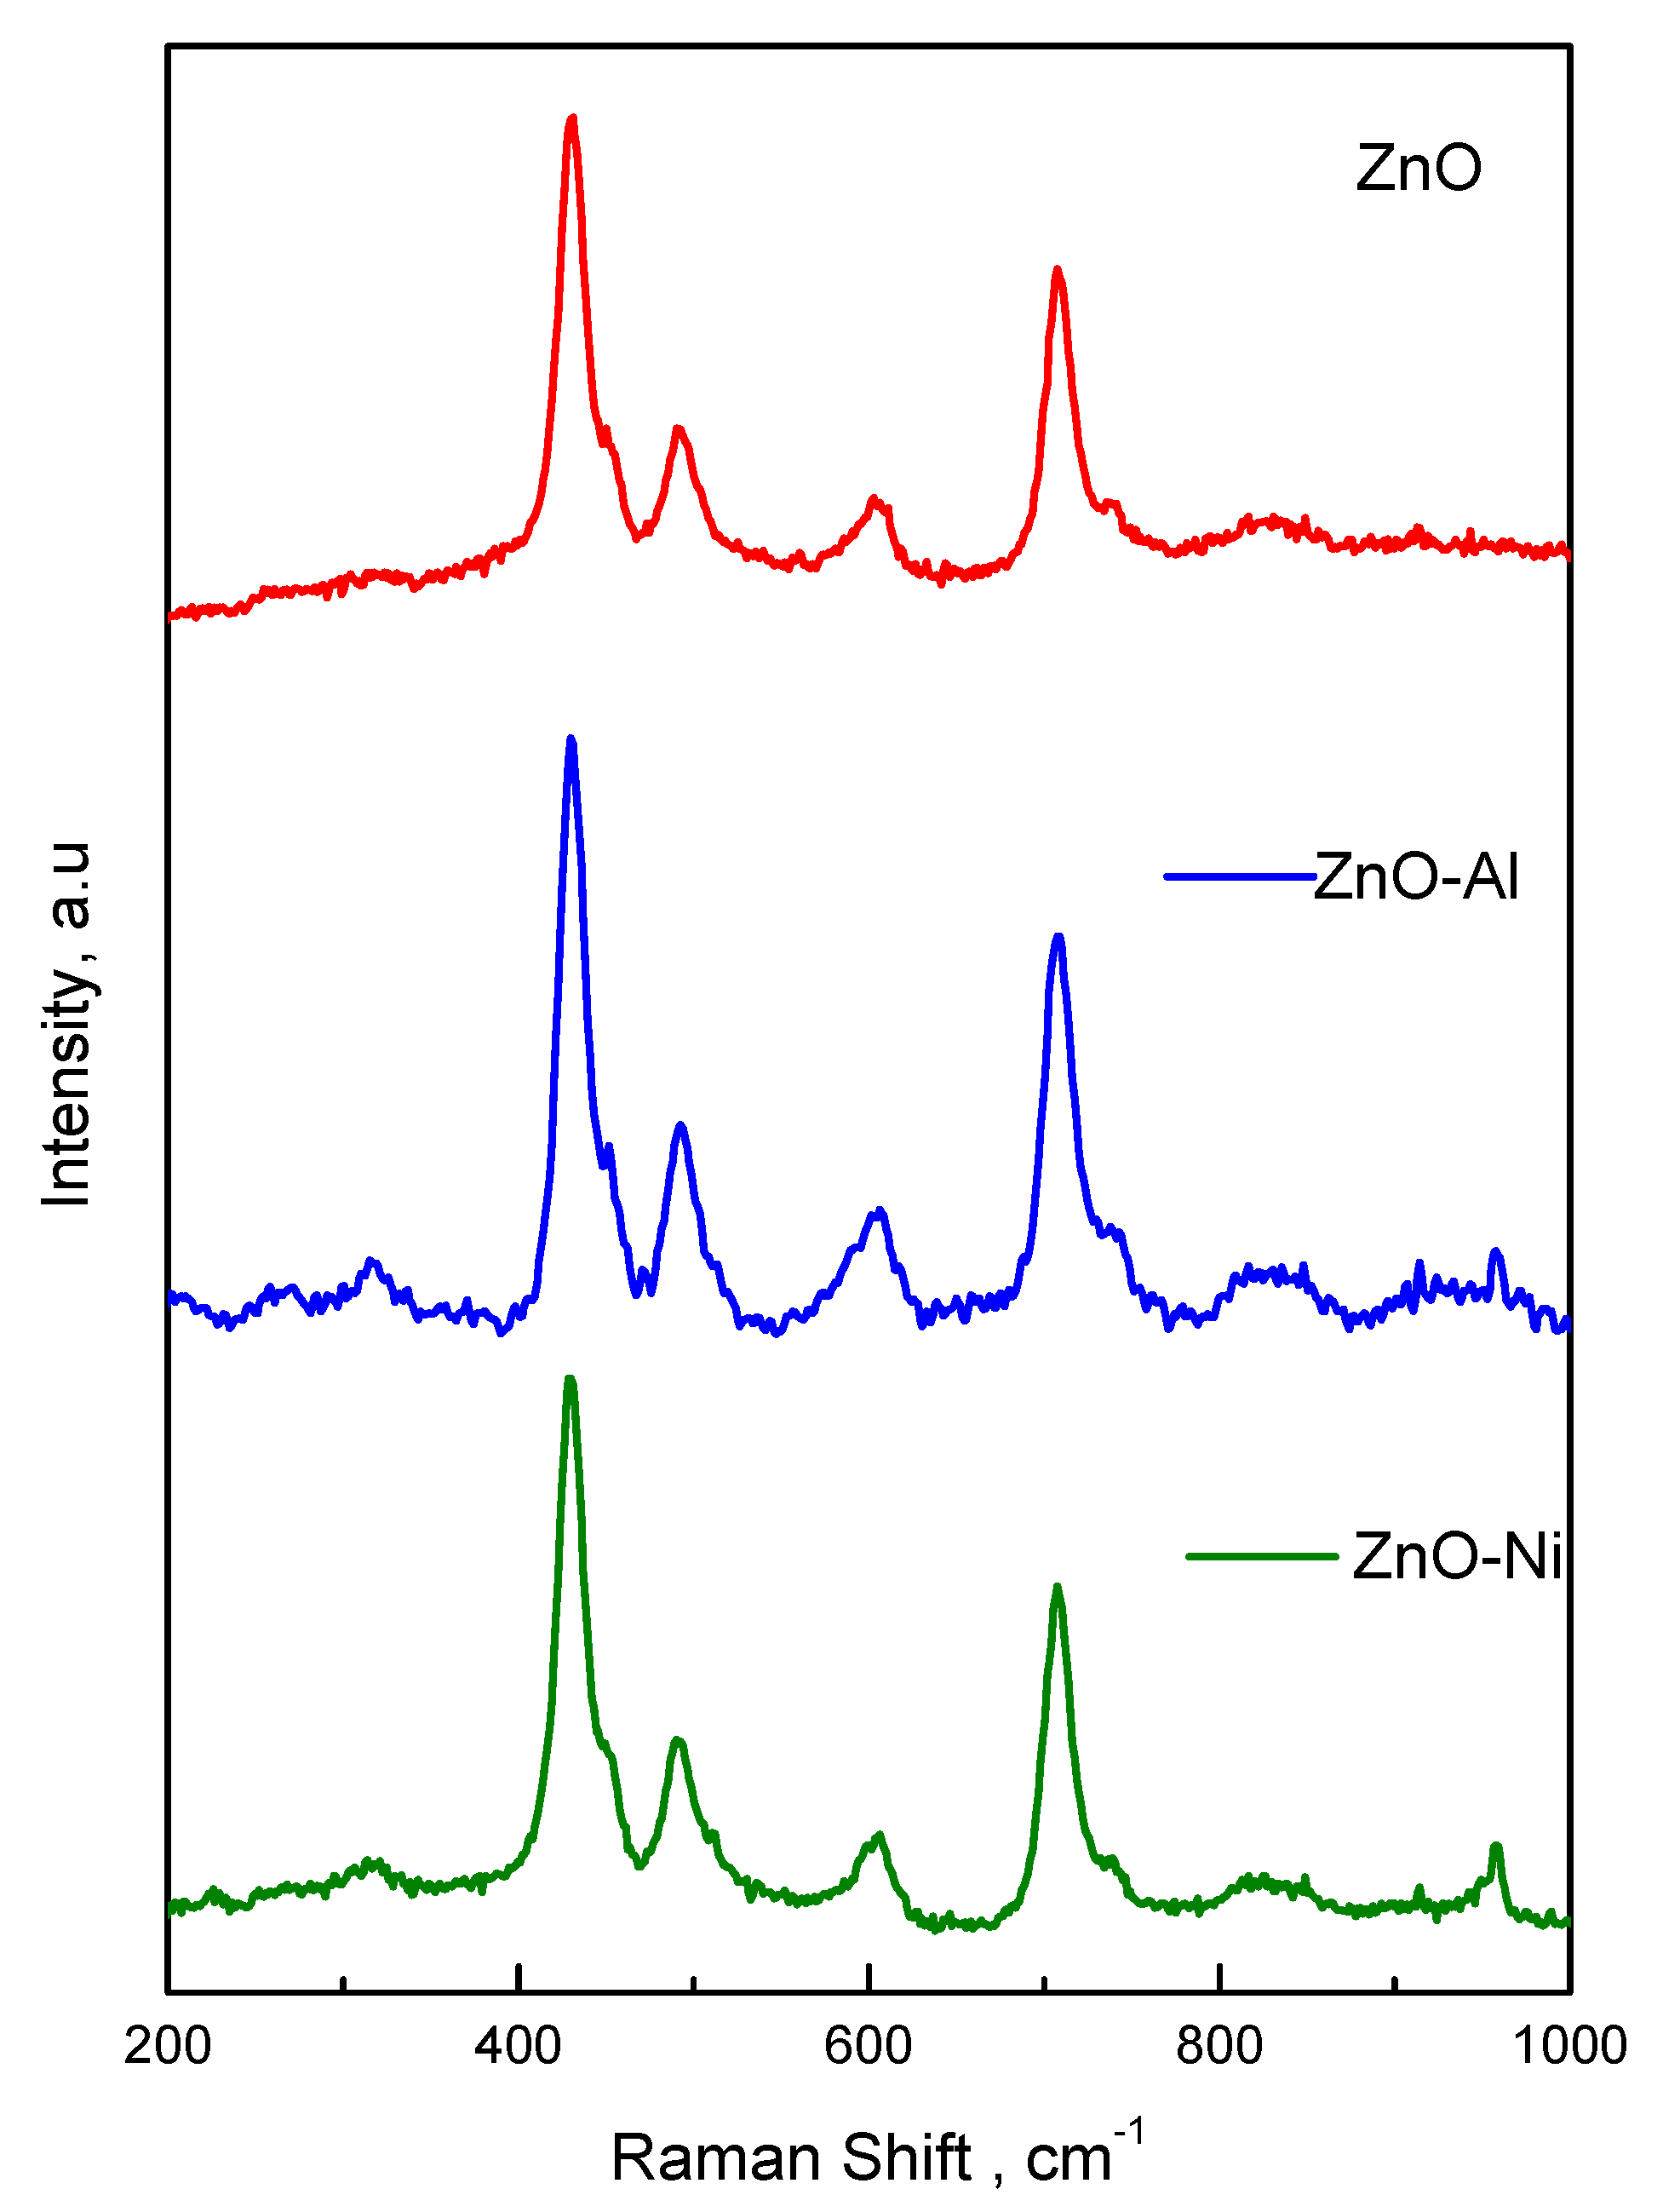
Raman spectra were recorded (Figure 2) under the same conditions for every sample. This technique is known to be susceptible to the local structure of ions, and it is now generally accepted that the positions and half-widths of the hexagonal bands are influenced by the preparation method, impurities, and oxygen vacancies [17,27]. Raman active modes of the wurtzite structure (space group P63mc) in the ZnO phase have six first-order vibrational modes, named A1, E1, 2E2, and 2B1, and are expected to appear near the point of their first Brillouin zone [30]. Raman spectra of ZnO, ZnO–Al, and ZnO–Ni showed peaks at 429 cm−1, 490 cm−1, 604 cm−1, and 707 cm−1. An irrelevant broadening of the ZnO–Al and ZnO–Ni bands can be observed in comparison to those of the pure ZnO. The broadening of band E1 may occur due to oxygen vacancies originated by the incorporation of Al3+ and Ni2+ ions into the hexagonal lattice. This result agrees with those reported by Luthra and Sayari [28,31].

3.2. Optical Properties

Figure 3 shows optical transmittance spectra of undoped and doped ZnO in the range 300–600 nm. The optical transmittance in the visible range was 85–90% but decreased in the presence of metallic ions. The band gaps determined for ZnO and doped ZnO were 3.60 (ZnO), 3.44 (ZnO–Al), and 3.39 (ZnO–Ni) eV. This shift to the red may be attributed to quantum confinement effects [19,32]. Most authors have observed that transition metal ions might additionally introduce d–d transitions into the UV–Vis spectra if the samples are present in a suitable oxidation state [1,17,33]. In the ZnO–Ni sample, the absorption band gap was shifted to higher wavelengths due to interband transitions from the valence band A2g to the T2g level of Ni2+ (3d8, 3A2g, 3T2g) by Ni2+. However, Al3+ increases free electrons by replacing Zn2+ in the ZnO network structure, hence generating conductivity in the semiconductor [31].
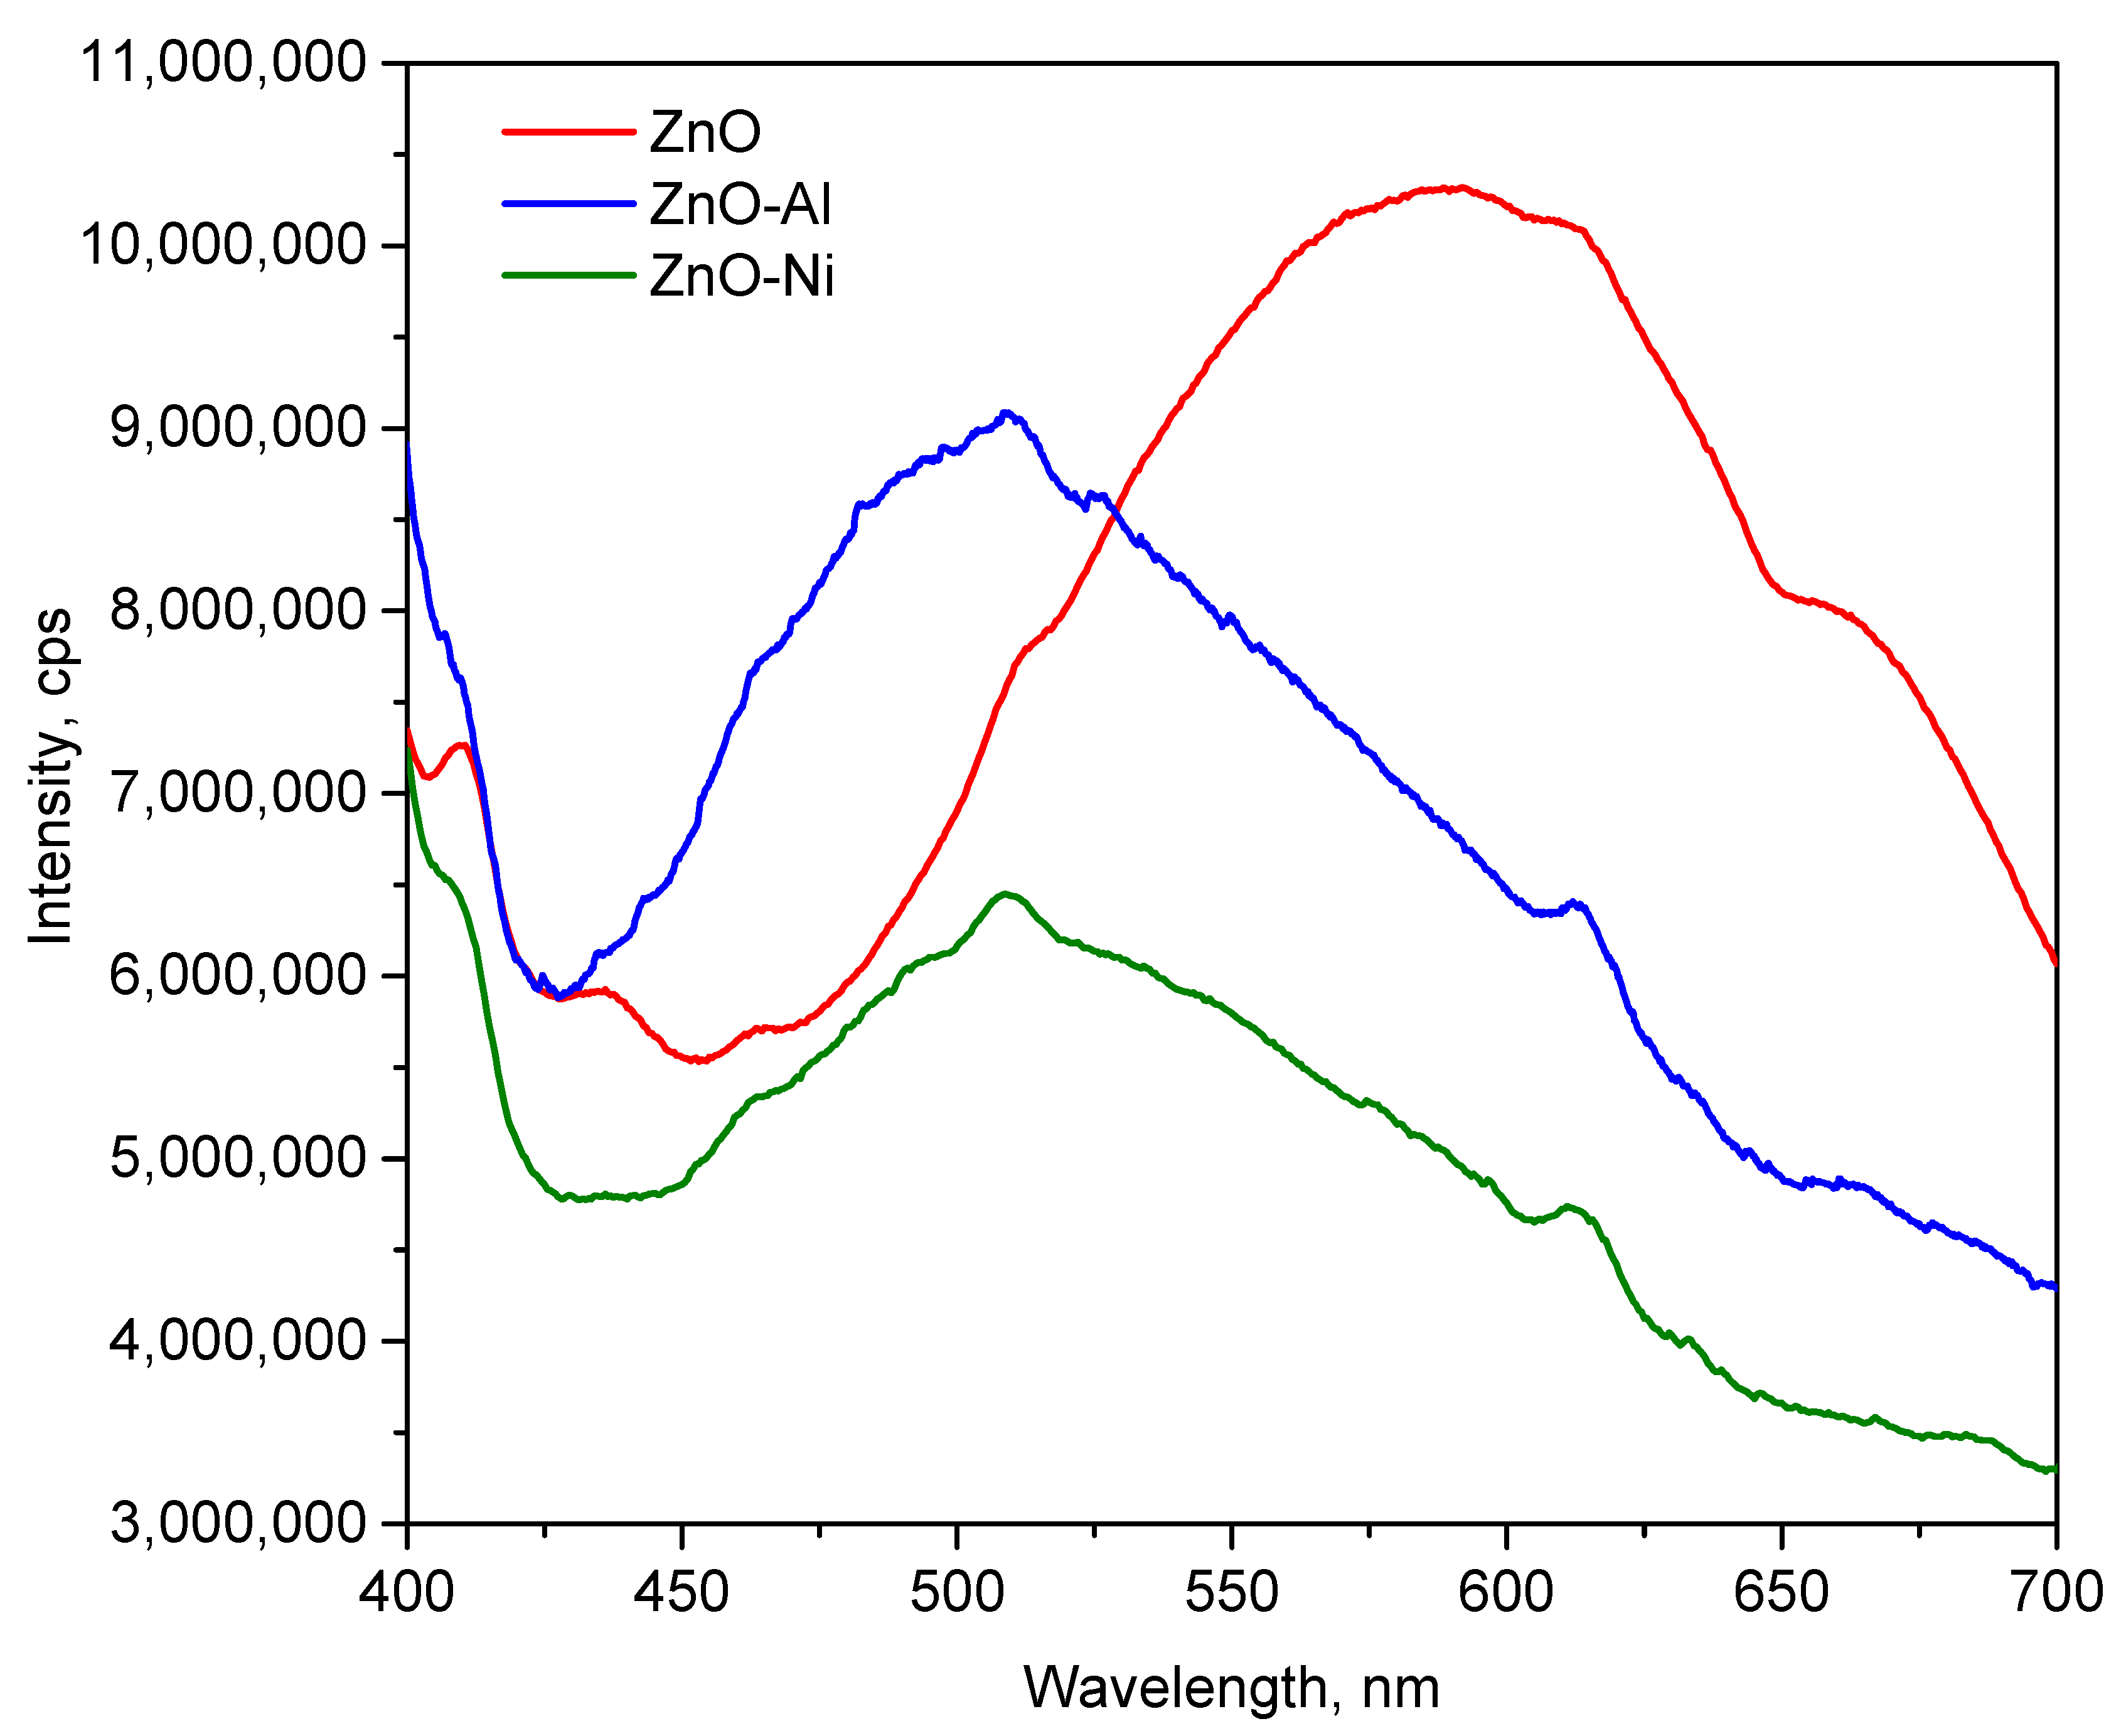
In Figure 4, photoluminescence spectra of the undoped and doped ZnO samples show a broad and intense emission spreading from 425 to 650 nm with an emission at 590 nm, while doped ZnO samples show that a shift at the 509 nm band is attributed to the presence of metal ions introduced by crystal defects such as oxygen vacancies because there are changes in the electronic band structure. This agrees with Samadi et al., who reported that the oxygen vacancies enhanced the photogeneration of electron–hole separation efficiency [1].

3.3. Surface Morphological Studies

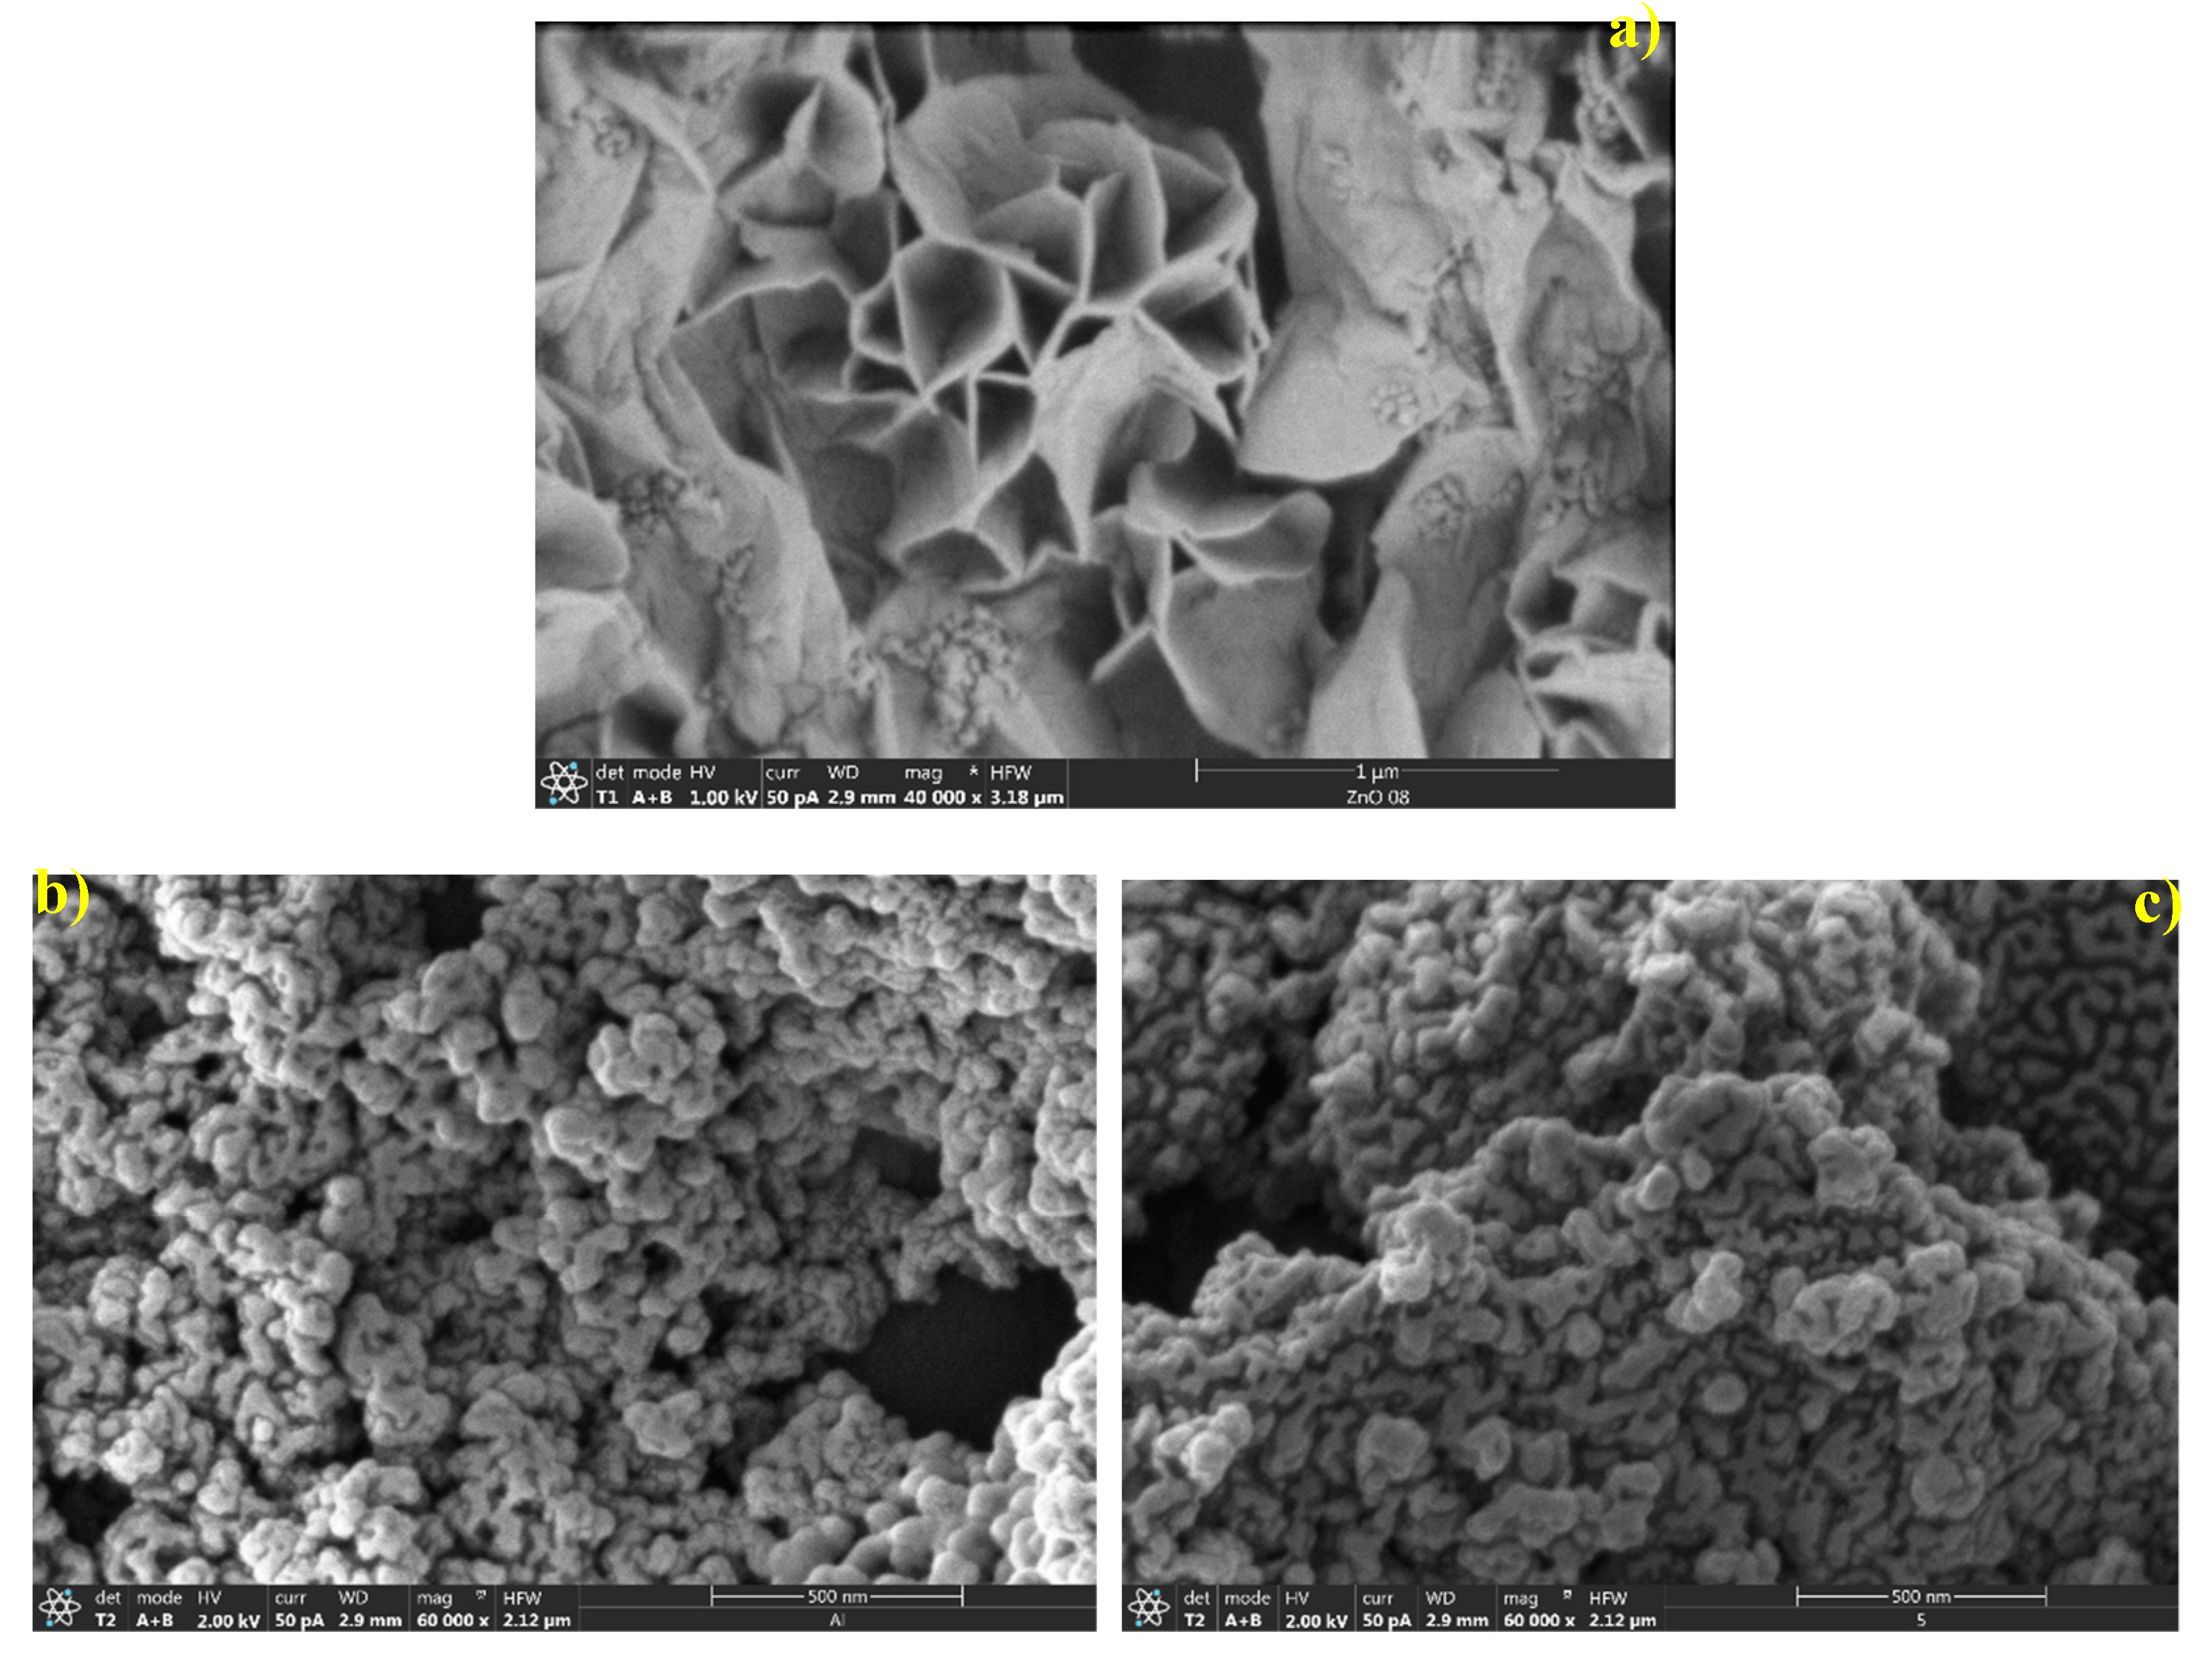
Figure 5 shows the FESEM micrograph of ZnO, where we can see that the oxide semiconductor was formed by aggregates and sheets. In contrast, ZnO–Al and ZnO–Ni samples show agglomerate formations of spherical nanoparticles. We suggest that metal ions changed the surface shape of the ZnO nanoparticles, the crystal size [1], and the mechanism of aggregation of nanoparticles. Therefore, the SEM images imply that ion incorporation was one of the factors affecting the surface morphology.

3.4. Textural Properties

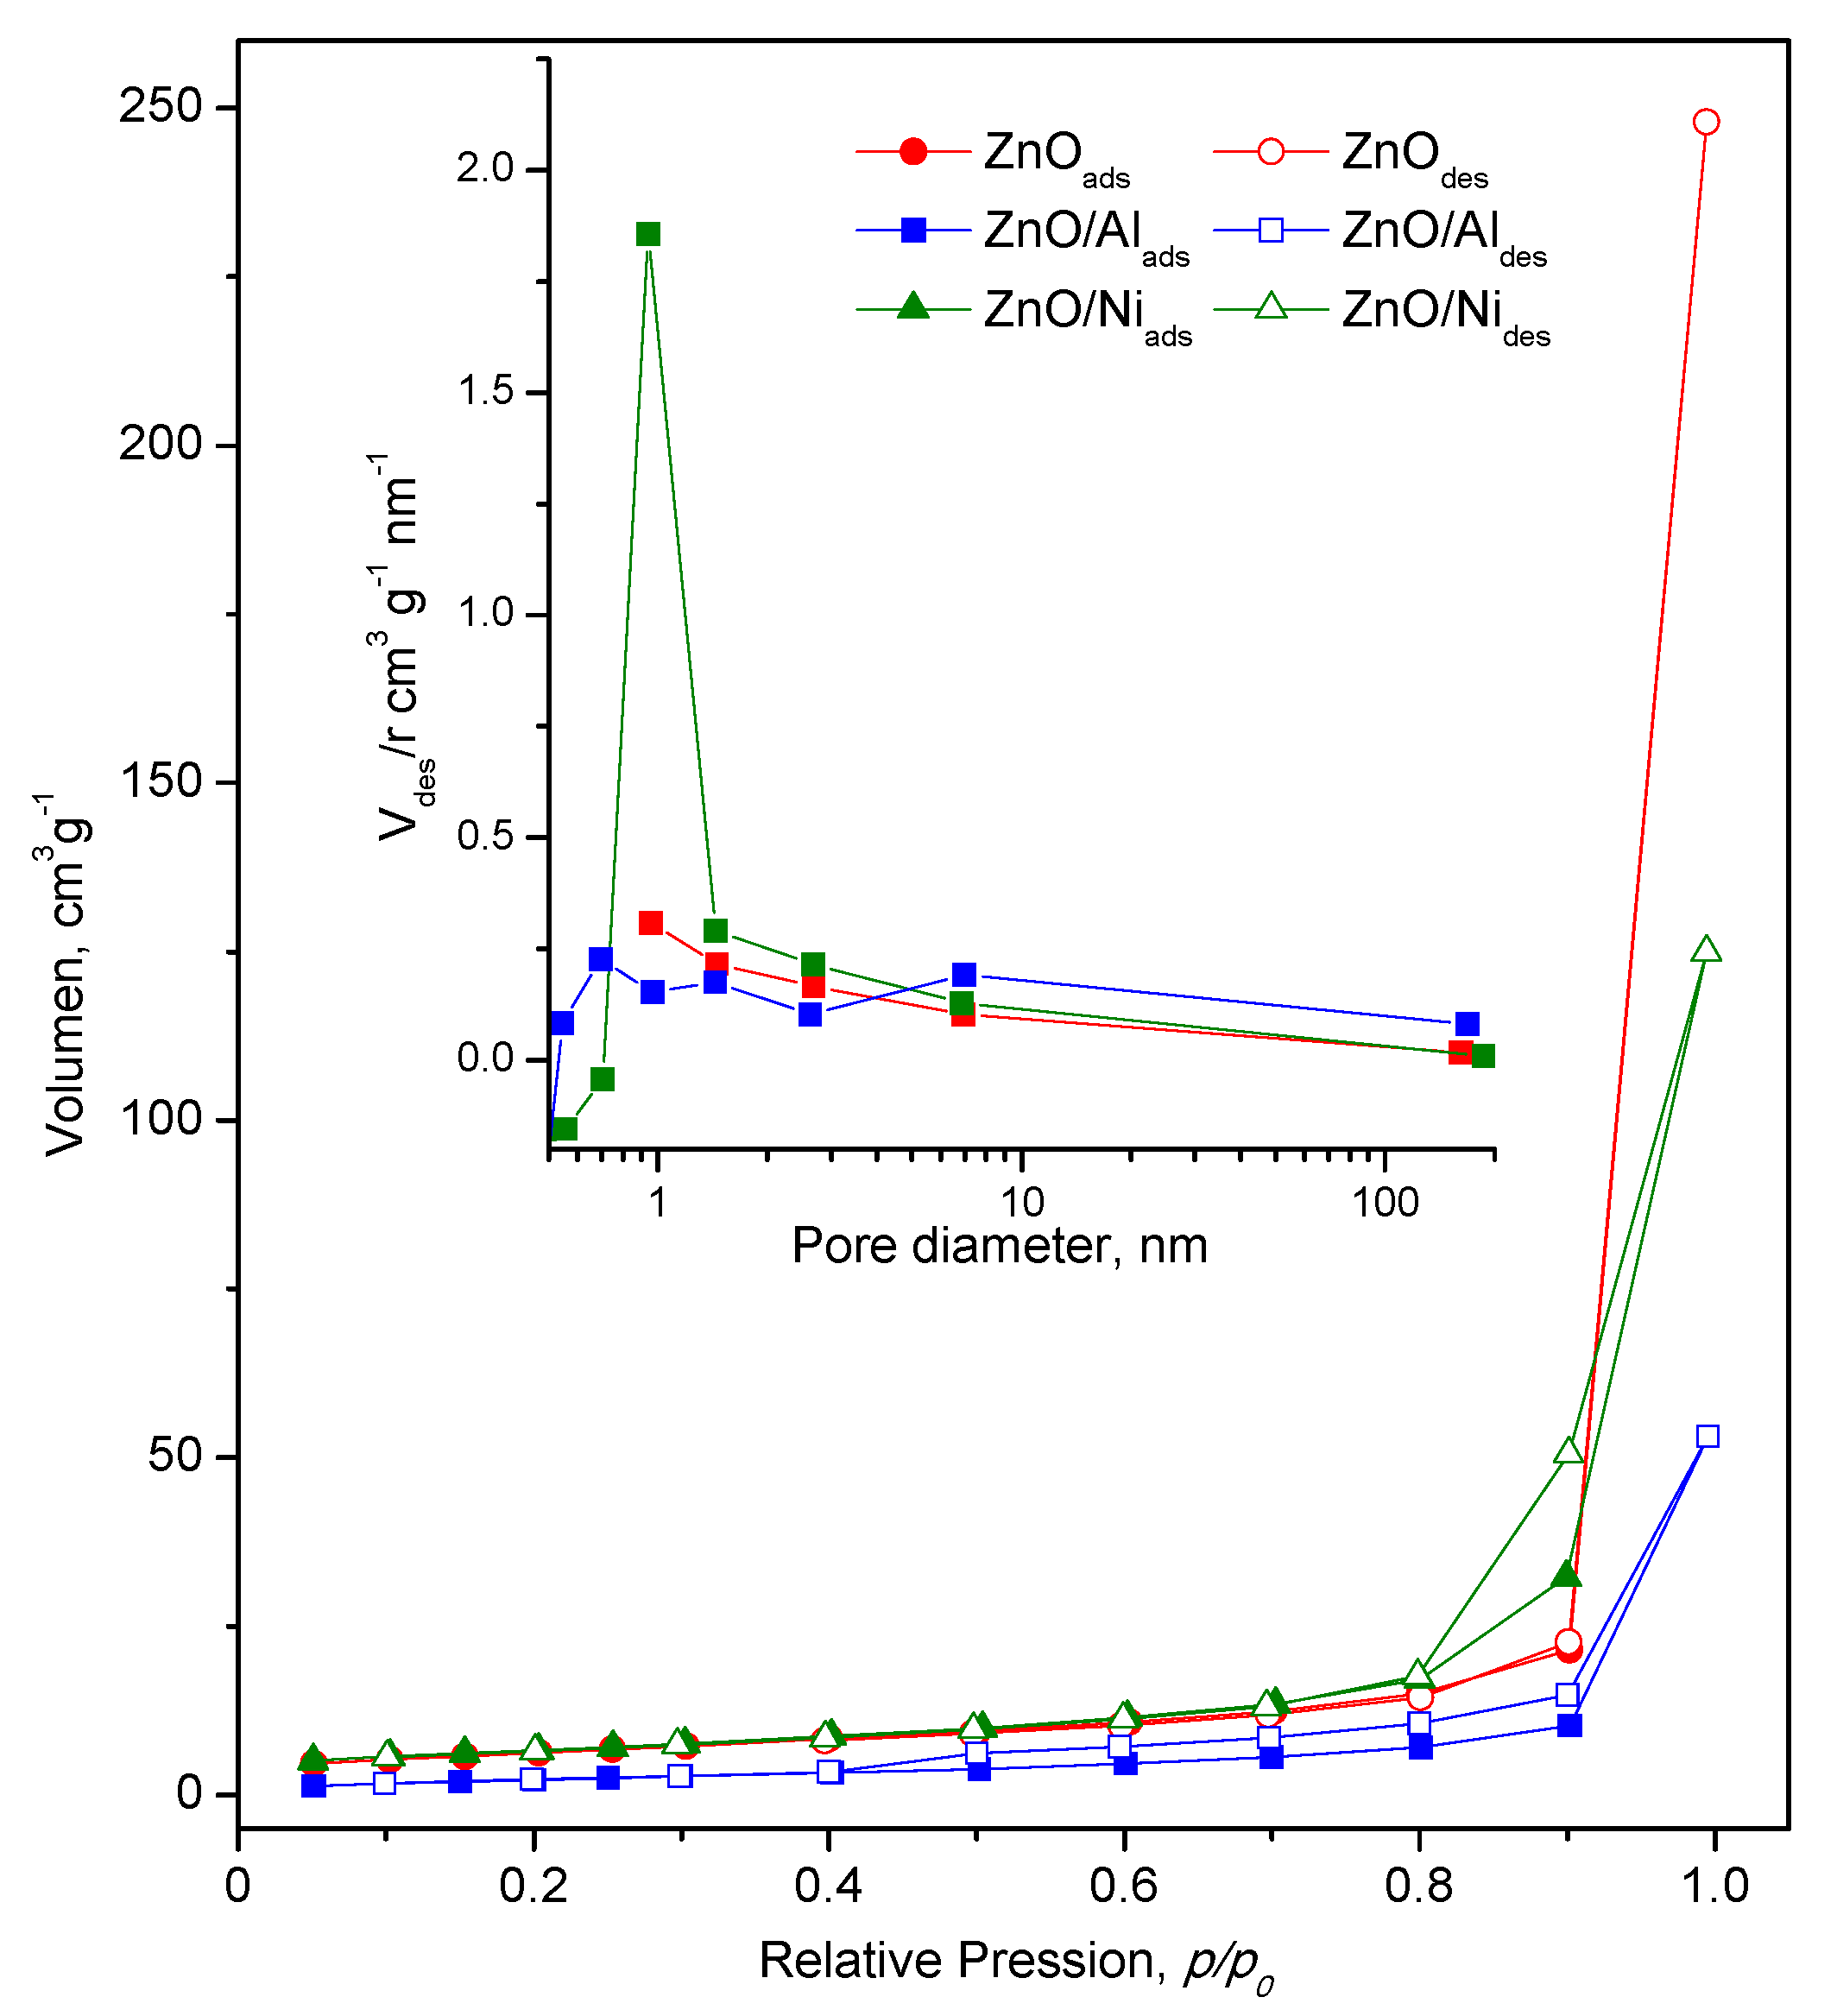
The effect of aluminum and nickel doping on the textural characteristics of the powders prepared by a sol–gel method assisted by ultrasound irradiation was investigated by measuring N2 adsorption–desorption isotherms. Figure 6 shows the isotherm and pore size distribution of the doped samples; these isotherms exhibited a narrow hysteresis loop of type H3 and a type II isotherm that may have been related to the agglomeration and slit-shaped spaces. In contrast with the pure ZnO, the isotherm was IUPAC type II without a hysteresis loop due to formation of plate-like particles. The specific surface area (SBET) and other textural parameters are compiled in Table 1. We suggest that the mesoporosity developed in the samples could have been affected by the ultrasonic irradiation promoting the incorporation of aluminum and nickel into the network of the wurzite phase. Assuming that the particles are spheres, the average particle diameter is D p ¯ = 6000 / S e s p   δ , where δ is the density in g cm−3 [34]. For ZnO, this was calculated to be 48.6 nm; the value for ZnO–Al is 46.50 nm and the value for ZnO–Ni is 118.8 nm. These results show a significant difference between the average pore diameter and the average particle diameter due to the development of plate-like particles in aggregates of shape semispherical of and slit-shaped spaces, according to the results obtained by SEM.

4. Conclusions

We describe a highly reproducible preparation of doped ZnO (Al3+ and Ni2+) and undoped ZnO powders obtained by sol–gel coupled with ultrasonic irradiation for a reaction time of 30 min, which is short compared with the reaction times in other reports. The metal ion incorporation into the crystal structure of ZnO induces significant changes in morphological, optical, and structural properties. The optical transmittance of the powders was greater than 80%. The optical direct band gap of films decreased from 3.60 to 3.44 and 3.39 eV. Finally, the doped ZnO nanocrystals obtained show plate-like aggregates due to the presence of doped ions.

Author Contributions

M.J.R.-Á. performed experiments and characterizations, analyzing the data and wrote the paper, M.E.R., J.M.-J. and J.A.L.-L. were made formal analysis and visualization, Á.D.H.d.l.L. participated in the writing and final editing of the manuscript. All authors read and approved the paper.

Funding

The authors of this paper wish to thank Advanced Nanostructured Materials and Applications Network for its support via Secretaría de Educación Pública (SEP).

Acknowledgments

Author M.J.R.-Á. wishes to thank the Powder Technology at Universidad Carlos III (UC3M) for its support and assistance in carrying out the experimental section. We are also grateful to Cristina Moral for her professional assistance (Laboratory SEM: UC3M) and Juan José Vilatela for his support in carrying out Raman Spectroscopy measurements at the IMDEA Materials Laboratory and A. Méndez-Blas for his assistance in the Photoluminiscence Spectroscopy measurements at the IFUAP Laboratory.

Conflicts of Interest

The authors declare no conflict of interested in this paper.

References

  1. Samadi, M.; Zirak, M.; Naseri, A.; Khorashadizade, E.; Moshfegh, A.Z. Recent progress on doped ZnO nanostructures for visible-light photocatalysis. Thin Solid Films 2015, 605, 2–19. [Google Scholar] [CrossRef]
  2. Morko, H.; Özgur, U. Zinc Oxide: Fundamentals, Materials and Device Technology; Wiley-VCH Verlag GMBH&Co: Weinheim, Germany, 2009; ISBN 9783527408139. [Google Scholar]
  3. Kolodziejczak-Radzimska, A.; Jesionowski, T. Zinc oxide—from synthesis to application: A review. Materials 2014, 7, 2833–2881. [Google Scholar] [CrossRef] [PubMed]
  4. Gahtar, A.; Benramache, S.; Benhaoua, B.; Chabane, F. Preparation of transparent conducting ZnO:Al films on glass substrates by ultrasonic spray technique. J. Semicond. 2013, 34, 073002. [Google Scholar] [CrossRef]
  5. Mamat, M.H.; Khusaimi, Z.; Zahidi, M.M.; Mahmood, M.R. ZnO nanorod arrays synthesised using ultrasonic-assisted sol-gel and immersion methods for ultraviolet photoconductive sensor applications. Nanorods 2012, 250. [Google Scholar] [CrossRef]
  6. Son, N.T.; Noh, J.; Park, S. Role of ZnO thin film in the vertically aligned growth of ZnO nanorods by chemical bath deposition. Appl. Surf. Sci. 2016, 379, 440–445. [Google Scholar] [CrossRef]
  7. Lojkowski, W.; Gedanken, A.; Grzanka, E.; Opalinska, A.; Strachowski, T.; Pielaszek, R.; Tomaszewska-Grzeda, A.; Yatsunenko, S.; Godlewski, M.; Matysiak, H.; et al. Solvothermal synthesis of nanocrystalline zinc oxide doped with Mn2+, Ni2+, Co2+ and Cr3+ ions. J. Nanopart. Res. 2009, 11, 1991–2002. [Google Scholar] [CrossRef]
  8. Shinde, K.P.; Pawar, R.C.; Sinha, B.B.; Kim, H.S.; Oh, S.S.; Chung, K.C. Optical and magnetic properties of Ni doped ZnO planetary ball milled nanopowder synthesized by co-precipitation. Ceram. Int. 2014, 40, 16799–16804. [Google Scholar] [CrossRef]
  9. Soomro, M.Y.; Hussain, I.; Bano, N.; Lu, J.; Hultman, L.; Nur, O.; Willander, M. Growth, structural and optical characterization of ZnO nanotubes on disposable-flexible paper substrates by low-temperature chemical method. J. Nanotechnol. 2012, 2012, 251863. [Google Scholar] [CrossRef]
  10. Siddheswaran, R.; Netrvalová, M.; Savková, J.; Novák, P.; Očenášek, J.; Šutta, P.; Kováč, J.; Jayavel, R. Reactive magnetron sputtering of Ni doped ZnO thin film: Investigation of optical, structural, mechanical and magnetic properties. J. Alloy. Compd. 2015, 636, 85–92. [Google Scholar] [CrossRef]
  11. Than Htay, M.; Hashimoto, Y.; Momose, N.; Ito, K. Position-selective growth of ZnO nanowires by ultrasonic spray pyrolysis. J. Cryst. Growth 2009, 311, 4499–4504. [Google Scholar] [CrossRef] [Green Version]
  12. Li, D.; Wang, J.; Wu, X.; Feng, C.; Li, X. Ultraviolet-assisted synthesis of hourglass-like ZnO microstructure through an ultrasonic and microwave combined technology. Ultrason. Sonochem. 2013, 20, 133–136. [Google Scholar] [CrossRef] [PubMed]
  13. Alammar, T.; Mudring, A.-V. Sonochemical Synthesis of 0D, 1D, and 2D Zinc Oxide Nanostructures in Ionic Liquids and Their Photocatalytic Activity. ChemSusChem 2011, 4, 1796–1804. [Google Scholar] [CrossRef] [PubMed]
  14. Rajeh, S.; Mhamdi, A.; Khirouni, K.; Amlouk, M.; Guermazi, S. Optics & Laser Technology Experiments on ZnO: Ni thin fi lms with under 1 % nickel content. Opt. Laser Technol. 2014, 69, 113–121. [Google Scholar] [CrossRef]
  15. Sayari, A.; El Mir, L.; Jürgen von Bardeleben, H. Structural, EPR and optical properties of Zn0.75TM0.25O (TM = Mn, Fe, Co, Ni) aerogel nanoparticles. Eur. Phys. J. Appl. Phys. 2014, 67, 10401. [Google Scholar] [CrossRef]
  16. Rajalakshmi, R.; Angappane, S. Synthesis, characterization and photoresponse study of undoped and transition metal (Co, Ni, Mn) doped ZnO thin films. Mater. Sci. Eng. B 2013, 178, 1068–1075. [Google Scholar] [CrossRef]
  17. Özgür, Ü.; Alivov, Y.I.; Liu, C.; Teke, A.; Reshchikov, M.A.; Doǧan, S.; Avrutin, V.; Cho, S.J.; Morkoç, H. A comprehensive review of ZnO materials and devices. J. Appl. Phys. 2005, 98, 1–103. [Google Scholar] [CrossRef]
  18. Mani, G.K.; Rayappan, J.B.B. Selective detection of ammonia using spray pyrolysis deposited pure and nickel doped ZnO thin films. Appl. Surf. Sci. 2014, 311, 405–412. [Google Scholar] [CrossRef]
  19. Pal, B.; Sarkar, D.; Giri, P.K. Structural, optical, and magnetic properties of Ni Doped ZnO nanoparticles: correlation of magnetic moment with defect density. Appl. Surf. Sci. 2015, 356, 804–811. [Google Scholar] [CrossRef]
  20. Bang, J.H.; Suslick, K.S. Applications of Ultrasound to the Synthesis of Nanostructured Materials. Adv. Mater. 2010, 22, 1039–1059. [Google Scholar] [CrossRef] [PubMed]
  21. Xiong, G.; Pal, U.; Serrano, J.G. Correlations among size, defects, and photoluminescence in ZnO nanoparticles. J. Appl. Phys. 2007, 101, 024317. [Google Scholar] [CrossRef]
  22. Kabekkodu, S.N.; Faber, J.; Fawcett, T. New Powder Diffraction File (PDF-4) in relational database format: Advantages and data-mining capabilities. Acta Crystallogr. Sect. B Struct. Sci. 2002, 58, 333–337. [Google Scholar] [CrossRef]
  23. Al-saadi, T.M.; Bakr, N.A.; Hameed, N.A. Study of nanocrystalline structure and micro properties of ZnO powders by using Rietveld method. Int. J. Eng. Technol. Res. 2014, 2, 191–195. [Google Scholar]
  24. Guruvammal, D.; Selvaraj, S.; Meenakshi Sundar, S. Effect of Ni-doping on the structural, optical and magnetic properties of ZnO nanoparticles by solvothermal method. J. Alloy. Compd. 2016. [Google Scholar] [CrossRef]
  25. Ashokkumar, M.; Muthukumaran, S. Effect of Ni doping on electrical, photoluminescence and magnetic behavior of Cu doped ZnO nanoparticles. J. Lumin. 2015, 162, 97–103. [Google Scholar] [CrossRef]
  26. Kaneva, N.V.; Dimitrov, D.T.; Dushkin, C.D. Effect of nickel doping on the photocatalytic activity of ZnO thin films under UV and visible light. Appl. Surf. Sci. 2011, 257, 8113–8120. [Google Scholar] [CrossRef]
  27. Yadav, H.K.; Sreenivas, K.; Gupta, V.; Katiyar, R.S. Structural studies and Raman spectroscopy of forbidden zone boundary phonons in Ni-doped ZnO ceramics. J. Raman Spectrosc. 2009, 40, 381–386. [Google Scholar] [CrossRef]
  28. Luthra, V.; Singh, A.; Pugh, D.C.; Parkin, I.P. Ethanol sensing characteristics of Zn0.99M0.01O (M = Al/Ni) nanopowders. Phys. Status Solidi Appl. Mater. Sci. 2016, 213, 203–209. [Google Scholar] [CrossRef]
  29. Shannon, R.D. Revised effective ionic radii and systematic studies of interatomic distances in halides and chalcogenides. Acta Crystallogr. Sect. A 1976, 32, 751–767. [Google Scholar] [CrossRef] [Green Version]
  30. Phuruangrat, A.; Thongtem, S.; Thongtem, T. Ultrasonic-assisted synthesis and photocatalytic performance of ZnO nanoplates and microflowers. Mater. Des. 2016, 107, 250–256. [Google Scholar] [CrossRef]
  31. Sayari, A.; El Mir, L. Structural and optical characterization of Ni and Al co-doped ZnO nanopowders synthesized via the sol-gel process. KONA Powder Part. J. 2015, 32, 154–162. [Google Scholar] [CrossRef]
  32. Wang, N.; Yang, Y.; Yang, G. Great blue-shift of luminescence of ZnO nanoparticle array constructed from ZnO quantum dots. Nanoscale Res. Lett. 2011, 6, 338. [Google Scholar] [CrossRef] [PubMed] [Green Version]
  33. Pearton, S.J.; Norton, D.P.; Ivill, M.P.; Hebard, A.F.; Zavada, J.M.; Chen, W.M.; Buyanova, I.A. ZnO Doped With Transition Metal Ions. IEEE Trans. Electron Devices 2007, 54, 1040–1048. [Google Scholar] [CrossRef]
  34. Kuśnieruk, S.; Wojnarowicz, J.; Chodara, A.; Chudoba, T.; Gierlotka, S.; Lojkowski, W. Influence of hydrothermal synthesis parameters on the properties of hydroxyapatite nanoparticles. Beilstein J. Nanotechnol. 2016, 7, 1586–1601. [Google Scholar] [CrossRef] [PubMed] [Green Version]
Figure 1. XRD powder patterns of ZnO and doped ZnO (Al3+ and Ni2+). Powder Diffraction File (PDF) of hexagonal (00-0361451). The inset shows the broadening and decrease of the main peak (101).
Crystals 08 00406 g001
Figure 2. Raman spectra of ZnO, ZnO–Al, and ZnO–Ni samples obtained by a sol–gel method assisted by ultrasound irradiation.
Crystals 08 00406 g002
Figure 3. Optical transmission spectra of ZnO and doped ZnO nanoparticles.
Crystals 08 00406 g003
Figure 4. Photoluminescence spectra of ZnO and doped ZnO (Al3+ and Ni2+) nanoparticle samples.
Crystals 08 00406 g004
Figure 5. Field emission SEM (FESEM) images showing the morphology of nanocrystalline (a) ZnO, (b) ZnO–Al, and (c) ZnO–Ni.
Crystals 08 00406 g005
Figure 6. Nitrogen adsorption–desorption isotherms and pore size distribution curves (inset) of ZnO, ZnO–Al, and ZnO–Ni (filled symbols indicate adsorption, and open symbols indicate desorption).
Crystals 08 00406 g006
Table 1. Compositional, structural, and textural characteristics of the prepared samples.
Sample Composition (by XRF)Structural ParametersTextural Parameters
a [Å]c [Å]V [Å3]Rwp [%]% Zn% O% Ni,AlCrystallite Size t (nm)Band Gap Eg (eV)SBET (m2 g−1)Average Pore Diameter (nm)
ZnO3.252 (2)5.209 (4)47.728.4578.821.20.0021.03.6022.068.0
ZnO/Al3.252 (3)5.211 (2)47.358.2777.921.10.9922.03.4423.033.0
ZnO/Ni3.252 (1)5.211 (5)46.108.3478.021.20.8024.53.399.036.0
SBET: specific surface, Rwp: weighted profile R-factor.