Abstract
In crystallization, nanoparticle aggregation often leads to the formation of orderly structures, even single crystals. Why can nanoparticles form orderly structures and what is the mechanism dominating their orderly aggregation? These questions raise interesting research problems, but the occurrences that could answer them often fail to be directly observed, since the interaction among particles is invisible. Here, we report an attempt to discover the interaction and aggregation of building blocks through a computer simulation, focusing on the shape effect of building blocks on the aggregation. Four types of silver building blocks were selected, each consisting of (100) and (111) facets, but the ratio of these two facets was different. It was found that the area of facets played an important role in selecting the aggregation mode. The facets with a large area and high energy had a high possibility of aggregation. In addition, the effects of solvent viscosity and temperature were also investigated. High viscosity and low temperature enhanced the orderliness of aggregation. This paper reports a detailed view of the aggregation process of silver nanoparticles, which is expected to be helpful in understanding the structure evolution of materials in nonclassical crystallization.
1. Introduction
The structures of particles determine their physical and chemical properties. Silver particles with various shapes, including spheres, rods, wires, dendrites and flowers, have been constructed and show diverse properties in the fields of catalysis [1,2], photonics [3], and biology [4,5]. Different approaches have been developed to synthesize silver particles with controllable morphologies, which include replacement reaction [6], electrodeposition [7], colloidal reduction [8], seed-mediated growth [9], and so on. Although there has already tremendous been progress in the synthesis of silver nanoparticles with designed sizes and shapes over the past few decades, the mechanism dominating the structure evolution is still at the infant stage [10,11]. There is no doubt that a full understanding of the mechanism would enhance our ability to control and manipulate the structures of nanoparticles.
Among numerous crystallization processes, particles growth via the aggregation of primary building blocks (clusters, nuclei, small crystals, and so on) has been widely observed, which is named as nonclassical crystallization. In 1998, Penn and Banfield [12,13] investigated the growth of titania nanocrystals under hydrothermal conditions through high-resolution transmission electron microscopy (HRTEM) and found that the crystal grew through oriented aggregation or oriented attachment (OA). Afterwards, adequate experimental observations confirmed the validity of the OA mechanism [14,15]. In the OA growth process, nanoparticles (building blocks) with identical crystallographic orientations directly combine together to form larger ones. If the crystallographic orientations of two building blocks are not perfectly aligned, aggregation can still occur, but mismatch, such as twinning, or dislocations would be formed at the interface [16]. From the view of thermodynamics, the combination of building blocks eliminates the interfaces, and thus reduces the total energy, which is the primary driving force for particle aggregation [16,17]. However, from the perspective of kinetics, the collision process also plays a significant role in the aggregation, because the building blocks have to approach and then contact each other prior to their alignment [18]. Therefore, the aggregation of particles is a complex process dominated by both thermodynamic and kinetic factors. A detailed investigation of the structure evolution in particle aggregation at the atom level is necessary to comprehensively understand the mechanism dominating nonclassical crystallization.
As the collision and bonding processes of particles is difficult to be directly observed via experimental methods [19], molecular dynamics (MD) simulation is often employed to discover the growth of particles at the microscopic level and to furnish the details that are not experimentally accessible [20]. Rahm and Erhart [21] predicted the equilibrium shape of silver particles through Monte Carlo simulations and found that there were three particularly important structure motifs, that is, truncated octahedral (TOC), icosahedra (Ih), and decahedra (Dh). Baletto et al. [22] and Uppenbrink et al. [23] reported a similar conclusion that TOC, Ih, Dh, and cuboctahedron (Cub) are the common structures when they investigated the structural properties of silver particles. In addition to the shape of building blocks, the solvent could play an important role in the anisotropic growth of silver nanostructures [24]. Therefore, the effects of the shape of building blocks and the viscosity of solvents on the aggregation processes should be investigated.
In this paper, the aggregation processes of silver particles are studied via the molecular dynamics simulation method. The interactions between atoms are described through the embedded atom method (EAM) potential. Four types of building blocks with different shapes are constructed, each containing both (100) and (111) facets, but the ratio of these two facets is different for each type of building block. The effect of shapes of building blocks on the aggregation processes are investigated. In addition, the influence of the viscosity and temperature are also considered in the simulation.
2. Computational Models and Methods
2.1. Building Blocks
In this study, the well-known truncated octahedron and its derivations were chosen as building blocks in the simulation of aggregation processes of silver nanoparticles. The reduction of surface energy provides the driving force for the combination of building blocks. Thus, four structures were constructed by truncating the octahedron in different degrees. As shown in Figure 1, the first one is a cuboctahedron and the other three are typical truncated octahedral (TOC) building blocks. For the convenience of discussion, these four building blocks are denoted as TOC1, TOC2, TOC3, and TOC4. Obviously, all TOCs contain 6 (100) facets and 8 (111) facets; only the relative area of the (111) and (100) facets (S(111) and S(100)) is different. The ratio of the (111) facet area to the total surface area for the four types of TOCs is 0.366, 0.776, 0.882, and 0.927, respectively.
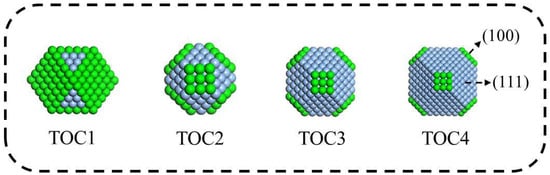
Figure 1.
The structures of four types of building blocks with different shapes (TOC1 is a cuboctahedron, containing six triangular (111) facets; TOC2, TOC3, and TOC4 are truncated octahedrons, containing six hexagonal (111) facets).
2.2. Simulation Methods
2.2.1. Potentials
All the molecular dynamics simulations in this work were performed in the large-scale atomic/molecular massively parallel simulator (LAMMPS) [25]. The interaction between silver atoms were described through EAM potential, which has been used to simulate the growth mechanism for silver nanowire [26], predict the mechanical properties of silver nanoparticle aggregates [27], investigate the melting behavior of silver nanoparticles and their clusters [28], and study the growth process of silver clusters from supersaturated vapor [29]. Generally, the EAM potential is formulated in the following forms:
where is the electron density at site i, is the energy required to place atom i into that electron density, and is the pair interaction between atoms i and j. The electron density at each site is computed from a superposition of atomic electron densities, so means the atomic electron density of atom j at a distance r from its nucleus. The values of those parameters used in this work are from Reference [30].
2.2.2. Calculation Methods for the Surface Energy
The silver crystal has a face-centered cubic (FCC) structure and the length of its unit cell is 4.086 Å. The calculation of the surface energy γ of a specific facet was carried out using the following procedures: (1) Set up a larger simulation box, for example, containing 20 × 20 × 20 unit cells, using periodic boundary conditions, then filled it up with silver atoms and made sure the opposite facets were the same type; (2) minimized the system potential energy and output the energy value as E0; (3) kept boundary conditions along two directions (for example, y axis and z axis) unchanged, but changed the third direction (along x axis) boundary condition to free surface; (4) minimized the system potential energy again and output the value as Efinal; (5) calculated the surface energy γ (unit in mJ·m−2) of the facet along x direction according to the following equation:
where A0 is the area of the facet surface along x direction.
To better understand the shape effect of the building block shape on the aggregation process, this article focused on the accumulative surface energy E, which is calculated by the product of the surface energy and the real area of the facet, as shown in Equation (4):
where E is the accumulative surface energy (unit in mJ) and A is the real area of the specific facet on the building block.
2.2.3. Simulation Methods for the Aggregation Process
The aggregation processes of silver nanoparticles were simulated in solvents with various viscosities. In each simulation, silver building blocks were initially placed randomly in a cubic box with periodic boundary conditions. The solvent could greatly influence the movement of nanoparticles and, thus, the aggregation process. However, if solvent molecules were modeled with all atoms, it would be too difficult to carry out simulations with such a large computational scale. Moreover, the main purpose of our research is to investigate the aggregation process of nanoparticles rather than the configuration of solvent molecules. Therefore, the implicit solvent approach was adopted in our simulation, in which the solvent effects upon the nanoparticles were described by a combination of a frictional term and a random force term [31,32]. The total force exerted on each nanoparticle has the form shown in Equation (5). The frictional term means the drag force upon the nanoparticle. The random force keeps the system at a chosen temperature and mimics the collisions between nanoparticles and solvent molecules, as shown by Equations (6) and (7).
where Fc is the conservation force computed via the usual inter-particle interactions, for example, EAM potential; Ff is a frictional drag or viscous damping term proportional to the nanoparticle’s velocity; and Fr is a force due to solvent atoms randomly bumping onto the particle at the temperature T. As derived from the fluctuation/dissipation theorem, the magnitude of Fr is proportional to , as shown in Equation (7), where kB is the Boltzmann constant, m is the mass of the nanoparticle, dt is the time step size, and ddamp is the damping factor. Here, random numbers Y are taken to randomize the direction and the magnitude of Fr. D is the diffusion coefficient of nanoparticles, d is the diameter of nanoparticles, and η is the dynamic viscosity of the frictional solvent.
In order to count the proportion of each pair of combined surfaces in aggregation, 1000 building blocks were placed in the simulation box. The dimensions of these four building blocks are 16.34283 Å3, 16.34283 Å3, 24.51423 Å3, and 32.68563 Å3, respectively. Correspondingly, their simulation boxes are 4003 Å3, 4003 Å3, 5303 Å3, and 6603 Å3. Within the simulation box, a region with distances greater than 5 Å from the box boundaries was meshed into 13 × 13 × 13 grids. Then, these 1000 building blocks were randomly placed at the center of these grids to ensure that there is no interaction between them at the initial stage. The building blocks essentially retained their initial shapes throughout the runs, without any artificial restrictions. All simulations were carried out in the NVT ensemble; the time step was 5 fs and the total simulation time was 80 ns.
2.2.4. Calculation Methods for the Aggregation Mode
The aggregation mode refers to the combined facets of two building blocks, such as the combination of (111)–(111), which means that the (111) facet of one building block is combined with the (111) facet of another nanoparticle. To count the proportion of each aggregation mode in a statistical way, the atoms in each building block were classified into two groups: The atoms completely on the (111) facets were assigned to group (111), and the atoms completely on the (100) facet were attributed to group (100).
Then, the proportions of aggregation modes were counted as follows:
- Calculated the distance between any two atoms which belonged to different building blocks. Once their distance was less than the critical distance 2.9 Å, which was set according to the nearest distance of silver crystal atom stacking 2.889 Å, the atom pair was considered to be in contact.
- If there were at least three atom pairs complying with the above distance criteria, two building blocks were aggregated, and then the aggregation mode could be determined. For example, the aggregation mode could be categorized as (111)–(111) or (100)–(100) if the atom pairs both belonged to the (111) group or (100) group. When one atom of the pair originated from the (111) group and the other one from the (100) group, the aggregation mode was defined as (111)–(100).
- After all atom pairs were counted, the proportion of a specific aggregation mode was calculated.
3. Results and Discussion
To disclose the influence of the building block shapes on the aggregation modes, we chose four types of building blocks and discovered their aggregation via computer simulations. These four types of building blocks belong to the same crystallographic family of truncated octahedrons. All the blocks contain the facets of (111) and (100), but the ratio of these two facets is different for each block, as described in Section 2.1. With the variation of their facet ratio, the shape of building block changes, which is expected to result in different aggregation modes, as shown in Figure 2. The building blocks have three different aggregation modes, namely (111)–(111), (111)–(100), and (100)–(100). A primary interest is to know, which path is their favorite way and why?
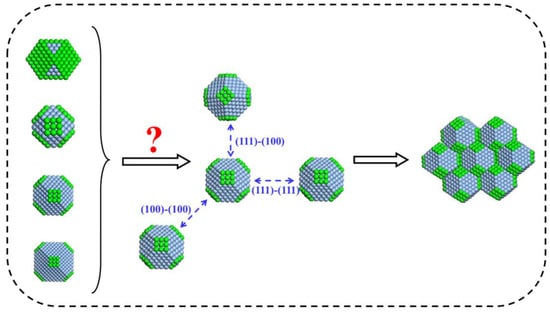
Figure 2.
An illustration of how the shapes of building blocks influence the aggregation modes.
A thousand building blocks were placed in the simulation box. The aggregation process of each type of building blocks was simulated in the same initial positions and every simulation lasted 80 ns. To ensure that 80 ns is long enough to capture the appreciable portions of the self-association process, the number of individual particles with the function of time was plotted, as shown in Figure 3. It was found that there are few unbound building blocks after 80 ns.
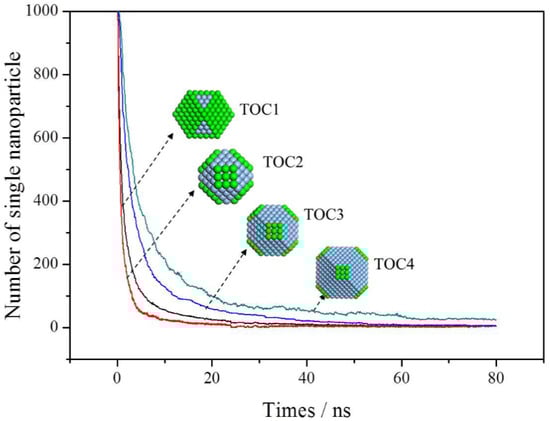
Figure 3.
The number of single nanoparticle as a function of simulation time.
For every building block, the aggregation simulations were conducted four times with different initial thermal velocity distributions, but at the same temperature of 298 K. Then, the aggregation mode was analyzed by counting the connecting facets. To clearly show the change of aggregation modes with the shapes of building blocks, the average proportion of each aggregation mode derived from the four runs is plotted in Figure 4. For building block TOC1, the aggregation mode (100)–(100) takes up 92.53%, while the other two modes are less than 8% combined. For the TOC4 with a higher ratio of (111) facet, the aggregation mode (111)–(111) increases to 66.02%, while the aggregation mode (100)–(100) decreases to 8.57%. Therefore, the shape of building blocks remarkably influences the aggregation mode.
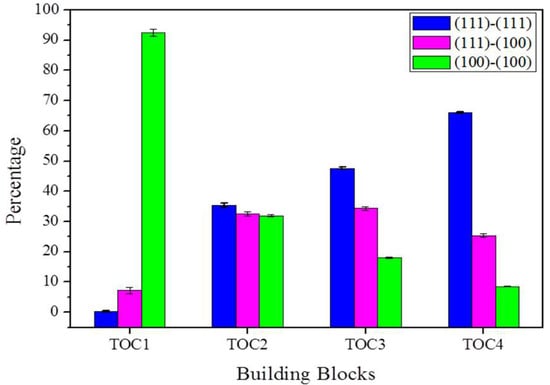
Figure 4.
The change of aggregation mode with the types of building blocks.
To reveal the details of aggregation process, the aggregation of TOC2 was snapshotted, as shown in Figure 5. When two blocks approach, the protuberances firstly get in touch. The protuberant position includes a vertex, an edge, and a narrow facet. These protuberances have advantages as contacting points because they are prominent, as well as because they have more unsaturated bonds and higher surface energy. When two blocks got in touch, they firstly formed a ‘hinge’, followed by a slight orientation before a stable surface connection. When the rotation stopped, the facets from different blocks aggregated together. Additionally, the diffusion of surface atoms was sometimes observed to fusion the aggregate, which enhanced the stability of aggregates.
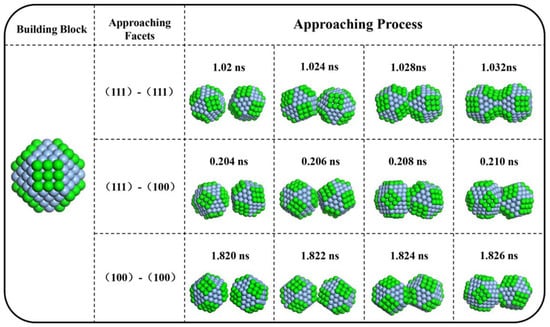
Figure 5.
Snapshots of the aggregation processes of TOC2 by computer simulation.
To find out why the aggregation mode depends on the shape of building blocks, we analyzed the change of accumulative surface energy E before and after aggregation. We firstly calculated the surface energy of each facet using the approach described in Section 2.2.2. The calculated surface energy per unit area of three low-index facets is γ(111) = 623 mJ·m−2, γ(100) = 701 mJ·m−2, and γ(110) = 763 mJ·m−2, respectively. They agree well with the reported results [30,33] that (110) the facet has the highest surface energy per unit area while the (111) has the lowest value. However, the surface energy per unit area is just used to demonstrate the thermodynamic stability of each facet and the area of each facet also contributes to the total reduction of energy, which was usually ignored in previous studies [12]. The effective reduction of energy should be the product of surface energy per unit area with surface area. Thus, we calculated the accumulative surface energy E of (111) and (100) for each type of building blocks in this work, and the results are listed in Table 1. When the facet area is considered in calculating the reduction of accumulative surface energy, the facet energy ratio between (111) and (100) increases from 0.385 to 8.466 for TOC1 to TOC4. Thus, the (111)–(111) aggregation mode is more and more thermodynamically favored due to the increase of the (111) facet area resulting from the shape variation.

Table 1.
Facet area and non-unit surface energy of each building block.
To quantify the energy reduction of each aggregation mode in the aggregation, two building blocks were placed at a series of certain distances and the potential energy was calculated at each distance. When their connected facets were aligned perfectly, the maximal reduction of potential energy could be obtained [34]. Taking two TOC2 as an example, the reduction of potential energy at different aggregation modes was calculated. The reduction of interactional energy was plotted as a function of the distance between facets of two building blocks, as shown in Figure 6. The reduction of potential energies of aggregation modes (111)–(111) and (100)–(100) reaches its minimal values at the distance around 2.8–2.9 Å, which indicates that the combination of two building blocks occurs at this distance. All three aggregation modes cause a reduction of potential energy, but the degree of reduction is different. The aggregation path along the <111> orientation by sharing the (111) facet resulted in the maximum reduction of energy owing to its largest area. Consequently, the aggregation along this direction is thermodynamically favored, which confirms that the facet area plays an indispensable role when the facet energy is considered.
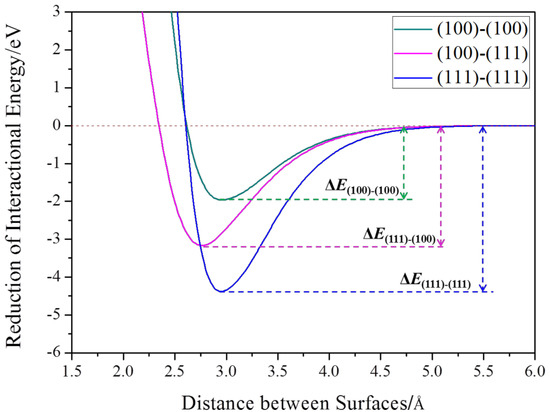
Figure 6.
Variations of interaction energy between two TOC2 building blocks at different distances.
The collision of particles is dominated by their dynamics in the solvent. We performed simulations in solvents with different viscosities, since the previous study suggested that the diffusion had a great effect on the structure evolution of materials [35]. Four viscosities of solvents were used, namely 9 × 10⁻³, 0.9 × 10⁻³ (above results at this viscosity), 0.09 × 10⁻³, and 0.009 × 10⁻³ Pa·s. For the convenience of discussion, the aggregation of TOC2 was still used as the target process. The simulation results are shown in Figure 7. Since the rise of viscosity slows down the diffusivity of building blocks, the frequency of collision of building blocks decreases with the viscosity. With the increase of viscosity, the aggregation along the (111) facet is increased, since the energy reduction of the (111)–(111) aggregation mode is larger than that of the (100)–(100) mode. In the high viscosity, the building blocks have sufficient time to rotate and adjust themselves to settle down on the thermodynamically favored site (111) rather than the (100) facets to optimize the total energy minimization. Thus, the aggregation along the <111> direction increases with the increase of viscosity, as shown in Figure 6.
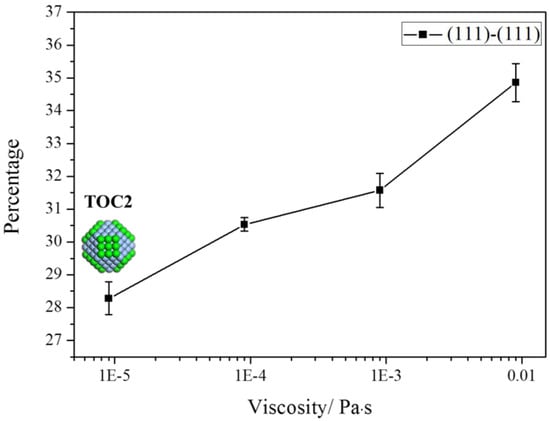
Figure 7.
The aggregation on (111) facets increases with increasing the viscosities of solvents.
To speed up the aggregation process, we further implemented a series of simulations under different temperatures. The effect of temperature on the aggregation mode is summarized in Figure 8. The proportion of the aggregation mode on the (111) facets declines with the increase of temperatures. A high temperature causes a high collision frequency and then induces a more random combination of building blocks rather than following the energy minimization. The influence of temperature is quite similar to that of the solvent viscosity abatement, and both of them increase the collision frequency of blocks. A higher collision frequency leads to more random aggregation, while a lower collision frequency gives particles much more chance to form orderly aggregates.
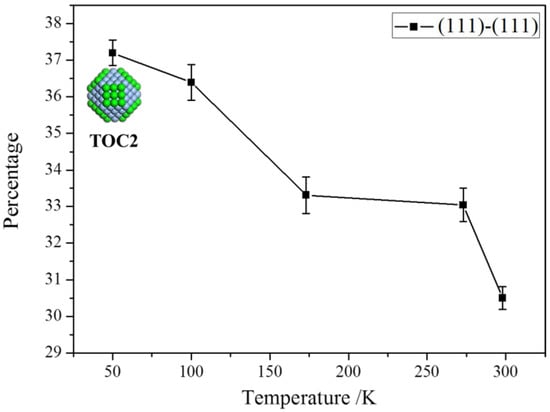
Figure 8.
The percentage of the aggregation on (111) facets decreases with the increase of temperatures.
4. Conclusions
This paper investigated the shape effects of building blocks on their aggregation. Four types of building blocks were constructed. All of them belonged to the family of truncated octahedrons. Each type of building block contains the facets of (100) and (111), but the ratio of these two facets is different. Molecular dynamics simulations were employed to investigate the aggregation process of each type of building blocks. It was found that the aggregation on the (100) facets was dominant when the building block had a larger (100) facet area than the (111) facet area. With the increase of the (111) facet area, the (100) facet area decreased, which led to the dominant aggregation on the (111) facets. These results indicated that the facet area played an important role in selecting the aggregation direction in crystallization. The increase of facet area enhanced the collision probability on such kinds of facets. These results indicated that the surface area should be considered in calculating the reduction of total surface energy in particle aggregation. In addition, the influence of solvent viscosity and temperature on the aggregation mode was investigated. Both the decrease of viscosity and the increase of temperature improved the diffusion of building blocks, which increased random aggregation. This paper shows a detail view of particle aggregation at the atomic level, which enables a better understanding of the growth of nanocrystals by aggregation and enhances our ability to control the structures of particle materials.
Author Contributions
X.W., C.H., C.L., and Y.H. conceived and designed the simulations; X.W. performed the simulations; X.W. and C.L. analyzed the data; Y.H. wrote the paper.
Funding
This study was supported by National Natural Science Foundation of China (No. 91434201, No. 21406232, No. 21776280). Financing from the Hundreds Talent Program from Chinese Academy of Sciences and the project from the State Key Laboratory of Multiphase Complex Systems (MPCS-2017-A-01) and from the Research Center for Mesoscience, Institute of Process Engineering, Chinese Academy of Sciences (MPCS-2017-A-01), and from the National Key Research and Development Program of China under the Grant No. 2016YFB0200504 were appreciated.
Conflicts of Interest
The authors declare no conflict of interest.
References
- Sushkevich, V.L.; Ivanova, I.I. Mechanistic study of ethanol conversion into butadiene over silver promoted zirconia catalysts. Appl. Catal. B 2017, 215, 36–49. [Google Scholar] [CrossRef]
- Baruah, B.; Gabriel, G.J.; Akbashev, M.J.; Booher, M.E. Facile synthesis of silver nanoparticles stabilized by cationic polynorbornenes and their catalytic activity in 4-nitrophenol reduction. Langmuir 2013, 29, 4225–4234. [Google Scholar] [CrossRef] [PubMed]
- Zheng, X.; Peng, Y.; Lombardi, J.R.; Cui, X.; Zheng, W. Photochemical growth of silver nanoparticles with mixed-light irradiation. Colloid Polym. Sci. 2016, 294, 911–916. [Google Scholar] [CrossRef]
- Yang, T.; Han, Y.; Li, J. Manipulating silver dendritic structures via diffusion and reaction. Chem. Eng. Sci. 2015, 138, 457–464. [Google Scholar] [CrossRef]
- Kim, D.H.; Park, J.C.; Jeon, G.E.; Kim, C.S.; Seo, J.H. Effect of the size and shape of silver nanoparticles on bacterial growth and metabolism by monitoring optical density and fluorescence intensity. Biotechnol. Bioprocess Eng. 2017, 22, 210–217. [Google Scholar] [CrossRef]
- Fang, J.; You, H.; Kong, P.; Yi, Y.; Song, X.; Ding, B. Dendritic Silver Nanostructure Growth and Evolution in Replacement Reaction. Cryst. Growth Des. 2007, 7, 864–867. [Google Scholar] [CrossRef]
- Mandke, M.V.; Han, S.-H.; Pathan, H.M. Growth of silver dendritic nanostructuresvia electrochemical route. CrystEngComm 2012, 14, 86–89. [Google Scholar] [CrossRef]
- Martínez-Castañón, G.A.; Niño-Martínez, N.; Loyola-Rodríguez, J.P.; Patiño-Marín, N.; Martínez-Mendoza, J.R.; Ruiz, F. Synthesis of silver particles with different sizes and morphologies. Mater. Lett. 2009, 63, 1266–1268. [Google Scholar] [CrossRef]
- Wang, Y.; Wan, D.; Xie, S.; Xia, X.; Huang, C.Z.; Xia, Y. Synthesis of Silver Octahedra with Controlled Sizes and Optical Properties via Seed-Mediated Growth. ACS Nano 2013, 7, 4586–4594. [Google Scholar] [CrossRef] [PubMed]
- Park, H.-G.; Joo, J.H.; Kim, H.-G.; Lee, J.-S. Shape-dependent reversible assembly properties of polyvalent DNA–silver nanocube conjugates. J. Phys. Chem. C 2012, 116, 2278–2284. [Google Scholar] [CrossRef]
- Bera, R.K.; Das, A.K.; Raj, C.R. Enzyme-cofactor-assisted photochemical synthesis of Ag nanostructures and shape-dependent optical sensing of Hg(II) ions. Chem. Mater. 2010, 22, 4505–4511. [Google Scholar] [CrossRef]
- Lee Penn, R.F.; Banfield, J. Imperfect oriented attachment: Dislocation generation in defect-free nanocrystals. Science 1998, 281, 969–971. [Google Scholar] [CrossRef]
- Penn, R.L.F.; Banfield, J. Morphology development and crystal growth in nanocrystalline aggregates under hydrothermal conditions: Insights from titania. Geochim. Cosmochim. Acta 1999, 63, 1549–1557. [Google Scholar] [CrossRef]
- Burrows, N.D.; Hale, C.R.; Penn, R.L. Effect of pH on the kinetics of crystal growth by oriented aggregation. Cryst. Growth Des. 2013, 13. [Google Scholar] [CrossRef]
- Fichthorn, K.A. Atomic-scale aspects of oriented attachment. Chem. Eng. Sci. 2015, 121, 10–15. [Google Scholar] [CrossRef]
- Lee, J.; Yang, J.; Gu Kwon, S.; Hyeon, T. Nonclassical nucleation and growth of inorganic nanoparticles. Nat. Rev. Mater. 2016, 1, 16034. [Google Scholar] [CrossRef]
- Li, D.; Nielsen, M.H.; Lee, J.R.; Frandsen, C.; Banfield, J.F.; De Yoreo, J.J. Direction-specific interactions control crystal growth by oriented attachment. Science 2012, 336, 1014–1018. [Google Scholar] [CrossRef] [PubMed]
- Lv, W.; He, W.; Wang, X.; Niu, Y.; Cao, H.; Dickerson, J.H.; Wang, Z. Understanding the oriented-attachment growth of nanocrystals from an energy point of view: A review. Nanoscale 2014, 6, 2531–2547. [Google Scholar] [CrossRef] [PubMed]
- Zhang, J.; Huang, F.; Lin, Z. Progress of nanocrystalline growth kinetics based on oriented attachment. Nanoscale 2010, 2, 18–34. [Google Scholar] [CrossRef] [PubMed]
- Nada, H. Computer Simulations: Essential Tools for Crystal Growth Studies. Crystals 2018, 8, 314. [Google Scholar] [CrossRef]
- Rahm, J.M.; Erhart, P. Beyond magic numbers: Atomic scale equilibrium nanoparticle shapes for any size. Nano Lett. 2017, 17, 5775–5781. [Google Scholar] [CrossRef] [PubMed]
- Baletto, F.; Ferrando, R.; Fortunelli, A.; Montalenti, F.; Mottet, C. Crossover among structural motifs in transition and noble-metal clusters. J. Chem. Phys. 2002, 116, 3856–3863. [Google Scholar] [CrossRef]
- Uppenbrink, J.; Wales, D.J. Structure and energetics of model metal clusters. J. Chem. Phys. 1992, 96, 8520–8534. [Google Scholar] [CrossRef]
- Kim, T.; Lee, C.H.; Joo, S.W.; Lee, K. Kinetics of gold nanoparticle aggregation: Experiments and modeling. J. Colloid Interface Sci. 2008, 318, 238–243. [Google Scholar] [CrossRef] [PubMed]
- Plimpton, S.; Crozier, P.; Thompson, A. LAMMPS-large-scale atomic/molecular massively parallel simulator. J. Appl. Phys. 2007, 18, 43. [Google Scholar]
- Murph, S.E.H.; Murphy, C.J.; Leach, A.; Gall, K. A Possible Oriented Attachment Growth Mechanism for Silver Nanowire Formation. Cryst. Growth Des. 2015, 15, 1968–1974. [Google Scholar] [CrossRef]
- Hawa, T.; Henz, B.; Zachariah, M. Computer Simulation of Nanoparticle Aggregate Fracture. MRS Proc. 2011, 1056, 1056-HH08-45. [Google Scholar] [CrossRef]
- Feng, D.; Feng, Y.; Yuan, S.; Zhang, X.; Wang, G. Melting behavior of Ag nanoparticles and their clusters. Appl. Therm. Eng. 2017, 111, 1457–1463. [Google Scholar] [CrossRef]
- Wang, Q.; Xie, H.; Chen, Y.; Liu, C. Effects of temperature and pressure on the nucleation and growth of silver clusters from supersaturated vapor: A molecular dynamics analysis. Int. J. Modern Phys. B 2017, 31, 1750057. [Google Scholar] [CrossRef]
- Foiles, S.M.; Baskes, M.I.; Daw, M.S. Embedded-atom-method functions for the fcc metals Cu, Ag, Au, Ni, Pd, Pt, and their alloys. Phys. Rev. B 1986, 33, 7983–7991. [Google Scholar] [CrossRef]
- Videcoq, A.; Han, M.; Aabélard, P.; Pagnoux, C.; Rossignol, F.; Ferrando, R. Influence of the potential range on the aggregation of colloidal particles. Phys. A 2007, 374, 507–516. [Google Scholar] [CrossRef]
- Schneider, T.; Stoll, E. Molecular-dynamics study of a 3-dimensional one-component model for distortive phase-transitions. Phys. Rev. B 1978, 17, 1302. [Google Scholar] [CrossRef]
- Trimble, T.M.; Cammarata, R.C. Many-body effects on surface stress, surface energy and surface relaxation of fcc metals. Surf. Sci. 2008, 602, 2339–2347. [Google Scholar] [CrossRef]
- Qiang, Z.; Wang, B.; Wang, P.; Dellago, C.; Wang, Y.; Fang, Y. Nanoparticle-based crystal growth via multistep self-assembly. CrystEngComm 2013, 15, 5114–5118. [Google Scholar] [CrossRef]
- Niederberger, M.; Cölfen, H. Oriented attachment and mesocrystals: Non-classical crystallization mechanisms based on nanoparticle assembly. Phys. Chem. Chem. Phys. 2006, 8, 3271–3287. [Google Scholar] [CrossRef] [PubMed]
© 2018 by the authors. Licensee MDPI, Basel, Switzerland. This article is an open access article distributed under the terms and conditions of the Creative Commons Attribution (CC BY) license (http://creativecommons.org/licenses/by/4.0/).