1. Introduction
The potassium niobate crystal KNbO
3 (KN) is well known to be a nonlinear optical crystal that shows wavelength modulation [
1,
2,
3,
4,
5]. It is known to be difficult to grow its bulk single crystals from melt due to KN’s incongruent melting and the double solid-state phase transformation properties, such as its cubic structure above 435 °C, tetragonal below it, and then at 225 °C turning orthorhombic [
6]. In recent years, however, the KN crystal has been a focus of growing interest for piezoelectric applications due to its large electric-mechanical coupling factor, which exceeds 50%, and zero temperature coefficients near room temperature [
7,
8]. The most important application is a surface acoustic wave (SAW) filer for television receivers and mobile phones [
7,
8]. In the KN crystal for example, 70% kt (electromechanical coupling factor for the thickness-extensional mode) was reported by 49.5° rotated
X-cut about the
Y-axis [
9,
10]. The KN crystal can be grown with high quality and low lattice defects, especially in fiber shape [
11]. It is difficult, however, to grow large size and high quality crystals since the melting mode of the KN crystal is incongruent [
7]. The most common growth technique for the KN crystal in bulk shape is the top-seeded solution growth (TSSG) method [
1,
2,
3,
4,
5]. It was reported that the Bridgman (BM) technique is easier to apply than the TSSG technique for growing KN crystal [
11]. KN crystal should in any case be grown from high temperature solutions; thus, it is important to know its phase diagram. A few reports on the phase diagram of the KN based crystals that are believed to be line compounds were found [
12]. So far only the liquidus line to K
2O-rich composition KN crystal has been reported [
13,
14]. Here the KN crystal was grown using the Bridgman technique and the composition of the resultant crystals investigated. According to the reports [
13,
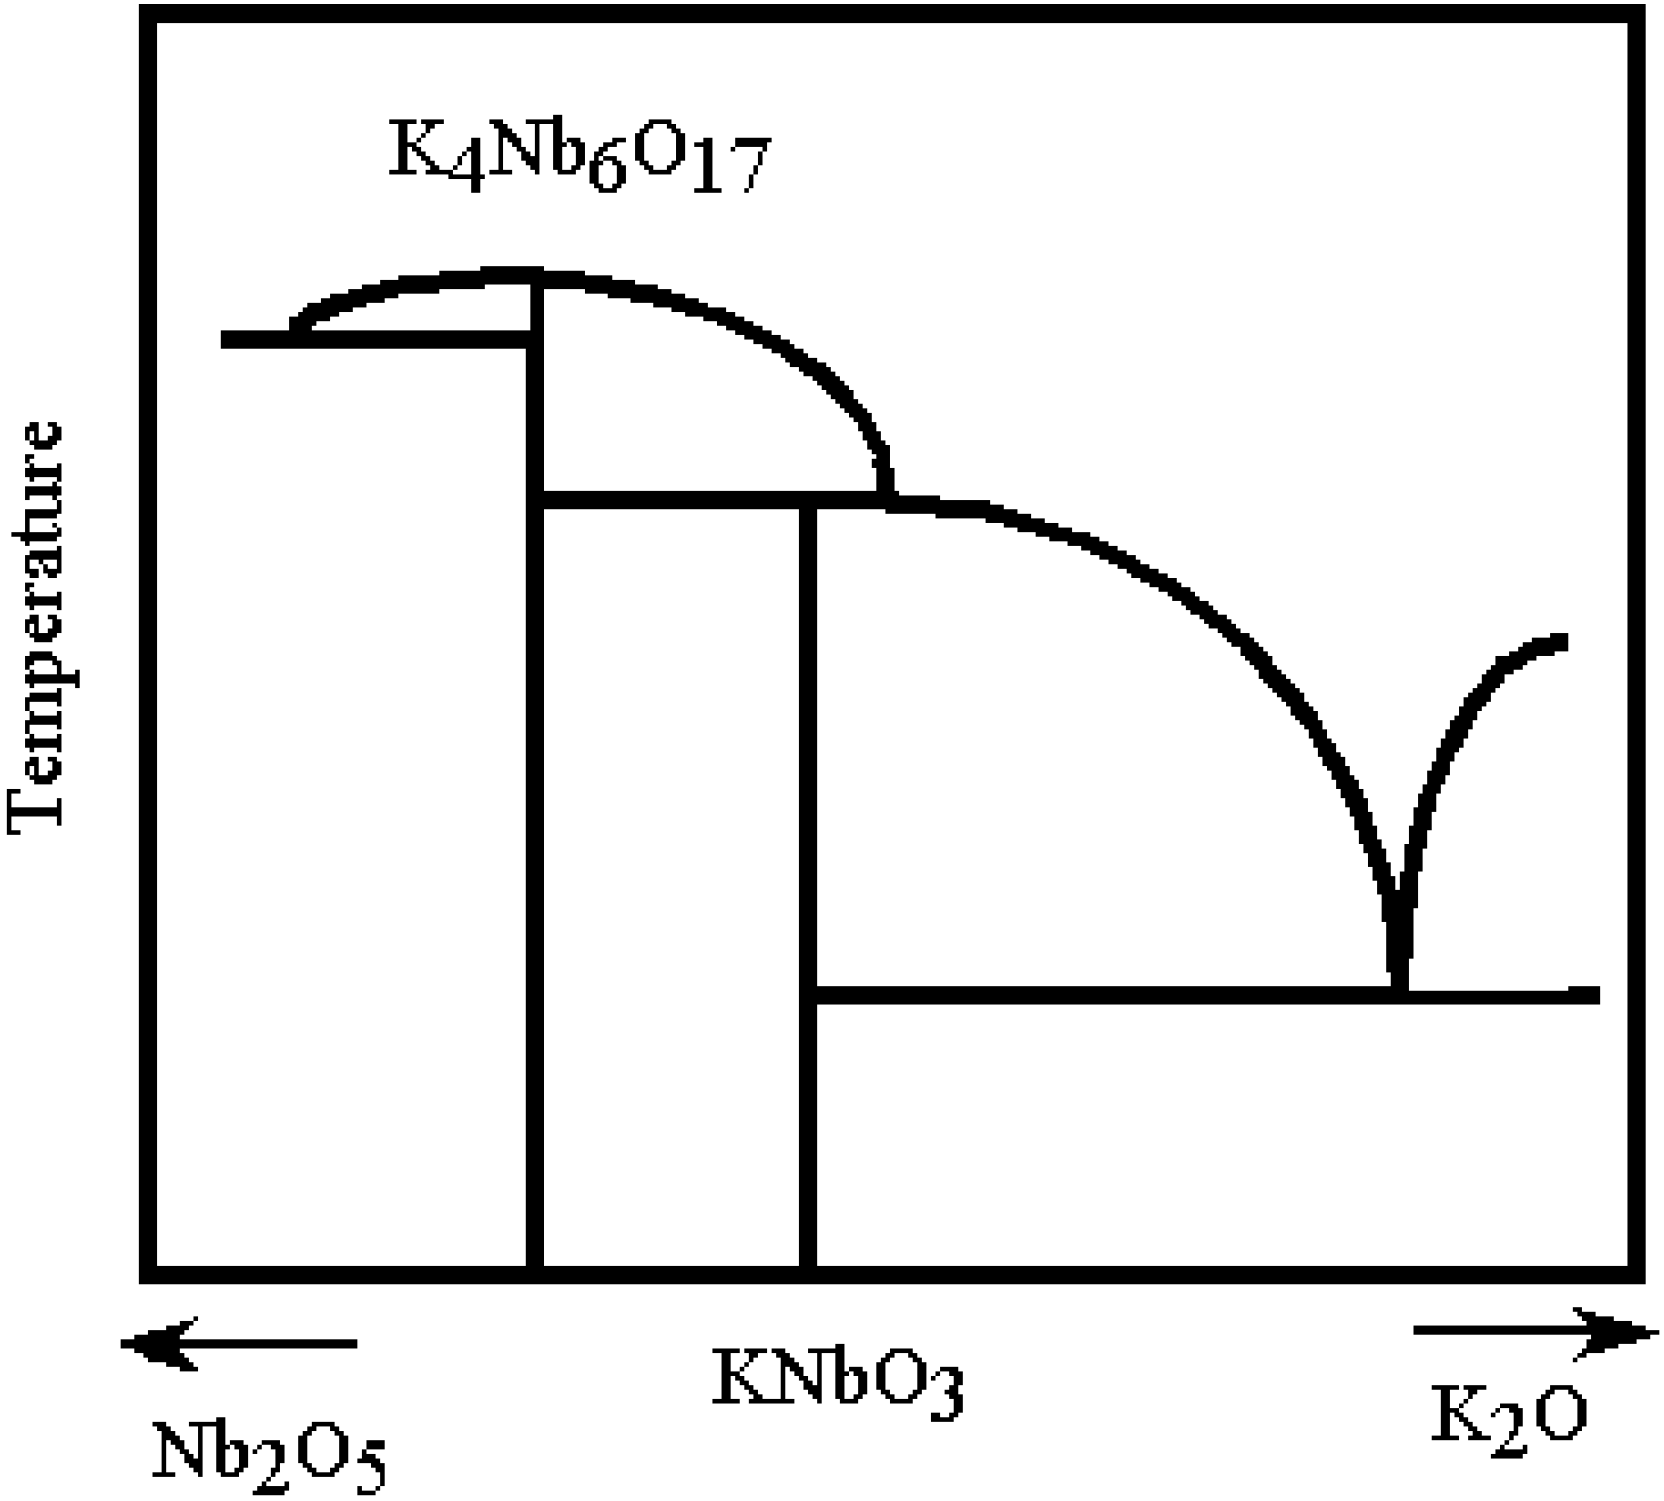
14], the color of the grown crystals changed during growth. It was concluded that a solid solution region was formed due to the deviation from the stoichiometry of the KN crystal. Furthermore, it was reported that crystals were able to be grown only from the molten stoichiometric composition. The KN crystal would go through a peritectic transformation during the growth process. A schematic phase diagram near the KN is shown in
Figure 1 [
15]. The original phase diagram was drawn from [
11,
12].
Figure 1.
Schematic phase diagram near KNbO
3, reprinted with permission from [
15]. Copyright 2006 Elsevier.
Figure 1.
Schematic phase diagram near KNbO
3, reprinted with permission from [
15]. Copyright 2006 Elsevier.
So many review articles on the KN crystal have been published up to the present from the viewpoint of piezoelectric applications, such as crystal growth and piezoelectric SAW properties for acoustic filter and so on. The KN crystal is too famous to study in another viewpoint. In this article, we summarize our past perverse study toward a multiple alkali metal dope KN crystal from a crystal grower’s viewpoint.
3. The KNbO3 Single Crystal in Fiber Shape
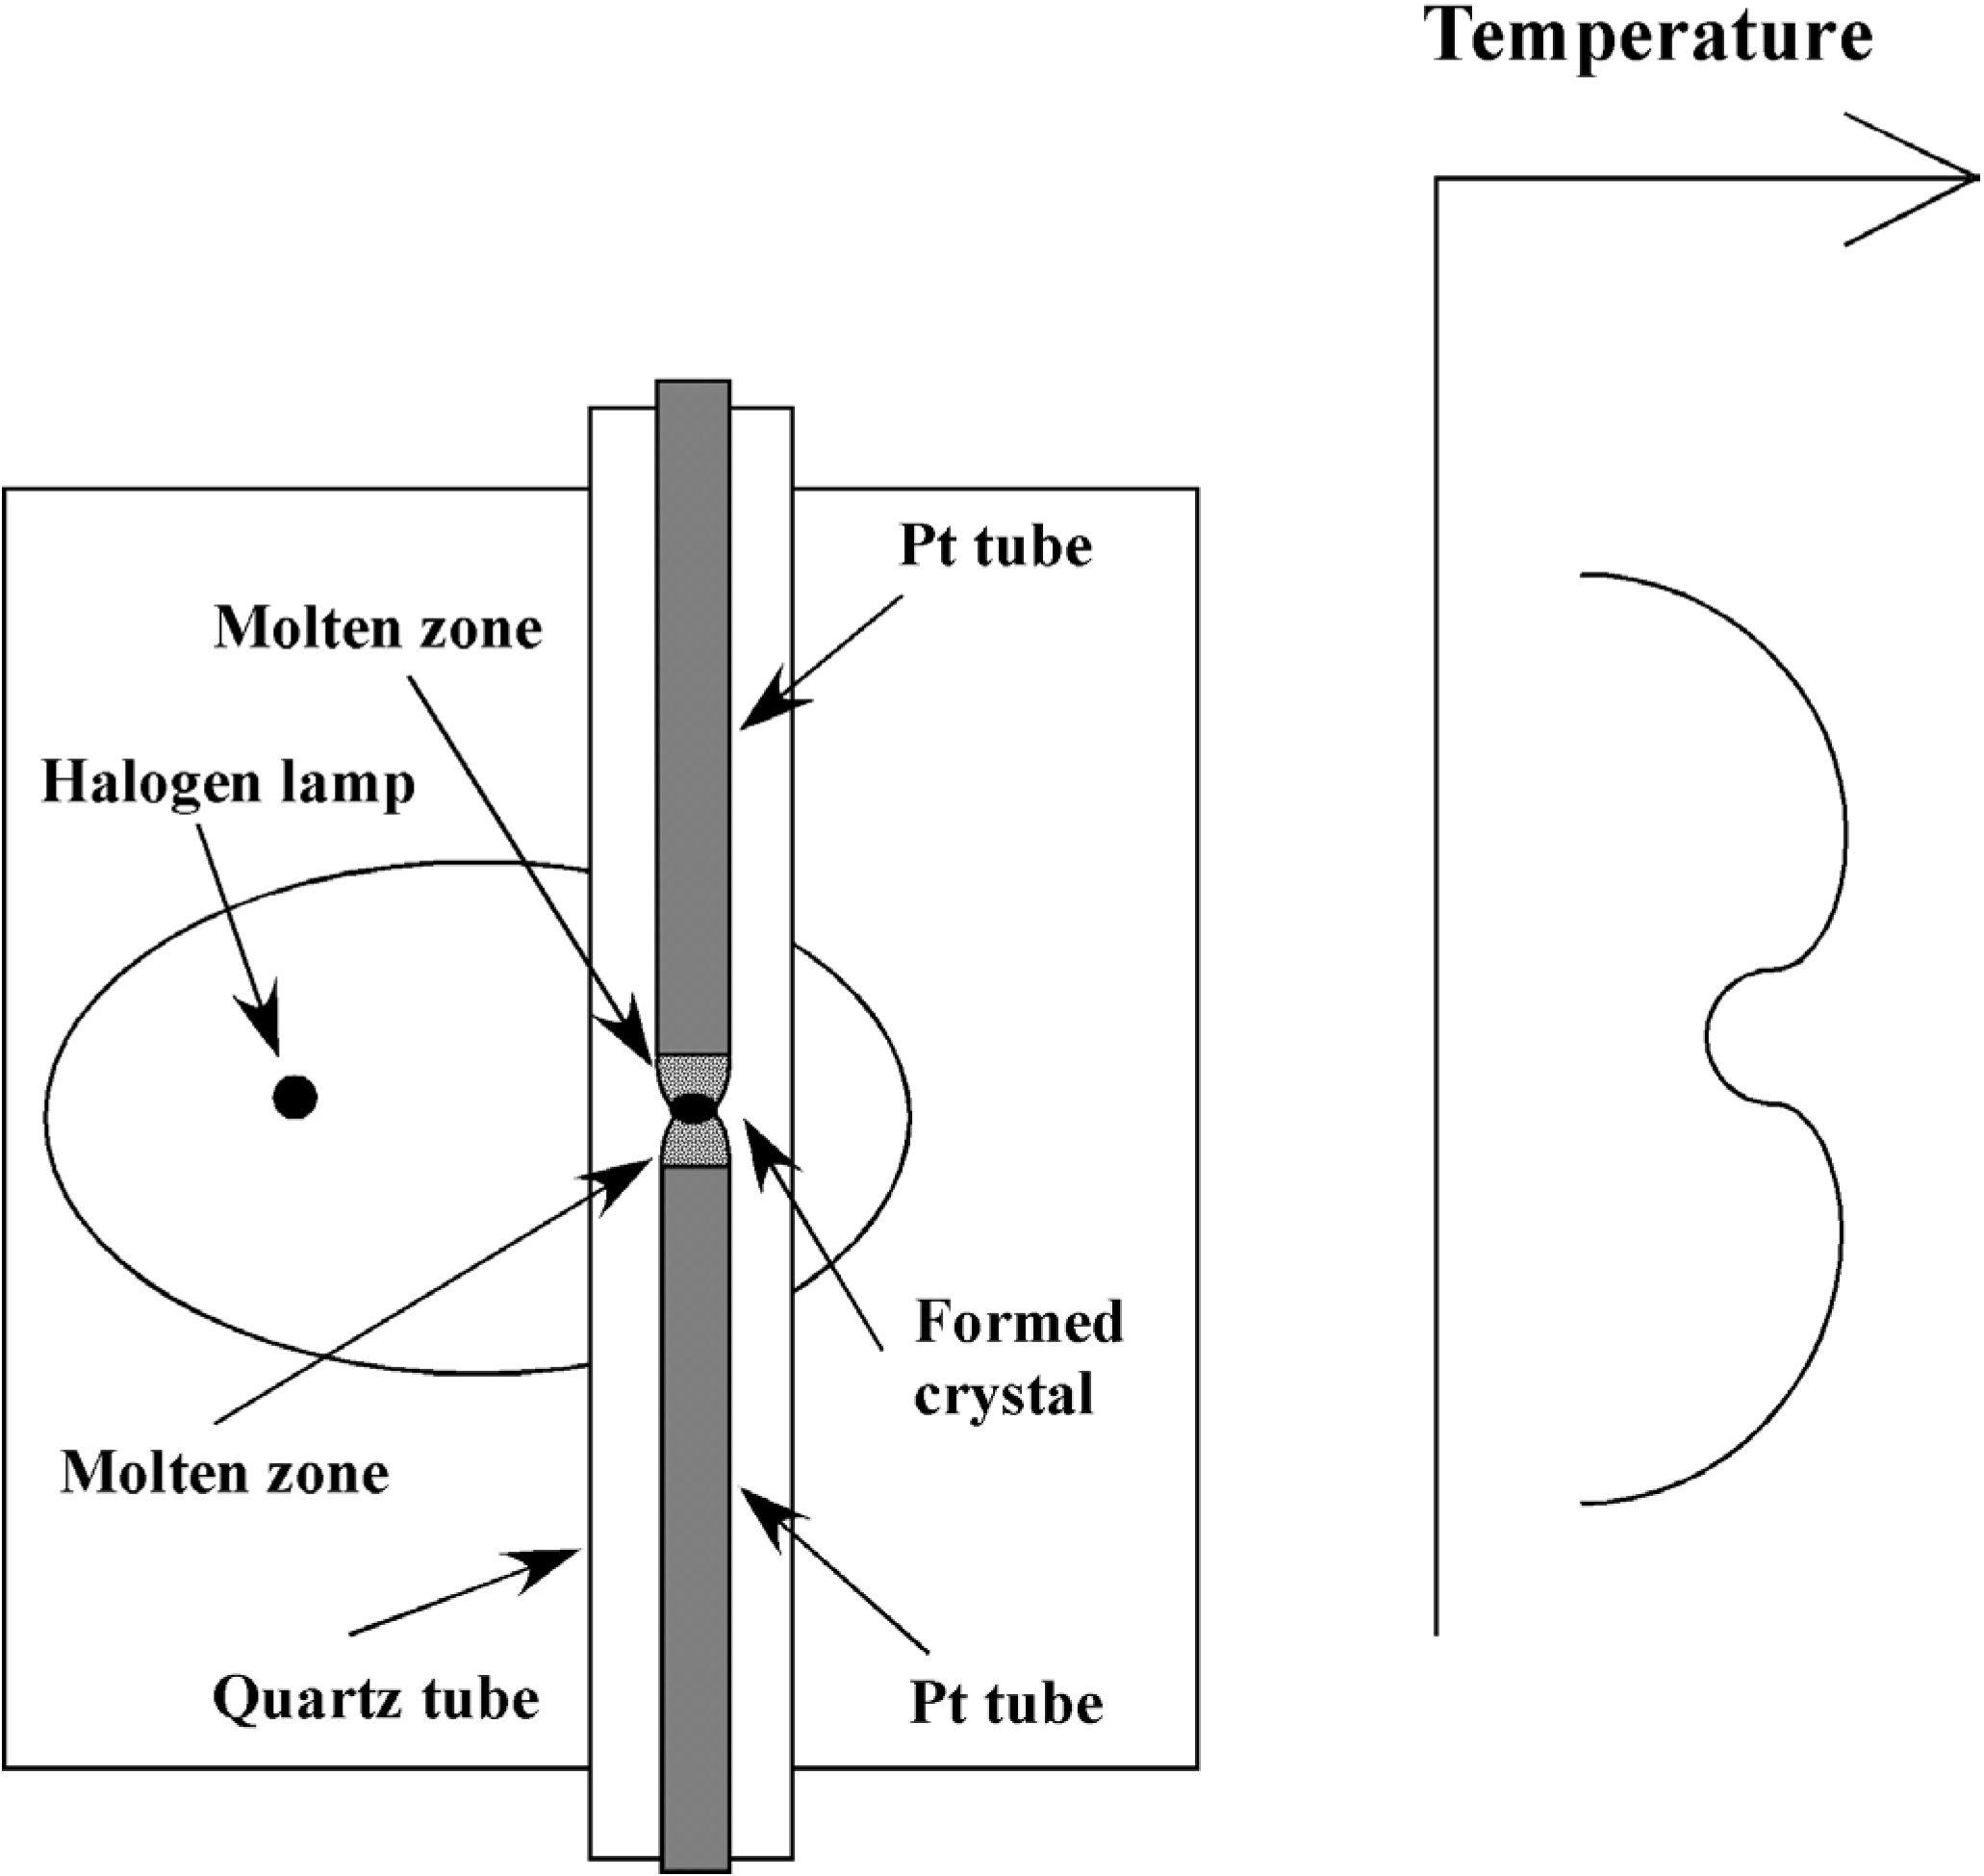
Crystal growth from high temperature solutions using the halogen lamp-heated Fz-PD technique can be employed for forming fiber crystals. Following the first report of this technique by the authors [
21], the technique was modified every year fitting to the crystals. The source materials were K
2CO
3 (99.9 mol%, CERAC incorporated, present Materion’s Advanced Material Group, Buffalo, NY, USA) and Nb
2O
5 (99.9 mol%, Kojundo Chemical Laboratory, Sakado, Japan). Suitable compositions of the starting materials were determined to be such that, the ratios of K:Nb were 50:50, 52:48, 54:46 or 58:42. We used our original double ring-shaped halogen lamp floating zone (DRFz) furnace for the Fz-PD technique to grow the fiber shaped crystals, and used here a Pt tube as a reservoir for source melt. A typical Pt tube in this case was of 2–4 mm in diameter and 50 mm in length with 0.1 mm thickness. The Pt tube was heated and the source material was melted inside the tube. The melt was positioned near the lower end of the Pt tube. A Pt wire was inserted in the molten pendant from the lower end of the Pt tube. The Pt wire was then pulled down at a rate of 10–20 mm/h without rotating. The temperature gradient of the solid-liquid interface was quite high at 200 °C/mm [
22]. On the other hand, the TSSG and the BM techniques were operated under smaller temperature gradients [
11,
14]. The lattice parameters for an orthorhombic system were calculated using the data from powder X-ray diffraction in our case.
When crystals were grown from the K:Nb = 58:42 starting composition, the crystal color was blue. According to reference [
23], this composition was the best for growing transparent crystals, but in our case the crystals formed were opaque.
Figure 4 shows a crystal grown from the K:Nb = 54:46 starting composition. A transparent and colorless crystal can be grown [
24]. We believe that the difference in the resultant crystals was due to the difference in the growth systems, especially the difference in the temperature gradient applied at the solid-liquid interface. The crystal’s color depends on the color center and the oxygen deficiency. Striation and twin images were observed in the initially grown part of the crystal. The growth direction was confirmed as being along the
c-axis by the X-ray diffraction pattern we obtained from our resultant crystals. When the starting composition was K:Nb = 50:50, a mixture phase of KN and K
4Nb
6O
17 was obtained. When the starting composition was a K-rich composition such as K:Nb = 52:48, a single-phase KN was obtained. The phase is in agreement with the JCPDS card (No. 35–795) in orthorhombic symmetry.
Figure 4.
Grown crystal from the K:Nb = 54:46 melt, reprinted with permission from [
24]. Copyright 2006 Elsevier. Scale bar: 10 mm.
Figure 4.
Grown crystal from the K:Nb = 54:46 melt, reprinted with permission from [
24]. Copyright 2006 Elsevier. Scale bar: 10 mm.
Table 1 shows the starting melt composition dependence of the lattice parameters and the lattice volume [
24]. The lattice parameters and the lattice volume increased with increasing K content in all cases, since the K ion is larger than the Nb ion [
25]. The crystals formed from the K:Nb = 50:50 starting composition showed KN phase and another phase such as K
4Nb
6O
17.
From the Thermogravimetric-Differential Thermal Analysis (TG-DTA) signal charts that were used for measuring the solid-state phase transformation temperatures of the heating and cooling process, the two peaks corresponding to the phase transformation in both the heating and cooling processes can be clearly observed. One is the orthorhombic/tetragonal phase transformation around 230 °C. The other is the tetragonal/cubic phase transformation around 450 °C. From the starting composition dependence of the melting point and twice solid-state phase transformation temperatures, the melting point and the phase transformation temperature were observed to decrease with increasing K content, suggesting that the binding energy decreases with a higher content of the large K ion. In the LiNbO
3 (LN) crystal, the solid solution region exists with an Nb-rich composition [
24]. However, in the KN crystal, the solid solution region expands to give a K-rich composition. The difference is visible in the different phase diagrams. The LN crystal shows congruent melting, while the KN crystal shows incongruent melting, and adopts a peritectic system [
13]. The liquidus line in Nb-rich compositions is higher than the melting point of the KN crystal. Thus the solid-solution region near the KN crystal exists as K-rich composition.
Table 1.
KNbO
3 (KN) crystals’ starting composition dependence of lattice parameters,
a,
b,
c, and lattice volume,
V, reprinted with permission from [
24]. Copyright 2006 Elsevier .
Table 1.
KNbO3 (KN) crystals’ starting composition dependence of lattice parameters, a, b, c, and lattice volume, V, reprinted with permission from [24]. Copyright 2006 Elsevier .
| K Content, mol% | a, nm | b, nm | c, nm | V, nm3 |
|---|
| 50 | 0.5697 | 0.5718 | 0.3974 | 0.12945 |
| 52 | 0.5694 | 0.5721 | 0.3974 | 0.12945 |
| 54 | 0.5694 | 0.5721 | 0.3975 | 0.12949 |
| 56 | 0.5697 | 0.5722 | 0.3974 | 0.12955 |
| 58 | 0.5699 | 0.5723 | 0.3975 | 0.12965 |
4. The Past Pb2KNb5O15 Crystal
Lead potassium niobate crystal (Pb
2KNb
5O
15: PKN) with a tungsten bronze structure is attractive for nonlinear optics and piezoelectric applications. At sometime the PKN was expected to exceed the KN crystal. About 40 years ago, crystal growth of PKN by the Czochralski (Cz) method was reported [
26] and properties of PKN were investigated [
27,
28]. However, there were only a few relevant papers published. In particular, regarding the properties of these grown crystals, only two groups of data were reported. The reason for all this is due to the difficulty of PKN crystal growth. Lead (Pb) and potassium (K) are easy to evaporate during crystal growth. Thus large deviation from the stoichiometric composition is expected in the grown crystals. Nowadays, Pb is believed to be detrimental for the environment. Thus Pb-free crystals are of interest even in piezoelectric materials. However, relatively speaking, the PKN still possesses good properties such as a large electro-mechanical coupling factor of bulk and surface waves, and small temperature dependence [
27,
28]. Up until now, the Cz method [
26,
27], the Bridgeman method (BM) [
29] and the top-seeded solution growth method (TSSG) [
30] have been applied to grow the PKN crystal. Elastic and piezoelectric properties [
31] and dielectric and optical properties [
27] have been reported. Furthermore, a possibility for a surface acoustic wave (SAW) device was investigated [
31]. The tungsten bronze structure was refined with a space group of
Cm2
m and the lattice parameters were found to be
a = 1.7779 nm,
b = 1.8015 nm and
c = 0.39209 nm [
32].
Crystal growth methods from melt were used for PKN: three kinds of methods were used such as halogen-lamp-heated Fz-PD method, halogen-lamp-heated Fz method and induction-heated Ts-Cz method. Compositions of starting materials were determined to be stoichiometric composition 1 wt% rich of PbO (99.5%, Kojundo Chemical Laboratory, Sakado, Japan). K
2CO
3 and Nb
2O
5 are the same as the KN source materials.
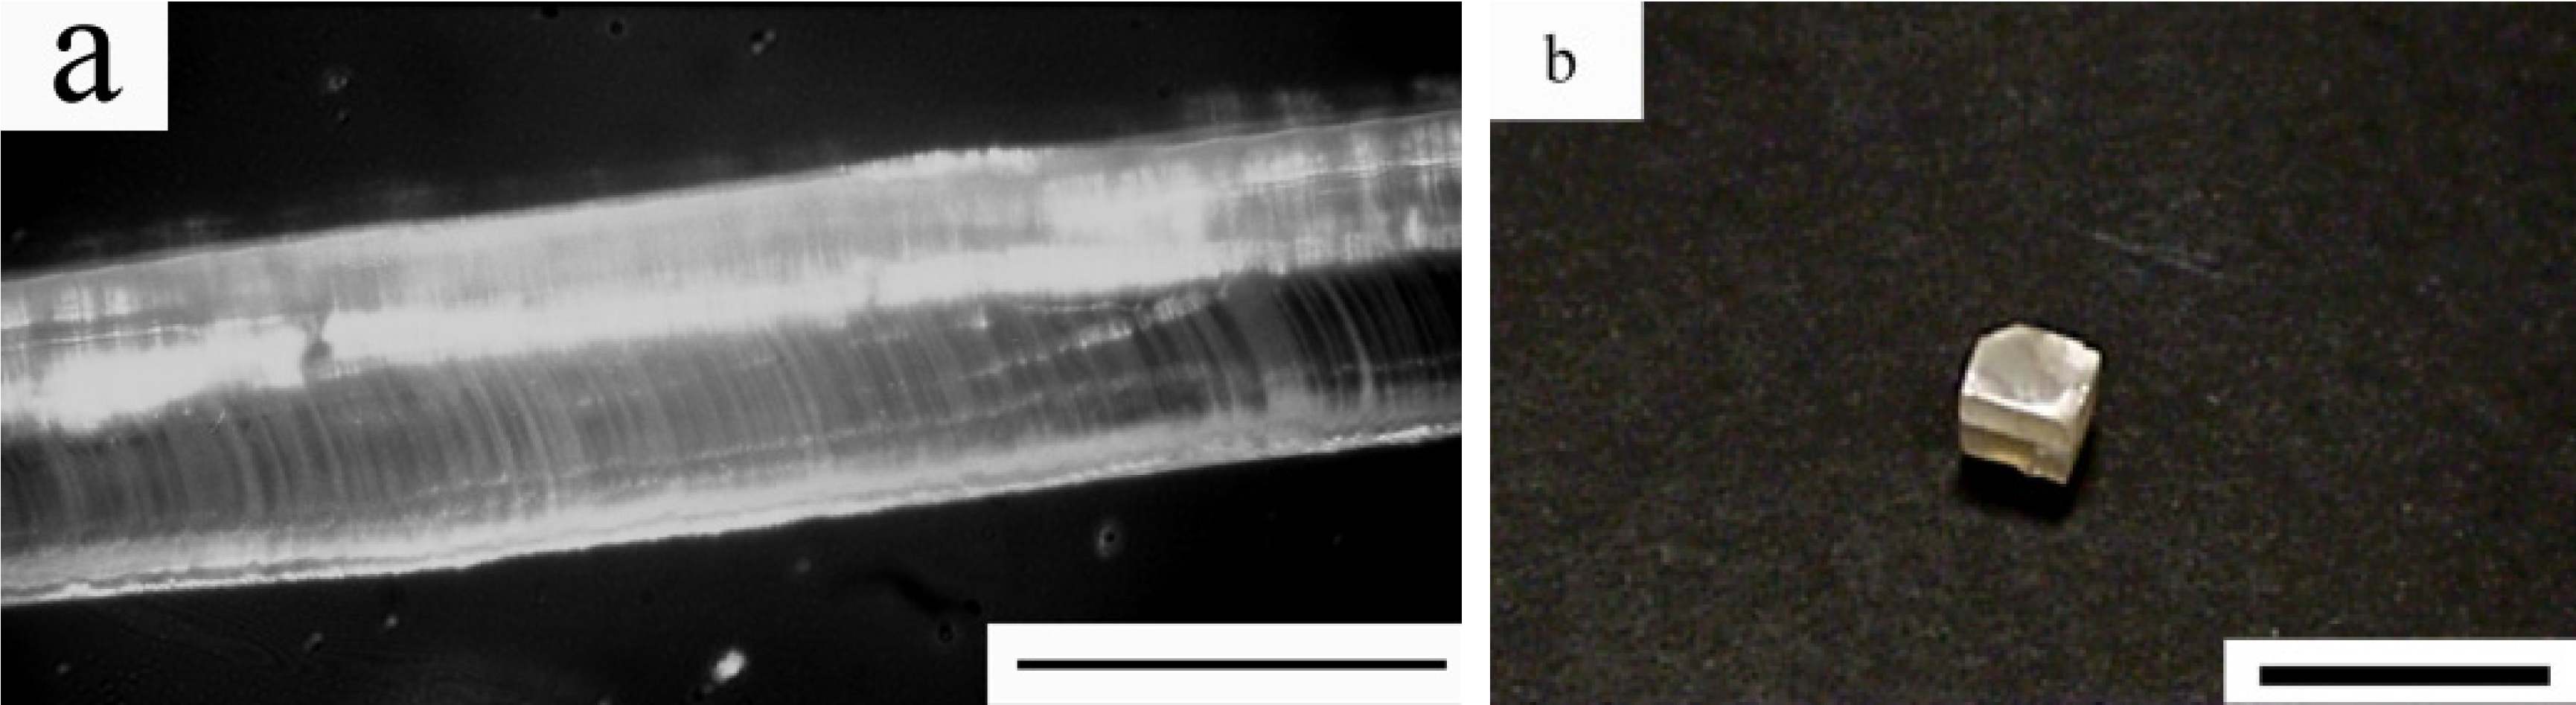
Figure 5 shows the crystals grown by the Fz-PD method (a) and by the Ts-Cz method (b) [
33]. Brownish and transparent crystals were grown under an air atmosphere. The surface of the crystals grown by the Ts-Cz method looks opaque, but the inside is transparent. The shape of the solid-liquid interface is expected to be flat during the growth. For the transparent crystal grown by the Ts-Cz method, a crack was induced during the cooling process. Grown crystals were found to have a cleavage plane. The cleavage plane was in the
c-plane in orthorhombic symmetry according to the X-ray analysis. The growth direction was close to the
c-axis by the Ts-Cz method. Crystals grown by the Fz method were opaque and not transparent as well as polycrystalline. Temperature gradient at the solid-liquid interface was found to be in the following order: Fz-PD method > Fz method > Ts-Cz method. According to thermal analysis by DTA, the melting point and the solidification point were found to be 60 °C lower than the reported value [
31]. Deviation from stoichiometric composition was expected by the evaporation of Pb and K. Even the evaporation of Pb was also expected, the Pb content in the crystal was found to be increased as shown later. We conclude that the reason was due to the evaporation of both Pb and K. A striation image was observed caused by temperature fiuctuation. The crystal quality was found to be improved, and that it was caused by a size-effect [
22]. The phase analysis result was in agreement with the JCPDS card (No. 33–1020) in orthorhombic symmetry. According to X-ray diffraction measurements, lattice parameters were found to be
a = 1.7714 nm,
b = 1.7890 nm and
c = 0.3923 nm by the Fz-PD method, and
a = 1.7754 nm,
b = 1.77981 nm and
c = 0.3910 nm by the Ts-Cz method. Despite the deviation from stoichiometric composition, the lattice parameters are similar to the reported values [
32]. According to the powder X-ray diffraction result, the pattern of the evaporated material in the Ts-Cz method is in agreement with the PbO structure in the JCPDS card (No. 38–1477). On the other hand, small evaporation was observed on the PKN crystal grown by the Fz-PD method.
Figure 5.
(
a) Pb
2KNb
5O
15 (PKN) crystals grown by the Fz-PD method. (
b) PKN crystals grown by the Ts-Cz method, reprinted with permission from [
33]. Copyright 2004 The Japan Society of Applied Physics. Scale bar: (a) 1 mm, (b) 10 mm.
Figure 5.
(
a) Pb
2KNb
5O
15 (PKN) crystals grown by the Fz-PD method. (
b) PKN crystals grown by the Ts-Cz method, reprinted with permission from [
33]. Copyright 2004 The Japan Society of Applied Physics. Scale bar: (a) 1 mm, (b) 10 mm.
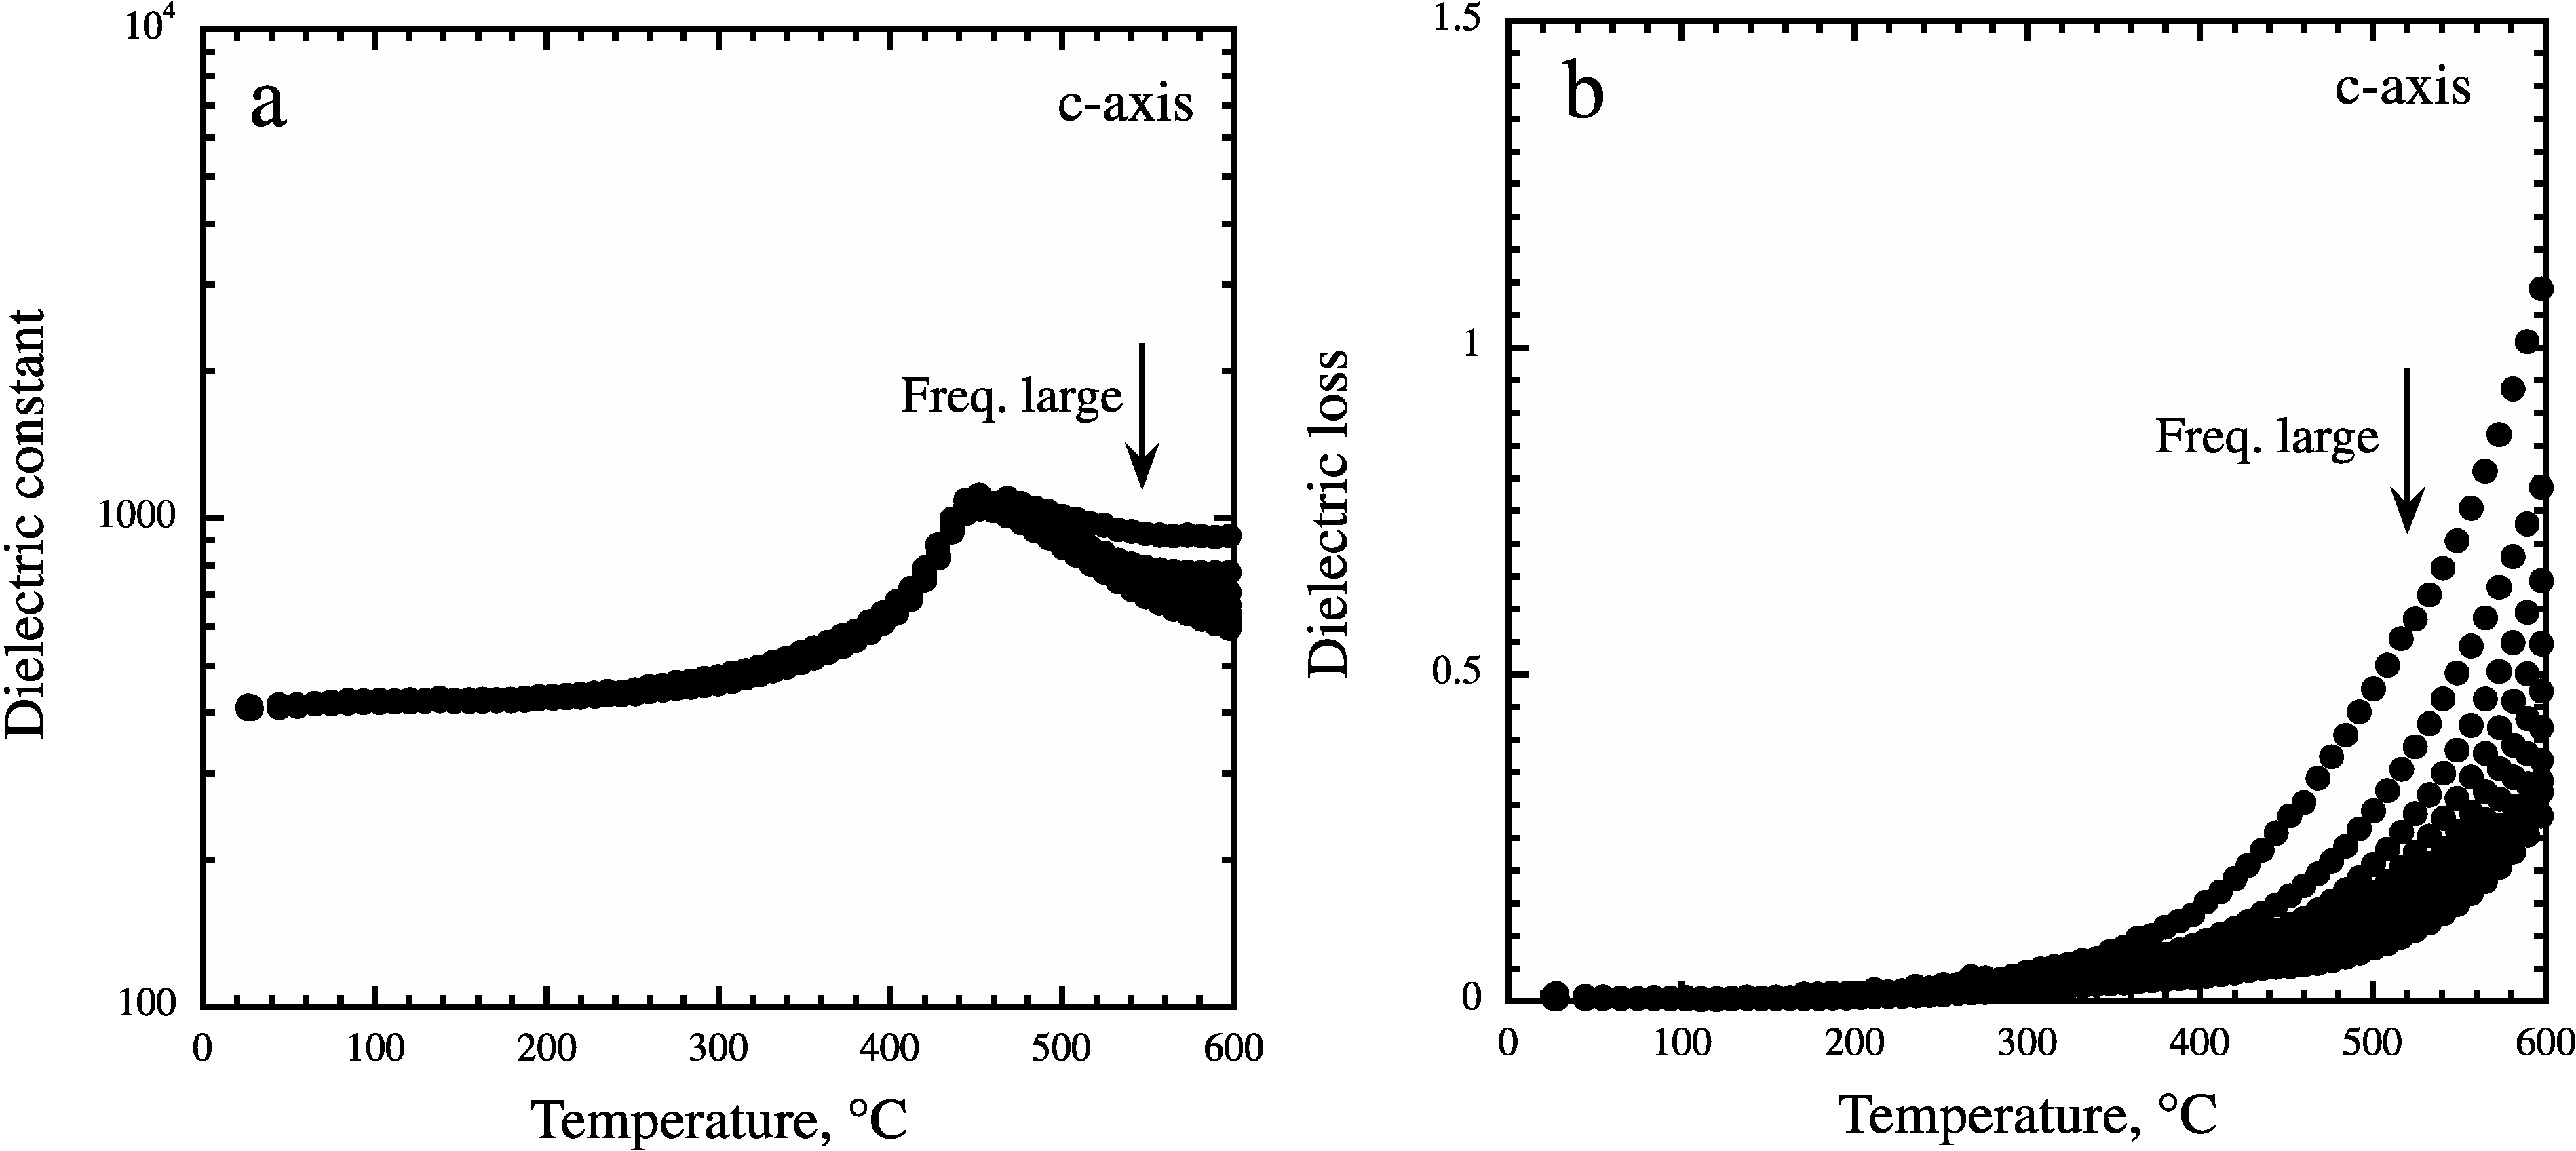
Figure 6 shows temperature dependence of the dielectric constant measured along the
c-axis at 10 kHz and applied electric voltage of 1 V, during the heating process [
33]. The value is 500–1000. These values are similar to that of the literature ones [
27]. Clear phase transition from the tetragonal to orthorhombic structures was observed near 460 °C.
The chemical formula of the Ts-Cz grown crystal was determined to be Pb
2.1K
0.8Nb
5O
15 using the inductively coupled plasma-atomic emissions spectrometry (ICP-AES) method when we assumed the Nb content to be 5 in chemical formula. To determine the directions, the dielectric constant along the
c-axis was found to decrease with increasing frequency above the Curie point. However, this behavior was not observed along the
a- and
b-axes, or <110> direction. Frequency dependence of the dielectric constant was found to be small along the
a- and
b-axes or the <110> direction [
33]. On the other hand, the dielectric loss was found to decrease with increasing frequency above the Curie point along the
a- and
b-axes or the <110> direction [
33]. This kind of dependence is common in most ferroelectric crystals. We obtained an almost isotropic dielectric constant on the
ab-plane. According to the report [
30], different dielectric constant patterns along the
a- and
b-axes exist below the Curie point. In reference [
31], the
b-axis was reported to be the spontaneous polarization direction. Almost identical dielectric constants along the
a- and
b-axes were reported for Ba
2NaNb
5O
15 (BNN) with a tungsten bronze structure [
34].
Figure 6.
Temperature dependence of the dielectric constant of PKN crystals measured along the
c-axis at 10 kHz with an applied electric voltage of 1 V, during the heating process, reprinted with permission from [
33]. Copyright 2004 The Japan Society of Applied Physics.
Figure 6.
Temperature dependence of the dielectric constant of PKN crystals measured along the
c-axis at 10 kHz with an applied electric voltage of 1 V, during the heating process, reprinted with permission from [
33]. Copyright 2004 The Japan Society of Applied Physics.
5. The Na, Rb and Cs Multiple Dope KNbO3 Crystals
It is difficult to grow a large size and high quality KN crystal. Thus most of the high quality and low lattice defect KN single crystals have been grown in fiber-shapes [
35]. On the other hand, Na doping has been studied on KN thin films in recent years [
36,
37,
38,
39]. With the Na doping, the piezoelectric properties were improved. However, Na doping has been so far reported only on thin films but not on single crystals. This is because the composition of grown single crystals is changed by the difference of ionic radius,
i.e., the Na ion is too small compared with the rest of the ions [
26]. We consider that the situation can be improved by doping with larger ions of Rb or Cs as a co-dopant [
10]. We attempted to grow alkali metal ion doped potassium niobate single crystals in fiber-shape by our original pulling down technique with the orthorhombic phase at room temperature [
10,
40], and investigated their growth conditions.
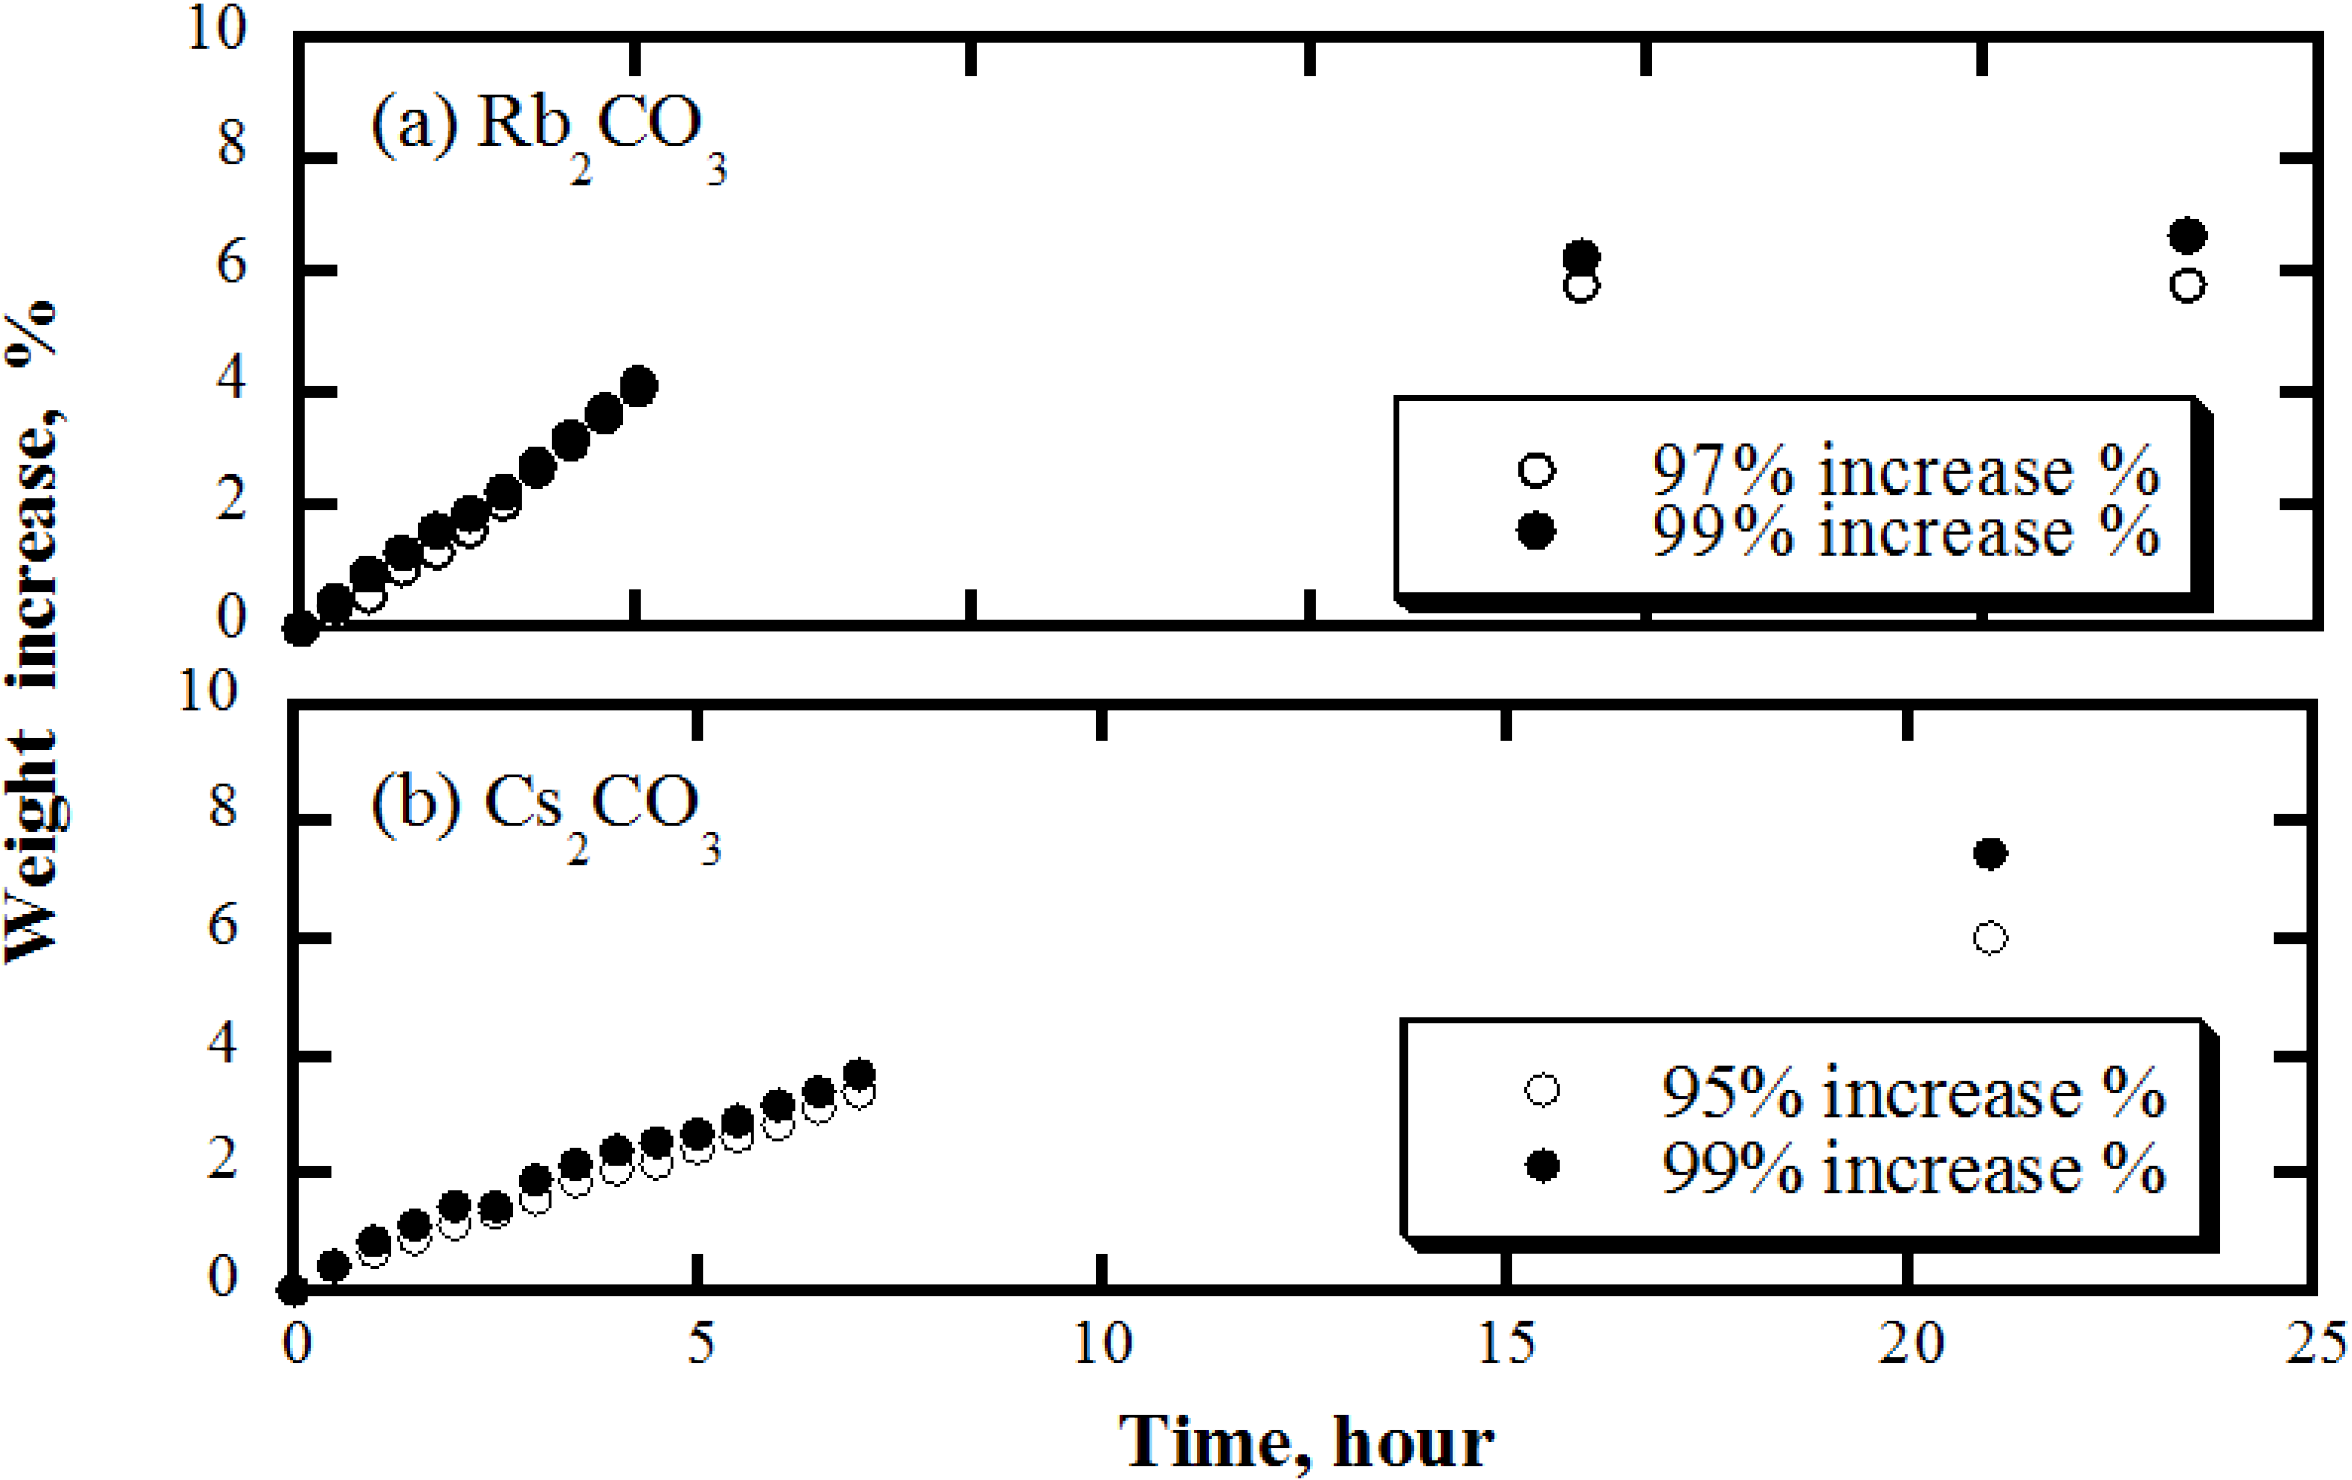
Starting materials of Rb and Cs carbonate absorb moisture quickly. Synthesized starting pellets by the solid-state reaction method would decompose even under a very dry atmosphere.
Figure 7 shows the weight increase of Rb and Cs carbonates powders against time for high and low purities [
41]. In both cases, high purity carbonates increase in weight faster due to a faster absorption rate of moisture. Lastly the solid-state powder was changed to liquid-state. So lower purity carbonates were found to be more suitable for starting materials in the present crystals. According to the EDX analysis, most impurities were determined to be K and Na ions. Thus in this case, the impurity does not affect the crystal growth and the properties so much.
Figure 7.
Weight increase of (
a) Rb carbonate and (
b) Cs carbonate powders depending on the purity, reprinted with permission from [
41]. Copyright 2010 Elsevier.
Figure 7.
Weight increase of (
a) Rb carbonate and (
b) Cs carbonate powders depending on the purity, reprinted with permission from [
41]. Copyright 2010 Elsevier.
It is impossible to prepare perfect source materials. Consequently we used low purity starting materials such as 97 mol% Rb (Rb2CO3, Wako Pure Chemical Industries, Osaka, Japan) and 95 mol% Cs (Cs2CO3, Wako Pure Chemical Industries) but not high purity carbonates (99 mol%, Sigma-Aldrich, St. Louis, MO, USA). K2CO3 and Nb2O5 were the same as the KN source materials.
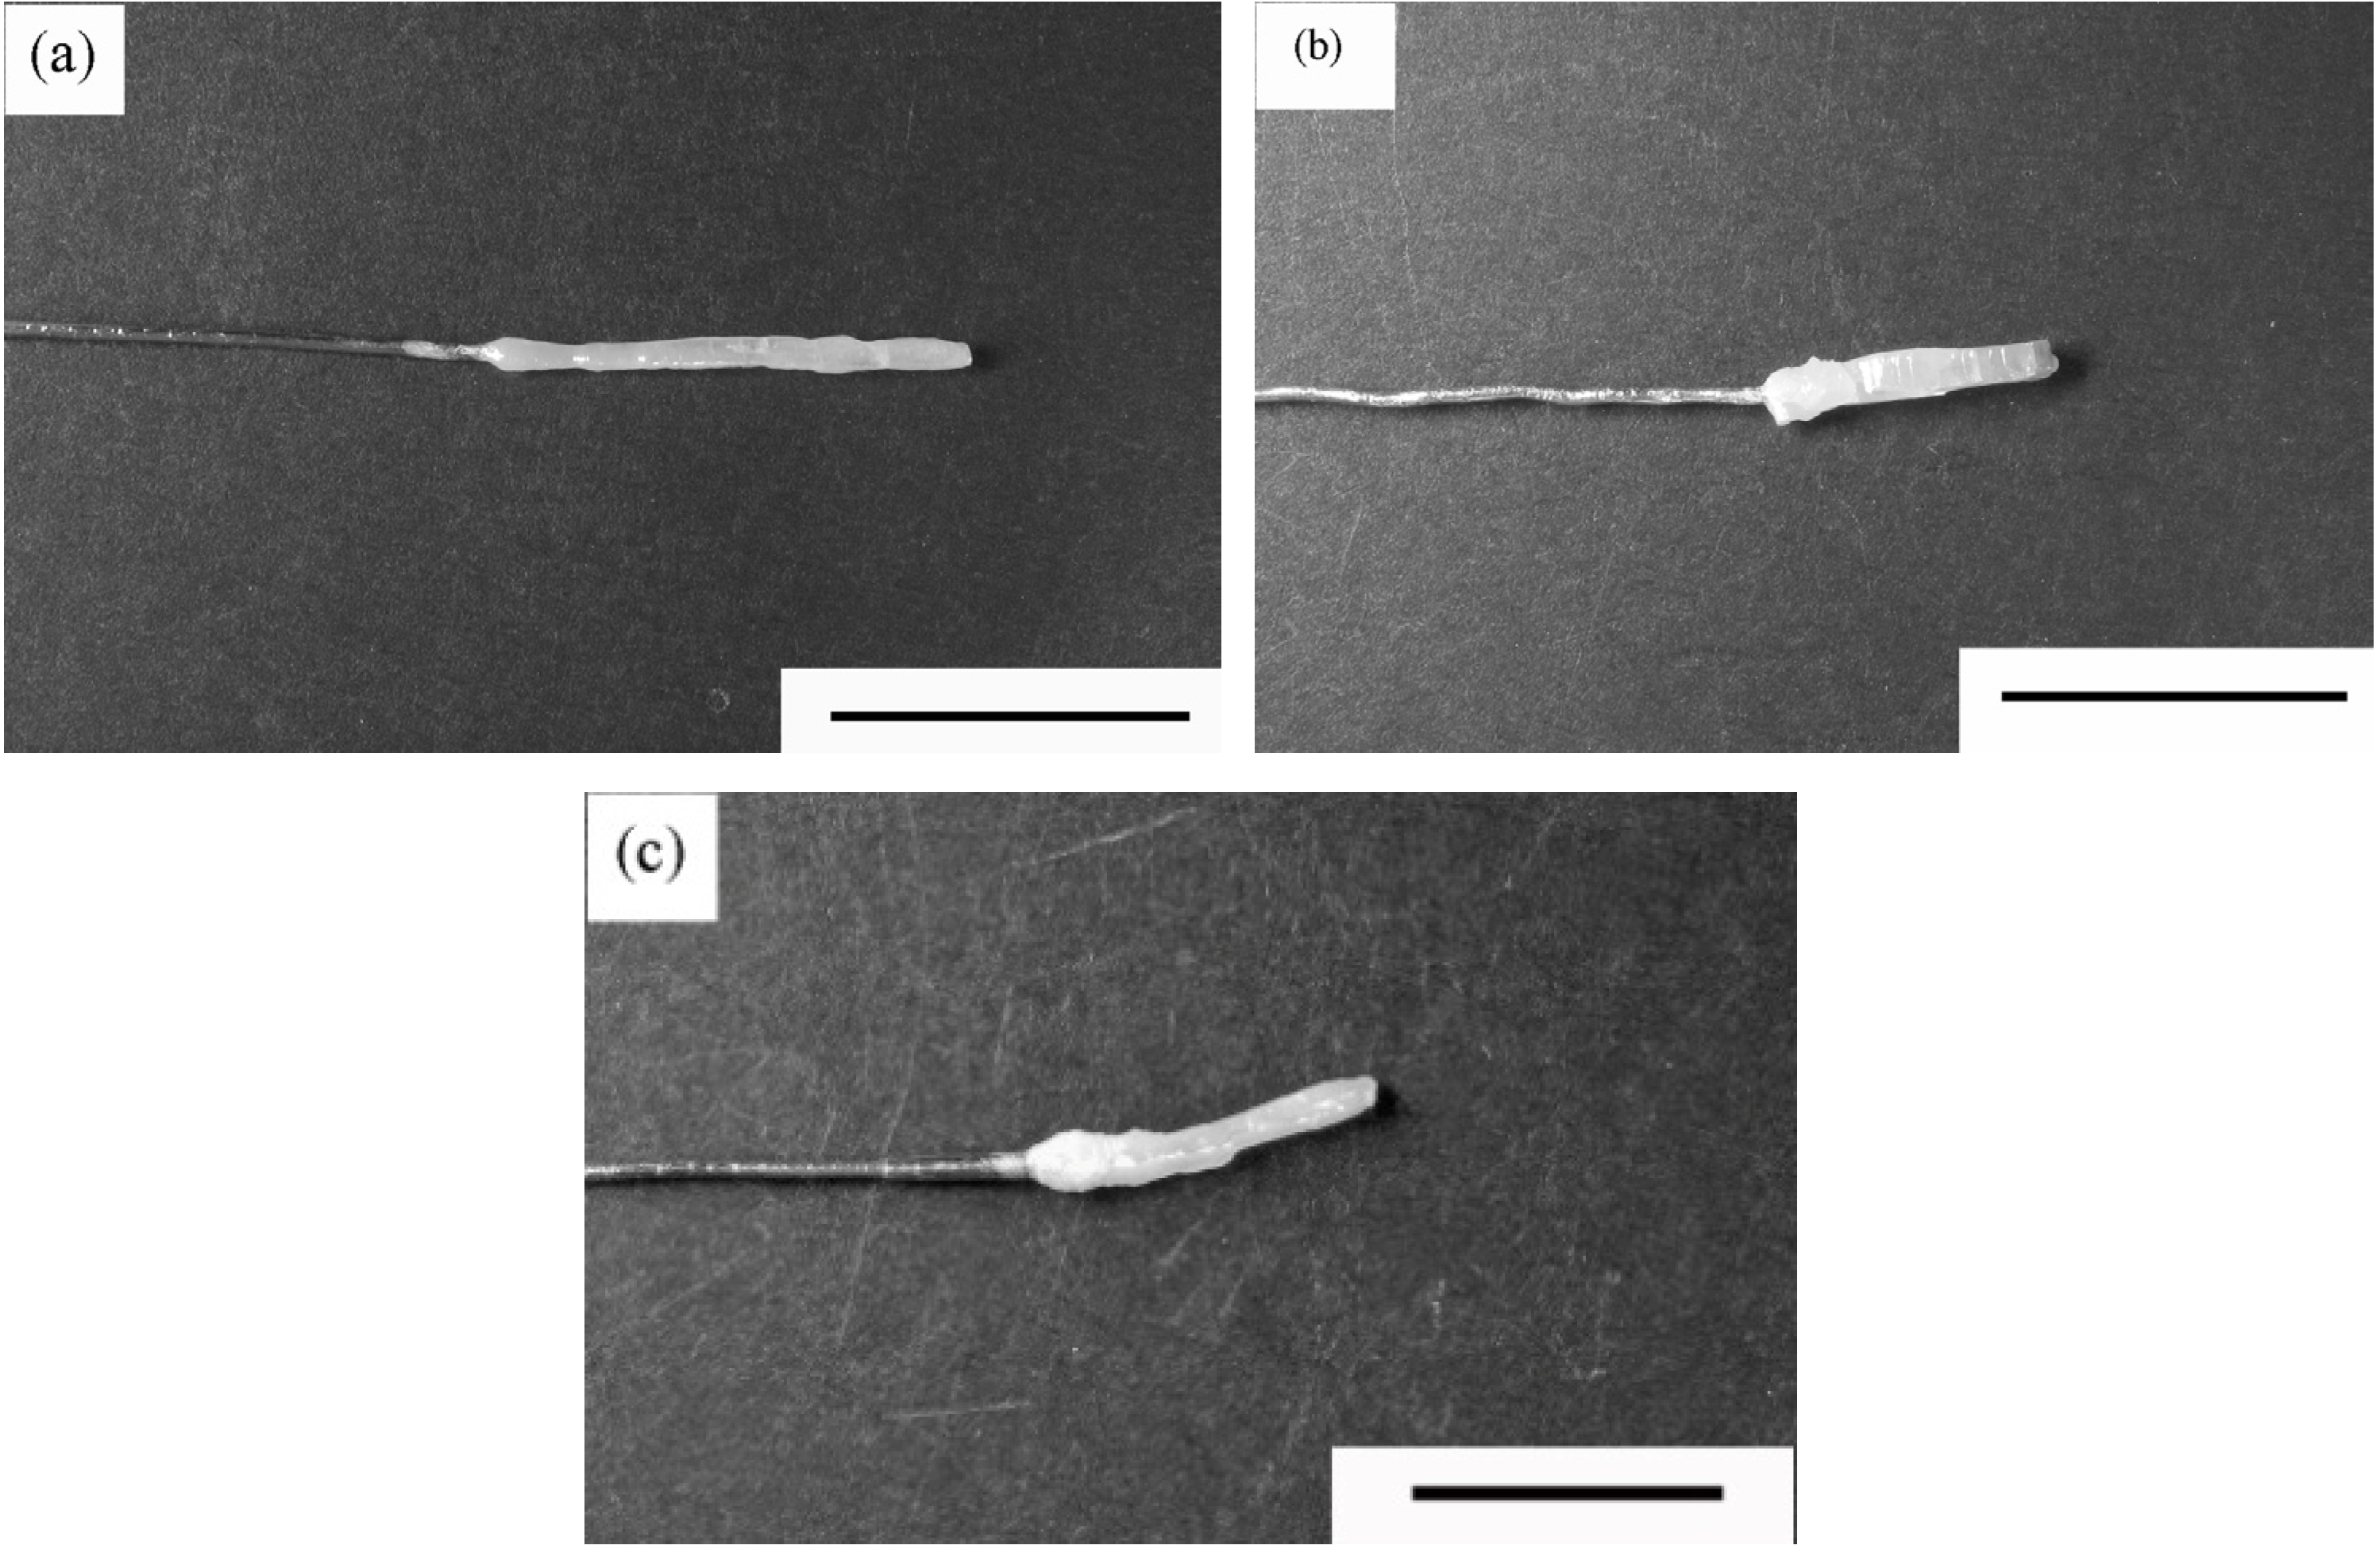
Figure 8 shows the typical as-grown single crystals on KN: KNbO
3, KNN: (K,Na)NbO
3, KNRN: (K,Na,Rb)NbO
3, KNCN: (K,Na,Cs)NbO
3 [
41]. Crystals were grown in an Ar gas flow condition, the Pt wire’s pulling-down rate was 10 mm/h and there was no crystal rotation. These single crystals were brownish and transparent in appearance. The orthorhombic system can be formed at room temperature for KNRN and KNCN as well as KN and KNN. In a conventional double ellipsoidal mirror furnace, the homogeneous temperature region is small in the vertical direction. In this case, the 4 mm diameter Pt tube direction was better than the 3 mm diameter Pt tube as it enabled further extension of the homogeneous temperature region in the horizontal direction.
The crystal sizes were 1–2 mm in diameter and 5–10 mm in length. Crystals were grown along mostly the
c-axis (shortest axis in the orthorhombic system). The
c-axis can be estimated easily from a rectangle crystal habit. The quality of the grown crystals was good according to observations under cross-nicols. In a fiber-shape single crystal, self-poling effect is expected as well as observed in LiNbO
3 [
42]. Unfortunately the self-poling effect was also difficult to observe in the present crystal. Sometimes the domain structure was observed on crystals.
Inspite of Na, Rb or Cs co-doping, single-phase single crystals could be grown in fiber-shape. The grown crystals were found to be of good quality by using cross-nicols observations.
Figure 8.
Typical as-grown single crystals of (
a) KNN: (K,Na)NbO
3; (
b) KNRN: (K,Na,Rb)NbO
3; and (
c) KNCN: (K,Na,Cs)NbO
3, reprinted with permission from [
10,
41,
43]. Copyright 2009 World Scientiflc Publishing Company; 2010 Elsevier; 2011 WILEY-VCH Verlag GmbH & Co. KGaA. Scale bar: 10 mm.
Figure 8.
Typical as-grown single crystals of (
a) KNN: (K,Na)NbO
3; (
b) KNRN: (K,Na,Rb)NbO
3; and (
c) KNCN: (K,Na,Cs)NbO
3, reprinted with permission from [
10,
41,
43]. Copyright 2009 World Scientiflc Publishing Company; 2010 Elsevier; 2011 WILEY-VCH Verlag GmbH & Co. KGaA. Scale bar: 10 mm.
To study the adequate required amount of the doped alkali metal ions, the amount was changed up to 20 mol% of doped alkali metal ions. In the KNN (KNbO
3-NaNbO
3) phase diagram [
44], liquidus and solidus lines deviated considerably. Thus composition is changed during the crystal growth. Here, the lattice parameter difference was measured by XRD, and the Na composition change was measured by EDX between the first and the last parts of grown crystals. The lattice volume and the chemical composition of alkali metal ions were changed largely on KNN. On the other hand, the composition change could be improved by means of co-doping with other alkali metal ions with different ionic radius.
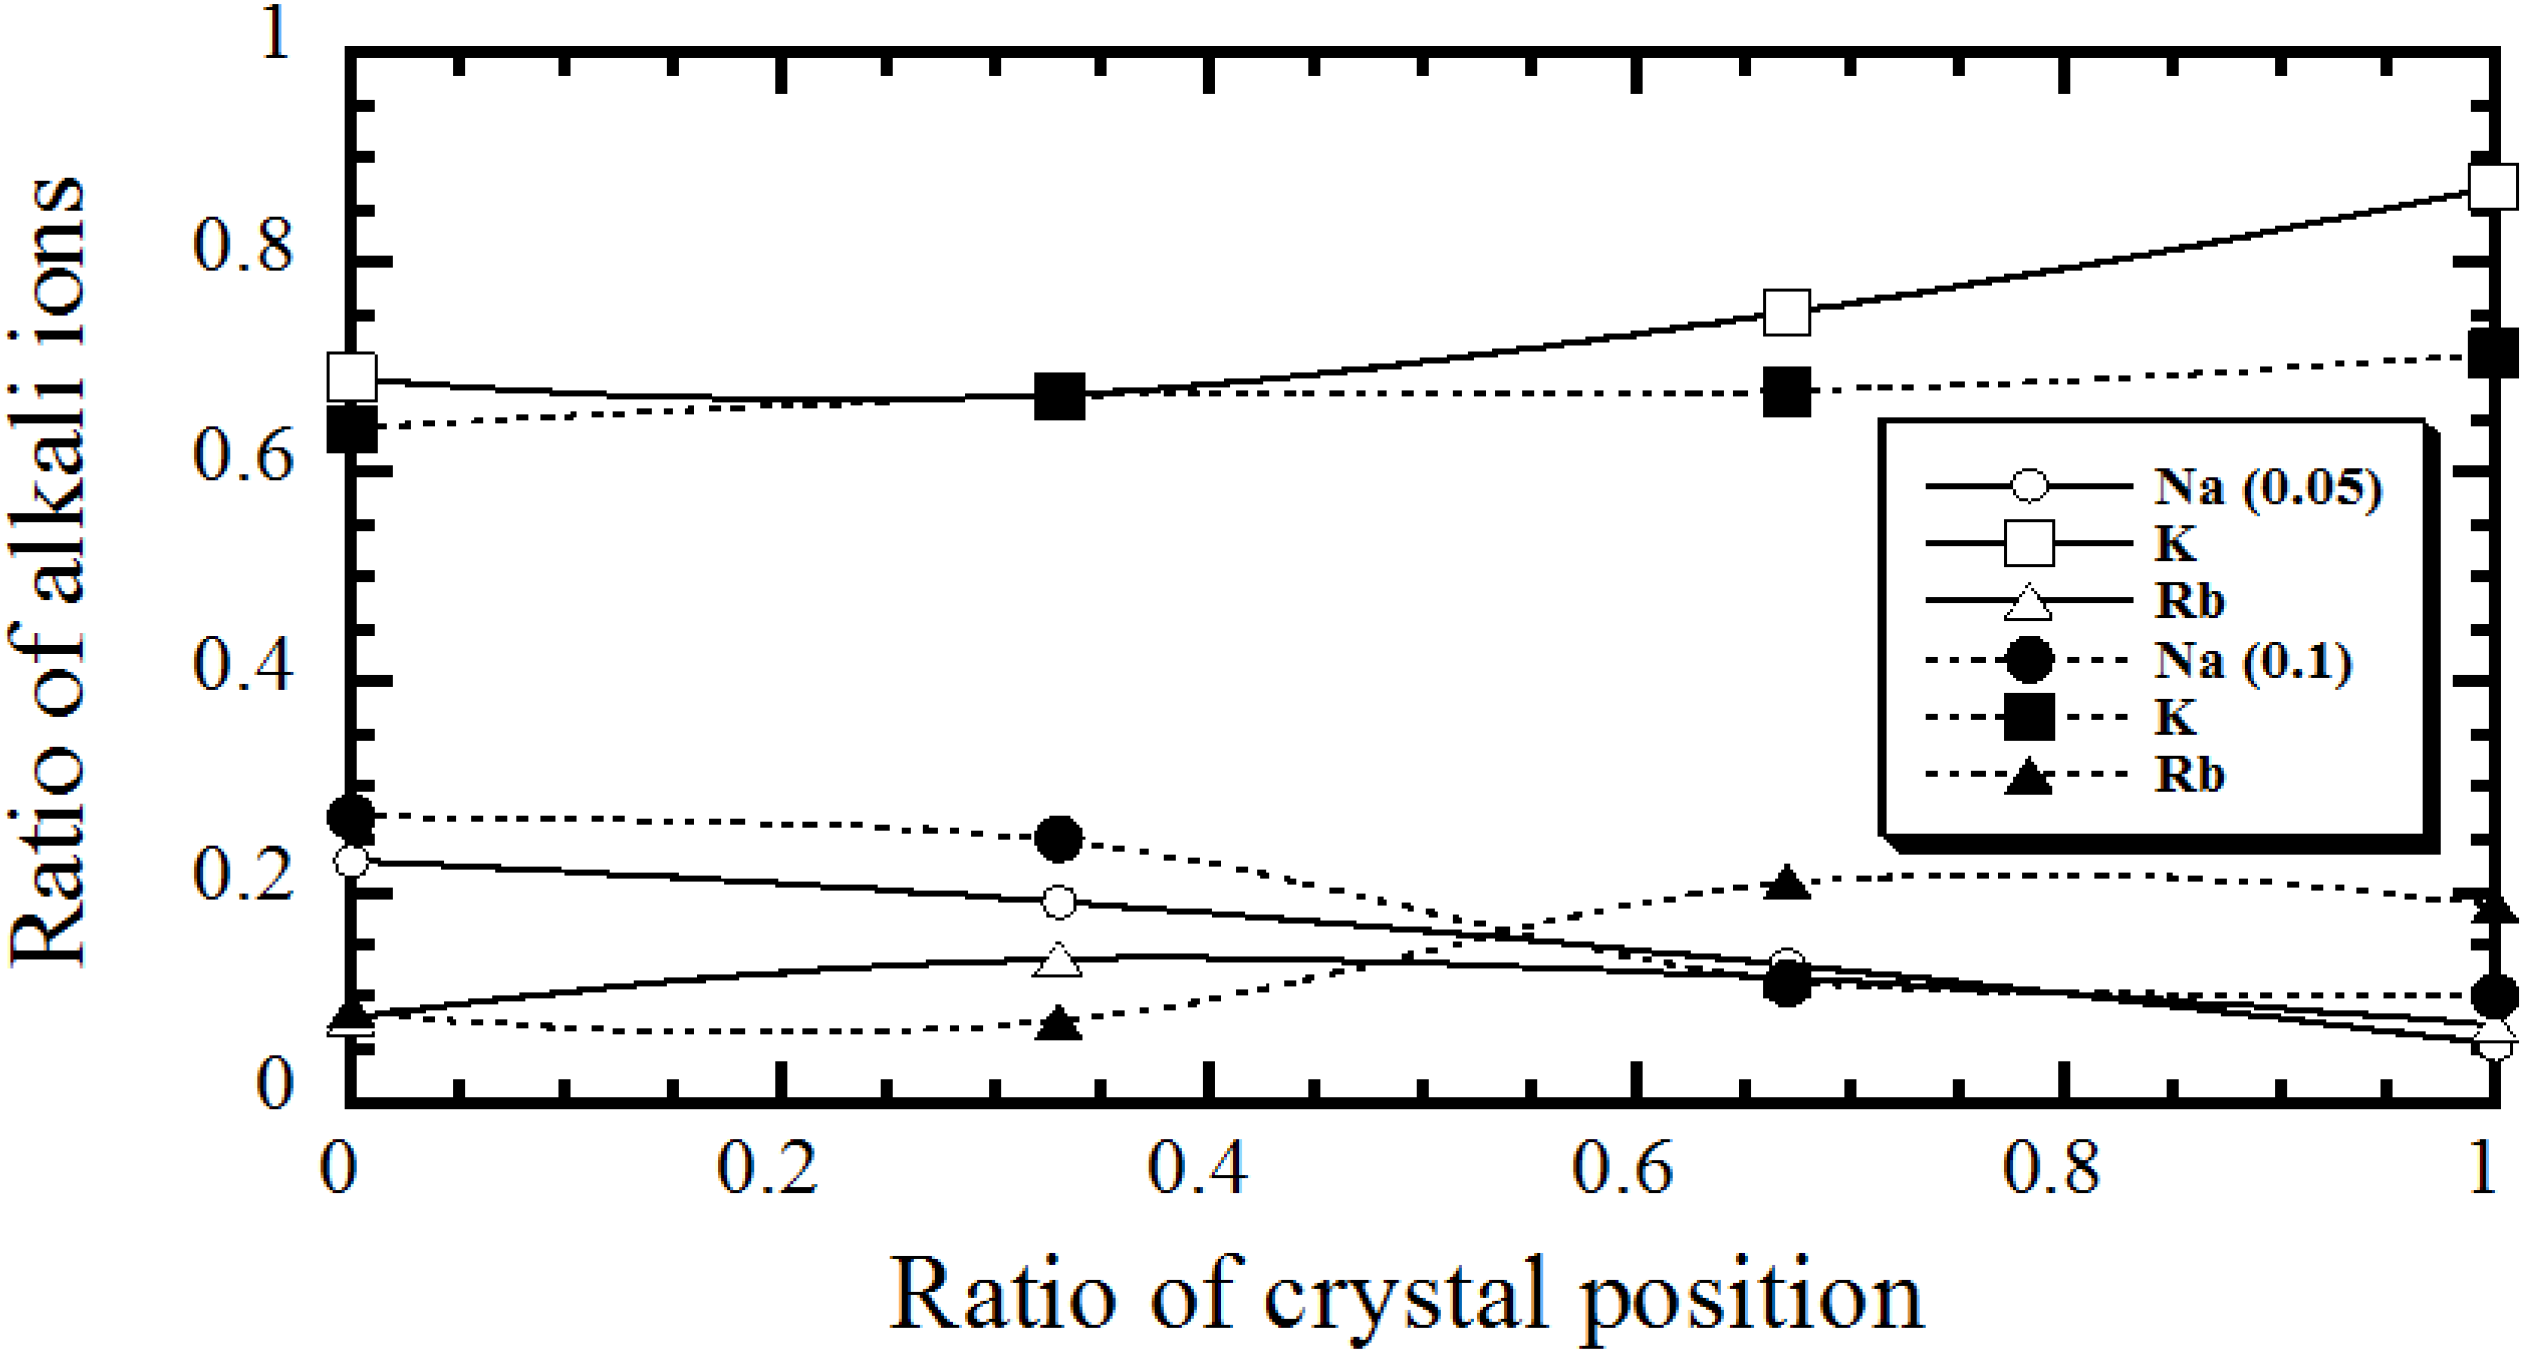
Figure 9 shows the relationship between the ratios of alkali metal ions and the ratio of crystal position on the KNRN when starting Na content is 5% and 10% [
41]. This figure shows in two cases that the starting Na ratios of alkali metal ions are 0.05 and 0.1. As compared with the KNN, the composition change during growth was improved on the KNRN for both Na ratios [
41]. The composition change was further improved by co-doping of Rb or Cs with Na.
Usually there are double solid-state phase transformations on a KN crystal. Even on KNN, KNRN and KNCN, similar phase transformations are expected. When temperature dependence of dielectric constants was measured for the phase transformation by DTA, the peaks corresponding to the phase transformation could be observed. In all cases, double phase transformations were observed clearly. Using the phase transformation temperature, composition change is evaluated. The phase transformation temperatures were decreased by Na doping on KN (KNN), and recovered to those of KN by Na and Rb co-doping (KNRN) [
10,
41]. Similar recovery of the phase transformation temperature was also observed on KNCN [
41]. However, the recovery temperature of KNCN is less than that of KNRN. In the KN series, most single crystals are transparent. The transmittance spectra are almost the same on KN, KNRN and KNCN, which means that these crystals have almost the same band gap. It should be mentioned that the KN series are ferroelectric and piezoelectric crystals.
Figure 9.
Relationship between ratios of alkali metal ions and ratio of crystal position on KNRN: (K,Na,Rb)NbO
3, reprinted with permission from [
41]. Copyright 2010 Elsevier. Starting Na content: 5% and 10%.
Figure 9.
Relationship between ratios of alkali metal ions and ratio of crystal position on KNRN: (K,Na,Rb)NbO
3, reprinted with permission from [
41]. Copyright 2010 Elsevier. Starting Na content: 5% and 10%.
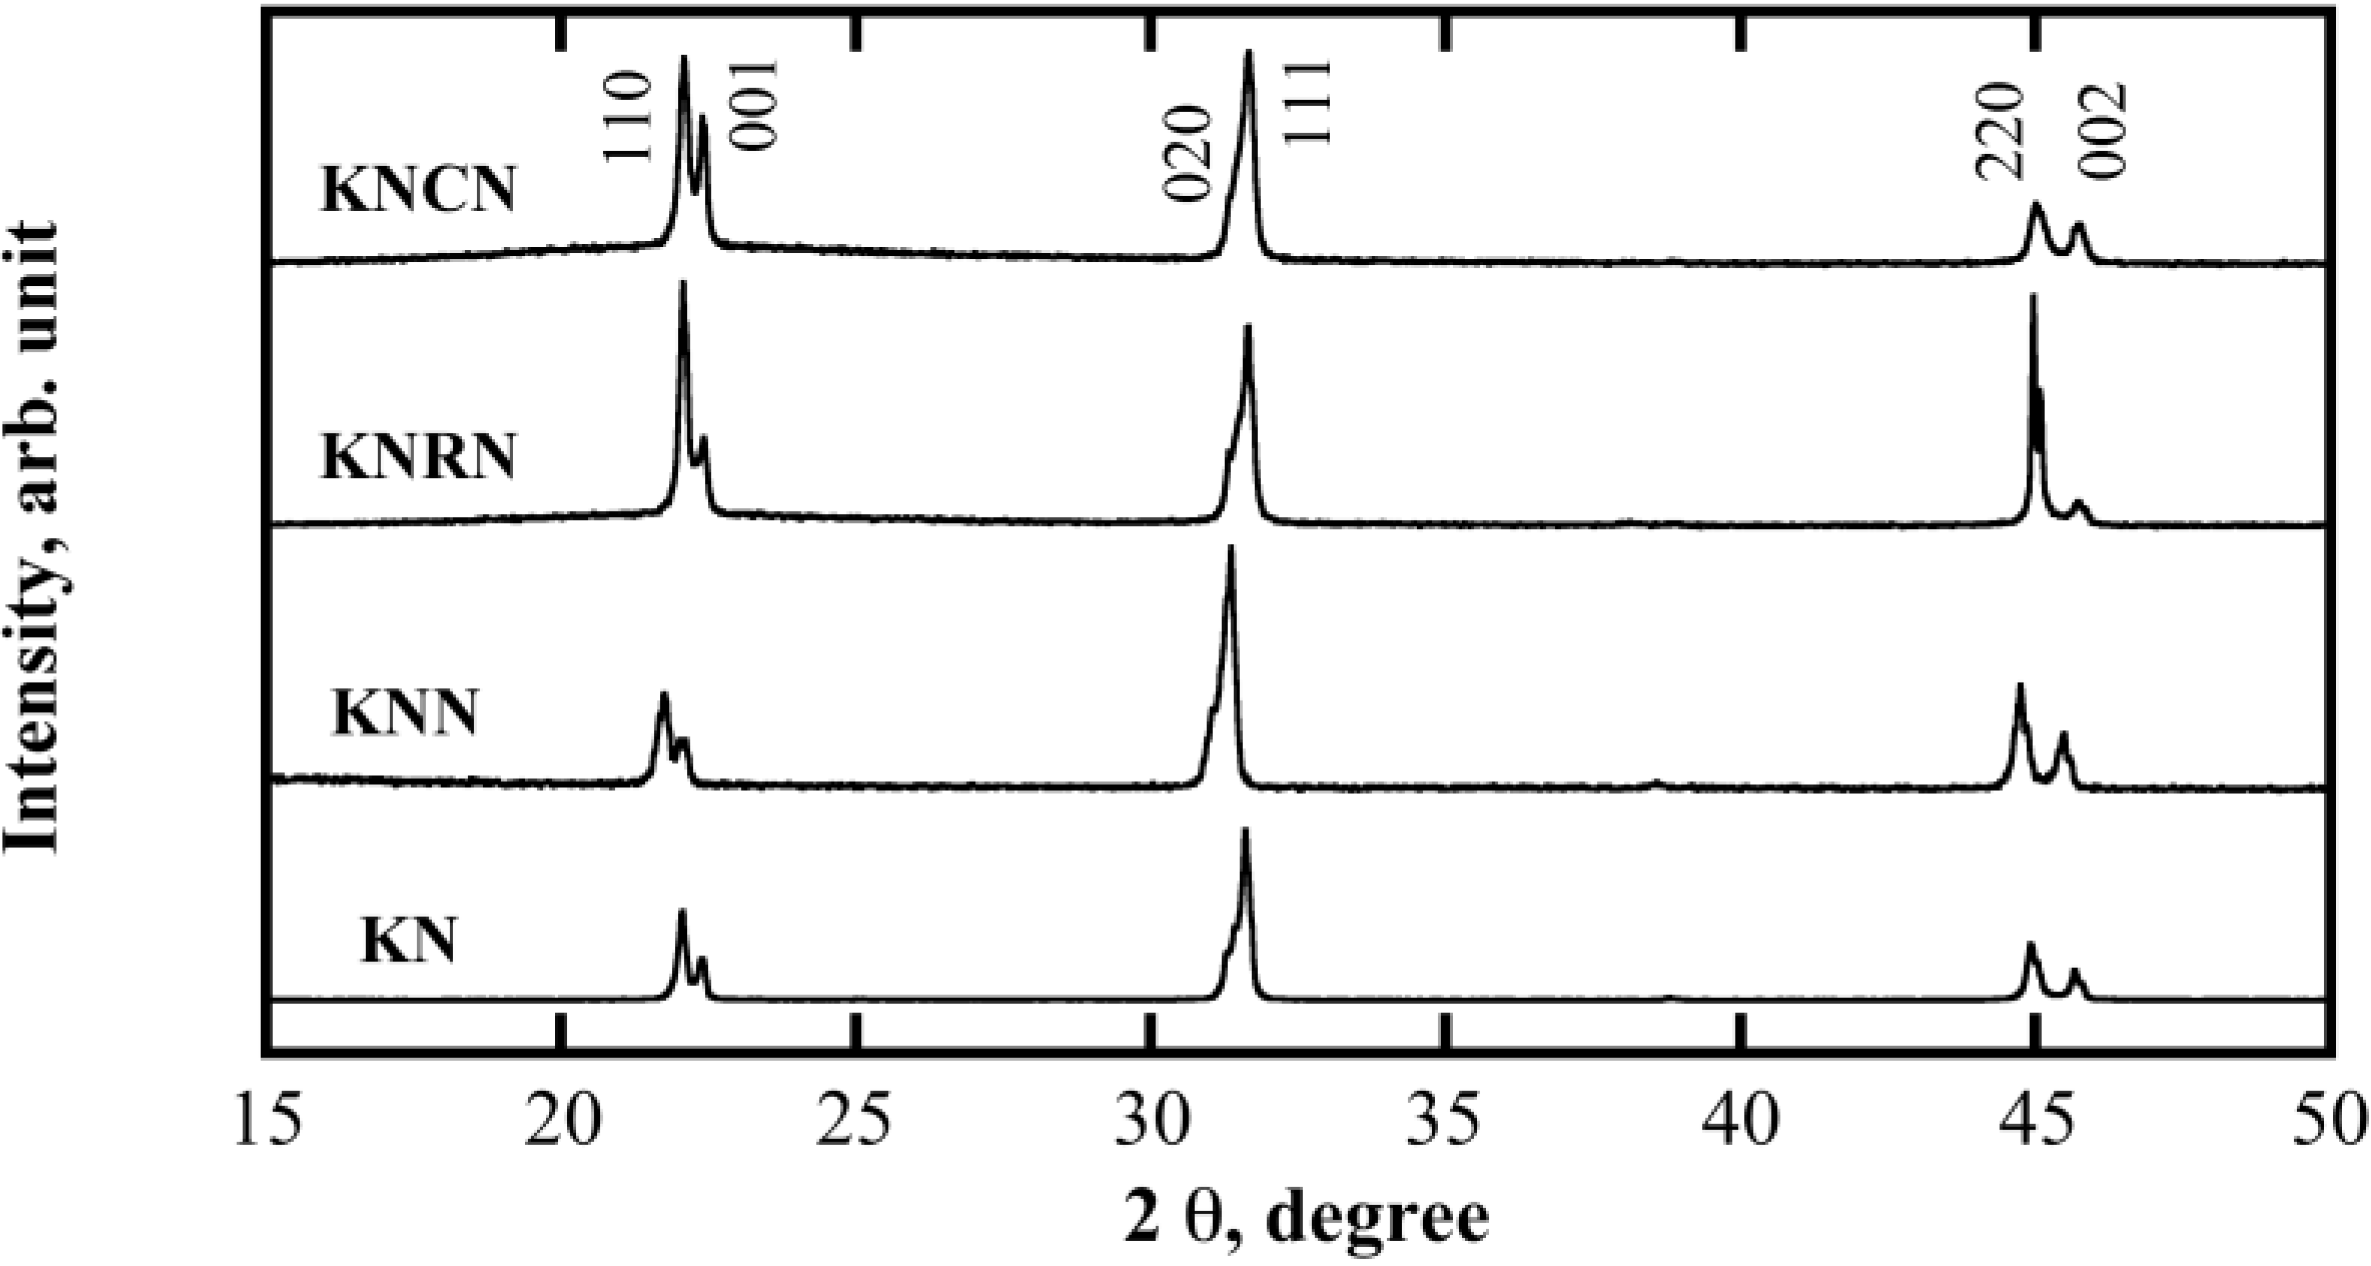
Figure 10 shows the powder X-ray diffraction patterns of KN, KNN, KNRN and KNCN [
45]. The orthorhombic crystal-phase system can be formed at room temperature on the KNRN and KNCN as well as KN [
45]. The peak positions were shifted to lower angles on the KNN pattern. This means that the Na ions can occupy the Nb site hence enlarging the crystal lattice. The peak positions for the KNRN and KNCN were not changed compared to the KN ones. While the chemical composition and the lattice volume of alkali metals were expected to be changed on the KNN dramatically, little change was observed on the KNRN and KNCN [
45],
i.e., the co-doping of Rb or Cs with Na minimizes the change on the chemical composition.
Figure 10.
Powder X-ray diffraction patterns of KN: KNbO
3, KNN: (K,Na)NbO
3, KNRN: (K,Na,Rb)NbO
3, KNCN: (K,Na,Cs)NbO
3, reprinted with permission from [
45]. Copyright 2011 Elsevier and Techna Group S.r.l.
Figure 10.
Powder X-ray diffraction patterns of KN: KNbO
3, KNN: (K,Na)NbO
3, KNRN: (K,Na,Rb)NbO
3, KNCN: (K,Na,Cs)NbO
3, reprinted with permission from [
45]. Copyright 2011 Elsevier and Techna Group S.r.l.
When the temperature dependence of dielectric constants was measured at 10–100 kHz on KN, KNN, KNRN and KNCN along the c-axis without poling, peaks corresponding to the phase transformation from the rhombohedral to orthorhombic structures were observed around 240 K. A clear difference between the different co-doping crystals was not observed. At high temperatures, the peaks corresponding to phase transformation (such as between orthorhombic, tetragonal and cubic structures) could also be observed. The value of the high-temperature dielectric constant of KNN is the largest compared with KN, KNRN and KNCN. Since the composition change of the KNN crystal is expected to be the largest, we therefore consider these dielectric constant values to be mainly the same for all co-doping crystals. Hysteresis in the temperature was observed during heating and cooling processes, especially at low-temperature transformation. We investigated the difference in phase transformation temperature during the heating and cooling processes at high temperatures. The temperature difference between the orthorhombic and tetragonal structures was found to be larger compared to the difference between tetragonal and cubic structures.
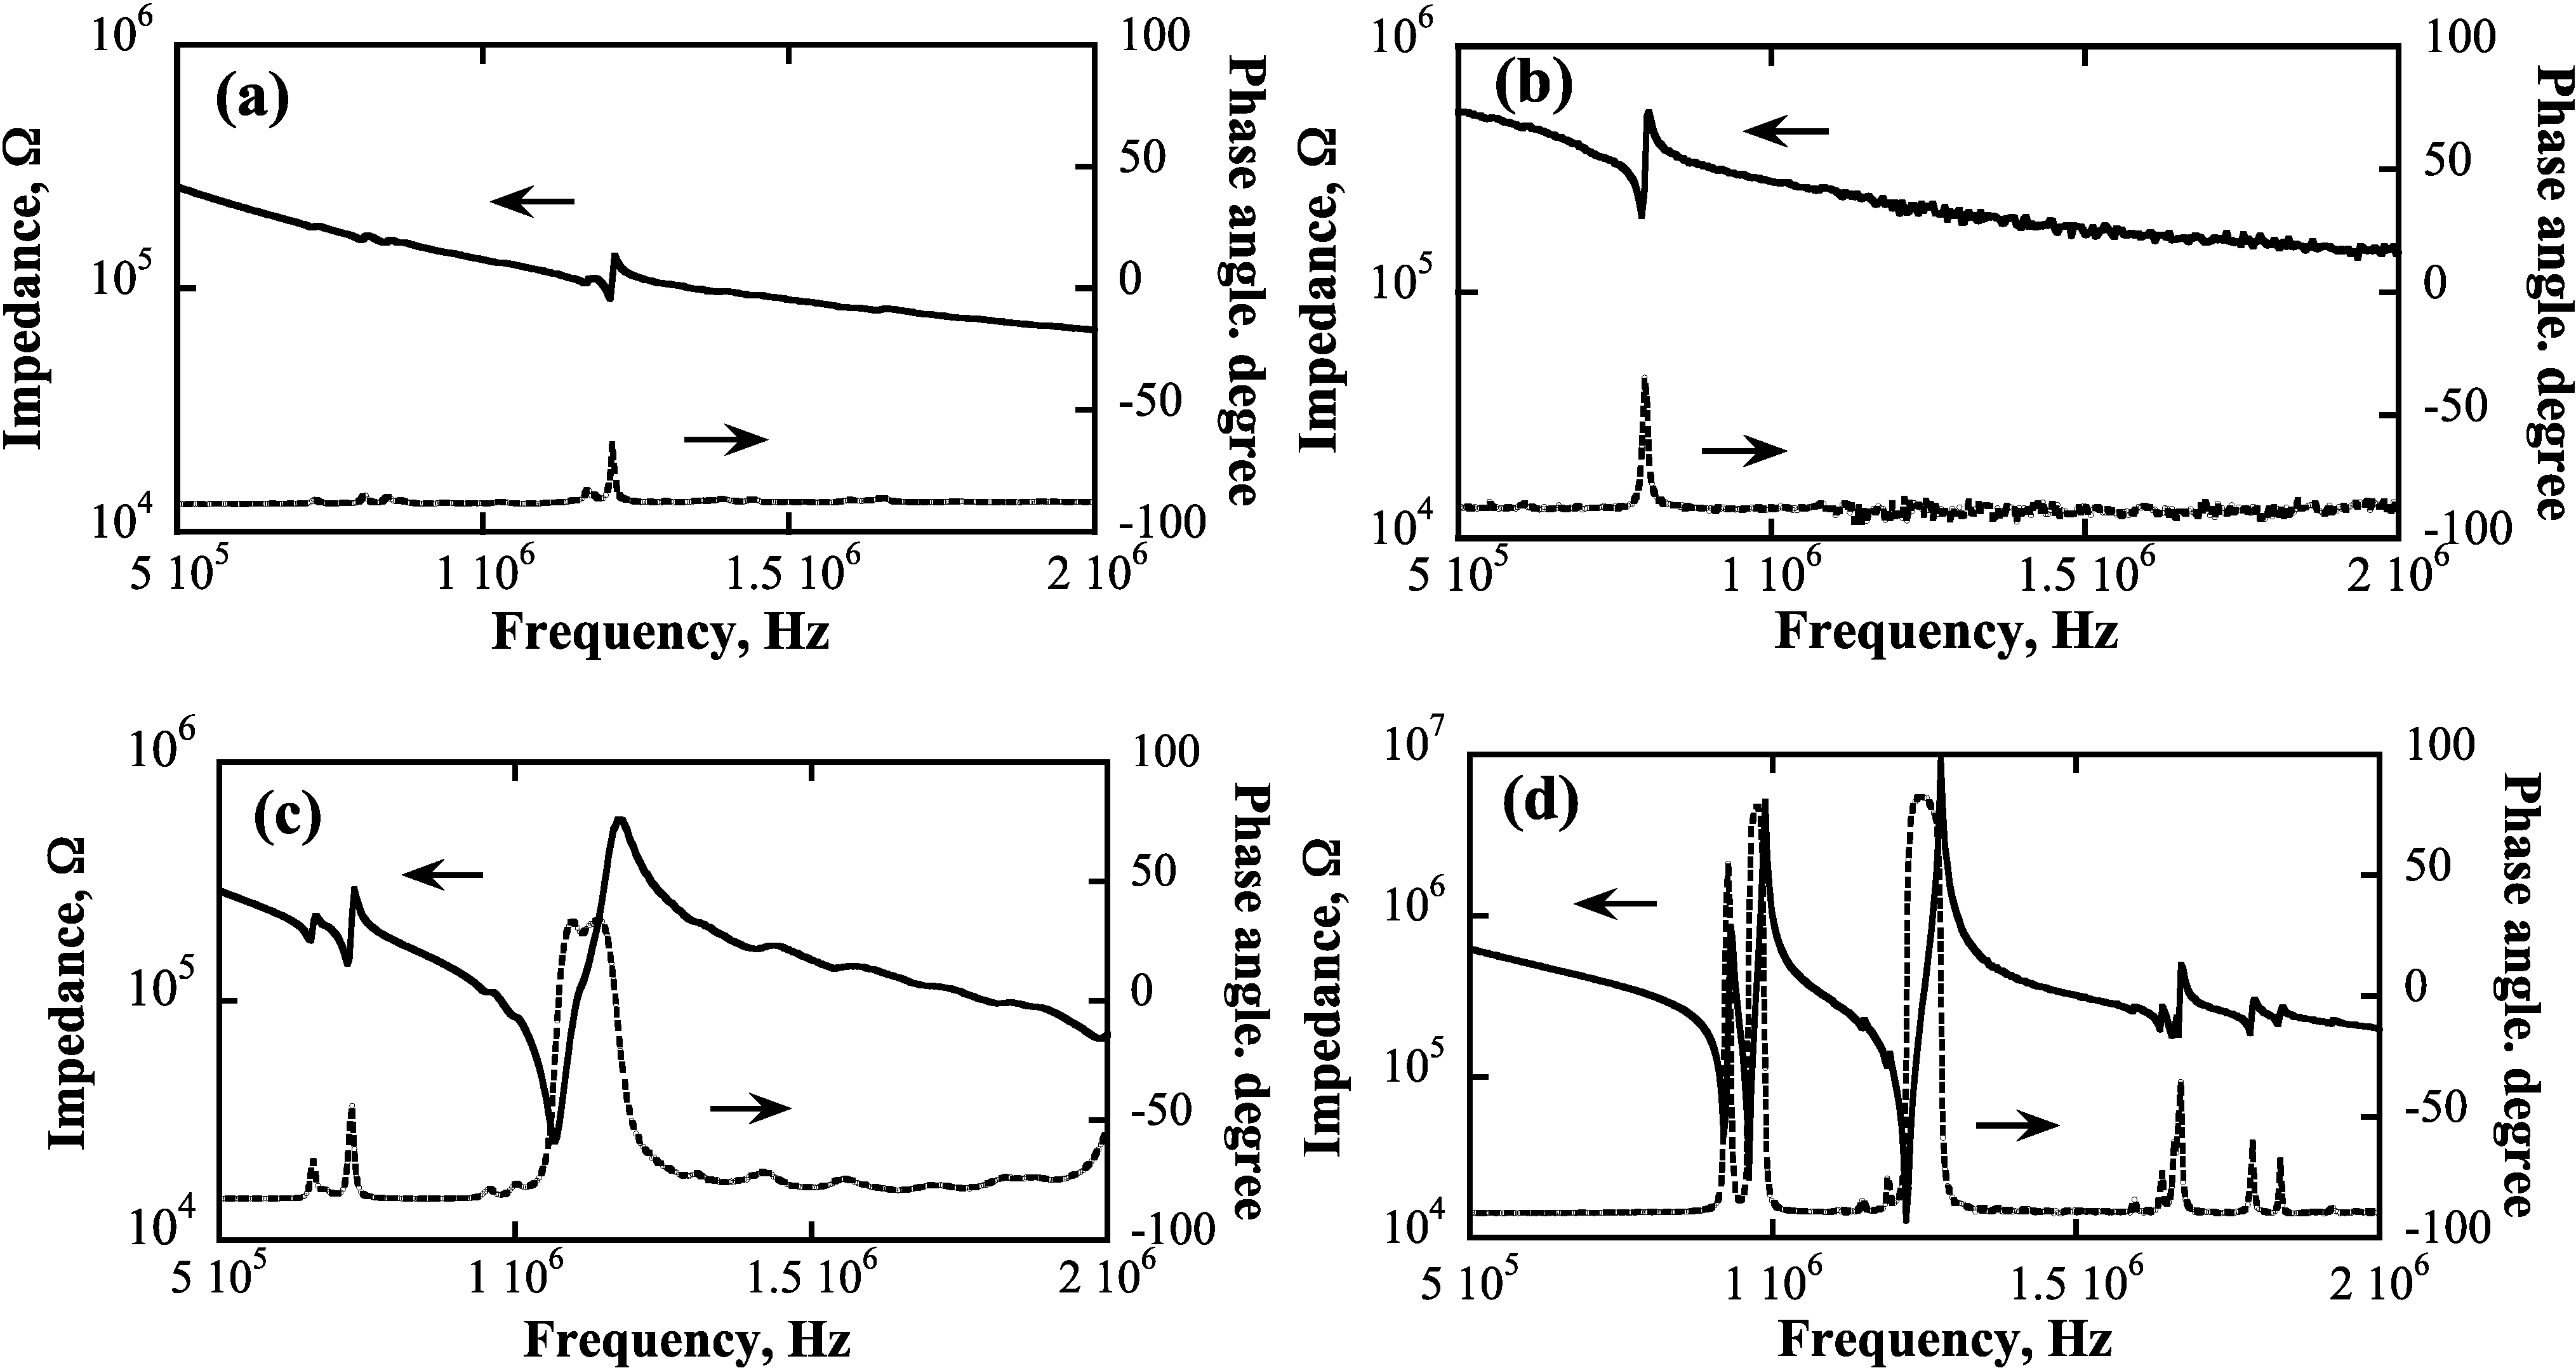
Figure 11 shows the frequency dependence of impedance and phase angle on the KN, KNN, KNRN and KNCN along the longitudinal direction of the
c-axis [
45]. The resonant and anti-resonant peaks, which reflect the piezoelectric properties, could be observed in all samples. The peaks correspond to the vibration mode along the longitudinal direction of the samples. Since poling was not carried out for these samples, the resonant and anti-resonant peaks on KN and KNN were not as large as expected. However, the resonant and anti-resonant peaks of KNRN and KNCN were considerably large. The phase angle also changes from −90% to +50% without poling. Thus we conclude that the co-doping of Rb or Cs with Na enhances the piezoelectric properties. In the KNRN, a large phase angle change was observed but it was not so in KNCN. KN series crystals with multi alkali metal ions, especially on KNRN, are promising Pb-free crystals for ferroelectric and piezoelectric crystals.
Figure 11.
Frequency dependence of impedance and phase angle on (
a) KN: KNbO
3; (
b) KNN: (K,Na)NbO
3; (
c) KNRN: (K,Na,Rb)NbO
3; (
d) KNCN: (K,Na,Cs)NbO
3 along the longitudinal direction of the
c-axis, reprinted with permission from [
45]. Copyright 2011 Elsevier and Techna Group S.r.l.
Figure 11.
Frequency dependence of impedance and phase angle on (
a) KN: KNbO
3; (
b) KNN: (K,Na)NbO
3; (
c) KNRN: (K,Na,Rb)NbO
3; (
d) KNCN: (K,Na,Cs)NbO
3 along the longitudinal direction of the
c-axis, reprinted with permission from [
45]. Copyright 2011 Elsevier and Techna Group S.r.l.
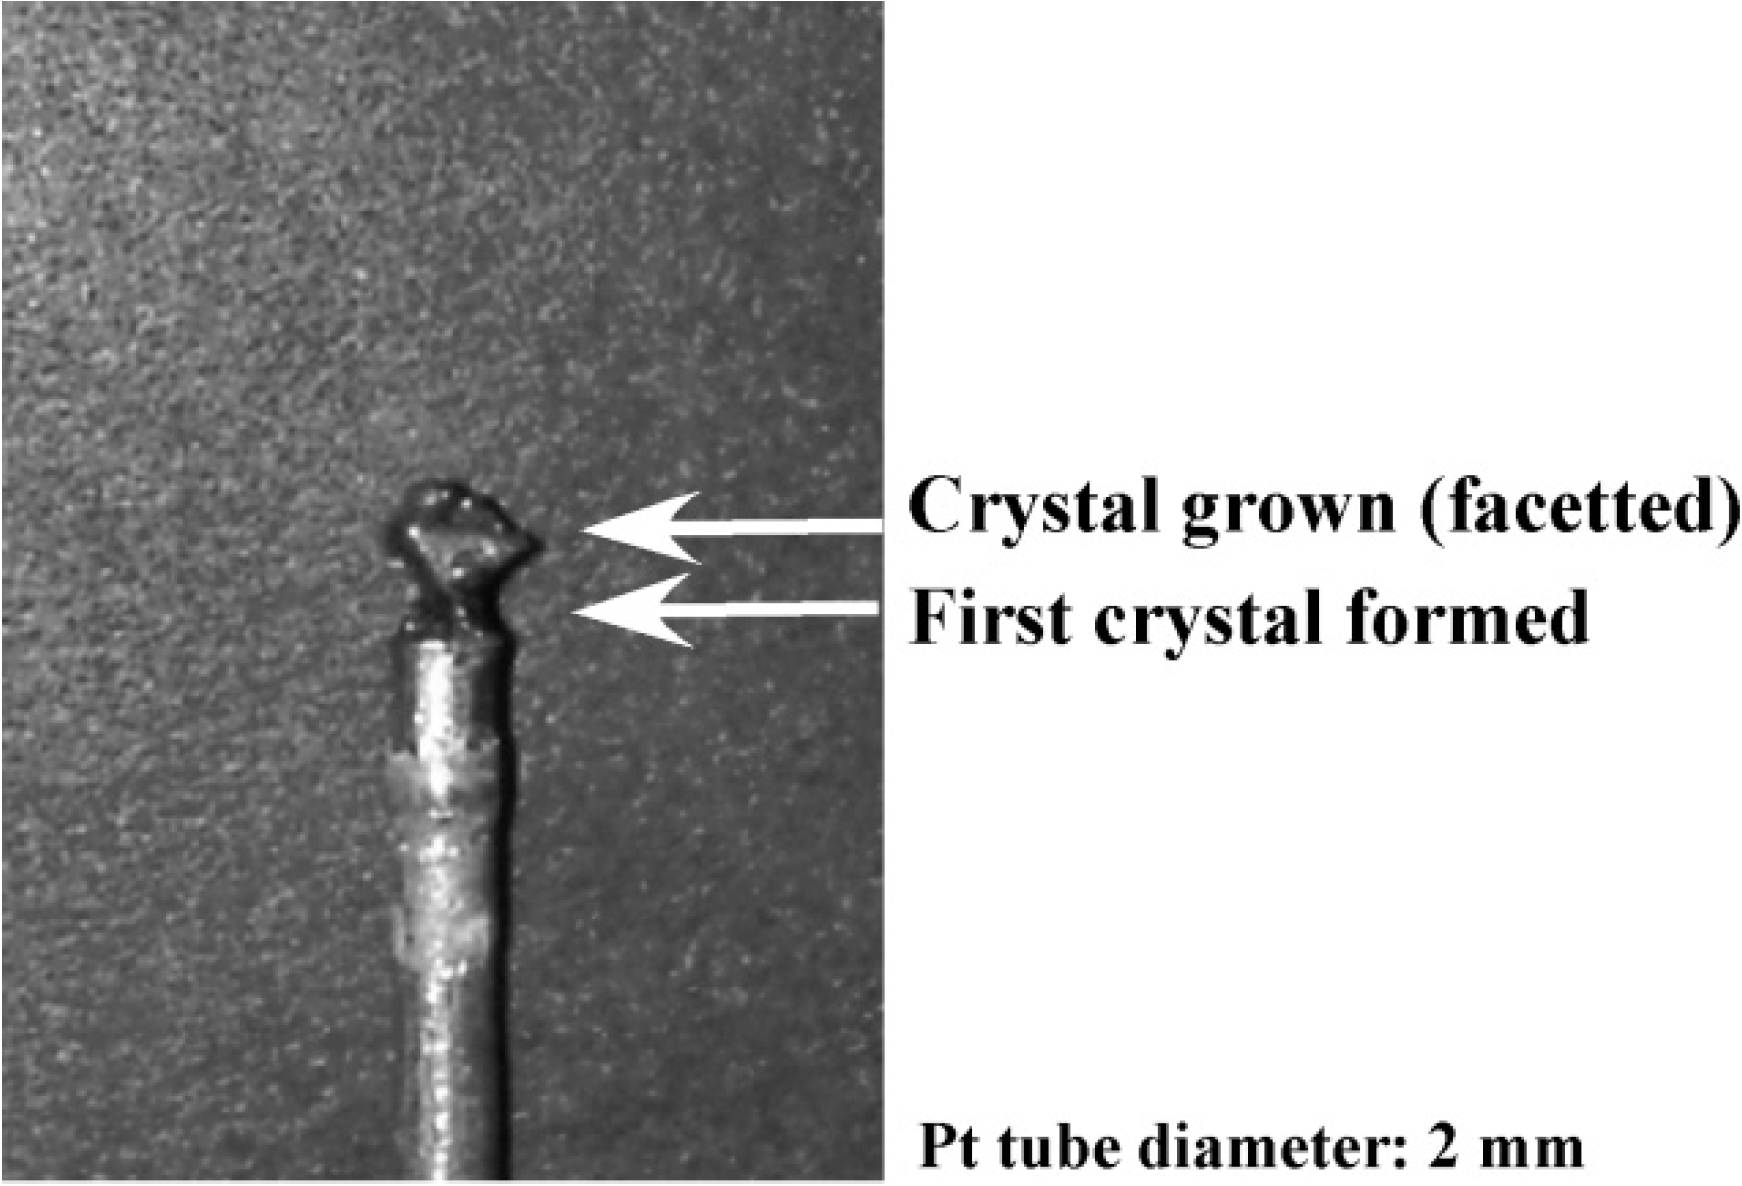
We also grew single crystals using the tube seed Czochralski method (Tube-Cz) for bulk shapes [
43]. Larger diameter crystals were obtained. A Pt tube was used instead of a seed crystal. After dipping the Pt tube into the melt, the melt rose up inside the tube by capillary forces and solidified in the upper colder part of the tube. This part was used as the seed crystal. The furnace was an RF heating system. The ratio of alkali metals to niobium was not 50:50 but instead it was 54:46. Crystals were grown in an Ar gas flowing condition, the Pt wire had a pulling-down rate of 10 mm/h and no crystal rotation was applied. Amounts of Na, Rb, or Cs also reached 10–20 mol% in the alkali metals of K-Na-A (A: Rb or Cs).
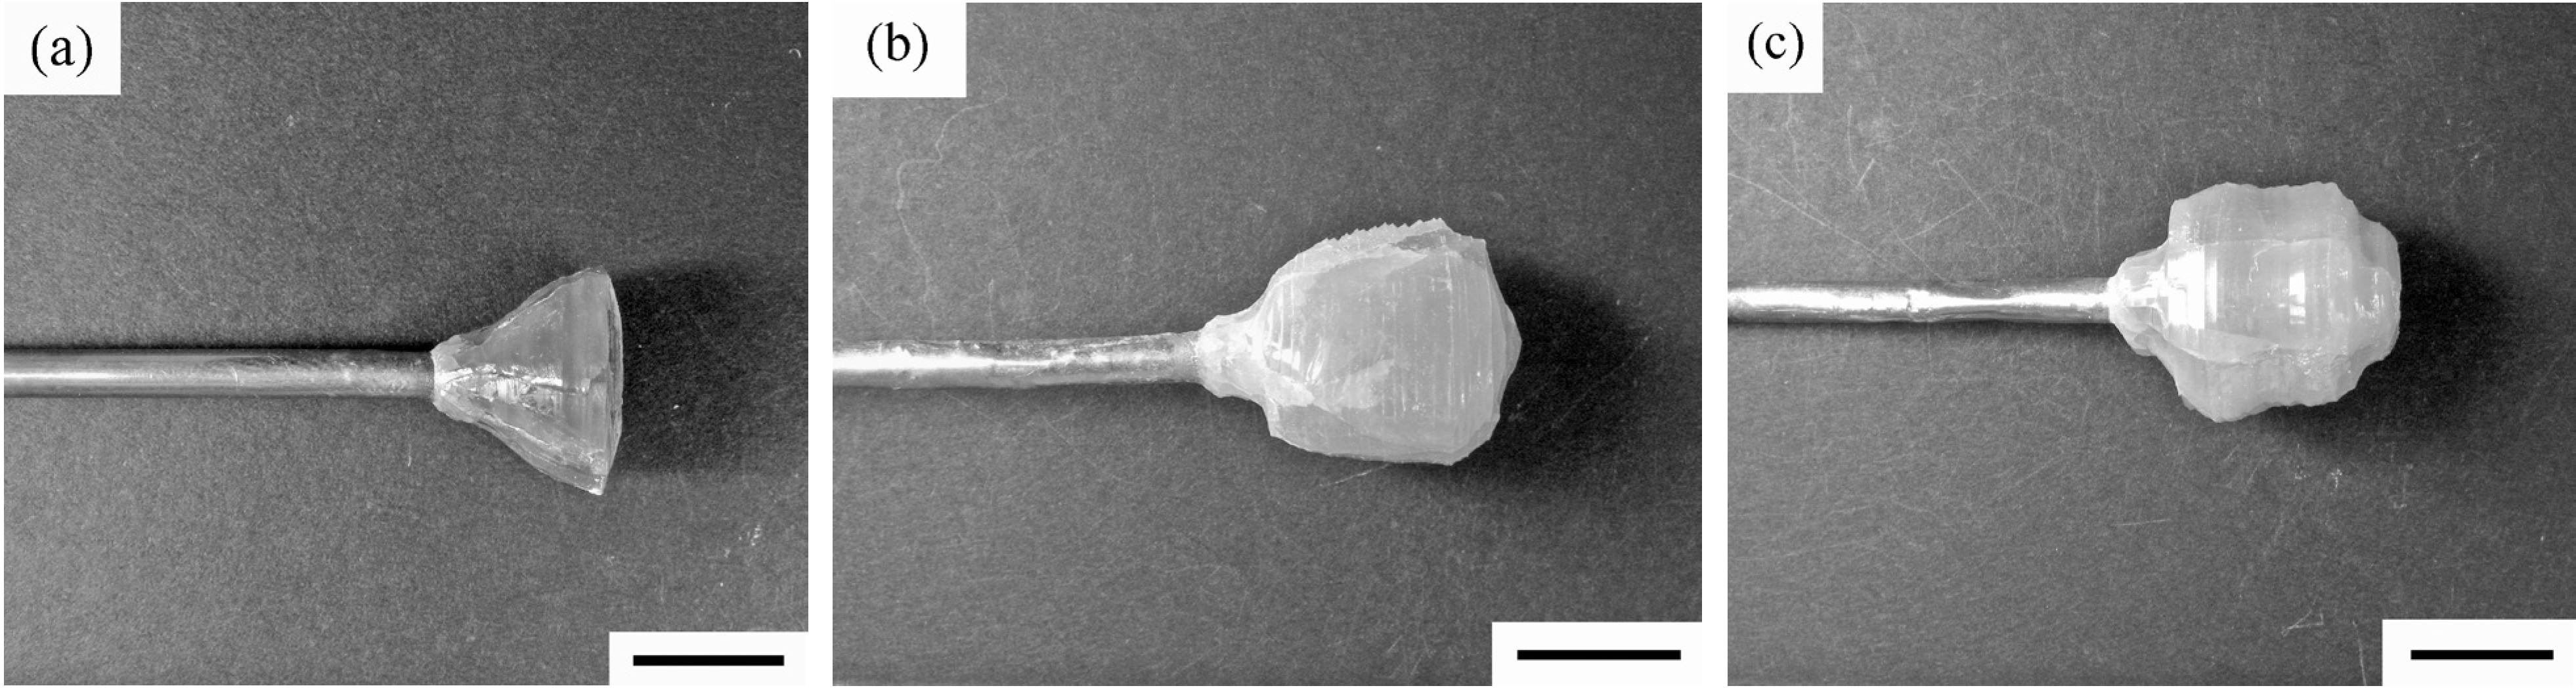
Figure 12 shows typical crystals grown by the Tube-Cz method on KN, KNRN and KNCN [
43]. The
c-axis was easily estimated from the rectangular crystal habit. Since the composition change of KNN crystals was the largest, the dielectric constant was mainly the same for co-doping of Rb or Cs with Na [
45].
Figure 12.
Typical crystals grown by the Tube-Cz method on (
a) KN: KNbO
3; (
b) KNRN: (K,Na,Rb)NbO
3; (
c) KNCN: (K,Na,Cs)NbO
3, reprinted with permission from [
43]. Copyright 2011 WILEY-VCH Verlag GmbH & Co. KGaA.
Figure 12.
Typical crystals grown by the Tube-Cz method on (
a) KN: KNbO
3; (
b) KNRN: (K,Na,Rb)NbO
3; (
c) KNCN: (K,Na,Cs)NbO
3, reprinted with permission from [
43]. Copyright 2011 WILEY-VCH Verlag GmbH & Co. KGaA.
The sample size for characterization was a 2 mm rectangle, 2–3 mm in length for
d33 measurement and a 1–2 mm rectangle, 1 mm in thickness for the P-E hysteresis loop measurement. Ag paste was used for electrode fabrication. For the crystals grown by the Tube-Cz method, poling treatment was conducted by applying 2–3 kV at 150–160 °C in silicone oil. The
d33 measurement was conducted using H.C. Materials ZJ-4B d
33 meter at room temperature. Typical
d33 values of bulk-shaped crystals after poling are 16–23 for KN, 55-63 for KNRN and 59–92 for KNCN [
43]. The
d33 values tended to increase by co-doping. Values of KNRN and KNCN were larger than that of KN. In the present work, it was difficult to measure the
d33 values in fiber crystals due to their small diameter. Thus, we cannot discuss the differences between the fiber and bulk crystals in this respect.
The ferroelectric properties in the P-E hysteresis loop were measured at room temperature in silicone oil using an aixACCT TF-1000 ferroelectric tester. The P-E hysteresis loop on bulk crystals is shown in
Figure 13 [
43], the ferroelectric properties were not really improved. On the other hand, compared with the bulk, the fiber crystal has better ferroelectric properties on remnant polarization although the coercive electric field is large. This can be attributed to its twin structure.
Figure 13.
P-E hysteresis loop on bulk crystals (
a) KN: KNbO
3; (
b) KNRN: (K,Na,Rb)NbO
3; (
c) KNCN: (K,Na,Cs)NbO
3, reprinted with permission from [
43]. Copyright 2011 WILEY-VCH Verlag GmbH & Co. KGaA.
Figure 13.
P-E hysteresis loop on bulk crystals (
a) KN: KNbO
3; (
b) KNRN: (K,Na,Rb)NbO
3; (
c) KNCN: (K,Na,Cs)NbO
3, reprinted with permission from [
43]. Copyright 2011 WILEY-VCH Verlag GmbH & Co. KGaA.
6. The Effects of K4Nb6O17 on KNbO3
During KN crystal growth process, another crystal phase of K
4Nb
6O
17 (KN4617) was sometimes formed as a secondary phase caused by the potassium evaporation in the KN melt. The KN4617 crystal had also been studied for its crystal structure [
46,
47] and its crystal growth [
48,
49]. The KN4617 crystal has an orthorhombic structure of which, its lattice parameters are
a = 0.7816,
b = 3.312 and
c = 0.6480 nm, and with a space group of
P2
1nb (33) [
47]. There is a disadvantage with the KN4617 crystal; it is easy to absorb moisture (hydrated) to become K
4Nb
6O
17-H
2O [
49,
50]. The KN4617 crystal was reported as a ferroelectric nonlinear material, but its electric properties have not been subjected to much study so far. When the electric properties of the KN crystal were measured, we also measured the KN4617 crystal at the same time. So it is necessary to know the electric properties of the KN4617 crystal in order to identify the KN single crystal properties clearly.
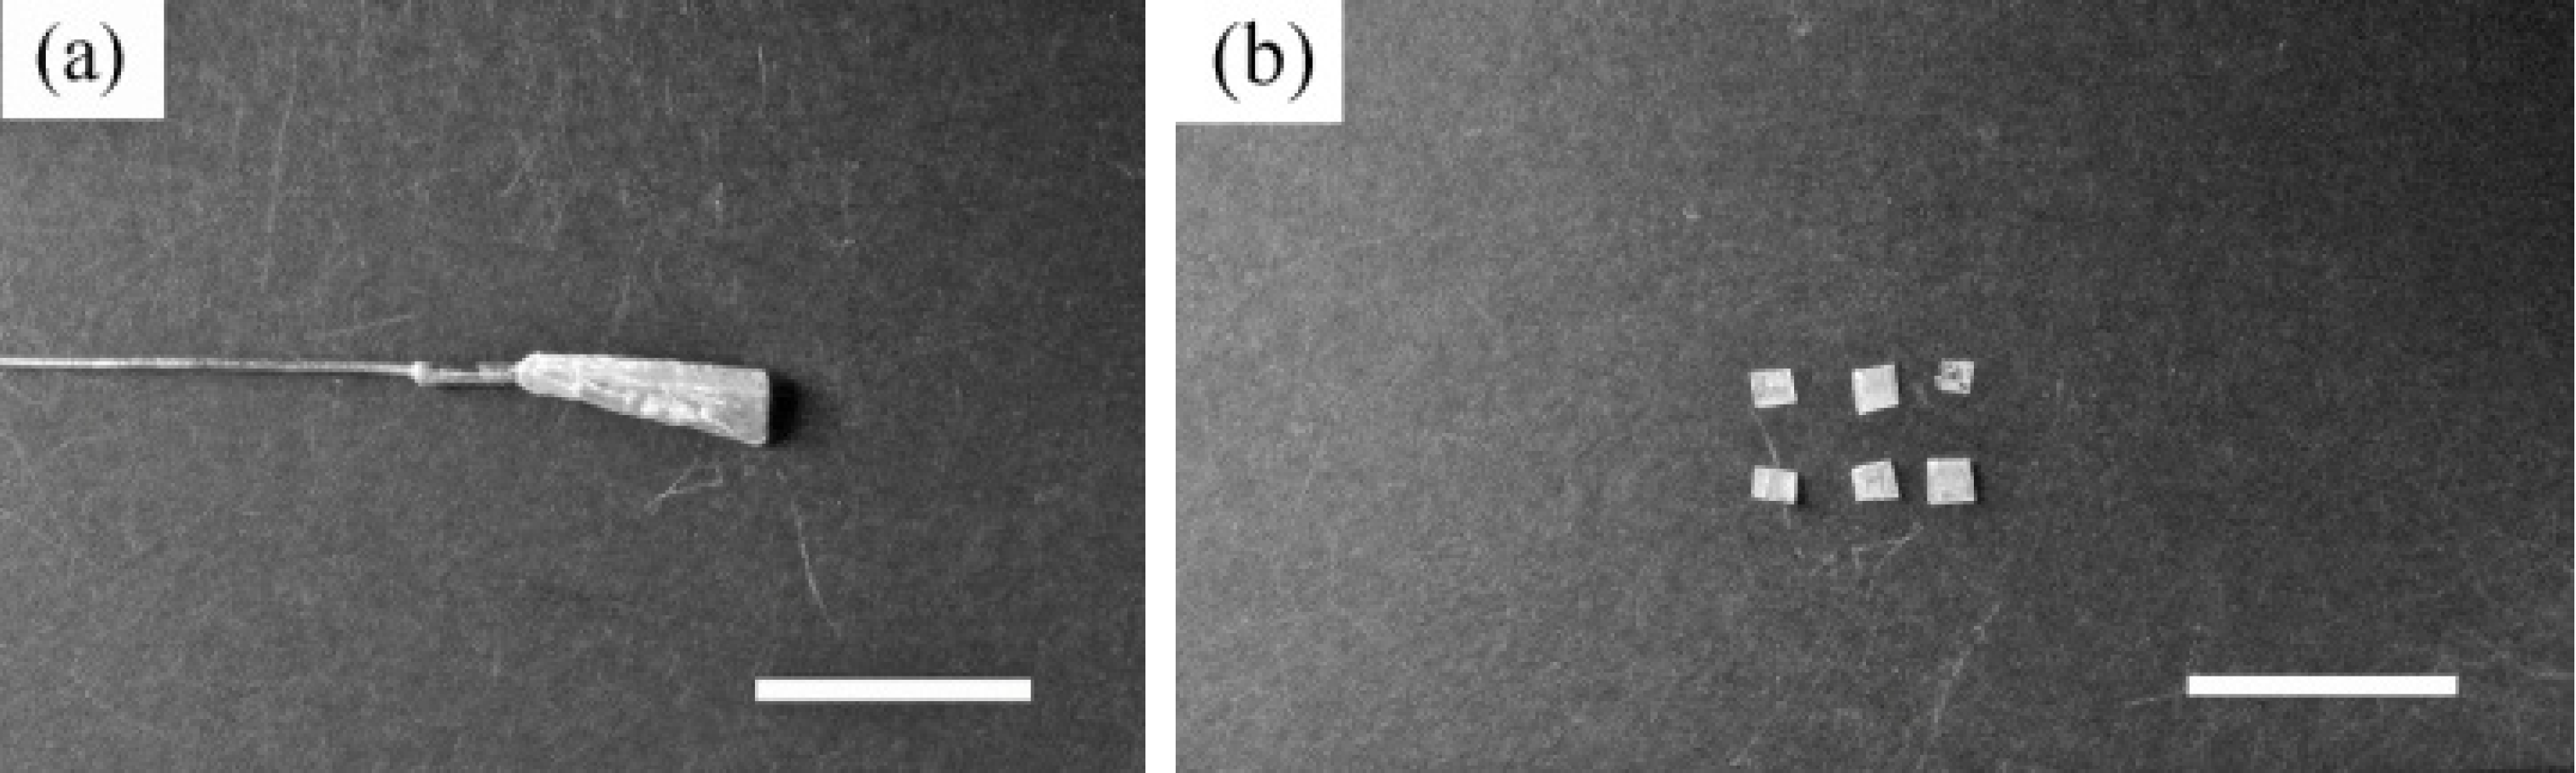
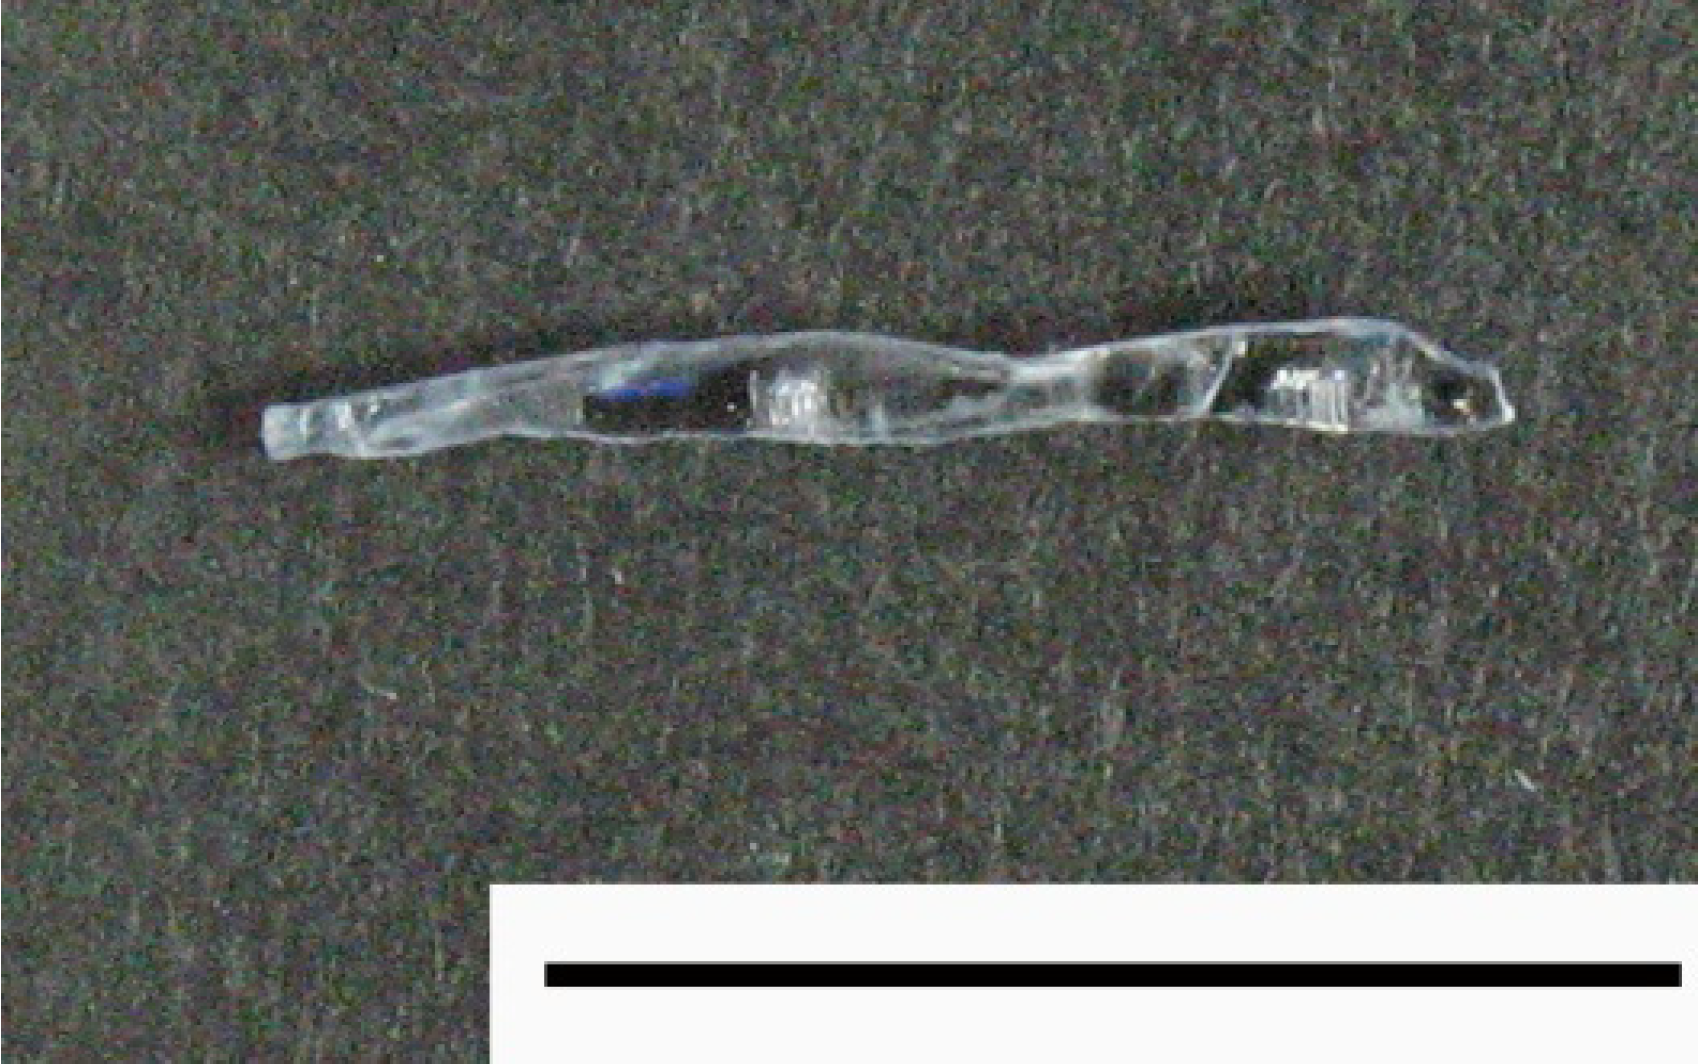
The KN4617 crystals were grown in an Ar gas flow condition as shown in
Figure 14a [
51]. Single-phase crystals were obtained with 1–2 mm in diameter and 5–10 mm in length, in fiber shape. The crystal’s growing direction was basically in the
c-axis (the shortest axis in the orthorhombic system). The grown crystals were reasonably stable in dry conditions. However, they were broken down to small pieces when cut with the conventional water-cooling cutting equipment,
i.e., a grown crystal was easy to break down by cleavage in moisture as shown in
Figure 14b [
51]. By powder XRD, a single-phase is formed with index as KN4617 phase on [
47]. From the XRD pattern on the cleavage plane of the KN4617 crystal, the cleavage plane was determined to be (110) plane. This plane does not coincide with a habitual plane of flux growth of the (010) plane [
48].
Figure 14.
(
a) Grown crystal. (
b) Cleavage crystal parts, reprinted with permission from [
51]. Copyright 2012 Elsevier. Scale bar: 10 mm.
Figure 14.
(
a) Grown crystal. (
b) Cleavage crystal parts, reprinted with permission from [
51]. Copyright 2012 Elsevier. Scale bar: 10 mm.
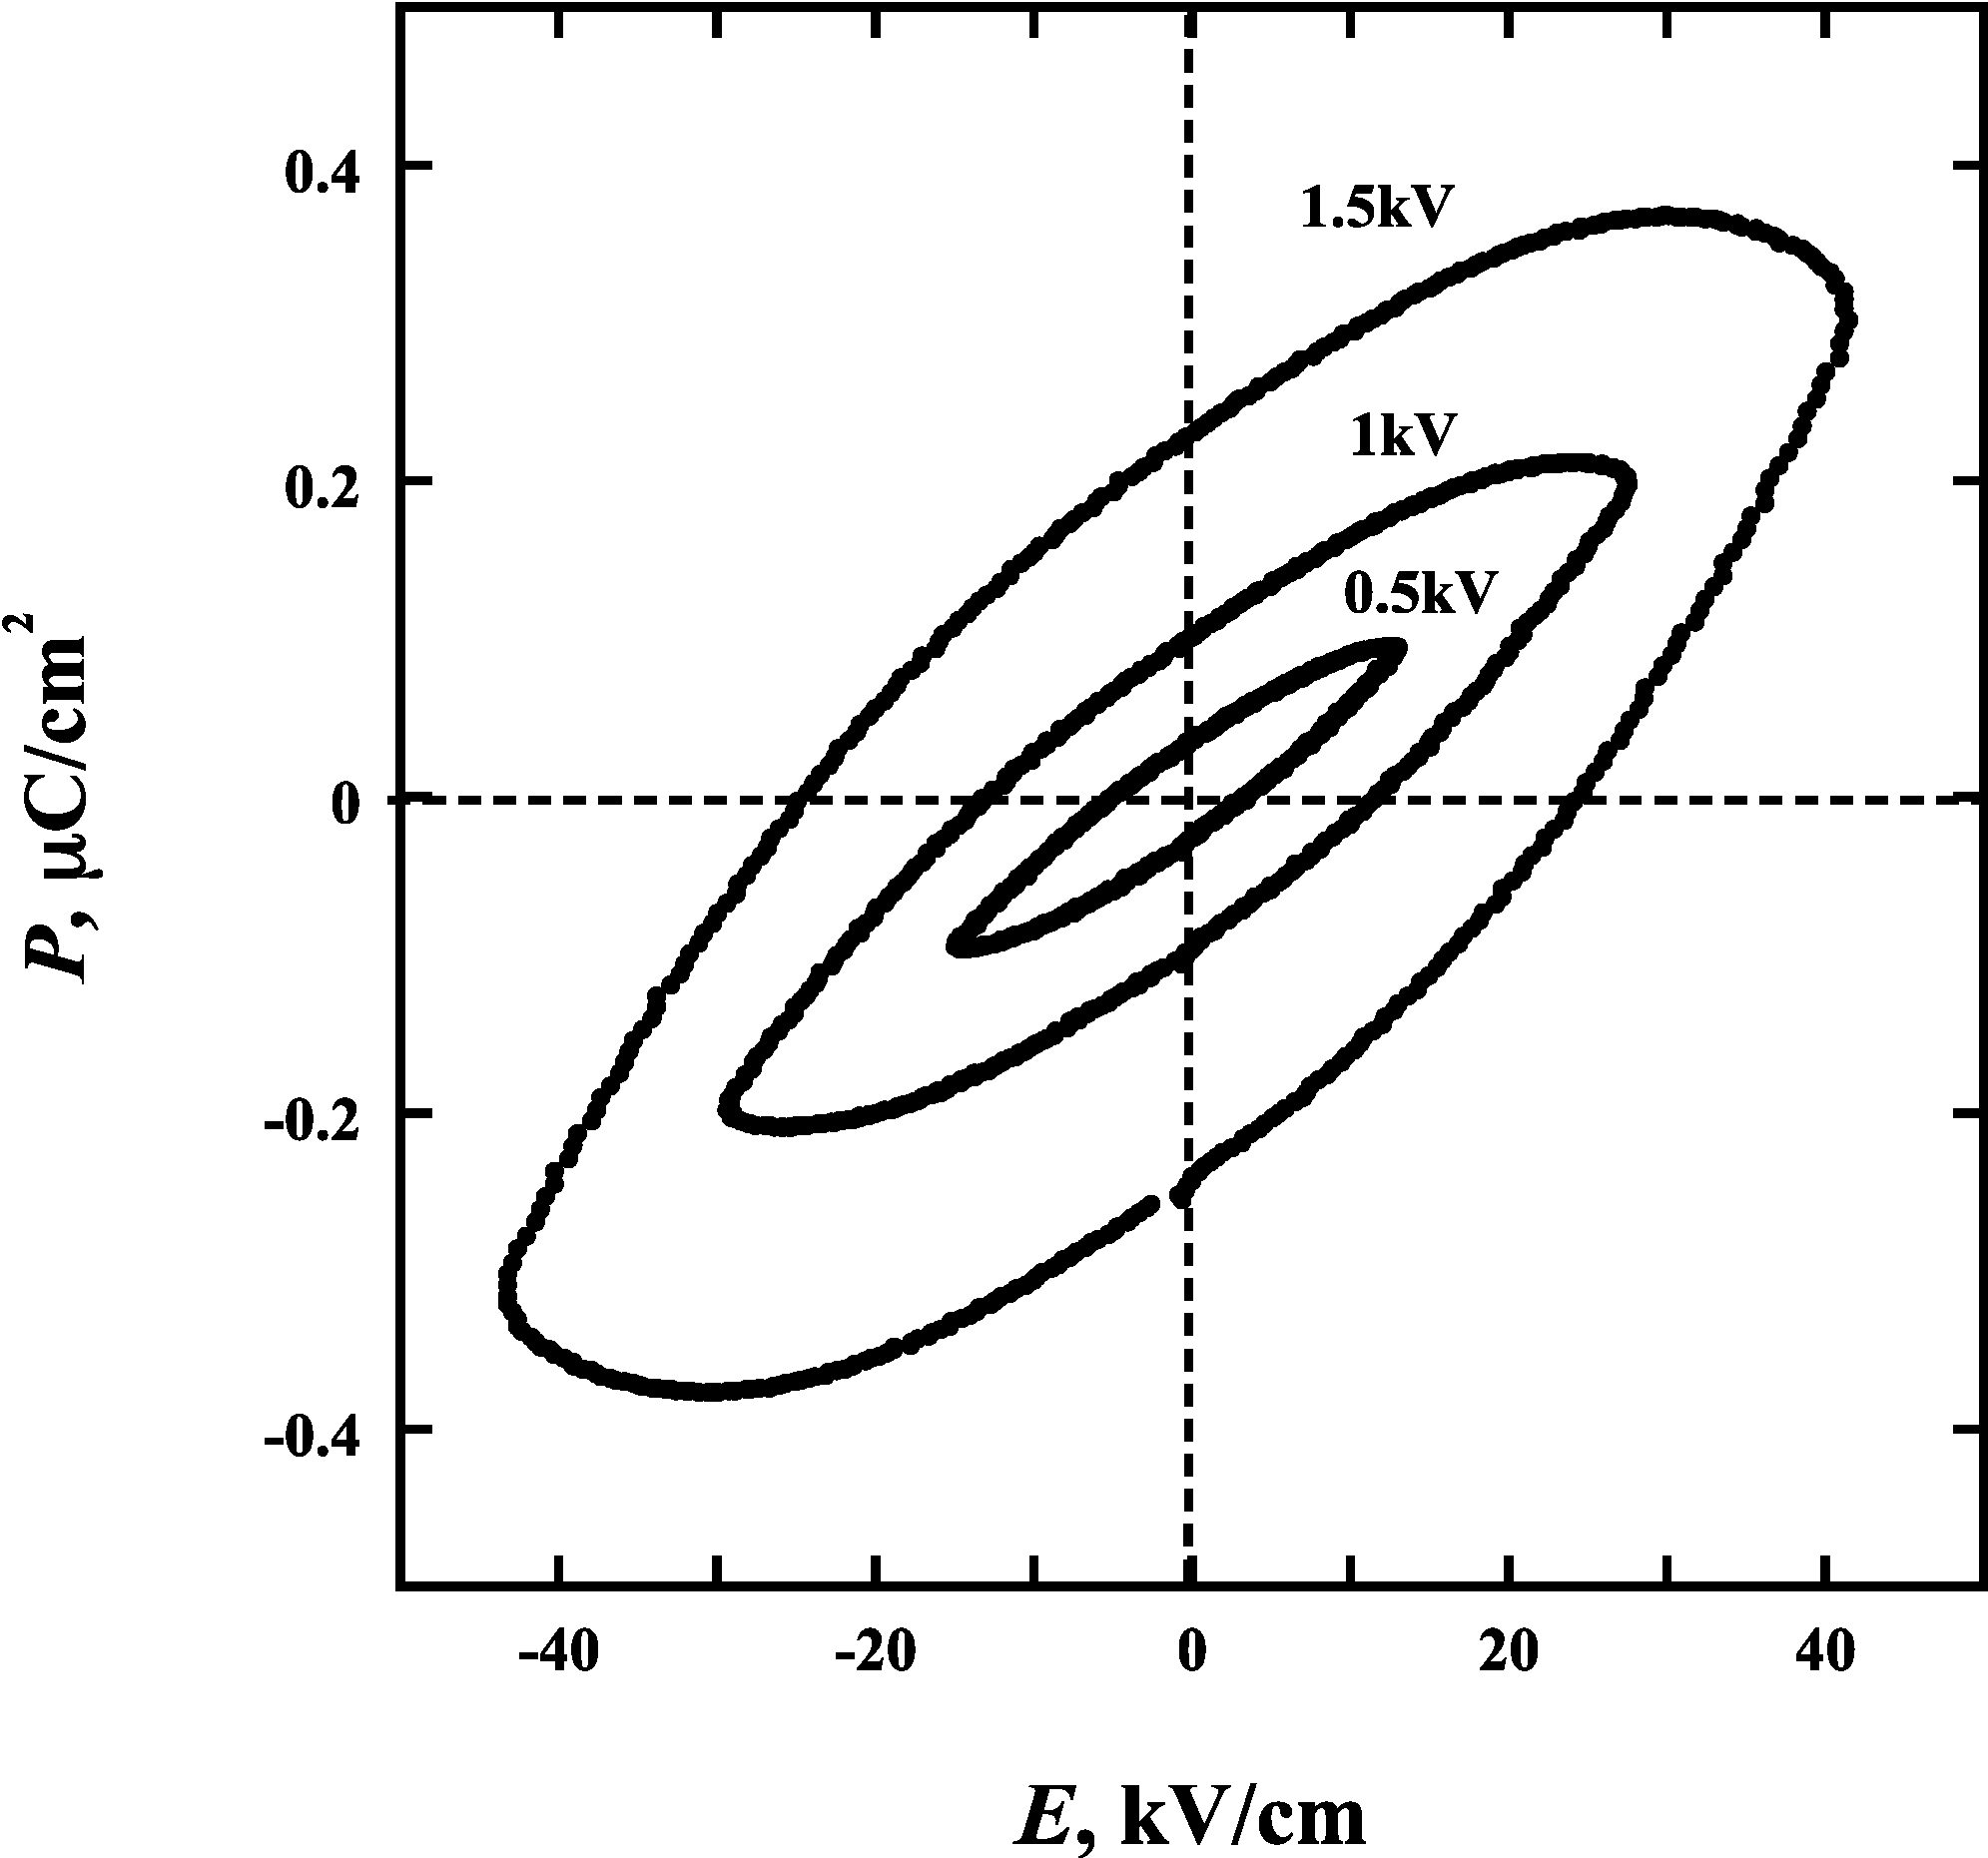
Cleavage crystals were used for the characterization of these samples in the size of 2 mm × 2 mm × 2 mm. The P-E hysteresis loop is shown in
Figure 15 on the cleaved KN4617 crystal [
51]. A newly cleaved surface was used in this case. The applied voltage was in the range of 0.5–1.5 kV. The moisture effect was not studied. This result is for the KN4617 phase but not the K
4Nb
6O
17-3H
2O phase, because the sample was used after the process of the 500 °C heating up treatment (as a result moisture was completely released from the crystal). The polarization was weak and was less than 0.4 µC/cm
2 for a ferroelectric material. The conventional KN single crystal has a small 20 µC/cm
2 value [
43]. Thus the KN4617 crystal did not affect the ferroelectric properties of KN that much, even although it was formed at the same time during the crystal growth.
Figure 15.
P-E hysteresis loop of KN4617: K
4Nb
6O
17, reprinted with permission from [
51]. Copyright 2012 Elsevier.
Figure 15.
P-E hysteresis loop of KN4617: K
4Nb
6O
17, reprinted with permission from [
51]. Copyright 2012 Elsevier.


