Article

Heat-Induced Color Evolution and Structural Stability of Pinkish-Orange and Red Tourmalines: An Integrated Colorimetric, Spectroscopic, and Chemical Study


by
Aumaparn Phlayrahan
* and
Nantharat Bunnag
*
Faculty of Gems, Burapha University Chanthaburi, Tha Mai, Chanthaburi 22170, Thailand
*
Authors to whom correspondence should be addressed.
Crystals 2026, 16(9), 577; https://doi.org/10.3390/cryst16090577
Submission received: 18 August 2026 / Revised: 31 August 2026 / Accepted: 1 September 2026 / Published: 4 September 2026
(This article belongs to the Section Mineralogical Crystallography and Biomineralization)

Abstract

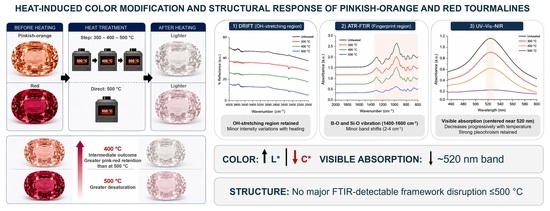
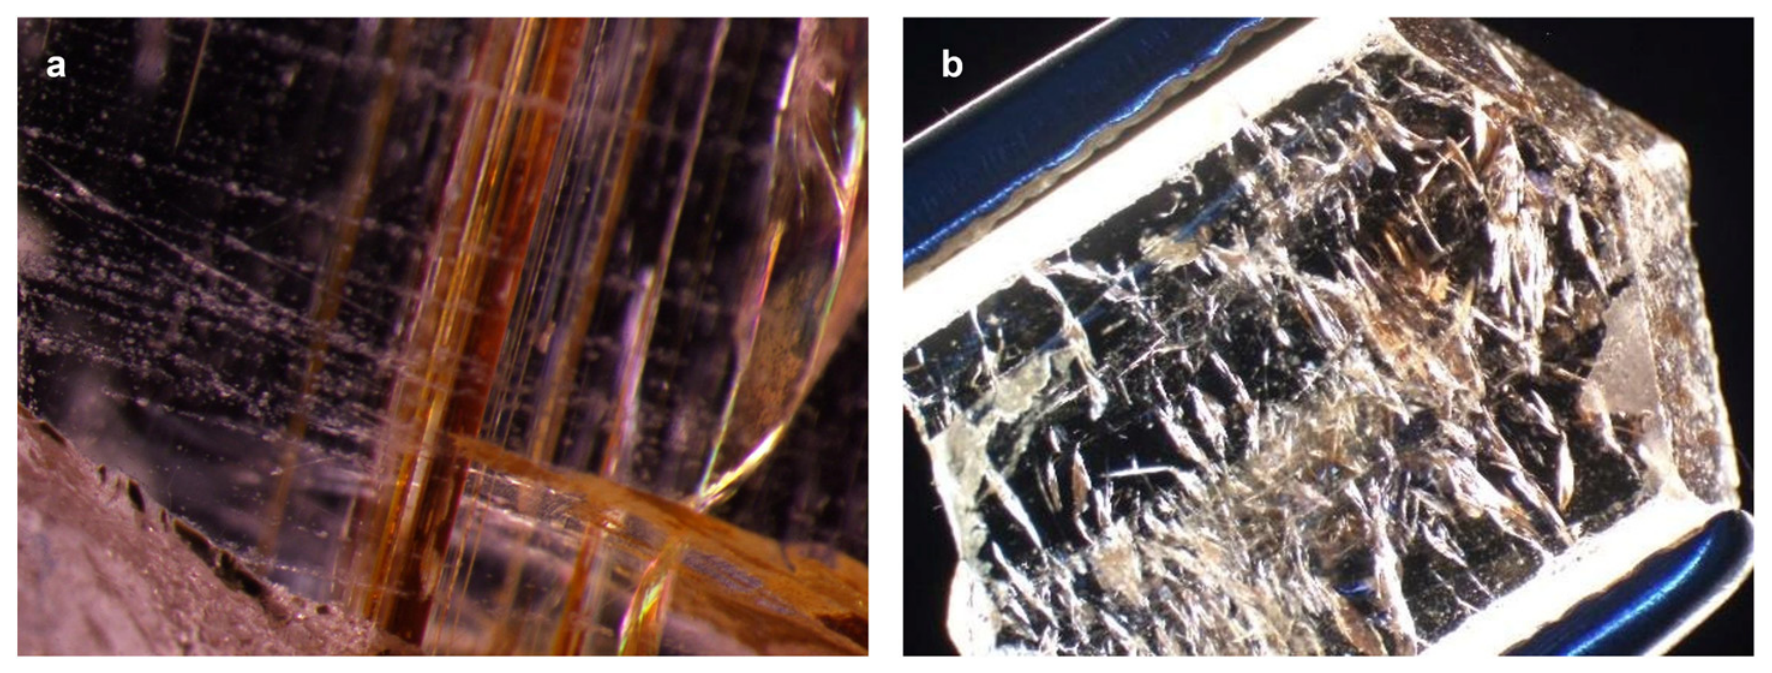
This study investigated the effects of progressive step-heating (300–500 °C) and direct heating (500 °C) on pinkish-orange and red tourmalines using colorimetric, spectroscopic, and chemical analyses. Heating progressively modified visible absorption and color, with treatment at 500 °C generally increasing lightness (L*) and substantially decreasing chroma (C*), accompanied by weakening of the broad absorption near 520 nm while strong pleochroism was retained. Chemical analyses revealed substantial compositional variability, particularly in Mn and Fe, although elemental abundance alone did not account for the observed optical responses. Color evolution was associated with changes in overlapping electronic absorption features, but the underlying microscopic processes could not be uniquely assigned to specific transition-metal ions or oxidation-state changes. Fourier transform infrared (FTIR) spectroscopy showed preservation of the principal framework-related vibrational features up to 500 °C, with no evidence of major structural disruption. Within the present step-heating series, 400 °C produced an intermediate outcome characterized by measurable lightening and desaturation while retaining more of the original pink-to-red chromatic component than after treatment at 500 °C, which produced substantially greater desaturation.

Graphical Abstract

1. Introduction

Tourmaline is one of the most chemically complex borosilicate mineral supergroups, characterized by extensive crystal-chemical variability arising from cation substitution at multiple structural sites [1,2,3,4]. This compositional flexibility produces a wide range of physical and optical properties and contributes to the remarkable color diversity observed among gem-quality tourmalines [1,2,3,4,5,6,7]. Among the various color varieties, pink to red tourmalines are particularly valued in the gemstone market because of their vivid hues and pronounced pleochroism [6,8,9,10,11]. Their coloration has been associated with transition-metal-related chromophoric centers incorporated into the crystal structure [12], with Mn recognized as an important contributor and Fe providing additional contributions to visible absorption depending on its abundance, oxidation state, and crystal-chemical environment [10,11,13,14].
Heat treatment is widely applied in the gem trade to modify the appearance of tourmaline [15,16,17,18]. In Mn-bearing pink and red tourmalines, heating generally results in reduced color saturation, increased lightness, and weakening of visible absorption bands [15,16,17,18,19,20]. Previous studies have discussed these optical changes in relation to Mn- and Fe-related electronic processes, although the underlying mechanisms may also depend on oxidation state, crystallographic site occupancy, local coordination environment, and other overlapping absorption processes [9,10,21,22,23]. Because these factors are difficult to distinguish from optical spectroscopy alone, the microscopic processes responsible for heat-induced color modification remain incompletely resolved. Furthermore, systematic comparisons between progressive step-heating and direct-heating pathways remain limited, particularly with respect to their influence on optical absorption, colorimetric properties, and structural response during heating.
Complementary analytical techniques provide information on both the optical and structural responses of tourmaline to thermal treatment. Polarized ultraviolet–visible–near-infrared (UV–Vis–NIR) spectroscopy is useful for monitoring changes in visible electronic absorption and their polarization dependence [11,17], while quantitative colorimetry provides an objective assessment of corresponding changes in lightness, chroma, and hue. Fourier transform infrared (FTIR) spectroscopy provides complementary information on hydroxyl-related vibrations and borate- and silicate-related framework bands that are sensitive to local crystal-chemical environments [24,25,26,27,28,29,30]. Previous studies have demonstrated the utility of FTIR for evaluating thermally induced structural responses and assessing preservation of the principal tourmaline framework after moderate-temperature heating [16,17,25,30,31]. Although FTIR does not directly quantify crystallinity, changes in local bonding or structural environments may provide complementary context for interpreting heat-induced optical behavior. Together with chemical characterization, these techniques enable the relationships among optical evolution, compositional variability, and framework response to be evaluated without requiring a priori assignment of a specific microscopic mechanism.
Although the thermal behavior of colored tourmalines has been investigated previously [15,16,17,32], these studies have primarily focused on documenting color changes following heat treatment or examining individual spectroscopic characteristics. Comprehensive investigations integrating quantitative colorimetry, polarized UV–Vis–NIR spectroscopy, FTIR spectroscopy, energy-dispersive X-ray fluorescence (EDXRF), and laser ablation inductively coupled plasma mass spectrometry (LA-ICP-MS) to systematically compare progressive step-heating and direct-heating treatments remain limited. Consequently, the influence of heating pathways on the optical and spectroscopic responses, particularly in compositionally heterogeneous natural specimens, remains incompletely understood. From a gemological perspective, the treatment condition that provides an appropriate balance between lightening, controlled desaturation, retention of the characteristic color, and preservation of the material also warrants consideration.
Therefore, this study systematically investigates the effects of progressive step-heating and direct-heating treatments up to 500 °C on pinkish-orange and red tourmalines by integrating quantitative colorimetry, polarized UV–Vis–NIR spectroscopy, FTIR spectroscopy, EDXRF, LA-ICP-MS, and conventional gemological observations. The objectives are to characterize the evolution of color and polarized visible absorption with heating, evaluate the preservation of the principal tourmaline framework, examine relationships between chemical composition and thermal response, compare the effects of progressive and direct-heating pathways, and assess the treatment conditions in terms of the balance between color modification and retention of the characteristic pink-to-red appearance.

2. Materials and Methods

2.1. Sample Selection and Preparation

Ten natural tourmaline samples of reported Mozambique origin were purchased from a commercial gem dealer in Chanthaburi City, Chanthaburi Province, Thailand, and divided into two color groups: pinkish-orange tourmaline (POT, n = 5; POT01–POT05) and red tourmaline (RT, n = 5; RT01–RT05). The samples were obtained through the commercial gem trade, and no additional locality information (e.g., mine or mining district) was available beyond the reported country of origin. The samples were selected based on representative body color, high transparency, and the absence of visible fractures or prominent inclusions that could interfere with the optical and spectroscopic measurements.
Baseline standard gemological examinations were performed prior to heat treatment. Refractive index was measured using a standard gemological refractometer with a contact liquid of refractive index 1.81 under sodium D-line illumination (589 nm), and birefringence was determined from the difference between the maximum and minimum refractive indices. Specific gravity was determined by the hydrostatic weighing method using distilled water at room temperature. Pleochroism was examined using a calcite dichroscope by observing color differences along different crystallographic directions. Ultraviolet fluorescence was examined in a dark chamber under short-wave (254 nm) and long-wave (365 nm) ultraviolet radiation, and the fluorescence response was visually recorded. Internal characteristics, including growth features and inclusions, were examined using a gemological microscope under darkfield illumination. Inclusion observations were based on optical appearance only, and no further instrumental characterization was performed. The same measurements were repeated after heat treatment to evaluate potential changes in the gemological properties of the investigated specimens.
For polarized spectroscopic measurements, all specimens were oriented relative to the crystallographic c-axis using a combination of a polariscope and a calcite dichroscope and prepared as doubly polished parallel plates with thicknesses of 2.0–3.0 mm. The surfaces were polished using diamond abrasives to a final particle size of 1 µm and cleaned ultrasonically in ethanol before spectroscopic analysis to minimize surface contamination and light-scattering effects. The cleaning procedure was repeated prior to post-heating spectroscopic measurements.

2.2. Thermal Treatment Protocols

The tourmaline samples were divided into two experimental groups to compare the effects of two heat-treatment pathways on color modification. The step-heating group (POT01–POT03 and RT01–RT03) was heated sequentially at 300, 400, and 500 °C, whereas the direct-heating group (POT04–POT05 and RT04–RT05) was heated directly to 500 °C.
All heat treatments were performed in air using a custom-built programmable electric muffle furnace sourced from Rojana Shop (Chanthaburi, Thailand). The samples were placed in an alumina crucible, heated at a constant rate of 50 °C h−1, and maintained at the target temperature for 2 h. After heating, the furnace was switched off, and the samples were allowed to cool naturally to room temperature before removal.
For the step-heating group, colorimetric and spectroscopic measurements were performed after each heating stage (300, 400, and 500 °C). For the direct-heating group, the same measurements were performed before and after treatment at 500 °C.

2.3. Chemical Composition Analysis

The baseline chemical compositions of the untreated tourmaline samples were evaluated using energy-dispersive X-ray fluorescence (EDXRF) spectroscopy. EDXRF was employed to characterize the major matrix constituents and provide comparative information on the elemental abundances of transition metals and other minor elements.
EDXRF measurements were performed using a Horiba XGT-9000 spectrometer operating (HORIBA, Ltd., Kyoto, Japan) in multi-condition mode with five sequential excitation filters and an acquisition time of 50 s per filter. A capillary collimator providing a beam diameter of 1.2 mm was used for all analyses. Because EDXRF employs X-ray excitation rather than an electron beam, no conductive coating of the sample surfaces was required prior to analysis. Instrument calibration and quantitative analyses were performed using the manufacturer’s Fundamental Parameters (FP) method. The quantitative results were initially obtained as oxide-equivalent compositions and were subsequently converted to elemental concentrations using stoichiometric conversion factors to facilitate direct comparison with the LA-ICP-MS data and avoid implying specific oxidation states for multivalent elements. To account for possible compositional heterogeneity within individual specimens, five EDXRF measurements were collected from different regions of each sample. The results are reported as mean ± standard deviation (n = 5), representing the observed variability among the analyzed regions. The standard deviations should not be interpreted as independent estimates of instrumental precision. All measurements were performed on polished sample surfaces prior to heat treatment under ambient laboratory conditions.
Because EDXRF has limited sensitivity for light elements (e.g., B, Li, H, and F) and provides semi-quantitative bulk compositional information, the results were used primarily for comparative evaluation of compositional variations among the investigated specimens rather than for formal tourmaline species classification.
To further characterize trace-element distributions, all investigated specimens (POT01–POT05 and RT01–RT05) were analyzed using laser ablation inductively coupled plasma mass spectrometry (LA-ICP-MS). Analyses were performed using a New Wave Research 213 laser ablation system coupled to a Thermo Scientific iCAP™ mass spectrometer (Thermo Fisher Scientific (Bremen) GmbH, Bremen, Germany). A laser spot size of 55 μm was used for all analyses. NIST SRM 610 and NIST SRM 612 glass standards [33] were employed for external calibration, whereas silicon concentrations derived from the EDXRF analyses were used as the internal standard for quantitative data reduction. Elemental concentrations are reported in parts per million (ppm). The LA-ICP-MS analyses were performed to provide quantitative trace-element concentrations, particularly for Mn and Fe. These data form the basis for the discussion of transition-metal abundances presented in this study and complement the comparative EDXRF measurements. Because each analysis was obtained from a single 55 μm laser ablation spot, the reported elemental concentrations represent localized measurements and should be regarded as approximate values for the analyzed regions. Consequently, although LA-ICP-MS provides highly sensitive quantitative elemental data, the reported concentrations may not fully represent the bulk composition of compositionally heterogeneous tourmaline specimens and should therefore be interpreted primarily in a comparative rather than absolute context.

2.4. Spectroscopic Measurements

2.4.1. CIELAB Colorimetric Analysis

CIELAB colorimetric parameters were calculated from the polarized ultraviolet–visible–near-infrared absorption spectra using the Lambda 365 Color Master Viewer software (Version 4.00 beta) supplied with the PerkinElmer Lambda 1050 double-beam spectrophotometer (PerkinElmer, Waltham, MA, USA). The calculations were performed using the CIE D65 standard illuminant and a 10° standard observer, and the results were expressed in the CIELAB color coordinates (L*, a*, and b*).
Each set of CIELAB coordinates was calculated from a single polarized UV–Vis–NIR absorption spectrum acquired for a given specimen, optical orientation, and heat-treatment stage. Consequently, the reported L*, a*, and b* values represent calculated colorimetric parameters for individual spectra rather than the mean of repeated colorimetric measurements. Because only one spectrum was acquired for each specimen at each treatment stage, no replicate dataset was available from which statistically meaningful standard deviations or error bars could be calculated. Accordingly, the numerical values are intended for comparative evaluation of color evolution during heat treatment and should not be interpreted as estimates of specimen heterogeneity or experimental uncertainty.
To account for the optical anisotropy of tourmaline, the colorimetric parameters were calculated separately for spectra recorded parallel to the crystallographic c-axis (e-ray, E ‖ c) and perpendicular to the c-axis (o-ray, E ⊥ c).
The total color difference (ΔE*) between the unheated and heated specimens was calculated using the CIELAB 1976 color space [34] equation:
Δ E *   =   ( Δ L * ) 2 + ( Δ a * ) 2 + ( Δ b * ) 2 ,
where ΔE*, ΔL*, Δa*, and Δb* represent the differences between the unheated and heated specimens for the same optical orientation.

2.4.2. Polarized UV–Vis–NIR Absorption Spectroscopy

Polarized UV–Vis–NIR absorption spectra were recorded at room temperature over the wavelength range of 250–1200 nm using a PerkinElmer Lambda 1050 double-beam spectrophotometer (PerkinElmer, Waltham, MA, USA) equipped with a Glan–Thompson prism polarizer (PerkinElmer, Inc., Llantrisant, Wales, UK). Spectra were collected with the incident electric vector oriented parallel and perpendicular to the crystallographic c-axis. Measurements were performed using a scan speed of 397.22 nm min−1 and a spectral bandwidth of 3.0 nm.

2.4.3. FTIR Spectroscopy

Fourier transform infrared (FTIR) spectra were collected at room temperature over the spectral range of 4000–400 cm−1 using a Nicolet iS50 FTIR spectrometer (Thermo Fisher Scientific, Madison, WI, USA). Two complementary sampling modes were employed:
  • Diffuse reflectance infrared Fourier transform (DRIFT) spectroscopy was used to examine the hydroxyl-stretching region (4000–2000 cm−1), and spectra were recorded in percentage transmittance (%T) mode.
  • Attenuated total reflectance Fourier transform infrared (ATR-FTIR) spectroscopy equipped with a diamond crystal was used to examine the principal framework vibrational region, particularly the borate- and silicate-related bands below 1400 cm−1, and spectra were recorded in absorbance mode.
For both techniques, spectra were acquired at a spectral resolution of 4 cm−1 using 64 co-added scans. Background spectra were collected before each measurement, and baseline correction was performed using OMNIC software (Version 9.11.745; Thermo Fisher Scientific).

3. Results

3.1. Basic Gemological Properties and Visual Color Evolution

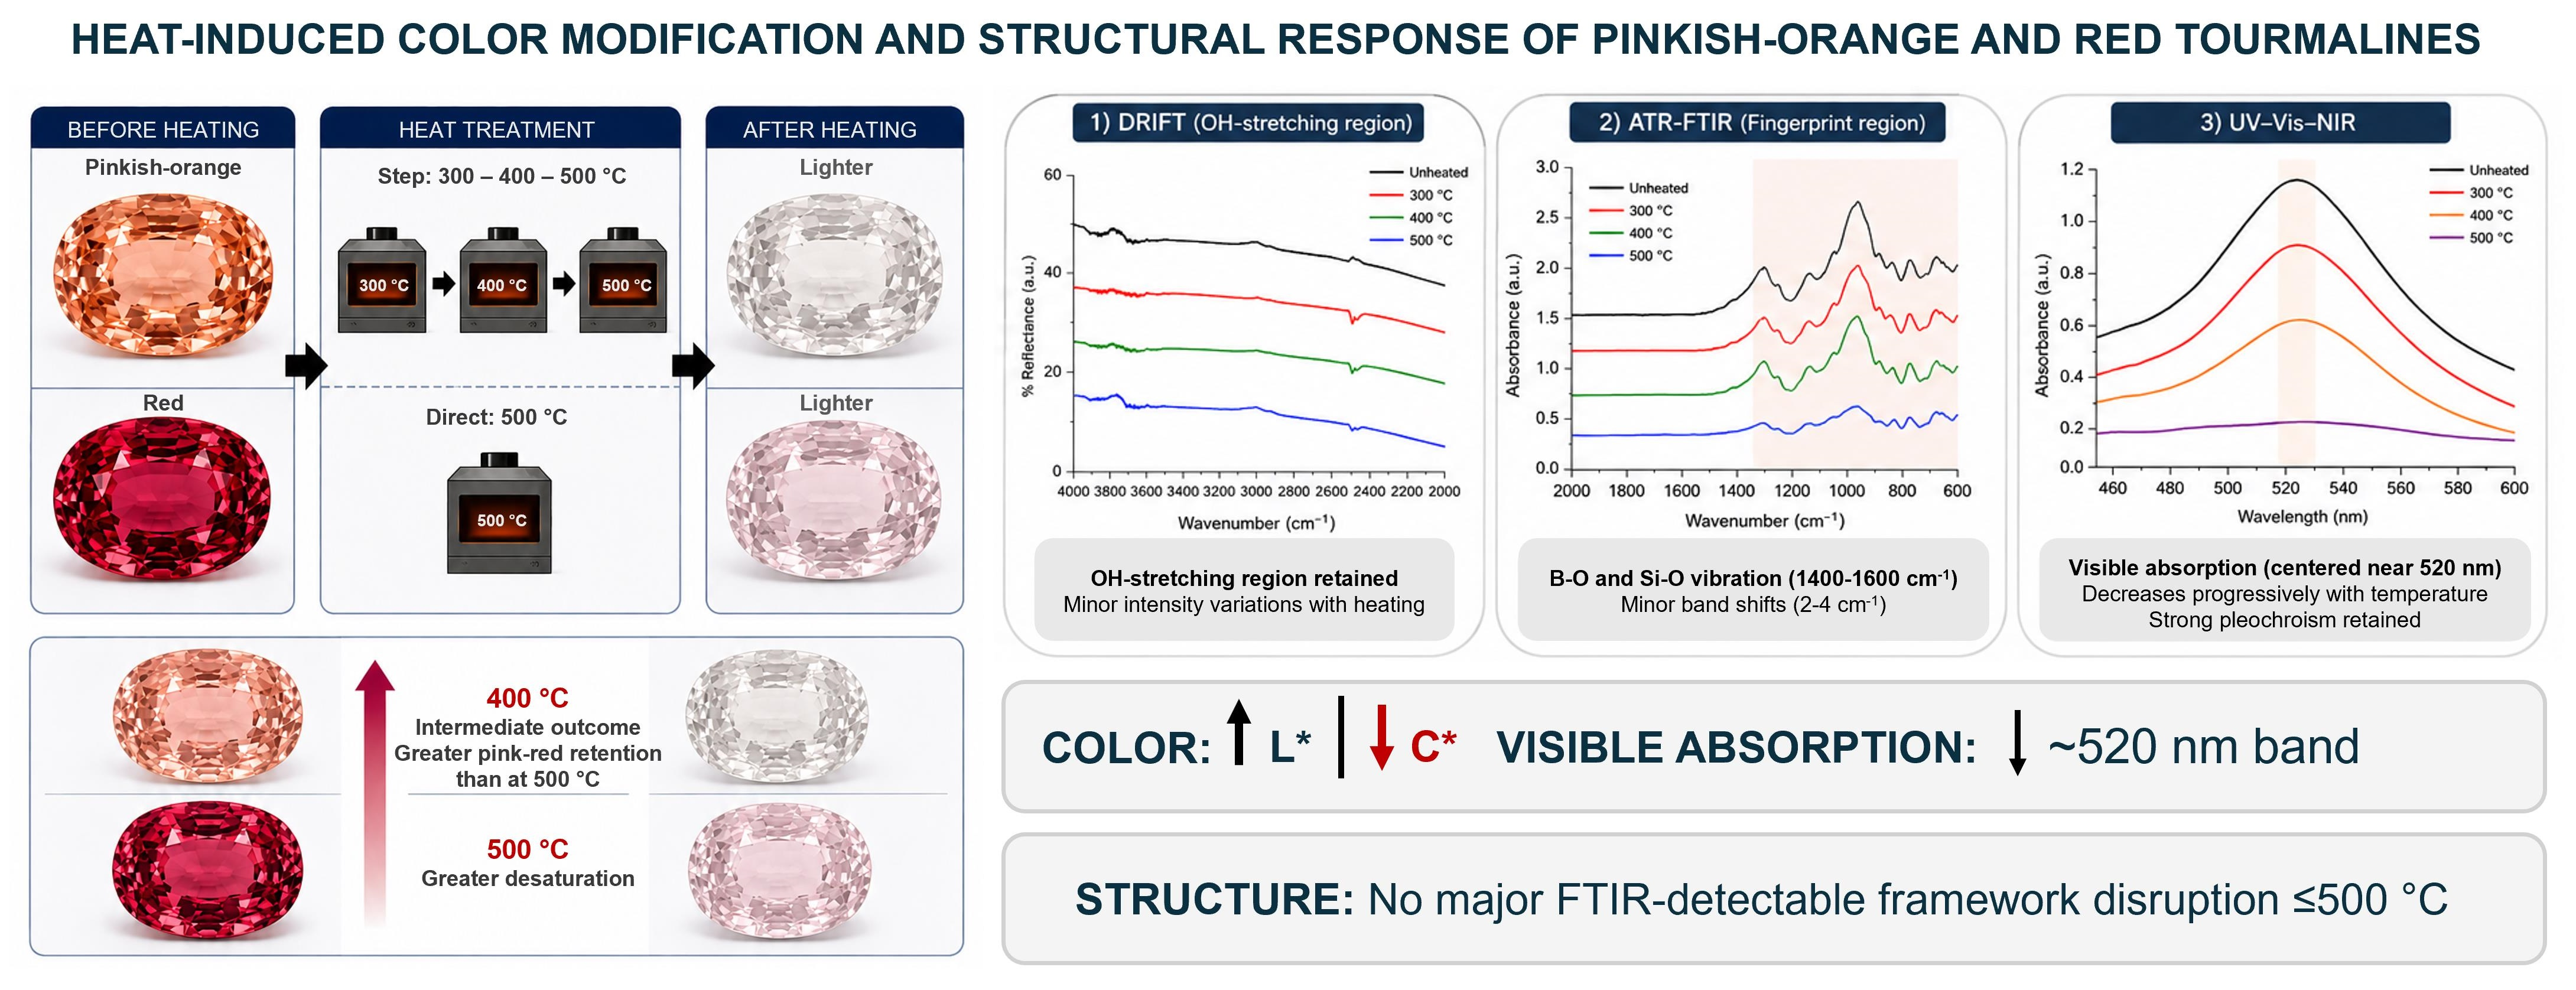
The color modification of the samples before and after heating is shown in Figure 1. Standard gemological characterization showed physical and optical properties consistent with members of the tourmaline supergroup.
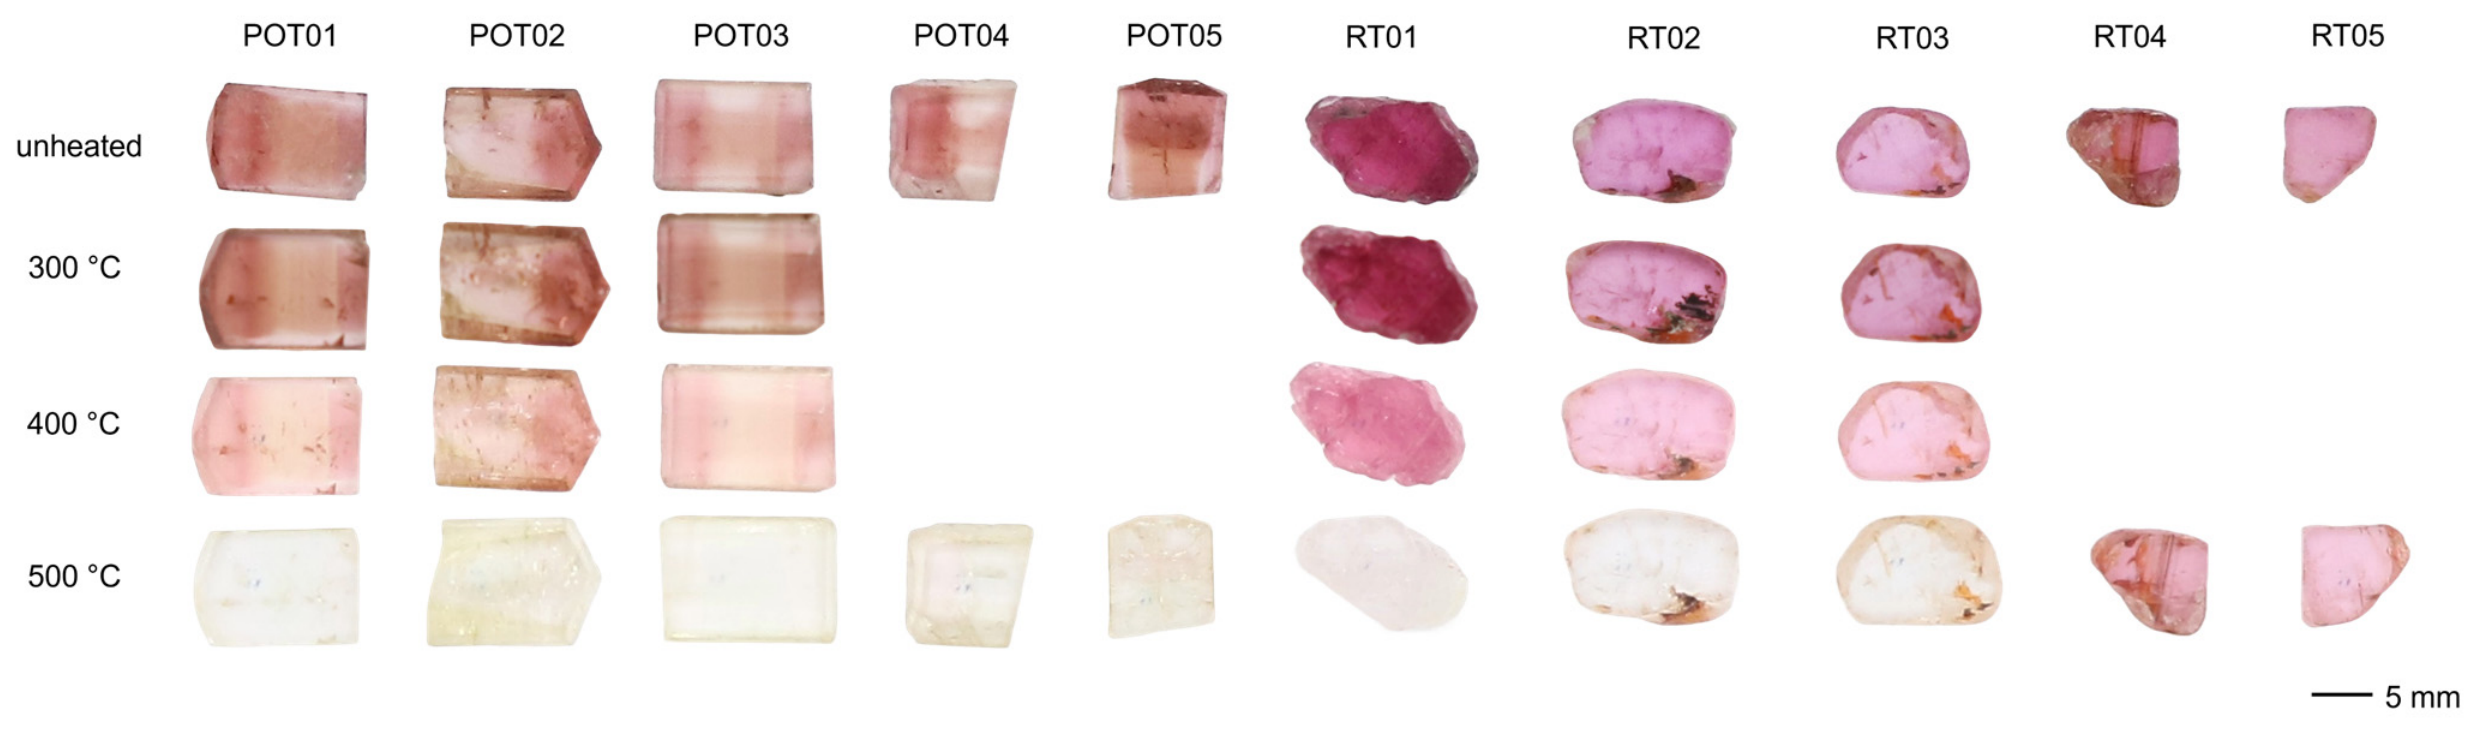
Prior to heat treatment, the refractive indices ranged from 1.622 to 1.640, with birefringence values of 0.018–0.020 and a uniaxial negative optical character. Specific gravity values varied from 3.01 to 3.06. All samples were inert under both long-wave (365 nm) and short-wave (254 nm) ultraviolet radiation. Microscopic examination revealed internal features interpreted from their optical appearance as fluid-bearing inclusions, together with growth tubes and hollow channels. Representative examples of the observed tubular and channel-like internal features are shown in Figure 2. No instrumental characterization of the inclusions was performed.
All specimens exhibited distinct to strong pleochroism when observed using a calcite dichroscope. In the unheated POT samples, pleochroic colors were pinkish orange in the o-ray direction and light pinkish orange in the e-ray direction. The unheated RT samples showed purplish-red pleochroic colors in the o-ray direction and pale pink colors in the e-ray direction.
After heat treatment to 500 °C through both the step-heating and direct-heating protocols, the refractive indices, birefringence, and specific gravity values remained unchanged. Microscopic observations suggested slight apparent expansion of some fluid-bearing inclusions, while growth tubes and hollow channels oriented parallel to the crystallographic c-axis showed no obvious change under microscopic observation.
The principal visual effect of heat treatment was a change in body color and pleochroic intensity. At 500 °C, the originally intense pinkish-orange and purplish-red colors observed in the o-ray direction became substantially lighter, evolving toward pale pinkish-yellow or near-colorless appearances. The corresponding e-ray colors became very pale pink to nearly colorless. Comparable visual color changes were observed in both the step-heated and directly heated samples.

3.2. Chemical Composition and Trace-Element Characteristics

Energy-dispersive X-ray fluorescence (EDXRF) analyses provided an overview of the chemical compositions of the investigated tourmalines (Table 1). The results are presented as elemental concentrations (wt.%), reported as mean ± standard deviation (n = 5), calculated from the oxide-equivalent quantitative results obtained using the Fundamental Parameters (FP) method. The analyses indicate compositions dominated by Si and Al, together with measurable variations in transition-metal and network-modifying elements among the investigated specimens. The five individual EDXRF measurements for each specimen are provided in Table S2.
The pinkish-orange tourmaline (POT) group exhibited noticeable compositional variability. Samples POT02, POT03, and POT05 displayed broadly comparable elemental compositions, with Mn concentrations ranging from 0.17 ± 0.02 to 0.33 ± 0.24 wt.% and moderate Ca concentrations. In contrast, POT01 contained relatively elevated Ca (7.36 ± 3.53 wt.%) and K (6.00 ± 12.83 wt.%) concentrations, distinguishing it from the remaining POT specimens. Similarly, POT04 exhibited the highest Ca concentration (11.70 ± 13.03 wt.%) and negligible K among the investigated specimens. The relatively large standard deviations observed for several elements indicate substantial variability among the analyzed regions. This variability may reflect compositional heterogeneity together with analytical variability; however, their relative contributions cannot be quantitatively separated because independent instrumental precision was not determined. Accordingly, the EDXRF data are used primarily for comparative evaluation of compositional variability rather than definitive crystal-chemical interpretation.
To further characterize trace-element distributions, LA-ICP-MS analyses were performed on all specimens, and the results are presented in Table S1. The analyses revealed marked differences in Mn and Fe concentrations among the investigated tourmalines. The step-heated red tourmalines (RT01–RT03) contained markedly higher Mn concentrations (8166–9477 ppm) and comparatively lower Fe concentrations (238–317 ppm) than the pinkish-orange specimens, which contained 679–825 ppm Mn and 709–1000 ppm Fe. In contrast, the direct-heated red specimens RT04 and RT05 contained exceptionally low concentrations of both Mn (197–200 ppm) and Fe (10–11 ppm), distinguishing them from all other investigated specimens. Because each LA-ICP-MS analysis was obtained from a single 55 μm ablation spot, the reported concentrations represent localized measurements and should be regarded as approximate values for the analyzed regions rather than bulk concentrations of the entire specimens.
Overall, the chemical analyses revealed substantial compositional variability among the investigated specimens, particularly with respect to Mn and Fe contents. The LA-ICP-MS data form the basis for the quantitative discussion of transition-metal abundances in the following sections, whereas the EDXRF results provide complementary information on broader compositional variations among the investigated tourmalines.

3.3. Colorimetric Analysis and CIELAB Evolution

3.3.1. Step-Heating Group (300, 400, and 500 °C)

Colorimetric analysis of the progressively step-heated tourmaline samples (POT01–03 and RT01–03) revealed systematic temperature-dependent variations in the CIELAB parameters L*, a*, b*, chroma (C*), and total color difference (ΔE*) along both the ordinary ray (o-ray) and extraordinary ray (e-ray) directions. Representative CIELAB data are presented in Table 2, while the complete colorimetric dataset for all investigated specimens, heating conditions, and polarization orientations is provided in Table S3. Each set of CIELAB parameters was calculated from an individual polarized absorption spectrum for a given specimen, heating condition, and optical orientation. Accordingly, the observed changes represent individual sample trajectories rather than averages of repeated colorimetric measurements and do not provide a statistical assessment of reproducibility or intracrystalline heterogeneity. The results demonstrate temperature-dependent changes in lightness, desaturation, and chromaticity in both polarization directions, although individual specimens exhibited non-linear responses at intermediate heating stages.
The pinkish-orange tourmaline (POT) samples revealed pronounced thermal color modification. In general, increasing temperature resulted in progressive increases in lightness (L*) accompanied by substantial decreases in the red chromatic coordinate (a*) and yellow chromatic coordinate (b*). Consequently, chroma (C*) decreased markedly, indicating strong desaturation of the original pinkish-orange coloration.
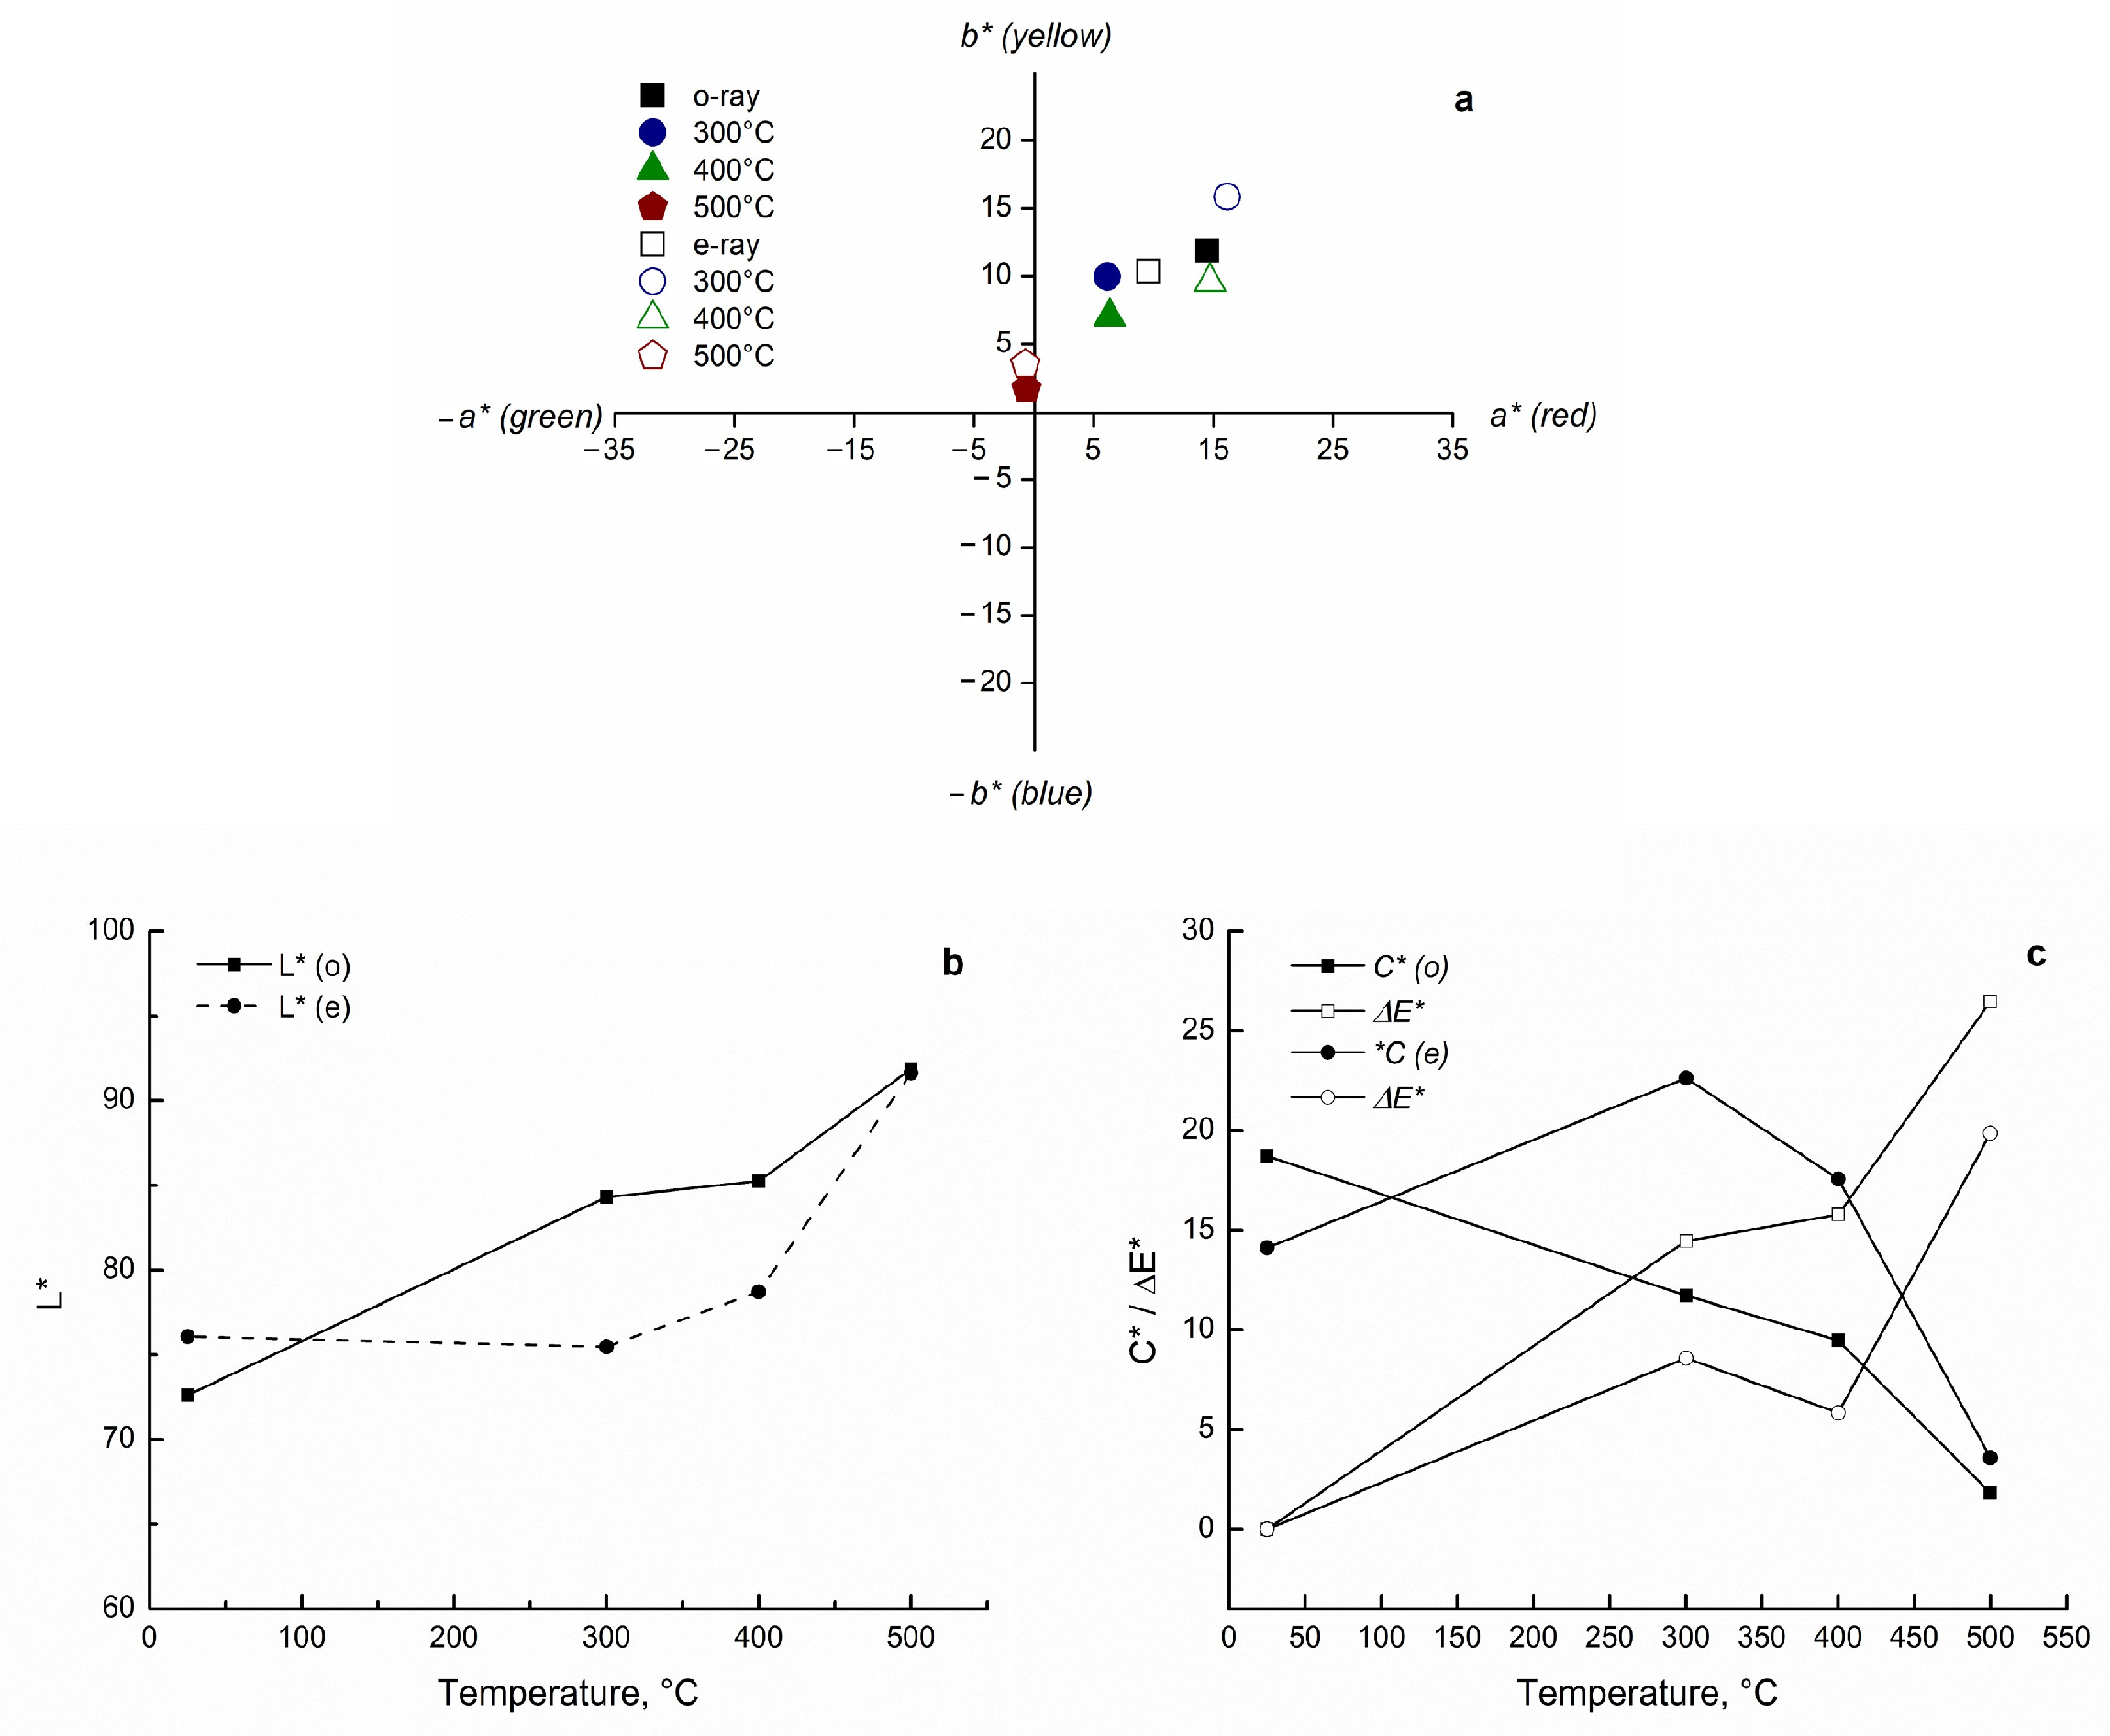
For example, POT01 measured along the o-ray evolved from an initial unheated state of L* = 72.6, a* = 14.4, and b* = 11.9 (C* = 18.7) to L* = 91.9, a* = −0.6, and b* = 1.7 (C* = 1.8) after heating at 500 °C. The corresponding ΔE* value reached 26.5, corresponding to a substantial color difference relative to the unheated state. Similar changes were observed along the e-ray direction, where the sample also evolved toward a highly desaturated and near-colorless appearance after heating. However, the thermal evolution of the e-ray was not entirely linear. At 300 °C, both a* and b* increased relative to the unheated state, resulting in a larger ΔE* value than that observed at 400 °C (Figure 3).
The red tourmaline (RT) samples displayed chromatic evolution comparable to that of the POT group but generally with a more gradual progression during heating. Although progressive reductions in a* and C* values were also observed, the RT specimens retained part of their original chromaticity at intermediate heating stages, particularly at 300 and 400 °C. Compared with the POT samples, the RT specimens maintained higher a* and C* values at the intermediate treatment temperatures (300 and 400 °C).
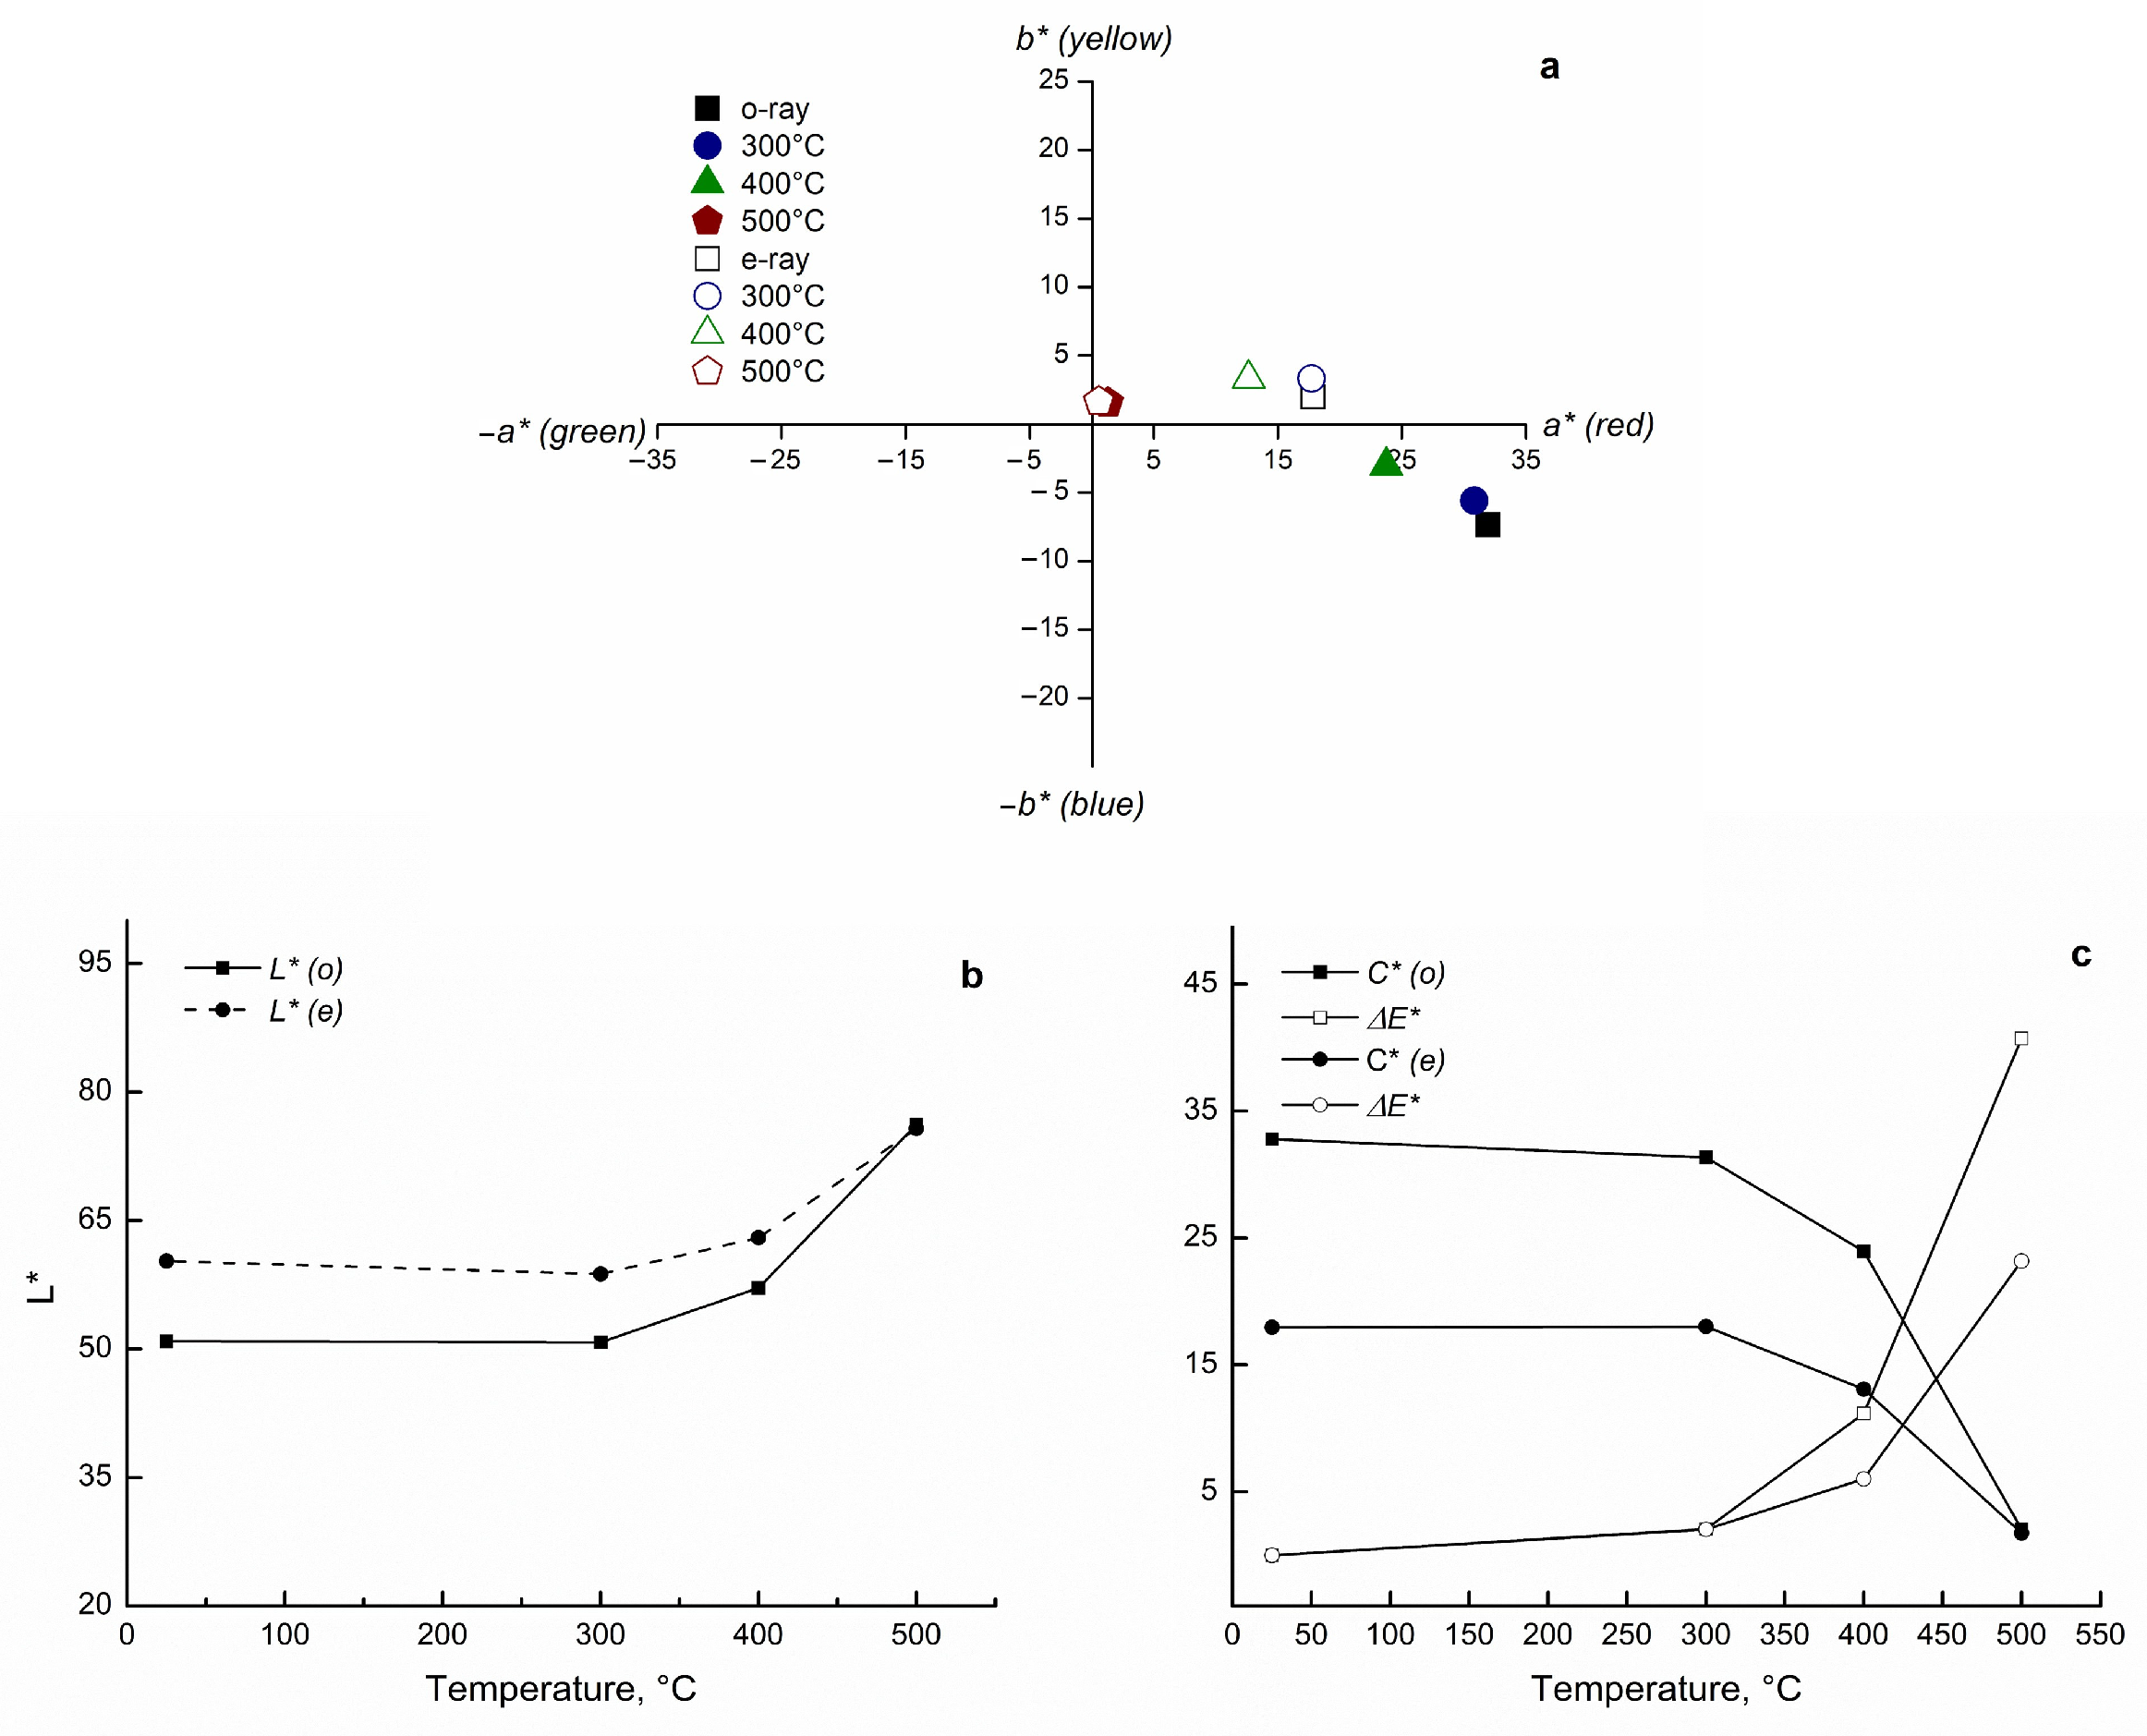
Sample RT01 along the o-ray initially displayed intense red coloration characterized by L* = 50.9, a* = 32.0, and b* = −7.3 (C* = 32.8). Only minor color evolution occurred at 300 °C, where ΔE* remained low at 2.1. More pronounced changes became evident at 400 °C, characterized by increasing lightness and decreasing red saturation. After heating at 500 °C, the sample evolved to L* = 76.2, a* = 1.3, and b* = 1.6, while chroma decreased substantially to C* = 2.0. The ΔE* value increased to 40.8, corresponding to a substantial color difference relative to the unheated state. Similar thermal evolution was observed along the e-ray direction (Figure 4).
Several RT samples also exhibited progressive shifts in b* values from negative toward positive values during heating, corresponding to a visual change from bluish-red toward more neutral or slightly yellowish hues. This trend became more pronounced with increasing treatment temperature and was accompanied by a gradual decrease in chroma (C*).
Distinct anisotropic responses between the o-ray and e-ray directions were observed throughout the step-heating sequence. The magnitudes of the changes in L*, a*, b*, and ΔE* differed between the two optical orientations. In several samples, the e-ray retained higher a* and C* values at the intermediate treatment temperatures, whereas the o-ray exhibited greater increases in lightness and larger decreases in chroma.
Overall, the step-heating experiments demonstrated progressive, temperature-dependent color modification in both the pinkish-orange (POT) and red (RT) tourmalines. Although some intermediate stages displayed non-linear chromatic evolution, the largest ΔE* values and the greatest reductions in chroma (C*) were generally observed after heating at 500 °C.

3.3.2. Direct-Heating Group (500 °C Single-Stage Treatment)

The direct-heating group (POT04–05 and RT04–05) exhibited pronounced optical changes following single-stage heating at 500 °C (representative data in Table 2; complete data in Table S3). Direct heating generally produced increased lightness and reduced chroma after a single heat-treatment stage, although individual sample responses varied.
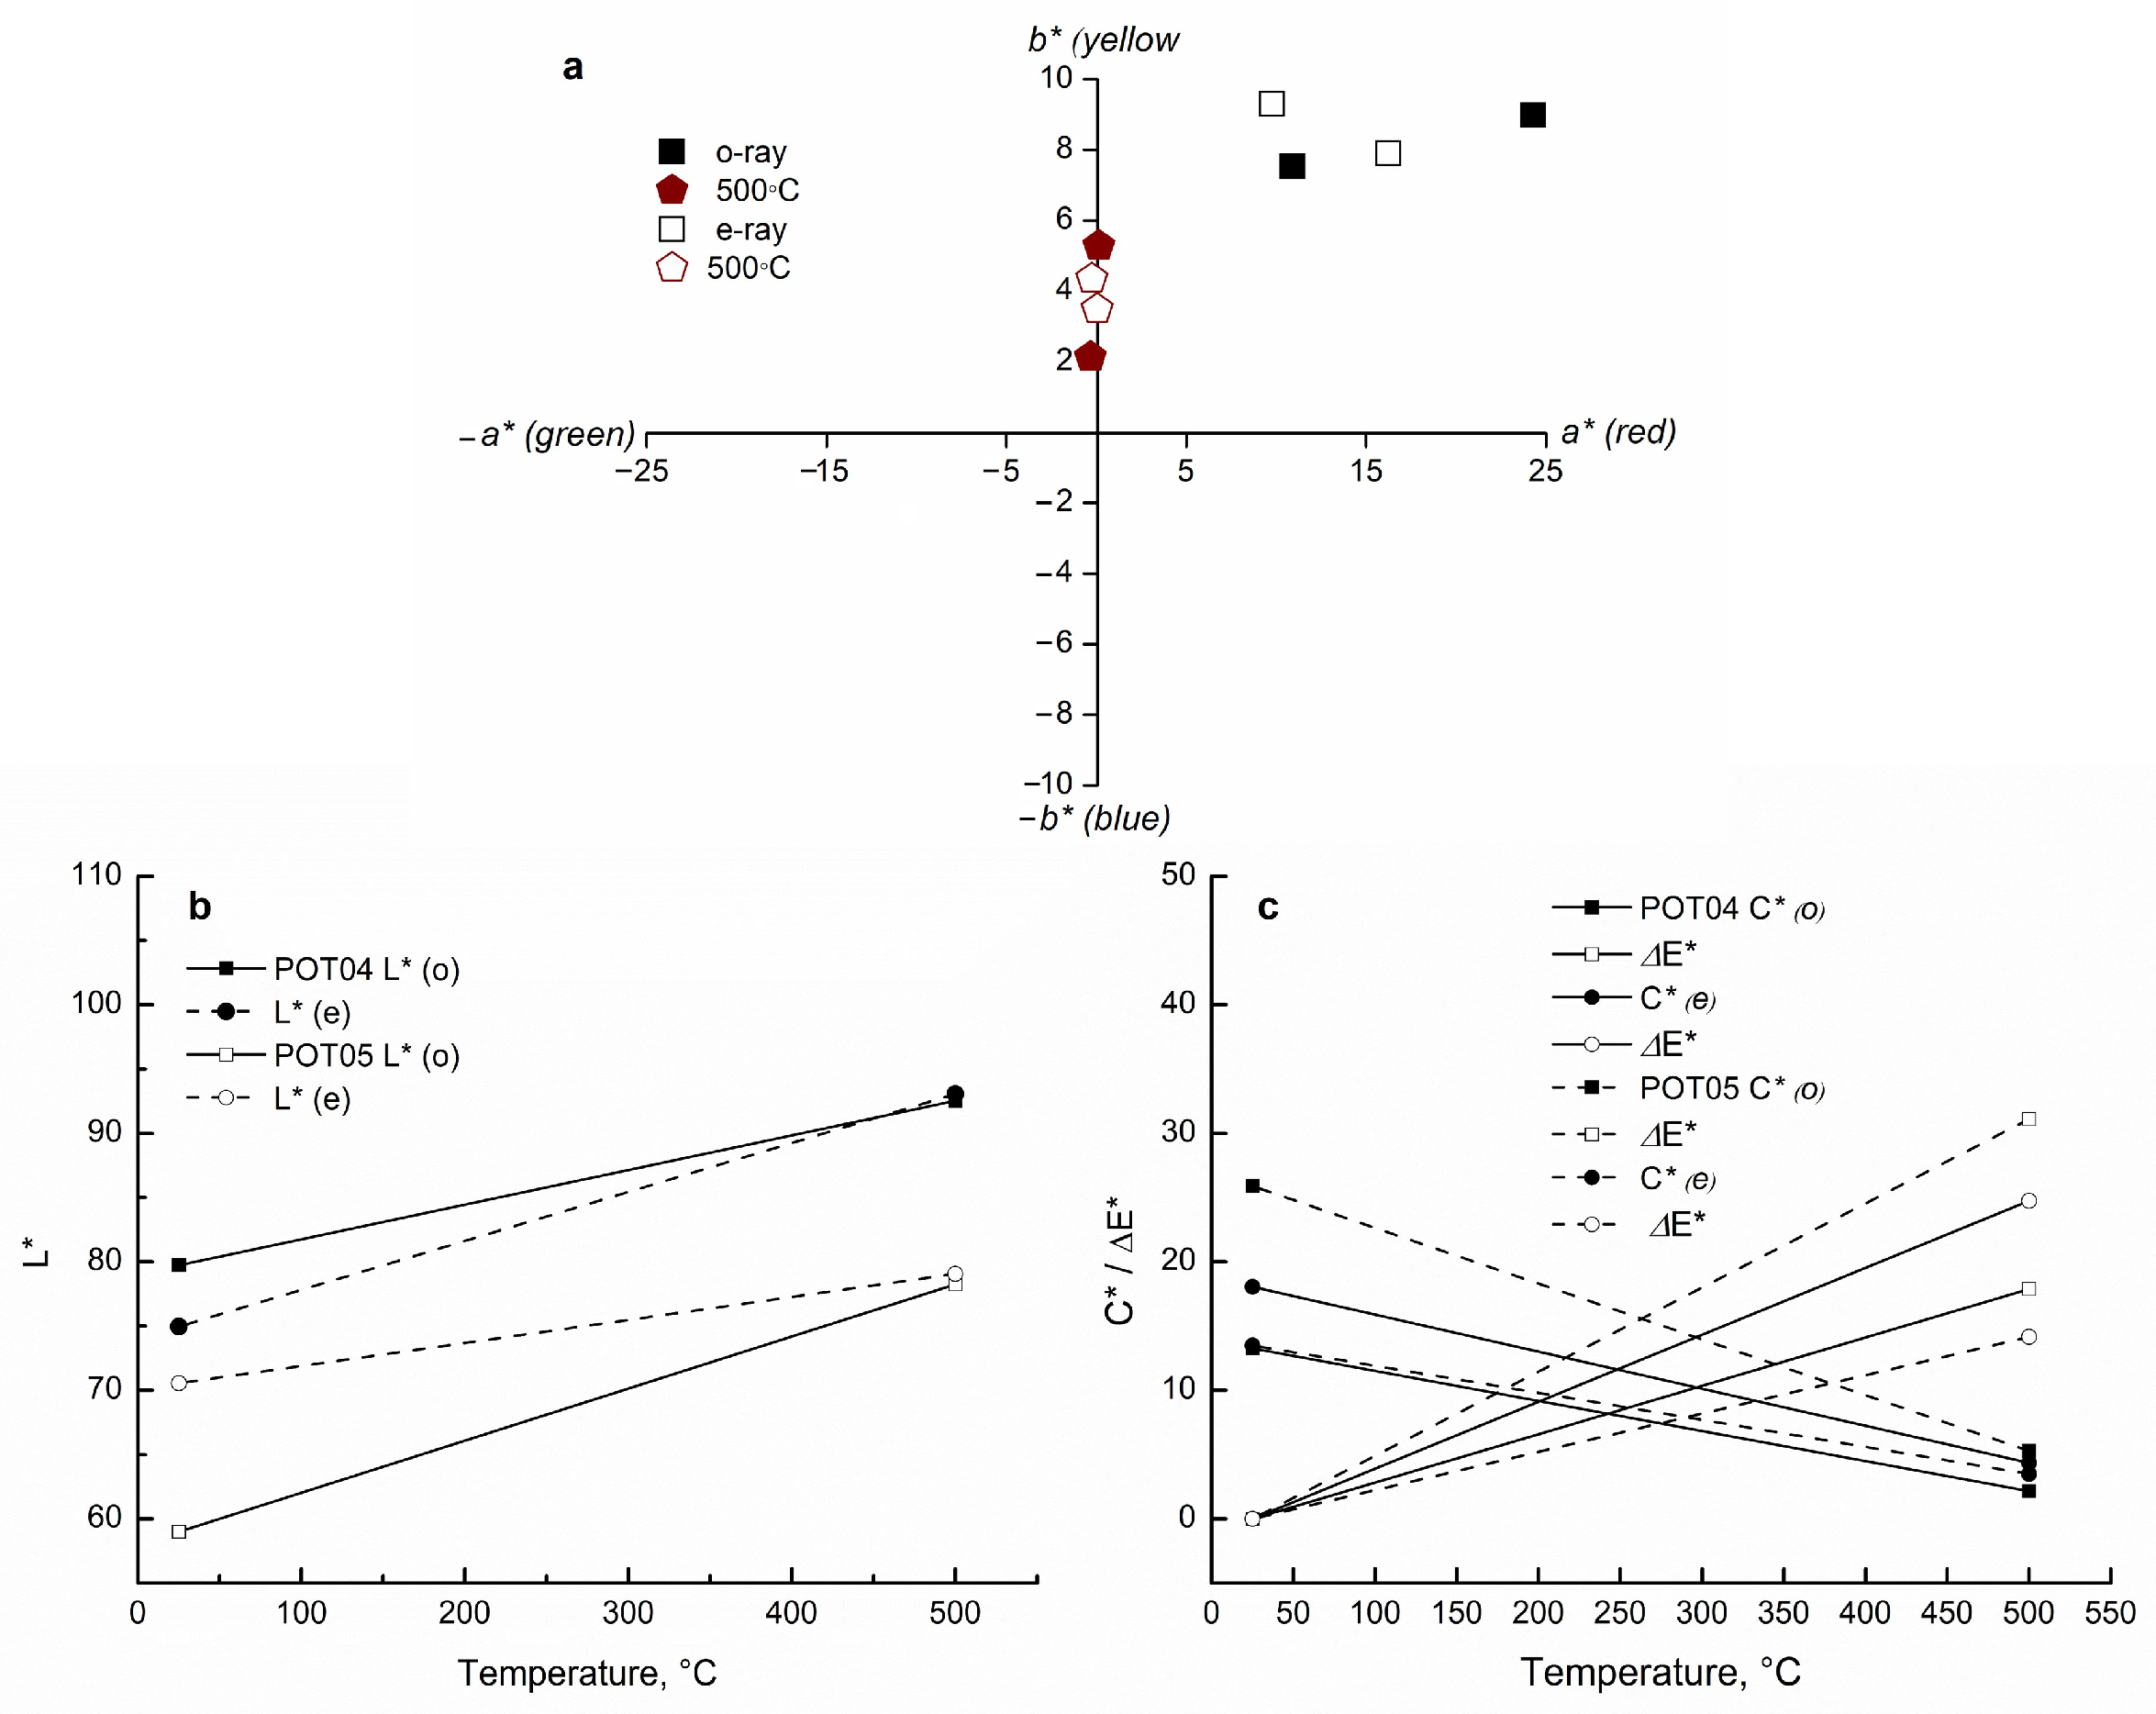
The POT samples again exhibited the largest changes in the CIELAB color parameters. Sample POT04 along the o-ray changed from an initial state of L* = 79.7, a* = 10.9, and b* = 7.5 (C* = 13.3) to a highly desaturated final state characterized by L* = 92.5, a* = −0.3, and b* = 2.1 (C* = 2.2) after heating. The corresponding total color difference was ΔE* = 17.9. Similar changes were observed along the e-ray direction, where substantial increases in lightness and reductions in chroma also occurred after heat treatment (Figure 5).
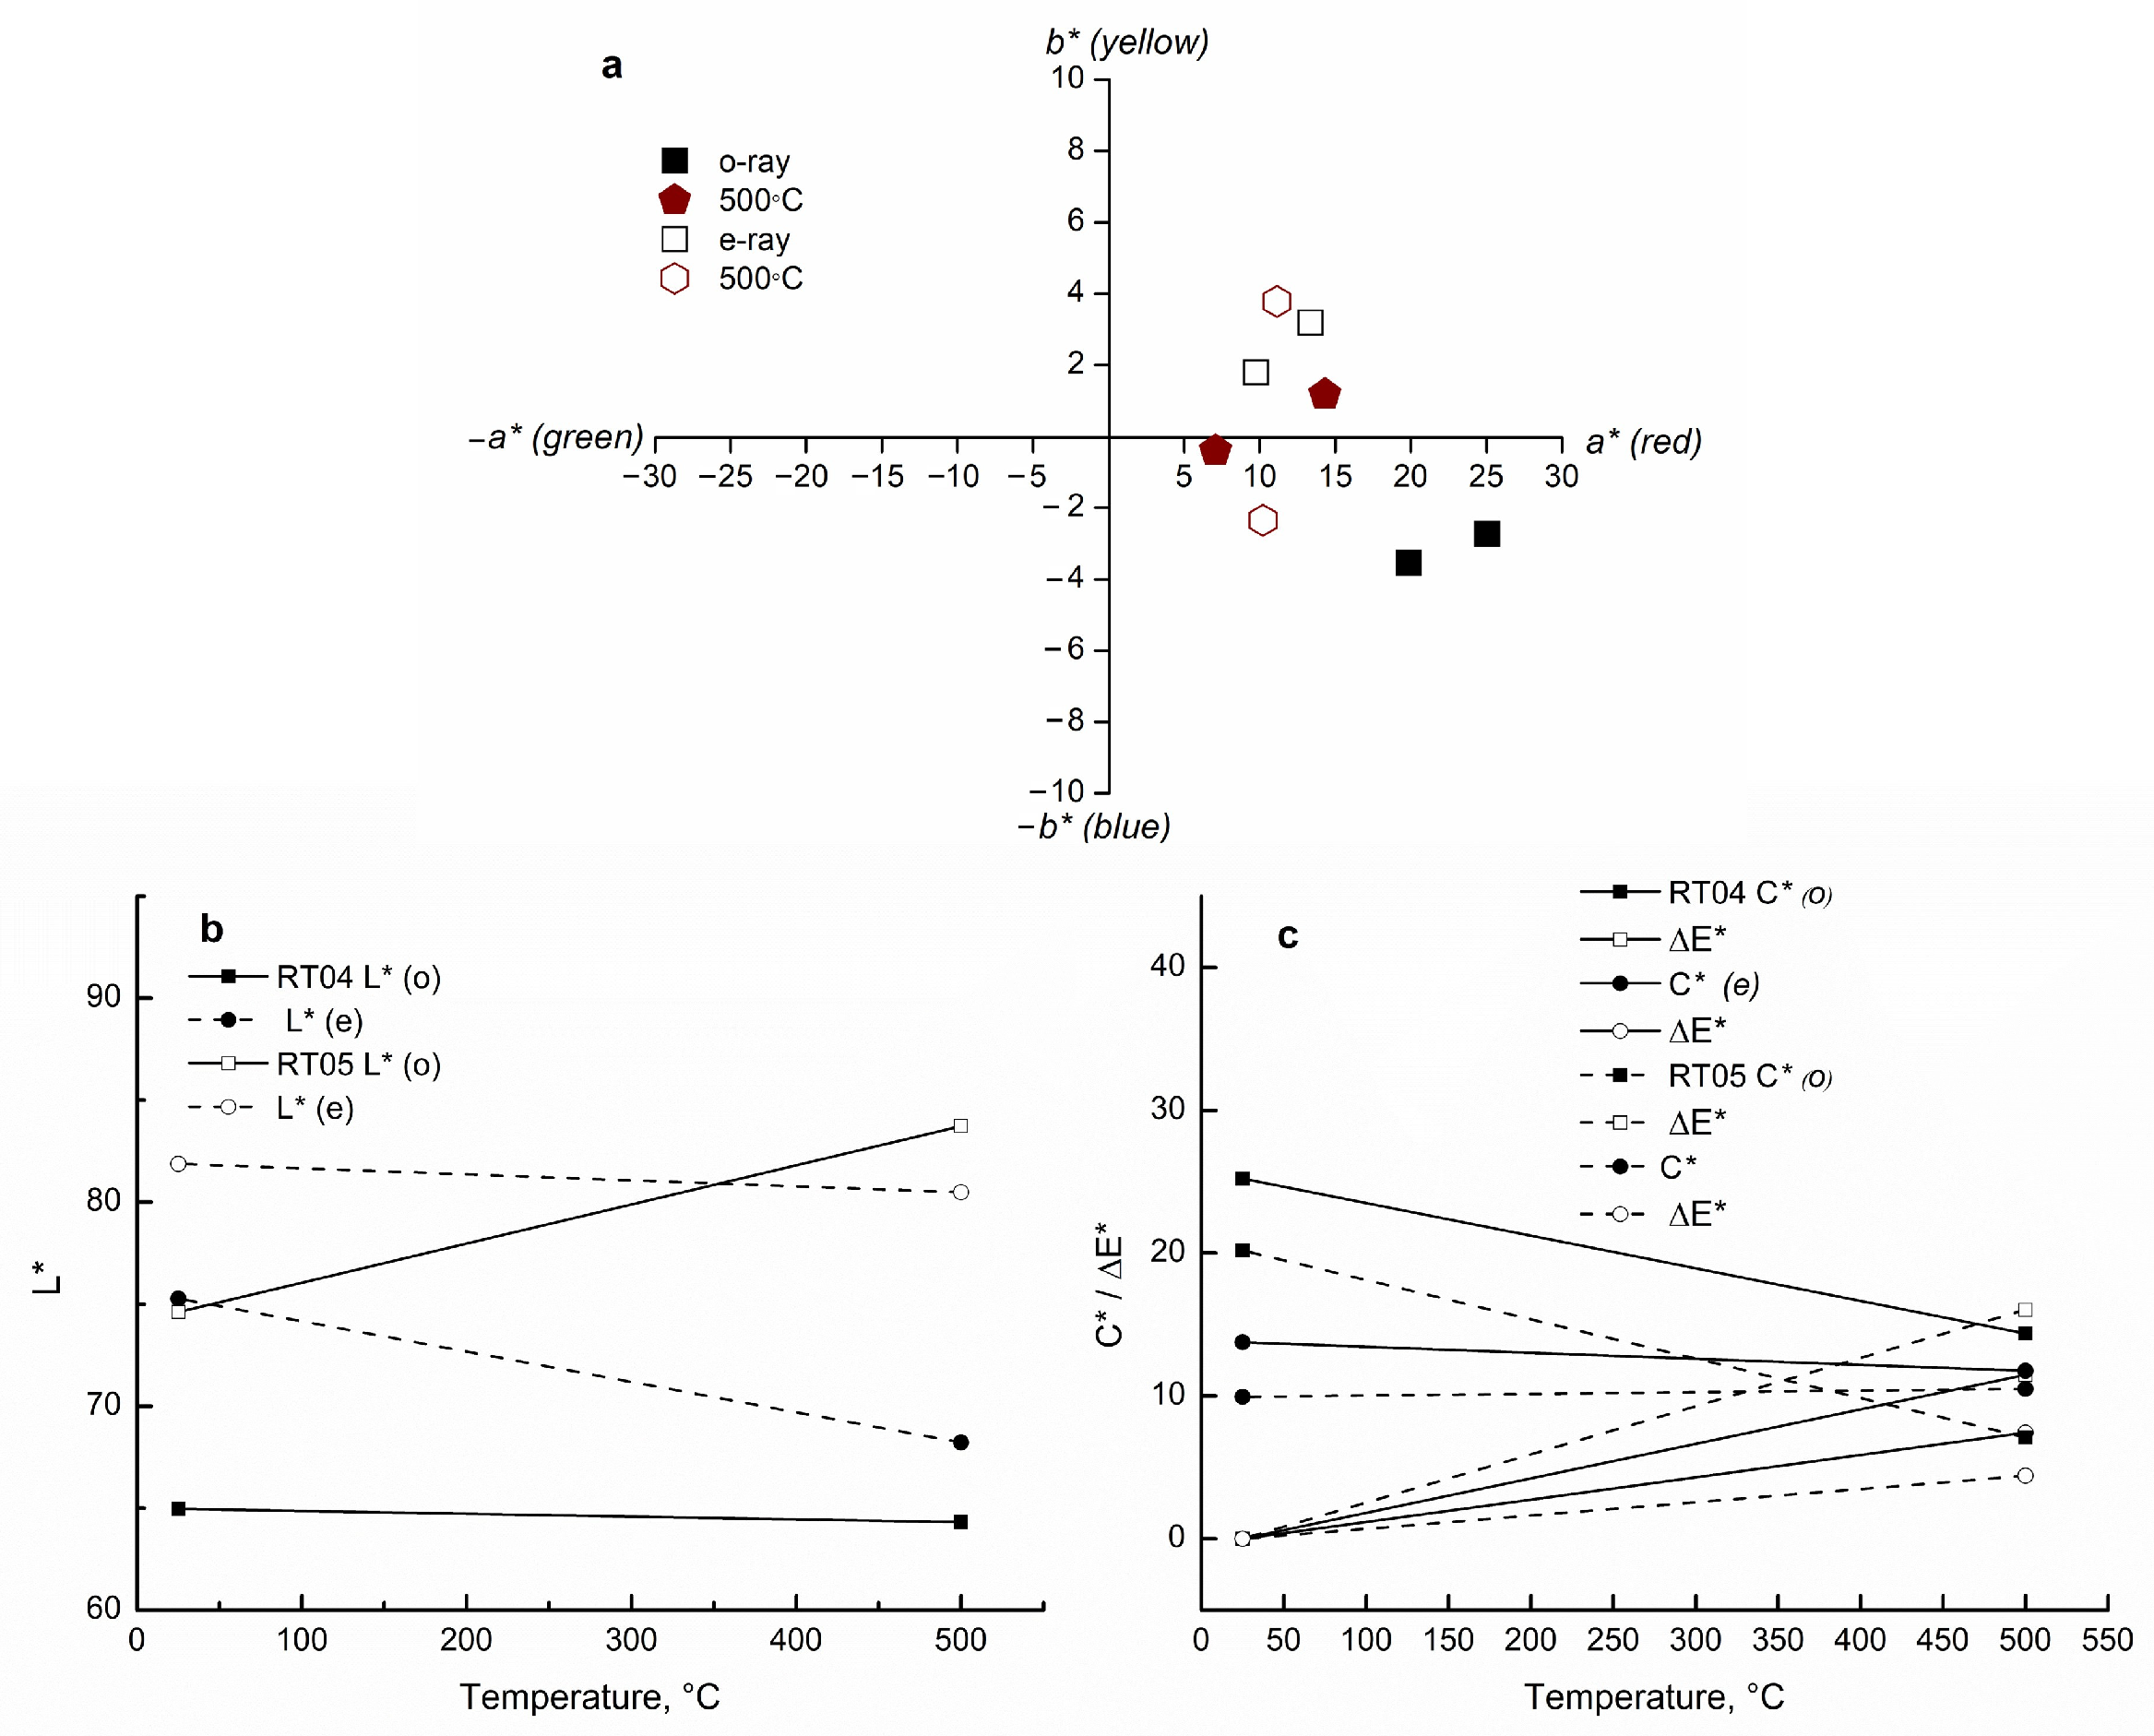
The RT samples revealed more variable thermal behavior than the POT group. Although decreases in a* and C* values were generally observed after direct heating, several RT specimens retained appreciable chromaticity after treatment. For example, RT04 measured along the o-ray showed only minor variation in lightness after heating (65.0 → 64.3), while the red chromatic component decreased from a* = 25.1 to 14.3. Chroma correspondingly decreased from C* = 25.2 to 14.4, yielding ΔE* = 11.5. Compared to the other RT specimens, RT04 retained relatively higher a* and C* values after heating (Figure 6).
The e-ray direction of RT04 displayed a contrasting response, with lightness decreasing from L* = 75.3 to 68.2 after heating. In contrast to the trend observed in most of the other investigated specimens, RT04 exhibited a decrease in lightness after direct heating.
Directional differences between the o-ray and e-ray remained evident in the direct-heated group. Compared to the step-heated specimens, the direct-heated ones showed color changes following a single heat-treatment stage rather than progressive intermediate stages.
Overall, the direct-heating experiments showed that single-stage heating at 500 °C produced substantial color modification in the investigated specimens. The largest decreases in chroma were observed in the direct-heated pinkish-orange specimens (POT04–POT05), whereas the direct-heated red specimens (RT04–RT05) exhibited greater variability in the measured CIELAB parameters after heating.

3.4. Spectroscopic Characteristics and Thermal Evolution

3.4.1. Polarized UV–Vis–NIR Spectral Characteristics

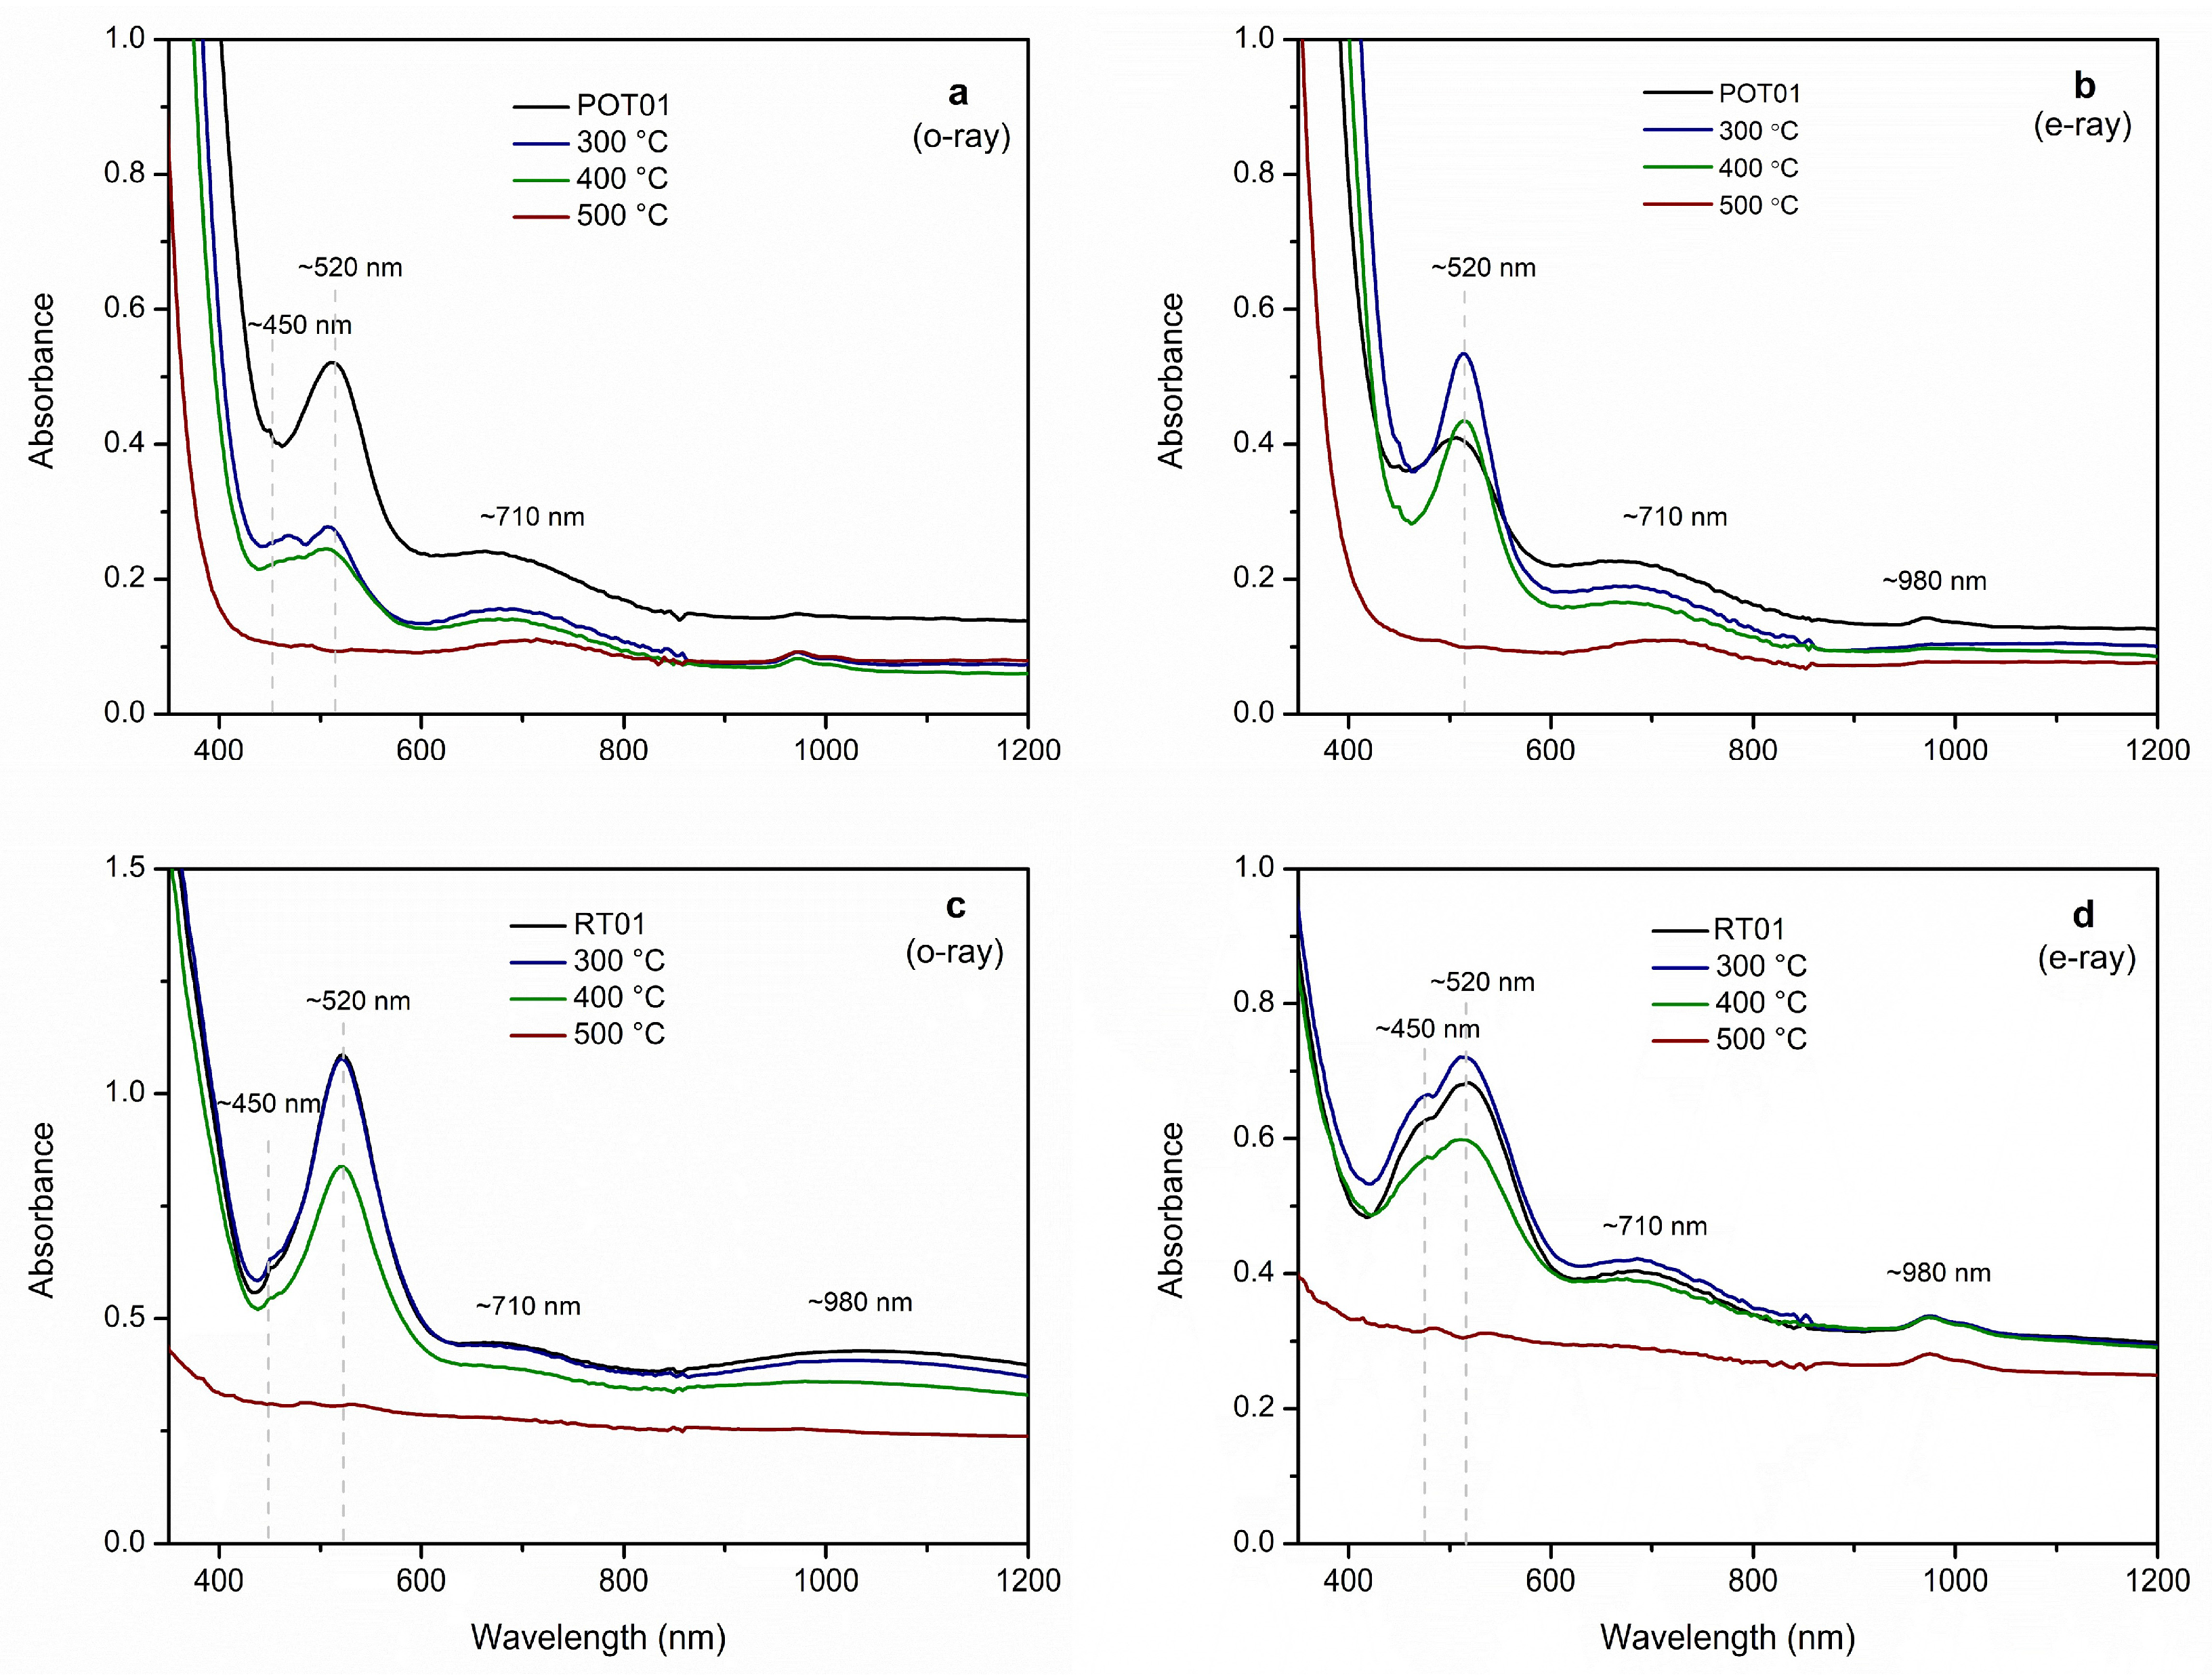
The polarized UV–Vis–NIR absorption spectra of the step-heated pinkish-orange tourmaline specimens exhibited a broad absorption band centered near 520 nm together with an absorption edge extending from the near-ultraviolet region toward the visible range. Strong pleochroism was evident, with the e-ray spectra exhibiting lower absorbance than the corresponding o-ray spectra. During step heating, the absorption band near 520 nm exhibited a slight increase in intensity in the e-ray spectra after heating at 300 °C and 400 °C relative to the untreated specimen, followed by a marked decrease after heating at 500 °C. In the o-ray spectra, the 520 nm absorption band progressively weakened with increasing treatment temperature. Despite these changes in absorption intensity, the overall pleochroic behavior was preserved (Figure 7a,b).
For the step-heated RT samples, the untreated o-ray spectra displayed a broad and intense absorption band centered near 520 nm together with a weaker absorption band around 450 nm. The corresponding e-ray spectra showed substantially lower absorption intensity throughout the visible region, consistent with the observed pleochroism. Progressive weakening of the visible absorption bands was observed with increasing treatment temperature. Minor spectral changes occurred after heating at 300 °C, larger reductions in absorption intensity were observed after heating at 400 °C and 500 °C (Figure 7c,d).
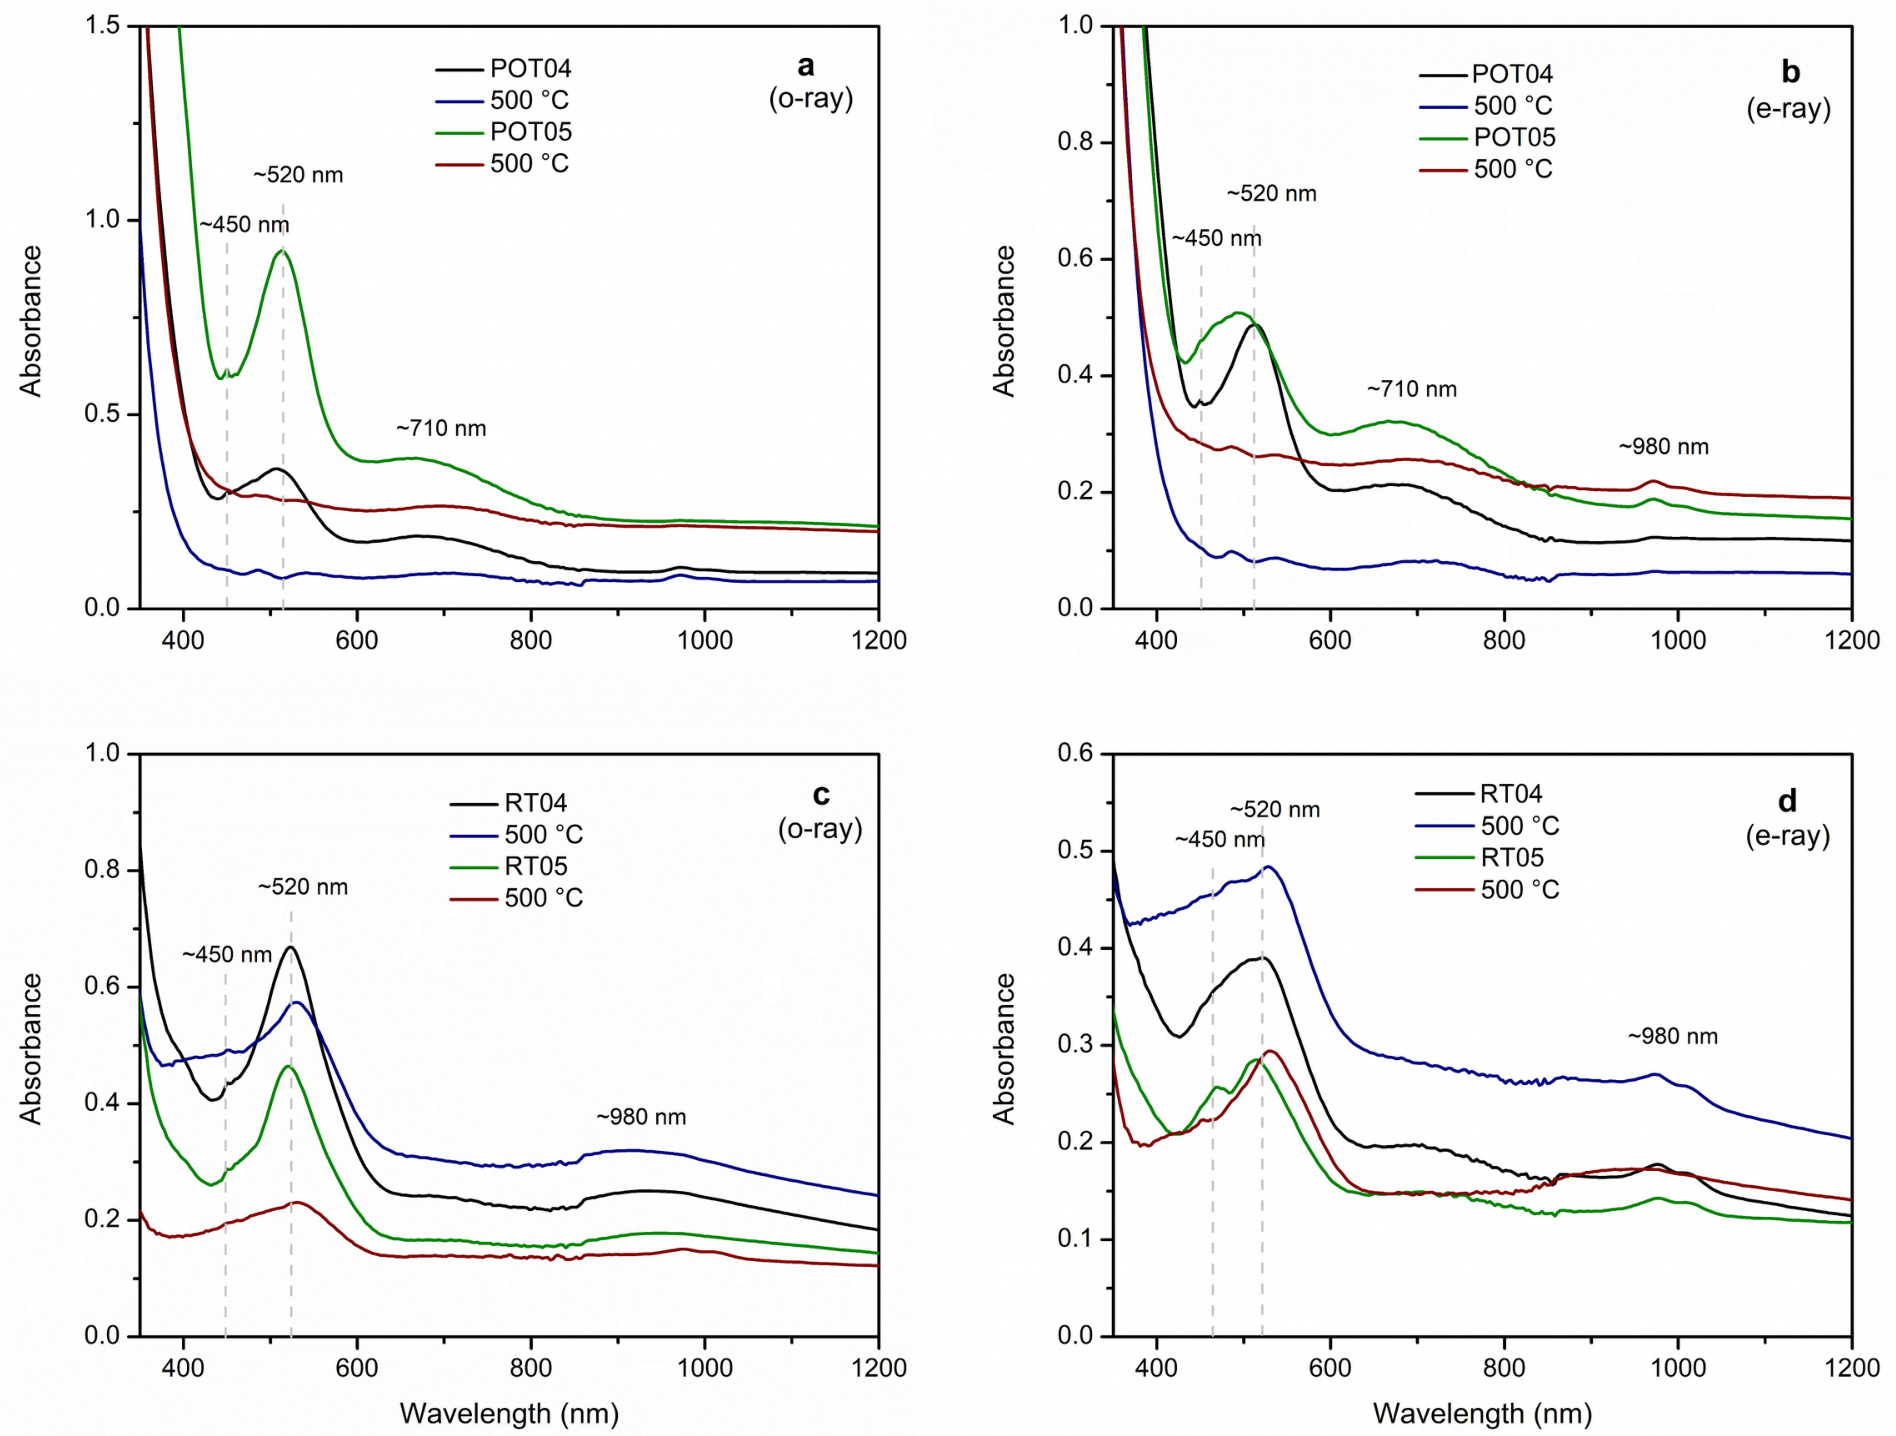
The direct-heated POT samples exhibited broad visible absorption features centered near 520 nm in both polarization directions before heating. After direct heating at 500 °C, the absorption intensity decreased in both the o-ray and e-ray spectra. These spectral changes were accompanied by decreases in chroma and increases in lightness measured by CIELAB colorimetry (Figure 8a,b).
Similarly, the direct-heated RT samples showed strong visible absorption features prior to heating, particularly along the o-ray direction. After direct heating at 500 °C, reductions in the visible absorption bands were observed in both polarization directions. Additional changes were also observed in spectral regions near approximately 450, 520, 710, and 980 nm. These spectral changes were accompanied by changes in the CIELAB color parameters after heat treatment (Figure 8c,d).
In addition to the weakening of the broad absorption band centered near 520 nm, the short-wavelength absorption wing extending from the near-ultraviolet into the visible region also became progressively weaker with increasing heating temperature. This reduction in absorption across the violet-to-blue region was generally accompanied by increased lightness (L*) and a decrease in chroma (C*), consistent with the progressive desaturation of the pinkish-orange and red tourmalines. The concurrent attenuation of both spectral features indicates an overall decrease in visible absorption after heat treatment, although the underlying crystal-chemical processes responsible for these spectral changes are discussed in Section 4.1.

3.4.2. Thermally Sensitive Features in the 2700–3200 and 1733–1750 cm−1 Regions (ATR Mode)

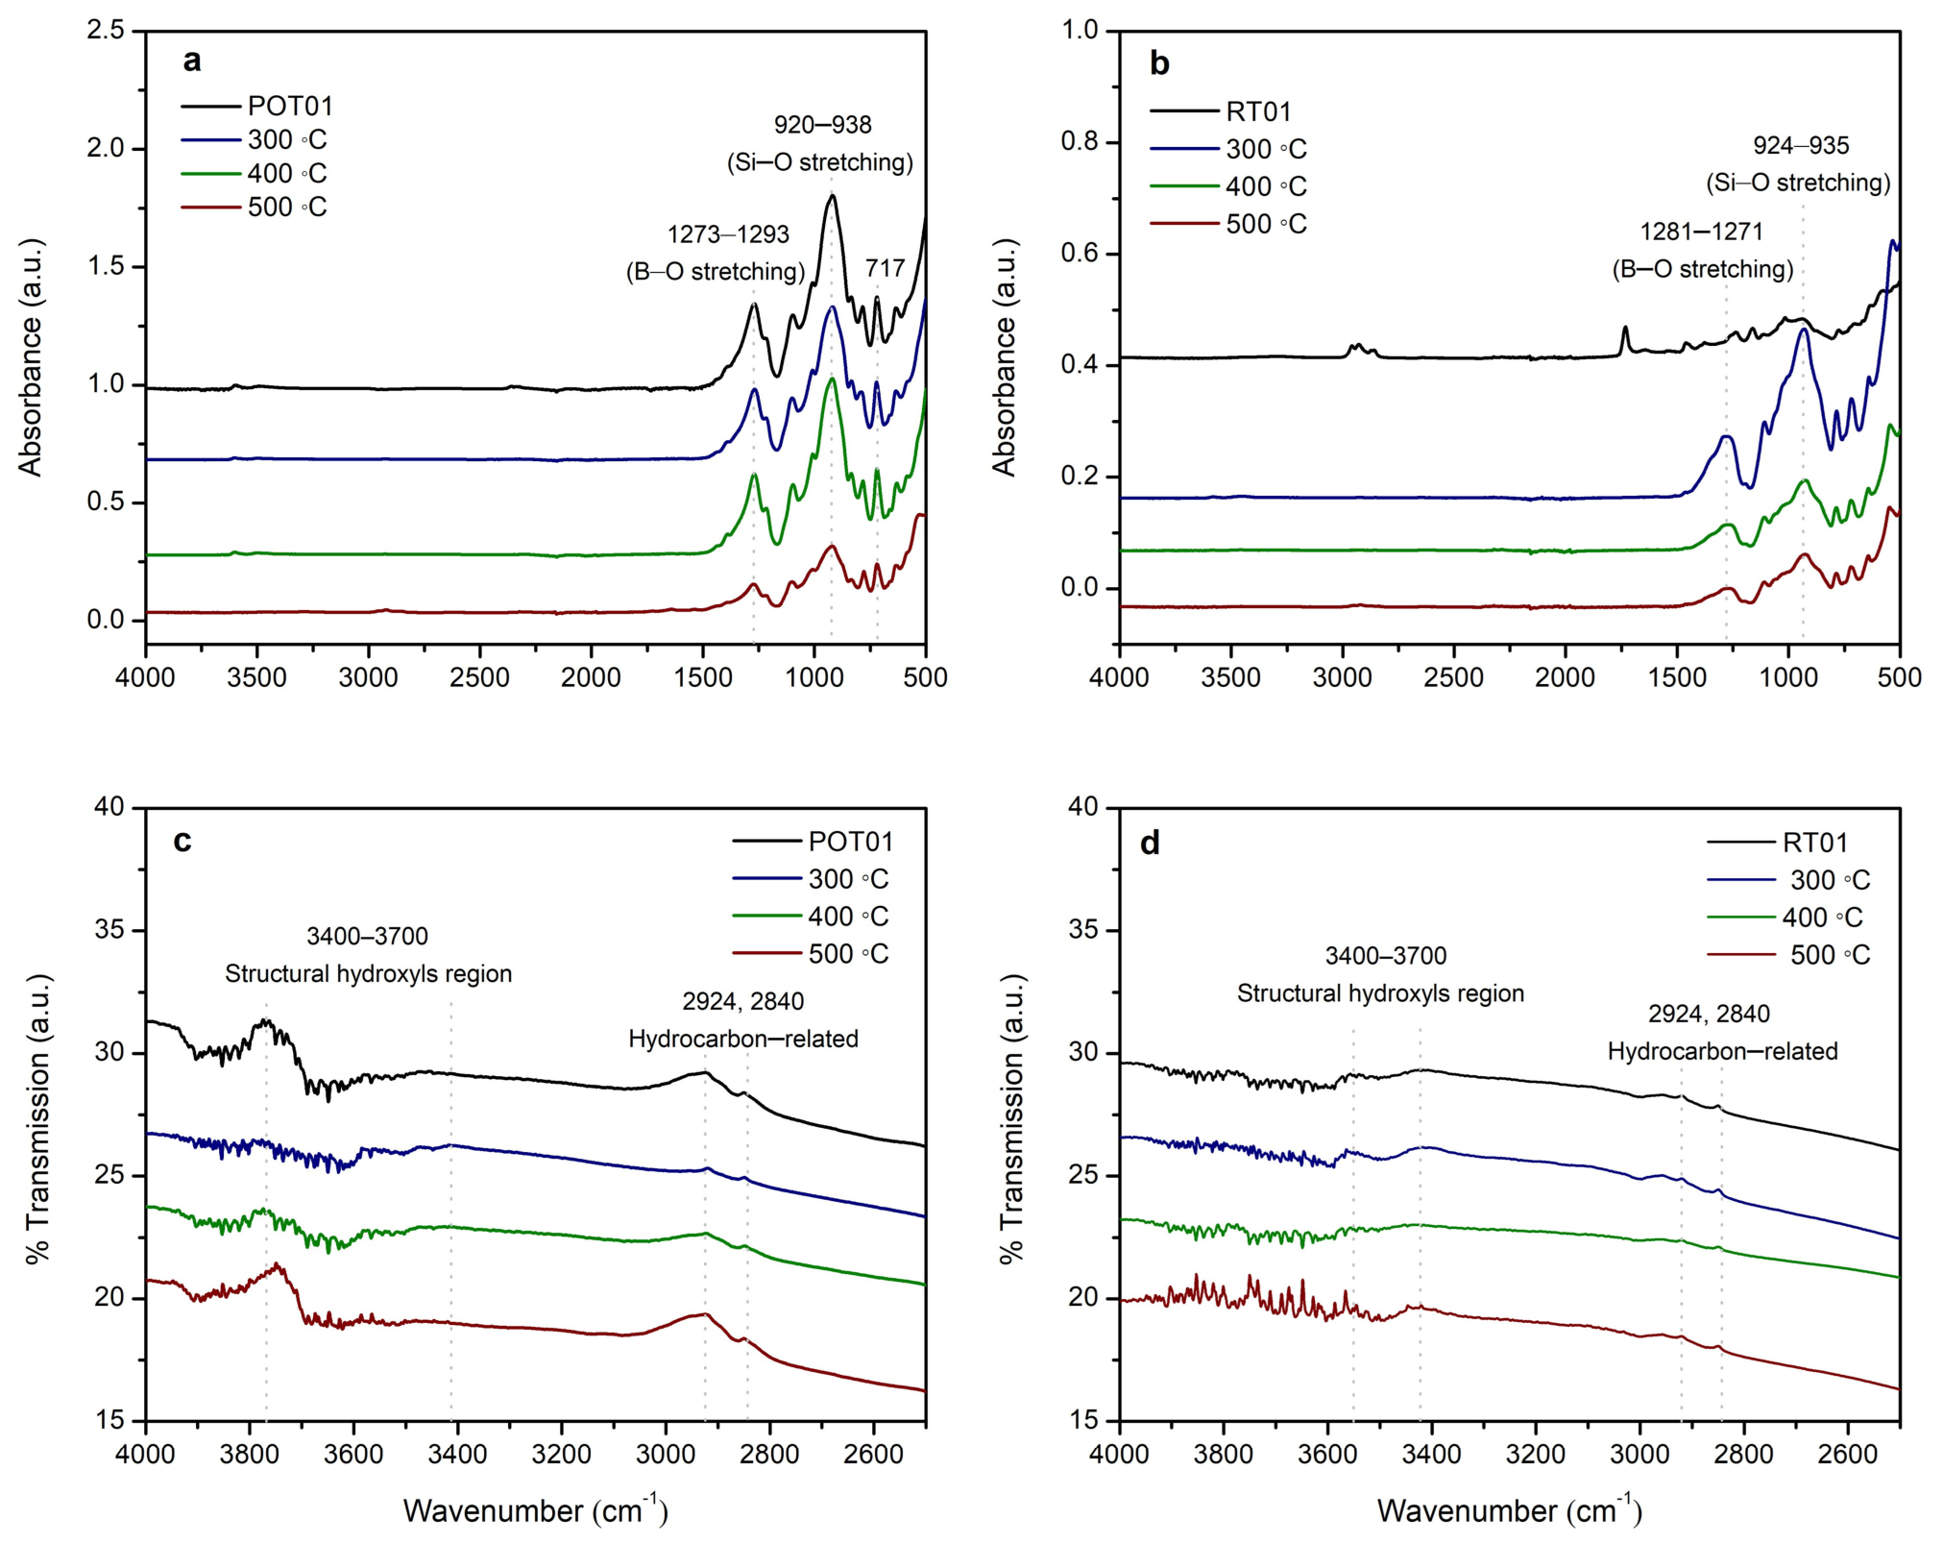
ATR-FTIR spectroscopy revealed several absorption features that changed after heat treatment (Figure 9a,b and Figure 10a). In the unheated specimens, absorption bands were observed within the 2700–3200 cm−1 region, including peaks centered at approximately 2950, 2920–2930, and 2858 cm−1. A weak absorption feature at approximately 1733–1750 cm−1 was also detected in the unheated red tourmaline samples.
For the step-heated specimens, the bands within the 2700–3200 cm−1 region decreased in intensity after heating at 300 and 400 °C. After heating at 500 °C, these features remained weakly detectable, although minor variations in relative band intensity and peak position were observed among the heated specimens (Figure 9a). No consistent monotonic trend beyond the overall reduction in these bands was observed.
The weak absorption feature at approximately 1733–1750 cm−1 exhibited a different response to heat treatment. This feature was observed in the untreated spectra but progressively decreased in intensity with heating and was no longer distinguishable after treatment at 500 °C (Figure 9b).
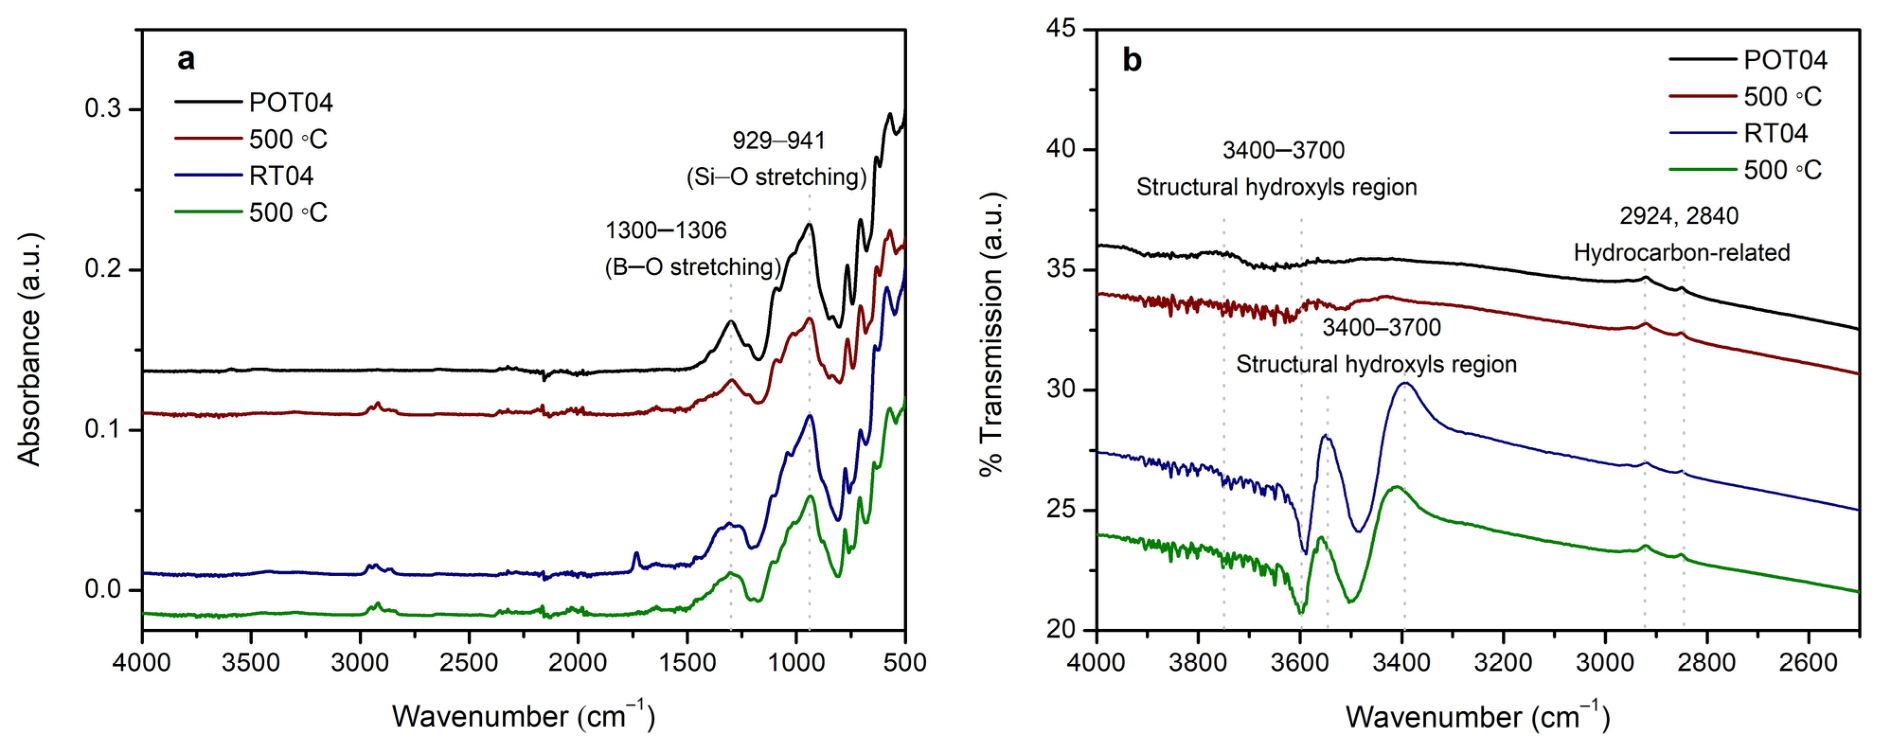
For the directly heated specimens, weak absorption bands within the 2700–3200 cm−1 region remained detectable after heating at 500 °C, whereas the weak feature near 1733–1750 cm−1 was strongly diminished or absent (Figure 10a).

3.4.3. High-Frequency Hydroxyl Structural Regime (DRIFT Mode)

Diffuse reflectance infrared Fourier transform (DRIFT) spectroscopy was employed to examine the hydroxyl-stretching region between 3400 and 3700 cm−1 (Figure 9c,d and Figure 10b). In the unheated specimens, all samples exhibited a broad absorption envelope extending across this region, consistent with overlapping hydroxyl-related vibrational features.
For the step-heated specimens, minor variations in the hydroxyl-stretching region were observed with increasing treatment temperature. The broad absorption envelope remained present throughout the heating sequence, while changes in overall intensity and band profile were evident after heating. No new discrete absorption bands were observed within the investigated spectral range.
The directly heated specimens also exhibited minor variations in band intensity and profile relative to the unheated specimens, although the magnitude of these changes differed among samples. The broad hydroxyl absorption envelope remained evident in all spectra after heating. Overall, the DRIFT spectra indicate that heat treatment up to 500 °C did not produce substantial modification of the hydroxyl-stretching region, consistent with the preservation of the principal tourmaline framework inferred from the FTIR results.

3.4.4. Low-Frequency Structural Framework Regime (ATR Mode)

The low-frequency framework region below 1400 cm−1 was examined using ATR-FTIR spectroscopy (Figure 9a,b and Figure 10a). In the untreated specimens, the spectra were characterized by a prominent absorption band near 1270–1310 cm−1 together with a series of overlapping bands between approximately 900 and 1100 cm−1, including a dominant feature centered near 924–938 cm−1.
These principal absorption features remained present throughout all heating treatments up to 500 °C. Small shifts in peak position were observed after heating, with the band near 1270–1310 cm−1 and the dominant feature within the 900–1100 cm−1 region shifting slightly toward lower wavenumbers.
Similar spectral behavior was observed for both the step-heated and directly heated specimens. At 500 °C, the two heating pathways produced comparable overall spectral profiles and band positions. No disappearance of the principal framework-related absorption features or substantial changes in their overall band shapes were observed after heating.

4. Discussion

4.1. Spectroscopic Interpretation of Heat-Induced Color Modification

The combined colorimetric, polarized UV–Vis–NIR, FTIR, and chemical analyses provide complementary evidence for the heat-induced color evolution observed in the investigated tourmalines under the experimental conditions employed. Heat treatment produced a progressive weakening of the broad visible absorption band centered near 520 nm, accompanied by a concurrent decrease in the short-wavelength absorption wing extending from the near-ultraviolet region into the visible spectrum. These spectroscopic changes closely paralleled the decrease in the green-to-red coordinate (a*), reduced chroma (C*), and generally increased lightness (L*), demonstrating a direct association between the observed desaturation and reduced absorption within the visible spectral region.
The polarized UV–Vis–NIR spectra provide further information on the optical changes induced by heating. In the untreated specimens, the visible spectra were dominated by the broad absorption band centered near 520 nm, together with the short-wavelength absorption wing and weaker absorption features near approximately 710 and 980 nm. Strong pleochroism was observed throughout the investigated spectral range, with consistently greater absorption in the o-ray direction than in the e-ray direction before and after heating. The persistence of this polarization dependence indicates that heating reduced the magnitude of visible absorption while preserving the pronounced optical anisotropy of the specimens. Similar polarization-dependent absorption has been reported for Mn-bearing tourmalines and has been related to their anisotropic crystal structure and the distribution of chromophoric ions among crystallographic sites [11,17,35,36].
Transition-metal ions that may contribute to color in tourmaline are accommodated predominantly at octahedrally coordinated crystallographic sites. Mn2+ and Mn3+ are generally incorporated at the Y octahedral site, whereas Fe2+ and Fe3+ occur primarily at the Y site, with possible substitution at the Z octahedral site depending on composition. Ti4+ is likewise predominantly associated with the octahedral Y site. Previous polarized UV–Vis–NIR studies have commonly associated the broad absorption near 520 nm in pink-to-red tourmalines with Mn3+-related electronic transitions, while Fe-related absorptions, intervalence charge-transfer processes, and local crystal-field effects may also contribute to the visible spectra [10,11,14,21,37,38]. These crystallographic and spectroscopic assignments provide a useful framework for discussing possible origins of the observed absorption features; however, neither the oxidation states nor the crystallographic site occupancies of these ions were directly determined in the present specimens.
The weaker absorption features near approximately 710 and 980 nm exhibited comparatively smaller changes during heating than the broad visible band, whereas the short-wavelength absorption wing progressively weakened. These observations indicate that the heat-induced spectral evolution involves changes across multiple overlapping absorption features rather than the disappearance of a single isolated band. Several electronic processes have been proposed in previous studies of Mn-bearing tourmalines, including changes involving Mn-related electronic transitions, Fe-related interactions, intervalence charge transfer, and Fe–Ti charge-transfer processes [10,11,14,16,35,36,37,38]. Because the present spectra contain overlapping broad absorptions and no oxidation-state-sensitive measurements were performed, the relative contributions of these processes cannot be resolved quantitatively. They are therefore considered here as possible contributors rather than as uniquely identified mechanisms for the observed color modification.
The chemical data likewise indicate that elemental abundance alone does not determine the optical response. LA-ICP-MS analyses showed that, with the exception of RT04 and RT05 discussed in Section 4.2, the red tourmalines generally contained higher Mn concentrations than the pinkish-orange specimens and exhibited stronger initial visible absorption and greater color saturation. However, the contrasting behavior of RT04 and RT05 demonstrates that total Mn concentration alone is insufficient to account for the observed spectral and color evolution. Variations in oxidation state, crystallographic site occupancy, local coordination environment, overlapping electronic absorption processes, and compositional heterogeneity may all influence the optical response. Because the present analytical methods determine elemental concentrations but do not directly determine oxidation states or crystallographic site occupancies, the individual contributions of these factors cannot be established from the present data.
Structural order may also influence the optical response during heating. Variations in local coordination geometry, lattice distortion, and defect environments can modify the local crystal-field conditions surrounding chromophoric centers and thereby affect electronic absorption. Crystallinity was not directly quantified in the present study; therefore, a contribution from subtle heat-induced changes in structural order cannot be excluded. Nevertheless, the principal framework-related FTIR bands remained essentially unchanged after heating to 500 °C, with only minor variations observed in the hydroxyl-stretching region. The preservation of these framework vibrations provides no evidence for major disruption of the tourmaline structure under the investigated heating conditions. Accordingly, although subtle changes in structural order or local coordination environments may contribute to the observed optical evolution, the present FTIR results do not indicate major structural degradation of the tourmaline framework.
Taken together, the results demonstrate that heat treatment modified the visible absorption behavior of the investigated tourmalines while preserving their pronounced optical anisotropy and principal framework-related vibrational features. The observed color evolution is therefore associated with changes in the electronic absorption spectrum, potentially influenced by several interrelated compositional and local structural factors. The present data do not permit these changes to be assigned uniquely to a particular transition-metal ion, oxidation-state transformation, crystallographic redistribution, or change in structural order. Consequently, the spectroscopic interpretation presented here is intentionally non-specific with respect to the microscopic mechanism of heat-induced color modification.

4.2. Relationships Between Chemical Composition and Thermal Response

The investigated specimens exhibited notable compositional variability, particularly with respect to Mn content. Most red tourmalines (RT01–RT03) contained substantially higher Mn concentrations than the pinkish-orange tourmalines and generally exhibited more pronounced color changes during heating. LA-ICP-MS analyses further revealed that RT04 and RT05 contained only ~200 ppm Mn, compared to 8166–9477 ppm in RT01–RT03, highlighting substantial compositional variability within the investigated red tourmalines. However, because the LA-ICP-MS analyses represent localized measurements obtained from a single 55 μm ablation spot, these concentrations should be regarded as approximate values for the analyzed regions. Nevertheless, the pronounced difference in Mn concentration between RT04–RT05 and RT01–RT03 indicates that total Mn abundance alone cannot fully account for the initial coloration or thermal response of the investigated red tourmalines. Additional compositional, electronic, and crystal-chemical factors, together with possible sample heterogeneity, are also likely to influence these properties [14,37,38].
Variations in matrix composition further differentiated the investigated specimens. POT02–POT05 displayed broadly comparable elemental compositions, with relatively low Mn contents and moderate Ca concentrations. In contrast, POT01 contained relatively elevated Ca (7.36 ± 3.53 wt.%) and K (6.00 ± 12.83 wt.%) concentrations determined by EDXRF, distinguishing it from the remaining investigated specimens. Likewise, POT04 exhibited the highest Ca concentration among the investigated specimens. Although these compositional differences are evident, the EDXRF data are intended primarily for comparative evaluation of bulk compositional variability and are not sufficient for crystal-chemical classification, mineral-species assignment, or determination of cation site occupancy. Despite these compositional differences, both color groups exhibited measurable decreases in color saturation after heating to 500 °C, indicating that thermal color modification occurred across the investigated compositional range.
An exception to the general color-fading trend was observed in the direct-heated specimen RT04, which contained comparatively low Mn and Fe concentrations according to both EDXRF and LA-ICP-MS analyses. Unlike the more strongly colored specimens that exhibited substantial decreases in chroma and increases in lightness after heating, RT04 displayed a slight decrease in lightness, particularly in the e-ray direction. This contrasting response suggests that the thermal behavior of tourmaline depends not only on heating conditions but also on the initial characteristics of individual specimens. The atypical response of RT04 further supports the interpretation that elemental abundances alone are insufficient to account for the observed thermal behavior of all investigated specimens. Instead, the optical response may additionally be influenced by crystal-chemical factors such as oxidation state, crystallographic site occupancy, local crystal-field environment, and overlapping transition-metal-related electronic absorption processes.
These observations are consistent with the discussion presented in Section 4.1 and further demonstrate that total elemental abundance alone is insufficient to account for the observed heat-induced color modification. The optical response is more appropriately interpreted as reflecting changes in overlapping electronic absorption features influenced by multiple compositional and local structural factors.

4.3. Pleochroism and Direction-Dependent Optical Response

Strong pleochroism was observed before and after heat treatment. Polarized UV–Vis–NIR spectra consistently showed stronger absorption in the o-ray direction than in the e-ray direction, corresponding to the more intense body colors observed visually and quantified by the CIELAB measurements.
Although heating significantly reduced the intensity of the visible absorption band, directional differences between the o-ray and e-ray spectra remained evident after treatment. The pronounced directional dependence of absorption is consistent with the anisotropic crystal structure of tourmaline and with previous interpretations relating polarized absorption to the orientation of transition-metal-bearing sites relative to polarized light [1,2,26,39,40]. These observations demonstrate that heat treatment reduced the overall intensity of visible absorption while the characteristic pleochroic behavior of the investigated tourmalines was retained under the experimental conditions employed.

4.4. FTIR Assessment of Framework Stability

The low-frequency ATR-FTIR spectra indicate no evidence of major alteration in the principal borosilicate framework of tourmaline after heat treatment up to 500 °C. Characteristic vibrational bands associated with the silicate framework and borate groups remained well resolved in all heated specimens. The principal framework-related absorption bands within the 1400–600 cm−1 region, including bands near 1310 cm−1 attributed to B–O stretching vibrations and bands near 970 cm−1 associated with Si–O stretching and bending modes, exhibited no substantial changes in shape or intensity after heating. The preservation of these fundamental vibrational features suggests that no major alteration in the principal borosilicate framework was detectable by FTIR after heat treatment, consistent with previous studies on tourmaline heated under comparable conditions [15,23,41]. Minor redshifts of approximately 2–4 cm−1 observed after heating to 500 °C may reflect subtle adjustments in local bonding environments or cation coordination rather than substantial structural reorganization of the tourmaline lattice [15,25,26,27,28].
Subtle variations within the hydroxyl-stretching region (3400–4000 cm−1) observed in the DRIFT spectra suggest that thermal exposure may have influenced local hydroxyl environments and hydrogen-bonding configurations. In tourmaline, O–H stretching vibrations are highly sensitive to the occupancy and distribution of neighboring cations surrounding the V and W structural sites. Consequently, the observed modifications in band symmetry and relative intensity may reflect localized adjustments in cation–OH interactions associated with heat treatment. Nevertheless, the persistence of the broad hydroxyl absorption envelope in all treated samples suggests that extensive dehydroxylation did not occur under the experimental conditions employed. These observations are broadly consistent with previous studies [15,16,17,22,24,40,41,42] reporting that moderate-temperature heating can affect local structural environments while preserving the principal tourmaline framework.
Additional weak absorption bands were observed within the 2700–3200 cm−1 and 1733–1750 cm−1 regions of the ATR spectra. These features generally decreased after heating but are not characteristic of intrinsic tourmaline vibrations. Their attenuation is therefore interpreted as reflecting modification or removal of minor surface-associated or other extrinsic species rather than changes within the principal borosilicate framework [43,44,45].
The preservation of the principal framework-related FTIR features up to 500 °C is consistent with previous studies reporting the thermal and structural stability of tourmaline over this moderate-temperature range [15,16,39]. Crystallinity was not directly quantified in the present study; therefore, subtle changes in structural order, lattice distortion, or defect environments cannot be excluded on the basis of the FTIR measurements alone. Accordingly, the preservation of the framework-related vibrational features should be interpreted as evidence that no major structural disruption was detected rather than as direct evidence of unchanged crystallinity. Within this limitation, the present results demonstrate that substantial changes in visible absorption and color occurred under both progressive step-heating and direct-heating pathways without major modification of the principal borosilicate framework detectable by ATR-FTIR. The comparable framework-region spectra obtained after the two heating pathways further indicate similar FTIR-detectable structural responses under the investigated conditions.

4.5. Influence of Heating Temperature and Pathway on Gemological Outcomes

Both the step-heating and direct-heating protocols produced substantial reductions in visible absorption intensity and color saturation after treatment at 500 °C. Although intermediate color changes differed among specimens during step heating, the investigated specimens generally exhibited less saturated color states after treatment at 500 °C. However, because the step-heated and direct-heated groups comprised different and compositionally heterogeneous specimens, the relative influences of final treatment temperature and heating pathway cannot be independently resolved from the present dataset.
From a gemological perspective, the condition producing the greatest color difference or strongest desaturation does not necessarily represent the most desirable treatment outcome. The practical significance of a particular heating condition depends on the intended degree of lightening and desaturation, retention of the characteristic pink-to-red color component, and preservation of the physical and structural integrity of the material. Within the present step-heating series, 400 °C produced an intermediate outcome characterized by measurable lightening and desaturation while retaining more of the original pink-to-red chromatic component than after treatment at 500 °C. Across the polarized measurements of POT01–POT03 and RT01–RT03, the mean a* and C* values at 400 °C were approximately 11.9 and 12.3, respectively. Further heating to 500 °C produced substantially greater lightening and desaturation, with the corresponding mean a* and C* values decreasing to approximately 0.2 and 2.8, respectively, indicating extensive loss of the original red/pink chromatic character.
The distinction was particularly evident for RT01–RT03. At 400 °C, these red specimens exhibited an overall increase in lightness accompanied by reduced chroma while retaining a substantial positive a* component. At 500 °C, substantially greater lightening was accompanied by a reduction in the mean a* and C* values to approximately 0.5 and 1.9, respectively, producing a weakly chromatic appearance. Thus, within the present step-heating series, the 400 °C stage retained more of the red-to-pink chromatic character than the 500 °C stage, whereas treatment at 500 °C produced substantially greater desaturation. No evidence of micro-fracturing or measurable deterioration of the evaluated gemological properties was observed under the investigated heating conditions, and the preservation of the principal FTIR framework-related vibrations provided no evidence for major structural disruption up to 500 °C.
These results have practical implications for treatment selection but should not be interpreted as demonstrating a direct increase in monetary value. Gemstone value depends on multiple factors, including hue, tone, saturation, clarity, size, overall appearance, treatment disclosure, and market preference, which were not evaluated quantitatively in the present study. Accordingly, the observed color responses at 400 and 500 °C should be regarded as outcomes specific to the investigated specimens and heating protocols rather than universally applicable treatment conditions.

4.6. Limitations and Future Perspectives

The present study establishes clear associations between heat treatment, changes in polarized visible absorption, and the resulting color modification of the investigated tourmalines; however, the microscopic processes responsible for these changes cannot be uniquely determined from the available data. In particular, the oxidation states and crystallographic site occupancies of Mn, Fe, Ti, and other potentially chromophoric ions were not directly determined. Consequently, the possible contributions of changes in oxidation state, cation distribution, charge-transfer interactions, and local crystal-field environments discussed in this study should be regarded as literature-supported interpretations rather than direct determinations of the underlying crystal-chemical processes.
In addition, crystallinity and structural order were not directly quantified. Although the preservation of the principal framework-related FTIR bands provides no evidence for major disruption of the tourmaline framework up to 500 °C, subtle changes in lattice order, local coordination geometry, or defect environments cannot be excluded. Future investigations combining oxidation-state-sensitive techniques such as X-ray absorption near-edge structure (XANES), Mössbauer spectroscopy, and electron paramagnetic resonance (EPR) with structural characterization and spatially resolved compositional mapping could provide further insight into the electronic and local structural changes accompanying heat-induced color modification. Experiments conducted under controlled heating atmospheres would additionally help distinguish the influence of thermal conditions on these processes.

5. Conclusions

This study demonstrates that moderate-temperature heating can systematically modify the color and polarized optical absorption of pinkish-orange and red tourmalines while preserving their principal framework-related vibrational features. Progressive heating produced reduced visible absorption, increased lightness, and decreased color saturation, with strong pleochroism retained throughout the investigated treatments. Within the present step-heating series, 400 °C produced an intermediate outcome characterized by measurable lightening and desaturation while retaining more of the original pink-to-red chromatic component than after treatment at 500 °C, which resulted in substantially greater desaturation and loss of chromatic intensity. Both step-heating and direct-heating pathways produced strongly desaturated states after treatment at 500 °C; however, because the two groups comprised different and compositionally heterogeneous specimens, the relative influences of final temperature and heating pathway cannot be independently resolved from the present dataset. The colorimetric results represent individual sample trajectories rather than statistically replicated measurements; therefore, reproducibility and intracrystalline color heterogeneity were not quantitatively assessed. The preservation of the principal FTIR framework-related bands provides no evidence for major disruption of the tourmaline framework up to 500 °C, although subtle changes in structural order cannot be excluded because crystallinity was not directly quantified. Overall, the results establish a clear association between heat treatment, modification of visible electronic absorption, and color evolution; however, the underlying microscopic mechanism cannot be uniquely assigned to particular transition-metal ions, oxidation-state changes, crystallographic site redistribution, or structural-order effects from the present data.

Supplementary Materials

The following supporting information can be downloaded at https://www.mdpi.com/article/10.3390/cryst16090577/s1. Table S1: LA-ICP-MS trace-element concentrations (ppm) of investigated tourmaline samples; Table S2: Individual EDXRF elemental measurements obtained from five analyzed regions of each investigated tourmaline specimen; Table S3: CIELAB colorimetric parameters of all investigated tourmaline specimens under different heating conditions and polarization orientations; Figure S1: Raw UV–Vis–NIR spectra; Figure S2: Raw FTIR spectra.

Author Contributions

Conceptualization, A.P. and N.B.; methodology, A.P. and N.B.; software, A.P.; validation, A.P.; formal analysis, A.P.; investigation, A.P.; resources, A.P.; data curation, A.P.; writing—original draft preparation, A.P.; writing—review and editing, A.P.; visualization, A.P.; supervision, N.B. and A.P.; project administration, N.B. and A.P.; funding acquisition, N.B. All authors have read and agreed to the published version of the manuscript.

Funding

This work was financially supported by (i) Burapha University (BUU), (ii) Thailand Science Research and Innovation (TSRI), and (iii) National Science Research and Innovation Fund (NSRF) (Fundamental Fund: Grant no. 2.73/2568).

Data Availability Statement

The original contributions presented in this study are included in the article and Supplementary Materials. Further inquiries can be directed at the corresponding authors.

Acknowledgments

During the preparation of this manuscript, the authors used ChatGPT (GPT-5.6 Sol, OpenAI) and Gemini (Gemini 3.1 Pro, Google) to improve clarity, readability, and language flow. All scientific content, interpretation of results, data analysis, and conclusions were developed solely by the authors. The authors have reviewed and edited the AI-generated output and take full responsibility for the content of this publication.

Conflicts of Interest

The authors declare no conflicts of interest.

Abbreviations

The following abbreviations are used in this manuscript:
UV–Vis–NIRUltraviolet–Visible–Near Infrared spectroscopy
FTIRFourier-Transform Infrared spectroscopy
EDXRFEnergy Dispersive X-ray Fluorescence
LA-ICP-MSLaser Ablation Inductively Coupled Plasma Mass Spectrometry

References

  1. Henry, D.J.; Novák, M.; Hawthorne, F.C.; Ertl, A.; Dutrow, B.L.; Uher, P.; Pezzotta, F. Nomenclature of the tourmaline-supergroup minerals. Am. Mineral. 2011, 96, 895–913. [Google Scholar] [CrossRef] [Scilit]
  2. Bosi, F.; Lucchesi, S. Crystal chemical relationships in the tourmaline group: Structural constraints on chemical variability. Am. Mineral. 2007, 92, 29–33. [Google Scholar] [CrossRef] [Scilit]
  3. Bosi, F. Tourmaline crystal chemistry. Am. Mineral. 2018, 103, 298–306. [Google Scholar] [CrossRef] [Scilit]
  4. MacDonald, D.J.; Hawthorne, F.C. The crystal chemistry of Si ↔ Al substitution in tourmaline. Can. Mineral. 1995, 33, 849–858. [Google Scholar]
  5. Dirlam, D.M.; Laurs, B.M.; Shigley, J.E.; Simmons, W.B.; Falster, A.U. Liddicoatite Tourmaline from Anjanabonoina, Madagascar. Gems Gemol. 2002, 38, 28–53. [Google Scholar] [CrossRef] [Scilit]
  6. Bosi, F.; Celata, B.; Skogby, H.; Hålenius, U.; Tempesta, G.; Ciriotti, M.E.; Marengo, A. Mn-bearing purplish-red tourmaline from the Anjanabonoina pegmatite, Madagascar. Mineral. Mag. 2021, 85, 242–253. [Google Scholar] [CrossRef] [Scilit]
  7. Bomal, F.; Hatert, F.; Philippo, S.; Guennou, M.; Depret, M.; Wang, H.; Lefèvre, P.; Erambert, M. Crystal chemistry and trace-element behaviour in tourmaline from Minas Gerais, Brazil. Eur. J. Mineral. 2025, 37, 709–731. [Google Scholar] [CrossRef] [Scilit]
  8. Bačík, P.; Ozdín, D.; Uher, P.; Chavan, M. Crystal chemistry and evolution of tourmaline in tourmalinite from Zlatá Idka, Slovakia. J. Geosci. 2022, 67, 209–222. [Google Scholar] [CrossRef] [Scilit]
  9. Ertl, A.; Rossman, G.R.; Hughes, J.M.; Prowatke, S.; Ludwig, T. Mn-bearing “oxy-rossmanite” with tetrahedrally coordinated Al and B from Austria: Structure, chemistry, and infrared and optical spectroscopic study. Am. Mineral. 2005, 90, 481–487. [Google Scholar] [CrossRef] [Scilit]
  10. Rossman, G.R.; Fritsch, E.; Shigley, J.E. Origin of color in cuprian elbaite from São José de Batalha, Paraíba, Brazil. Am. Mineral. 1991, 76, 1479–1484. [Google Scholar]
  11. Kurtz, D.A.; Rossman, G.R.; Hunter, B.M. The nature of the Mn(III) color centers in elbaite tourmalines. Inorg. Chem. 2020, 59, 9618–9626. [Google Scholar] [CrossRef] [Scilit] [PubMed]
  12. Fritsch, E.; Rossman, G.R. An update on color in gems. Part 2: Color involving multiple atoms and color center. Gems Gemol. 1988, 24, 3–15. [Google Scholar] [CrossRef] [Scilit]
  13. Wilkins, R.W.T.; Farrell, E.F.; Naiman, C.S. The crystal field spectra and dichroism of tourmaline. J. Phys. Chem. Solids 1969, 30, 43–56. [Google Scholar] [CrossRef] [Scilit]
  14. Taran, M.N.; Rossman, G.R. High-temperature, high-pressure optical spectroscopic study of ferric-iron-bearing tourmaline. Am. Mineral. 2002, 87, 1148–1153. [Google Scholar] [CrossRef] [Scilit]
  15. Li, K.; Yue, S. Mechanisms of Thermal color change in brown Elbaite–Fluorelbaite tourmaline: Insights from trace elements and spectral signatures. Minerals 2025, 15, 1032. [Google Scholar] [CrossRef] [Scilit]
  16. Castañeda, C.; Eeckhout, S.G.; Costa GMd Botelho, N.F.; Grave, E.D. Effect of heat treatment on tourmaline from Brazil. Phys. Chem. Miner. 2006, 33, 207–216. [Google Scholar] [CrossRef] [Scilit]
  17. Maneewong, A.; Seong, B.S.; Shin, E.J.; Kim, J.S.; Kajornrith, V. Color Change of Tourmaline by Heat Treatment and Electron Beam Irradiation: UV-Visible, EPR, and Mid-IR Spectroscopic Analyses. J. Korean Phys. Soc. 2016, 68, 83–92. [Google Scholar] [CrossRef] [Scilit]
  18. Ahn, Y.; Seo, J.; Park, J. Electronic and vibrational spectra of tourmaline—The impact of electron beam irradiation and heat treatment. Vib. Spectrosc. 2013, 65, 165–175. [Google Scholar] [CrossRef] [Scilit]
  19. Li, M.; Tang, Y.; Li, K. Spectroscopic analysis of varieties and colo genesis in emerald-green tourmaline crystal. Crystal 2026, 16, 404. [Google Scholar] [CrossRef] [Scilit]
  20. Li, M. Spectroscopic characteristics and color origin of red tourmaline from Brazil. J. Spectrosc. 2022, 1, 1769710. [Google Scholar]
  21. Filip, J.; Bosi, F.; Novák, M.; Skogby, H.; Tuček Čuda, J.; Wildner, M. Iron redox reaction in the tourmaline structure: High temperature treatment of Fe3+-rich schorl. Geochim. Cosmochim. Acta 2012, 86, 239–256. [Google Scholar] [CrossRef] [Scilit]
  22. Ballirano, P.; Celata, B.; Bosi, F.; Andreozzi, G.B. Thermal behavior of schorl up to breakdown temperature at room pressure. Period. Mineral. 2023, 92, 23–32. [Google Scholar]
  23. Castañeda, C.; Oliveira, E.F.; Gomes, N.; Soares, A.P.C. Infrared study of OH sites in tourmaline from the elbaite-schorl series. Am. Mineral. 2000, 85, 1503–1507. [Google Scholar] [CrossRef] [Scilit]
  24. Fuchs, Y.; Fourdrin, C.; Balan, E. Theoretical OH stretching vibrations in dravite. Eur. J. Mineral. 2022, 34, 239–251. [Google Scholar] [CrossRef] [Scilit]
  25. Thongnopkun, P.; Naowabut, P. Effect of Heat Treatment on Madagascar Dravite Tourmaline: UV-Visible and Diffuse Reflectance Infrared Spectroscopic Characterization. J. Appl. Spectrosc. 2018, 85, 616–623. [Google Scholar] [CrossRef] [Scilit]
  26. Robert, J.L.; Fuchs, Y.; Gourdant, J.P. Characterization of tourmalines by FTIR absorption spectrometry. Phys. Chem. Miner. 1996, 23, 309. [Google Scholar] [CrossRef] [Scilit]
  27. Reddy, B.J.; Frost, R.T.; Martens, W.N.; Wain, D.L.; Kloprogge, T. Spectroscopic characterization of Mn-rich tourmalines. Vib. Spectrosc. 2007, 44, 42–49. [Google Scholar] [CrossRef] [Scilit]
  28. Prasad, P.S.R. Study of structural disorder in natural tourmaline by infrared spectroscopy. Gondwana Rev. 2005, 8, 265–270. [Google Scholar] [CrossRef] [Scilit]
  29. Bačík, P.; Ozdín, D.; Miglierini, M.; Kardošová, P.; Pentrák, M.; Haloda, J. Crystallochemical effects of heat treatment on Fe-dominant tourmalines from Dolní Bory (Czech Republic) and Vlachovo (Slovakia). Phys. Chem. Miner. 2011, 38, 599–611. [Google Scholar] [CrossRef] [Scilit]
  30. Zhou, Q.; Zhan, F.; Yu, H.; Lu, Z.; Wan, X. Gemological, spectroscopic, and origin description studies of tourmaline from Yunan, China. Molecules 2025, 30, 3680. [Google Scholar] [CrossRef] [Scilit] [PubMed]
  31. Meng, J.; Liang, J.; Liu, J.; Ding, Y.; Gan, K. Effect of heat treatment on the far-infrared emission spectra and fine structures of black tourmaline. J. Nanosci. Nanotechnol. 2014, 14, 3607–3611. [Google Scholar] [CrossRef] [Scilit] [PubMed]
  32. Altieri, A.; Luppi, R.; Skogby, H.; Hålenius, U.; Tempesta, G.; Pezzotta, F.; Bosi, F. Thermal treatment of the tourmaline Fe-rich princivalleite Na(Mn2Al)Al6(Si6O18)(BO3)3(OH)3O. Phys. Chem. Miner. 2023, 50, 27. [Google Scholar] [CrossRef] [Scilit]
  33. Jochum, K.P.; Weis, U.; Stoll, B.; Kuzmin, D.; Yang, Q.; Raczek, I.; Jacob, D.E.; Stracke, A.; Birbaum, K.; Frick, D.A.; et al. Determination of Reference Values for NIST SRM 610–617 Glasses Following ISO Guidelines. Geostand. Geoanalytical Res. 2011, 35, 397–429. [Google Scholar] [CrossRef] [Scilit]
  34. Commission Internationale de l’Éclairage (CIE). Colorimetry, 4th ed.; CIE 015:2018; CIE Central Bureau: Vienna, Austria, 2018. [Google Scholar]
  35. Mattson, S.M.; Rossman, G.R. Ferric iron in tourmaline. Phys. Chem. Miner. 1984, 11, 225–234. [Google Scholar] [CrossRef] [Scilit]
  36. Vigier, M.; Evans, H.; Rossman, G.R.; Jobic, S.; Fritsch, E. Fe-Ti vs. Fe-Fe charge transfers: A comprehensive review and its application in minerals and glasses. Am. Mineral. 2026, 111, 567–582. [Google Scholar] [CrossRef] [Scilit]
  37. Rossman, G.R.; Mattson, S.M. Yellow, Mn-rich elbaite with Mn-Ti intervalence charge transfer. Am. Mineral. 1986, 71, 599–602. [Google Scholar]
  38. Andreozzi, G.B.; Bosi, F.; Lango, M. Linking Mössbauer and structural parameters in elbaite-schorl-dravite tourmalines. Am. Mineral. 2008, 93, 658–666. [Google Scholar] [CrossRef] [Scilit]
  39. He, D.; Liu, S. Effect of heat treatment on structure, surface composition, infrared emission and surface electrical properties of tourmaline. Mod. Phys. Lett. B 2017, 31, 1750026. [Google Scholar] [CrossRef] [Scilit]
  40. Kuehn, K. Producing and Detecting Polarization. In A Student’s Guide Through the Great Physics Texts, 1st ed.; Undergraduate Lecture Notes in Physics; Springer: Cham, Switzerland, 2016; pp. 257–267. [Google Scholar]
  41. Fernández, M. Infrared and electron microprobe analysis of tourmalines. Phys. Chem. Miner. 1988, 15, 452–460. [Google Scholar] [CrossRef] [Scilit]
  42. Hawthorne, F.C.; Henry, D.J. Classification of minerals of the tourmaline group. Eur. J. Mineral. 1999, 11, 201–215. [Google Scholar] [CrossRef] [Scilit]
  43. Tijing, L.D.; Amarjargal, A.; Jiang, Z.; Ruelo, M.T.G.; Park, C.H.; Pant, H.R.; Kim, D.W.; Lee, D.W.; Kim, C.S. Antibacterial tourmaline nanoparticles/polyurethane hybrid mat decorated with silver nanoparticles prepared by electrospinning and UV photoreduction. Curr. Appl. Phys. 2013, 13, 205–210. [Google Scholar] [CrossRef] [Scilit]
  44. Wesełucha-Birczyńska, A.; Natkaniec-Nowak, L. A Raman microspectroscopic study of organic inclusions in “watermelon” tourmaline from the Paprok mine (Nuristan, Afghanistan). Vib. Spectrosc. 2011, 57, 248–253. [Google Scholar] [CrossRef] [Scilit]
  45. Pieczka, A.; Gołębiowska, B.; Stachowicz, M.; Nejbert, K.; Kotowski, J.; Jeleń, P.; Ertl, A. Estimation of Li and OH contents in (Li,Al)-bearing tourmalines from Raman spectra. Miner. Petrol. 2022, 116, 229–249. [Google Scholar] [CrossRef] [Scilit]
Figure 1. Photographs of pinkish-orange (POT) and red (RT) tourmalines of reported Mozambique origin before heating and after successive heat-treatment temperatures (300, 400, and 500 °C), showing the corresponding visual color changes.
Crystals 16 00577 g001
Figure 2. Representative internal features observed in the investigated tourmalines under darkfield illumination: (a) elongated growth tubes and channel-like features; and (b) abundant elongated internal features and associated fractures. The features were documented based on their microscopic appearance and were not subjected to further instrumental characterization.
Crystals 16 00577 g002
Figure 3. CIELAB color evolution of representative pinkish-orange tourmaline specimen POT01 during step-heating at 300, 400, and 500 °C: (a) a–b chromaticity diagram; (b) lightness (L*); and (c) chroma (C*) and total color difference (ΔE*).
Crystals 16 00577 g003
Figure 4. CIELAB color evolution of representative red tourmaline specimen RT01 during step-heating at 300, 400, and 500 °C: (a) a–b chromaticity diagram; (b) lightness (L*); and (c) chroma (C*) and total color difference (ΔE*).
Crystals 16 00577 g004
Figure 5. CIELAB color evolution of direct-heated pinkish-orange tourmaline specimens POT04 and POT05 after treatment at 500 °C: (a) a–b chromaticity diagram; (b) lightness (L*); and (c) chroma (C*) and total color difference (ΔE*).
Crystals 16 00577 g005
Figure 6. CIELAB color evolution of direct-heated red tourmaline specimens RT04 and RT05 after treatment at 500 °C: (a) a–b chromaticity diagram; (b) lightness (L*); and (c) chroma (C*) and total color difference (ΔE*).
Crystals 16 00577 g006
Figure 7. Polarized UV-Vis-NIR absorbance spectra of step-heated tourmaline samples measured along the o-ray and e-ray directions: (a) POT o-ray; (b) POT e-ray; (c) RT o-ray; and (d) RT e-ray. Progressive weakening of the visible absorption band centered near 520 nm was observed with increasing treatment temperature while pleochroism was preserved.
Crystals 16 00577 g007
Figure 8. Polarized UV–Vis–NIR absorbance spectra of direct heat-treated tourmaline samples measured along the o-ray and e-ray directions: (a) POT04–POT05 (o-ray); (b) POT04–POT05 (e-ray); (c) RT04–RT05 (o-ray); and (d) RT04–RT05 (e-ray). Direct heating at 500 °C produced a marked reduction in the broad visible absorption band centered near 520 nm in both polarization directions. These spectral changes correspond to the observed changes in chroma and lightness determined by CIELAB colorimetric analysis. Spectra were vertically offset for clarity.
Crystals 16 00577 g008
Figure 9. Attenuated total reflectance Fourier transform infrared (ATR-FTIR) and diffuse reflectance infrared Fourier transform (DRIFT) spectra of step-heated tourmaline samples measured before heating and after heating at 300, 400, and 500 °C: (a) ATR-FTIR spectra of POT01; (b) ATR-FTIR spectra of RT01; (c) DRIFT spectra of POT01; and (d) DRIFT spectra of RT01.
Crystals 16 00577 g009
Figure 10. Attenuated total reflectance Fourier transform infrared (ATR-FTIR) and diffuse reflectance infrared Fourier transform (DRIFT) spectra of direct-heated tourmaline samples measured before heating and after heating at 500 °C: (a) ATR-FTIR spectra of POT04 and RT04; and (b) DRIFT spectra of POT04 and RT04. Insets show the enlarged 2700–3200 cm−1 region. Spectra were vertically offset for clarity.
Crystals 16 00577 g010
Table 1. EDXRF-derived elemental concentrations of the investigated tourmaline samples prior to heat treatment, calculated from the oxide-equivalent quantitative results obtained using the Fundamental Parameters (FP) method. Values are reported as mean ± standard deviation (n = 5).
Element
(wt.%)
Step-Heated
POT01POT02POT03RT01RT02RT03
Al19.62 ± 5.8924.86 ± 1.6825.45 ± 0.2922.82 ± 4.9322.36 ± 12.0126.62 ± 1.47
Si20.29 ± 2.9721.46 ± 0.7520.53 ± 0.3917.86 ± 3.7016.86 ± 7.8619.60 ± 1.14
K6.00 ± 12.830.00 ± 0.000.00 ± 0.000.00 ± 0.000.00 ± 0.000.00 ± 0.00
Ca7.36 ± 3.533.45 ± 0.845.00 ± 1.009.61 ± 11.2211.78 ± 25.362.73 ± 3.34
Ti0.30 ± 0.360.12 ± 0.110.04 ± 0.020.53 ± 0.871.38 ± 3.040.09 ± 0.12
Mn0.27 ± 0.230.33 ± 0.240.17 ± 0.022.83 ± 0.271.82 ± 0.962.42 ± 0.32
Fe0.35 ± 0.340.87 ± 0.990.25 ± 0.090.20 ± 0.180.17 ± 0.110.17 ± 0.03
Cu0.17 ± 0.140.12 ± 0.050.09 ± 0.000.12 ± 0.030.10 ± 0.020.15 ± 0.03
Zn0.08 ± 0.040.03 ± 0.020.03 ± 0.010.03 ± 0.020.06 ± 0.020.05 ± 0.01
Ga0.25 ± 0.200.18 ± 0.080.15 ± 0.030.17 ± 0.030.14 ± 0.020.14 ± 0.02
Element
(wt.%)
Direct-heated
POT04POT05 RT04RT05
Al22.69 ± 5.5625.59 ± 0.28 27.57 ± 1.5427.63 ± 0.78
Si18.05 ± 4.7620.63 ± 0.38 20.50 ± 1.3621.98 ± 0.62
K0.00 ± 0.000.00 ± 0.00 0.00 ± 0.000.00 ± 0.00
Ca11.70 ± 13.034.73 ± 0.36 2.45 ± 3.780.15 ± 0.09
Ti0.70 ± 1.300.04 ± 0.01 0.11 ± 0.170.02 ± 0.02
Mn0.19 ± 0.040.17 ± 0.03 0.07 ± 0.010.12 ± 0.02
Fe0.24 ± 0.100.17 ± 0.05 0.02 ± 0.020.02 ± 0.02
Cu0.13 ± 0.030.13 ± 0.00 0.13 ± 0.040.14 ± 0.02
Zn0.02 ± 0.030.01 ± 0.00 0.02 ± 0.010.01 ± 0.00
Ga0.16 ± 0.020.17 ± 0.01 0.11 ± 0.020.13 ± 0.03
Note: Values are reported as mean ± standard deviation (n = 5) of elemental concentrations (wt.%) calculated from the oxide-equivalent quantitative results obtained using the manufacturer’s Fundamental Parameters (FP) method. Because EDXRF does not quantify light elements such as B, Li, H, or F, the reported values should not be interpreted as complete mineral compositions or used alone for crystal-chemical classification.
Table 2. CIELAB color parameters (L*, a*, and b*), chroma (C*), and total color difference (ΔE*) of the investigated specimens after step-heating and direct-heating treatments.
Sample ID and RayTreatment StageL*a*b*C*ΔE*
(Cumulative)
SET 1: Step-Heating
POT01 (o-ray)Unheated72.614.411.918.70.0
300 °C84.36.210.011.714.5
400 °C85.36.47.09.515.8
500 °C91.9−0.61.71.826.5
POT01 (e-ray)Unheated76.19.610.414.10.0
300 °C75.516.215.922.68.6
400 °C78.714.79.617.65.8
500 °C91.7−0.73.53.619.9
RT01 (o-ray)Unheated50.932.0−7.332.80.0
300 °C50.830.8−5.631.42.1
400 °C57.123.8−3.024.011.2
500 °C76.21.31.62.040.8
RT01 (e-ray)Unheated60.317.92.018.00.0
300 °C58.817.73.318.02.0
400 °C63.012.73.313.16.0
500 °C75.70.61.71.823.2
SET 2: Direct-Heating
POT04 (o-ray)Unheated79.710.97.513.30.0
500 °C92.5−0.32.12.217.9
POT04 (e-ray)Unheated75.016.27.918.10.0
500 °C93.1−0.34.44.424.8
RT04 (o-ray)Unheated65.025.1−2.725.20.0
500 °C64.314.31.214.411.5
RT04 (e-ray)Unheated75.313.43.213.80.0
500 °C68.211.13.811.87.4
Note: Total color difference (ΔE*) was calculated using the CIELAB 1976 formula. All ΔE* values for the heated specimens were calculated relative to the corresponding unheated specimens.
Disclaimer/Publisher’s Note: The statements, opinions and data contained in all publications are solely those of the individual author(s) and contributor(s) and not of MDPI and/or the editor(s). MDPI and/or the editor(s) disclaim responsibility for any injury to people or property resulting from any ideas, methods, instructions or products referred to in the content.