1. Introduction
Silicon carbide (SiC), a representative third-generation wide-bandgap semiconductor, exhibits indispensable advantages in high-temperature, high-frequency, and high-power electronic devices owing to its high thermal conductivity, high critical breakdown field, high saturation electron drift velocity, and high chemical stability [
1,
2,
3,
4]. Consequently, SiC has been widely applied in key technological areas such as new energy vehicles, smart power grids, and aerospace engineering [
5,
6,
7].
Chemical vapor deposition (CVD) is the primary method for preparing high-quality, low-defect-density SiC thin films [
8,
9,
10,
11,
12]. Through the decomposition and reaction of gaseous precursors on the substrate surface, CVD enables the controlled growth of materials at the atomic scale. Recent advances in computational approaches have also enabled atomic-scale insights into SiC growth mechanisms. For instance, molecular dynamics simulations have been employed to investigate the vapor deposition growth of SiC crystals on 4H-SiC substrates, revealing the influence of different crystal orientations and temperatures on the crystalline quality [
13]. However, the trade-off between the deposition rate and uniformity remains a core challenge in CVD technology. Although increasing the deposition temperature and precursor concentration within a certain process window effectively enhances the deposition rate, it also exacerbates the non-uniformity of the temperature and velocity fields inside the reactor, degrading film deposition uniformity. This trade-off originates from the highly coupled, complex transport and reaction processes within the CVD reactor, involving multiple physical domains (fluid flow, temperature, concentration, and chemical kinetics) [
14,
15,
16,
17,
18].
In a typical high-temperature (>1500 °C) SiC-CVD environment, a large temperature gradient (often exceeding 1000 K) exists between the hot substrate and the cooler reactor inlet and walls. This large gradient not only induces natural convection but also gives rise to a non-negligible Soret effect, often referred to as the thermal diffusion effect [
19,
20]. This effect refers to the phenomenon in which distinct molecules migrate at different velocities under the influence of a temperature gradient, with heavier molecules moving toward the colder regions, thereby establishing a concentration gradient [
21]. Consequently, the precursors required for the reaction may be “driven away” from the hot substrate region by the temperature gradient, or intermediate products may become enriched in localized zones, altering the reactant concentration at the substrate surface and affecting both the deposition rate and the film uniformity. Li et al. [
22] numerically investigated the Soret effect in graphene CVD and found that whether the effect promotes or hinders methane diffusion depends on the relative molecular weights of the species with respect to the average molecular weight of the gas mixture. Furthermore, the Soret effect significantly altered the distribution of the deposition rate along the gas flow direction.
The deposition rate and uniformity of SiC thin films are generally influenced by the gas flow velocity, operating pressure, substrate rotation speed, and deposition temperature. Seo [
23] designed and optimized a funnel-type nozzle structure that effectively controls the gas flow velocity within the reactor and significantly increases the deposition rate. Shinde et al. [
24] combined computational fluid dynamics (CFD) with the response surface methodology to optimize the process parameters and achieved favorable optimization results. Deivendran et al. [
14] performed three-dimensional modeling and optimization of a vertical hot-wall CVD reactor, revealing the effect of natural convection on thin-film deposition inside the reactor through dimensionless analysis. Zheng et al. [
25] employed a combined CFD-DOE approach to optimize the SiC-CVD process parameters and achieved a deposition rate as high as 24.8 μm/h. However, these prior studies focused heavily on the macroscopic impacts of process parameters on final deposition outcomes, bypassing the underlying role of the thermal diffusion effect.
Although the importance of the thermal diffusion effect has been recognized, systematic studies that quantitatively isolate this effect from other transport phenomena over a wide range of process parameters are lacking [
26]. How the thermal diffusion effect interacts with the process parameters, as well as how to reconcile the trade-off between the deposition rate and uniformity, remains to be fully explored.
In this study, systematic CFD simulations of the SiC-CVD process incorporating the thermal diffusion effect are performed. A quantitative evaluation framework based on thermal diffusion contribution (TDC) metrics is established to analyze the individual and coupled effects of ΔT, p, ω, and Q on the thermal diffusion effect and determine the optimal parameters that simultaneously maximize the deposition rate and film uniformity. This work provides theoretical insights into the underlying mechanisms governing the thermal diffusion effect and provides a framework for the targeted optimization of SiC-CVD processing.
2. Mathematical Model and Numerical Method
2.1. Mathematical Model
Numerical simulations of the mass transport and chemical reactions within the reactor during the SiC-CVD process are performed based on the following assumptions and boundary conditions: (1) The gas is an ideal, incompressible, and viscous fluid with laminar flow; substance transport and surface reaction kinetics jointly determine the deposition behavior. (2) The reactor walls and the substrate are simplified as isothermal. (3) Deposition occurs only on the substrate surface, and the surface reactions are kinetically controlled. (4) Gravity and radiative heat transfer are accounted for. The governing equations are discretized and solved using the finite volume method.
(1) Continuity equation:
where
is the density of the gas mixture, and
is the velocity vector.
(2) Momentum conservation equation:
where
is the static pressure,
is the gravitational body force,
represents other body forces, and the stress tensor is defined as follows:
where
is the dynamic viscosity of the gas mixture, and
is the unit tensor.
(3) Energy conservation equation:
Considering heat conduction, thermal radiation, chemical reaction heat sources, and enthalpy transport due to species diffusion:
where
is the total enthalpy of the gas mixture,
is the thermal conductivity of the gas mixture,
is the radiative heat flux (calculated using the discrete ordinates model),
is the heat source/sink term due to chemical reactions,
is the specific enthalpy of species
i, and
is the diffusive mass flux of species
i.
(4) Species transport equation (including the thermal diffusion term):
where
is the net rate of production of species
i by gas-phase chemical reactions (kg·m
−3·s
−1).
For the modeling of substance transport in multi-species mixtures, both the mass diffusion coefficient and the thermal diffusion coefficient must be considered. In laminar flow, the process is calculated using Fick’s law:
where the first term represents Fickian diffusion,
is the mass diffusion coefficient of species
i in the mixture, the second term represents thermal diffusion (Soret effect), and
is the thermal diffusion coefficient of species
i.
where
is the mole fraction of species
i, and
is the binary diffusion coefficient, given by the Chapman–Enskog formula:
where
is the molar mass of species
i (g/mol),
is the absolute pressure (Pa);
is the average characteristic Lennard–Jones length (Å), and
is the dimensionless diffusion collision integral for molecular interactions in the system:
where
, and
is the average characteristic Lennard–Jones energy parameter.
The thermal diffusion coefficient
is expressed using an empirical species-dependent expression:
(5) Ideal gas equation of state:
where
is the universal gas constant.
2.2. Chemical Reaction Kinetics Model
For the SiH
4 + C
3H
8 + H
2 (silane–propane–hydrogen) system, this study adopts the model introduced by Meziere et al. [
26], which is a reasonably simplified version of previously published gas-phase and surface chemical reaction mechanisms. This chemical reaction model includes 17 gas-phase reactions and 19 surface reactions that influence SiC deposition/etching, as listed in
Table 1 and
Table 2, respectively.
Although the SiH4 + C3H8 + H2 system has been extensively studied and is well-documented in the literature, we acknowledge that the academic and industrial communities have increasingly shifted towards alternative silicon precursors, such as chlorosilanes (e.g., SiHCl3, SiH2Cl2) and organosilicon compounds (e.g., hexamethyldisilane, HMDS), for SiC deposition. These precursors are often preferred due to their higher growth rates, improved safety, and better film quality at lower temperatures. However, from a fundamental transport phenomena perspective, the molecular weight, diffusivity, and thermal diffusion behavior of the primary silicon-containing species are the key parameters governing the Soret effect. The underlying model validated here captures these essential physical and chemical processes, and the quantitative insights—such as the competition between thermal diffusion and convection—are not specific to the precursor chemistry. Therefore, the conclusions drawn from this study regarding the parametric sensitivity of the Soret effect are expected to be qualitatively, and to a large extent semi-quantitatively, transferable to SiC-CVD processes using other silicon precursors. The silane–propane system serves as an ideal benchmark due to its well-established, reduced chemical mechanism, allowing us to isolate and systematically study the thermal diffusion phenomenon without the additional complexity introduced by chlorine chemistry.
The gas-phase reaction rates follow the Arrhenius law:
where
A is the pre-exponential factor,
is the activation energy, and
is the temperature exponent.
The deposition rate of the SiC thin film (
, μm·h
−1) is calculated by summing the surface deposition fluxes of Si-containing species:
The deposition uniformity (
GU) of the thin film is defined as follows:
The SiC-CVD process is numerically simulated using the species transport module in FLUENT, which accounts for gas-phase reactions, surface reaction kinetics, and heat and mass transfer phenomena. The simulation involves solving the conservation equations for mass, momentum, energy, and species concentrations. Pressure–velocity coupling is handled using the coupled algorithm. The momentum, species, and energy equations are discretized spatially using the second-order upwind scheme, while pressure interpolation is performed using the standard format. Convergence is established when the residuals for all equations drop below 1 × 10⁻⁶.
2.3. Geometric Model
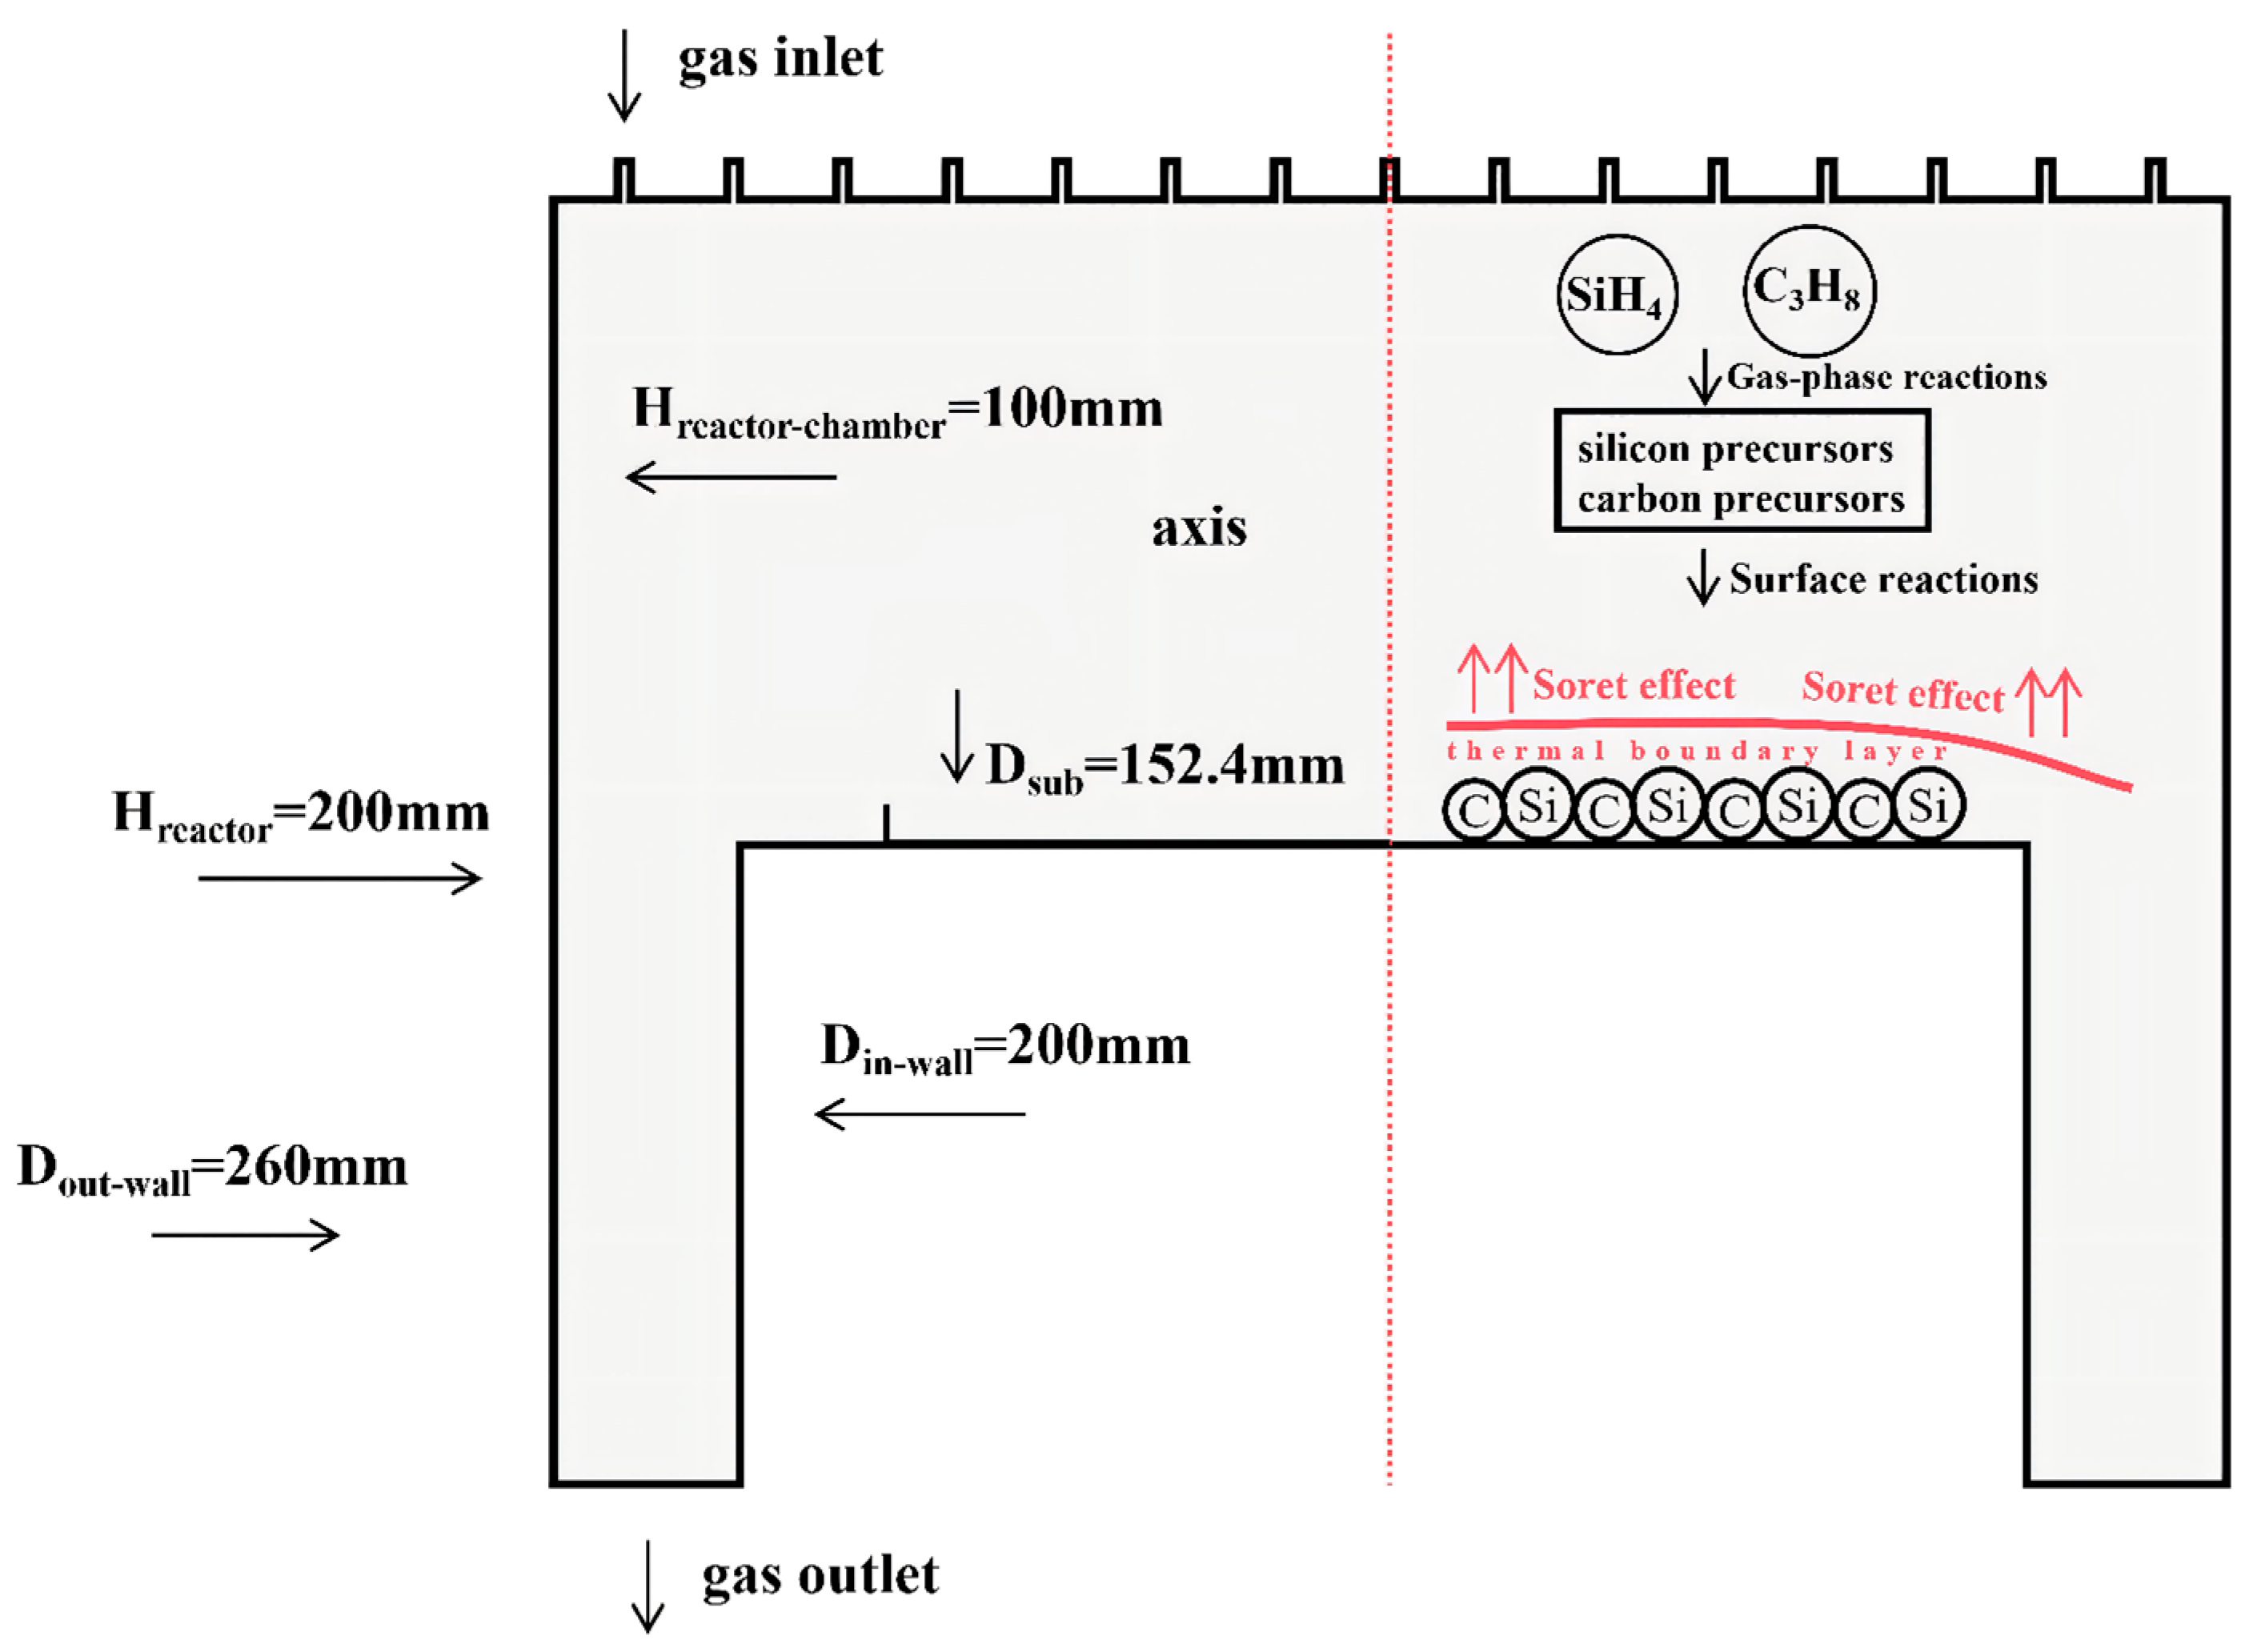
The vertical CVD reactor used in this study (
Figure 1) consists primarily of a cylindrical chamber with a total height of 200 mm, a reaction chamber height of 100 mm, and a reactor diameter of 260 mm. The substrate (6 inches) is placed horizontally on a graphite susceptor. To reduce computational cost by taking advantage of axisymmetry, a two-dimensional axisymmetric model is employed for simplified calculations.
This reactor geometry and wafer size are representative of contemporary SiC epitaxial production systems, where 6-inch and emerging 8-inch wafers are the industry standards for power device fabrication. The axisymmetric nature of the reactor enables efficient 2D modeling while capturing the essential transport phenomena relevant to industrial-scale operation. The optimized process parameters identified in this study are therefore expected to provide practical guidance for process optimization in commercial SiC-CVD reactors of similar configuration.
The reaction gases are uniformly injected from the top and, after reacting over the substrate region, are discharged through the outlet at the bottom. The inlet gas consists of silane (Si source), propane (C source), and hydrogen (carrier gas), with mass flow rates of 120 sccm, 40 sccm, and 70 slm, respectively. Considering that the vertical reactor employs water-cooled walls, all walls are set to an isothermal condition of 300 K. The inlet gas is not preheated and is also maintained at 300 K. The initial substrate temperature is set to 2000 K, which is subsequently varied with ΔT. The outlet pressure is set to the operating pressure. Under such extreme temperature differences, the Grashof (Gr) and Reynolds (Re) numbers are calculated to confirm that the flow remains within the steady laminar regime, thereby validating the assumptions.
In the vertical CVD reactor configuration employed in this study, both precursor gases (SiH4 and C3H8) are uniformly injected vertically downward from the top gas inlet at a 90° angle to the substrate surface. This injection configuration ensures symmetric gas distribution within the reactor chamber and is consistent with the standard design of vertical showerhead-type CVD reactors.
2.4. Evaluation Metrics for the Thermal Diffusion Effect
To quantitatively evaluate the influence of the thermal diffusion effect, the following two evaluation metrics are defined in this paper:
The thermal diffusion contribution to the deposition rate:
where
and
are the average deposition rates across the substrate with and without considering the thermal diffusion effect, respectively. A negative value indicates that the thermal diffusion effect suppresses the deposition rate, and a larger absolute value of this metric indicates stronger suppression.
The thermal diffusion contribution to the deposition uniformity:
where
GUon and
GUoff are the average uniformities across the substrate with and without considering the thermal diffusion effect, respectively. A positive value indicates an increase in film non-uniformity when the thermal diffusion effect is considered, meaning that the thermal diffusion effect degrades deposition uniformity.
3. Results and Discussion
3.1. Influence of the Thermal Diffusion Effect Under the Baseline Scenario
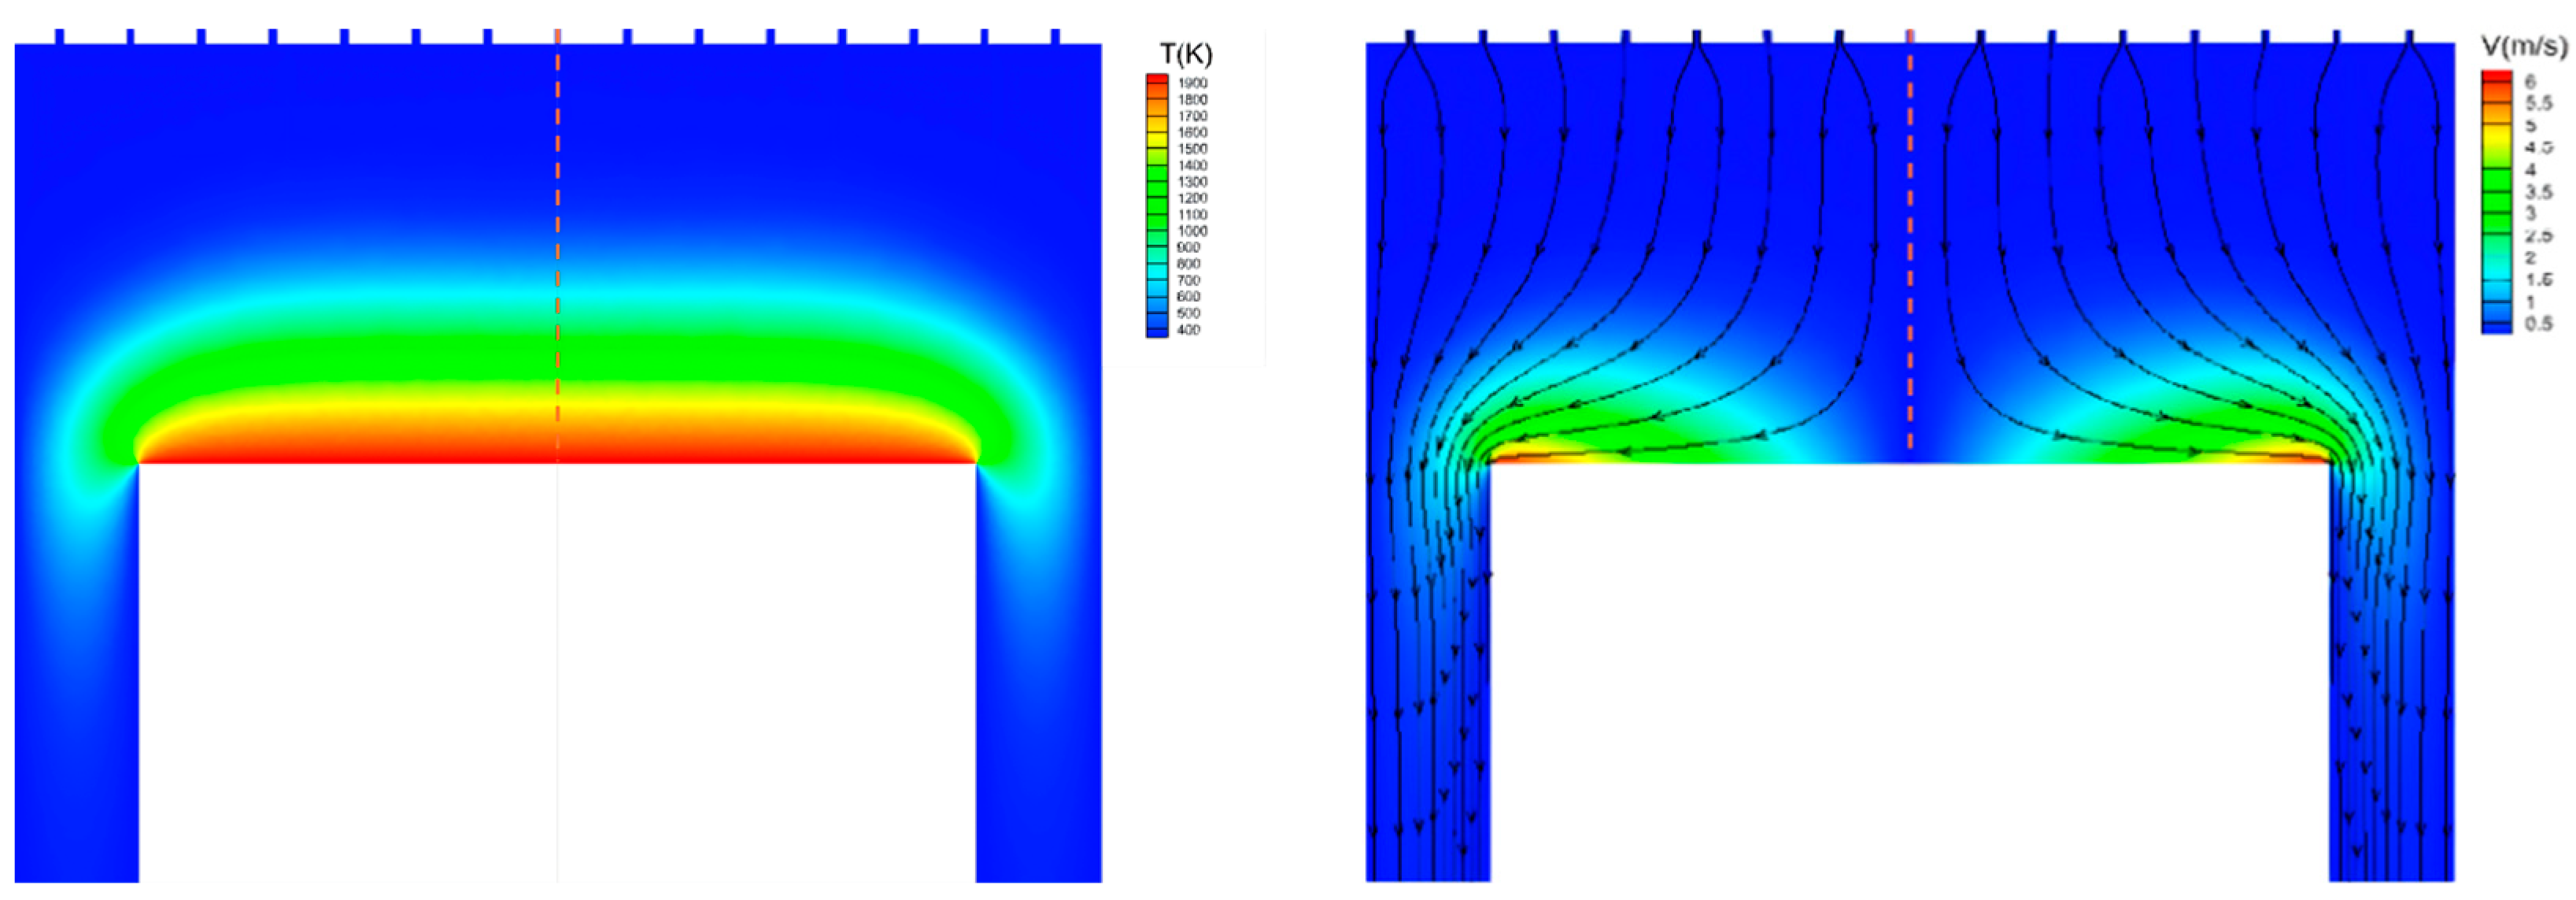
The baseline scenario parameters are set as follows: ΔT = 1700 K, p = 10,000 Pa, ω = 600 rpm, Q = 70 slm. This parameter set was chosen because it corresponds to a well-established baseline scenario adopted in prior SiC-CVD studies. Using this baseline not only allows direct validation of the present model against published data but also provides a consistent reference point against which the individual and combined effects of the process parameters can be systematically isolated and compared. Under this condition, comparative simulations are performed with and without the thermal diffusion term, and
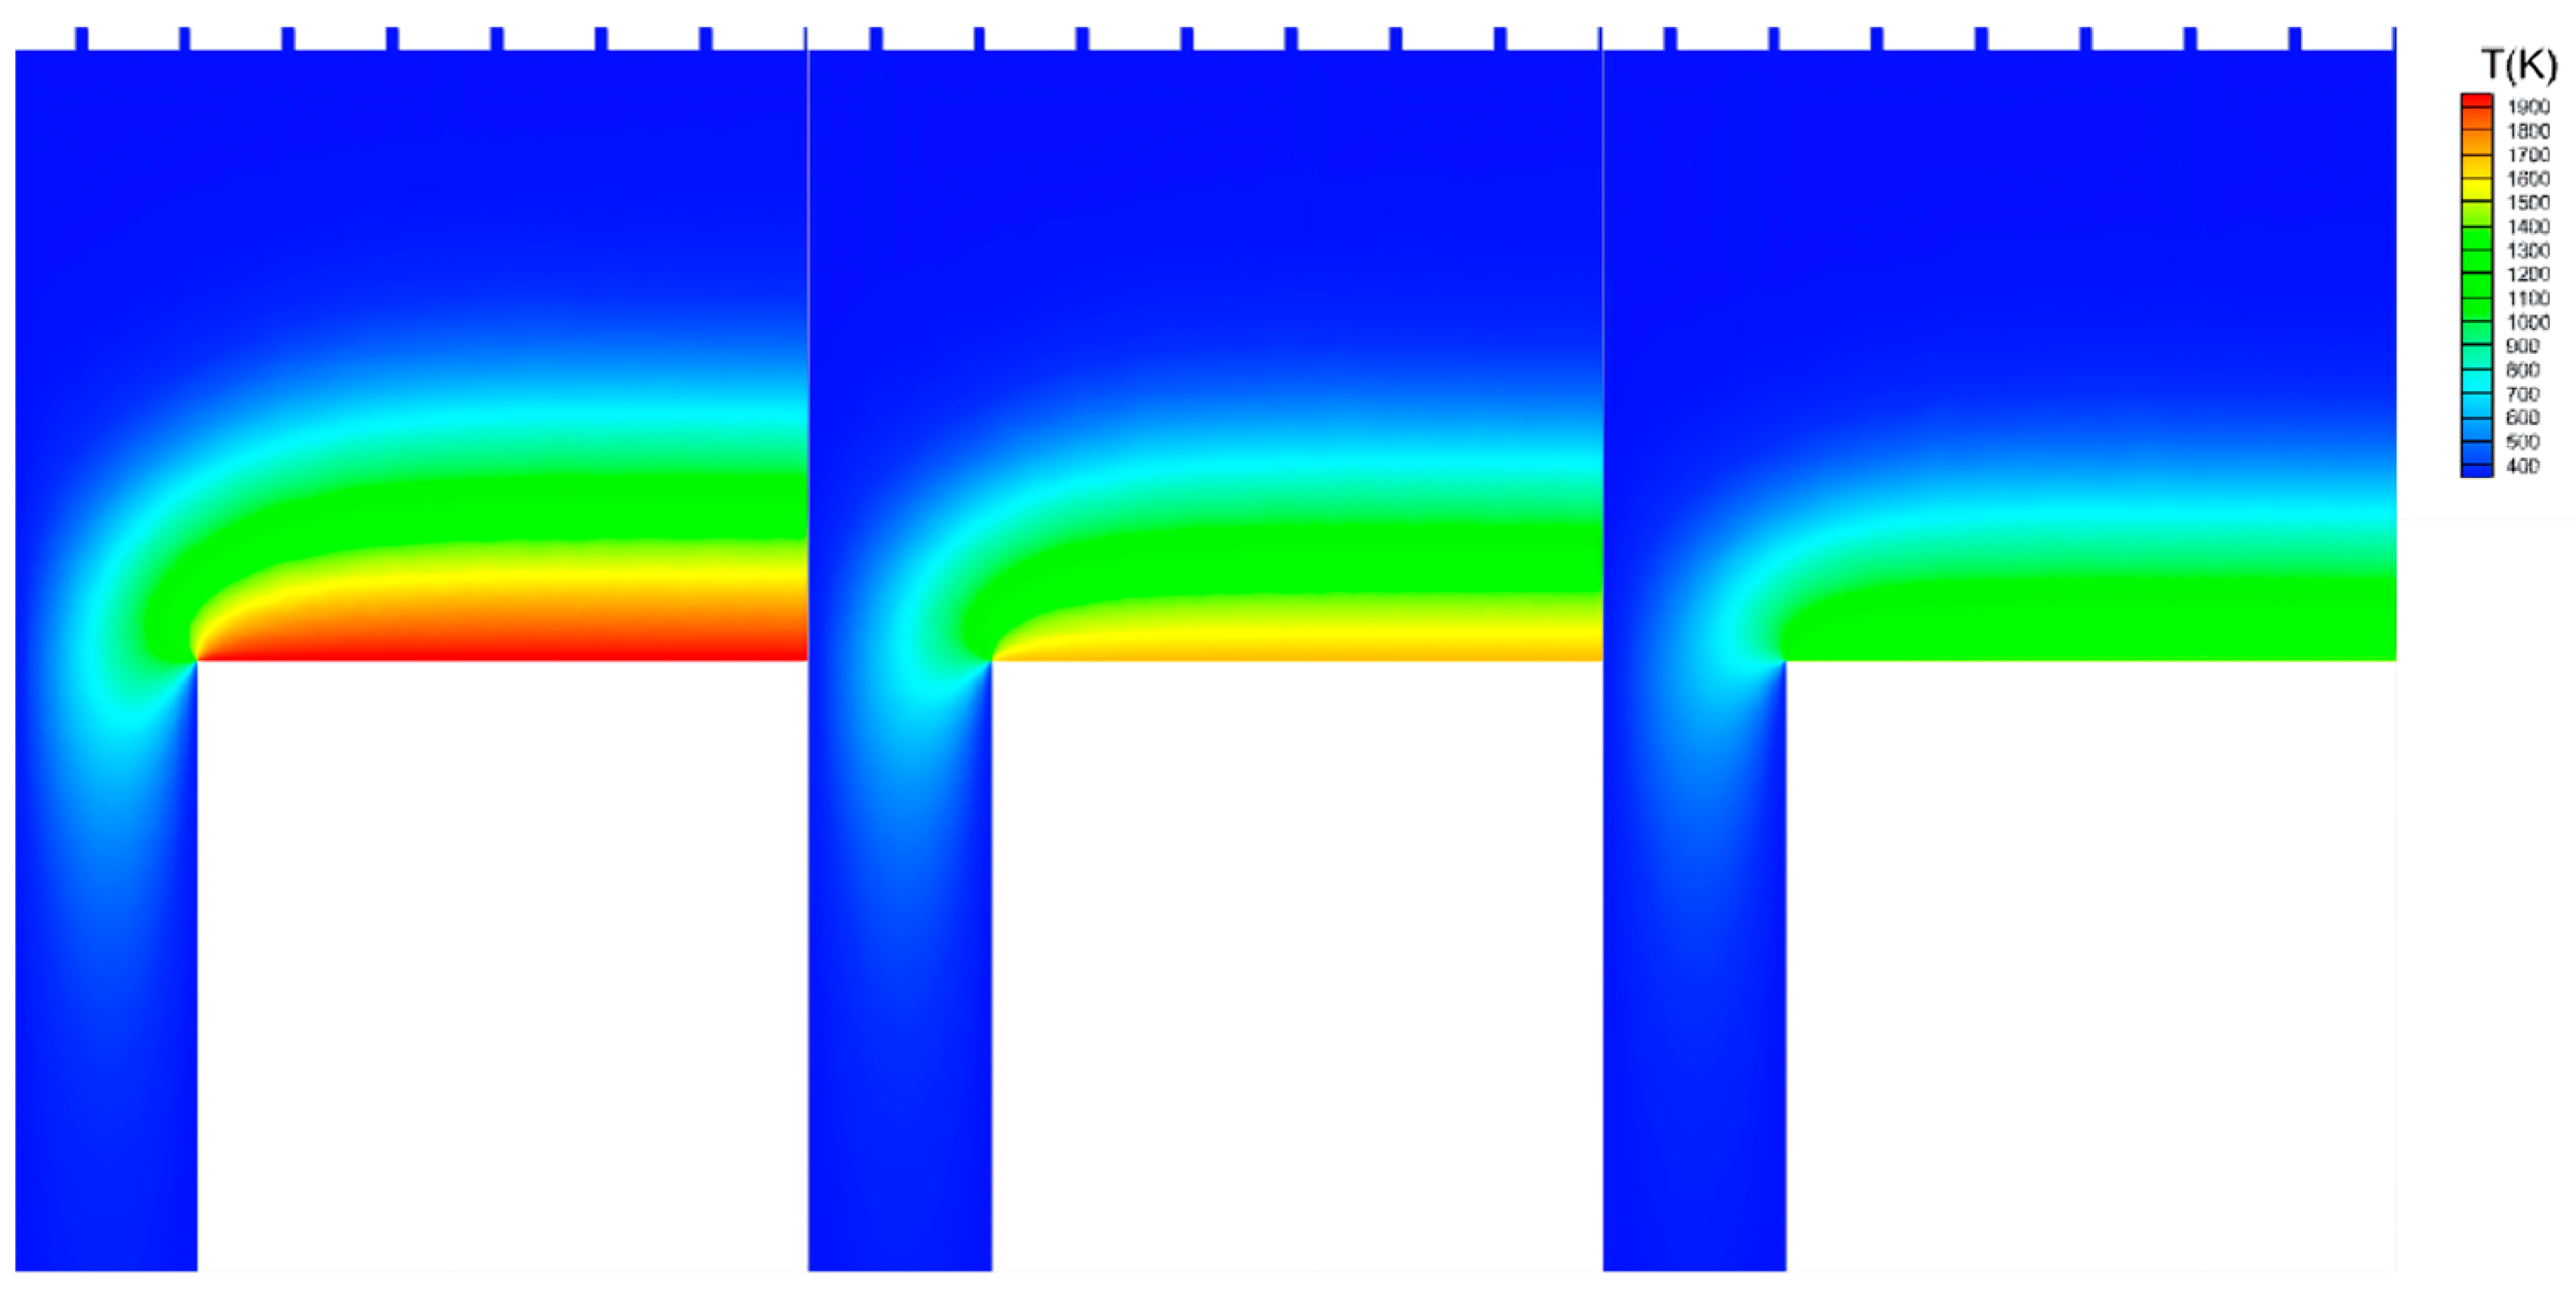
Figure 2 shows the resulting temperature and velocity fields. Notably, incorporating the thermal diffusion effect has no significant influence on the temperature or velocity fields. This is because the driving force of the thermal diffusion effect is the temperature gradient; thus, the influence of the thermal diffusion effect is negligible in the region above the thermal boundary layer. Within the thermal boundary layer near the substrate, the pumping effect combined with the high-speed rotation of the substrate increases the fluid velocity, making convection the dominant mode of mass and energy transfer in this region.
By comparing the molar deposition rates of the carbon and silicon species above the substrate, close agreement is observed (the carbon molar flux is computed to be approximately 1.507776 × 10⁻⁶ mol∙m−2∙s−1, while the silicon molar flux is approximately 3.518144 × 10⁻⁶ mol∙m−2∙s−1), resulting in a C/Si molar ratio very close to unity. This near-stoichiometric ratio matches the expected composition of SiC, confirming that the numerical model correctly captures the deposition of SiC thin films. The predicted deposition rates under baseline conditions (5.63–12.91 μm/h) are also within the typical range reported in the literature for SiC-CVD processes (5–10 μm/h for standard growth conditions, and up to 24.8 μm/h under optimized conditions).
Nevertheless, the thermal diffusion effect profoundly impacts the deposition results, as seen in
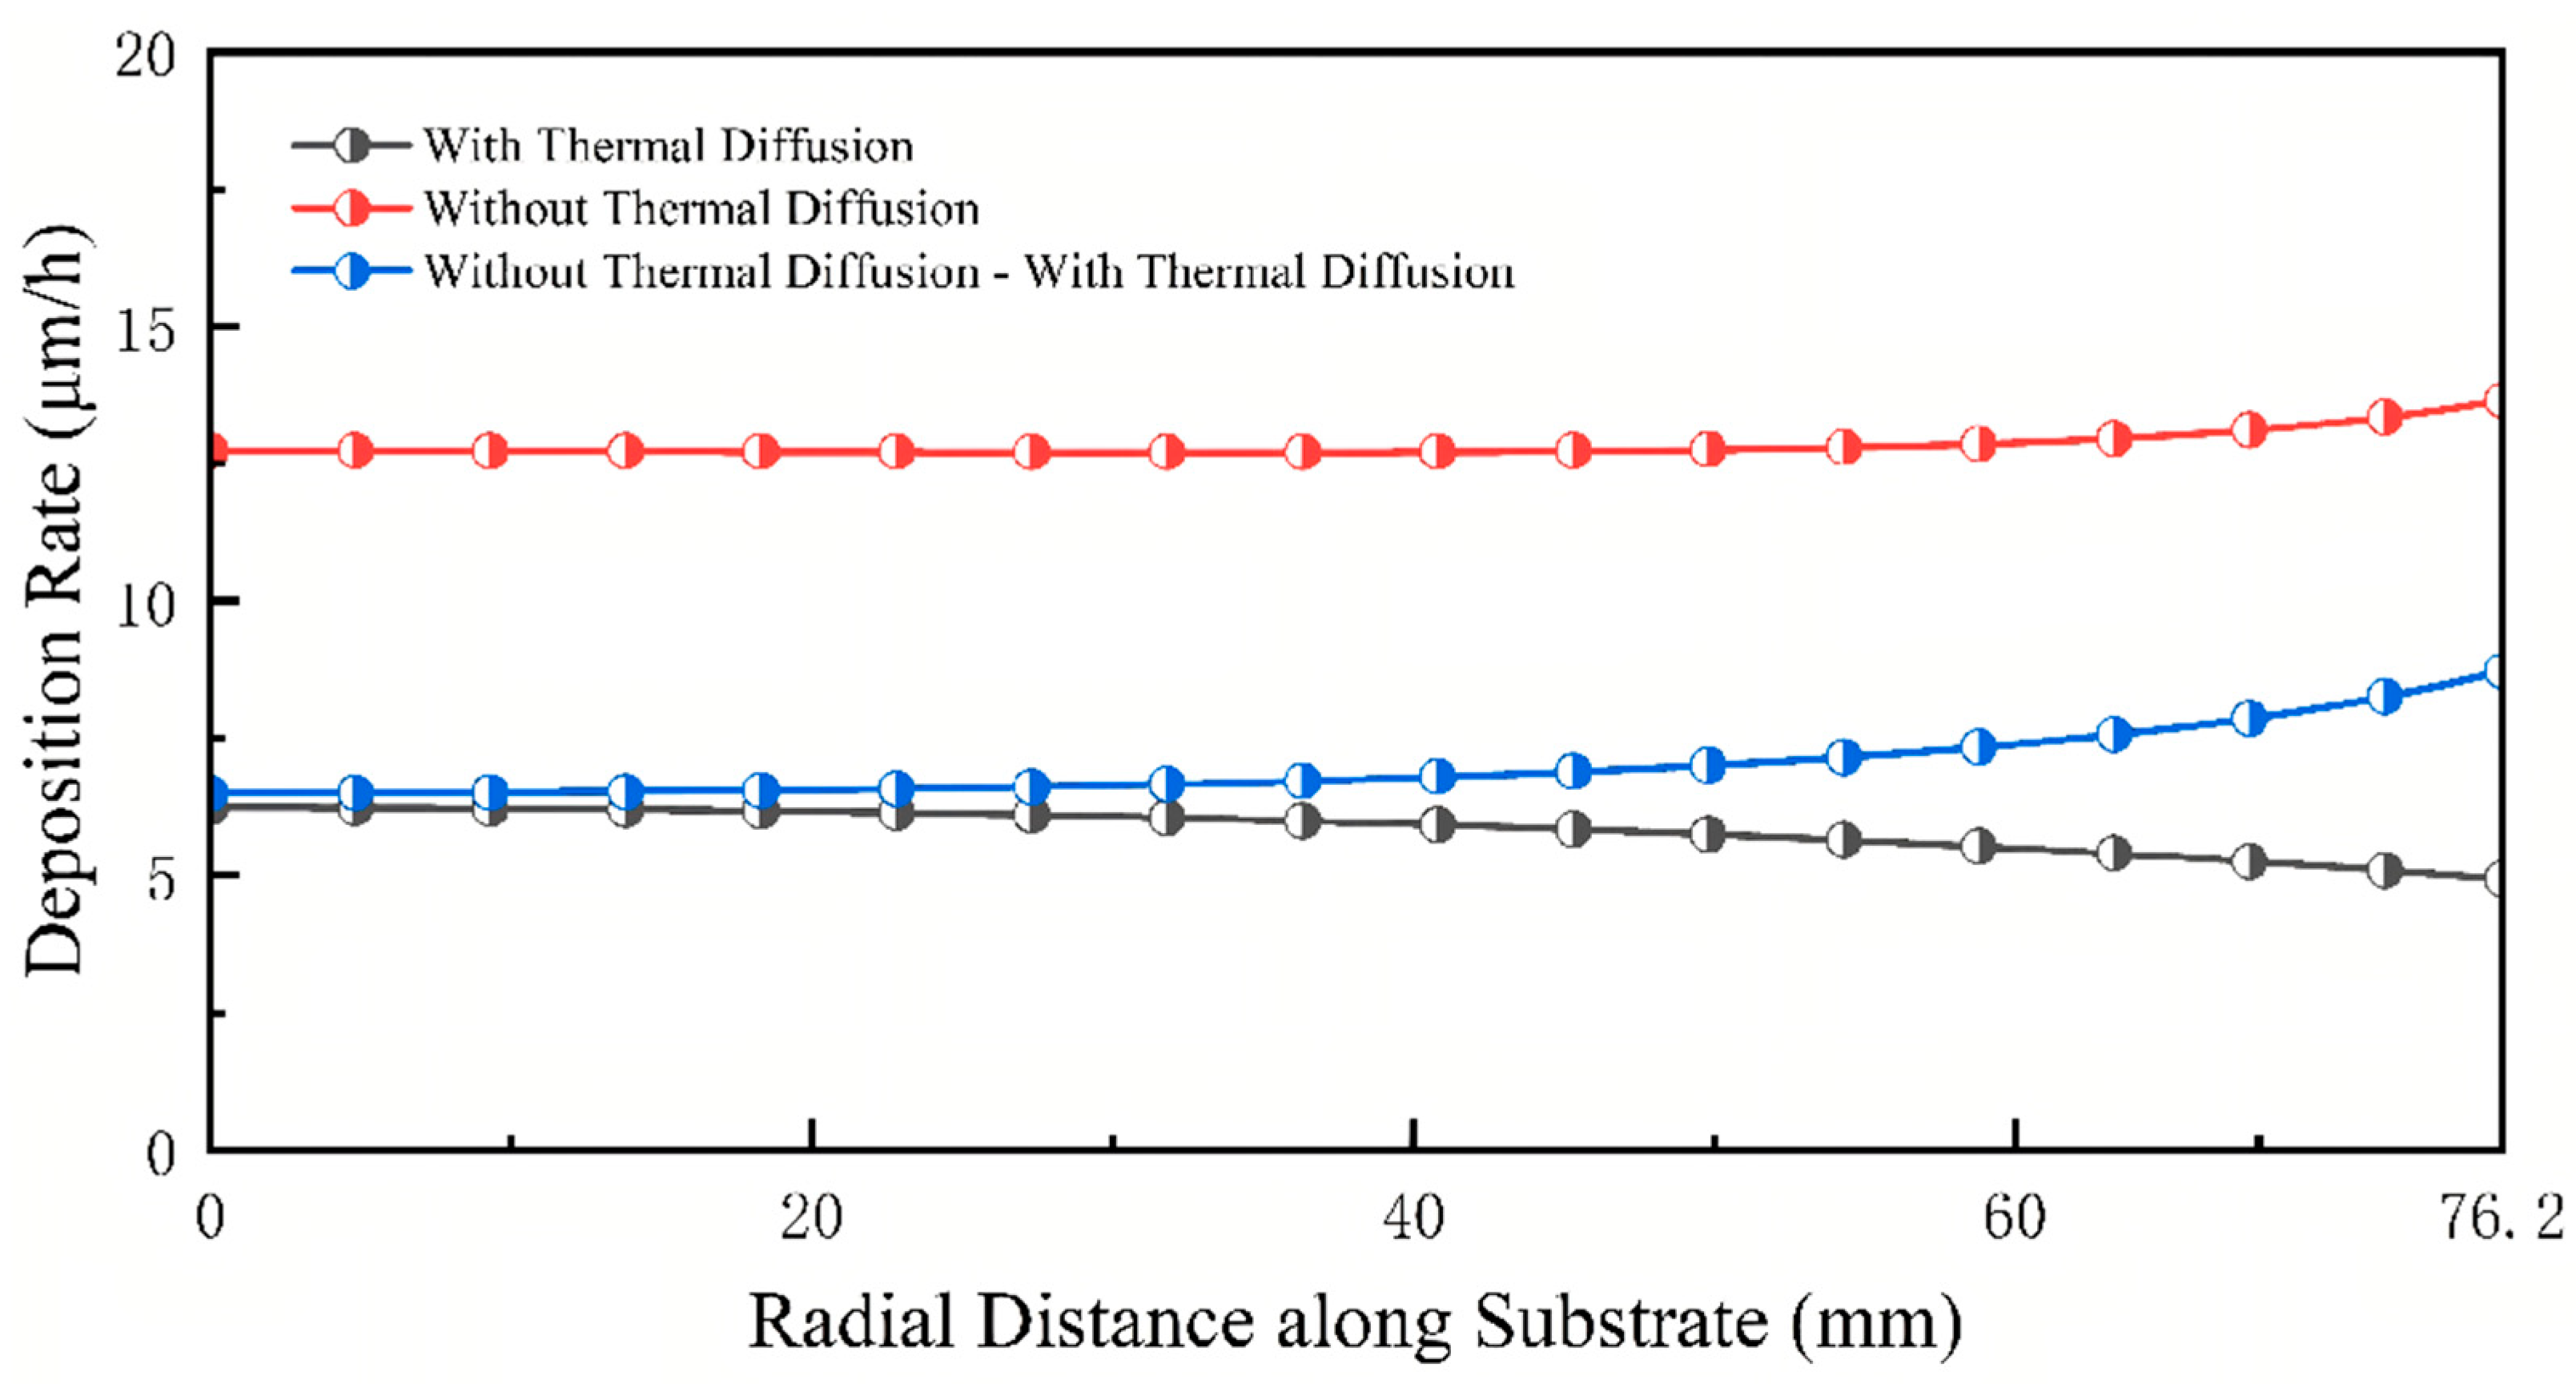
Figure 3. When thermal diffusion is considered, the average deposition rate across the substrate surface is 5.63 μm/h, with a film non-uniformity of 6.85%. Here, the degree of slope in the radial deposition rate profile directly reflects the spatial non-uniformity: a steeper slope corresponds to more pronounced non-uniformity. In contrast, when thermal diffusion is neglected, the average deposition rate increases to 12.91 μm/h, and the non-uniformity decreases to 1.55%. Under these baseline scenarios, the calculated TDC_GR is −56.39%, and TDC_GU is 5.29%.
It is noteworthy that the deposition rate profiles are highly uniform within the 0–40 mm radial range, regardless of whether the thermal diffusion effect is considered. This observation can be attributed to the centrifugal pumping effect generated by the rotating substrate (600 rpm), which effectively suppresses radial non-uniformity in the near-center region.
As shown in
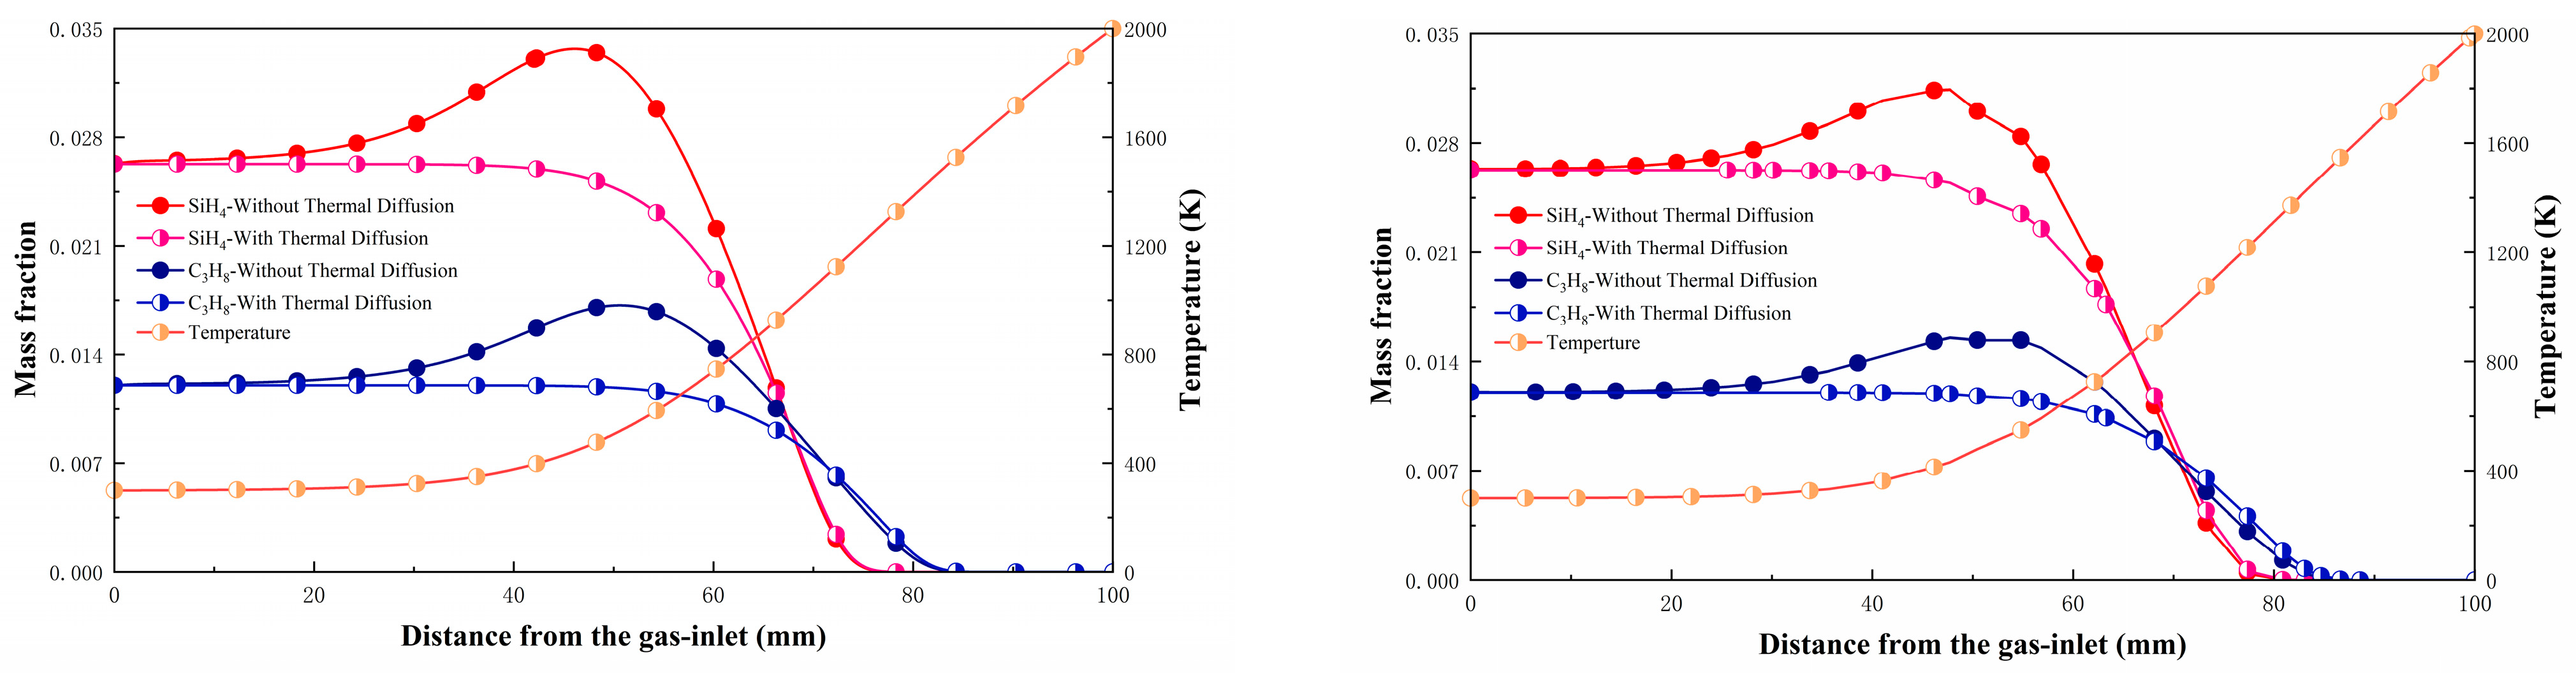
Figure 4, because the steep temperature gradient points toward the substrate, the large-mass precursor molecules experience an upward thermal diffusion flux directed away from the hot substrate, causing them to accumulate above the thermal boundary layer. Consequently, under the effect of thermal diffusion, this upward flux suppresses the net transport of precursors crossing the thermal boundary layer to reach the substrate surface, significantly reducing the deposition rate. Meanwhile, this thermal diffusion barrier intercepts and redistributes precursor molecules that would otherwise be locally oversupplied because of flow field non-uniformities, thereby disrupting the radial flux balance and degrading deposition uniformity to a certain extent. Without the effect of thermal diffusion, the mass fractions of the source gases remain essentially unchanged after entering the reactor, only gradually decreasing near the thermal boundary layer because of gas-phase and surface reactions and dropping to zero at the substrate.
3.2. Effect of Inlet-to-Substrate Temperature Difference (ΔT)
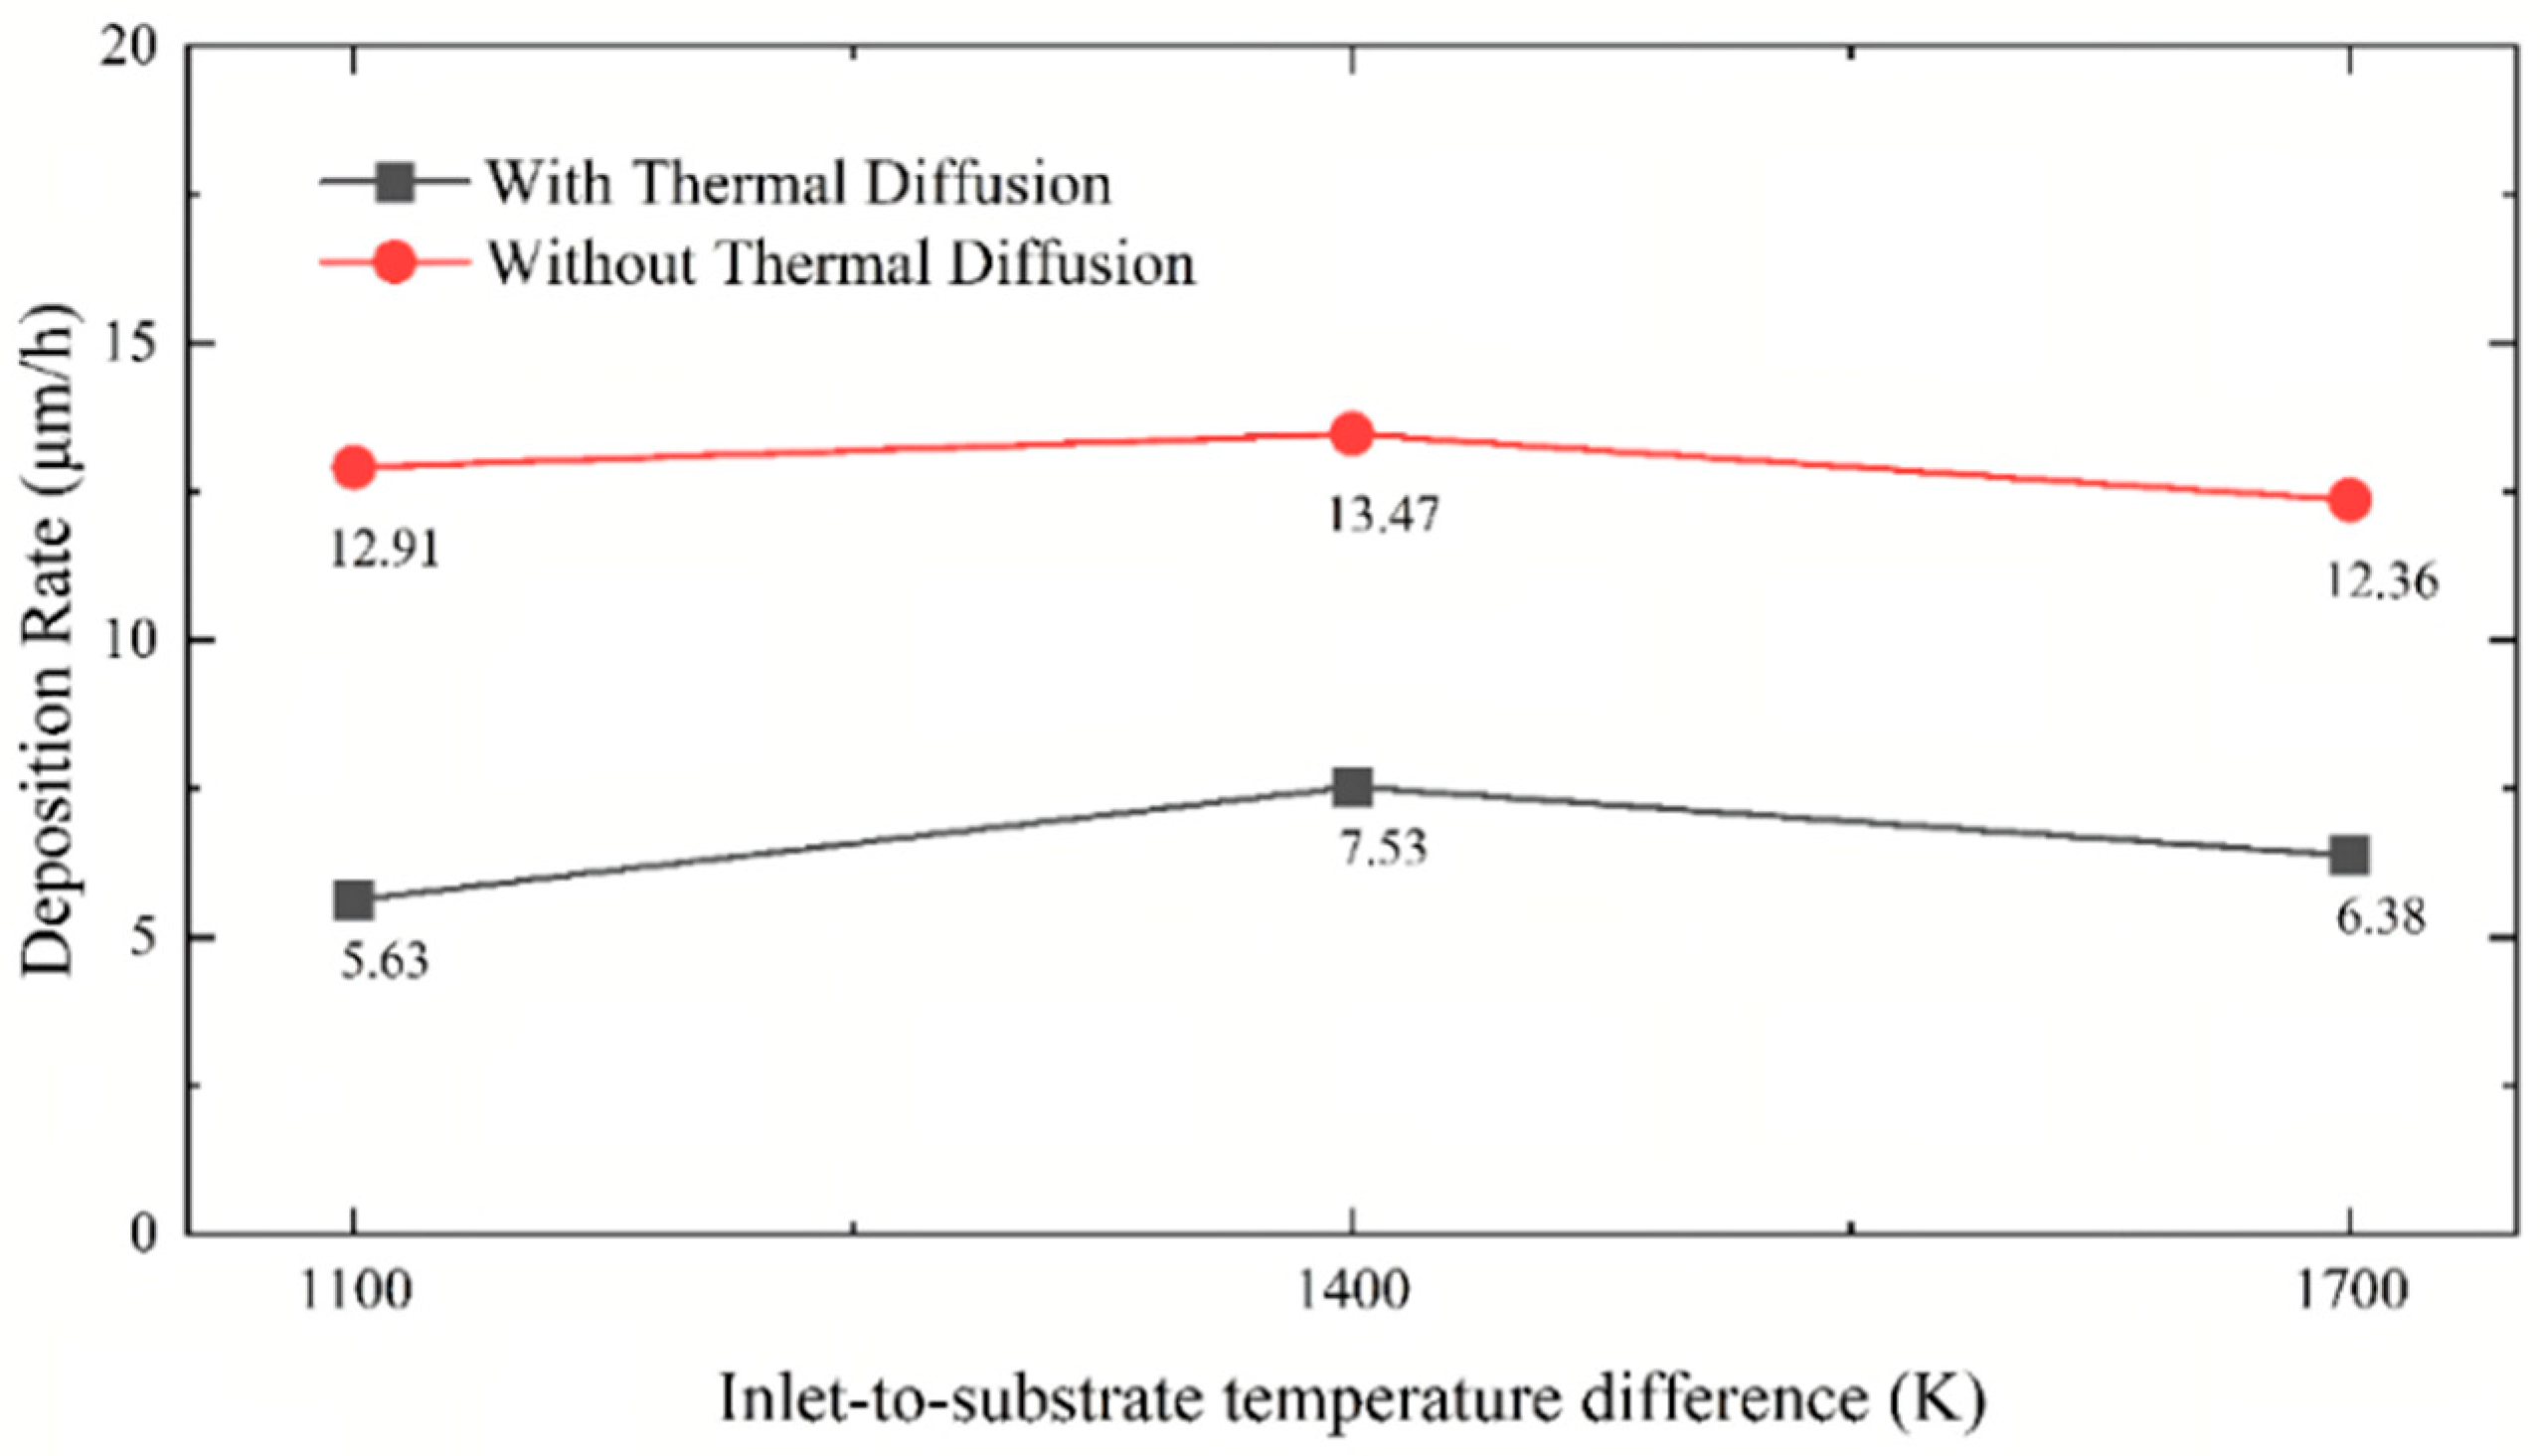
Because ΔT is the direct driving force behind the Soret effect, the increase from 1100 to 1700 K causes the absolute value of TDC_GR to rise, indicating that a larger temperature gradient induces a stronger flux of precursors away from the substrate, resulting in a more pronounced suppression of the deposition rate. Concurrently, TDC_GU increases sharply from 2.29% to 5.29%, demonstrating that a large temperature difference induces an uneven radial distribution of the thermal diffusion flux, severely degrading the resulting film uniformity(
Figure 5).
Note that GR_on is 5.63 μm/h at ΔT = 1700 K, which is lower than that (7.53 μm/h) at ΔT = 1400 K(
Figure 6). This deviation from a monotonic trend with respect to ΔT is also observed for TDC_GR, which can be attributed to the competing H
2 etching reaction occurring at higher temperatures [
26]. At ΔT = 1400 K, the substrate temperature is moderate, achieving an optimal balance between the thermal activation of the surface deposition reaction and the H
2 etching reaction. Because the suppression of the precursor supply by the thermal diffusion effect is also relatively moderate at this temperature, the coupling of these multi-physical factors results in the highest net deposition rate.
While keeping all other process parameters unchanged, ΔT was varied at three representative levels (1700, 1400, and 1100 K), which represent the high, medium, and low ends of the typical operating window. This range is sufficient to clearly reveal the non-monotonic dependence of the deposition rate and the monotonic enhancement of the Soret effect with increasing temperature difference. The physical mechanisms elucidated below provide a coherent explanation for these observations, and the identification of the optimal ΔT (1400 K) is well-supported by the current data set.
3.3. Effect of Pressure
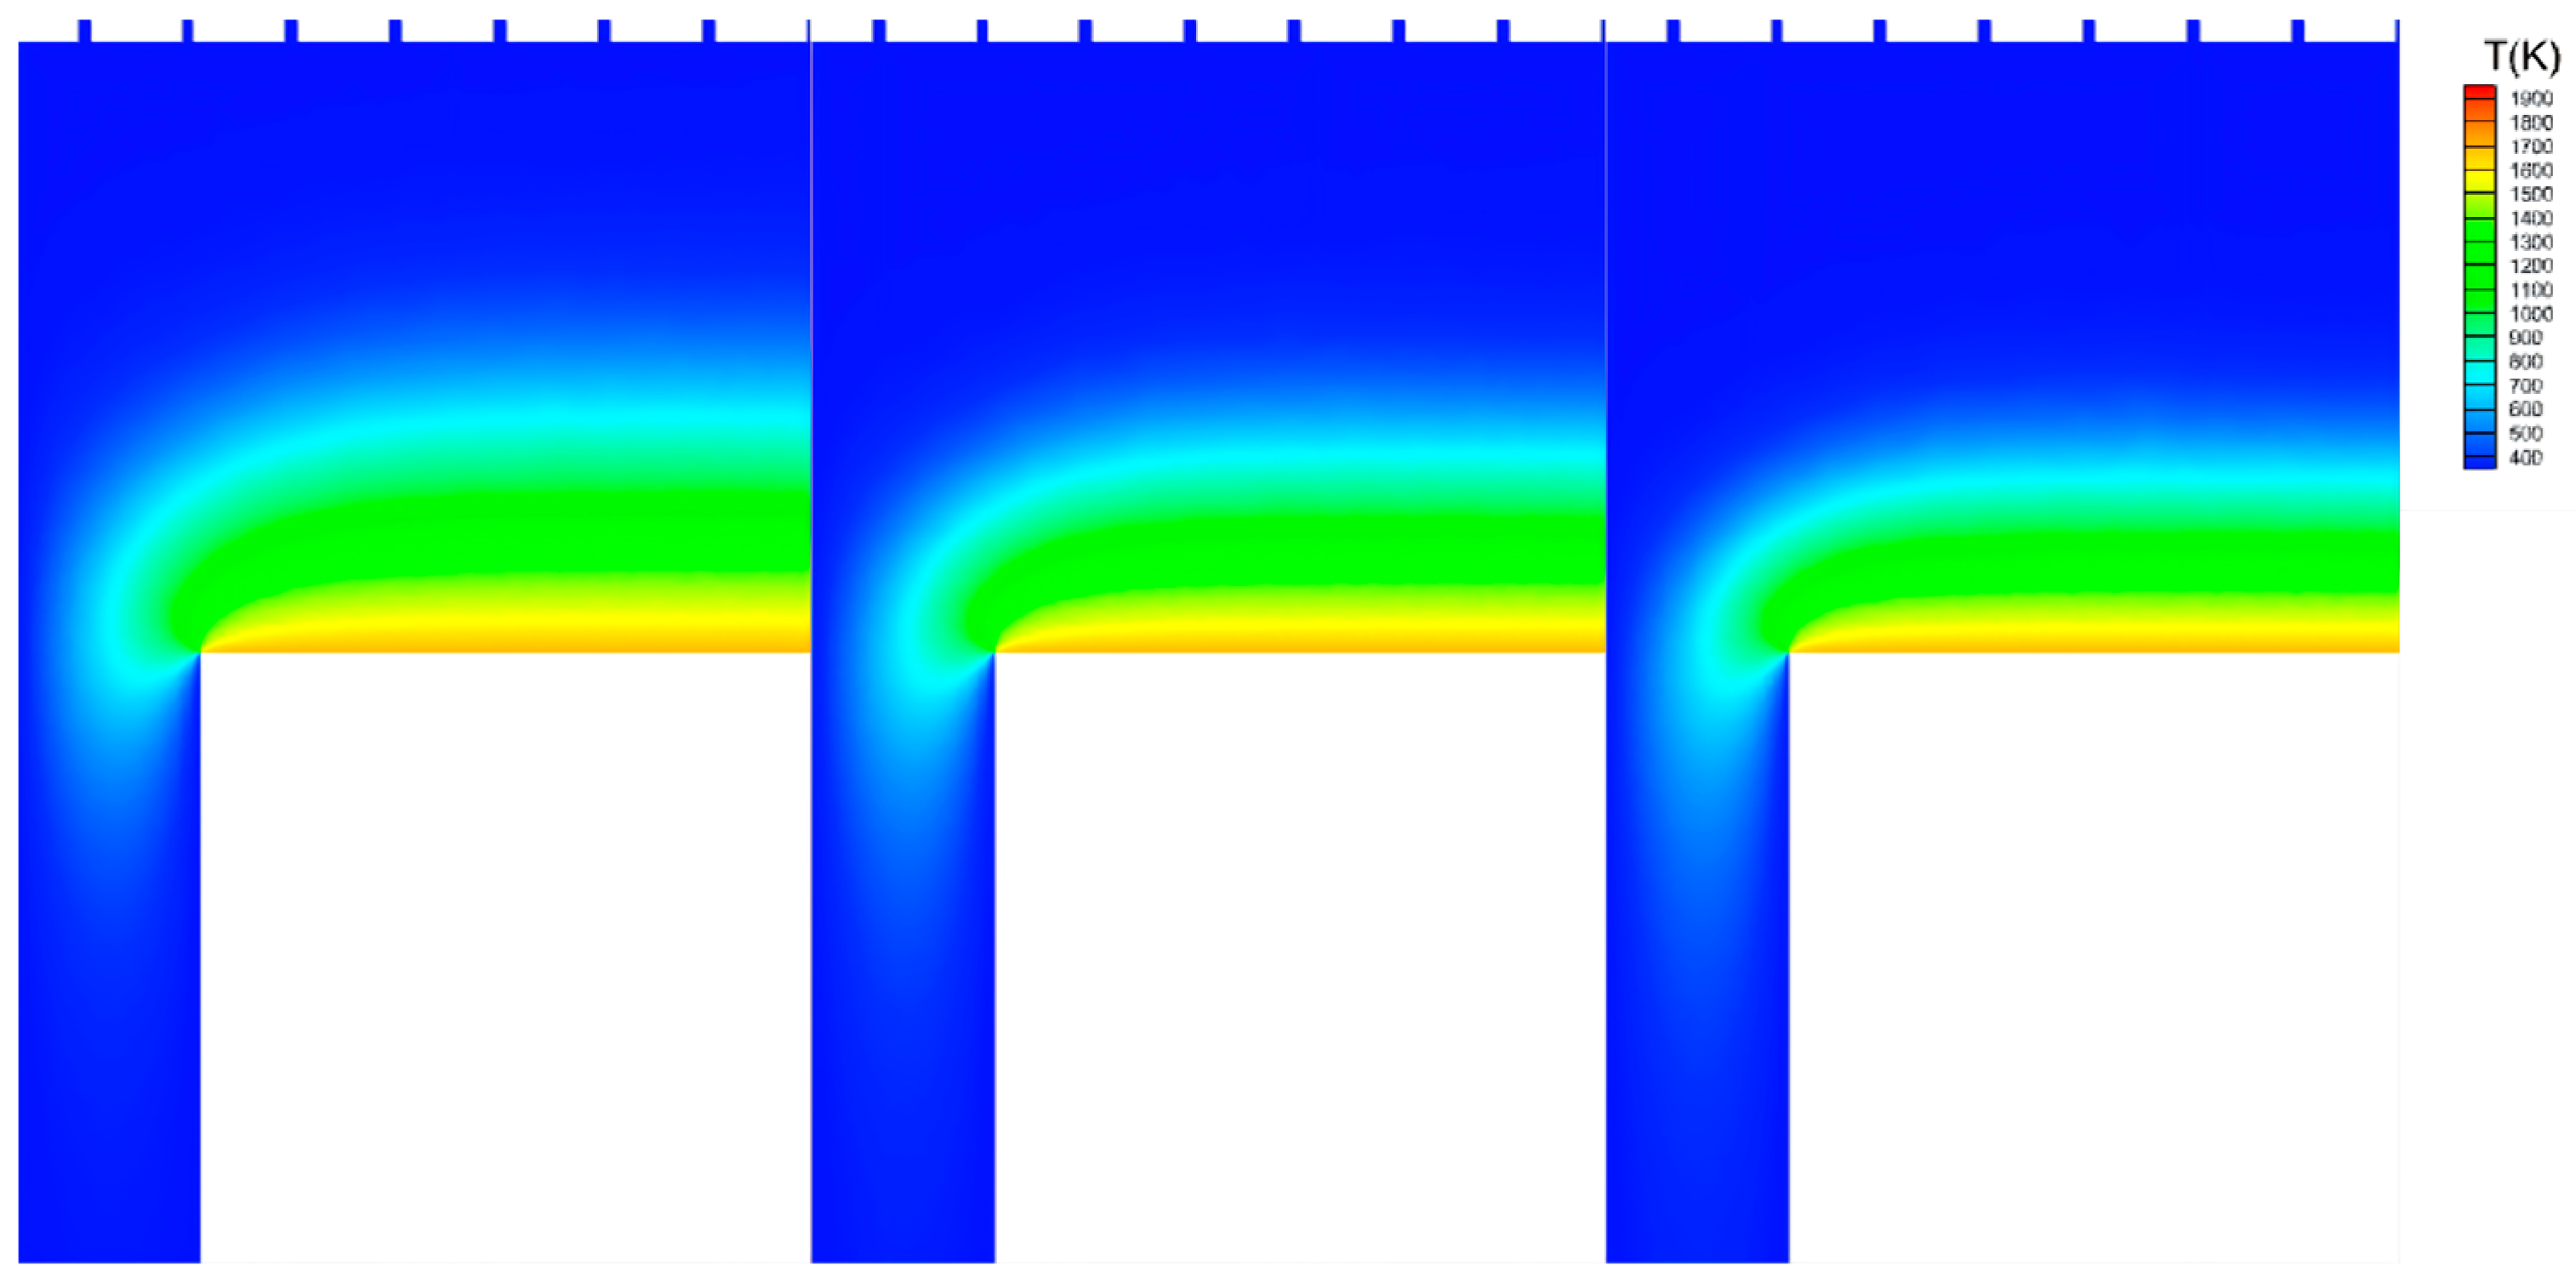
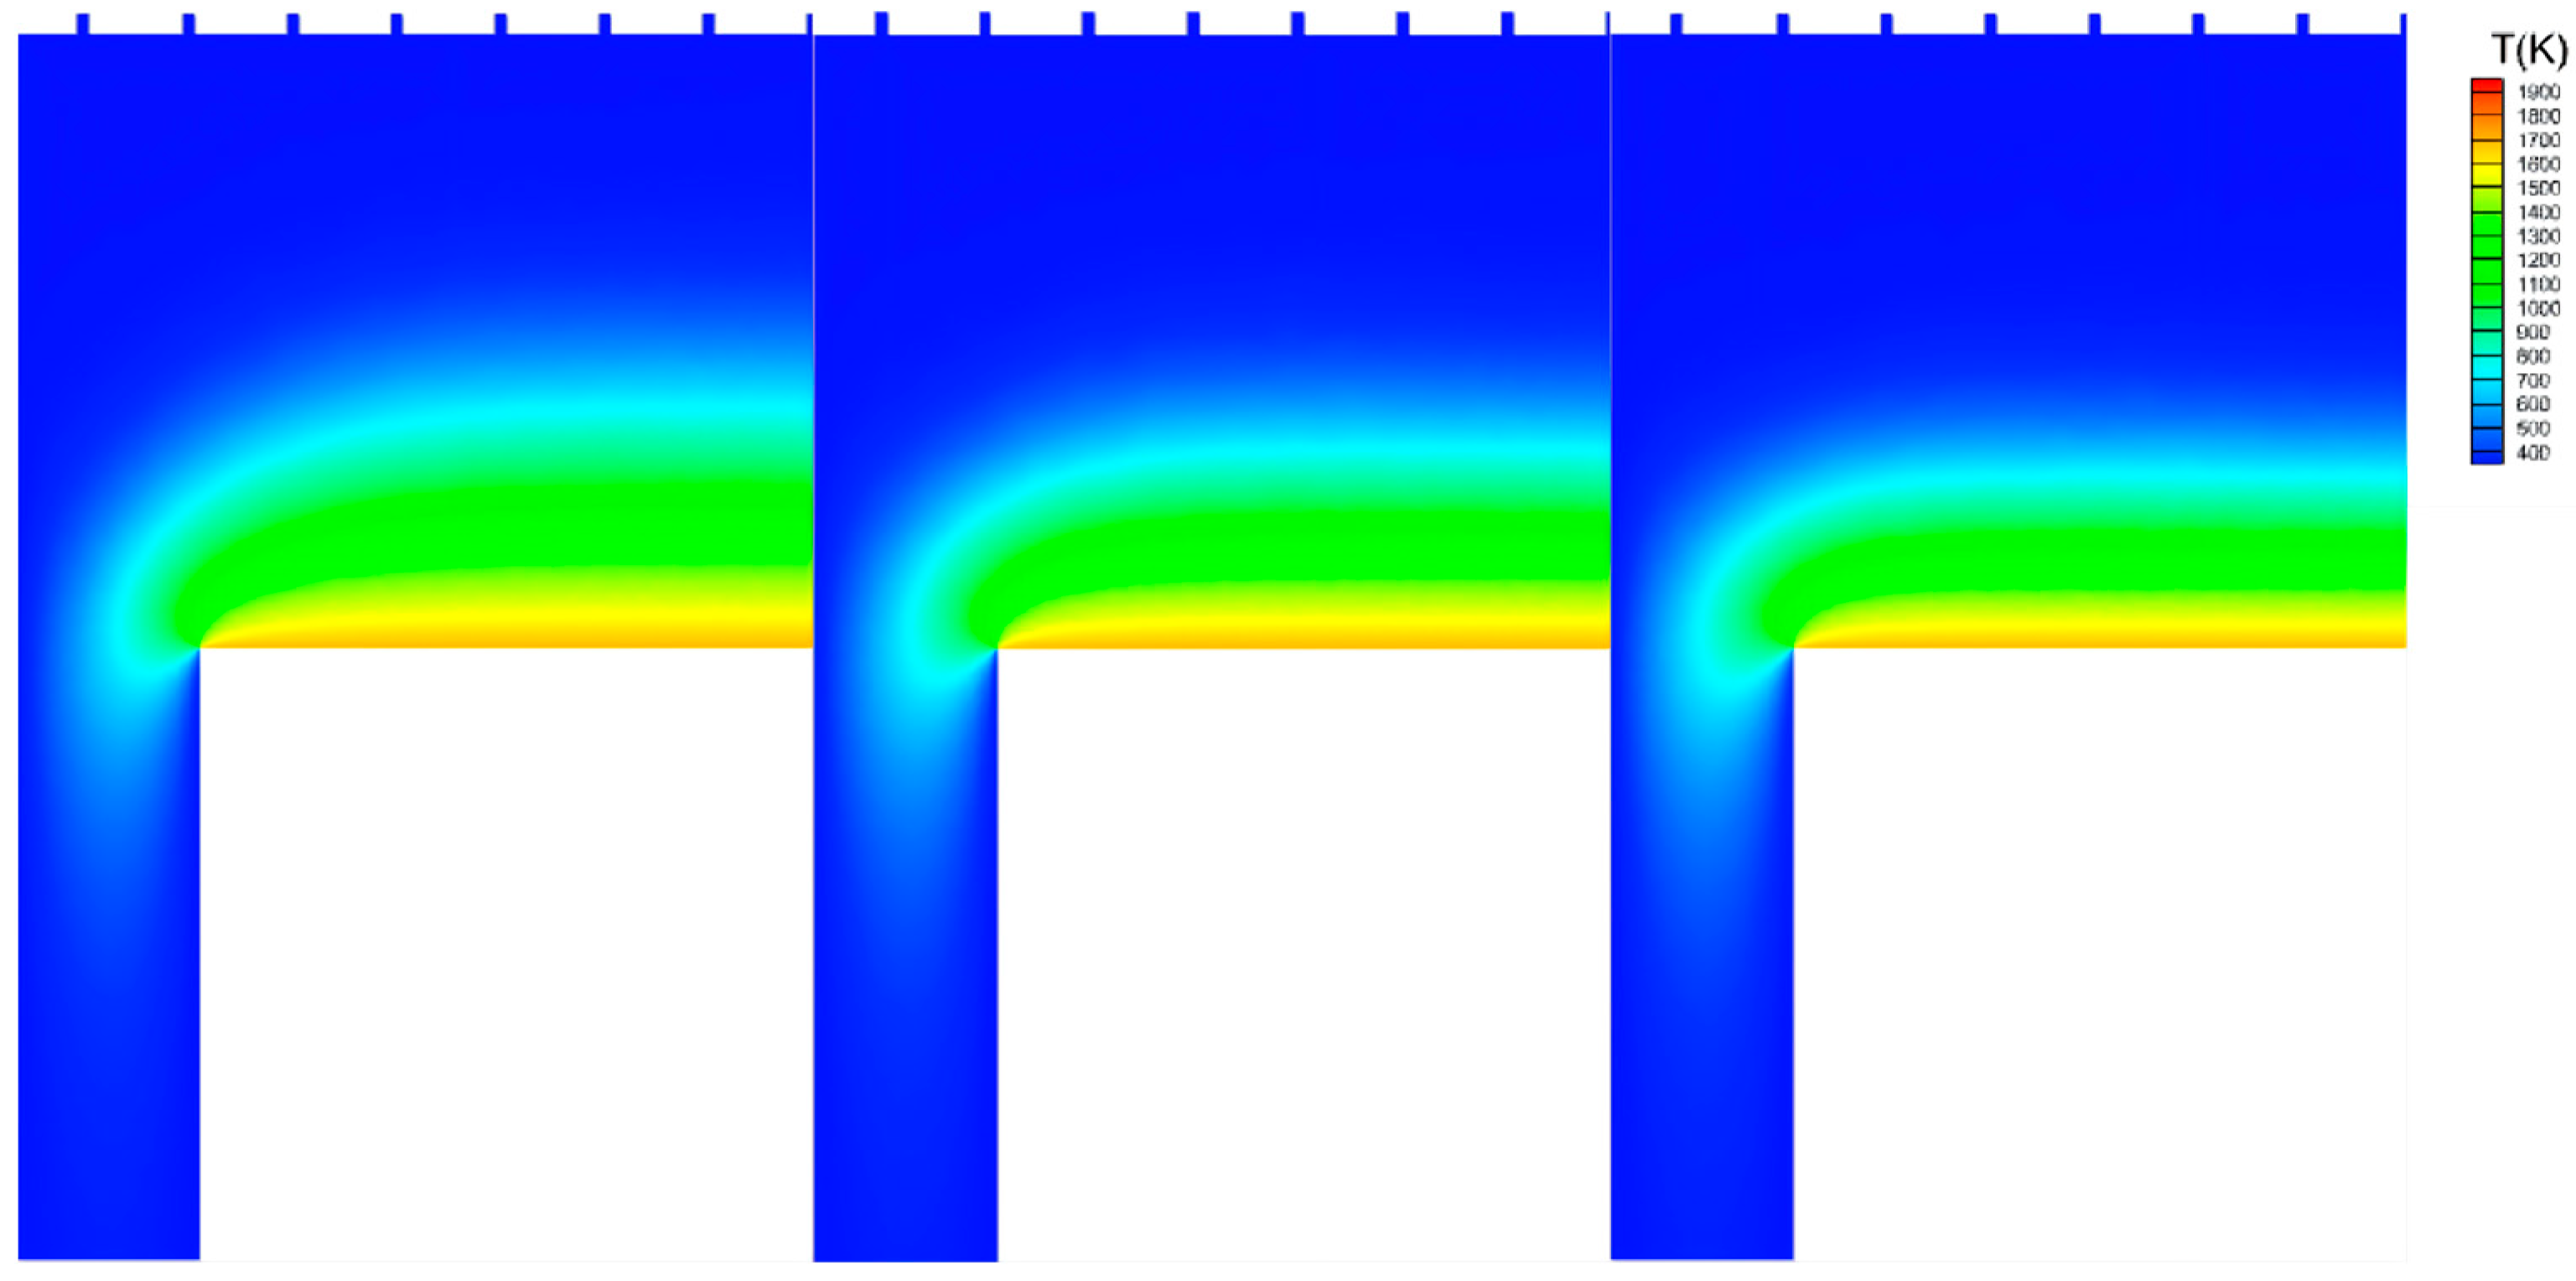
Table 3 (Rows 4–6) presents the simulation results obtained for pressures of 7500, 10,000, and 12,500 Pa under the constant conditions of ΔT = 1400 K, ω = 600 rpm, and Q = 70 slm. As shown in
Figure 7, the thermal boundary layer above the substrate does not change significantly as pressure increases.
As the pressure increases from 7500 to 12,500 Pa, the absolute value of TDC_GR initially decreases and then slightly increases, but the overall variation remains small (−46.66% → −44.10% → −45.02%). However, TDC_GU markedly decreases from 4.19% to 1.93% with increasing pressure. These results suggest that although higher pressures do not significantly weaken the suppression of the deposition rate by the thermal diffusion effect, they promote radial mass transport and mixing by increasing the collision frequency between gas molecules. Hence, increasing the pressure may be effective for mitigating the localized degradation in film uniformity imposed by the Soret effect [
20].
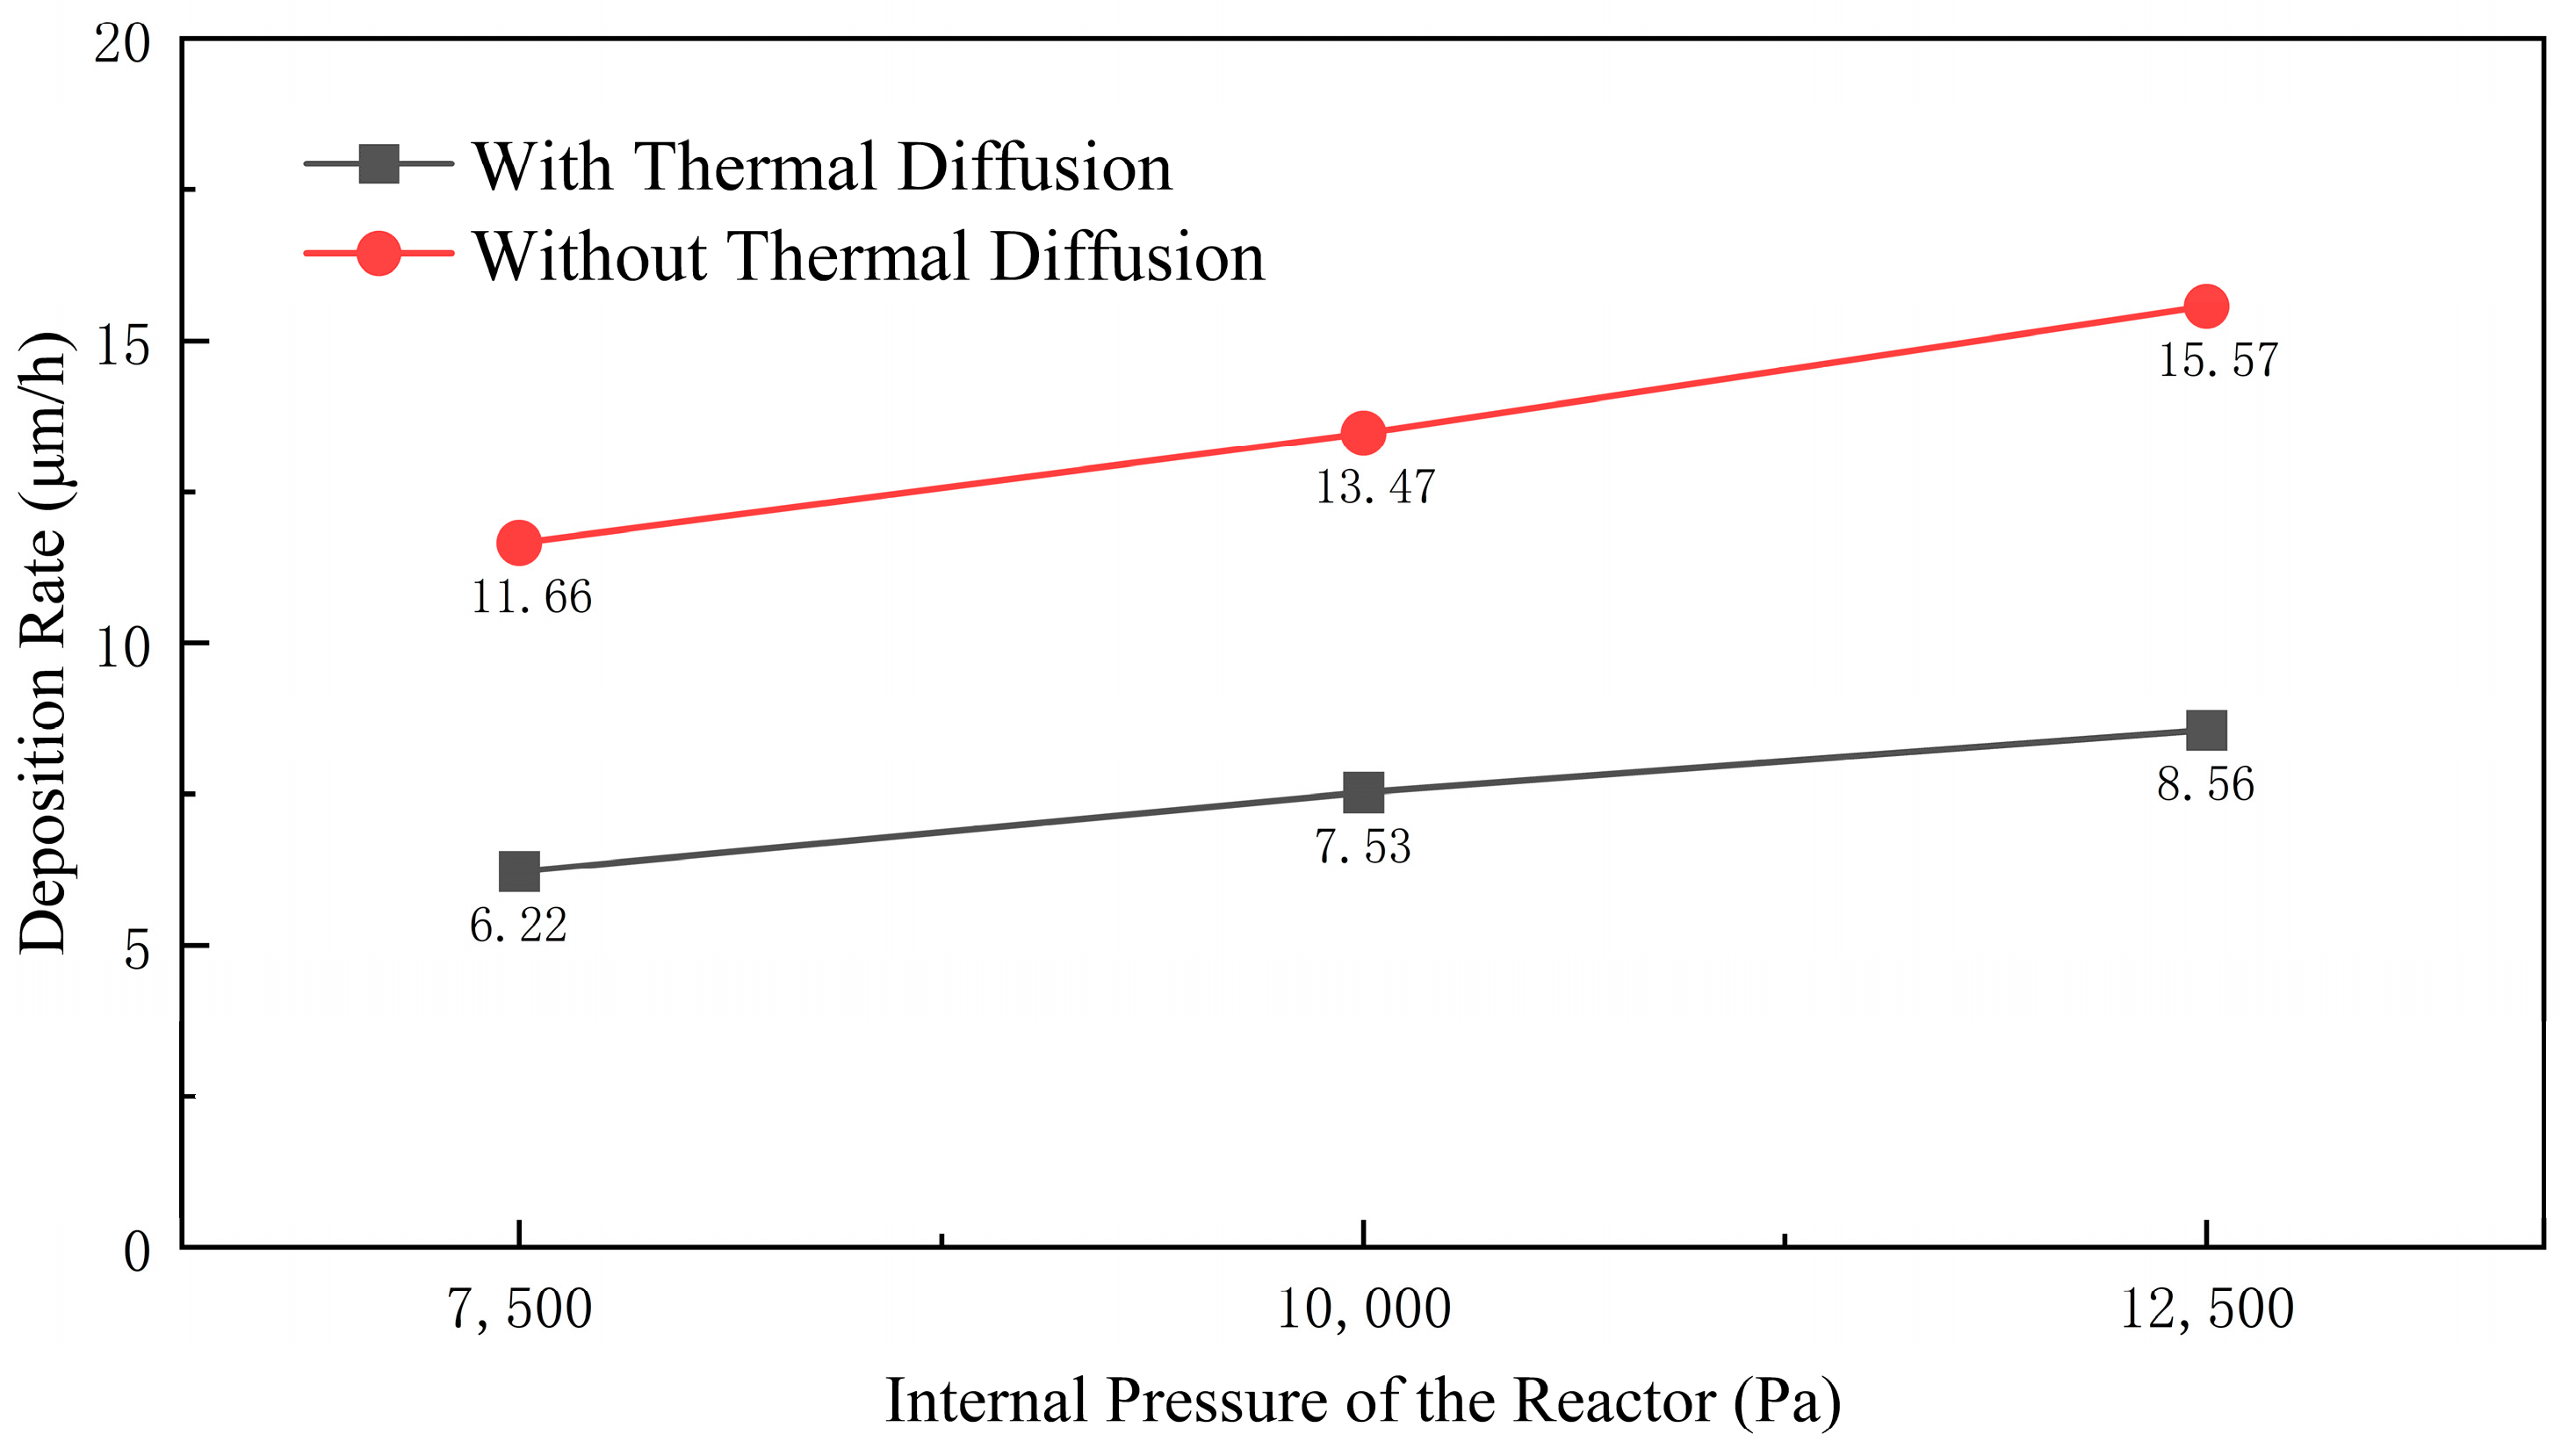
Figure 8 shows the change in deposition rates with and without the thermal diffusion effect as the pressure increases; the rates increase monotonically with pressure, as expected. This trend is reasonable because a higher total pressure raises the partial pressures of the reactant gases (SiH
4 and C
3H
8), leading to greater concentrations of the precursor species near the substrate surface. Because the deposition process is surface-kinetics-controlled under the present conditions, the increased reactant availability directly enhances the net deposition rate.
Table 3 (Rows 4–6) presents the simulation results obtained for pressures of 7500, 10,000, and 12,500 Pa. These three levels cover the practical operational window. The monotonic increase in deposition rate and the significant decrease in TDC_GU with increasing pressure are consistently captured, indicating that higher pressure enhances gas-phase mixing and molecular collisions, which counteracts the radial concentration differences induced by the Soret effect.
3.4. Effect of Substrate Rotation Speed
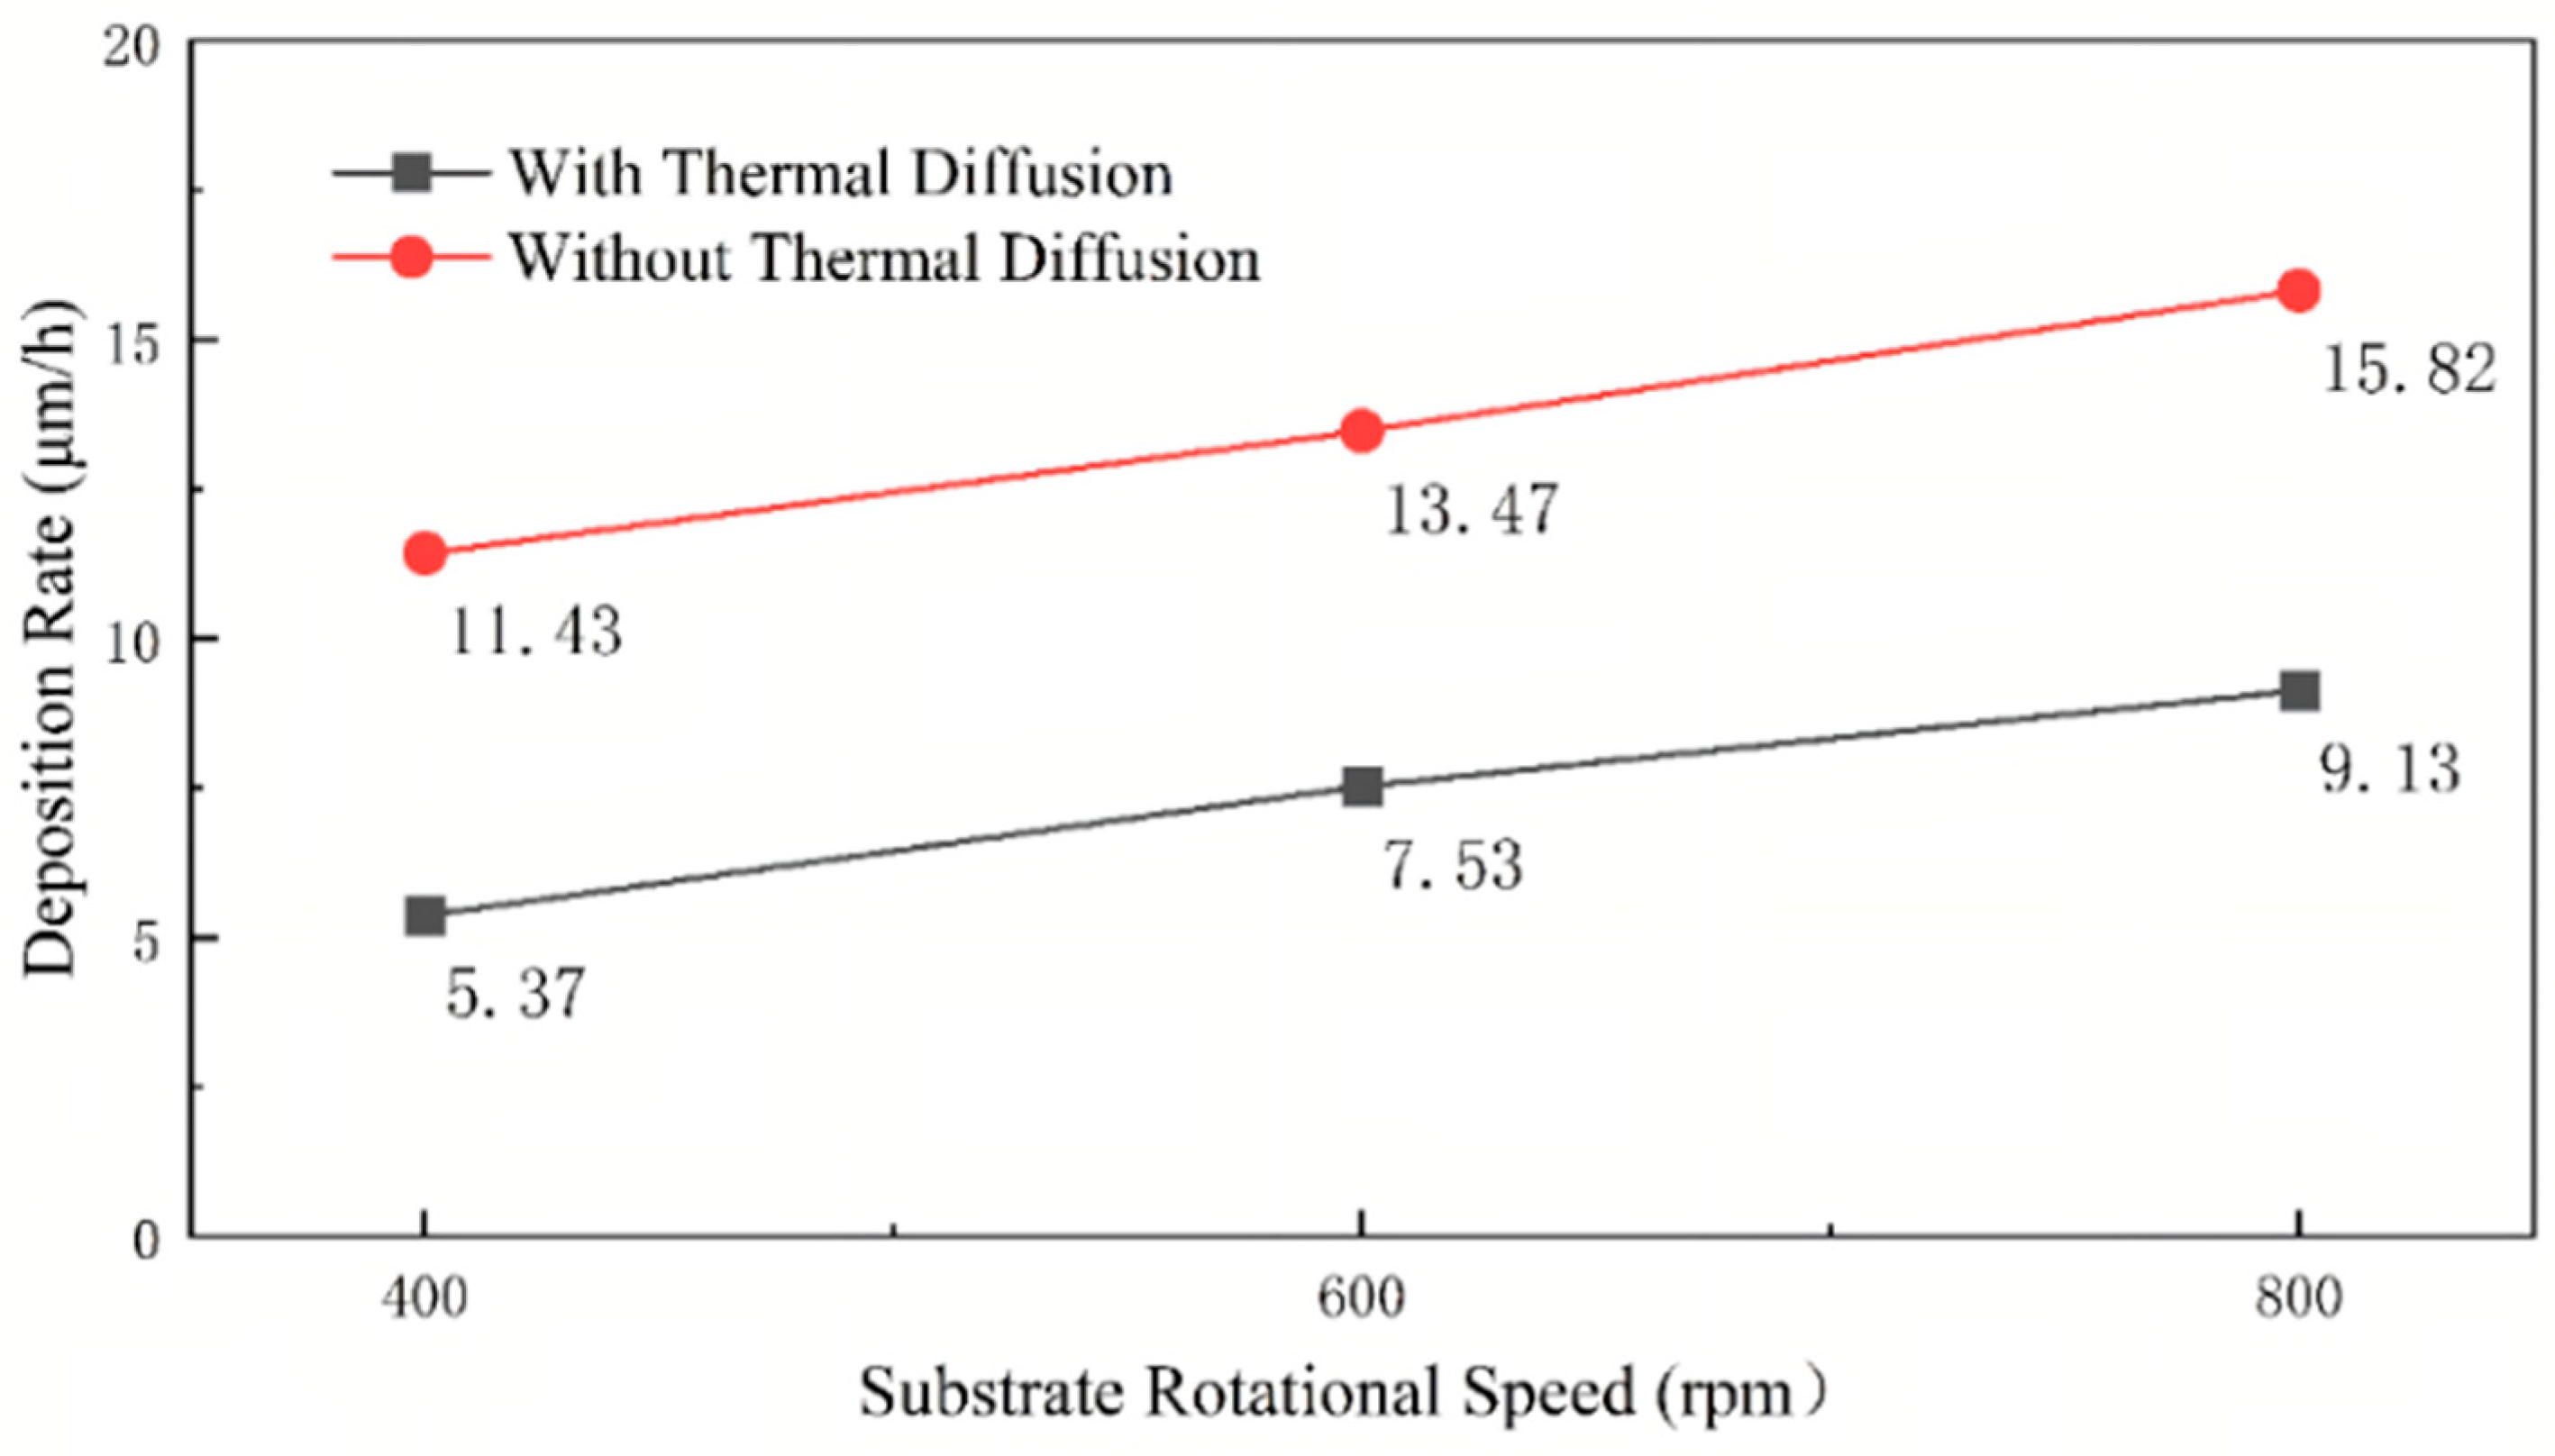
Table 3 (Rows 7–9) presents the simulation results obtained at substrate rotation speeds of 400, 600, and 800 rpm under the constant conditions of ΔT = 1400 K, p = 10,000 Pa, and Q = 70 slm. As shown in
Figure 9, the thermal boundary layer above the substrate does not change significantly as rotation speed increases.
As the rotation speed increases, the magnitude of growth suppression via TDC_GR decreases from 53.02% to 42.29%. This is primarily because the pumping effect and centrifugal force generated by substrate rotation enhance forced convection, thereby thinning the velocity and thermal boundary layers. Thinner boundary layers shorten the effective distance over which the temperature gradient acts, reducing the total residence time and path length over which precursor molecules are affected by thermal diffusion. Consequently, more precursors can reach the substrate surface and participate in deposition. The deposition rate calculated without the thermal diffusion effect also increases with rotation speed, confirming that substrate rotation primarily influences the convective mass transfer efficiency of precursors through hydrodynamic mechanisms.
In contrast, TDC_GU exhibits no significant change with rotation speed, indicating that the rotation speed has a relatively limited capacity to regulate radial uniformity variations caused by the thermal diffusion effect. This is reasonable because the rotation speed predominantly governs the axial transport of chemical species, and its effect on the radial thermal diffusion flux distribution remains less significant than that of pressure.
Figure 10 shows that the deposition rates increase with rotation speed, regardless of the thermal diffusion effect. This trend is physically sound because a higher substrate rotation speed intensifies the centrifugal pumping effect, which thins the velocity and thermal boundary layers above the substrate. Consequently, the diffusive transport distance for precursor species is shortened, and the convective supply of reactants to the surface is enhanced.
Table 3 (Rows 7–9) presents the simulation results obtained at substrate rotation speeds of 400, 600, and 800 rpm under constant conditions. These three levels cover the practical operational window for vertical CVD reactors. The monotonic increase in deposition rate and the marginal change in uniformity with ω are consistently captured, indicating that the primary role of substrate rotation is to thin the boundary layer and enhance convective transport. The selected resolution is sufficient to reveal that rotation speed has a limited capacity to regulate radial uniformity variations caused by the Soret effect.
3.5. Effect of Carrier Gas Flow Rate
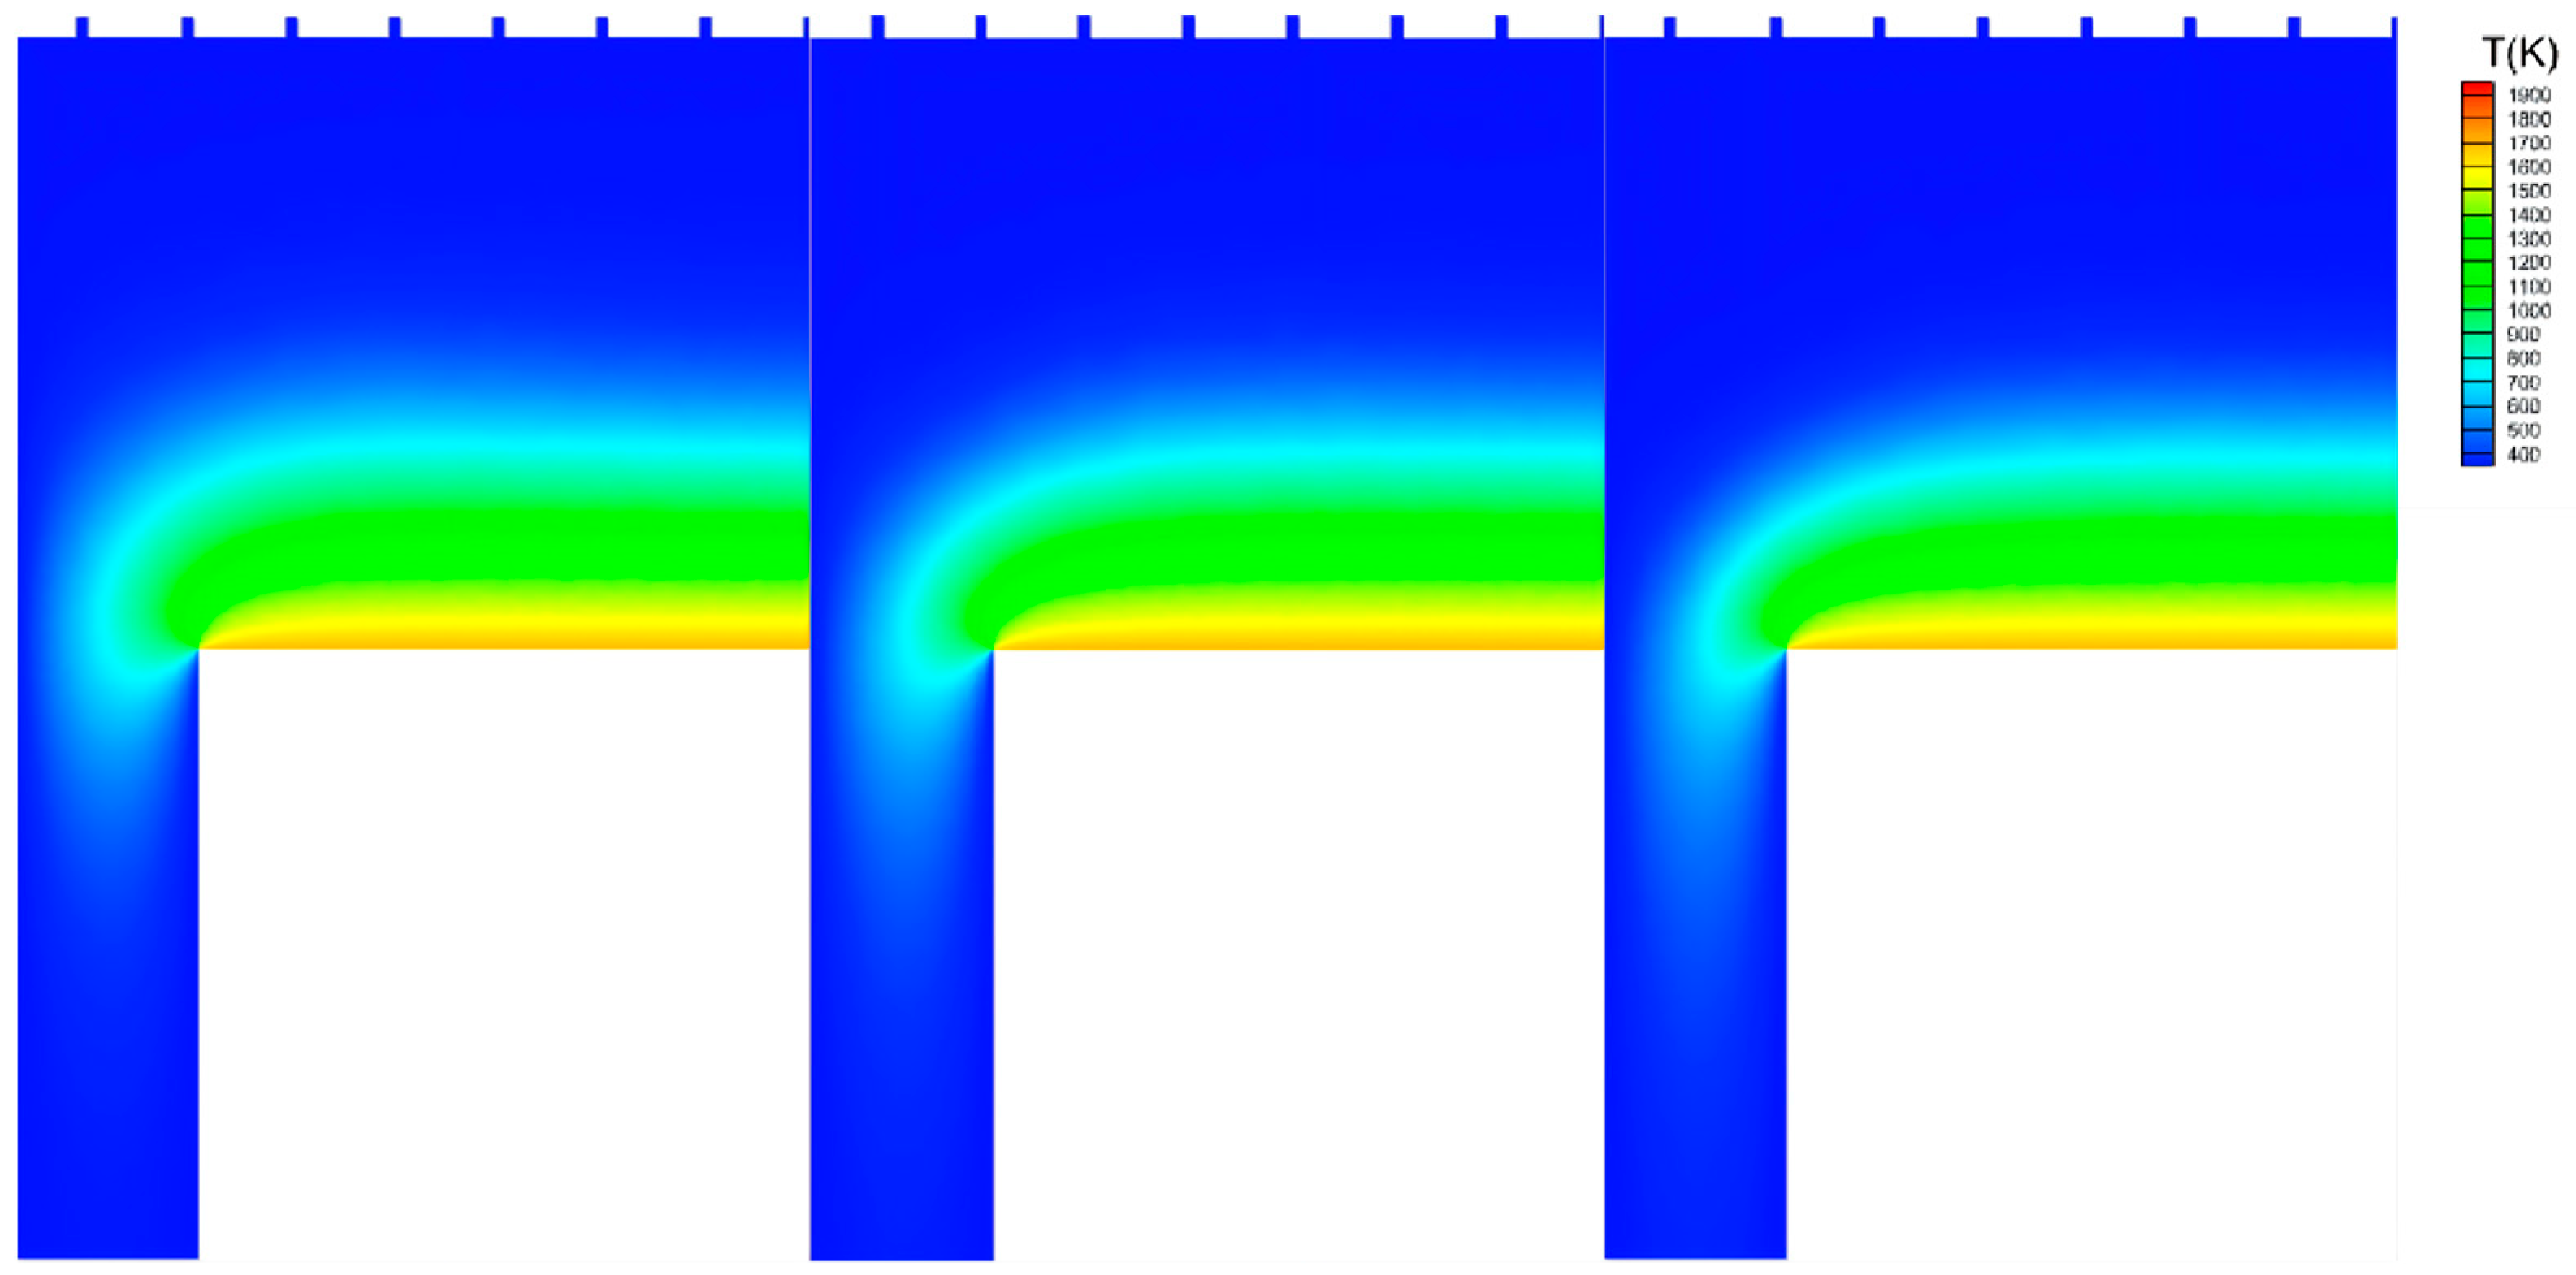
Table 3 (Rows 10–12) presents the simulation results obtained at H
2 flow rates of 50, 70, and 90 slm under the constant conditions of ΔT = 1400 K, p = 10,000 Pa, and ω = 600 rpm. As shown in
Figure 11, the thermal boundary layer above the substrate does not change significantly as the gas flow rate increases.
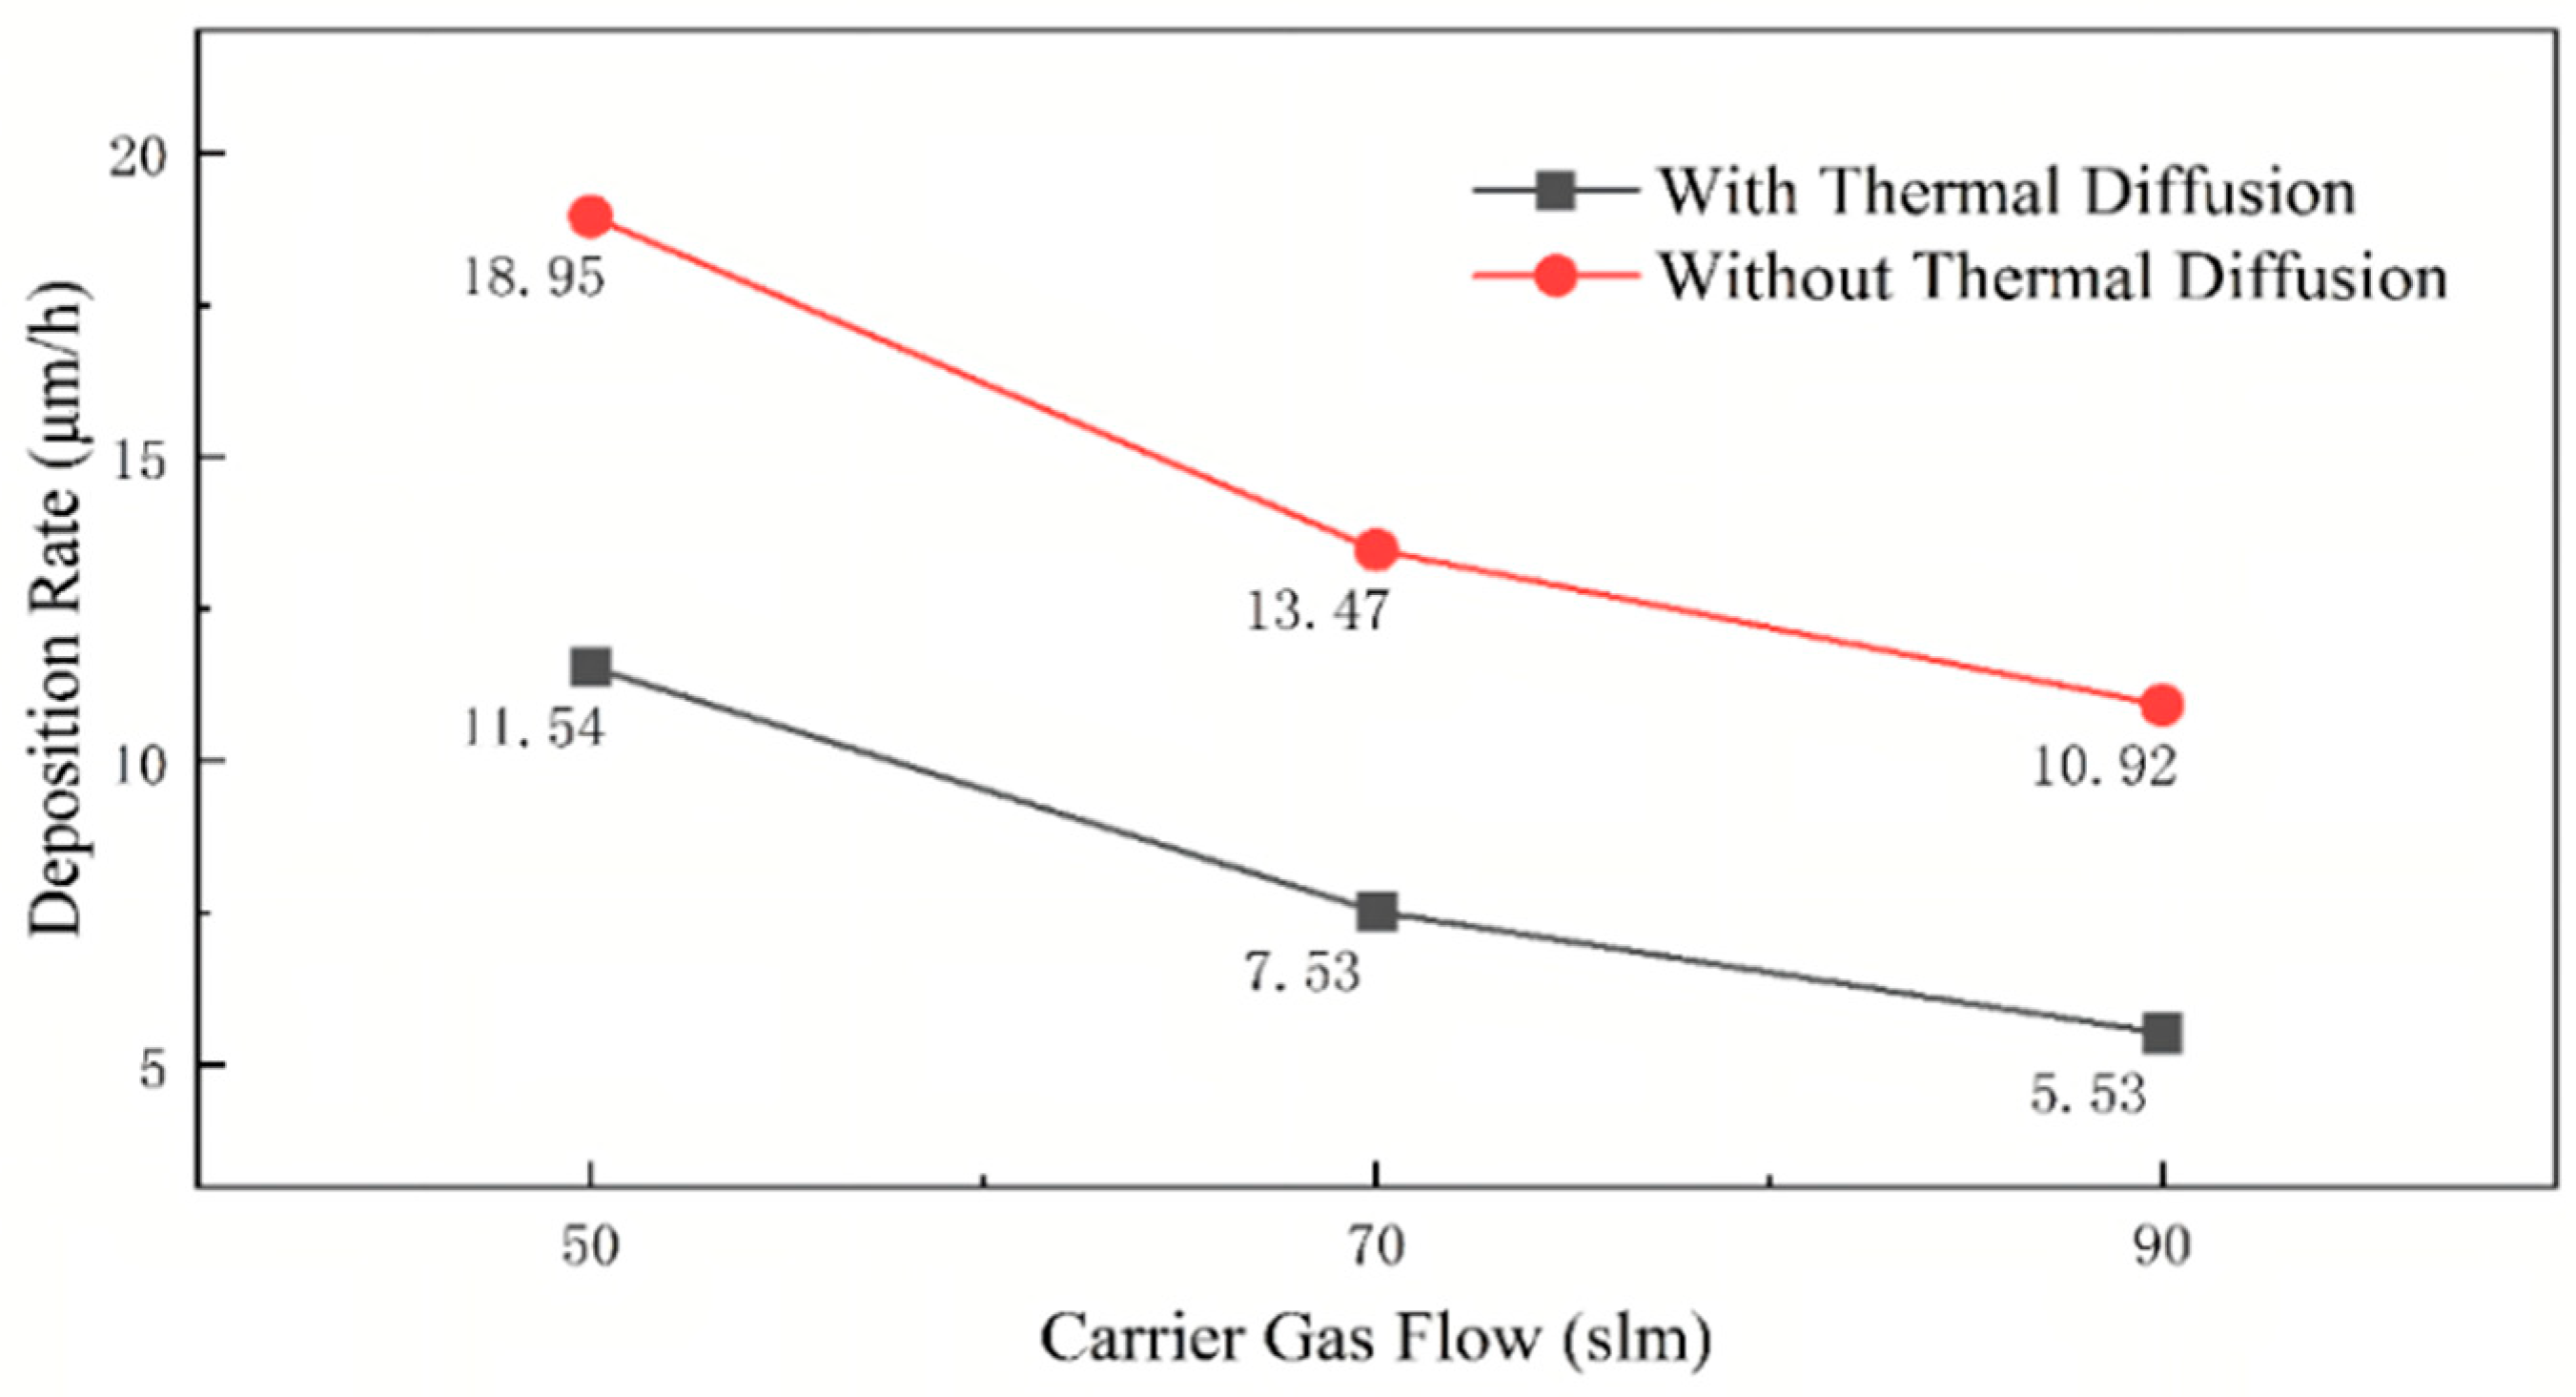
Increasing the carrier gas flow rate simultaneously reduces the residence time and the partial pressures of the precursors in the reactor. Together, these two mechanisms drive a continuous decrease in the deposition rate, as shown in
Figure 12. The absolute value of TDC_GR reaches 39.10% at 50 slm, 44.10% at 70 slm, and 49.36% at 90 slm. Under low flow rate conditions, the prolonged residence time and elevated precursor partial pressures make convective transport more effective than thermal transport, increasing the fraction of precursors reaching the substrate and decreasing the absolute value of TDC_GR. Conversely, under high flow rate conditions, precursor molecules flow more rapidly, and under a constant thermal diffusion intensity, the proportion of precursors reaching the substrate further decreases, leading to a corresponding increase in the absolute value of TDC_GR (growth suppression).
Meanwhile, TDC_GU decreases from 3.12% to 1.20% as the flow rate increases. This improvement occurs because high flow rates shorten the gas residence time above the substrate, attenuating the cumulative development of radial concentration differences caused by the thermal diffusion effect, resulting in a macroscopically uniform concentration distribution across the boundary layer.
Table 3 (Rows 10–12) presents the simulation results obtained at H
2 flow rates of 50, 70, and 90 slm. These three levels cover the practical operational window. The monotonic decrease in deposition rate and the reduction in TDC_GU with increasing flow rate are consistently captured, indicating that higher flow rates shorten residence time and reduce precursor partial pressures, while also attenuating the cumulative development of radial concentration differences caused by the Soret effect.
3.6. Process Parameter Optimization
Based on the comprehensive analysis of the individual and interactive effects of each parameter, ΔT is established as the dominant factor influencing the thermal diffusion effect. Recent simulation studies on 6-inch 4H-SiC homoepitaxial growth have similarly demonstrated the importance of optimizing gas flow and temperature field distributions to achieve uniform doping and thickness across large-area wafers [
27]. Pressure mainly suppresses the radial non-uniformity induced by the thermal diffusion effect by enhancing gas-phase mixing. Substrate rotation speed improves precursor transport efficiency by thinning the boundary layer. The carrier gas flow rate affects both deposition rate and uniformity by altering the residence time and partial pressure of precursors. Balancing the inherent trade-off between deposition rate and film uniformity, an optimal process parameter combination was identified within the investigated range: ΔT = 1400 K, p = 12,500 Pa, ω = 800 rpm, Q = 50 slm (Row 13 in
Table 3). The optimization rationale for this combination is described as follows: a moderate ΔT (1400 K) regulates the baseline intensity of the thermal diffusion effect, avoiding severe deposition rate loss caused by an excessively large temperature difference; a higher pressure (12,500 Pa) enhances gas-phase mixing, effectively reducing TDC_GU; a higher rotation speed (800 rpm) enhances convection, thins the boundary layer, and improves precursor transport efficiency; and a lower flow rate (50 slm) increases the precursor residence time and partial pressure, compensating for the flux loss caused by the thermal diffusion effect.
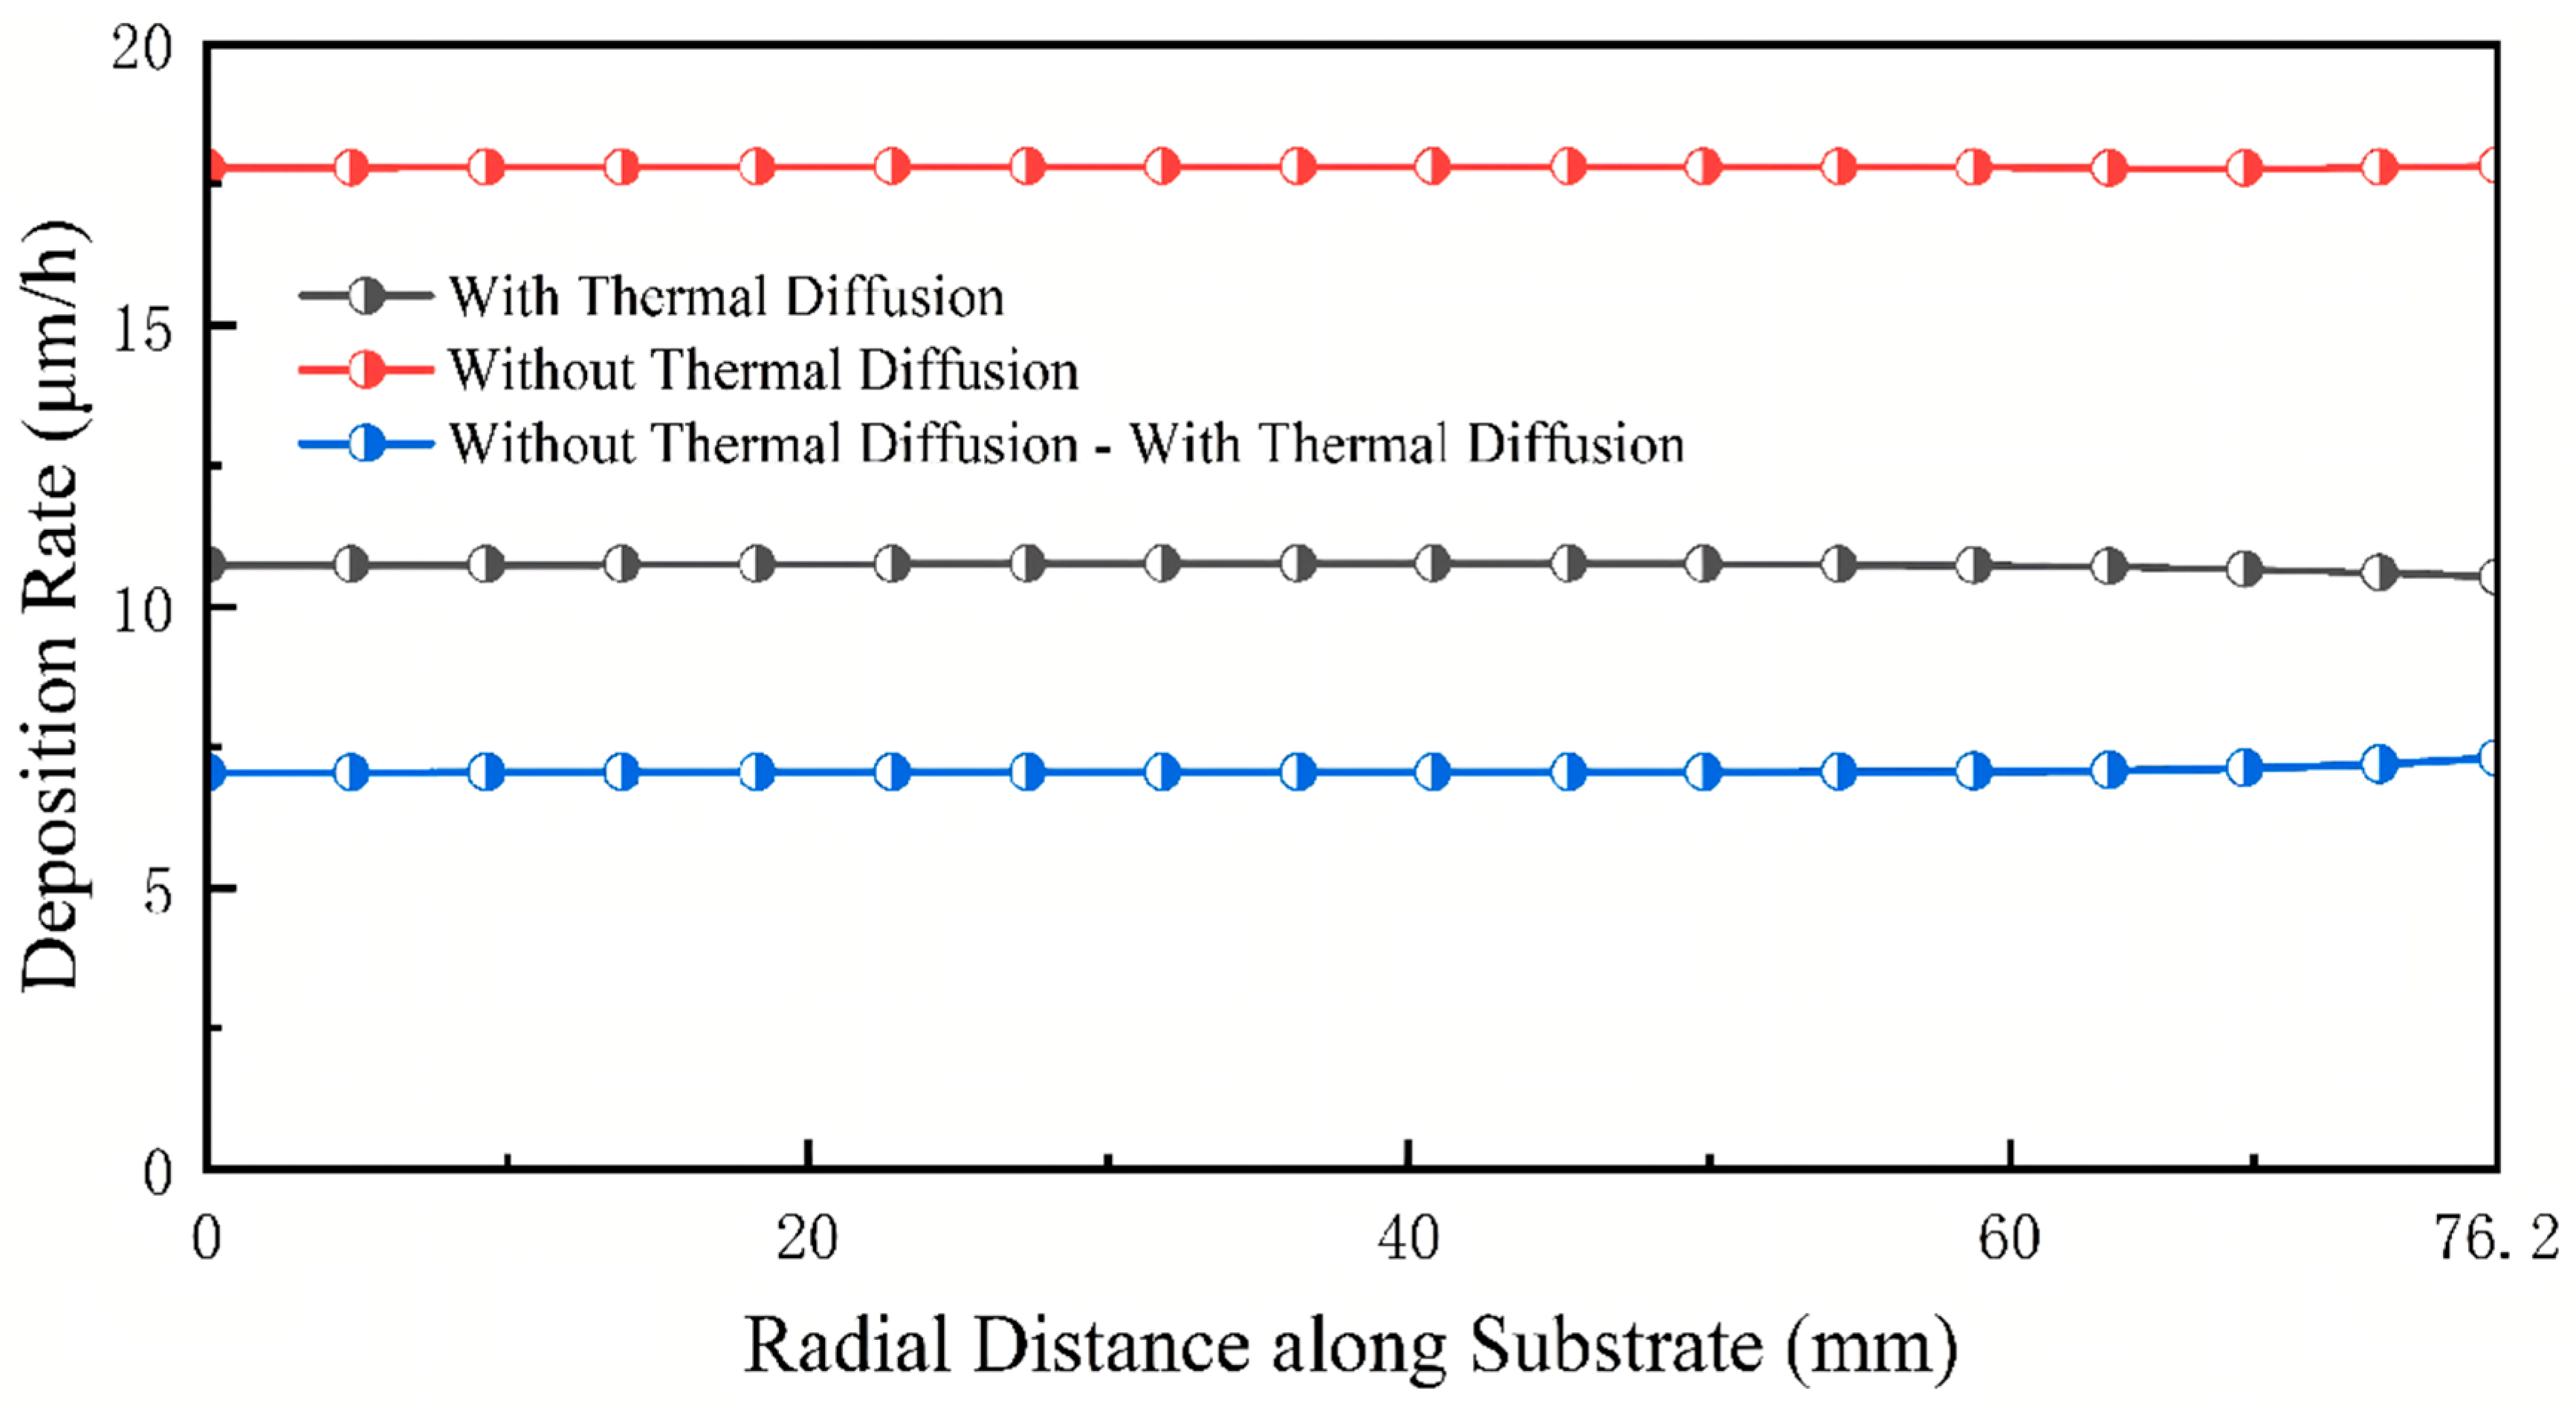
Under this optimized condition, the actual deposition rate (with the thermal diffusion effect considered) reaches 10.71 μm/h (
Figure 13), with a non-uniformity of 0.45%. When the thermal diffusion effect is artificially neglected, the deposition rate is 17.81 μm/h (
Figure 13), with a non-uniformity of 0.05%. Thus, TDC_GR is −39.87%, and TDC_GU is only 0.40%. Compared with the baseline scenario (TDC_GR = −56.39%, TDC_GU = 5.29%), the optimized combination still delivers high deposition uniformity while maintaining a relatively high deposition rate.