Article

Dynamic Recrystallization Behavior and Prediction Model of an Ultra-High-Strength Nickel-Based Corrosion-Resistant Alloy During Hot Deformation

1
Chongqing Materials Research Institute Co., Ltd., Chongqing 400707, China
2
National Engineering Research Center for Instrument Functional Materials, Chongqing 400707, China
3
Chongqing Key Laboratory of High-Performance Corrosion-Resistant Alloys, Chongqing 400707, China
4
School of Mechanical Engineering, Taiyuan University of Science and Technology, Taiyuan 030024, China
*
Author to whom correspondence should be addressed.
Crystals 2026, 16(7), 424; https://doi.org/10.3390/cryst16070424
Submission received: 5 June 2026 / Revised: 23 June 2026 / Accepted: 24 June 2026 / Published: 29 June 2026
(This article belongs to the Special Issue Investigation of Microstructural and Properties of Steels and Alloys)

Abstract

A recently developed high-strength nickel-based corrosion-resistant alloy has attracted increasing interest for drilling and production operations in unconventional oil and gas fields. Owing to its high resistance to media containing H2S, CO2 and chloride ions, together with its ultra-high strength and favorable strength–toughness balance, this alloy is suitable for demanding service conditions. During hot working, dynamic recrystallization (DRX) governs deformation softening, grain refinement and the subsequent microstructural state, and thus has a direct influence on final properties. In this work, isothermal compression experiments were conducted on this ultra-high-strength nickel-based corrosion-resistant alloy using a Gleeble thermal simulator at 1000–1150 °C and strain rates of 0.01–10 s−1. Electron backscatter diffraction (EBSD) was used to quantify grain size, grain-boundary misorientation, kernel average misorientation (KAM) and the DRX volume fraction. The results indicate that higher deformation temperature generally accelerates DRX, lowers the KAM value and increases the recrystallized-grain fraction. Under a constant deformation temperature, the DRX volume fraction changes non-monotonically with strain rate, showing an initial increase followed by a decrease. Based on the EBSD-derived DRX fractions, linear and quadratic single-parameter models using the Zener–Hollomon parameter were examined first, but neither provided satisfactory fitting accuracy. A two-variable empirical model was therefore formulated for a fixed true strain of ε = 0.92 by considering deformation temperature and strain rate separately. The predicted values agree well with the experimental data, giving R2 = 0.91278 and an average relative error of 8.53%. The proposed model captures the main variation tendency of the DRX volume fraction within the studied processing window and provides a useful basis for microstructure control and hot-working parameter design for ultra-high-strength nickel-based corrosion-resistant alloys.

1. Introduction

Ultra-high-strength nickel-based corrosion-resistant alloys are designed for structural components that must retain high strength and corrosion resistance in harsh oil and gas environments. Their yield strength can exceed 1400 MPa, and their resistance to media containing H2S, CO2 and chloride ions makes them suitable for downhole and offshore components such as flow-channel converters and steering shafts in rotary steering tools. As service requirements for strength, toughness and lifetime continue to increase, understanding and controlling microstructural evolution during hot working have become essential for this class of alloys [1,2,3,4,5].
During hot deformation, the material response is controlled by the balance between strain hardening and thermally activated softening. Dynamic recrystallization (DRX) is a key softening process under medium- and high-temperature deformation conditions [6,7]. Through the formation and growth of new, relatively strain-free grains, DRX releases stored deformation energy and modifies grain morphology, thereby affecting plasticity, strength and later service behavior [8,9,10]. A detailed evaluation of DRX under different thermal–mechanical parameters is therefore necessary for optimizing the hot-working route of ultra-high-strength nickel-based corrosion-resistant alloys.
Studies on the hot deformation of 1400 MPa-grade corrosion-resistant nickel-based alloys have mainly addressed flow-stress behavior, constitutive modeling, processing maps and finite-element simulations. For example, Liao et al. [11] investigated this alloy family at 900–1060 °C and 0.001–0.5 s−1, proposed a power-law model for DRX grain-size prediction, and discussed the competition between continuous and discontinuous DRX as well as the effect of δ-phase dissolution on softening behavior. Their analysis, however, emphasized recrystallization mechanisms and grain-size prediction rather than a direct quantitative description of the DRX volume fraction as a function of hot deformation variables. Elekyabi et al. [12] used experiments and DIGIMU full-field simulations to study temperature-path effects on the DRX fraction and grain structure of Inconel 718 during non-isothermal forming. These results highlight the importance of transient temperature, but systematic work on the evolution and prediction of DRX volume fraction in ultra-high-strength corrosion-resistant nickel-based alloys remains limited.
Although nickel-based alloys have been widely studied during hot deformation, available work is still dominated by constitutive equations, flow-stress analysis, processing maps, numerical simulations and grain-size models. Compared with these topics, predictive modeling of the DRX volume fraction is less mature, particularly for ultra-high-strength nickel-based corrosion-resistant alloys used in severe oilfield environments.
The alloy considered here differs from conventional nickel-based superalloys because it combines a very high-strength level with a complex alloying system containing Cr, Nb, Mo, Ti and Al. Solute atoms and residual MC-type carbonitrides can affect dislocation storage, solute drag, boundary mobility and the nucleation and growth of recrystallized grains. As a result, the relative contributions of dynamic recovery, DRX nucleation and grain-boundary migration may not follow the same pattern as in more conventional nickel-based alloys. A focused investigation of the hot deformation microstructure of this alloy is therefore required for reliable process optimization.
The Zener–Hollomon parameter is often used to combine the effects of temperature and strain rate into a single deformation parameter. However, if the DRX volume fraction varies non-monotonically with strain rate, such a single-parameter description may obscure the separate and interactive roles of temperature and strain rate. In this study, single-Z-parameter descriptions are first tested, and a two-variable empirical formulation is then developed. The main contribution is to clarify how deformation temperature and strain rate jointly affect the DRX volume fraction and to show the limitation of relying only on a conventional Z-based representation for this alloy.
Accordingly, hot compression tests combined with EBSD characterization were carried out to examine microstructural changes in the ultra-high-strength nickel-based corrosion-resistant alloy at different deformation temperatures and strain rates. EBSD-derived DRX volume fractions were used to assess the applicability of Zener-Hollomon-based single-parameter models. A two-variable empirical model using temperature and strain rate was then established to describe the measured variation in DRX volume fraction quantitatively.

2. Experimental Materials and Methods

2.1. Experimental Materials

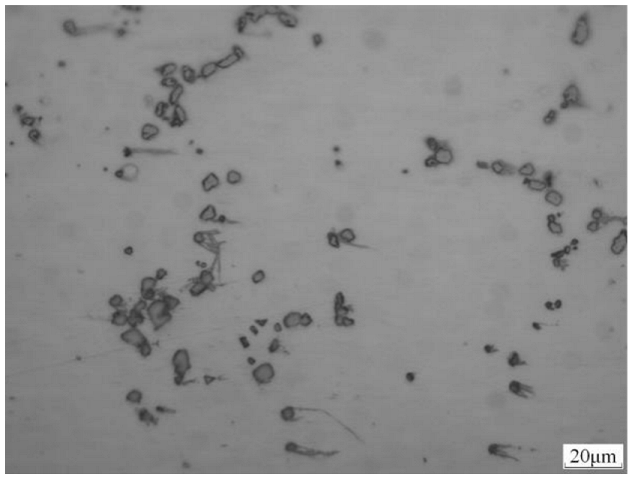
The material investigated in this work was an ultra-high-strength nickel-based corrosion-resistant alloy. Cylindrical compression specimens with a diameter of 8 mm and a height of 12 mm were machined from a Φ260 mm homogenized as-cast ingot. Microstructural observations and statistical measurements were then performed after different hot deformation conditions in order to evaluate the influence of temperature and strain rate on DRX behavior. Table 1 gives the alloy composition, and Figure 1 presents the starting microstructure.
The homogenized Φ260 mm as-cast ingot exhibits a relatively uniform matrix, as shown in Figure 1. Typical dendrite arms and interdendritic segregation from casting are no longer visible after homogenization. The matrix appears light gray and lacks obvious grain-boundary contrast, while the dark particles are mainly incompletely dissolved MC-type carbonitrides, primarily NbC, with sizes mostly between 1 and 5 μm. These particles are blocky, polygonal or locally fragmented, and slight clustering can be observed in some regions. Such a homogenized matrix provides a consistent initial state for subsequent isothermal compression, whereas the remaining carbonitrides may restrict abnormal grain growth through boundary pinning during hot deformation.

2.2. Thermal Compression Experimental Equipment

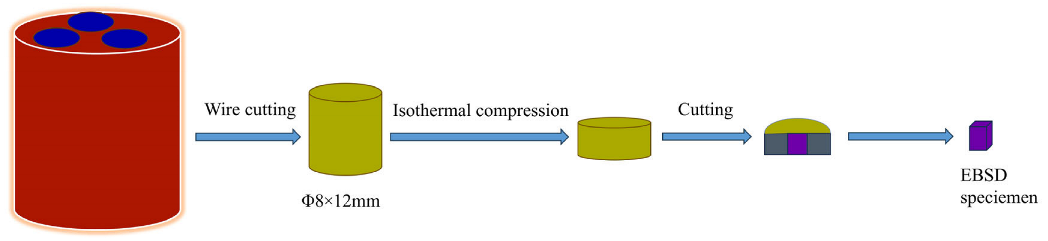
Thermomechanical compression experiments were performed on a Gleeble 3800-GTC simulator (Dynamic Systems Inc., Albany, NY, USA). The system permits independent control of specimen temperature, deformation rate and total strain, making it suitable for reproducing the coupled thermal–mechanical conditions experienced during hot working. Isothermal constant-strain rate compression tests were conducted at the selected temperatures and strain rates. The complete experimental route is illustrated in Figure 2.

2.3. Hot Compression Parameters and Procedure

The Φ260 mm as-cast alloy ingot was sectioned by wire cutting into cylindrical samples of Φ8 mm × 12 mm. The two end faces were carefully ground to obtain flat and parallel surfaces, with the parallelism error controlled below 0.02 mm. Four deformation temperatures (1000, 1050, 1100 and 1150 °C) and four strain rates (0.01, 0.1, 1 and 10 s−1) were selected. Each specimen was compressed to a height reduction of 60%, corresponding to a true strain of ε = 0.92.
All compression tests were carried out on the Gleeble 3800-GTC system. Samples were heated to the target temperature at 10 °C/s and held for 5 min to reduce thermal gradients before deformation. Uniaxial compression was then applied at the preset strain rate to reach the 60% height reduction. Immediately after compression, the specimens were water-quenched to retain the high-temperature deformation microstructure and suppress post-deformation static recrystallization or grain growth. Tantalum and graphite sheets were placed between the specimen and anvils to reduce friction. According to the instrument specification, the temperature measurement error of the Gleeble 3800-GTC is within ±1% of the measured value. Temperature was monitored at the specimen center using a spot-welded K-type thermocouple, and the feedback control accuracy during testing was maintained within ±1 °C.

2.4. EBSD Characterization and Microstructure Statistics

After deformation, each specimen was cut along the compression axis, and the longitudinal section was selected for EBSD observation. The surface preparation procedure was as follows [13,14]:
The observation surfaces were mechanically ground using 240#, 400#, 800#, 1200# and 2000# SiC papers to remove cutting marks and oxide layers. Electrolytic polishing was then performed in a solution of 10 vol.% HClO4 and 90 vol.% C2H5OH at 20 V and −20 °C for 30–60 s. This treatment removed the mechanically damaged surface layer and produced a surface suitable for EBSD indexing. EBSD data were collected using a Zeiss Sigma 300 field-emission scanning electron microscope (Carl Zeiss AG, Oberkochen, Germany) equipped with a NordlysNano EBSD detector (Oxford Instruments, Abingdon, UK). The accelerating voltage, working distance and step size were 20 kV, 15 mm and 1.4 μm, respectively. Each mapped region was at least 500 μm × 500 μm and contained more than 300 grains, improving the statistical representativeness of the microstructural measurements.
Channel 5 software was used to process the EBSD datasets. Recrystallized and deformed grains were identified by grain orientation spread (GOS), and grains with GOS values below 2° were classified as recrystallized grains [15]. Grain boundaries were grouped by misorientation angle: boundaries above 15° were regarded as high-angle grain boundaries (HAGBs), whereas boundaries between 2° and 15° were considered low-angle grain boundaries (LAGBs). Kernel average misorientation (KAM) was also calculated to evaluate local orientation gradients and dislocation accumulation inside grains.

2.5. DRX Volume Fraction Determination

The DRX volume fraction was required as the dependent variable for model development. Recrystallized regions were identified from EBSD data under each deformation condition, and the measured recrystallized area fraction was used to approximate the DRX volume fraction. In this way, DRX fractions at different temperatures and strain rates were obtained at the fixed final strain of ε = 0.92 and used as the experimental basis for the prediction model.
The value ε = 0.92 was chosen because it is the final strain corresponding to the 60% height reduction used in all compression tests. At this deformation level, DRX had been activated and had developed to different extents under most of the selected conditions. Keeping the final strain constant removes strain as an additional variable, so the separate effects of deformation temperature and strain rate on DRX fraction can be compared more clearly. Thus, the present model should be interpreted as an empirical description valid at ε = 0.92, rather than as a complete kinetic model over the entire strain range.

3. Results and Discussion

Grain size, grain-boundary character, KAM value and recrystallized-grain fraction were evaluated from the hot compression and EBSD results to clarify how the alloy responds to different deformation parameters. The following sections discuss the influences of temperature and strain rate on DRX from the viewpoint of microstructural evolution. These observations also provide the dataset for developing a DRX volume fraction model.

3.1. Effect of Deformation Temperature on Microstructural Evolution

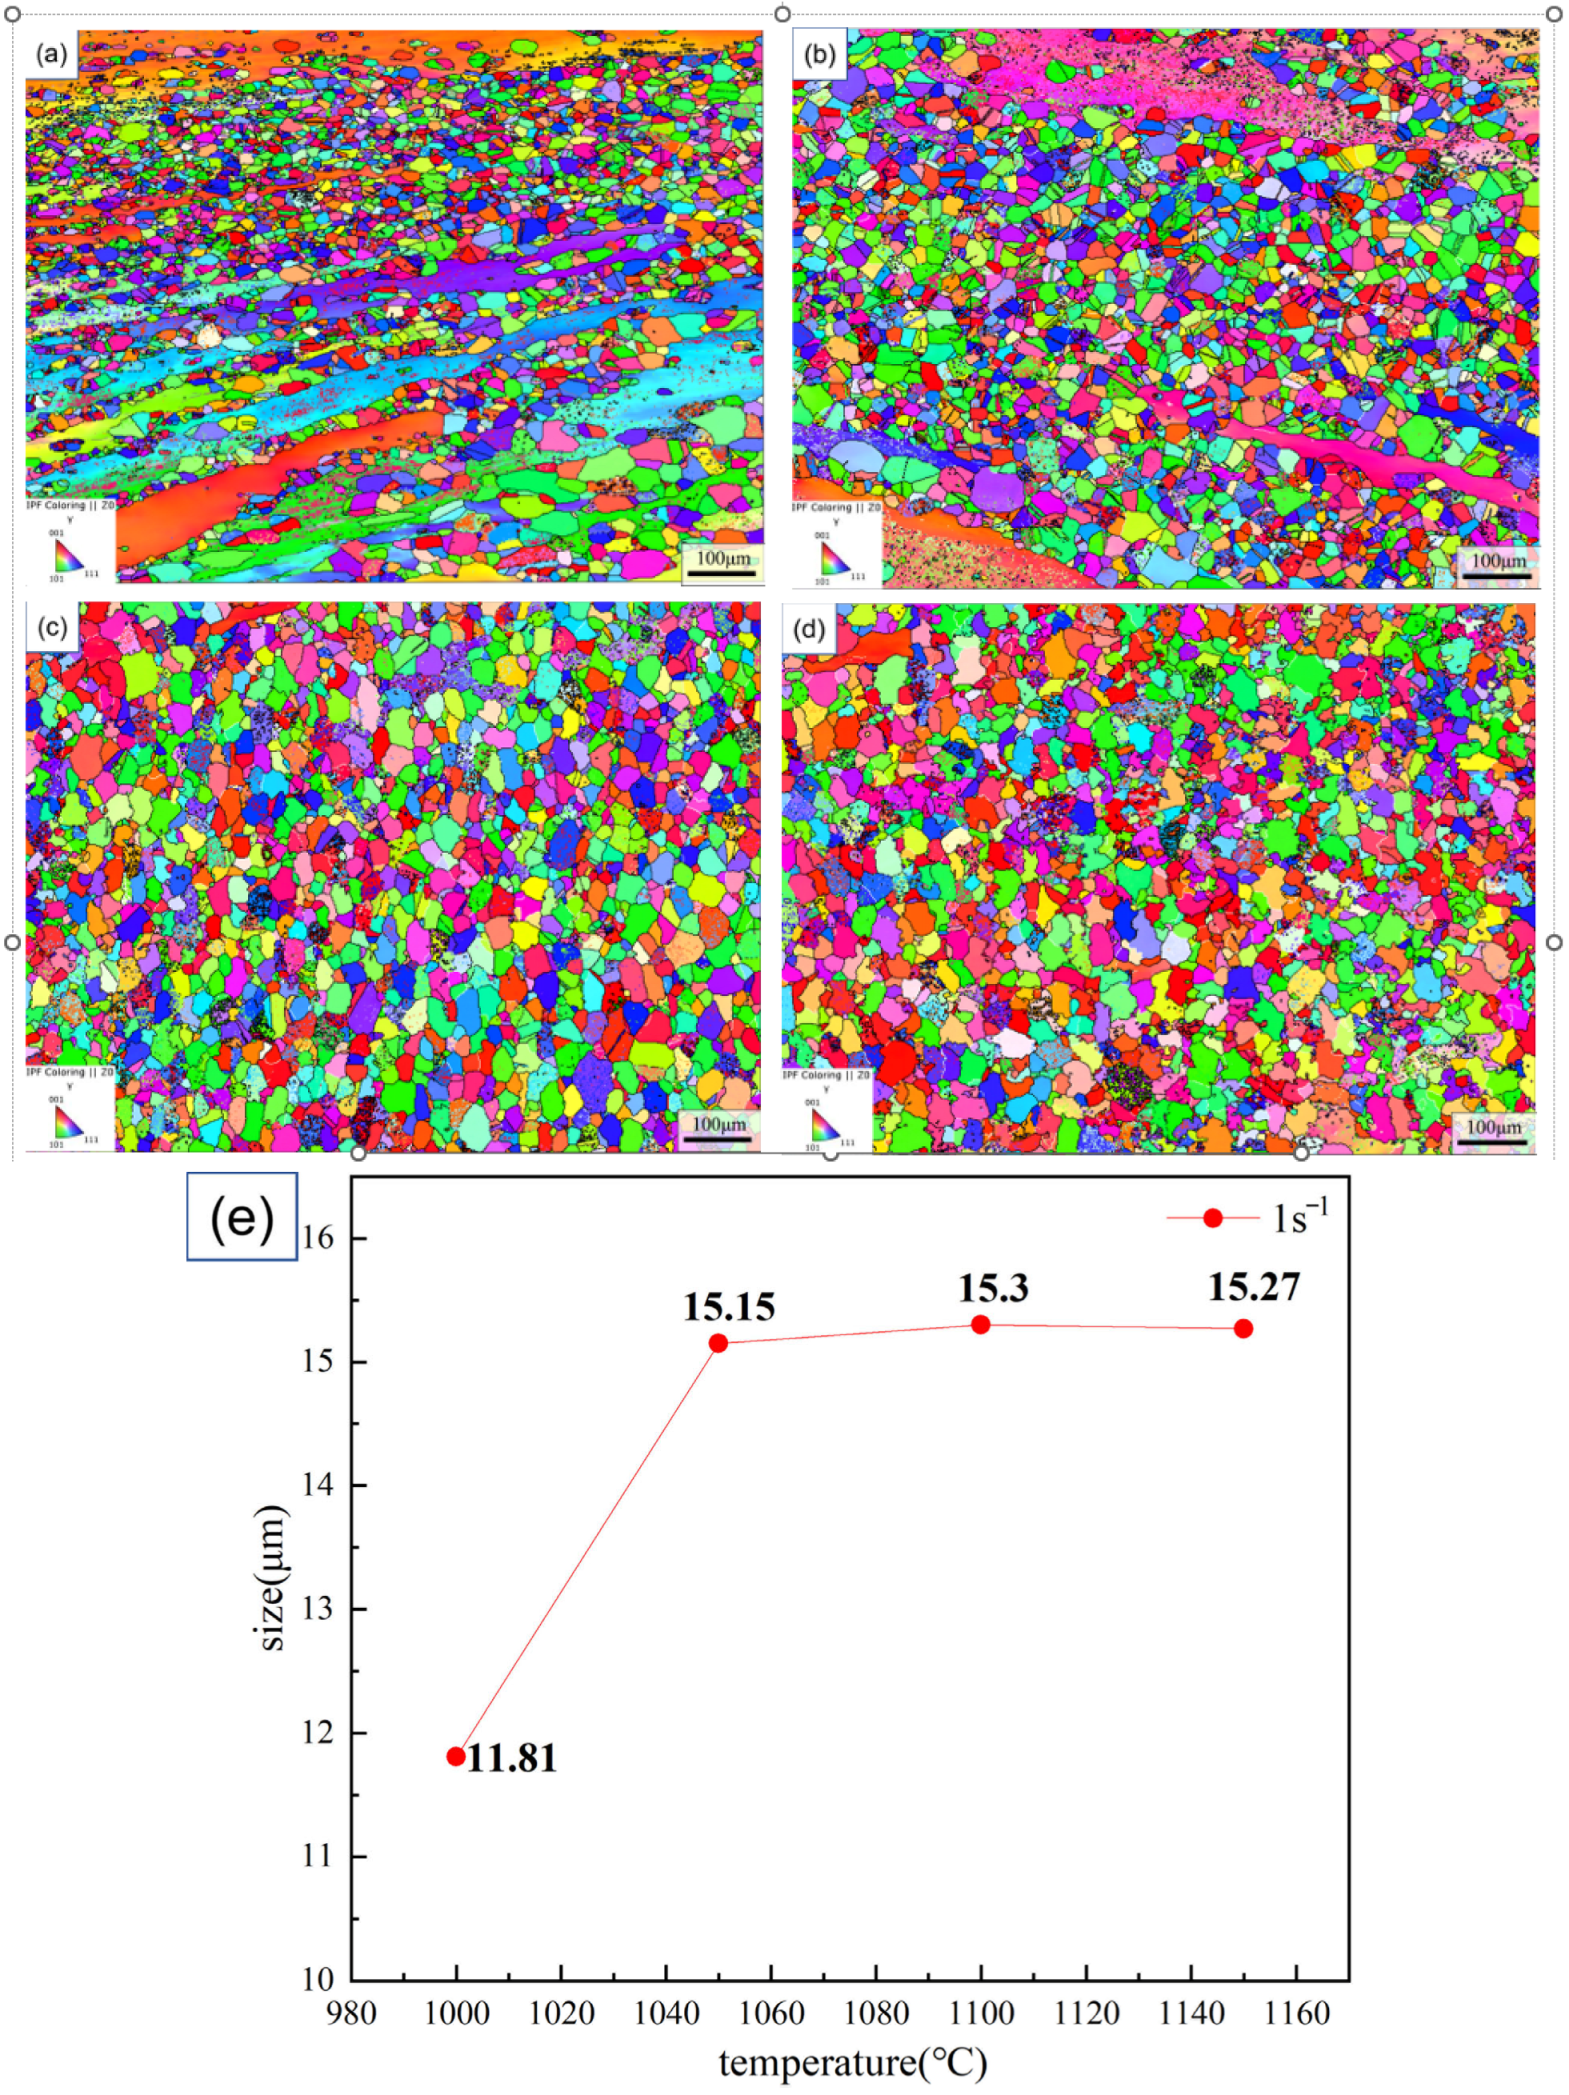
Figure 3 presents the EBSD grain maps and average grain size for specimens deformed at different temperatures at a constant strain rate of 1 s−1. The average grain size increases as the temperature rises. At 1000 °C, grain growth is limited because atomic diffusion and boundary motion are relatively sluggish. Higher temperatures enhance diffusion and promote the growth of newly recrystallized grains, leading to coarser grains. When the temperature is sufficiently high, the grain size tends to level off, suggesting that DRX nucleation and grain growth approach a dynamic balance.
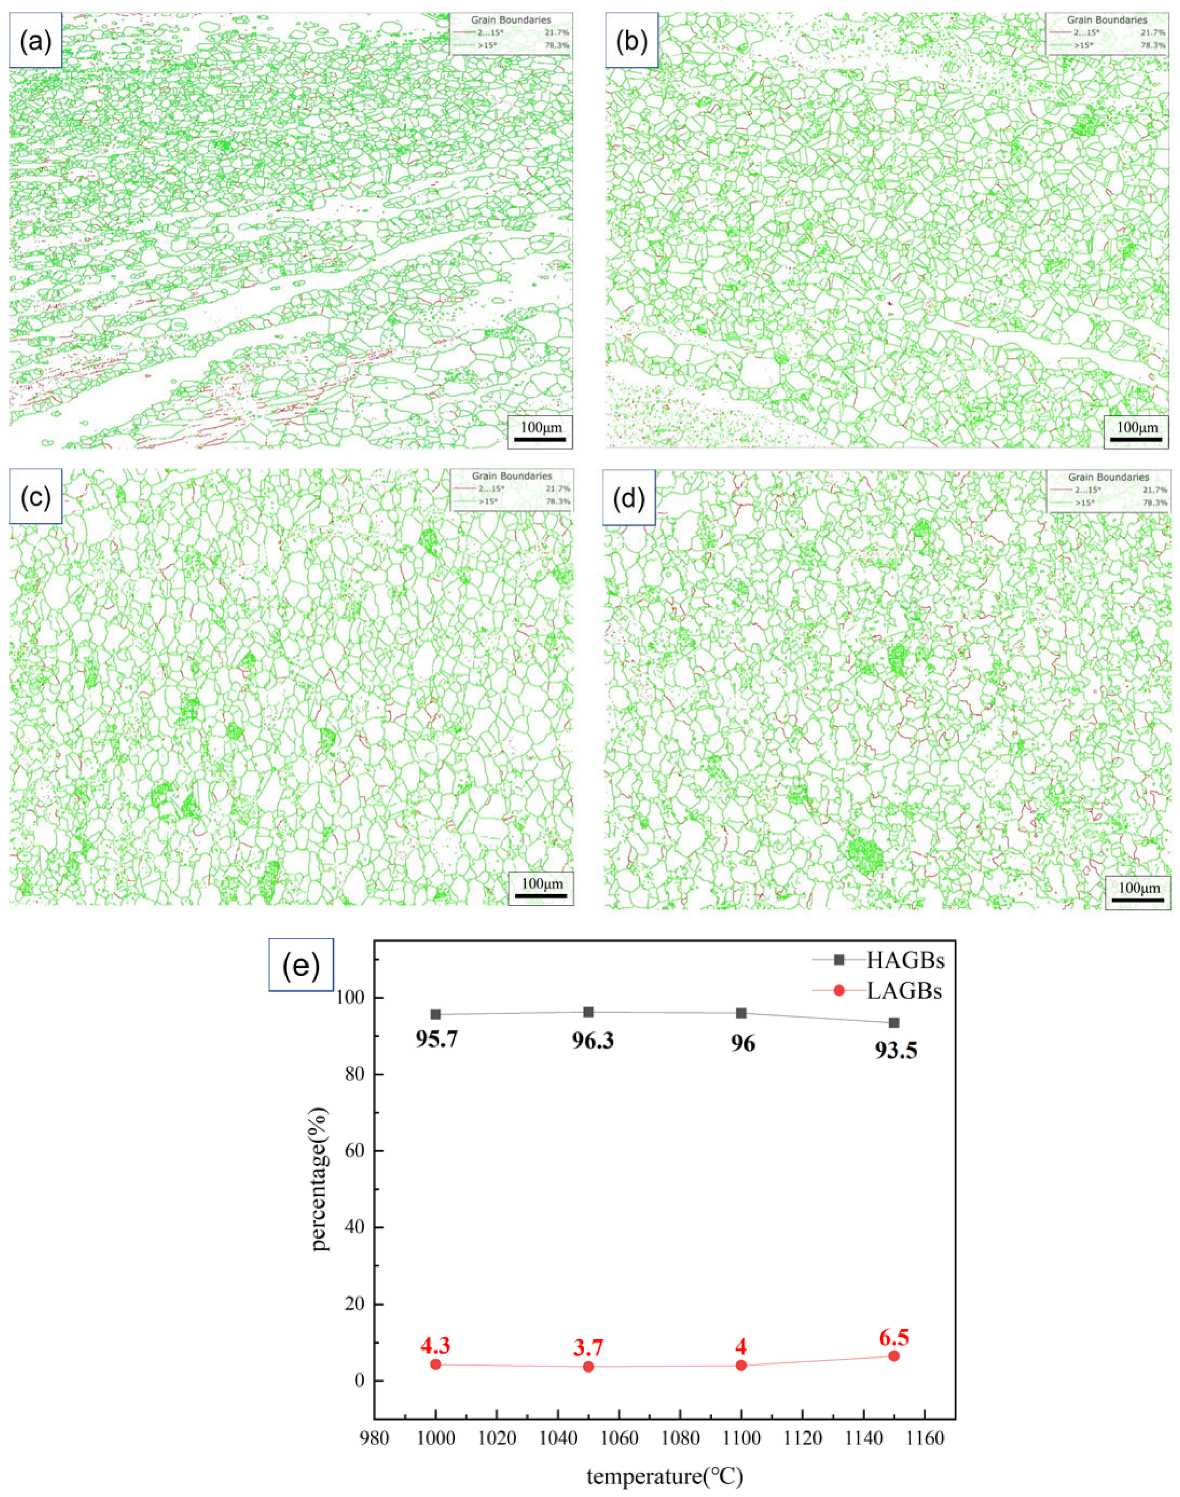
Figure 4 summarizes the grain-boundary misorientation distributions for samples deformed at 1000–1150 °C and 1 s−1. Boundaries with misorientation angles of 2–15° were treated as LAGBs, while those above 15° were classified as HAGBs. A high HAGB fraction is present at all temperatures, which indicates substantial microstructural rearrangement during compression. The HAGB fraction remains high but slightly decreases at the highest temperature, accompanied by a small increase in LAGBs. Therefore, the boundary statistics alone should not be taken as evidence for a simple monotonic increase in DRX; instead, they indicate concurrent recrystallization, dynamic recovery and substructure evolution at elevated temperature.
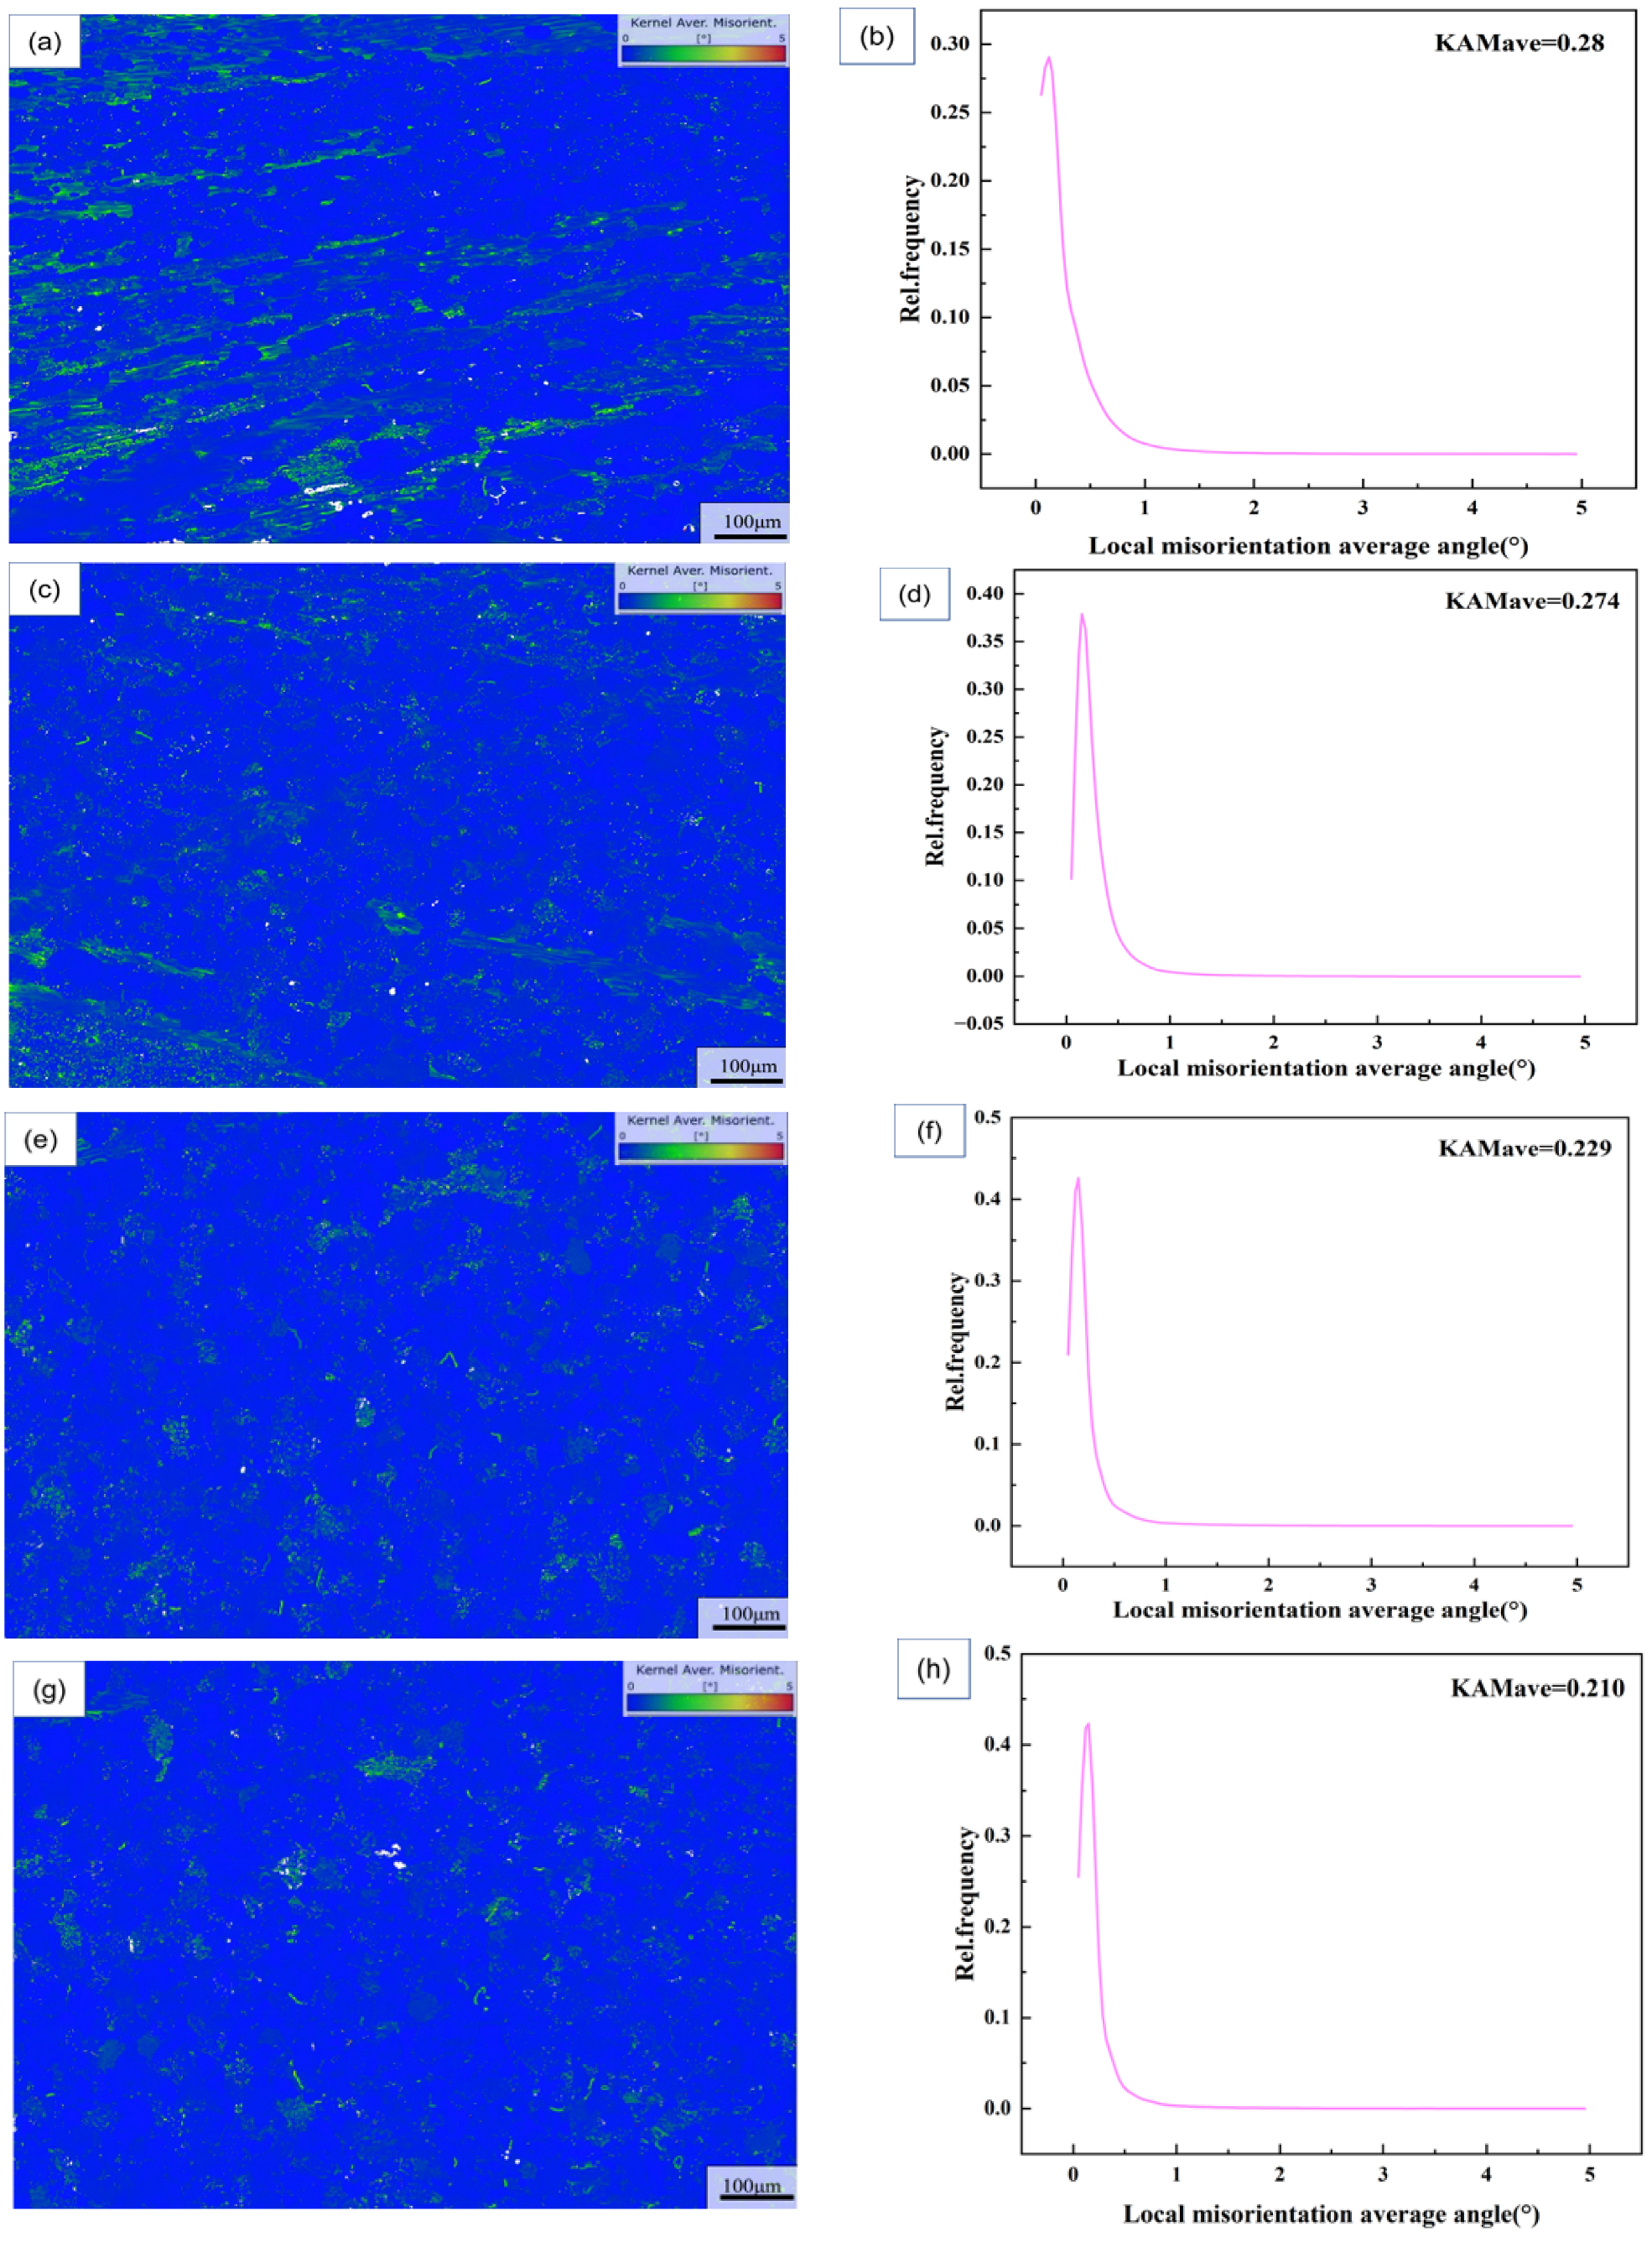
Figure 5 gives the KAM maps and distributions for the same temperature series at 1 s−1. KAM reflects local lattice curvature and is commonly associated with stored dislocation density. With increasing temperature, the average KAM decreases, showing that intragranular distortion and dislocation accumulation are reduced. This behavior can be attributed to enhanced dislocation annihilation, substructure adjustment and boundary migration at higher temperatures. Together with the grain-size and boundary analyses, the KAM results confirm that temperature promotes both dynamic recovery and DRX.
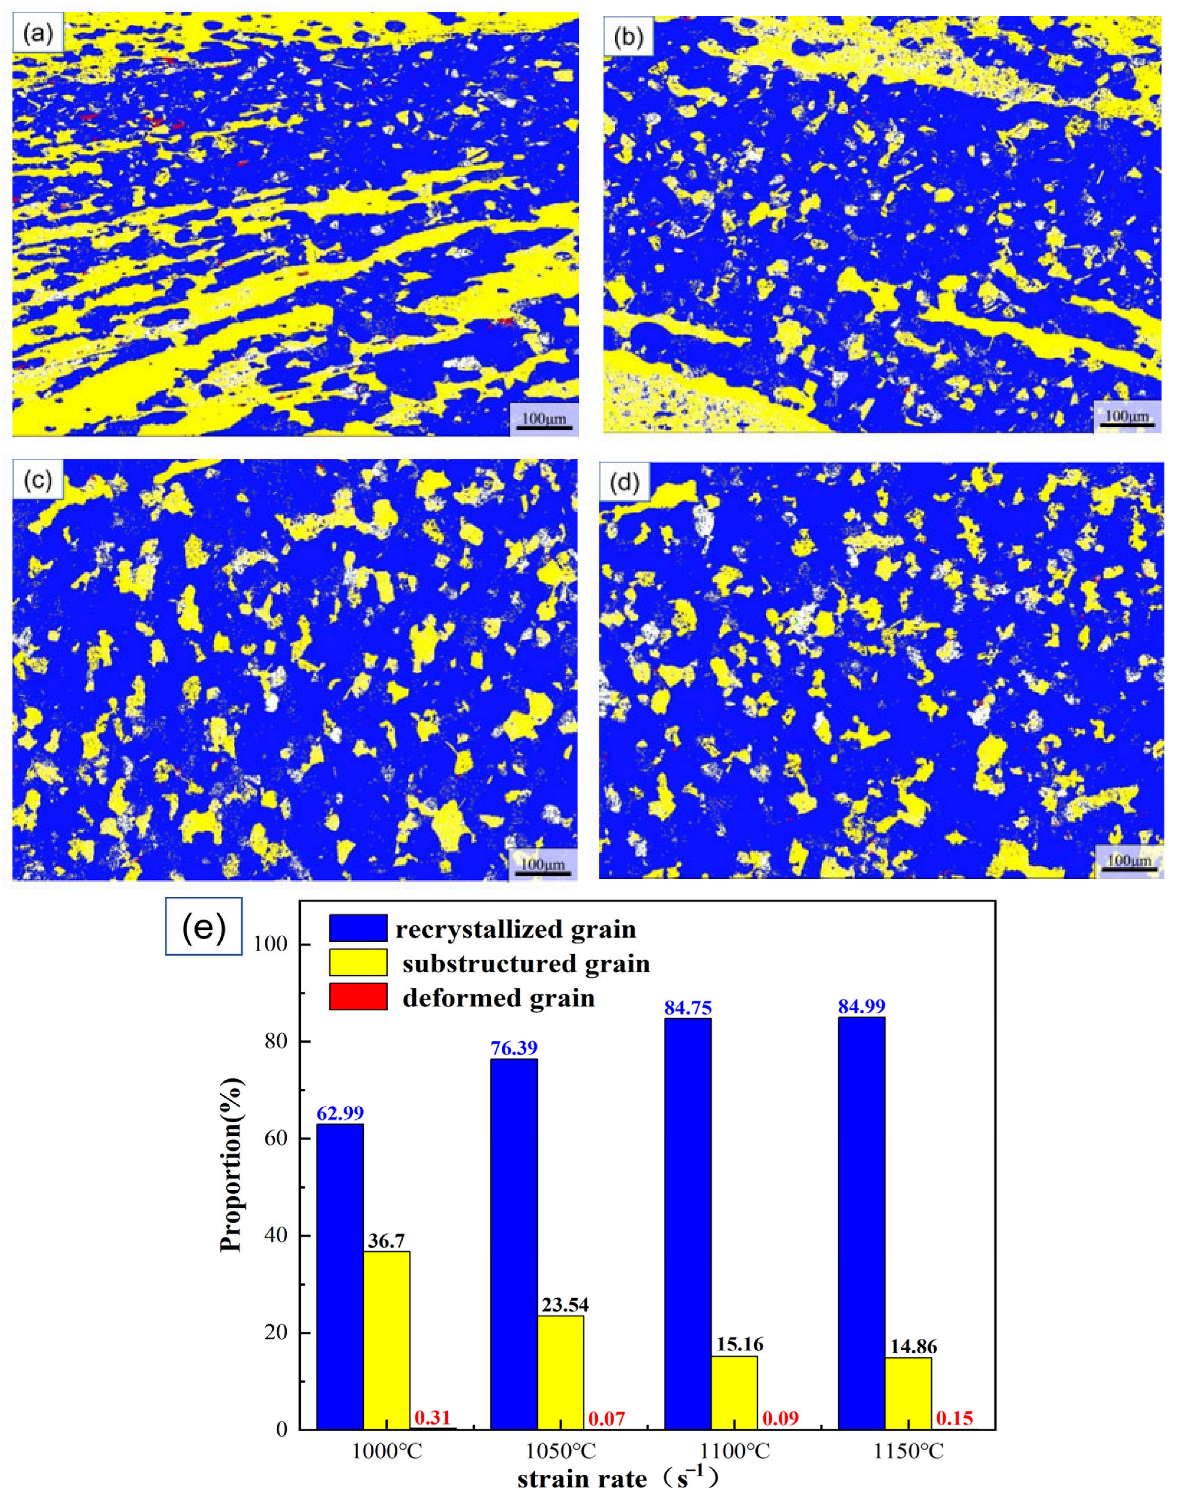
Figure 6 compares the fractions of recrystallized grains, subgrains and deformed grains at different temperatures under the strain rate of 1 s−1. In the EBSD classification used here, grains with GOS < 2° were considered recrystallized grains, grains with GOS > 7° were taken as deformed grains and grains with 2° < GOS < 7° were assigned to the subgrain category. The recrystallized-grain fraction increases with temperature, whereas the fractions of subgrains and deformed grains decrease. These results show that temperature facilitates the formation and growth of recrystallized grains. At the upper end of the tested temperature range, the increase in recrystallized fraction becomes less pronounced, implying that the DRX process tends toward a stabilized state.

3.2. Effect of Strain Rate on Microstructural Evolution

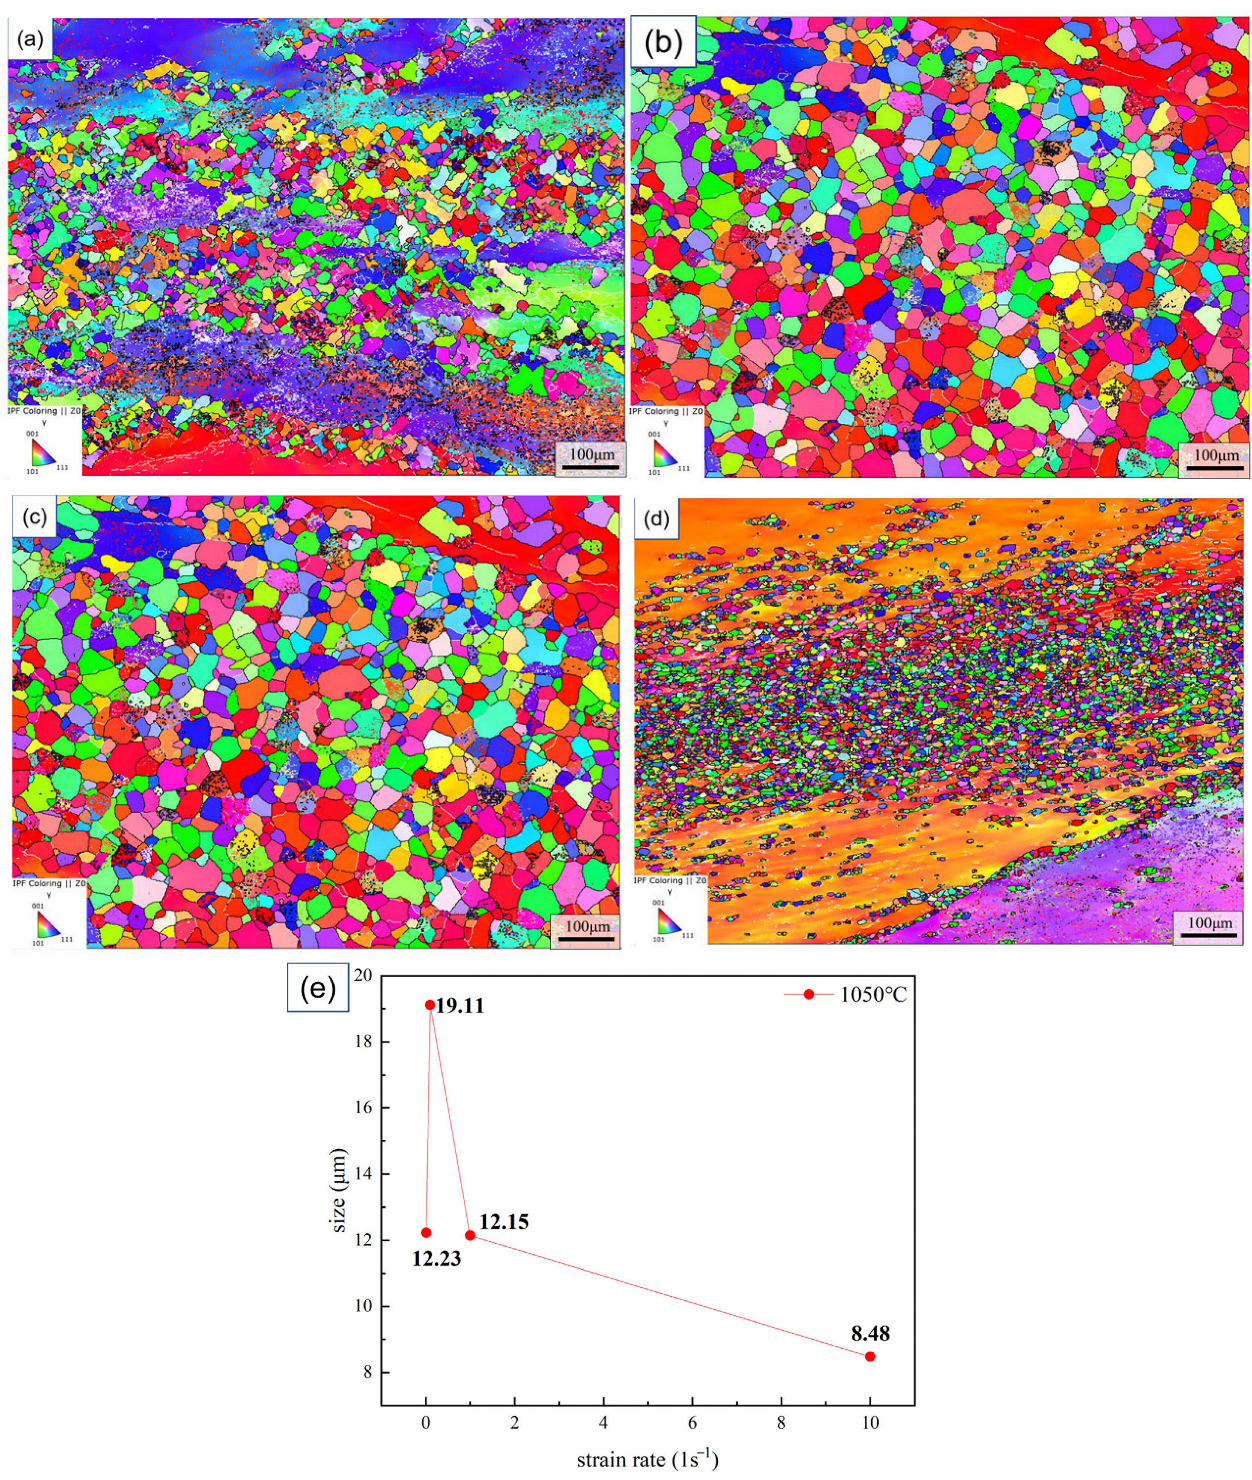
At 1050 °C, changing the strain rate clearly alters grain size and morphology. As shown in Figure 7, the average grain size rises from 12.23 to 19.11 μm when the strain rate increases from 0.01 to 0.1 s−1. With further increases to 1 and 10 s−1, the grain size drops to 12.15 and 8.48 μm, respectively. This non-monotonic response suggests that strain rate affects not only deformation time, but also stored energy, the driving force for recrystallization and the time available for boundary migration. At low strain rates, boundaries can migrate for a longer time and grains may grow more extensively. At high strain rates, deformation proceeds rapidly, dislocations accumulate within a shorter period and the growth of recrystallized grains is restricted, producing a refined microstructure.
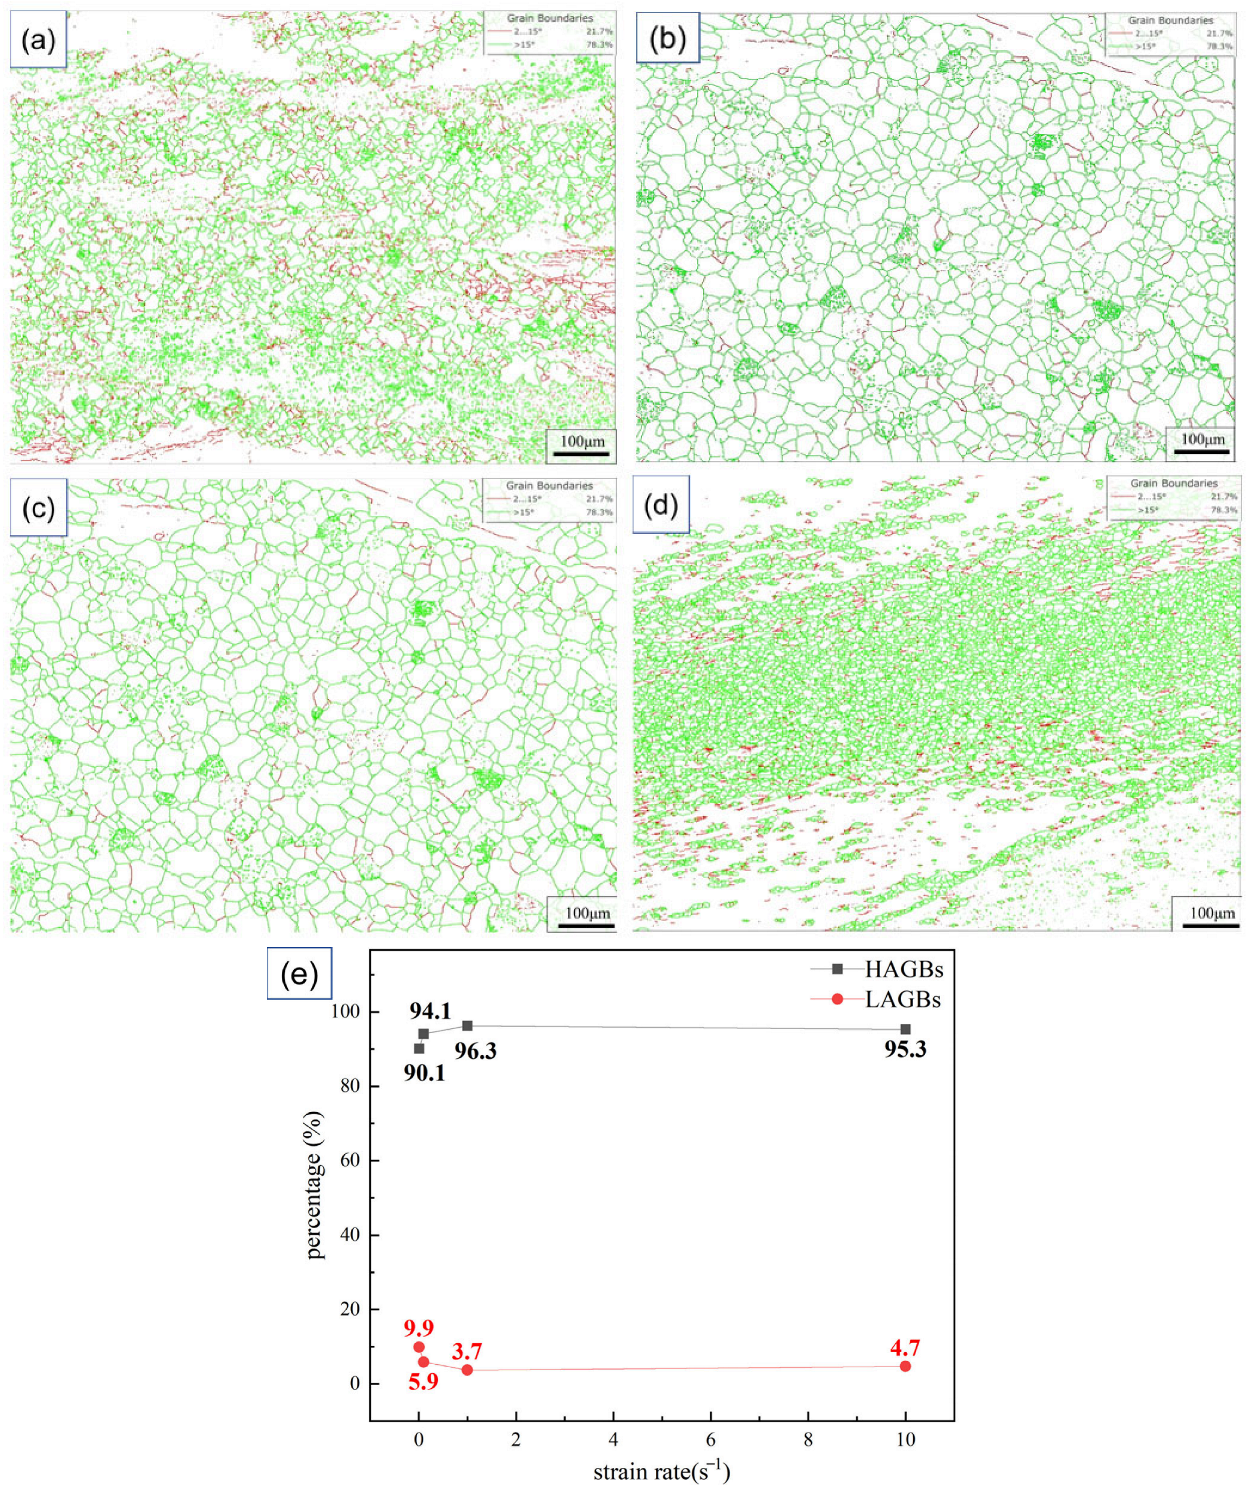
The misorientation statistics in Figure 8 further reveal the strain rate effect at 1050 °C. The HAGB fraction increases initially and then decreases as strain rate rises, with a maximum value of 96.3% at 1 s−1. This trend indicates that an intermediate strain rate favors HAGB formation and DRX development. At very high strain rate, the limited deformation time restricts boundary migration and recrystallized-grain growth, leaving more substructure-related features in the microstructure.
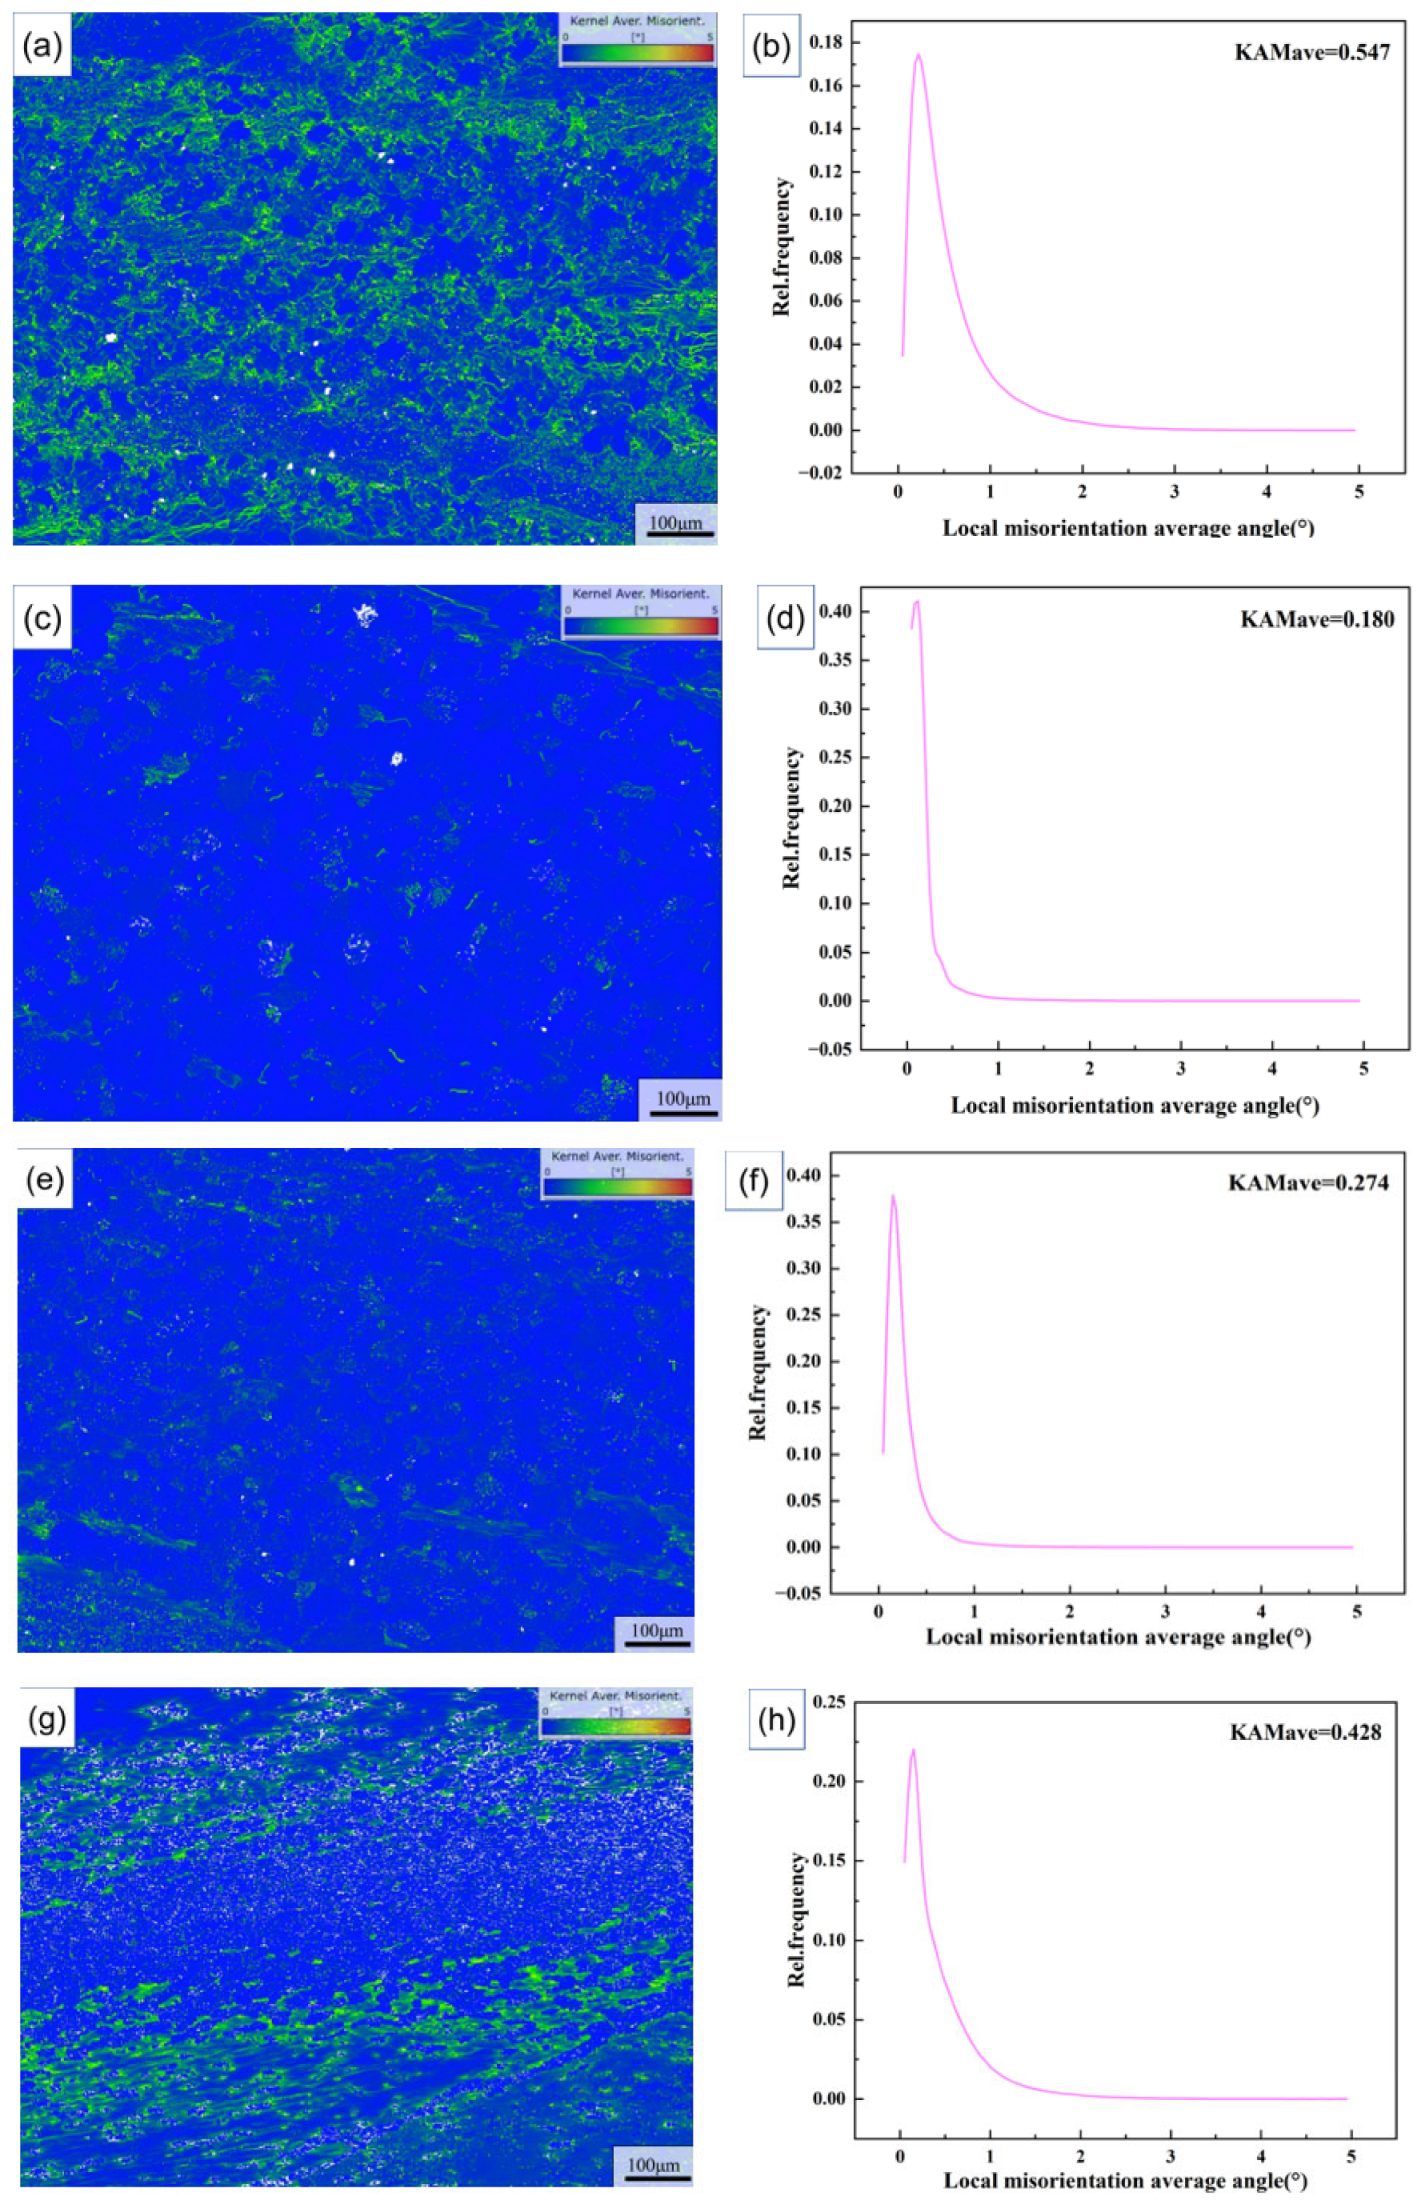
Figure 9 presents the KAM results at 1050 °C for different strain rates. The KAM value decreases first and then increases, reaching a minimum at 0.1 s−1. At low to moderate strain rates, dislocations have more opportunity to rearrange and annihilate, which reduces the local misorientation. When the strain rate becomes high, dislocations are generated and retained over a short deformation time, increasing local orientation gradients. Thus, strain rate affects both recrystallized-grain formation and the storage and release of deformation energy.
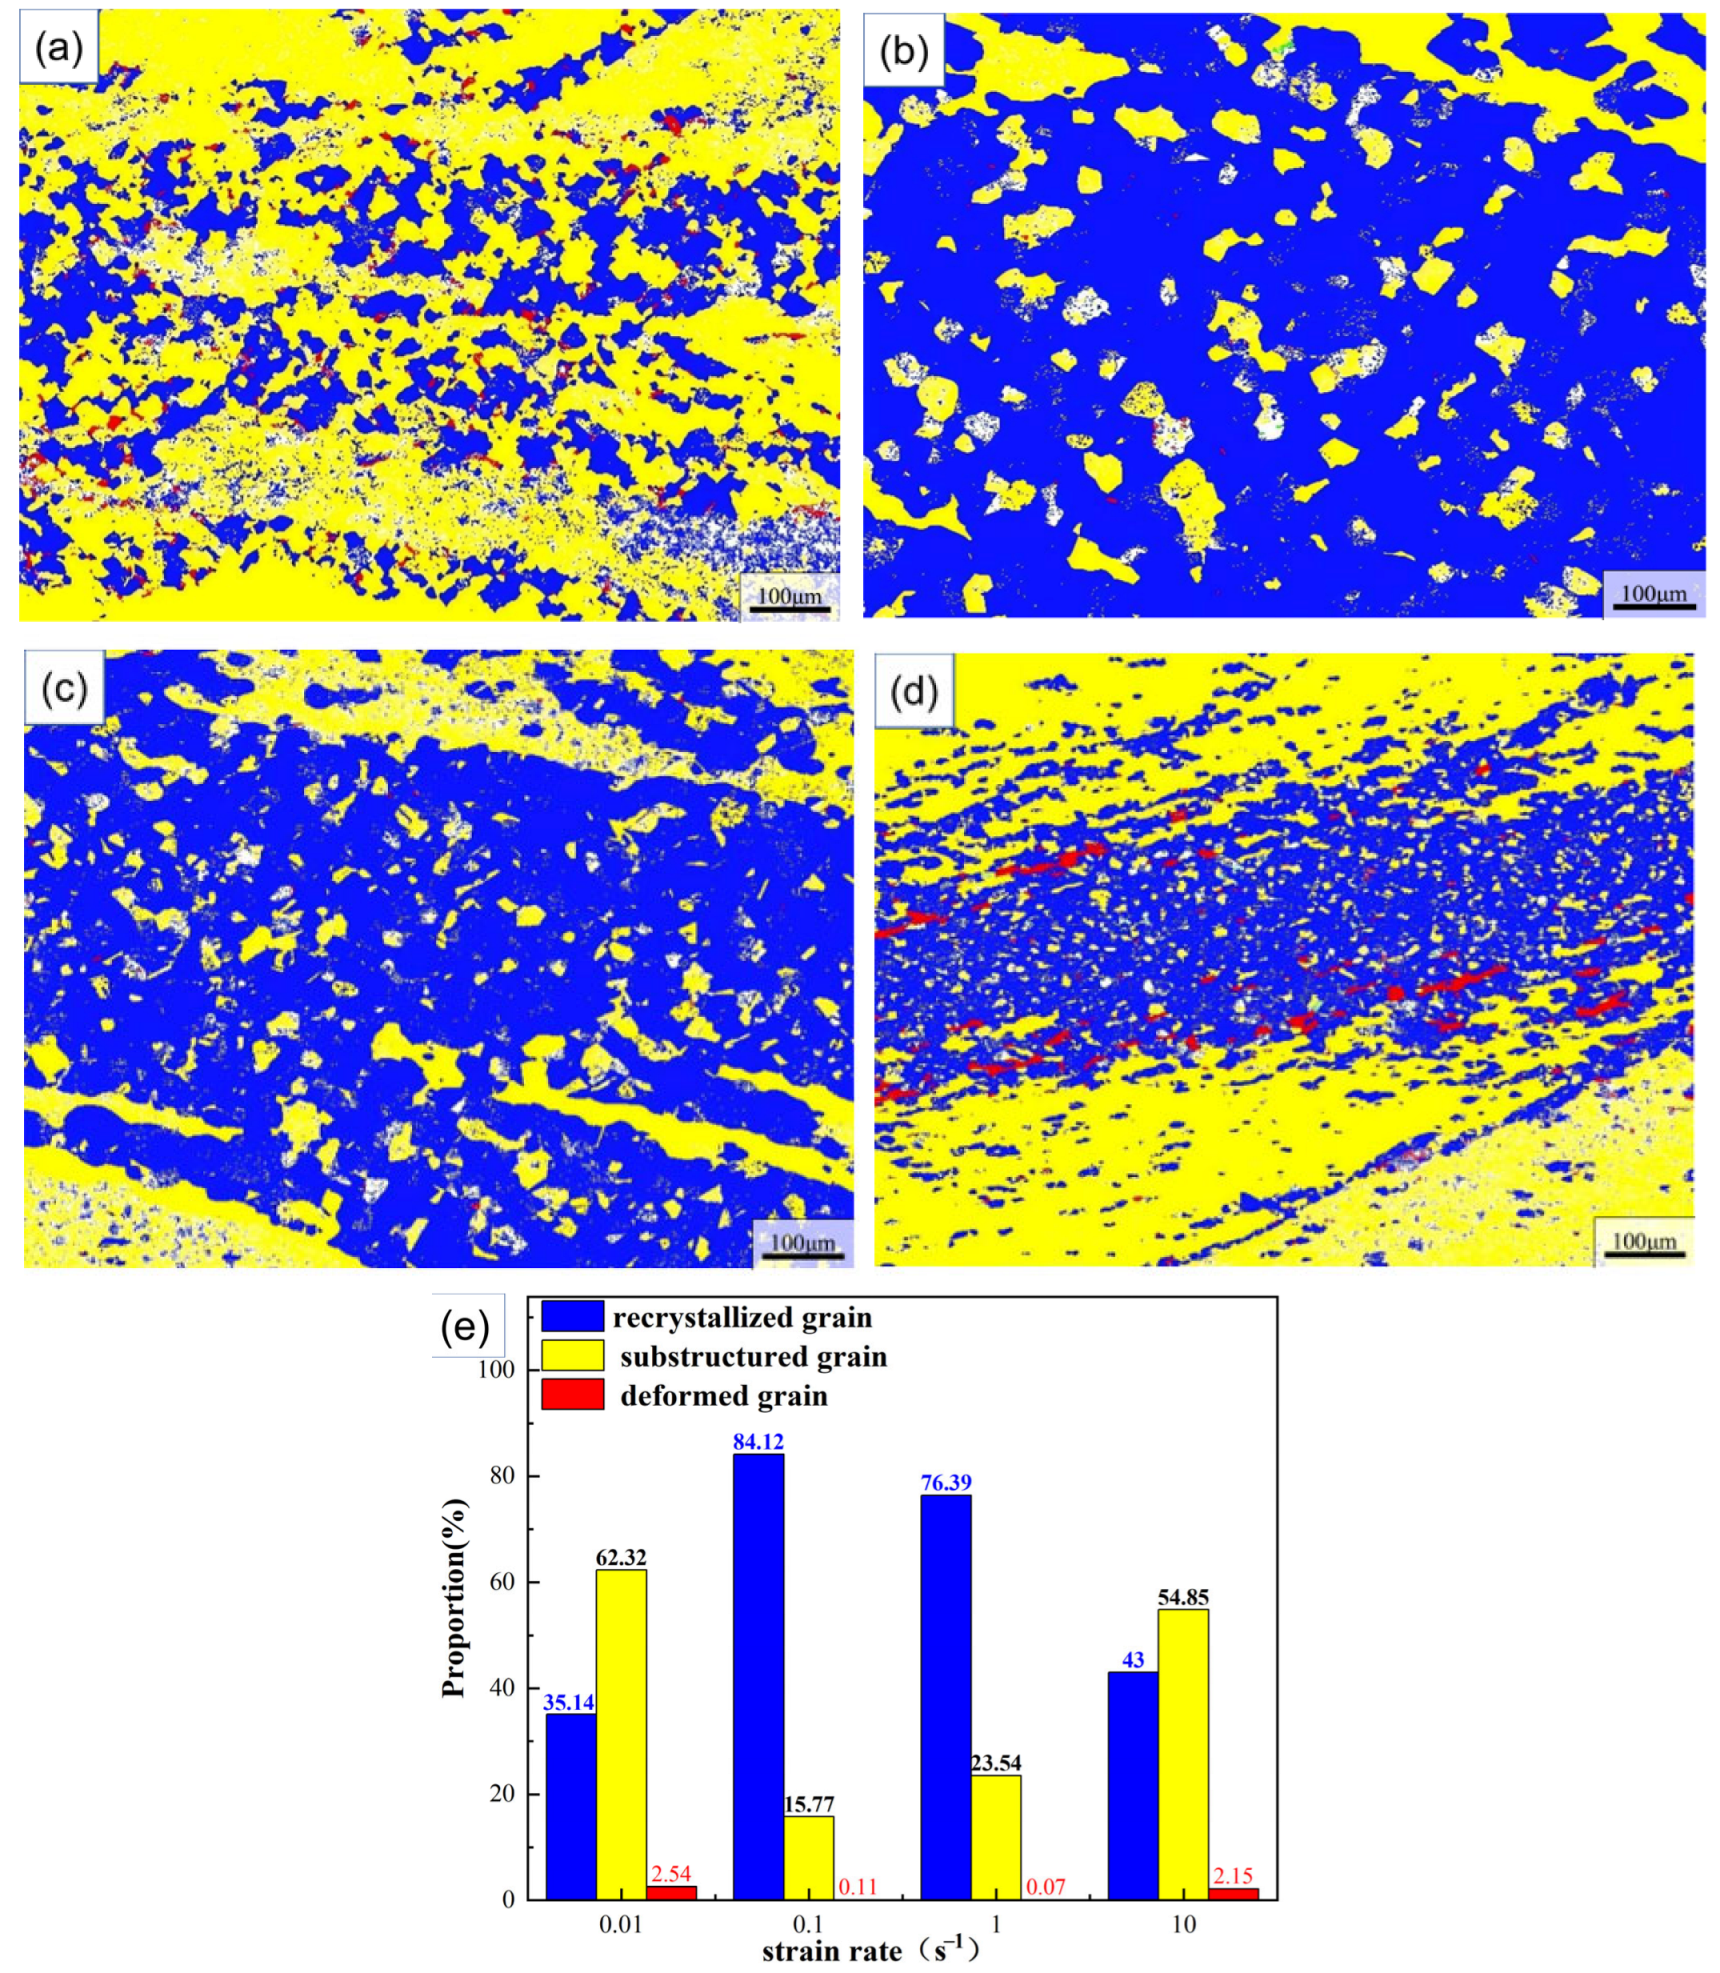
The grain-type statistics in Figure 10 show that the recrystallized fraction increases first and then decreases with strain rate. At low and intermediate strain rates, the material experiences a combination of sufficient stored energy and adequate time for nucleation and growth of recrystallized grains, resulting in a higher DRX fraction. Excessively high strain rate shortens the effective deformation time, restricts boundary motion and suppresses complete DRX development; consequently, the fractions of subgrains and deformed grains increase.
Overall, the EBSD results demonstrate that the alloy is strongly affected by both temperature and strain rate during hot deformation. Increasing temperature generally coarsens grains, decreases KAM and raises the fraction of recrystallized grains, showing enhanced DRX and recovery [16,17]. The effect of strain rate is more complex and non-monotonic, reflecting the competition among recrystallization nucleation, grain growth and recovery-related release of stored energy. These observations provide the physical basis for modeling the DRX volume fraction.
The non-monotonic variation in grain size and DRX fraction with strain rate can be explained by the interplay of dislocation storage, dynamic recovery, DRX nucleation and boundary migration. At 0.01 s−1, the long deformation time promotes recovery and dislocation rearrangement. However, excessive recovery can reduce stored energy and weaken the driving force for DRX nucleation, so the recrystallized fraction does not reach its maximum despite the availability of time for boundary migration.
At intermediate strain rates, such as 0.1–1 s−1, stored energy accumulation and thermally activated boundary motion are more favorably balanced. A sufficient dislocation density provides the driving force for nucleation, while the deformation time remains long enough for recrystallized grains to grow. This combination explains the relatively high recrystallized fraction observed in this range.
At 10 s−1, dislocation storage increases rapidly, but boundary migration and recrystallized-grain growth are limited by the short deformation time. Rapid loading can also intensify local strain heterogeneity. As a result, DRX development is incomplete, the microstructure becomes finer and the recrystallized fraction decreases.
Therefore, the strain rate effect cannot be interpreted simply as a deformation-time effect. It reflects the combined action of stored energy, recovery, nucleation kinetics and grain-boundary mobility. This competition accounts for the maximum DRX fraction at intermediate strain rates rather than a monotonic strain rate response.
These microstructural features form the experimental foundation for the DRX volume fraction model developed below.

4. Development of DRX Volume Fraction Prediction Model

The microstructural analysis above shows that DRX in this alloy depends on deformation temperature and strain rate in a coupled and nonlinear manner. To describe this behavior quantitatively, a prediction model for DRX volume fraction was developed. The Zener–Hollomon parameter [18,19,20,21] was first examined as a conventional single descriptor of the combined temperature–strain rate effect. Because the present DRX fractions were measured at a fixed final strain of ε = 0.92, the dataset is not intended for constructing a full strain-dependent kinetic model. Instead, temperature and strain rate were used as independent variables to build an empirical model at fixed strain, and the prediction accuracy was assessed by comparing calculated and measured DRX fractions.

4.1. Modeling Approach and Variable Selection

During hot deformation, strain hardening occurs together with thermally activated softening. DRX is one of the most important softening mechanisms because it creates new grains and consumes part of the stored deformation energy. The resulting changes in grain structure affect microstructural homogeneity and the balance between strength and toughness. For this reason, the DRX volume fraction is a useful state variable for evaluating hot-working conditions and optimizing process parameters.

4.1.1. Introduction of Zener–Hollomon Parameter

Temperature and strain rate jointly control hot deformation and the associated microstructural changes. For nickel-based superalloys, this combined influence is often expressed through the Zener–Hollomon parameter or through Sellars-type relations, which have been applied to recrystallization and grain-evolution analyses [22,23,24]. In this work, Z was introduced as:
Z = ε ˙ e x p ( Q R T )
where ε ˙ is the strain rate, Q is the activation energy for hot deformation, R is the gas constant and T is absolute temperature.
The hot deformation activation energy used here was taken from a previous Arrhenius-type constitutive analysis of the same alloy and was set to Q = 540.33 kJ/mol.
Because Z varies over several orders of magnitude, direct fitting using Z is inconvenient. The natural logarithm of Z was therefore used to simplify trend identification and model fitting. Taking the logarithm of Equation (1) gives:
l n Z = l n ε ˙ + Q R T

4.1.2. Applicability Analysis of Single-Z-Parameter Model

Equation (2) shows that ln Z contains both the strain rate term and the temperature-dependent term Q/RT. Thus, ln Z can partially represent the coupled temperature–strain rate effect during hot deformation. The relationship between DRX volume fraction (XDRX) and ln Z at ε = 0.92 was first analyzed to determine whether a single-Z-parameter description was adequate for the present dataset.
Linear Model
The dependence of XDRX on ln Z was first described with a linear expression, y = ax + b. The coefficient of determination, R2, was used to assess the fitting result; a value approaching 1 indicates that the regression captures most of the data variation, whereas a value close to 0 indicates weak explanatory capability.
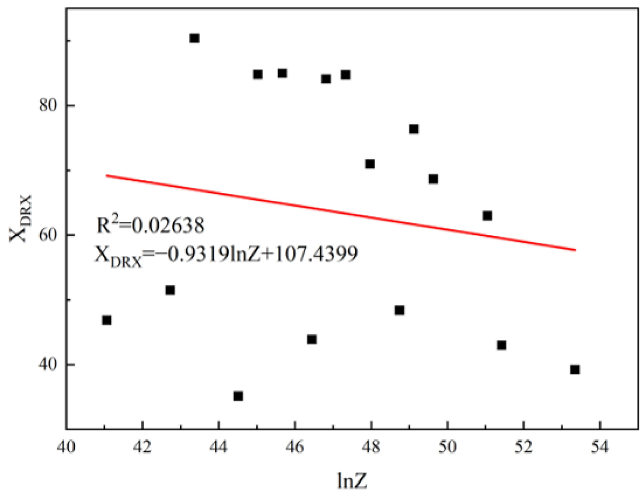
The linear fitting result is presented in Figure 11. Here, ln Z is plotted on the horizontal axis and XDRX on the vertical axis. The data points show pronounced scatter, and the R2 value is only 0.02638. This result demonstrates that a linear function of ln Z alone is unable to describe the DRX volume fraction under the tested conditions.
Quadratic Model
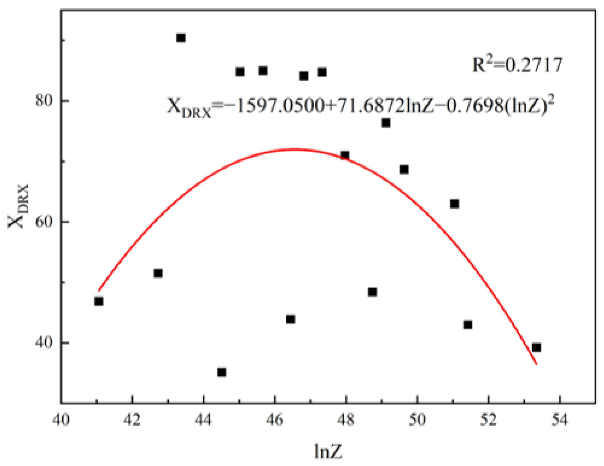
A quadratic function, y = ax2 + bx + c, was then used to fit the relationship between XDRX and ln Z. The resulting equation was XDRX = −1597.5 + 71.6872 ln Z − 0.7698(ln Z)2, as shown in Figure 12. Although the quadratic expression slightly improves the trend description relative to the linear function, the R2 value remains low at 0.2717. Therefore, a single ln Z parameter is still insufficient for quantitative prediction of XDRX at the fixed strain used in this work.
The poor performance of both lnZ-based fittings indicates that temperature and strain rate cannot be compressed into a single parameter without losing important information on DRX evolution. In particular, the non-monotonic strain rate response of XDRX is not reproduced by ln Z alone. The subsequent model therefore retains temperature and strain rate as separate variables, allowing their individual and interactive contributions to be considered.

4.2. Establishment of a Two-Variable Empirical Prediction Model

The measured DRX volume fraction displays a distinct non-monotonic trend, so the single-Z-parameter approach does not capture its evolution adequately. Considering the nonlinear effects of temperature and strain rate, a quadratic response-surface type expression was selected to predict the DRX volume fraction at ε = 0.92. The model was written as follows:
θ = T 1075 50 η = log 10 ε ˙ ,
X DRX = 88.1018 + 14.2784 θ 15.0911 η 7.2200 θ 2 0.0621 θ η   19.0369 η 2 + 0.7768 θ η 3 + 4.9048 θ 2 η + 4.6349 θ 2 η 2 1.8567 θ 3
In the equations, XDRX is the DRX volume fraction (%), T is deformation temperature (°C) and ε ˙ is strain rate (s−1). The normalized variables θ and η represent temperature and strain rate, respectively. By including temperature, strain rate, interaction and higher-order terms, the model can describe the nonlinear DRX response at the selected fixed strain.
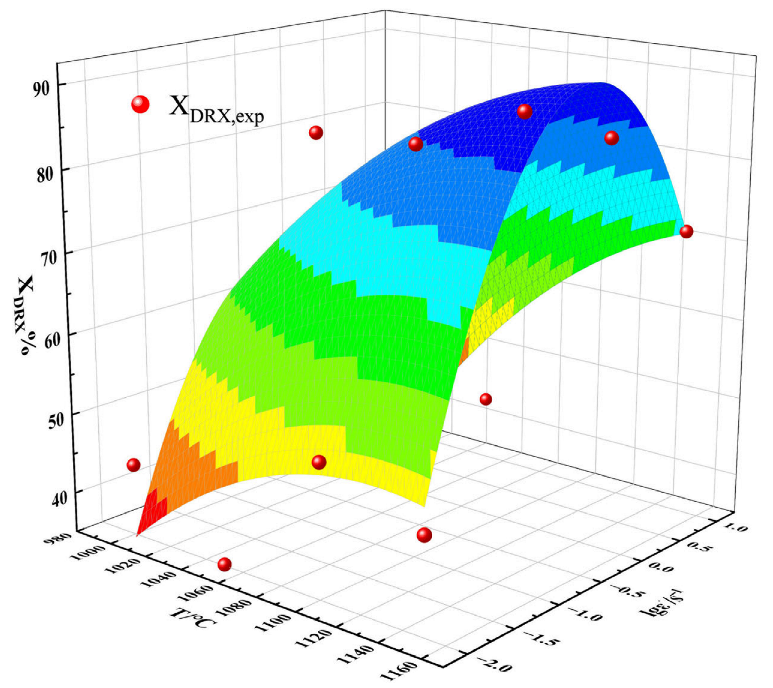
Figure 13 compares the fitted response surface with the experimental DRX data. The surface corresponds to the model prediction, while the red markers represent measured values. The distance between a marker and the surface provides a visual indication of the local prediction error and allows the overall fitting performance to be evaluated.
As seen in Figure 13, the two-variable empirical model follows the main variation in DRX volume fraction with temperature and strain rate, despite some local deviations. The improvement relative to the single-Z-parameter models shows that retaining temperature and strain rate separately is more appropriate for representing the present data. The model therefore provides a practical tool for estimating DRX fraction within the investigated processing window.

4.3. Model Verification and Error Analysis

4.3.1. Comparison of Experimental and Predicted Values

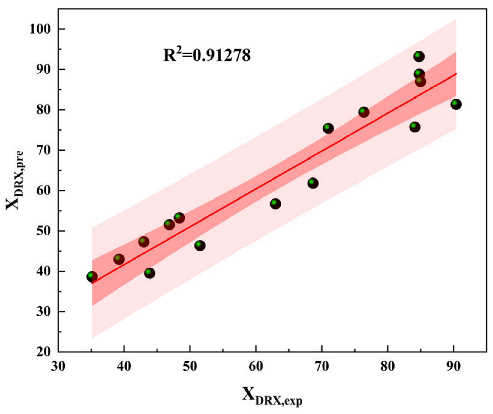
Table 2 compares the measured and calculated DRX volume fractions, and Figure 14 presents the corresponding correlation plot. In Figure 14, XDRX,exp denotes the EBSD-measured value and XDRX,pre denotes the model prediction. Most points cluster close to the ideal prediction line, and the coefficient of determination is R2 = 0.91278, confirming a strong correlation between experiment and prediction. Small deviations at individual conditions may arise from experimental scatter, local microstructural heterogeneity and the nonlinear influence of strain rate.
To further examine model reliability, 95% confidence and prediction intervals were calculated for the regression relationship, as illustrated in Figure 14. The confidence band represents uncertainty in the fitted mean response, whereas the prediction band estimates the range in which future observations are expected to fall. Since most experimental points lie within the prediction interval, the model provides a statistically reasonable description of DRX fraction in the studied deformation range. The relatively narrow confidence band also supports the stability of the fitted relationship.

4.3.2. Error Analysis

As summarized in Table 2 and Figure 14, the relative errors of all data points are below 10%, and the mean relative error is 8.53%. Together with the confidence and prediction interval analysis, these results indicate that the two-variable model has satisfactory prediction capability and statistical reliability for the investigated deformation conditions. The relatively larger errors at several points may be associated with microstructural heterogeneity and the strong nonlinear dependence of DRX fraction on strain rate.
Based on the observed microstructural evolution, a fixed-strain prediction model for the DRX volume fraction of the alloy was established. The Zener–Hollomon parameter was first assessed as a combined representation of temperature and strain rate, but the linear and quadratic ln Z models produced low R2 values. This indicates that the non-monotonic strain rate effect cannot be captured adequately by ln Z alone. By contrast, the two-variable model treats temperature and strain rate as independent inputs and includes interaction and nonlinear terms, which results in better agreement with the measured DRX fractions.

5. Conclusions

Hot compression tests and EBSD characterization were used to investigate DRX behavior and microstructural evolution in an ultra-high-strength nickel-based corrosion-resistant alloy at deformation temperatures of 1000–1150 °C and strain rates of 0.01–10 s−1. The main conclusions are as follows:
At a constant strain rate, increasing the deformation temperature from 1000 to 1150 °C promotes DRX development. The recrystallized-grain fraction rises and the KAM value decreases as temperature increases, indicating enhanced diffusion, boundary migration, dislocation rearrangement and microstructural softening.
At 1050 °C, the DRX volume fraction varies non-monotonically with strain rate, increasing first and then decreasing. Low and intermediate strain rates provide more favorable conditions for dislocation storage, recovery and recrystallized-grain growth, whereas excessive strain rate shortens the available time for boundary migration and suppresses full DRX development.
For the fixed true strain of ε = 0.92, a two-variable empirical model was developed using deformation temperature and strain rate as independent variables. The model incorporates temperature, strain rate, interaction and nonlinear terms and describes the DRX fraction more effectively than single-Z-parameter models. The correlation coefficient R2 = 0.91278 and mean relative error of 8.53% demonstrate acceptable predictive accuracy within the tested processing range.

Author Contributions

D.Z.: Investigation, Data curation, Writing—original draft, Formal analysis. G.M.: Conceptualization, Methodology, Funding acquisition, Writing—review and editing, Supervision, Project administration. P.G.: Resources, Investigation. W.J.: Methodology, Resources, Validation, Investigation. T.Z.: Supervision, Writing—review and editing, Resources, Conceptualization. All authors have read and agreed to the published version of the manuscript.

Funding

This work was supported by the Natural Science Foundation of Chongqing (No. CSTB2024NSCQ-MSX0099), SINOMACH Youth Science and Technology Grant (QNJJ-PY-2024-09) and SINOMACH Research Institute Youth Scientific Research Grant (SINOMAST-QNJJ-2024-01). The APC was funded by Taiyuan University of Science and Technology.

Data Availability Statement

The data that support the findings of this study are available from the corresponding author upon reasonable request.

Conflicts of Interest

Some authors are affiliated with SINOMACH Research Institute. The authors declare that this study received funding from SINOMACH. The funder was not involved in the study design, collection, analysis, interpretation of data, the writing of this article or the decision to submit it for publication. All other authors declare no competing financial interests or personal relationships that could have appeared to influence the work reported in this paper.

References

  1. Sun, Y.; Lian, Y.; Qian, P.; Chen, R.; Zhang, J. Optimized composition design of nickel-based corrosion-resistant alloy for enhanced mechanical properties by integrating experimental design and high-throughput screening. Mater. Today Commun. 2025, 46, 112574. [Google Scholar] [CrossRef]
  2. He, Q.; Pan, F.; Guo, F.; Wang, D.; Liu, H.; Wang, J.; Zhou, D.; Wu, W.; Chai, L.; Ding, Q. Synergistic strengthening by bimodal co-precipitates: Strengthen mechanisms in a new directly aged corrosion-resistance nickel-based alloy. J. Mater. Res. Technol. 2025, 36, 9840–9850. [Google Scholar] [CrossRef]
  3. Rajabinezhad, M.; Bahrami, A.; Mousavinia, M.; Seyedi, S.J.; Taheri, P. Corrosion-Fatigue Failure of Gas-Turbine Blades in an Oil and Gas Production Plant. Materials 2020, 13, 900. [Google Scholar] [CrossRef] [PubMed]
  4. Wang, X.J.; Ji, Y.F.; Niu, J.; Li, X. Effect of variable thickness cross rolling on microstructure gradient of 2205 duple stainless steel. J. Mater. Res. Technol. 2024, 29, 4317–4326. [Google Scholar] [CrossRef]
  5. Zhou, H.; Zhu, Z.; Li, C.; Fang, K.; Chen, Y.; Sui, Y.; Lv, Y.; He, Z. Effect of Iron Ion on Corrosion Behavior of Inconel 625 in High-Temperature Water. Scanning 2020, 2020, 9130362. [Google Scholar] [CrossRef] [PubMed]
  6. Ye, N.; Chen, S.; Yang, B. Understanding unusual evolution of mechanical property for GH4169 superalloy considering δ phase characteristics via crystal plasticity modeling. Mater. Sci. Eng. A 2026, 959, 150009. [Google Scholar] [CrossRef]
  7. Li, Z.; Qi, Q.; Gao, Y. Kinetic modeling and grain refinement mechanisms during static recrystallization of GH4169 superalloy. Mater. Today Commun. 2025, 49, 114095. [Google Scholar] [CrossRef]
  8. Jia, D.; Cheng, X.; Lu, J. Effect of recrystallization on plastic deformation of LPBF-Inconel 718 superalloy: The role of annealing twins. Mater. Charact. 2026, 234, 116199. [Google Scholar] [CrossRef]
  9. Hao, Z.; Xu, Y.; Fan, Y. Electroplasticity-based constitutive modeling and electric pulse-assisted cutting of Inconel 718. Int. J. Impact Eng. 2026, 213, 105690. [Google Scholar] [CrossRef]
  10. Ti, Y.; Liu, L.; Jin, T.; Zhang, Z.; Li, Z. Deformation and failure mechanisms of GH4169 under tension. J. Alloys Compd. 2026, 1053, 186233. [Google Scholar] [CrossRef]
  11. Liao, H.; Gao, L.; Li, P.; Li, Y.; Huang, M.; Ni, W.; Li, M. Dynamic recrystallization mechanisms and phase stability in GH4169 superalloy under thermo-mechanical loading. Mater. Sci. Eng. A 2026, 960, 150128. [Google Scholar] [CrossRef]
  12. Elekyabi, N.; Brüggemann, H.; Scharifi, E. Modeling Transient Temperature-Driven Microstructure Evolution in Inconel 718 during Hot Forming. Solid State Phenom. 2026, 390, 85–96. [Google Scholar] [CrossRef]
  13. Tao, H.; Li, H.Z.; Li, J.H.; Wang, L.; He, W.W.; Tan, X.F.; Zhou, R.; Liang, X.P. Microstructural evolution and dynamic recrystallization mechanisms of additively manufactured TiAl alloy with heterogeneous microstructure during hot compression. Trans. Nonferrous Met. Soc. China 2024, 34, 3208–3220. [Google Scholar] [CrossRef]
  14. Ma, B.; Kang, J.; Wang, L.; Ma, H.; Wu, D.; You, B.; Su, R. Influence of initial elemental microsegregation severity in controlling dynamic recrystallization heterogeneity during hot deformation of high-recycled-ratio GH4169 superalloy. Mater. Sci. Eng. A 2025, 945, 149012. [Google Scholar] [CrossRef]
  15. Le, W.; Chen, Z.; Naseem, S.; Yan, K.; Zhao, Y.; Zhang, H.; Lv, Q. Study on the microstructure evolution and dynamic recrystallization mechanism of selective laser melted Inconel 718 alloy during hot deformation. Vacuum 2023, 209, 111799. [Google Scholar] [CrossRef]
  16. Zhao, P.; Xu, Y.; Zhan, M. Coupled effects of pre-strain and heat treatment on the mechanical response and fatigue performance of Inconel 718 superalloy. J. Mater. Res. Technol. 2026, 42, 861–874. [Google Scholar] [CrossRef]
  17. Buzolin, R.H.; Ferraz, F.M.B.; Lasnik, M.; Krumphals, A.; Poletti, M.C. Improved Predictability of Microstructure Evolution during Hot Deformation of Titanium Alloys. Materials 2020, 13, 5678. [Google Scholar] [CrossRef] [PubMed]
  18. Ma, B.; Jin, W.; Kang, J.; Wu, D.; Ma, H.; You, B.; Gao, S.; Su, R. Hot deformation behavior of GH4169 superalloy with high proportion of recycled material addition and initial dendrite structure. J. Alloys Compd. 2024, 1007, 176352. [Google Scholar] [CrossRef]
  19. Jiao, Y.; Qi, Q.; Gong, Y.; Gao, Y.; Chen, H.; Chen, F.; Zhou, F.; Li, X. Research on hot deformation behavior and microstructure evolution mechanism of GH4169 superalloy. Mater. Today Commun. 2024, 40, 109958. [Google Scholar] [CrossRef]
  20. Xu, X.; Xu, R.; Qiu, C.; Li, W.; Ren, W.; Wang, R.; Zhang, Z.; Ma, S. Hot deformation behavior and microstructure evolution of the Al-2.5at.%Nd alloy. J. Mater. Res. Technol. 2026, 42, 7130–7147. [Google Scholar] [CrossRef]
  21. Kusekar, S.; Dhondapure, P.; Jahazi, M. Microstructural evolution and high-temperature deformation behavior of wire arc additively manufactured Inconel 718 forging Preforms: Toward a hybrid Additive–Forging Process. J. Mater. Res. Technol. 2026, 40, 1364–1380. [Google Scholar] [CrossRef]
  22. Zhao, S.; Cheng, Z.; Yu, W. GH4169 Simulates the Degree of Recrystallization and Grain Growth Model of Different Annealing Processes. J. Mater. Eng. Perform. 2025, 35, 6142–6153. [Google Scholar] [CrossRef]
  23. Jiao, Y.; Qi, Q.; Zhu, X. Coupled mechanisms of grain refinement through subgrain formation and lattice rotation during recrystallization of GH4169 alloy. J. Alloys Compd. 2025, 1030, 180751. [Google Scholar] [CrossRef]
  24. Patnamsetty, M.; Peura, P.; Saastamoinen, A.; Somani, M.C. Constitutive modelling of hot deformation behaviour of a CoCrFeMnNi high-entropy alloy. Sci. Technol. Adv. Mater. 2020, 21, 43–55. [Google Scholar] [CrossRef] [PubMed]
Figure 1. Starting microstructure of the investigated ultra-high-strength nickel-based corrosion-resistant alloy.
Crystals 16 00424 g001
Figure 2. Schematic procedure used for the isothermal constant-strain rate hot compression tests.
Crystals 16 00424 g002
Figure 3. EBSD grain morphology and average grain size after deformation at different temperatures at 1 s−1: (a) 1000 °C; (b) 1050 °C; (c) 1100 °C; (d) 1150 °C; and (e) average grain-size variation.
Crystals 16 00424 g003
Figure 4. Grain-boundary misorientation statistics after deformation at 1 s−1: (a) 1000 °C; (b) 1050 °C; (c) 1100 °C; (d) 1150 °C; and (e) HAGB/LAGB fractions.
Crystals 16 00424 g004
Figure 5. KAM maps and local misorientation distributions for samples compressed at 1 s−1: (a,b) 1000 °C; (c,d) 1050 °C; (e,f) 1100 °C; and (g,h) 1150 °C.
Crystals 16 00424 g005
Figure 6. Grain-type fractions after deformation at different temperatures and 1 s−1: (a) 1000 °C; (b) 1050 °C; (c) 1100 °C; (d) 1150 °C; and (e) statistical comparison of recrystallized grains, subgrains and deformed grains.
Crystals 16 00424 g006
Figure 7. Grain morphology and average grain size for samples compressed at 1050 °C under different strain rates: (a) 0.01 s−1; (b) 0.1 s−1; (c) 1 s−1; (d) 10 s−1; and (e) grain-size trend.
Crystals 16 00424 g007
Figure 8. Grain-boundary misorientation statistics after deformation at 1050 °C: (a) 0.01 s−1; (b) 0.1 s−1; (c) 1 s−1; (d) 10 s−1; and (e) HAGB/LAGB fractions.
Crystals 16 00424 g008
Figure 9. KAM maps and local misorientation distributions for specimens deformed at 1050 °C: (a,b) 0.01 s−1; (c,d) 0.1 s−1; (e,f) 1 s−1; and (g,h) 10 s−1.
Crystals 16 00424 g009
Figure 10. Recrystallized, subgrain and deformed-grain fractions at 1050 °C under different strain rates: (a) 0.01 s−1; (b) 0.1 s−1; (c) 1 s−1; (d) 10 s−1; and (e) grain-type comparison.
Crystals 16 00424 g010
Figure 11. Linear fitting of XDRX as a function of ln Z.
Crystals 16 00424 g011
Figure 12. Quadratic model.
Crystals 16 00424 g012
Figure 13. Response surface of the two-variable empirical model for DRX volume fraction.
Crystals 16 00424 g013
Figure 14. Correlation between measured and predicted DRX volume fractions. Shaded regions show the 95% confidence band and prediction band of the regression model.
Crystals 16 00424 g014
Table 1. Nominal chemical composition of the investigated alloy (mass fraction, %).
ElementNiCrNbMoTiAlCMnFe
Content5521.563.110.70.010.2Remainder
Table 2. Experimental Values and Predicted Values.
Temperature (°C)Strain Rate (s−1)Experimental Value XDRX,expPredicted Value XDRX,preFractional Error (%)
10000.0143.89639.5189.97
10000.1048.39853.2259.97
10001.0062.98756.7069.97
100010.0039.23742.9709.51
10500.0135.14738.6529.97
10500.1084.12375.7349.97
10501.0076.38679.3903.93
105010.0043.00147.2899.97
11000.0151.51346.3769.97
11000.1084.79688.8334.76
11001.0084.75293.2049.97
110010.0068.66661.8189.97
11500.0146.87551.5509.97
11500.1090.39881.3839.97
11501.0084.98987.0082.38
115010.0070.98975.4176.24
average error8.53
Disclaimer/Publisher’s Note: The statements, opinions and data contained in all publications are solely those of the individual author(s) and contributor(s) and not of MDPI and/or the editor(s). MDPI and/or the editor(s) disclaim responsibility for any injury to people or property resulting from any ideas, methods, instructions or products referred to in the content.