1. Introduction
Kidney stones typically form by one of two different general mechanisms [
1,
2,
3]. The first mechanism (the focus of the present study) is free solution crystallization, that is, the formation of well-defined crystals such as calcium oxalate, uric acid (UA), brushite, or cystine. The second mechanism is the formation of attached (to any part of the urinary system) microcrystalline structures consisting of an aggregation of microparticles (apatites and carboxyapatites). In the first case, crystal formation begins with heterogeneous or homogeneous nucleation, and this is followed by crystal growth via molecule-by-molecule (or ion-by-ion) attachment and aggregation (crystals that grew close to each other and impinge, intergrown and twinning, also known as primary aggregation). In the second case, crystal formation begins with the genesis of small ionic aggregates (9–10 atoms, ‘Posner clusters’ [
4,
5]), and this is followed by aggregation into larger spherical structures and, when these are retained, the formation of spherulites or aspidinic structures.
Crystallization inhibitors are molecules that prevent or slow the development of crystalline structures [
6]. The mechanism and efficacy of a crystallization inhibitor depend on the chemistry of the crystal and its mechanism of formation. The formation of a homogeneous crystalline nucleus in solution requires very high supersaturation, and this generally does not occur in the kidney [
7,
8]. For example, homogeneous nucleation of calcium oxalate monohydrate particles in urine (spontaneous nucleation) is negligible when supersaturation is lower than 59 [
9]. When these conditions do occur, leading to homogeneous nucleation, crystallization inhibitors generally lack the capacity to prevent stone formation [
7,
8,
10,
11]. Instead, most renal crystals begin to form by heterogeneous nucleation, in which a pre-existing solid particle (organic or crystalline matter) functions as a heterogeneous nucleant. Stone formation can be blocked by substances that inhibit nucleation, growth, aggregation, or attachment [
12].
There are many well-known inhibitors of crystal growth. These molecules adsorb onto regions of crystal growth (steps, terraces, etc.) and prevent the addition of new growth units [
13]. However, there are some discrepancies regarding the efficacy of the different types of growth inhibitors [
11].
The effect of aggregation inhibitors is considerably more complex [
14]. Thus, in the case of kidney stones composed of calcium oxalate crystals (mono- or dihydrate), UA, or cystine, studies have only rarely demonstrated the presence of secondary aggregates (formed by collisions of individual crystals). Therefore, for these compounds, crystal aggregates form by nucleation of the same phase on an already existing surface of the same phase, but with a certain misalignment. Although secondary crystal aggregates can occur in the urine of some stone-forming individuals [
15], these structures are not generally integrated into the kidney stones. The mechanisms of aggregate formation are only relevant in the formation of apatite or carboxyapatite and struvite kidney stones. The formation of these stones begins with small clusters of phosphate and calcium ions (approximately 10 molecules), known as Posner clusters [
4,
5]. These clusters aggregate to form larger entities that, in the presence of certain proteins, form spherulitic or aspidinic structures. When molecules such as citrate, hydroxycitrate, pyrophosphate, bisphosphonates, or inositol phosphates bind to calcium, they prevent the reaggregation of these structures and inhibit the development of hydroxyapatite deposits [
16]. Furthermore, if hydroxyapatite appears in a colloidal state in plasma or interstitial fluids, it can be eliminated by the liver [
17]. The adsorption of citrate, hydroxycitrate, or inositol phosphates onto these particles increases the negative surface charge, and this prevents aggregation and facilitates removal. In this case, the presence of proteinaceous material in the stone means that the immune system can prevent tissue calcification or the formation of Randall’s plaque [
18,
19].
In the present study, we examined the effect of the level of supersaturation on the efficacy of different crystallization inhibitors in the formation of defined crystalline structures of calcium oxalate, UA, and cystine.
2. Materials and Methods
2.1. Preparation of Solutions
Most experiments were performed using artificial urine solutions that mimicked physiological urine. Cystine crystallizations were performed using an aqueous sodium chloride solution. Different stock solutions were prepared, leading to the same final saline concentration. All solutions were passed through a 0.45 µm pore filter prior to use.
2.2. Artificial Urine for Calcium Oxalate Crystallization
For calcium oxalate crystallization experiments (
Table 1), freshly prepared samples of Solution A and Solution B were filtered, sonicated, and adjusted to pH 6.0. Synthetic urine was then obtained by mixing equal volumes of each solution.
Different amounts of CaCl2 were added to solution A to obtain calcium concentrations of 400 mg/L, 440 mg/L, or 480 mg/L, so that the final concentrations were 200 mg/L, 220 mg/L, or 240 mg/L. A 40 mM stock solution of sodium oxalate that was prepared in ultra-pure Milli-Q water was used to induce crystallization.
2.3. Artificial Urine for UA Crystallization
For UA crystallization experiments (
Table 2), a stock solution of artificial urine was prepared using saline concentrations 4 times greater than the typical physiological levels.
Additionally, a 1 g/L UA stock solution was prepared for experiments in which the final concentrations were 400 or 500 mg/L UA, and a 2 g/L UA stock solution was prepared for experiments in which the final concentration was 600 mg/L UA. All solutions were prepared daily.
2.4. Solution for Cystine Crystallization
Cystine crystallization experiments were performed in sodium chloride solutions instead of artificial urine to prevent interference from the additional ionic species in artificial urine. A cystine stock solution was prepared daily by dissolving cystine and 8.33 g of NaCl in 500 mL of ultra-pure deionized water from the Milli-Q system. The pH was then adjusted to 9.0 using 3 M NaOH to ensure the complete dissolution of cystine. The final cystine concentrations were 1000 mg/L (4.16 mM) or 900 mg/L (3.75 mM).
2.5. Stock Solutions of Inhibitors
For inhibition of calcium oxalate crystallization, 10 mM stock solutions of hydroxycitrate (hydroxycitric acid tripotassium salt monohydrate) from Toronto Research Chemicals Inc. (Toronto, ON, Canada), citrate (sodium citrate tribasic dihydrate), tartronate (tartronic acid), and 1 mM phytate (phytic acid sodium salt hydrate), from Sigma-Aldrich (St. Louis, MO, USA) were prepared in Solution B (
Table 1) and adjusted to pH 6.0.
For inhibition of UA crystallization, 2 mM stock solutions of theobromine and 3-methylxanthine (Sigma-Aldrich, Steinheim, Germany) and a 1.9 mM stock solution of 7-methylxanthine (Thermo Fisher Scientific, Heysham, UK) were dissolved in ultra-pure Milli-Q water, with the addition of droplets of 3 M NaOH if necessary.
For inhibition of cystine crystallization, a 0.1 M stock solution of N-acetyl-L-cysteine (Fluka, Buchs, Switzerland) was prepared in ultra-pure Milli-Q water. This inhibitor was added to the crystallization system at different concentrations.
2.6. Kinetic–Turbidimetric Crystallization Assays
Kinetic–turbidimetric assays were performed to determine the crystallization induction time (t
i) in the absence and presence of different inhibitors. Different concentrations of the crystallizing solutes were used to assess the effects of the level of supersaturation on the effects of the different inhibitors. These experiments were performed using a previously described kinetic–turbidimetric assay [
20]. This method used a spectrometer that was equipped with a fiber-optic light-guide measuring cell (AvaSpec-ULS2048CL EVO, Avantes, Apeldoorm, The Netherlands) and was operated in the kinetic mode. Integrated absorbance from 400 to 600 nm was recorded. These experiments were performed with constant mixing by a magnetic stir bar (250 rpm) in a water bath at 37 °C to mimic physiological conditions. The pH was monitored to confirm that it remained stable.
2.7. Procedure for the Crystallization of Calcium Oxalate
Solution B, with the adequate concentration of inhibitor, was prepared by mixing the appropriate volume of solution B (free of inhibitor,
Table 1) with the stock solution of inhibitor. A volume of 25 mL of this solution was stirred at 250 rpm in a thermostatic bath at 37.0 ± 0.2 °C for 15 min. Then, 25 mL of Solution A (with different calcium concentrations) was added. Calcium oxalate crystallization was induced by adding 0.705 mL of a 40 mM sodium oxalate solution.
2.8. Procedure for the Crystallization of UA
Experiments were performed by adding an appropriate amount of a UA stock solution, with or without inhibitors, into a 50 mL beaker containing Milli-Q water, with a final volume of 30 mL. This solution was stirred at 250 rpm in a turbidimetric bath at 37.0 ± 0.2 °C for 15 min. Turbidimetric measurements were initiated after the addition of 10 mL of the AUx4 medium (
Table 2). Uric acid precipitation was induced at 30 s by adding 0.37 to 0.40 mL of 1 M HCl to reach a pH of 4.60 ± 0.03, conditions that induced UA crystallization.
2.9. Procedure for the Crystallization of Cystine
Experiments were performed by adding 50 mL of a cystine stock solution and an N-acetylcysteine solution (when applicable) to reach the desired experimental concentrations in a 50 mL glass beaker. The solution was stirred at 250 rpm in a thermostatic bath at 37.0 ± 0.2 °C for 15 min, and 0.15–0.45 mL of 1 M HCl was added to reach the desired pH (4.5, 5.0, or 6.0) and induce cystine crystallization.
2.10. Analysis of Crystal Morphology
The crystals formed during these assays were collected by passing the solution through a 0.45 µm pore nylon membrane filter and drying at room temperature. The crystals were fixed with adhesive conductive tape onto a sample holder and then observed by scanning electron microscopy (SEM; TM4000 Plus II, Hitachi, Tokyo, Japan).
2.11. Statistics
The data are expressed as the mean of three replicates ± standard deviation. Two-sided ANOVA with Sidak’s post hoc test was performed to assess significance between the inhibitory capacities at different supersaturation levels. All data analysis and interpretation were carried out using GraphPad Prism version 8.0.2 (GraphPad Software, La Jolla, CA, USA).
3. Results
3.1. Induction of the Crystallization of Calcium Oxalate, UA, and Cystine
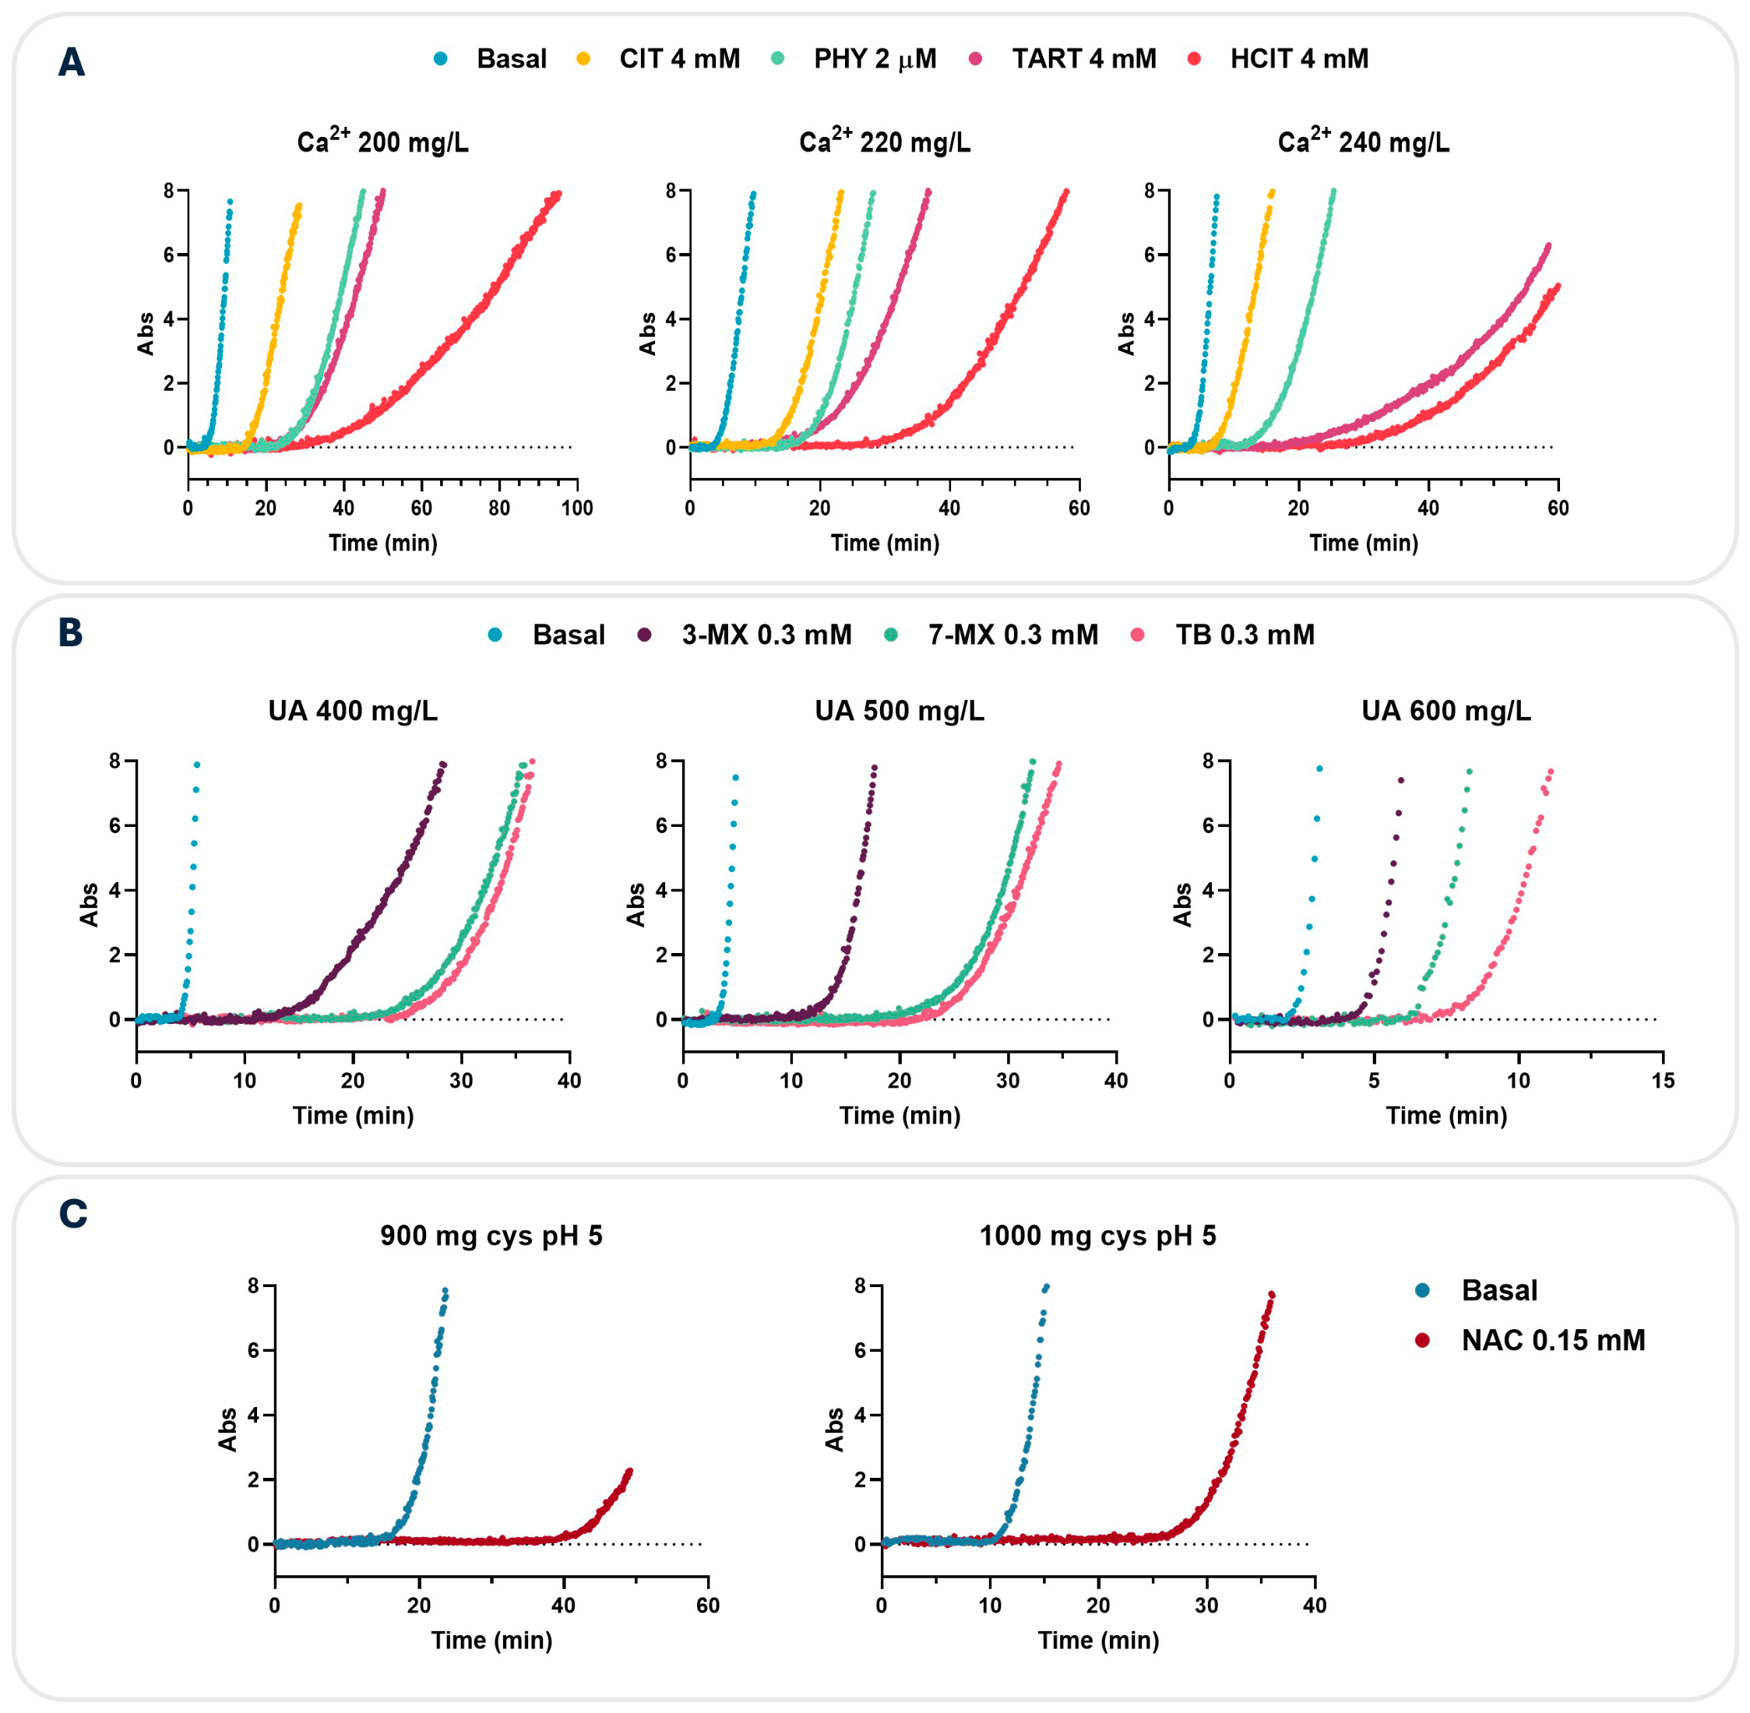
The turbidimetric assay for measuring the t
i of calcium oxalate consisted of generating a supersaturated solution containing different concentrations of calcium with or without different inhibitors (
Figure 1A). The assays for determining the t
i values of UA (
Figure 1B) and cystine (
Figure 1C) were similar, although different crystallization inhibitors were used.
Initially, for all experiments and before the beginning of crystallization, the absorbance remained constant at 0. The beginning of crystallization is indicated by the sudden and exponential increase in the absorbance because of light scattering by higher-order particles. Absorbance then increased linearly during the crystal growth phase (
Figure 1). The time when absorbance first increased was considered to be the induction time of crystallization (t
i). The induction time was manually determined from the kinetic–turbidimetric curves.
In these experiments, the ti values of several minutes and the sudden increase in absorbance indicate heterogeneous nucleation. It should be noted that homogeneous nucleation is not produced because the supersaturation levels in our experiments are not high enough. The increased ti in the presence of inhibitors indicates that these compounds inhibited nucleation; during the subsequent linear increase in absorbance, the decreased slope in the presence of these inhibitors indicates that they also inhibited crystal growth.
3.2. Crystallization of Calcium Oxalate
We induced crystallization of calcium oxalate in artificial urine in the presence of oxalate (0.56 mM, 50 mg/L), with three different concentrations of calcium (200, 220, and 240 mg/L; 5.0, 5.5, and 6.0 mM). The corresponding supersaturation values (calculated using the EQUIL 2.0 program as relative supersaturation) were 23.6, 24.8 and 25.9, respectively. We examined the inhibitory effects of four different compounds (citrate, hydroxycitrate, tartronate and phytate) at these different supersaturation levels and used inhibitor concentrations that can occur in human urine.
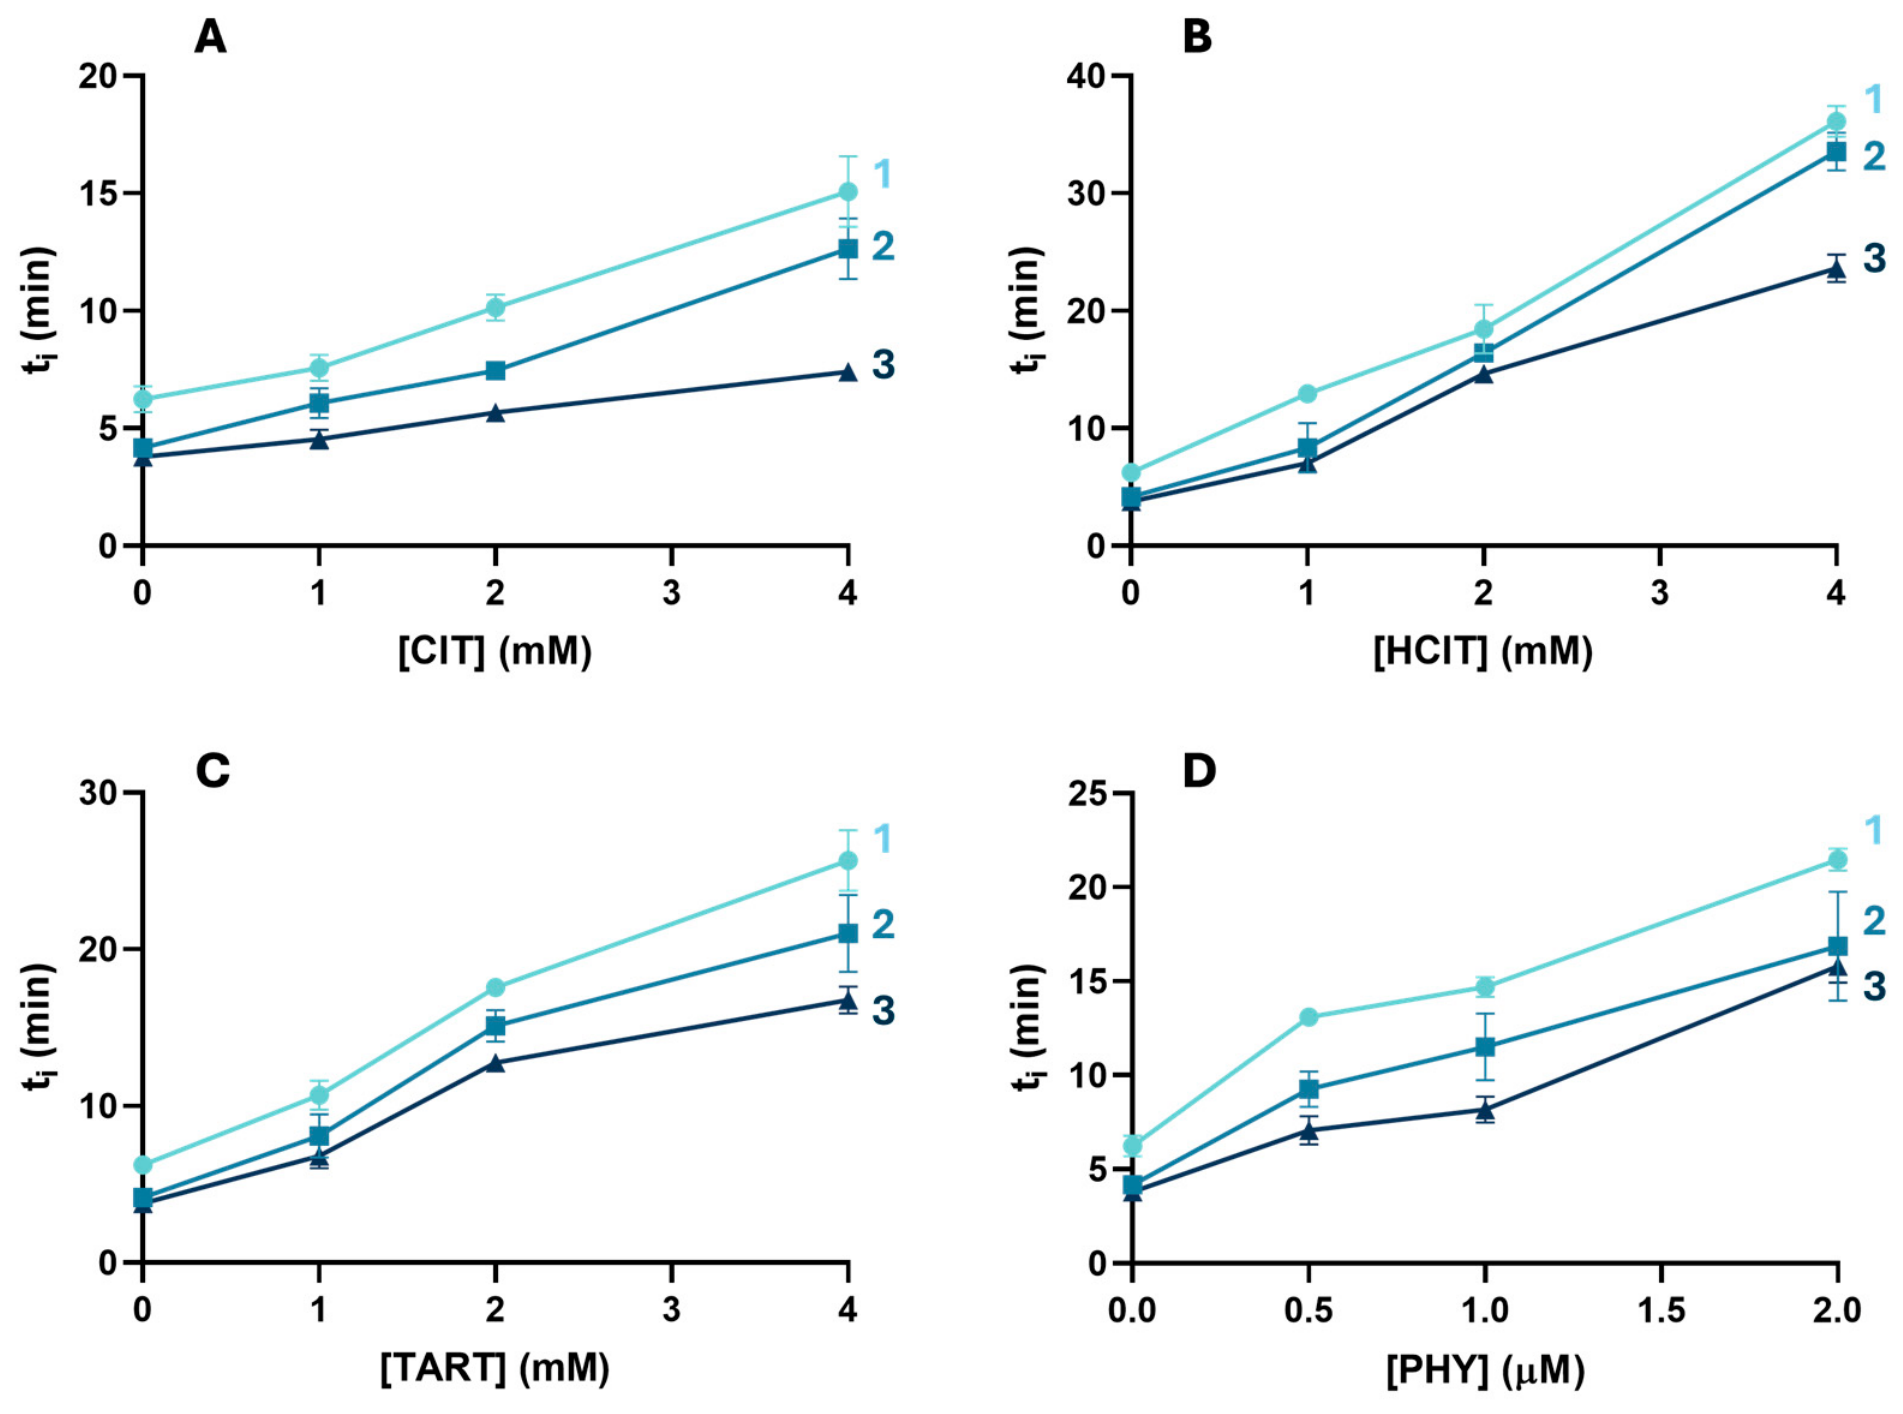
In the absence of any inhibitor, the t
i decreased as the calcium concentration increased (
Figure 1A and
Figure 2). In particular, the t
i was 6.2 ± 0.6 min for 200 mg/L of Ca
2+, 4.2 ± 0.3 min for 220 mg/L Ca
2+, and 3.8 ± 0.1 min for 240 mg/L of Ca
2+.
Examination of the effects of four different inhibitors indicated that the inhibitory capacity decreased as the calcium concentration increased (
Figure 2). In the case of citrate, tartronate and phytate, this decrease appeared to be gradual, because the increase in the t
i of calcium oxalate was lower as the calcium concentration increased. However, in the case of hydroxycitrate, the inhibitory capacity was the same for 200 and 220 mg/L of Ca
2+ (presenting a
p > 0.05 between these concentrations), in that the increase in the t
i was the same for each concentration of inhibitor. For example, a hydroxycitrate concentration of 4 mM led to nearly identical t
i values (36.1 and 33.5 min) at 200 and 220 mg/L of Ca
2+, although the t
i was 23.6 min for a Ca
2+ concentration of 240 mg/L (presenting a
p < 0.0001 with the curve from 240 mg/L).
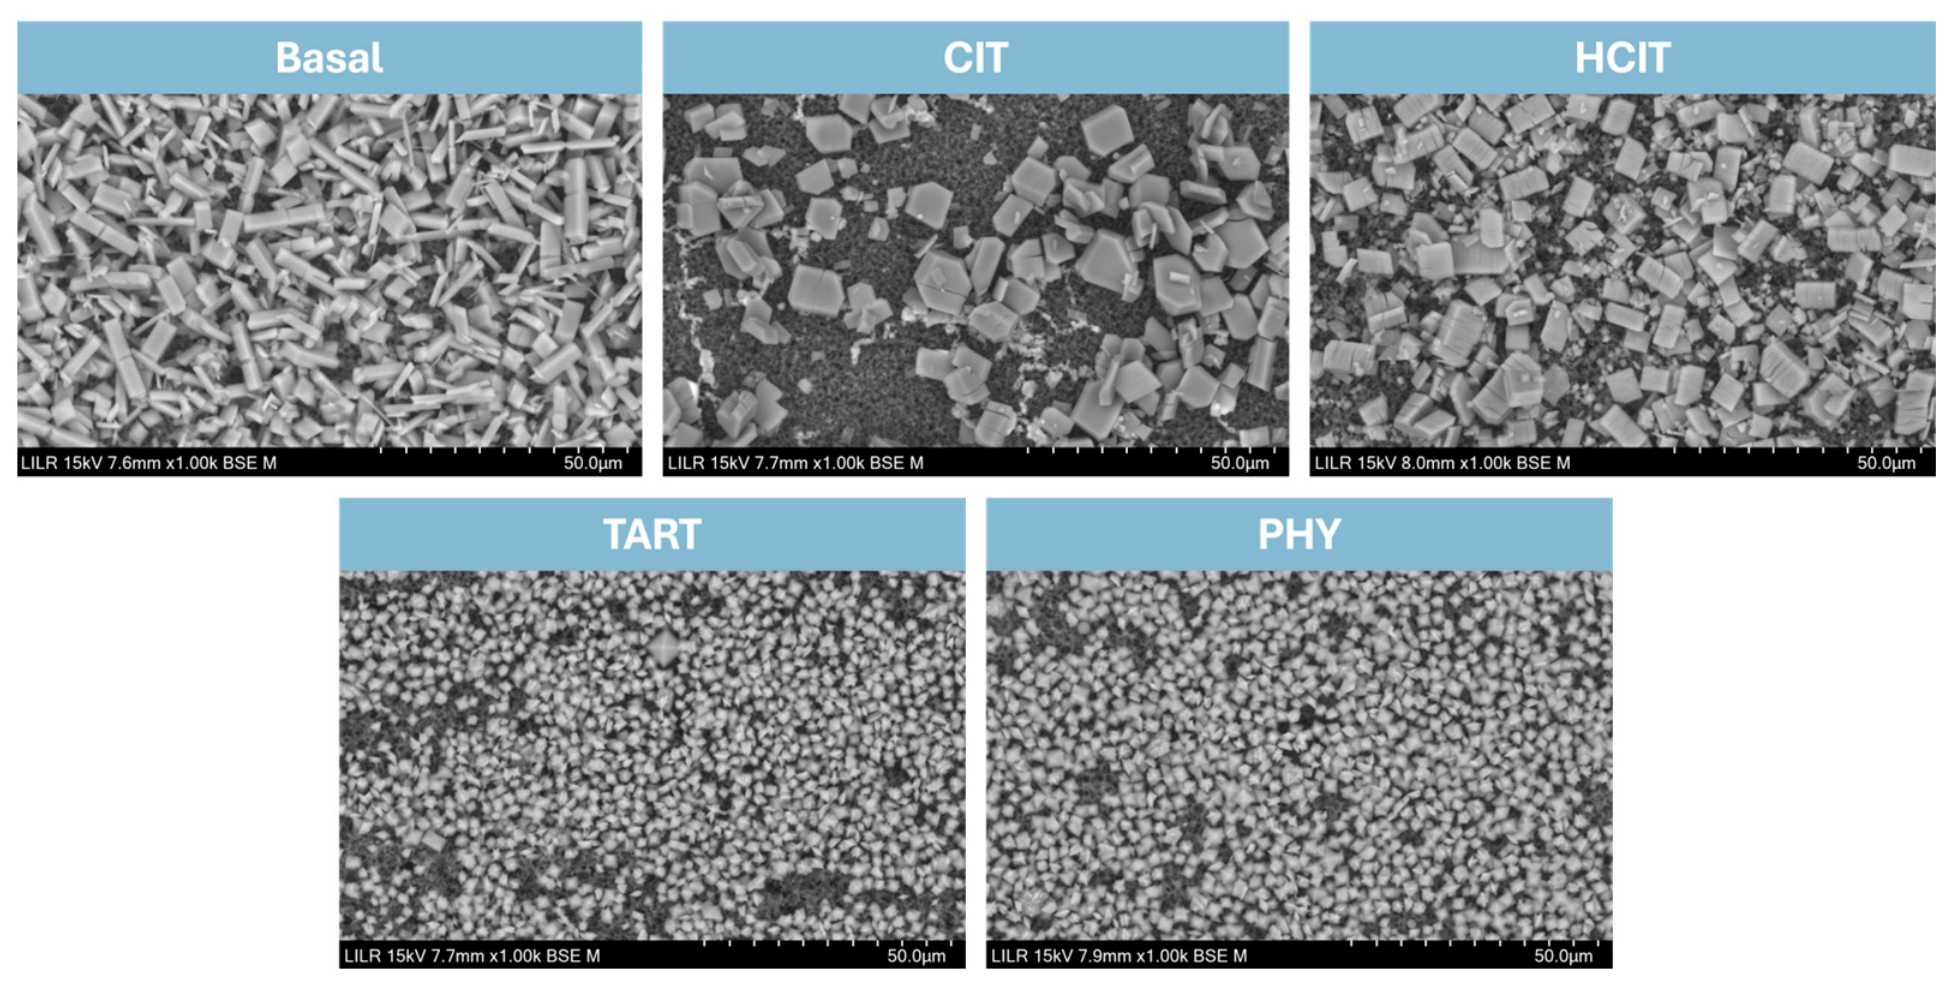
We used SEM to determine the effects of the inhibitors on crystal morphology (
Figure 3). In the absence of an inhibitor (Basal), calcium oxalate trihydrate (COT) was obtained. COT crystals were also obtained in the presence of citrate (CIT) and hydroxycitrate (HCIT), although in this case the crystals were bigger and square-shaped. In the presence of tartronate (TART) and phytate (PHY), crystals obtained presented a dihydrate morphology (COD).
3.3. Crystallization of UA
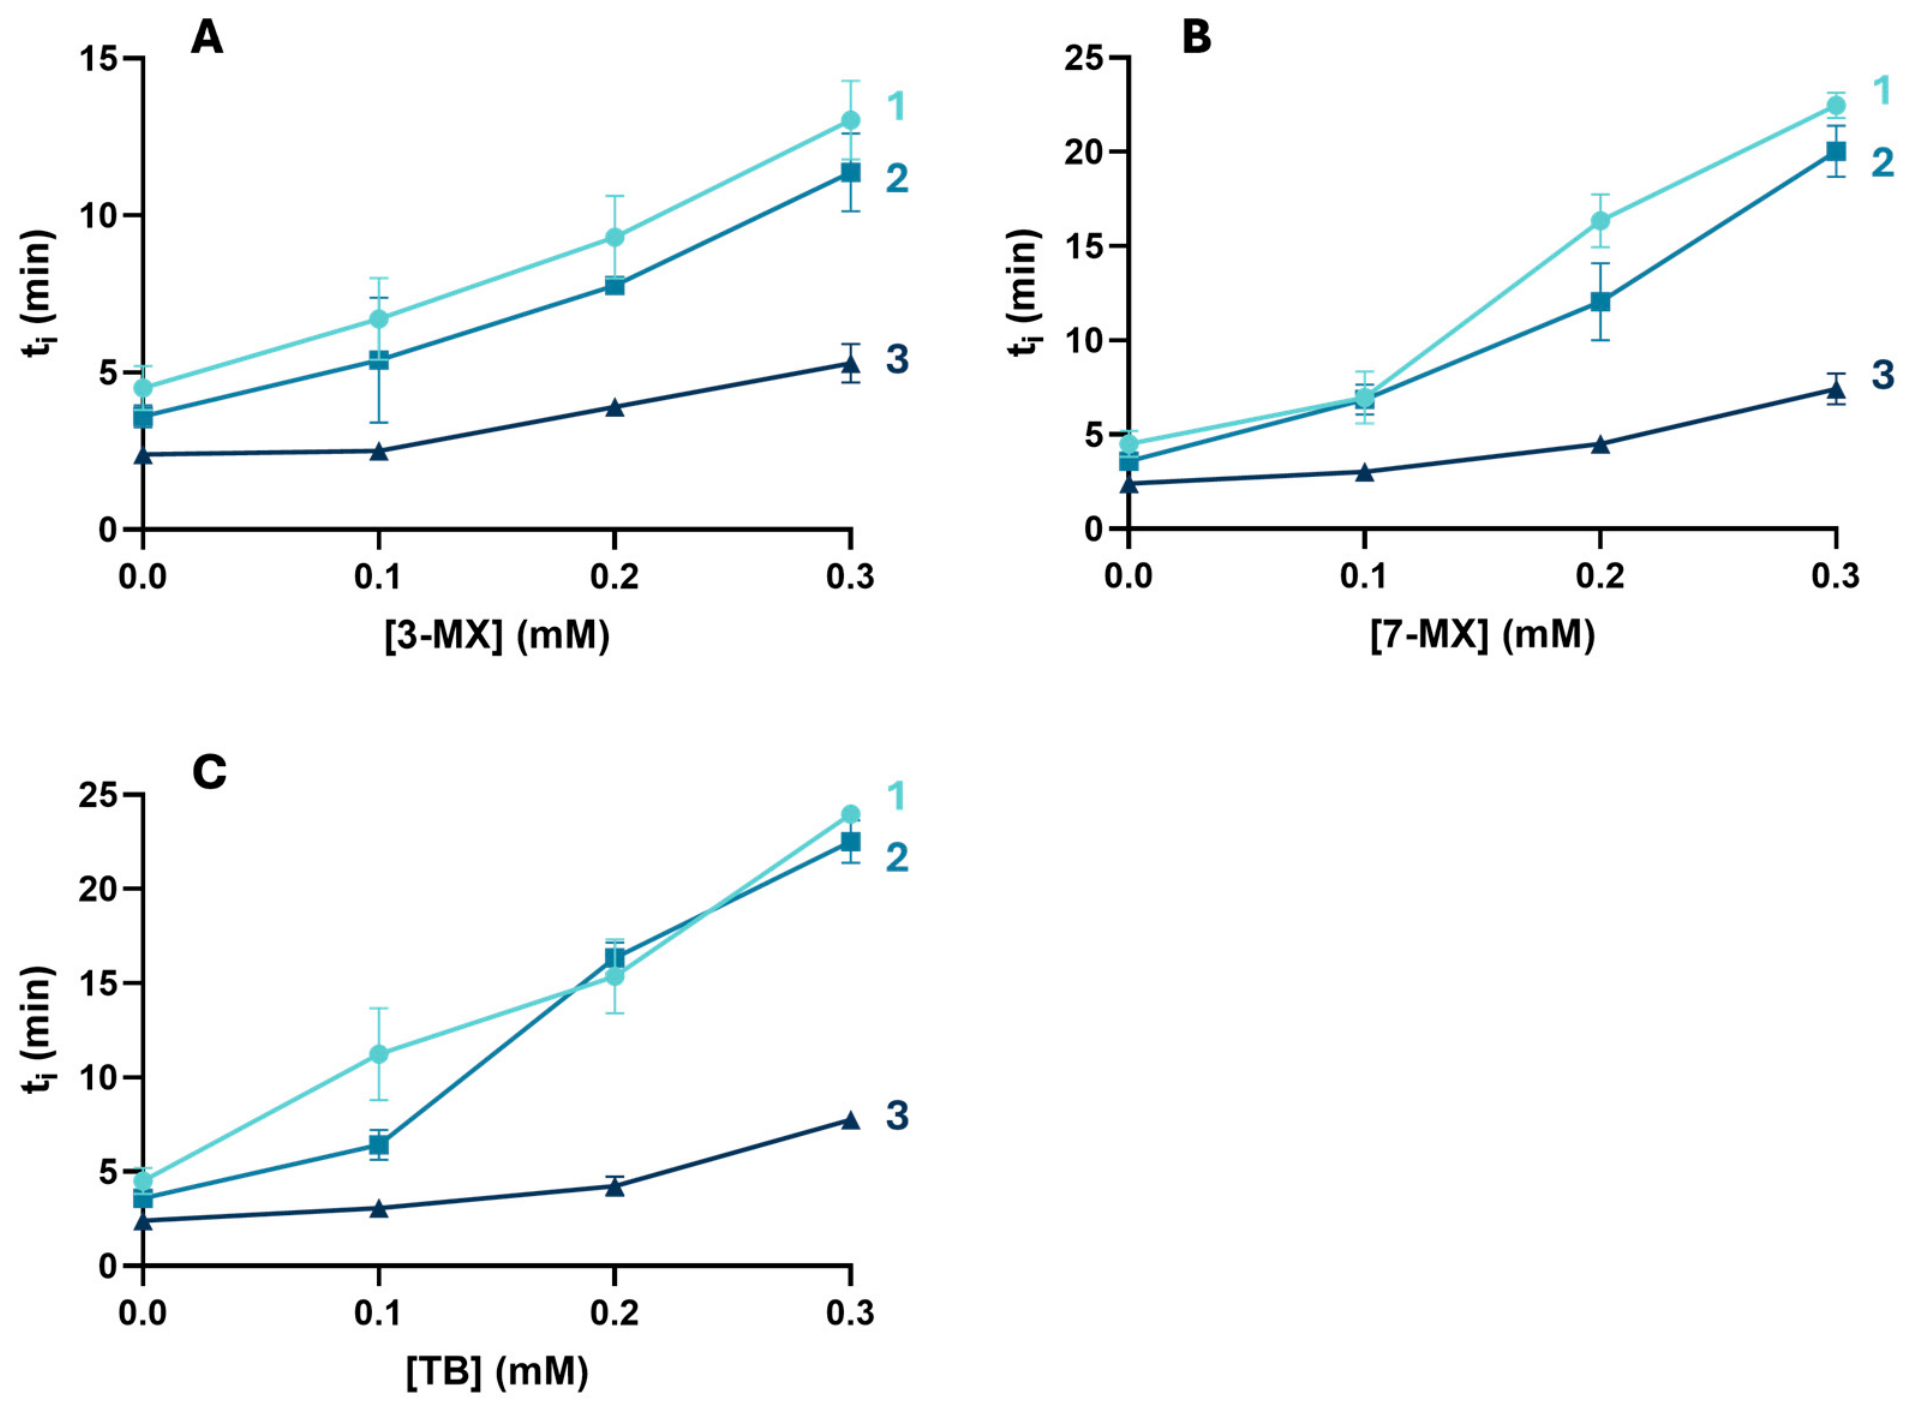
We studied the crystallization of UA at pH 4.6 with UA concentrations of 400, 500 and 600 mg/L (corresponding to relative supersaturation values of 3.63, 4.53, and 5.45 [
21],
Figure 4) and determined the effects of three inhibitors (3-methylxanthine, 7-methylxanthine, and theobromine) at three concentrations (0.1, 0.2 and 0.3 mM, based on observed urinary concentrations [
21]).
In the absence of any inhibitor, the ti values were 4.5 ± 0.9 min (400 mg/L UA), 3.6 ± 0.4 min (500 mg/L UA), and 2.4 ± 0.2 min (600 mg/L UA).
The inhibitory effects on UA crystallization of the mono-methylxanthines (3-methylxanthine and 7-methylxanthine) and di-methylxanthine (theobromine) increased as the inhibitor concentration increased, regardless of the supersaturation level, and were very similar for initial UA concentrations of 400 and 500 mg/L (
Figure 4) (interaction factor
p < 0.05 for 7-methylxanthine and theobromine,
p > 0.05 for 3-methylxanthine). This is clearly evident for 3-methylxanthine at UA concentrations of 400 and 500 mg/L, in that the differences in t
i values were less than 1 min (presenting no significance for an α of 0.05). However, for an initial UA concentration of 600 mg/L, the increase in t
i was considerably less compared to the t
i increases for the same inhibitor concentration at lower supersaturation. This indicates a decreased efficacy of inhibition at higher levels of supersaturation (overall significance of
p < 0.0001 for 7-methylxanthine and theobromine, and
p < 0.005 for 3-methylxanthine).
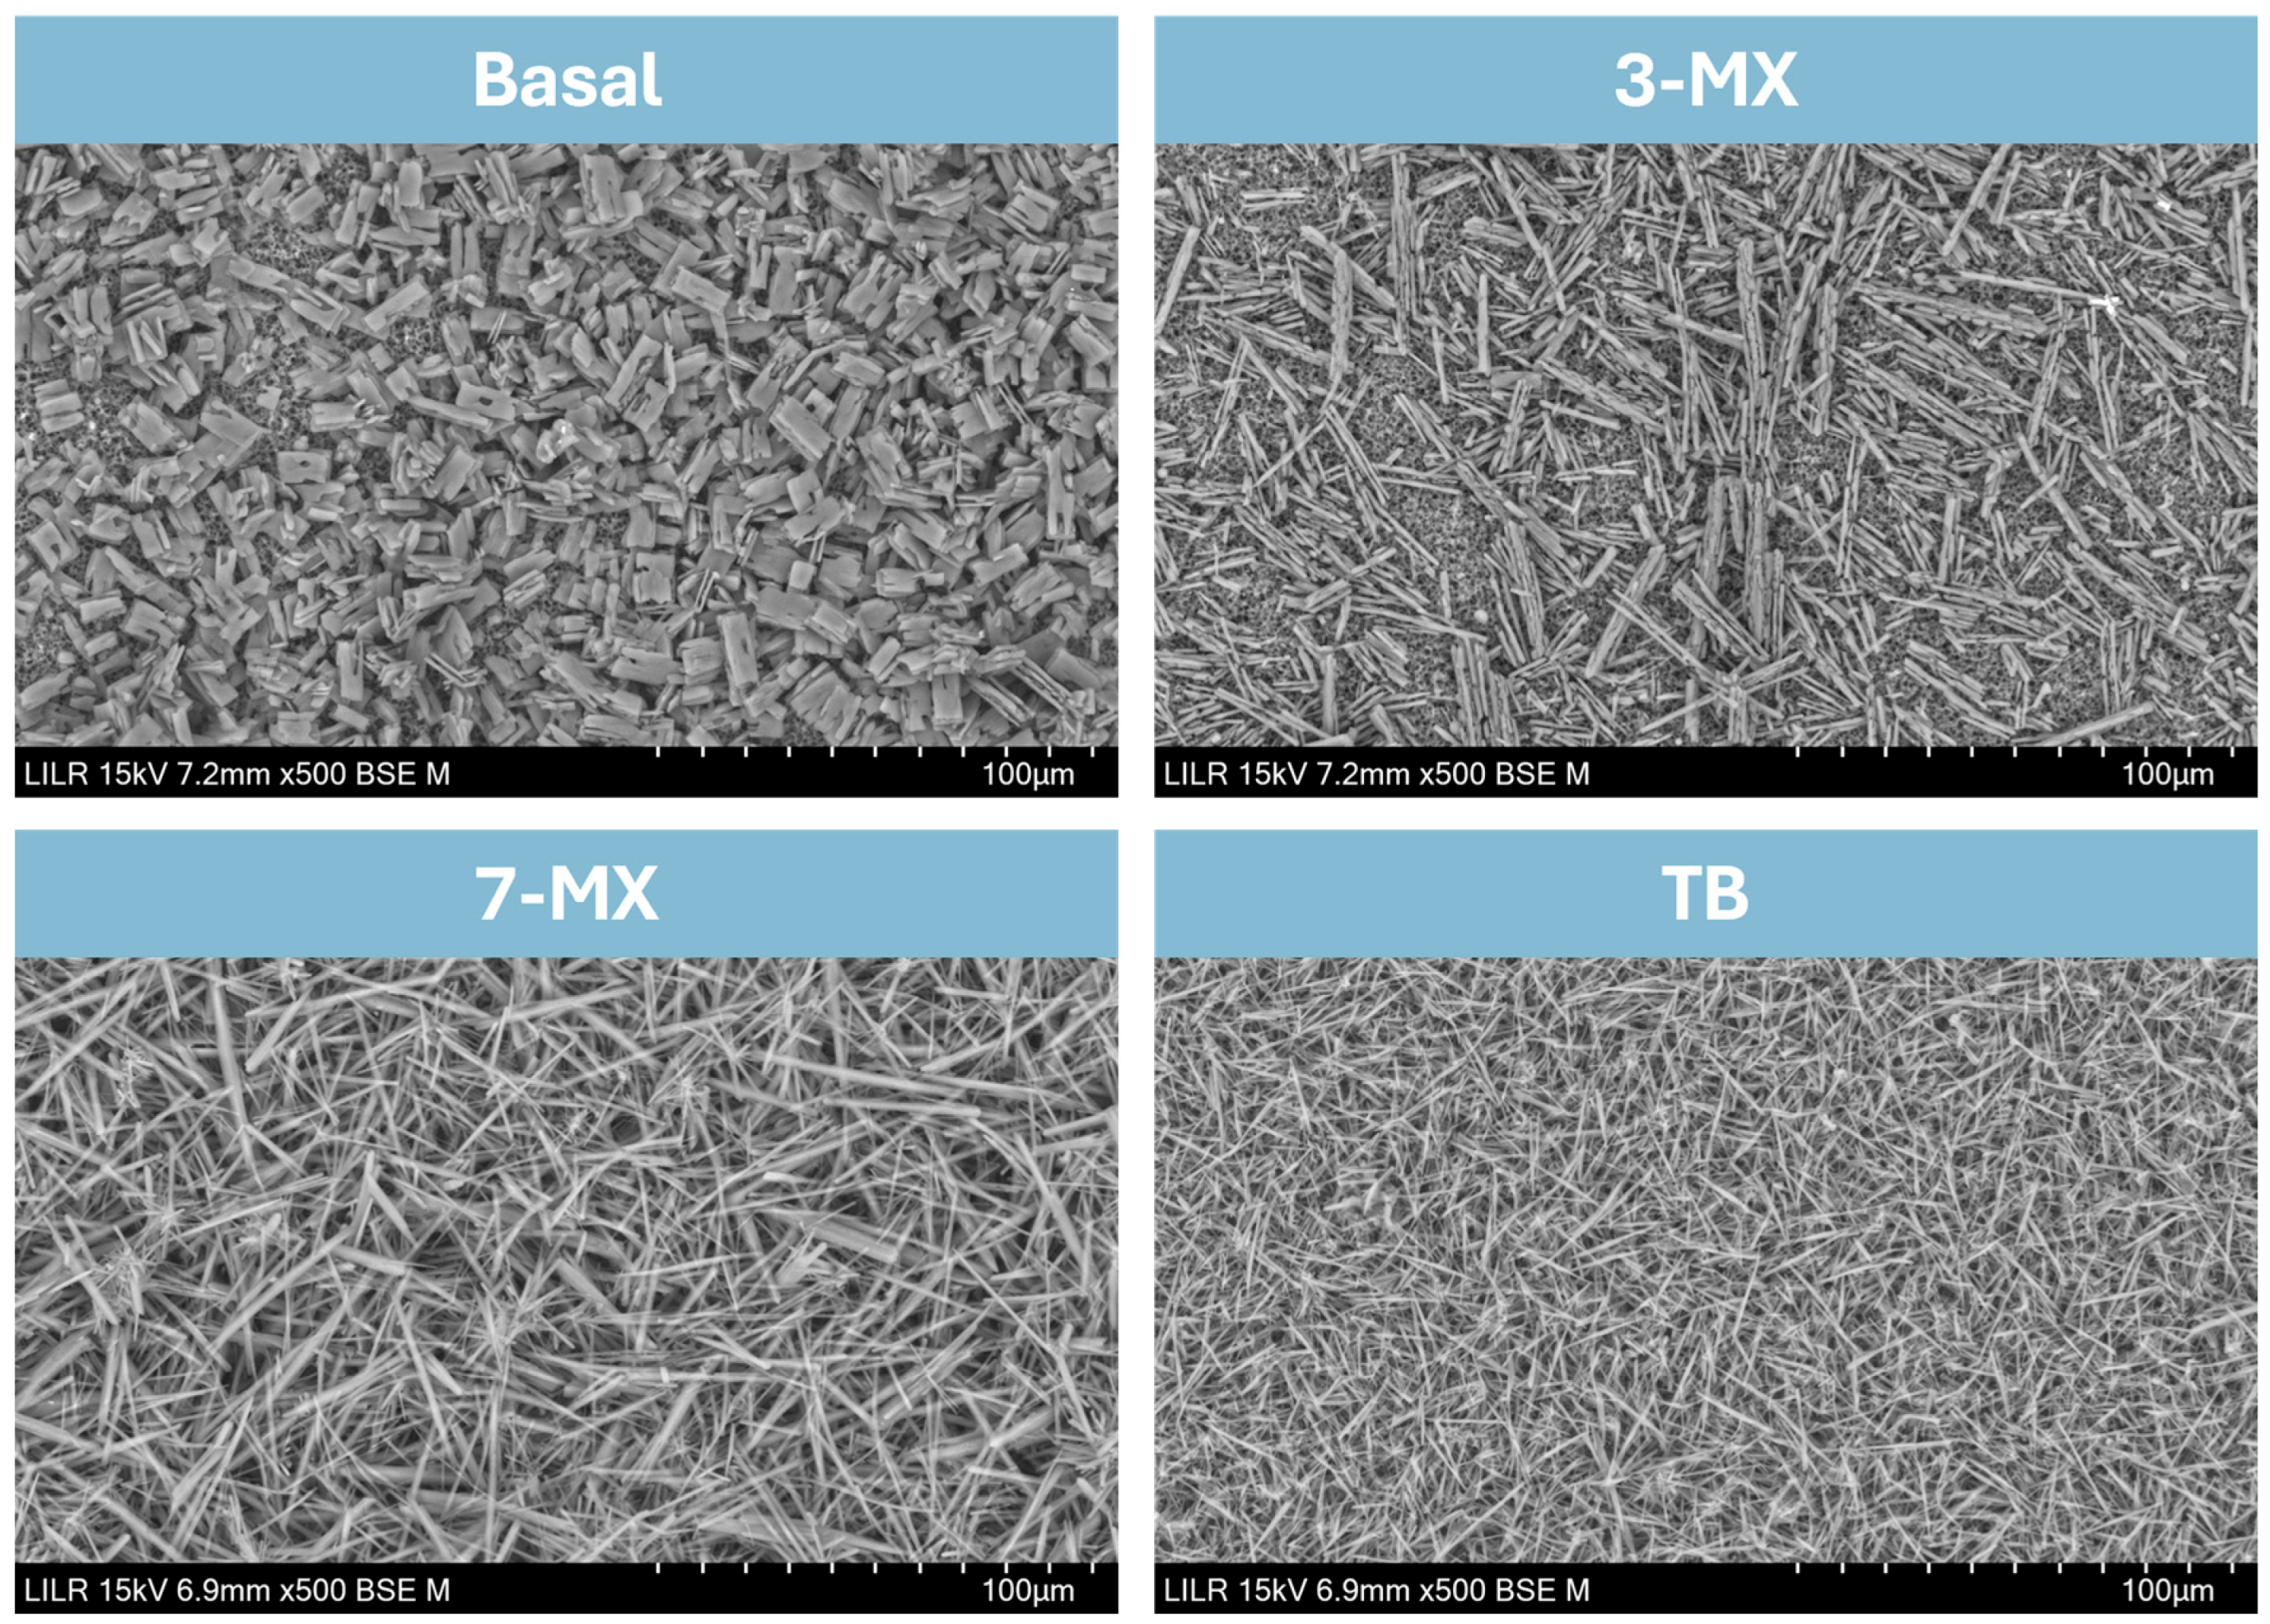
We used SEM to determine the effects of the inhibitors on crystal morphology (
Figure 5). In the absence of an inhibitor (Basal), rectangular anhydrous uric acid crystals were obtained. In the presence of the inhibitors, the crystals obtained an elongated morphology, especially in the presence of 7-methylxanthine (7-MX) and theobromine (TB), presenting a needle-like morphology.
3.4. Crystallization of Cystine
We studied the crystallization of cystine at three pH values (4.5, 5.0, and 6.0) and at two different cystine concentrations (900 and 1000 mg/L). These cystine concentrations corresponded to supersaturation values (SS
CYS = [Cys]/S
CYS, being S
CYS = 0.83 × 10
−3 M [
22]) of SS
CYS = 4.5 (900 mg/L) and SS
CYS = 5.0 (1000 mg/L). The solubility of cystine in sodium chloride is nearly independent of acidity in the range of pH 4.0 to pH 6.0 [
22], and the t
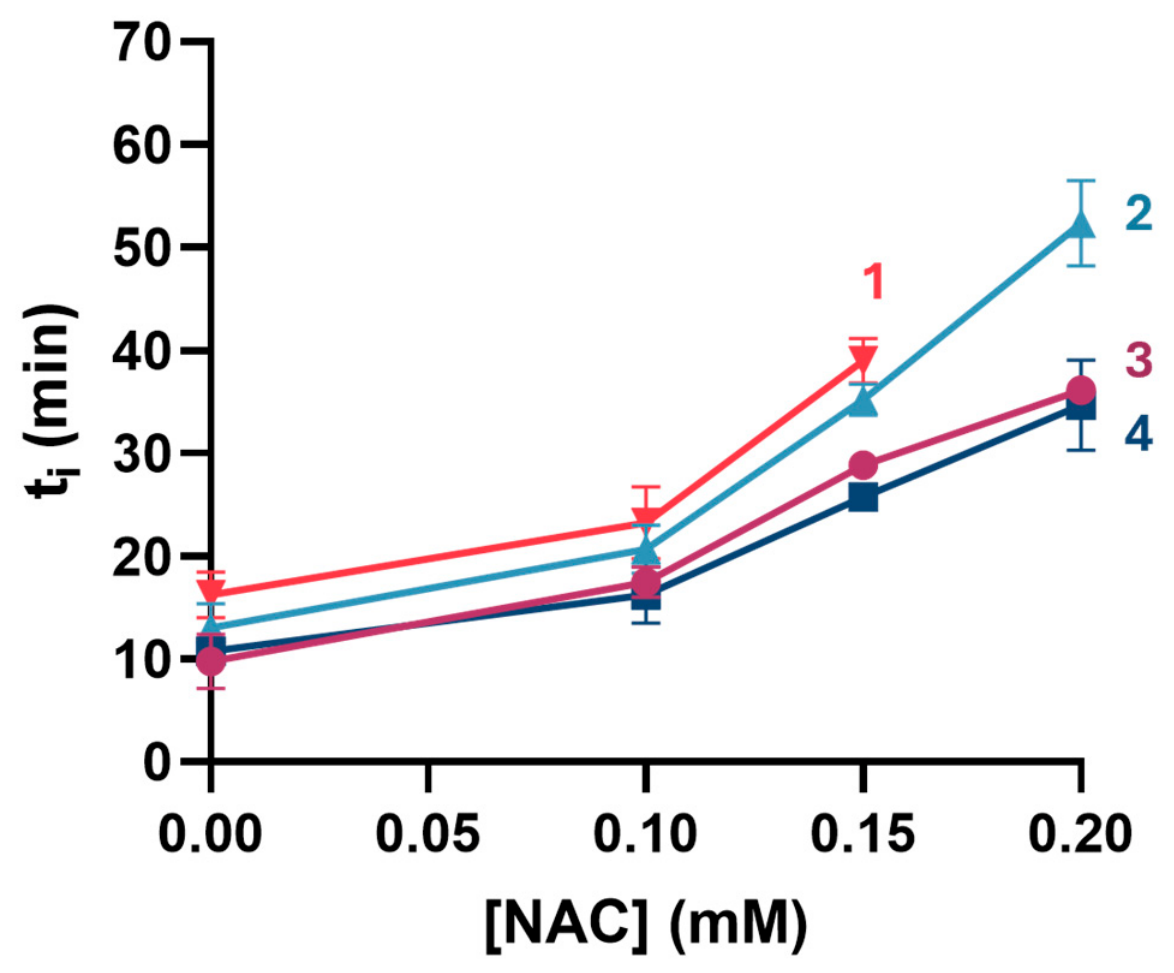
i of crystallization at 1000 mg/L at pH 5.0 was 10.8 ± 0.7 min in the absence of an inhibitor. For 900 mg/L cystine at pH 5.0, the t
i was 16.3 ± 0.2 min (
Figure 6).
We examined the inhibitory effects of NAC at 0.1, 0.15, and 0.2 mM. For 1000 mg/L cystine, the inhibitory effects were comparable at pH 4.5 and 5.0 (p > 0.05, not significance), but NAC produced a greater increase in the induction time at pH 6.0 (p < 0.0001).
For a cystine concentration of 900 mg/L at pH 5.0, we examined the effects of two NAC concentrations. For 0.1 mM NAC, the ti increased by about 7 min; for 0.15 mM NAC, the ti increased by nearly 23 min. These results indicate greater efficacy of inhibition compared with the effects at the same pH with 1000 mg/L of cystine (ti increased by 6 min at 0.1 mM NAC and by 13 min at 0.15 mM NAC) (p < 0.05).
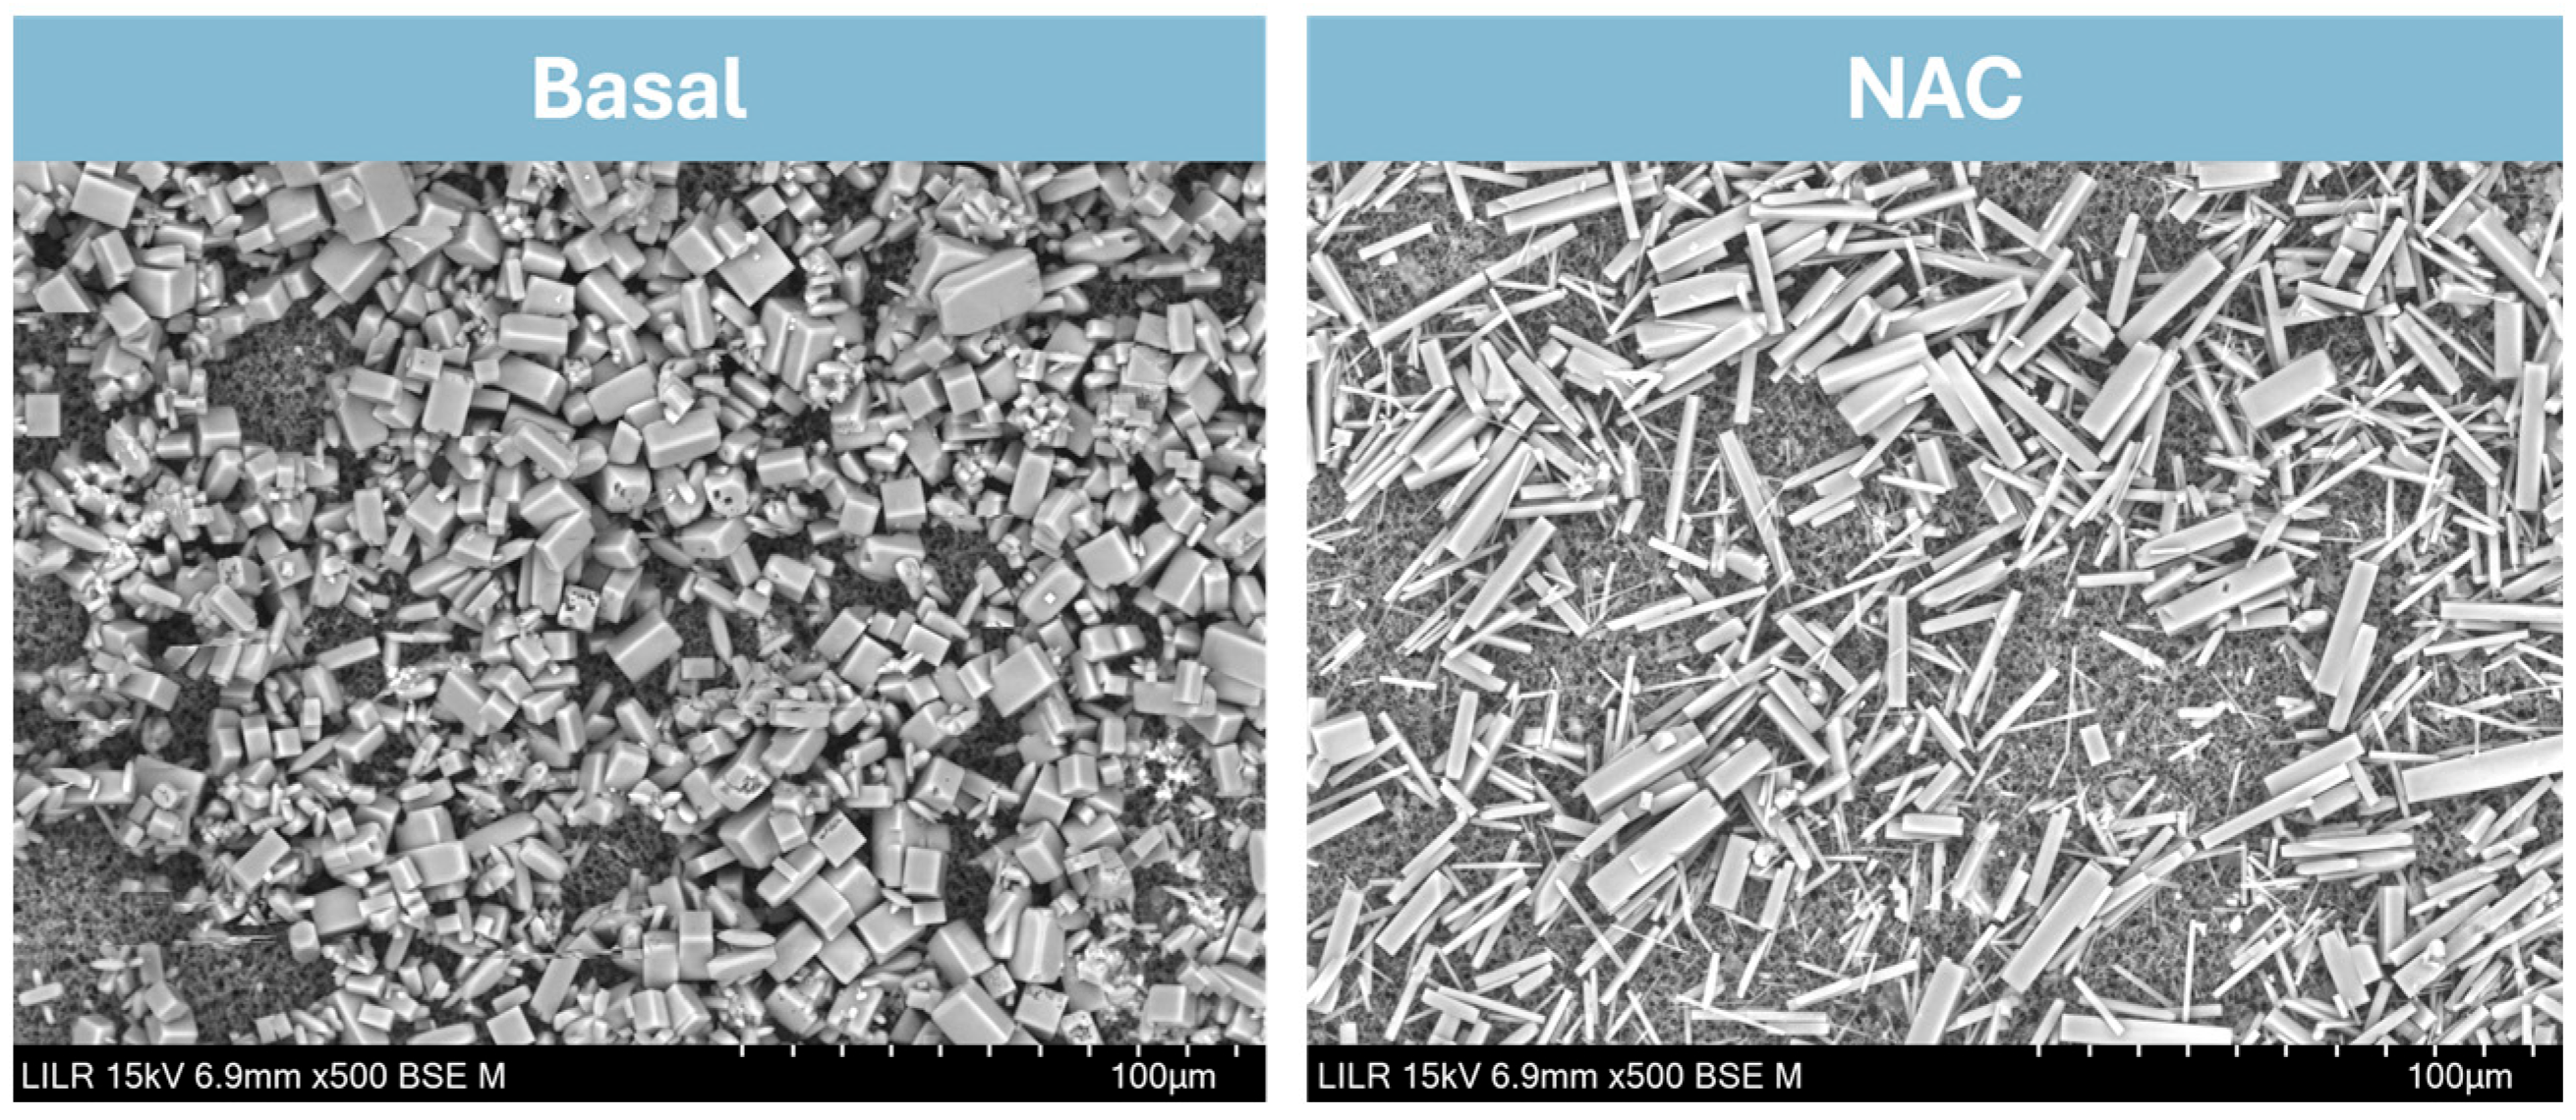
We used SEM to determine the effects of N-acetylcysteine on crystal morphology (
Figure 7). In the absence of NAC (Basal), square-shaped cystine crystals were obtained. In the presence of NAC, the crystals exhibited an elongated morphology, shifting to a needle-like form.
4. Discussion
Our analysis of the crystallization kinetics of calcium oxalate (
Figure 2) indicates that the tested inhibitors mainly affected the rates of heterogeneous nucleation and crystal growth, rather than homogeneous nucleation processes. In fact, considering the low supersaturation values and the time required for crystals to appear in the medium (
Figure 1), it is clear that nucleation was not homogeneous in any case and that the tested inhibitors mainly affected crystal nucleation and growth processes for all three types of crystals (calcium oxalate, uric acid, cystine). Turbidimetric measurements alone do not allow us to distinguish between inhibition of nucleation, growth, or aggregation.
It is important to note how potent inhibitors such as phytate prevent the formation of the kinetically favorable COT crystals, leading to the formation of COD crystals. Other studies have also shown that certain proteins or denatured proteins stabilize the metastable phase of COD [
23,
24]. Clearly, the phase transition affects the growth rate and hardness of kidney stones and provides important information on kidney stone formation mechanisms [
25].
In the case of calcium oxalate, the inhibitory capacity of the tested compounds (citrate, hydroxycitrate, tartronate, and phytate) decreased significantly when the Ca
2+ concentration increased from 220 mg/L to 240 mg/L. The three polyhydroxycarboxylic acids (citrate, hydroxycitrate, and tartronate) form complexes with calcium ions, leading to decreased supersaturation, as was demonstrated in previous papers [
26]. This is not the case for phytate because, although it forms complexes with calcium, its urinary concentration is much lower than that of calcium, so the decrease in supersaturation can be considered negligible. Thus, for the inhibitors of calcium oxalate crystallization studied here, the inhibition of crystal formation clearly decreased as the supersaturation of calcium oxalate increased. In all cases, the tested inhibitors interacted with the faces of the forming crystals, although not identically, as can be seen from the images in
Figure 3.
It is important to note that two types of “inhibitors” of crystallization should be considered. On the one hand, some inhibitors increase the solubility of the crystallizing compound by forming soluble species with one of its constituent components. This describes the interaction of polyhydroxycarboxylic acids with calcium, which decreases calcium oxalate supersaturation and produce an apparent increase in its solubility [
23]. However, individuals with high citrate intake may achieve a high urinary pH, and when the urine pH rises above 6.2, it is important to consider, as a secondary negative effect, that this pH increase can induce the crystallization of hydroxyapatite, leading to the formation of mixed calcium oxalate–hydroxyapatite stones [
27,
28].
On the other hand, other types of crystallization inhibitors bind to crystals or aggregates that have already formed, thereby slowing or preventing crystal growth. In fact, the polyhydroxycarboxylic acids studied here also bind to crystal surfaces, although this inhibitory capacity is quite limited. Recent studies have described polyphosphates that exhibit a much greater inhibitory capacity at concentrations much lower than those of polyhydroxycarboxylic acids. For example, bisphosphonates [
29,
30], phytate, and the products resulting from its partial dephosphorylation after oral ingestion [
20] can have significant effects as crystallization inhibitors. In fact, the results presented in this paper demonstrate that phytate has significant inhibitory effects on the crystallization of calcium oxalate compared to citrate and hydroxycitrate. Furthermore, when hydroxycitrate is administered concurrently with phytate, the decrease in free calcium due to the formation of complexes with the polyhydroxycarboxylic acid reduces supersaturation and thereby increases the inhibitory capacity of phytate [
26].
We studied the formation of UA crystals in the presence of theobromine, a known inhibitor of the formation of uric acid crystals, and two of its metabolites, 3-methylxanthine and 7-methylxanthine, which are also known to inhibit the formation of these crystals [
21]. The three uric acid inhibitors tested interact with the faces of the generated uric acid crystals, forming more elongated crystals. For all three inhibitors, increased supersaturation of uric acid decreased their ability to inhibit crystal formation. Theobromine binds to uric acid molecules in solution, consequently decreasing the supersaturation of this compound [
31], although the decrease in the apparent solubility of uric acid has not been assessed previously. Interestingly, for all three of these inhibitors, the decreased capacity for inhibiting crystallization occurred when the uric acid concentration in solution increased from 500 mg/L to 600 mg/L.
Previous studies have examined the formation of cystine crystals in the presence of N-acetylcysteine and have demonstrated that this compound has a significant capacity to inhibit the formation of these crystals [
32,
33]. In the presence of the inhibitor, the crystals exhibited an elongated morphology. Our results showed that at pH values between 4.5 and 5.0 (at which the solubility of cystine is minimal and supersaturation is therefore higher), the inhibitory capacity of N-acetylcysteine decreased significantly, which also occurred at higher concentrations of cystine.
The reason for the decreased efficacy of crystallization inhibitors at greater levels of supersaturation is related to the mechanism of crystal growth. According to classical crystal growth theory (monomer-by-monomer addition), a crystal grows at relatively low supersaturation by the incorporation of new units at active growth sites located at crystal imperfections, primarily by ‘screw dislocations’, and the binding of a crystallization inhibitor to these growth sites prevents further development. However, as supersaturation increases, crystal growth can occur through ‘surface nucleation’, that is, the formation of new growth terraces on crystal surfaces that lack imperfections. Under these conditions, there is a significantly greater number of potential growth zones, and the inhibitors are therefore less effective. Furthermore, as supersaturation increases, the free-energy gain by crystallization is obviously higher; this not only enables surface nucleation but will also make the building blocks (molecules or ions) of the growing crystal more likely to push the adsorbed inhibitor away from the growth site, as there will always be adsorption/desorption equilibria. Another effect may be that the crystal grows around the adsorbed molecule and encapsulates it. In this way, the effective concentration of the inhibitor will decrease over time. However, it is important to consider that these interpretations have not been directly demonstrated experimentally in the study presented in this paper; therefore, they should be considered explanations rather than definitive conclusions.