Article

Effects of Fast-Frequency Pulsed Twin-TIG Welding on Molten Pool Flow, Mechanical Properties and Microstructure in 316L Austenitic Stainless Steel


School of Material Science and Engineering, Shenyang University of Technology, Shenyang 110870, China
*
Author to whom correspondence should be addressed.
Crystals 2026, 16(7), 406; https://doi.org/10.3390/cryst16070406
Submission received: 28 May 2026 / Revised: 16 June 2026 / Accepted: 16 June 2026 / Published: 23 June 2026
(This article belongs to the Section Crystalline Metals and Alloys)

Abstract

To improve the efficiency of TIG (Tungsten Inert Gas) welding, our team developed a novel fast-frequency pulsed twin-TIG welding power source and matched welding procedures to overcome the drawbacks of conventional high-efficiency TIG welding. After parameter optimization, stable, high-efficiency and high-quality welding of 316L stainless steel can be realized. Compared with traditional DC TIG welding, the mechanical properties of joints are greatly improved: the weld grain size is refined by 38% under moderate current, while tensile strength, elongation and microhardness rise by 13.6%, 26% and 10% respectively, which achieves simultaneous improvement in strength and ductility. Numerical simulations were carried out to analyze the evolution of molten pool temperature field and velocity vector flow field. The simulation results are highly consistent with experimental data, which verifies the reliability of the model and lays a foundation for the study of molten pool behavior. Combined with molten pool flow characteristics and weld microstructure, the evolution mechanism of microstructure and texture as well as grain refinement in this welding process is revealed.

1. Introduction

Since its inception nearly a century ago, TIG welding has remained one of the most widely used welding techniques in engineering applications. Conventional direct-current TIG welding offers numerous advantages, including a clean welding process, stable arc, relatively simple equipment, low overall cost, and high joint quality [1,2]. However, its primary limitation lies in the relatively low welding efficiency [3,4]. Consequently, the pursuit of high-efficiency TIG welding has become a major research focus in recent years. Among various high-efficiency TIG welding methods, keyhole TIG (K-TIG) has demonstrated the most remarkable performance [5,6,7]. With this process, a single-pass weld can achieve a penetration depth exceeding 8 mm even at relatively high welding speeds. Nevertheless, such performance requires extremely high welding currents of 500–700 A [8,9]. The associated excessive heat input inevitably degrades joint properties [10], while also causing severe welding deformation and residual stress concentration. Moreover, the process requires the stabilization of a keyhole, which greatly complicates the procedure in a manner similar to laser welding [11,12]. The narrow process window further increases the risk of welding failure. In essence, K-TIG sacrifices many of the fundamental advantages of conventional TIG welding in pursuit of extreme penetration. Other approaches, such as activated TIG (A-TIG), TIG welding with external magnetic arc constriction, and hot-wire TIG welding, can also improve welding efficiency to some extent [13,14]. However, these methods further complicate the equipment and process parameters [15,16,17], thereby limiting their widespread application in engineering practice.
Furthermore, hybrid welding has been commonly employed as a means to enhance welding efficiency. In 1998, Yamada proposed a dual-TIG hybrid welding approach [18,19]. Subsequently, Kobayashi and colleagues developed specialized dual-TIG torches and applied the dual-TIG hybrid technique to the welding of low-temperature steels in engineering applications, achieving moderate improvements in welding efficiency [20]. However, in coupled-arc dual-TIG welding, the Lorentz force attraction between the arcs significantly reduces the plasma force acting on the molten pool [21,22], which is detrimental to increasing weld penetration. In addition, due to the current-carrying limitations of the tungsten electrodes, the welding current cannot be further increased [23], thereby imposing an upper limit on the achievable efficiency enhancement of this method.
With the rapid advancement of semiconductor electronic devices, high-efficiency TIG welding based on waveform-controlled welding power supplies has developed rapidly [24]. Among these, high-frequency TIG welding can effectively improve welding efficiency while fully retaining the advantages of conventional TIG, through arc constriction induced by the magnetohydrodynamic (MHD) effect and arc thermal delay [25,26]. Moreover, high-frequency TIG welding has been shown to refine weld microstructure and enhance joint performance in numerous studies [27,28].
Wang et al. utilized a novel SiC MOSFET-switch-controlled power supply [29] to integrate high- and low-frequency signals, developing a more efficient fast-frequency pulsed TIG welding method. Wu et al. subsequently applied this single-electrode fast-frequency pulsed method to the welding of TC4 titanium alloy, achieving an overall improvement in weld joint performance [30,31].
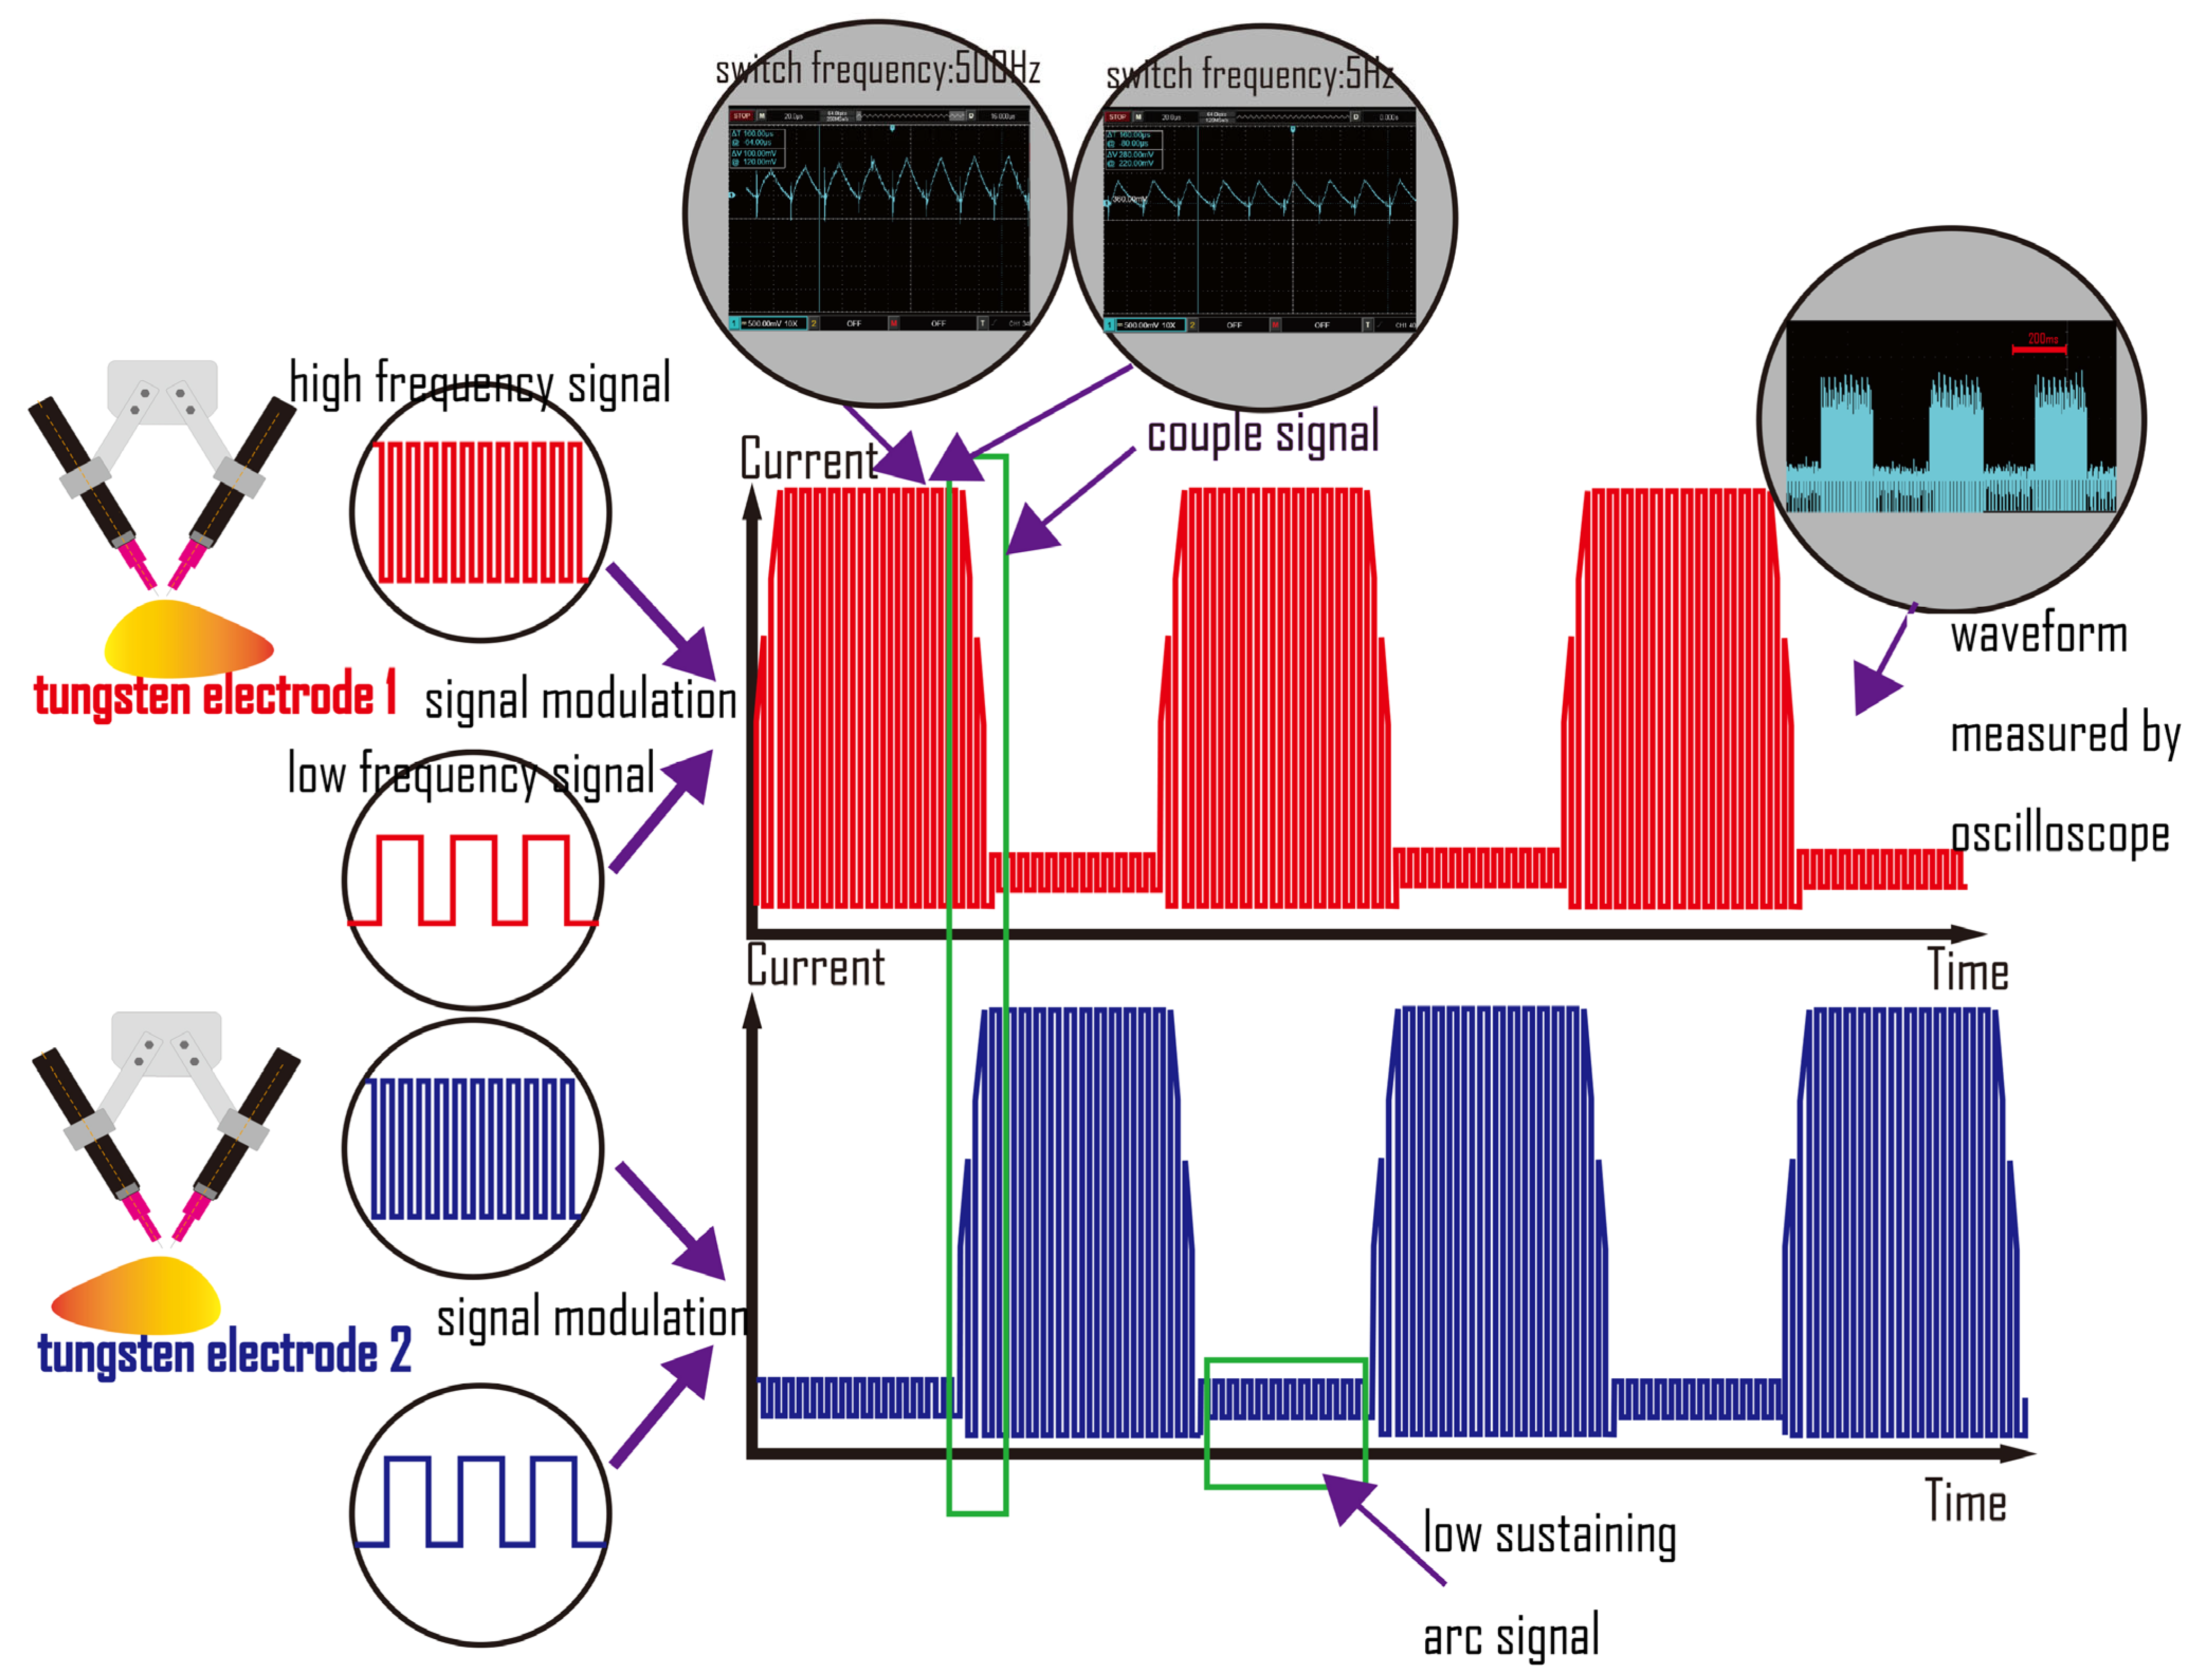
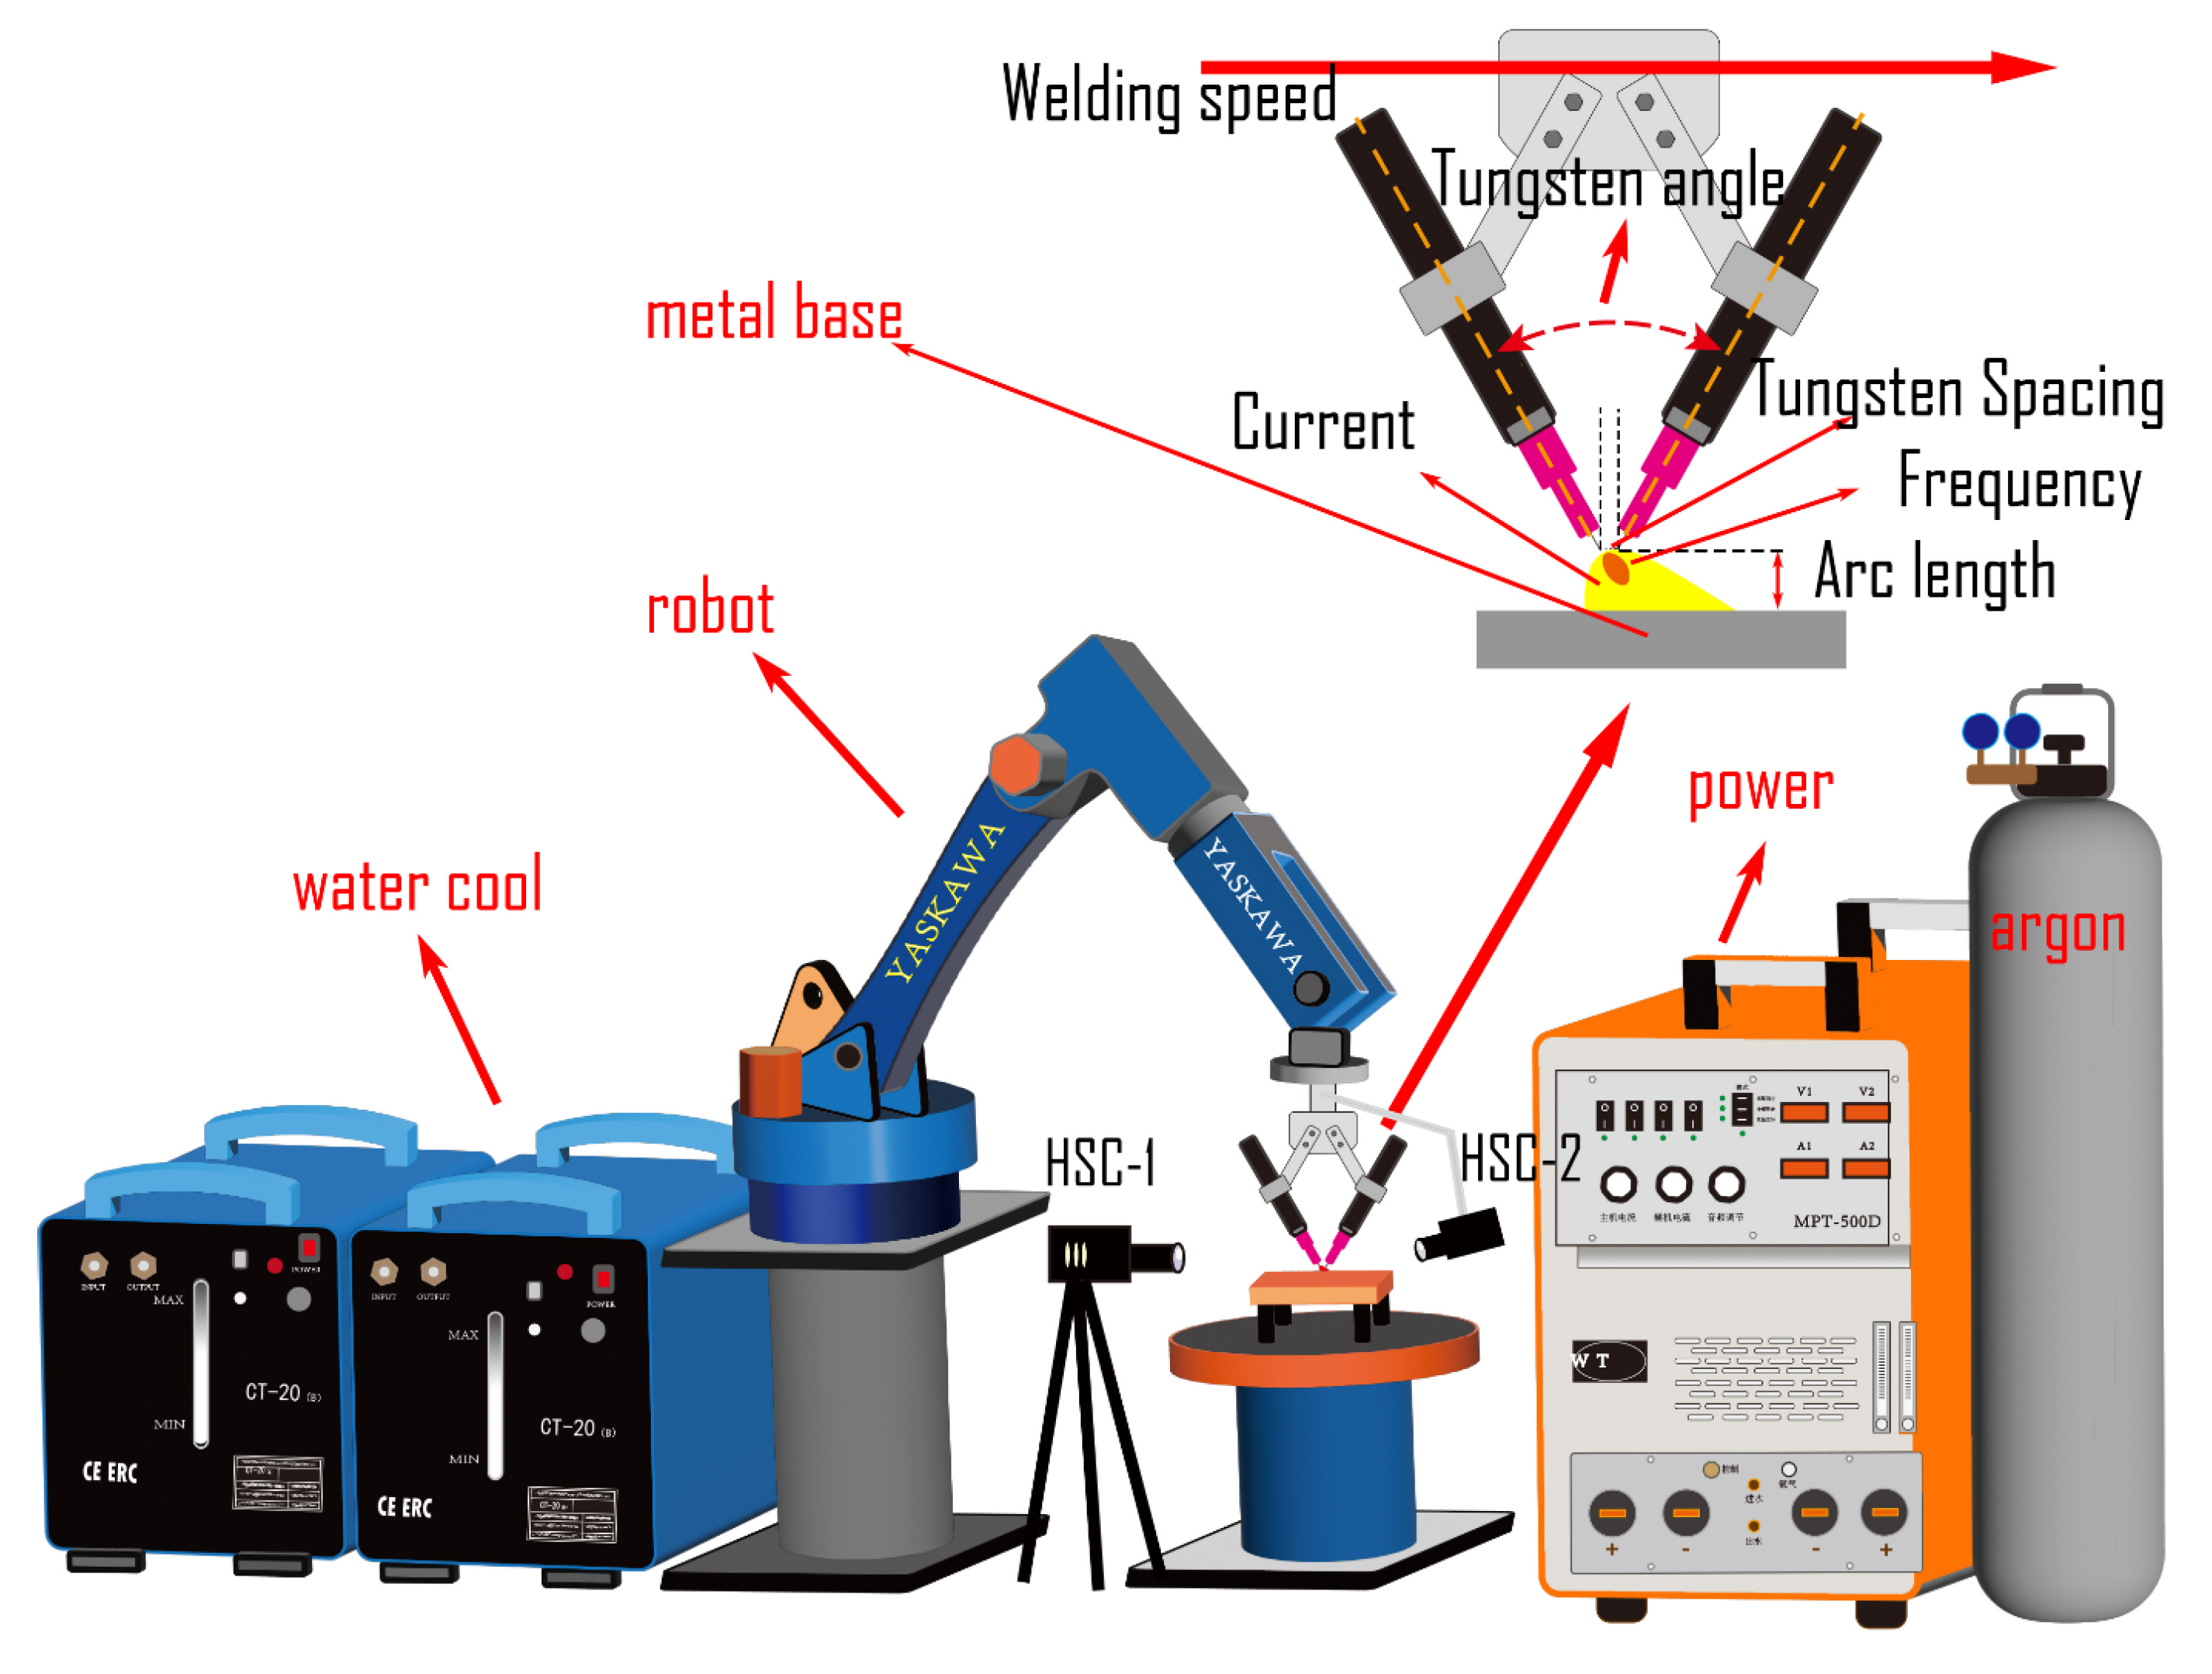
Based on the aforementioned developments, our team integrated dual-channel fast-frequency pulsed waveform outputs to develop a high-efficiency fast-frequency pulsed twin-TIG welding power supply. This system enables an orderly and stable alternating signal output between two high-frequency (30 kHz) TIG electrodes. The alternation frequency of the twin-TIG tungsten electrodes ranges from 5 to 500 Hz, allowing a cyclic control sequence from the ignition of one arc → coupled arc → ignition of the other arc. The output waveforms and arc behavior are illustrated in Figure 1. The welding platform and key welding process parameters are shown in Figure 2. The novel welding power supply offers several advantages: the compressed single-output high-frequency TIG arc concentrates energy density; alternating arcs of the twin-TIG electrodes share the thermal load under high currents while enhancing the stirring effect of reciprocating arc forces on the molten pool; the inclusion of a coupled-arc transition zone ensures stable force distribution within the molten pool, preventing weld defects such as poor bead formation and spatter. In this study, a combination of experimental investigation and numerical simulation was employed to evaluate the practical welding performance of this novel process on 316L stainless steel. The molten pool flow characteristics under specific parameters were analyzed, and the influence of this method on the microstructure and mechanical properties of the metal was explored through analyzing the physical features of the flow field. Meanwhile, this method offers more adjustable parameters compared with conventional TIG welding, and these parameters are highly interrelated, requiring greater patience to explore suitable process settings.

2. Welding Experiments and Numerical Simulation of the Molten Pool

2.1. Experimental Materials and Procedures

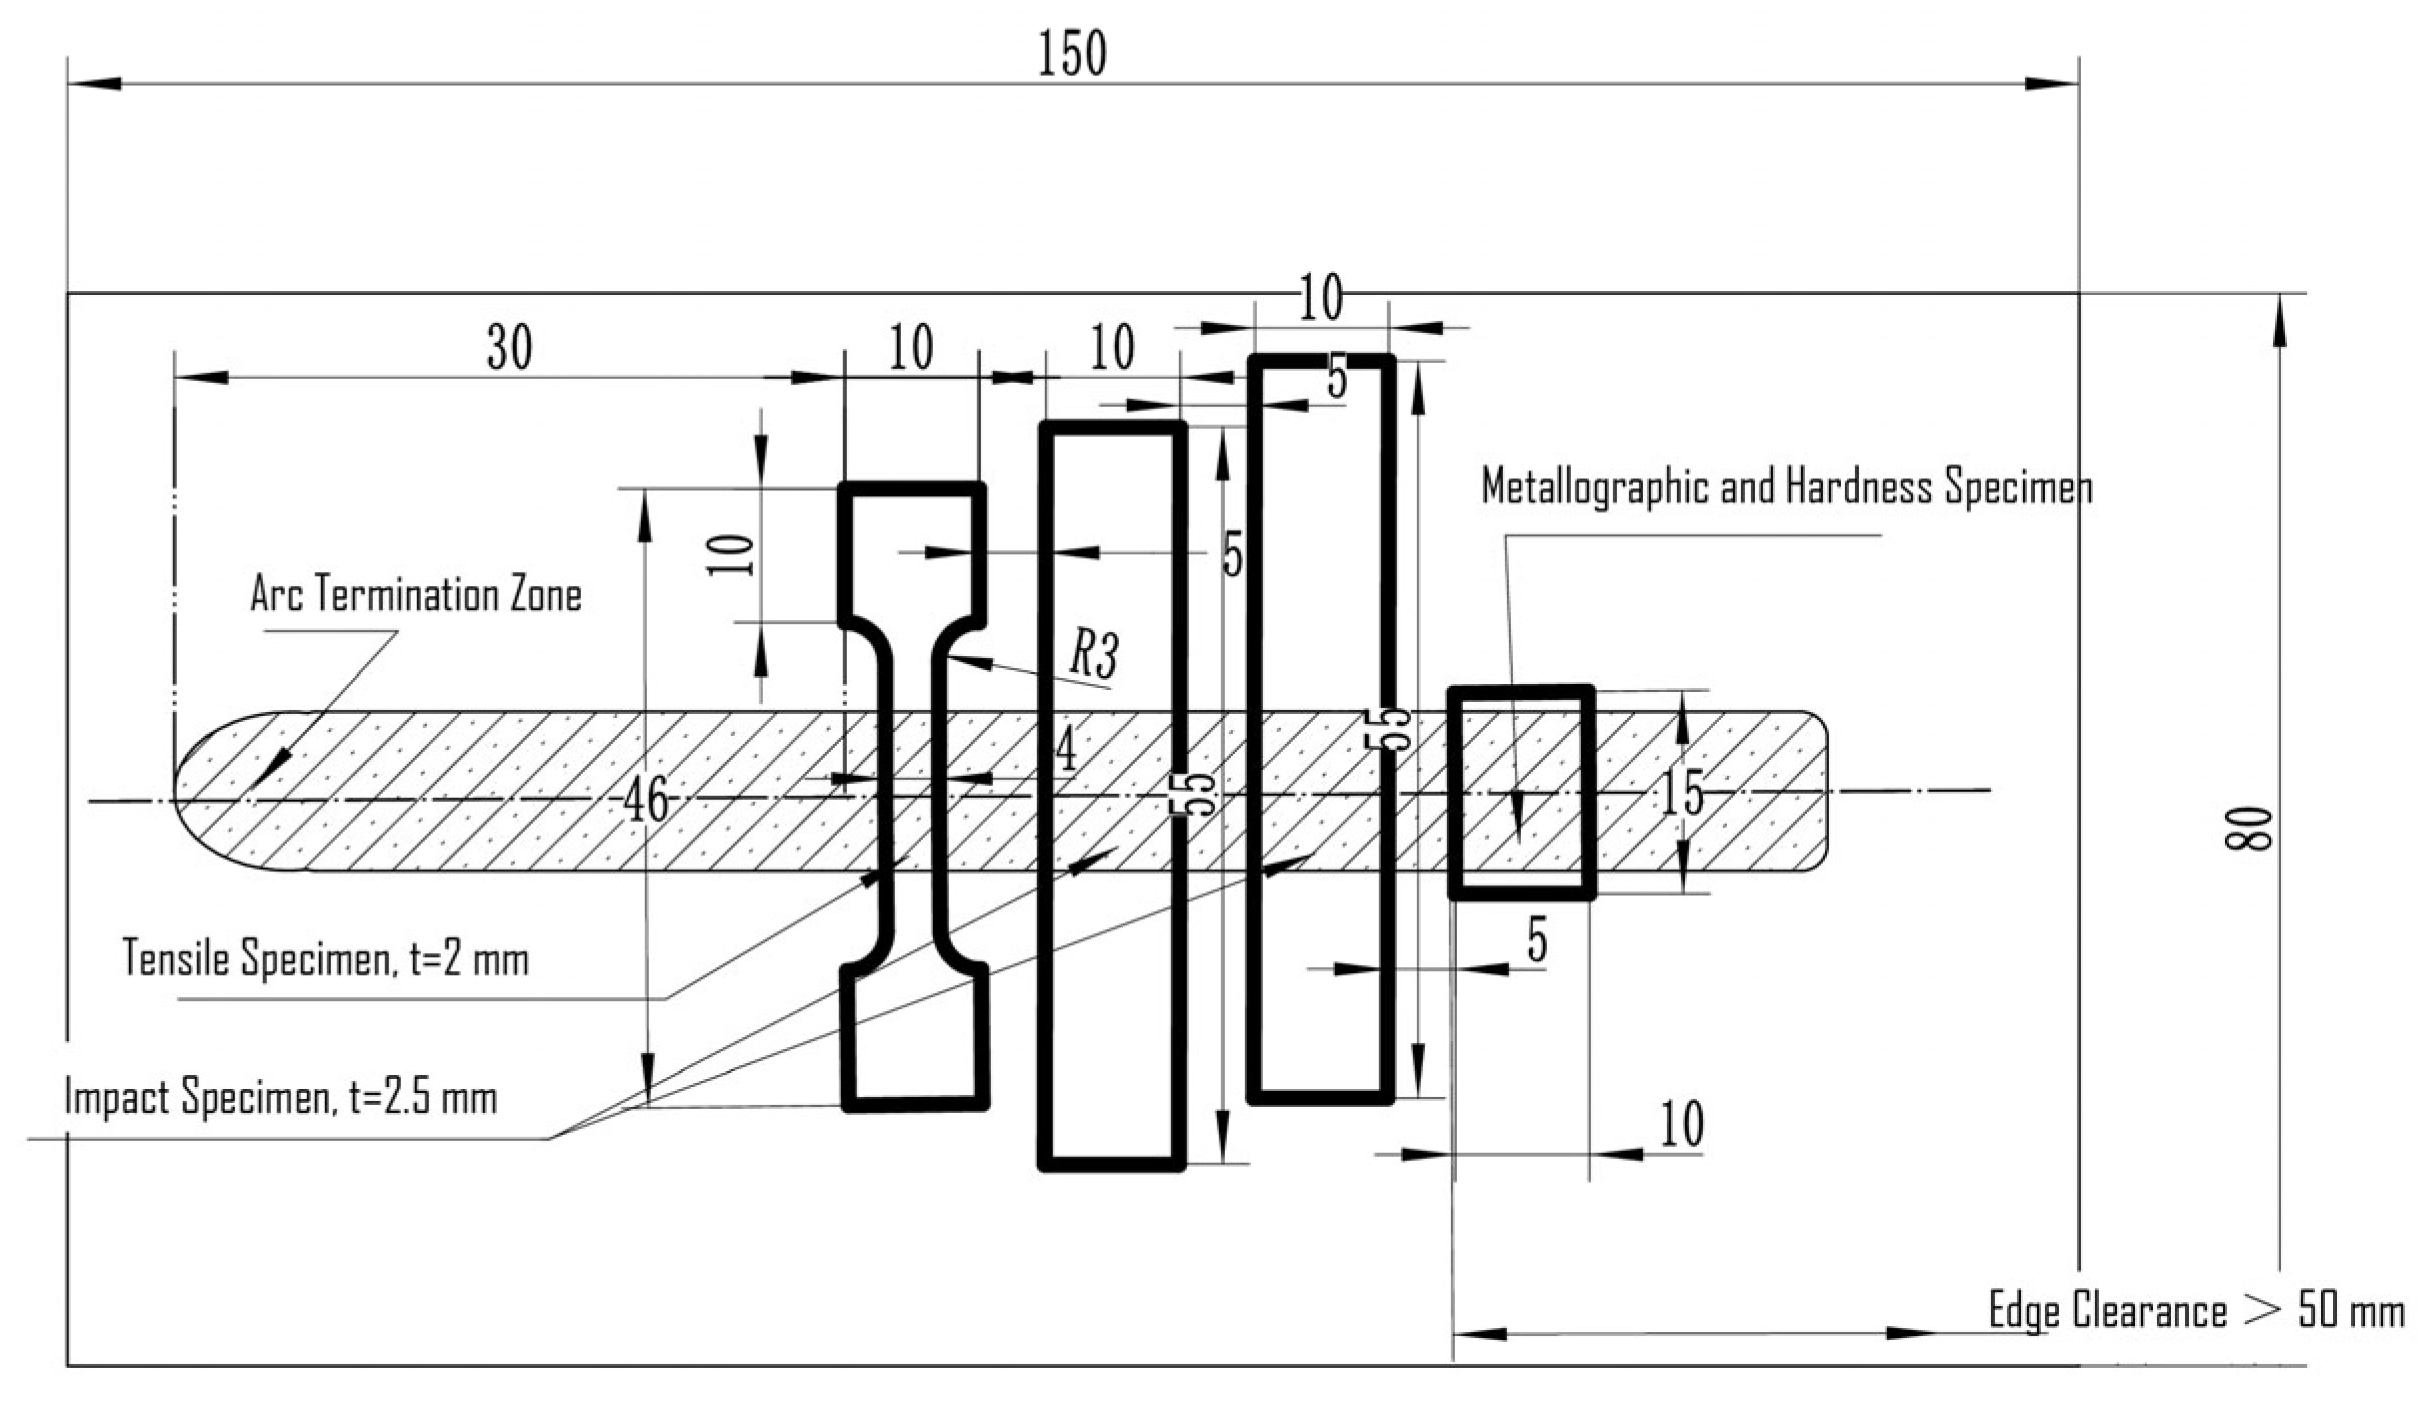
Comparative experiments were carried out among the aforementioned novel welding arc, conventional TIG welding and single-output high-frequency pulsed TIG welding, using hot-rolled AISI 316L austenitic stainless-steel plates measuring 150 mm × 80 mm × 5 mm. The chemical composition of the base metal is listed in Table 1. Butt welding without groove preparation and without filler wire was employed. The welding setup and key welding parameters are summarized in Figure 2 and Table 2. During welding, two high-speed cameras were used to record arc and molten pool behavior from the rear and side perspectives, respectively. After welding, wire electrical discharge machining (WEDM) was adopted to cut samples from the welded plates, and the detailed dimensions of each specimen are shown in Figure 3. The machined specimens were subjected to room-temperature tensile tests, room-temperature Charpy V-notch impact tests, and Vickers hardness tests. Metallographic samples were polished and etched with aqua regia prior to observation under an optical metallurgical microscope (Shanghai Optical Instrument Factory, Shanghai, and China), transmission electron microscopy (TEM) (Hitachi High-Technologies, Hitachinaka, and Japan) and energy dispersive spectroscopy (EDS) (Hitachi High-Technologies, Hitachinaka, and Japan) mapping. After stress relief via vibratory polishing, electron backscatter diffraction (EBSD) characterization was performed on the specimens.

2.2. Numerical Simulation of the Welding Molten Pool

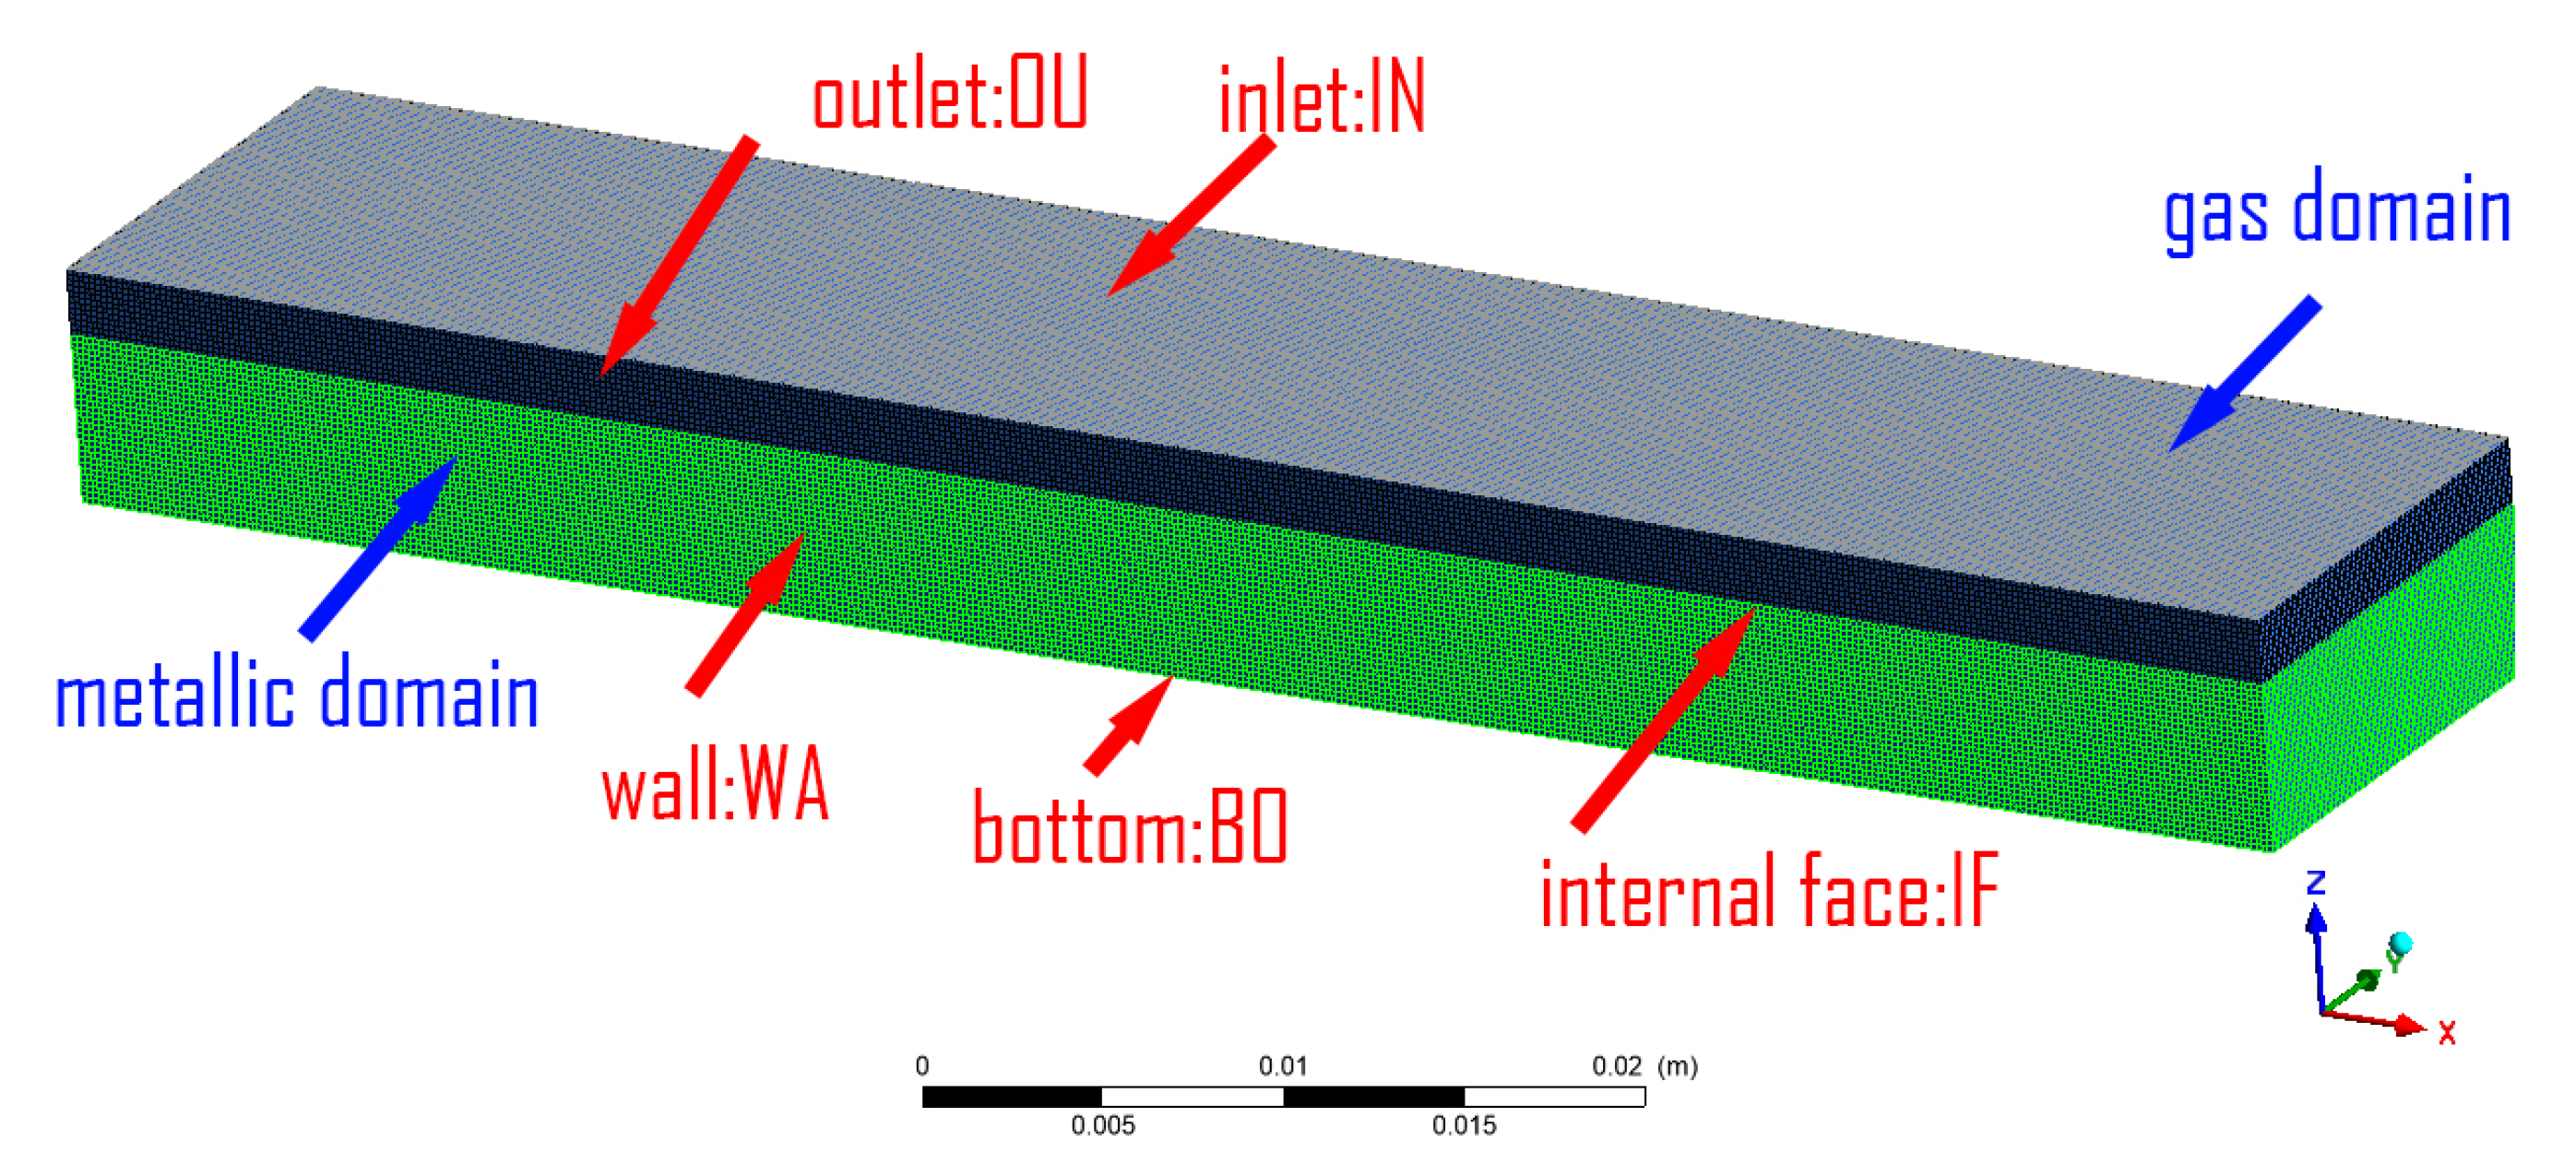
To investigate the temperature distribution, force state, and flow field of the molten pool in fast-frequency pulsed twin-TIG welding, a numerical model of the welding molten pool was established using ANSYS Fluent 2022 R2. A three-dimensional model of the metal plate was constructed with the Z-axis aligned with the plate thickness. To reduce computational cost, only the core region influenced by the welding molten pool was modeled, with model dimensions of 70 mm × 14 mm × 7 mm, including a 2 mm air layer and a 5 mm metal domain consistent with the thickness of the experimental plate. Symmetry along the YZ plane was applied to further decrease the computational load. A high-accuracy structured mesh was employed for discretization, with a total of approximately 670,000 elements. The numerical model is illustrated in Figure 4.

2.3. Thermo-Mechanical Model of the Welding Molten Pool

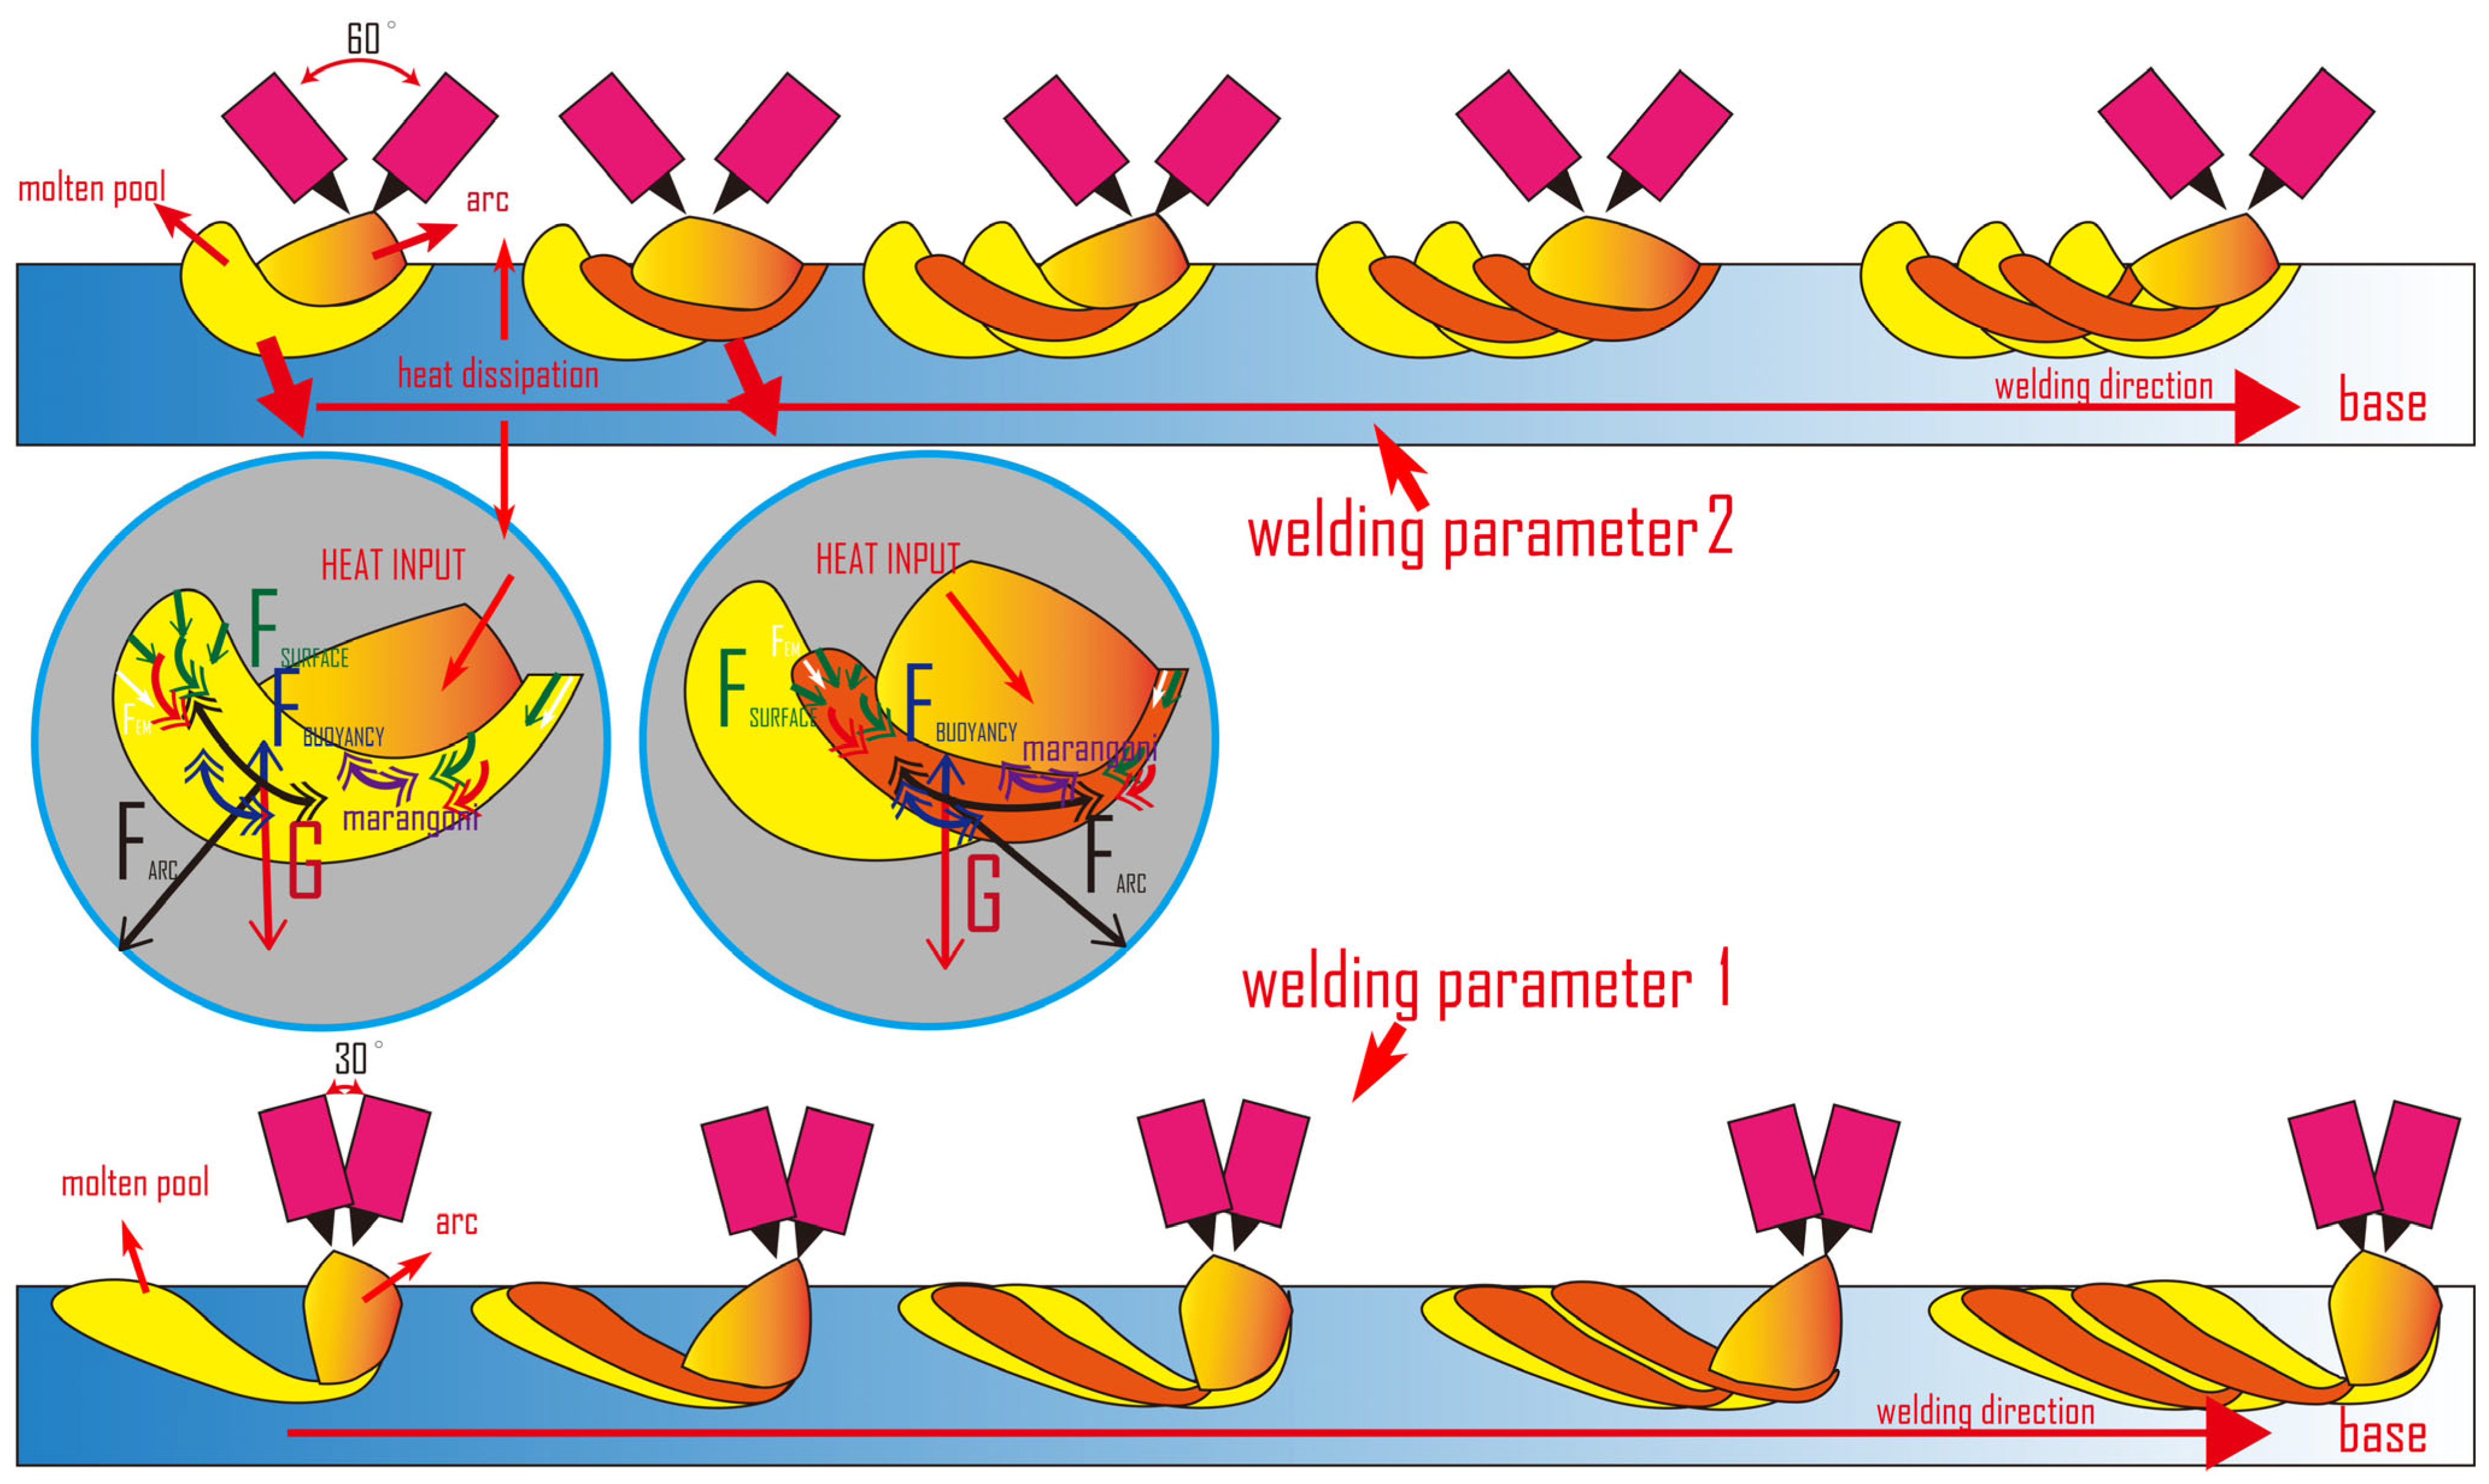
In fast-frequency pulsed twin-TIG welding of 316L stainless steel, the inclusion of dual tungsten electrodes and the alternating arc sequence introduces greater complexity in the process parameters, resulting in more intricate thermo-mechanical interactions within the molten pool. Two sets of typical welding parameters (P1 and P2) were selected for numerical simulation to elucidate the flow mechanisms of the welding molten pool. The welding parameters and material properties are listed in Table 2 and Table 3, and the thermo-mechanical analysis of the molten pool is shown in Figure 5. In this study, the numerical model considers the arc heat from the twin-TIG tungsten electrodes applied to the molten pool as a heat source, convective heat transfer between the substrate, shielding gas, and ambient environment, and radiative heat loss from the substrate to the surroundings. It also accounts for the continuous pressure and shear forces on the molten pool surface induced by the arc plasma flow, surface tension-induced contraction and Marangoni effects caused by non-uniform temperature distribution, as well as gravity and buoyancy forces within the liquid metal.
In this study, the primary driving forces of the molten pool and the continuous pressure and shear forces induced by the plasma flow were treated using a special approach, rather than following the conventional method reported by previous researchers, which introduces arc pressure into the molten pool through formulae and converts surface forces into volumetric forces via the CSF model [32,33]. Our team considered that this conventional approach deviates from reality during the application of volumetric forces, resulting in significant discrepancies between numerical simulation and experimental observations. Therefore, in this work, the plasma flow forces on the molten pool surface were applied by simulating the shielding gas (argon) flow field, which is more physically realistic and yields more accurate computational results [34].

2.4. Control Equation

In the finite element method, fundamental physical processes in fluid mechanics must satisfy the continuity equations. In this study, the continuity equations include the mass conservation equation, energy conservation equation, momentum conservation equation, and the volume fraction transport equation of the VOF model. When performing calculations in finite element fluid simulation software (ANSYS Fluent 2022 R2), only the material properties and external source terms need to be specified. The software then automatically solves and balances each set of continuity equations, thereby providing the corresponding physical quantities.
Mass Conservation Equation:
ρ t + ( ρ ν ) = 0
In the equation, ρ represents the density, v denotes the velocity, is the partial differential operator, t is time, and S is the energy source term.
Energy Conservation Equation:
( ρ C P T ) t + ( ρ v C P T ) = ( κ T ) + S
where S is the energy source term, C P is the specific heat capacity, T is the temperature, and κ is the thermal conductivity. The material properties in the equations are detailed in Table 1. The energy source term S corresponds to the external heat source, which is modeled using a commonly used double ellipsoidal welding heat source for the molten pool. The expressions for the front and rear half-ellipsoidal heat sources are given as follows:
f f r o n t ( x , y , z ) = 2 a f a f + a r × 6 3 η U I a f b c π π × exp [ ( 3 x 2 ( a f / cos θ ) 2 ) 3 y 2 b 2 3 z 2 ( c / cos θ ) 2 ) ]
f b a c k ( x , y , z ) = 2 a r a f + a r × 6 3 η U I a r b c π π × exp [ ( 3 x 2 ( a r / cos θ ) 2 ) 3 y 2 b 2 3 z 2 ( c / cos θ ) 2 ) ]
In the equations, af, ar, b, and c represent the dimensions of the double ellipsoid shape, θ denotes the welding gun angle (the angle of the arc tail in high-speed welding), U is the voltage, I is the current, and η represents the power efficiency of TIG welding.
Momentum Conservation Equation:
( ρ v ) t + ( ρ v v ) = τ + S
In the equation, S represents the momentum source term, and τ denotes the stress tensor.
The momentum source term in Equation (5) is as follows:
S = P + F + ρ g
In the equation, P represents the fluid pressure, the fluid shear force, and the resultant surface tension force; F represents the internal forces in the liquid, including buoyancy and the electromagnetic forces generated by the arc, and g is the acceleration due to gravity. The buoyancy formula in the Boussinesq model for liquids is as follows:
F = ρ g β ( T T 1 )
In the equation, T1 represents the melting temperature, and β is the coefficient in the Boussinesq buoyancy model. The electromagnetic force is applied as a volumetric force F e m = J × B , where J denotes the current density and B the magnetic flux density [35].
Continuity Equation of the Free Surface VOF Model:
Φ t + · ( v Φ ) = 0
In the equation, Φ represents the volume fraction of the liquid. The Laplace surface tension formula is as follows:
P c a = γ κ 1 n
In the equation, P c a represents the surface tension, γ denotes the surface tension coefficient, κ 1 is the curvature of the free surface in the VOF model, and n is the unit normal vector.
The formula for the Marangoni effect caused by the temperature gradient of the liquid surface is as follows:
τ M a = γ T T s
In the equation, τ M a represents the Marangoni shear force, and s is the tangential vector at the free surface in the VOF model. In the software, it is only necessary to set the surface tension coefficient γ ; all other parameters are computed automatically by the computer. The formula for the surface tension coefficient is as follows:
γ = 1.6 γ M a ( T T 1 )
In the equation, γ M a represents the Marangoni force coefficient.

2.5. Boundary Conditions

The boundaries of the numerical model are labeled in Figure 3, and the corresponding boundary conditions are listed in Table 4. In fast-frequency pulsed twin-TIG welding, the inlet velocity and temperature continuously vary with the alternating arc sequence of the twin tungsten electrodes. This cyclic variation is implemented in the software by combining time-dependent functions with conditional variables. The inlet velocity is specified to provide realistic plasma flow pressure, while the inlet temperature is set to minimize heat exchange between the plasma flow and the molten pool.

3. Results and Discussion

3.1. Welding Experiments and Mechanical Properties of the Weld Joints

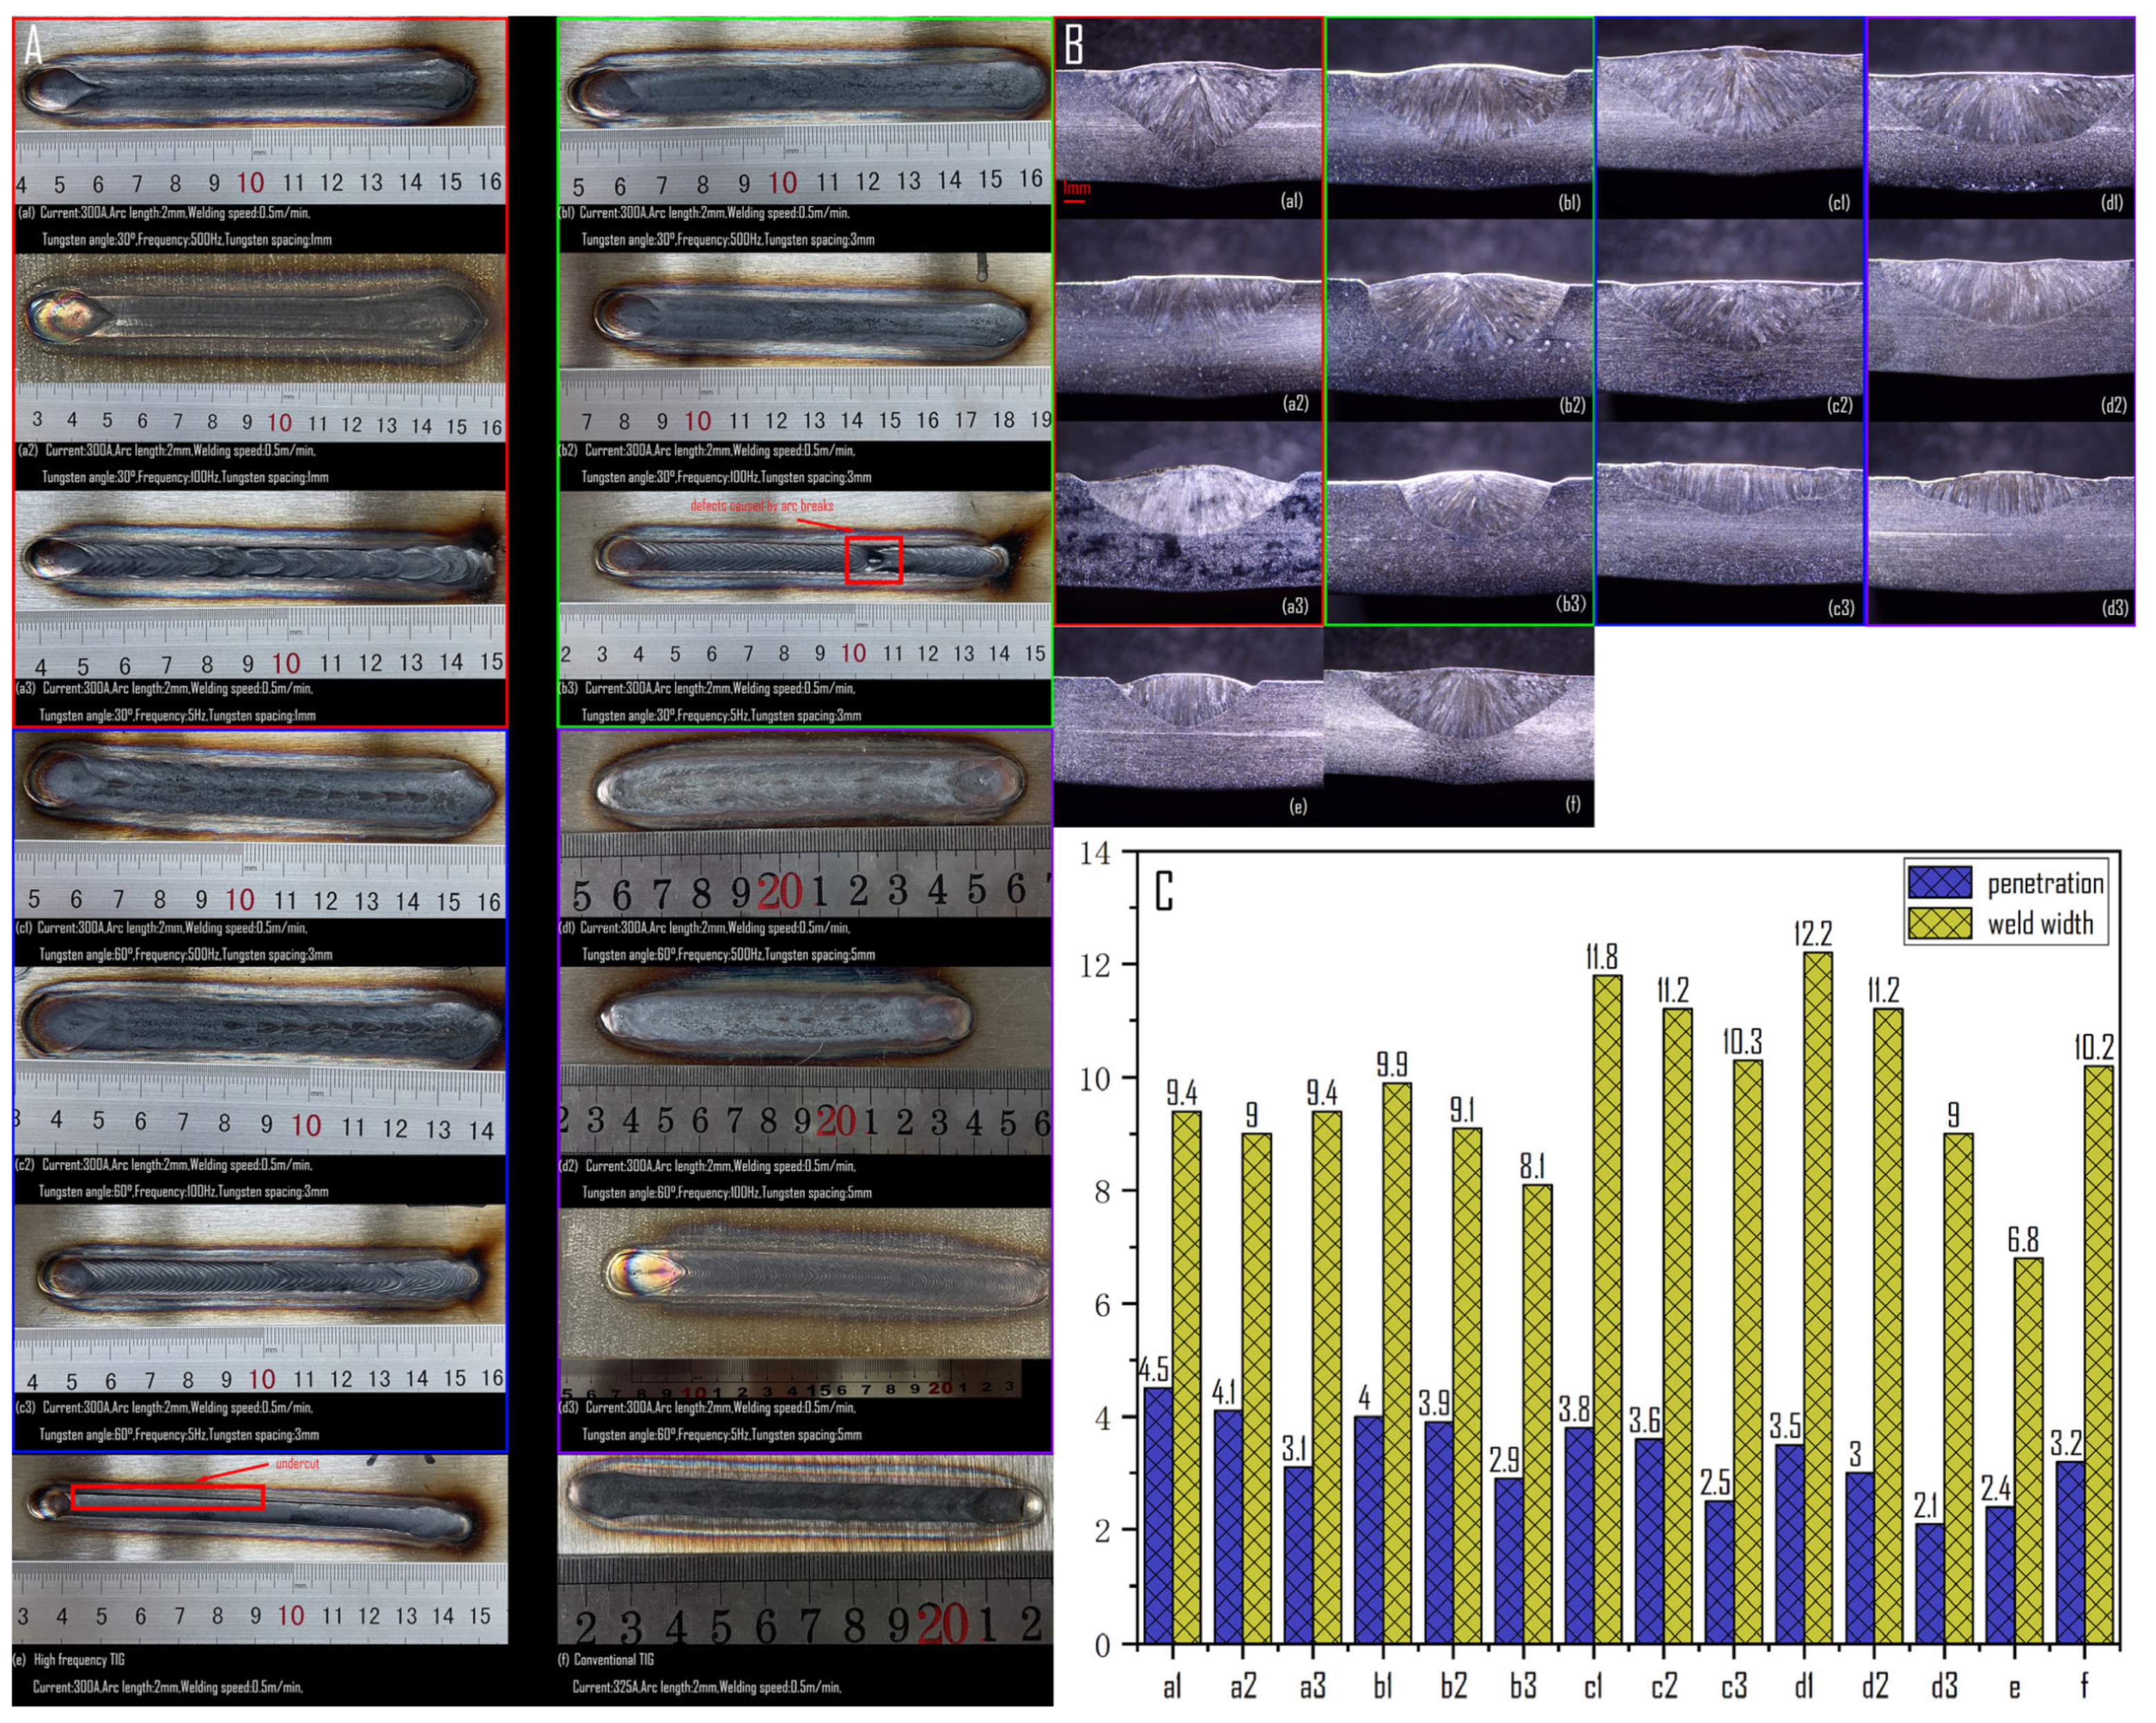
To evaluate the performance of fast-frequency pulsed twin-TIG welding under high overall welding efficiency, welding experiments were conducted using a high-efficiency welding current and high welding speed, while maintaining a constant arc length (welding current 300 A, welding speed 0.5 m/min, arc length 2 mm). By varying the angles of the twin tungsten electrodes, the electrode spacing, and the alternating arc frequency, the weld appearance as well as the molten pool penetration and width of the weld joints were compared under different parameters. Because the twin fast-frequency TIG arcs have only about 1/14 of the dual-arc coupling time, as shown in Figure 1, conventional DC TIG welding (welding current 325 A, welding speed 0.5 m/min, arc length 2 mm) was used for comparison, and single-output high-frequency welding (welding current 300 A, welding speed 0.5 m/min, arc length 2 mm, arc frequency 20 kHz, triangular waveform) were also conducted under the same parameters. The weld appearances and the molten pool penetration and width are presented in Figure 6. The results indicate that groups (a) and (b) exhibit greater penetration, with the cross-section of the weld joints forming a funnel shape and a high depth-to-width ratio, representing an ideal high-efficiency weld morphology. As the tungsten electrode angle and spacing increase, the weld transitions from a funnel shape to a disk shape, with a significant increase in the depth-to-width ratio, reducing its practical application value. Compared with single-output high-frequency welding and conventional TIG welding, the (a1) weld achieves a penetration of 4.5 mm with a depth-to-width ratio of 0.48, representing an 87.5% increase in penetration and a 37% increase in depth-to-width ratio over single-output high-frequency welding, and a 40.6% increase in penetration and a 55% increase in depth-to-width ratio over conventional TIG welding.
Observations of the weld appearances indicate that at an alternating frequency of 5 Hz, the weld surface exhibits a fish-scale pattern similar to that of manual welding. At this frequency, edge undercut defects are prone to occur. In group (a), deep arc burn pits are observed at the arc termination position, which may lead to stress concentration; therefore, process measures should be implemented in practical applications to prevent arc burn crack formation. In the (e) single-output high-frequency welding, due to the relatively low heat input and the concentrated arc energy, nearly the entire weld exhibits edge undercut at this welding speed. Overall, fast-frequency pulsed twin-TIG welding is highly stable at higher tungsten electrode alternating frequencies, with surface defects only observed in (b3) under low-frequency conditions caused by an arc burnout event. Increasing the arc sustaining current appropriately can mitigate the occurrence of arc burnout.
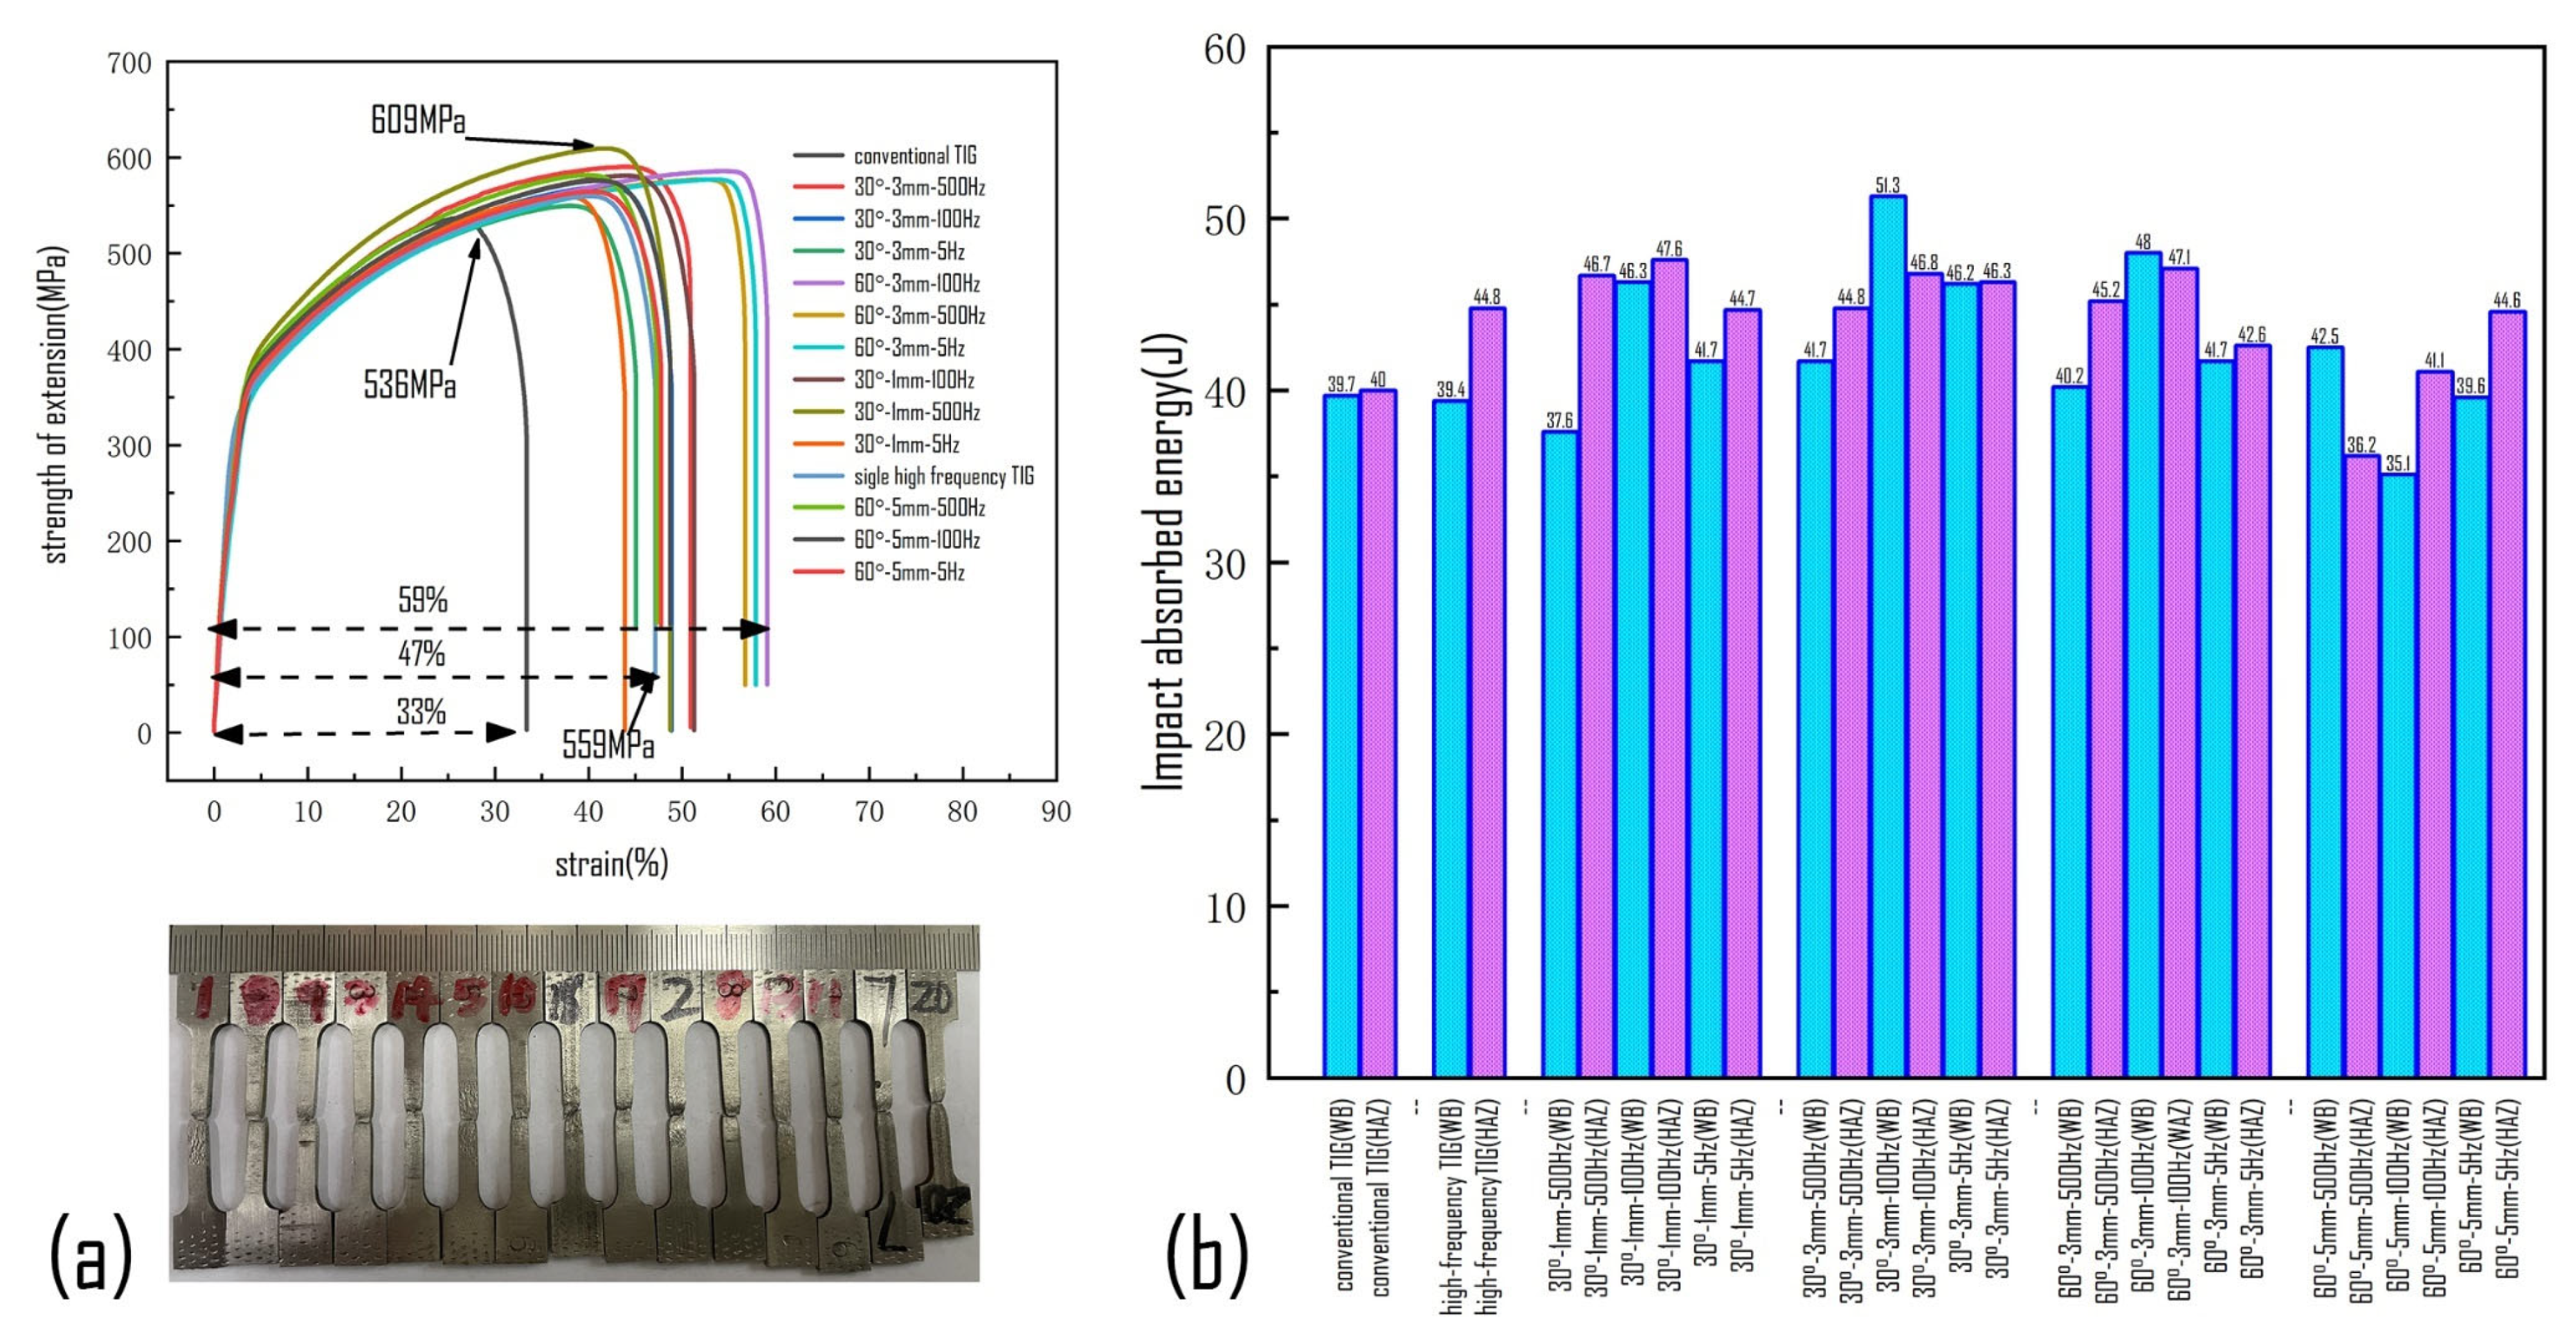
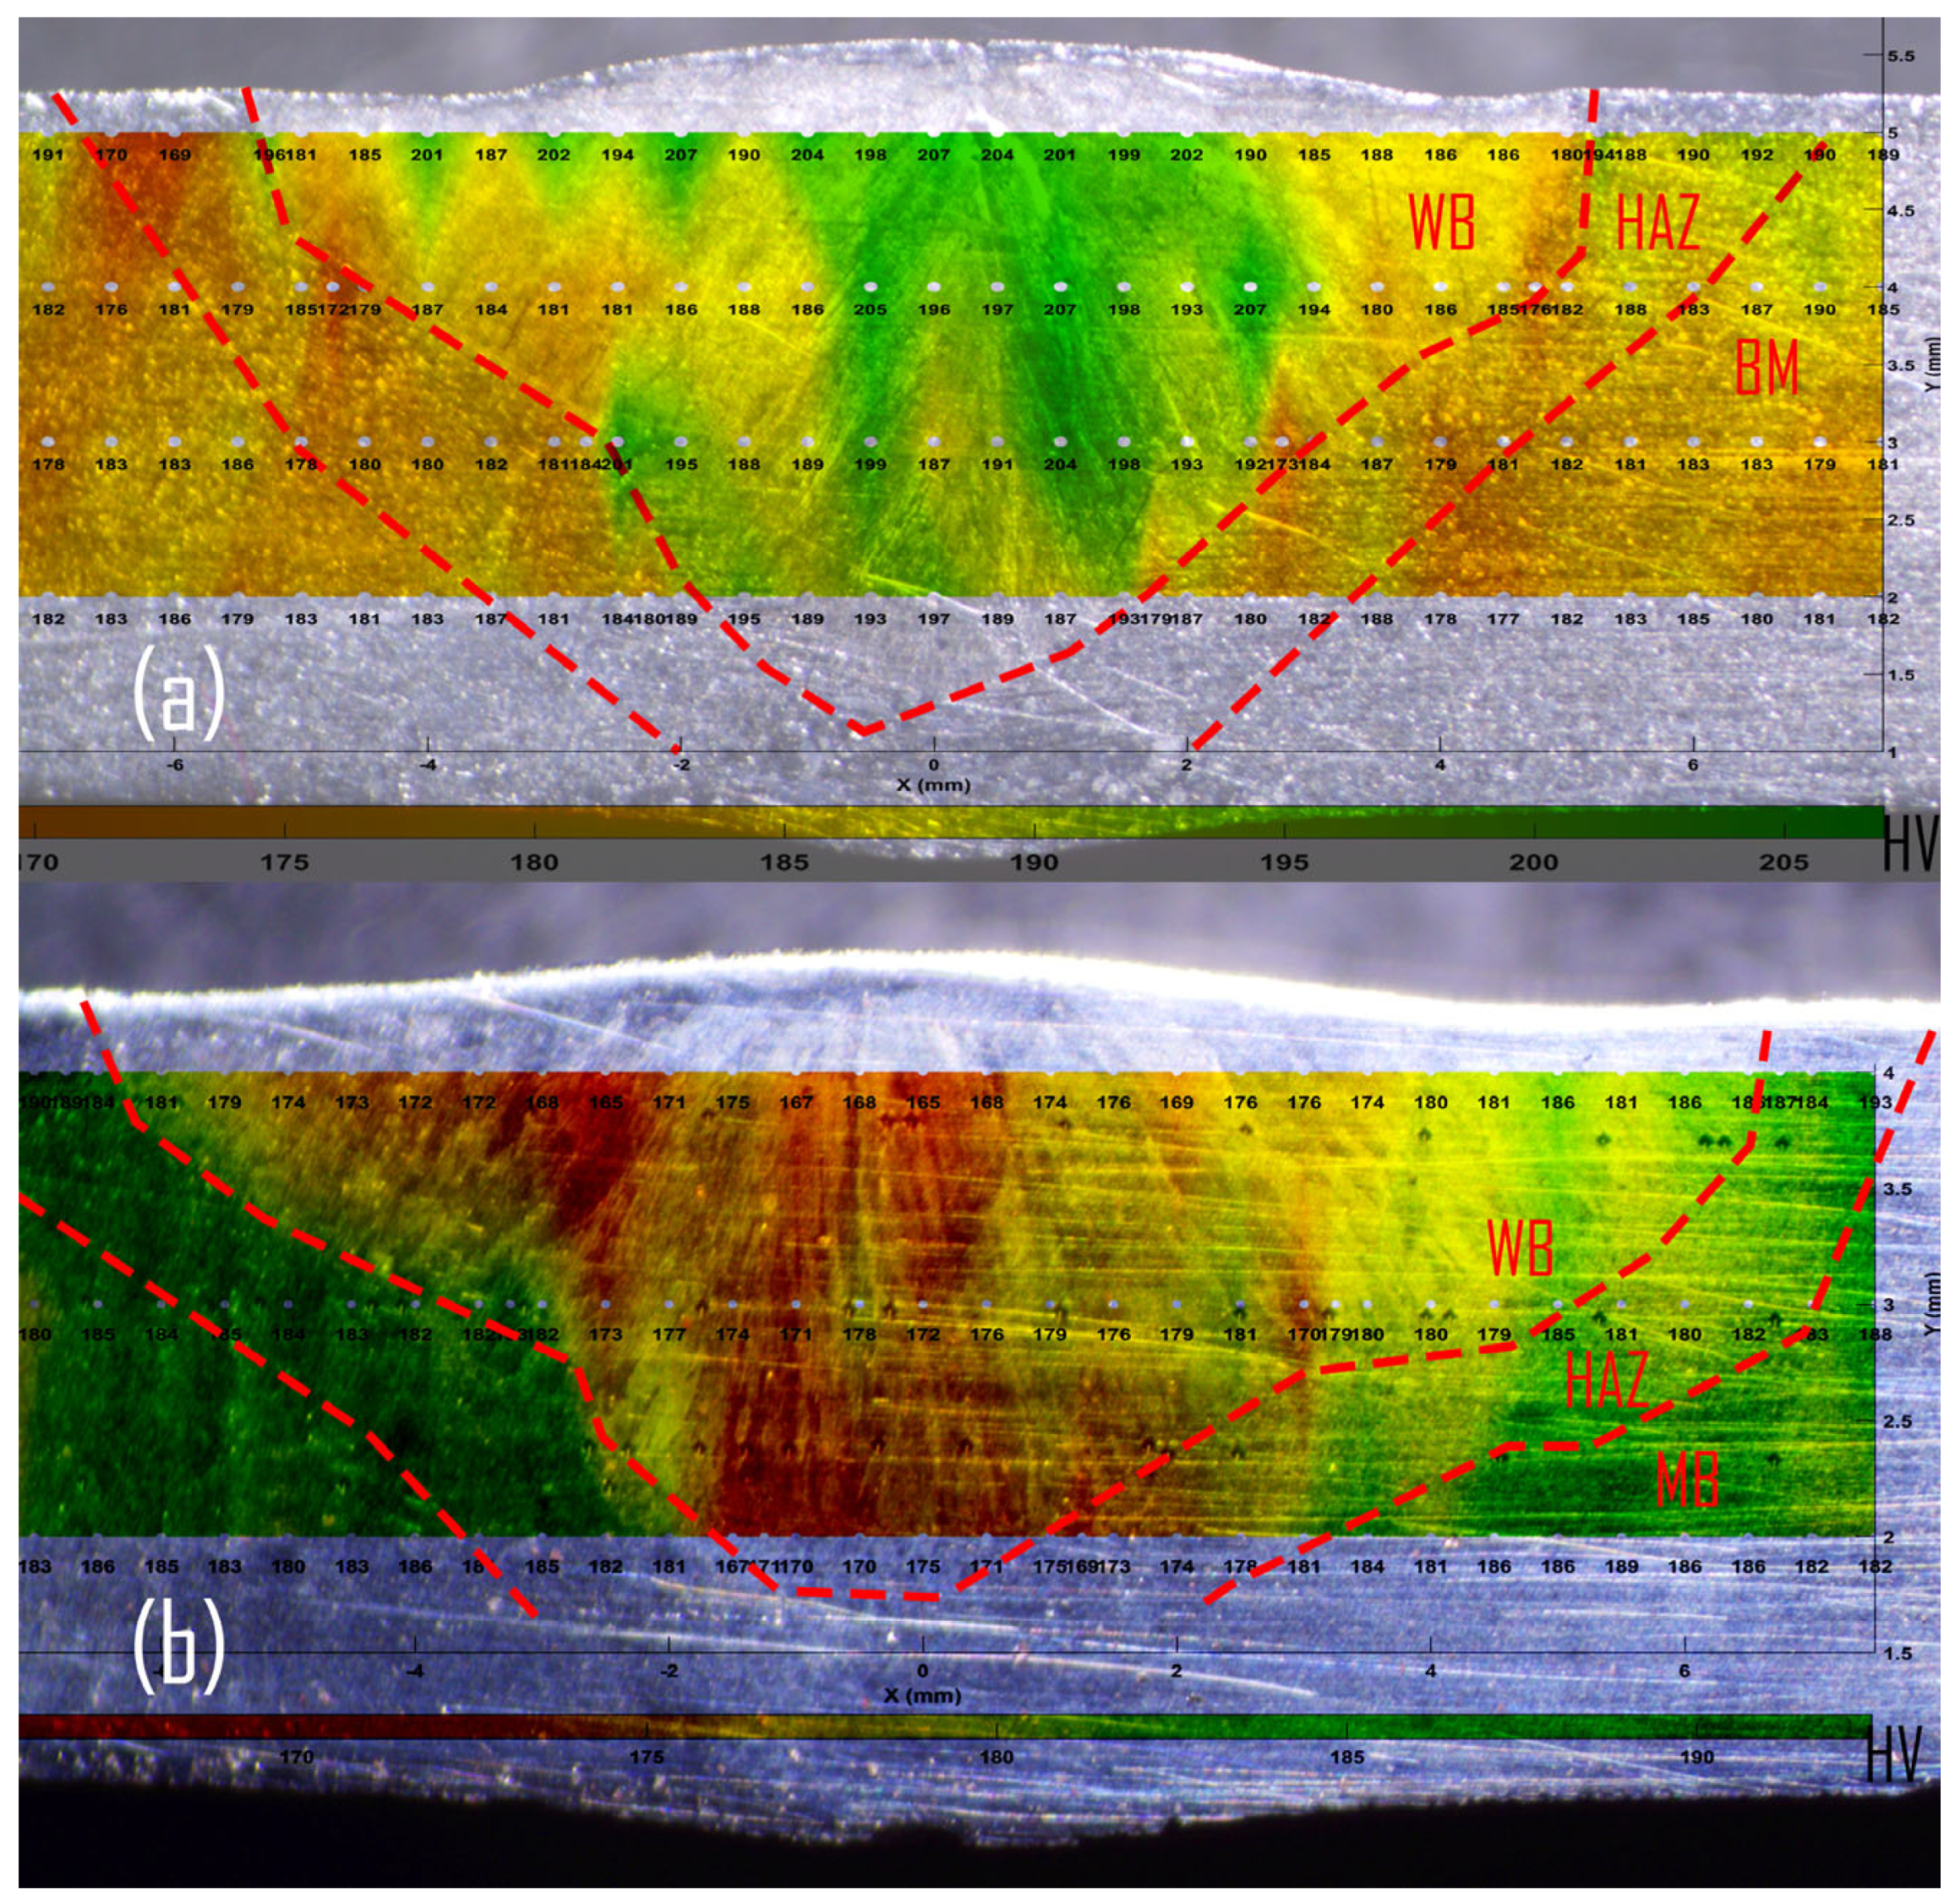
The tensile and impact tests were sampled in accordance with the Chinese standards GB/T 228.1 and JB 4708, respectively. The tensile properties and impact energies are presented in Figure 7, and the Vickers hardness distributions in Figure 8. Compared with conventional TIG welding, fast-frequency pulsed twin-TIG welding exhibits enhanced tensile strength and elongation. In conventional TIG welding, continuous high current output leads to significant grain coarsening in the weld and HAZ, resulting in notable degradation of material properties. The maximum tensile strength of fast-frequency pulsed twin-TIG welding increased by 13.6%, and the elongation improved by 26%. Furthermore, the average Charpy impact energy of the fast-frequency pulsed twin-TIG weld and HAZ were 42.66 J and 44.48 J, respectively, corresponding to increases of 7.5% and 11.2% compared with conventional TIG welding. For the (a1) weld zone and HAZ, the average Vickers hardness of the fast-frequency pulsed twin-TIG welding were 192.4 HV and 182.1 HV, respectively, while for conventional TIG welding, the average hardness values were 174.9 HV and 182.2 HV. The weld zone hardness increased by approximately 10%, indirectly indicating that the fast-frequency pulsed twin-TIG welding possesses higher strength, consistent with the tensile test results.

3.2. Flow Behavior of the Welding Molten Pool

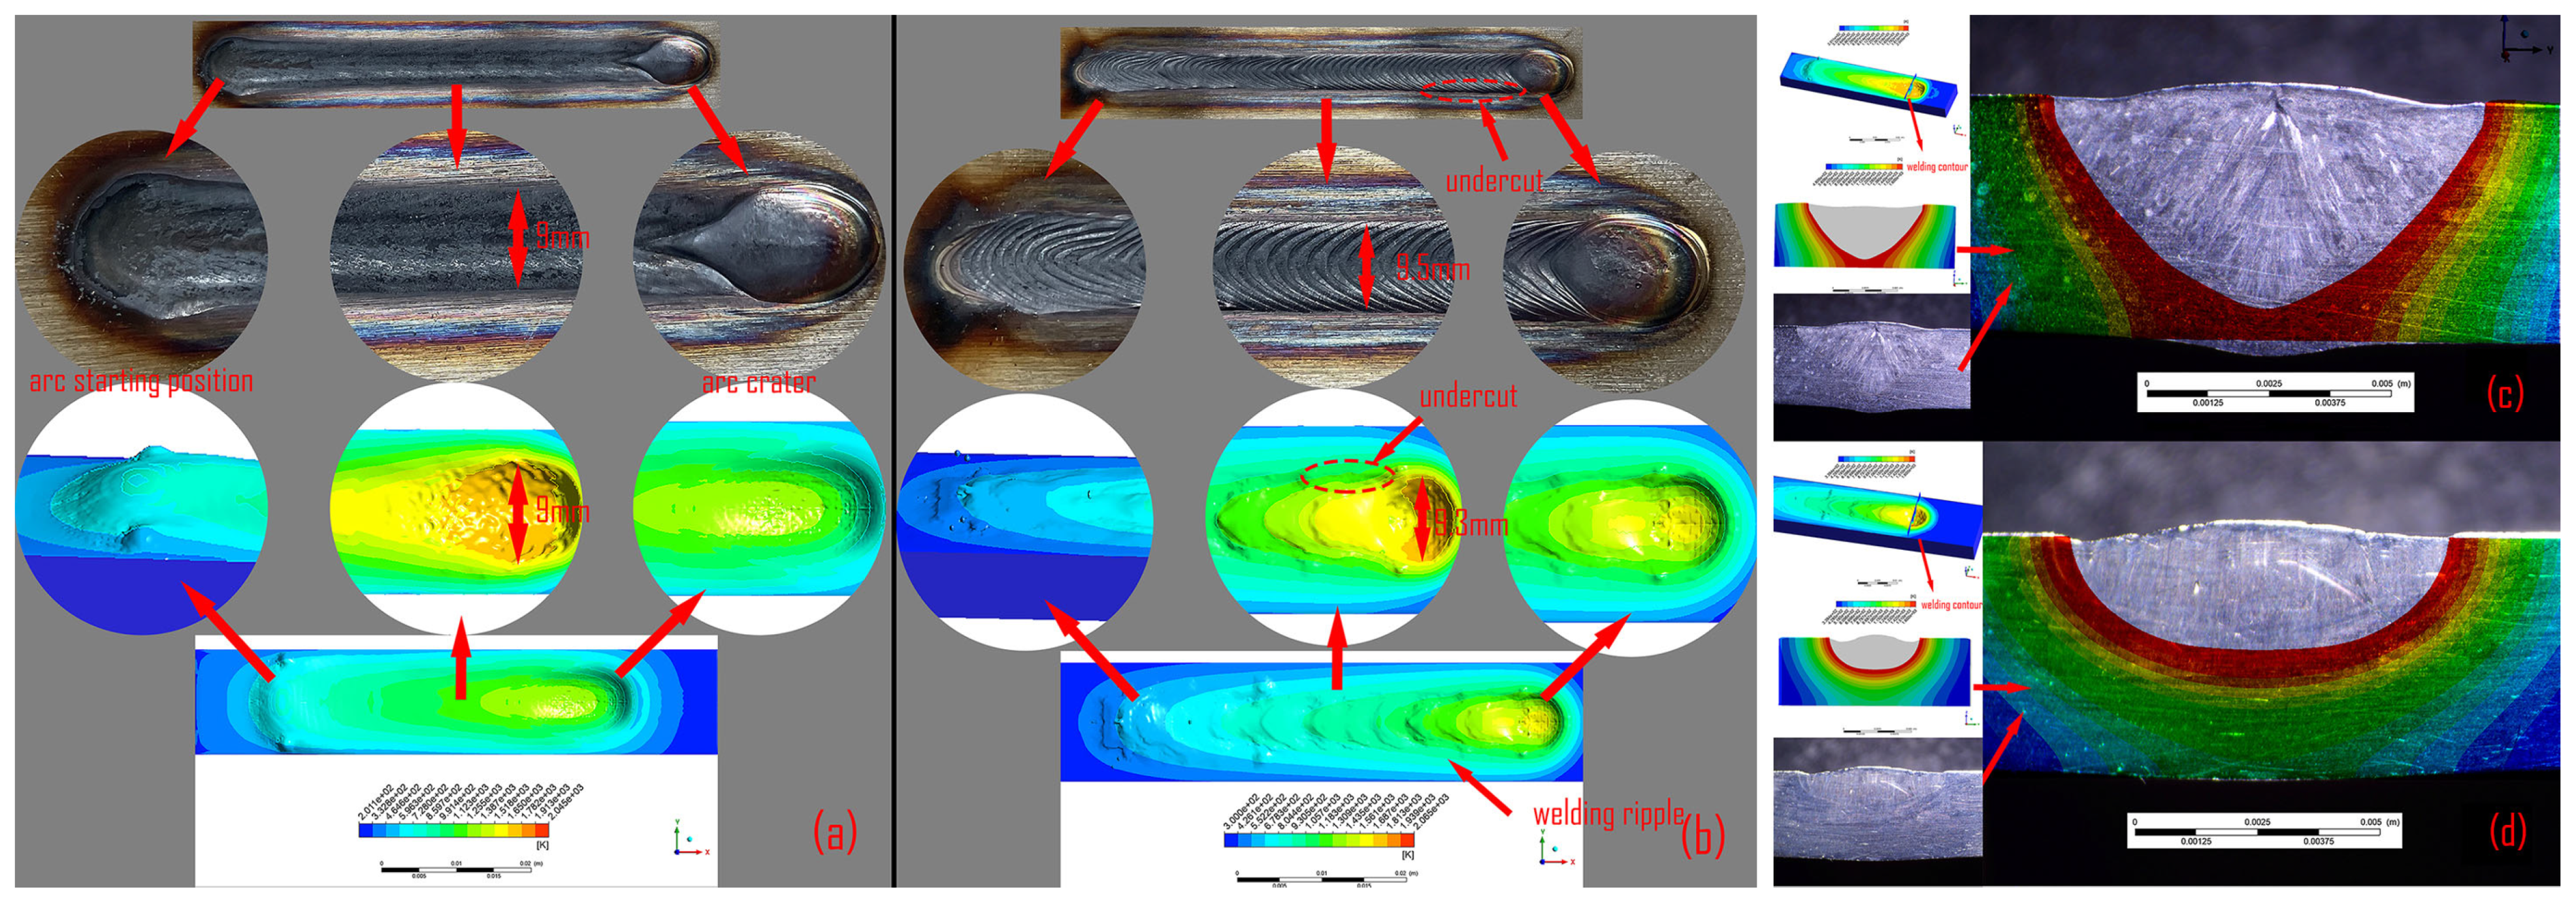
The numerical simulation results of the welding molten pool under the two sets of process parameters were compared with the corresponding weld appearances in Figure 6(a1,c3), as shown in Figure 9. In Figure 9a, the arc burn morphology from the arc start to the arc termination in the simulated weld closely matches the experimental weld. In Figure 9b, in addition to the consistent morphology at the arc start and termination positions, surface ripples and edge undercut defects caused by the low alternating frequency are also clearly reflected in the simulated weld morphology. Similarly, in Figure 9c,d, the cross-sections of the simulated weld joints exhibit a high degree of agreement with the experimental results. The dimensional errors of penetration depth and bead width between the numerical model and experimental welds are within 5%. These observations demonstrate the excellent fidelity of the numerical simulation for the weld molten pool.
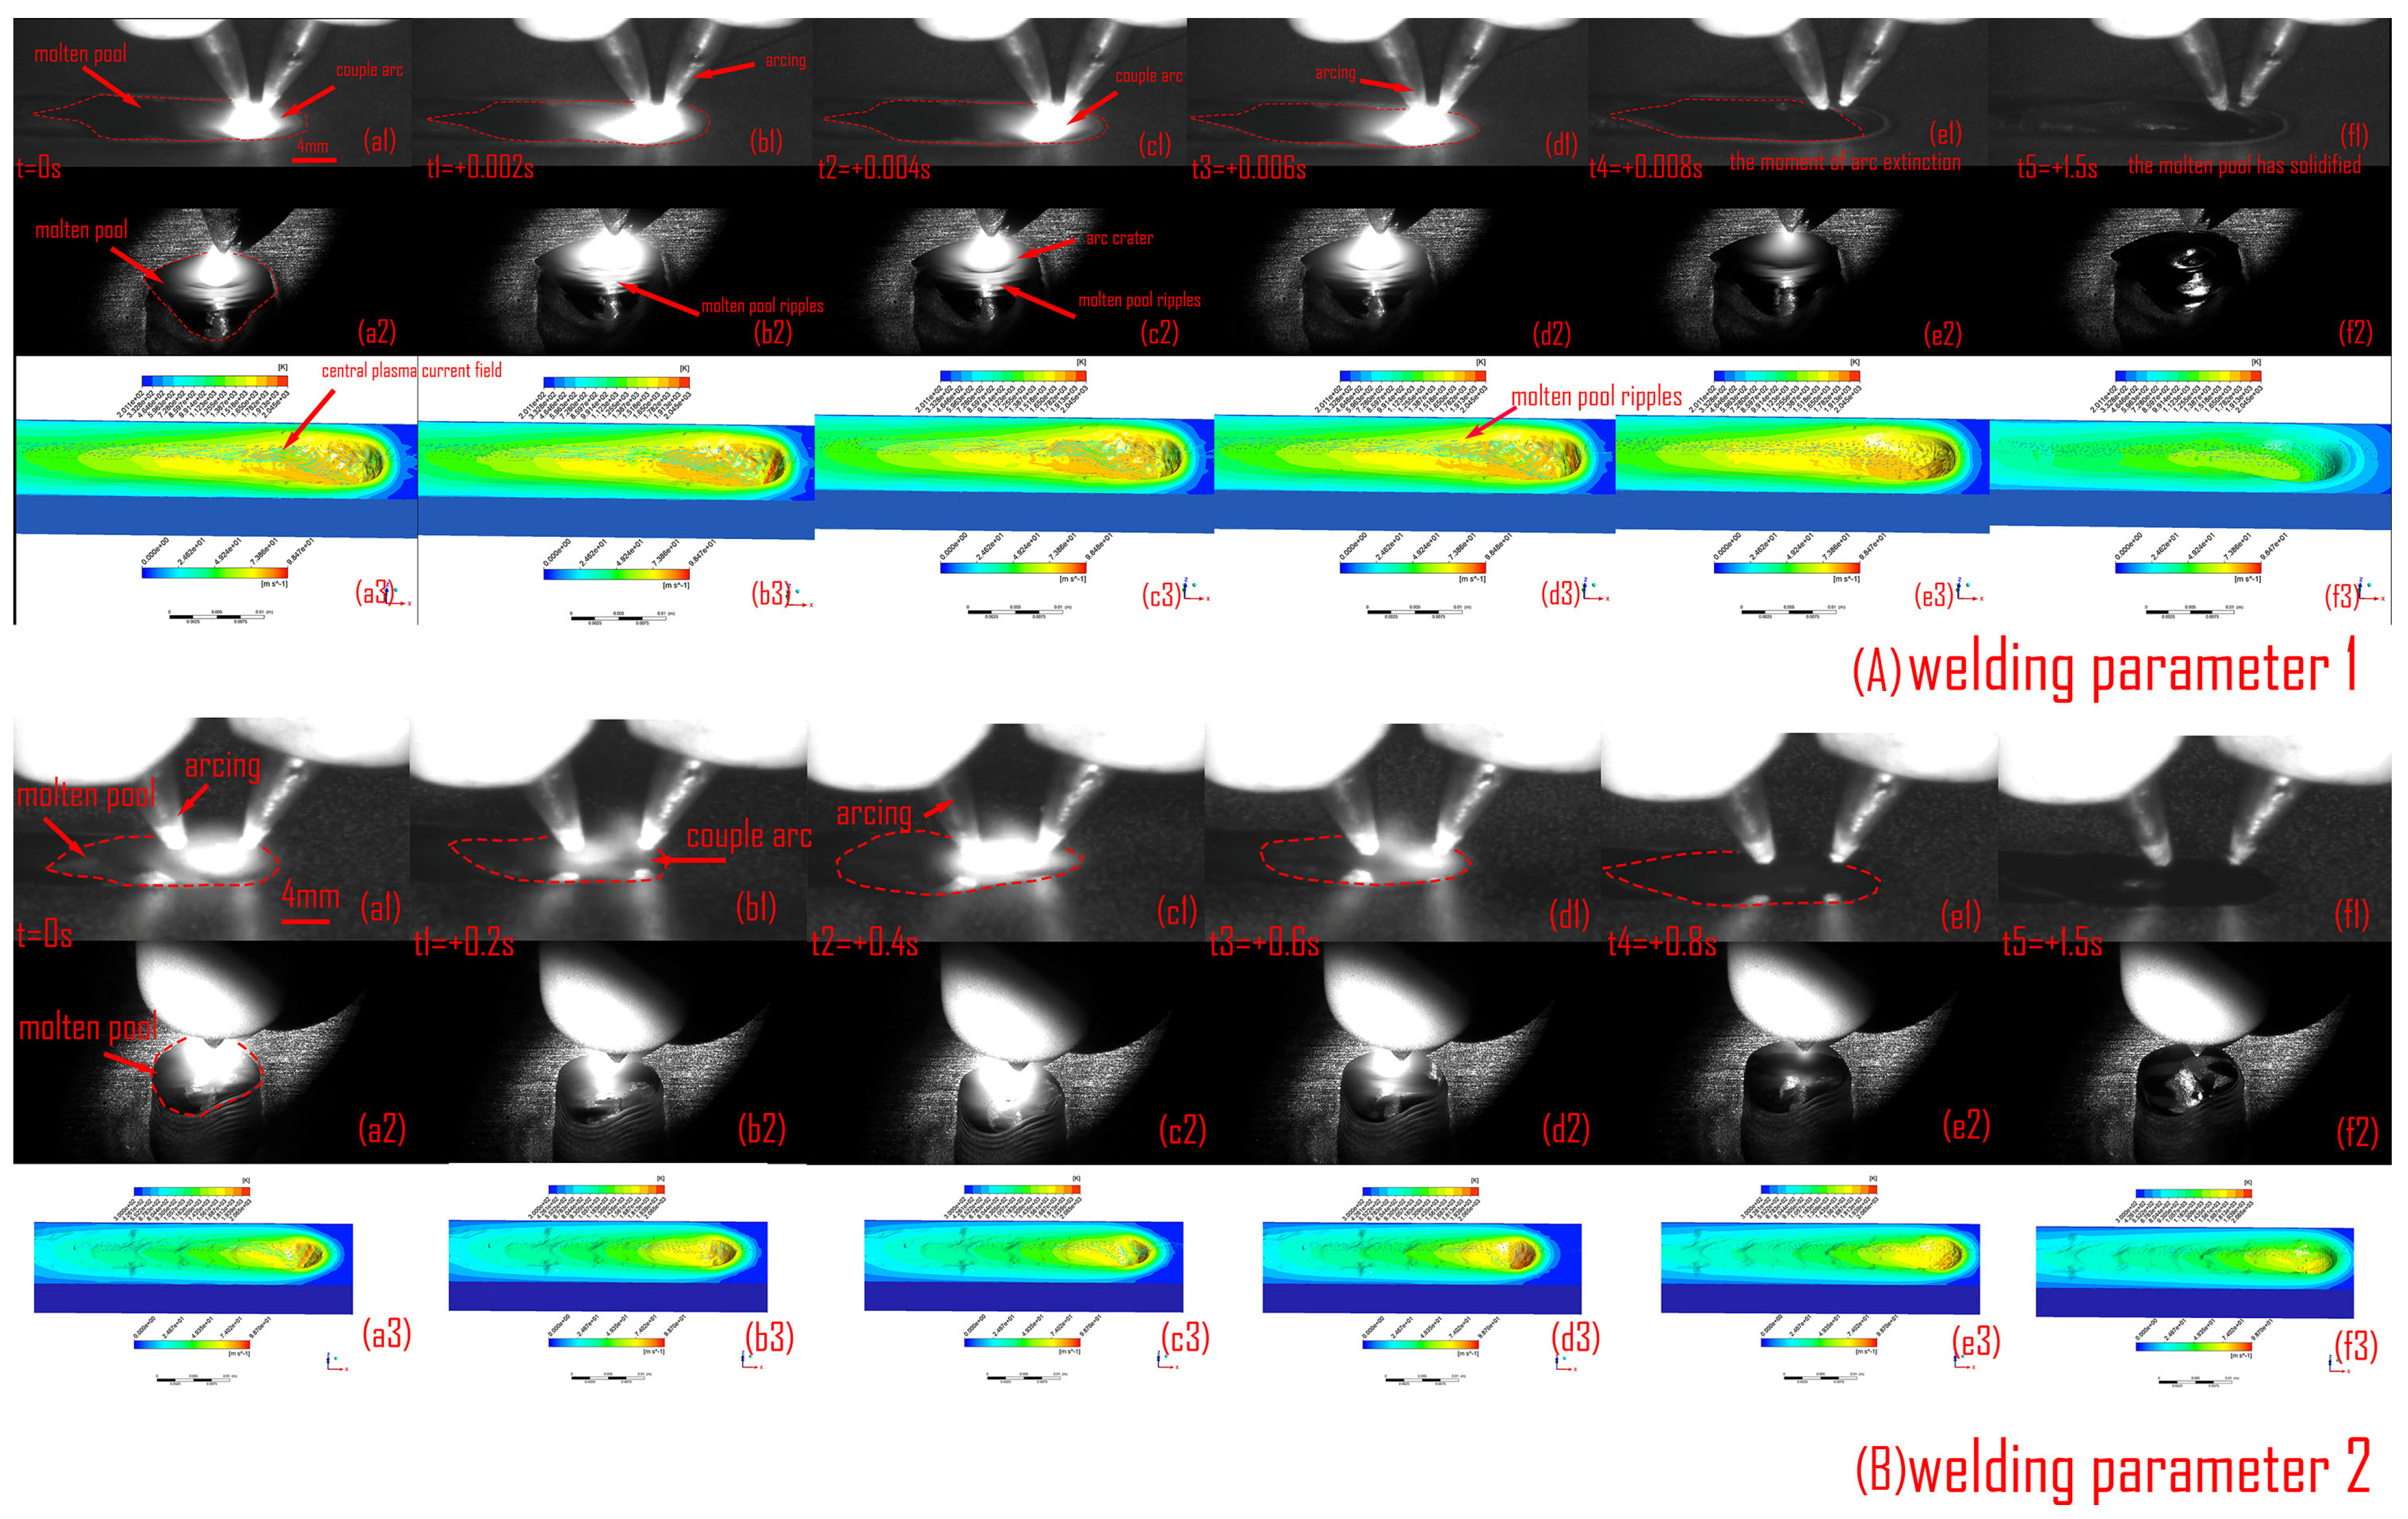
High-speed cameras captured the molten pool morphology from two directions during a single arc alternation cycle under the two aforementioned welding process parameters, as well as at the instant of arc extinction at the end of welding. These images were compared with the corresponding numerical simulation results, as shown in Figure 10. It can be observed that the dynamic dimensions of the molten pool closely match those in the simulation. Under welding parameter 1, the molten pool length is approximately 20 mm, while under welding parameter 2, it is approximately 10 mm. The molten pool morphology at the moment of arc extinction also agrees well with the simulation results. Observations from high-speed photography reveal that at a higher tungsten electrode alternating frequency (500 Hz), the molten pool surface exhibits pronounced ripples. This phenomenon is also evident in the numerical simulation, as shown in Figure 10 (welding parameter 2), indicating that high-speed arc alternation induces a strong oscillatory effect on the molten pool.
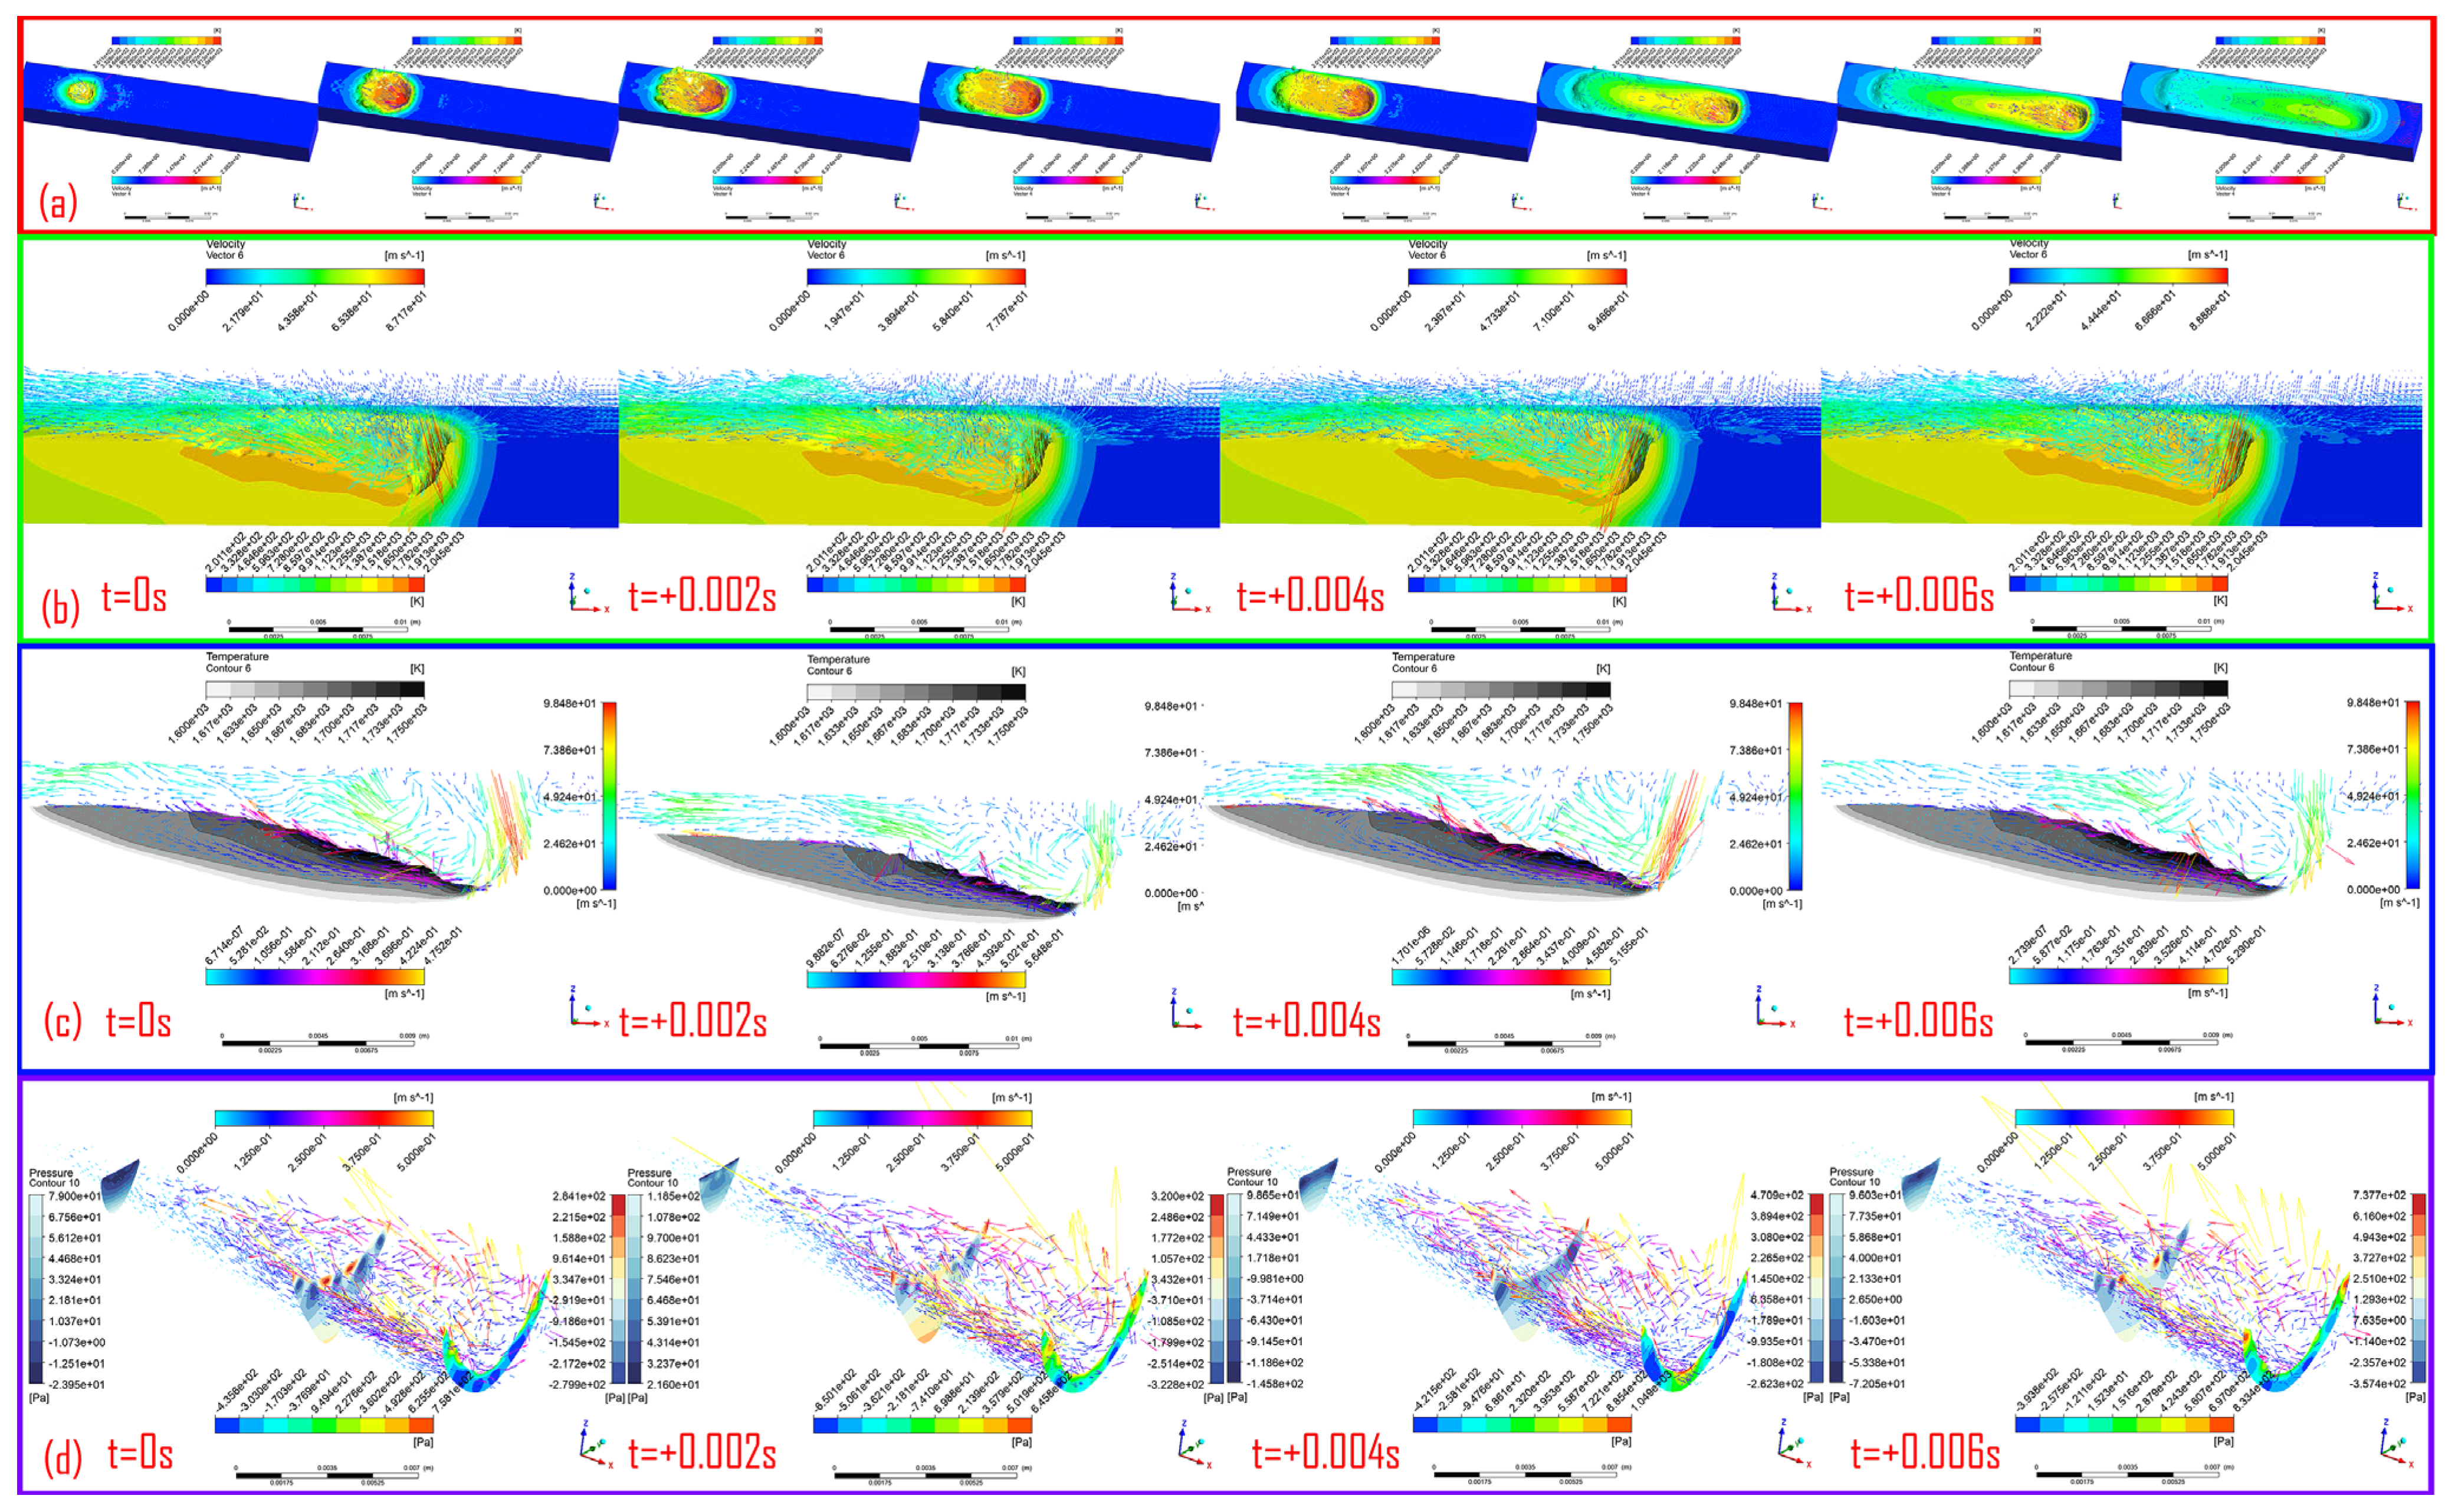
Based on the above results, the numerical simulation of the molten pool in fast-frequency pulsed twin-TIG welding shows excellent agreement with the experimental observations, which validates the reliability of using numerical models to investigate molten pool flow behavior. The simulated flow field under welding parameter 1 is presented in Figure 11. Figure 11a illustrates the entire weld formation process under this parameter, while Figure 11b,c show the evolution of the shielding gas flow field above the molten pool and the flow field in the central cross-section of the molten pool within a single arc alternation cycle, respectively. Figure 11d depicts the overall flow state and evolution of the molten pool during the same arc alternation cycle, with the resultant pressure exerted by liquid metal flow annotated at the front, middle, and rear regions of the molten pool.
Once the process reaches a stable welding stage, the molten pool size is approximately 20 mm under welding parameter 1. The strong plasma flow generated by the shielding gas drives liquid metal to flow rapidly backward along the upper surface and sides of the molten pool. Due to continuous variations in arc direction and plasma force, the backward flow velocity fluctuates, which explains the rippled surface morphology observed in the high-speed imaging. As the liquid metal flows backward, its velocity gradually decreases under the combined effects of viscous forces, surface tension, and electromagnetic forces, leading to continuous downward and central backflow. The lower region of the molten pool acts as a recirculation channel, where the velocity is higher near the arc impingement zone. Compared with direct arc heating, the backflow of high-temperature liquid contributes more significantly to penetration depth. Analysis of the pressure distribution at different molten pool locations further reveals that the force state at the pool bottom changes continuously under the action of liquid metal flow, exhibiting a clear periodicity synchronized with the arc alternation cycle. For instance, at the central bottom region, the pressure varies from −430 Pa to −360 Pa, then to 230 Pa, and finally to −260 Pa within a single cycle. Such periodic force fluctuations strongly affect the crystallization and solidification behavior at the molten pool bottom. Moreover, the magnitude of force variation decreases gradually from the bottom solidification zone to the upper region, with the fluctuation range in the upper central solidification region remaining within 100 Pa.
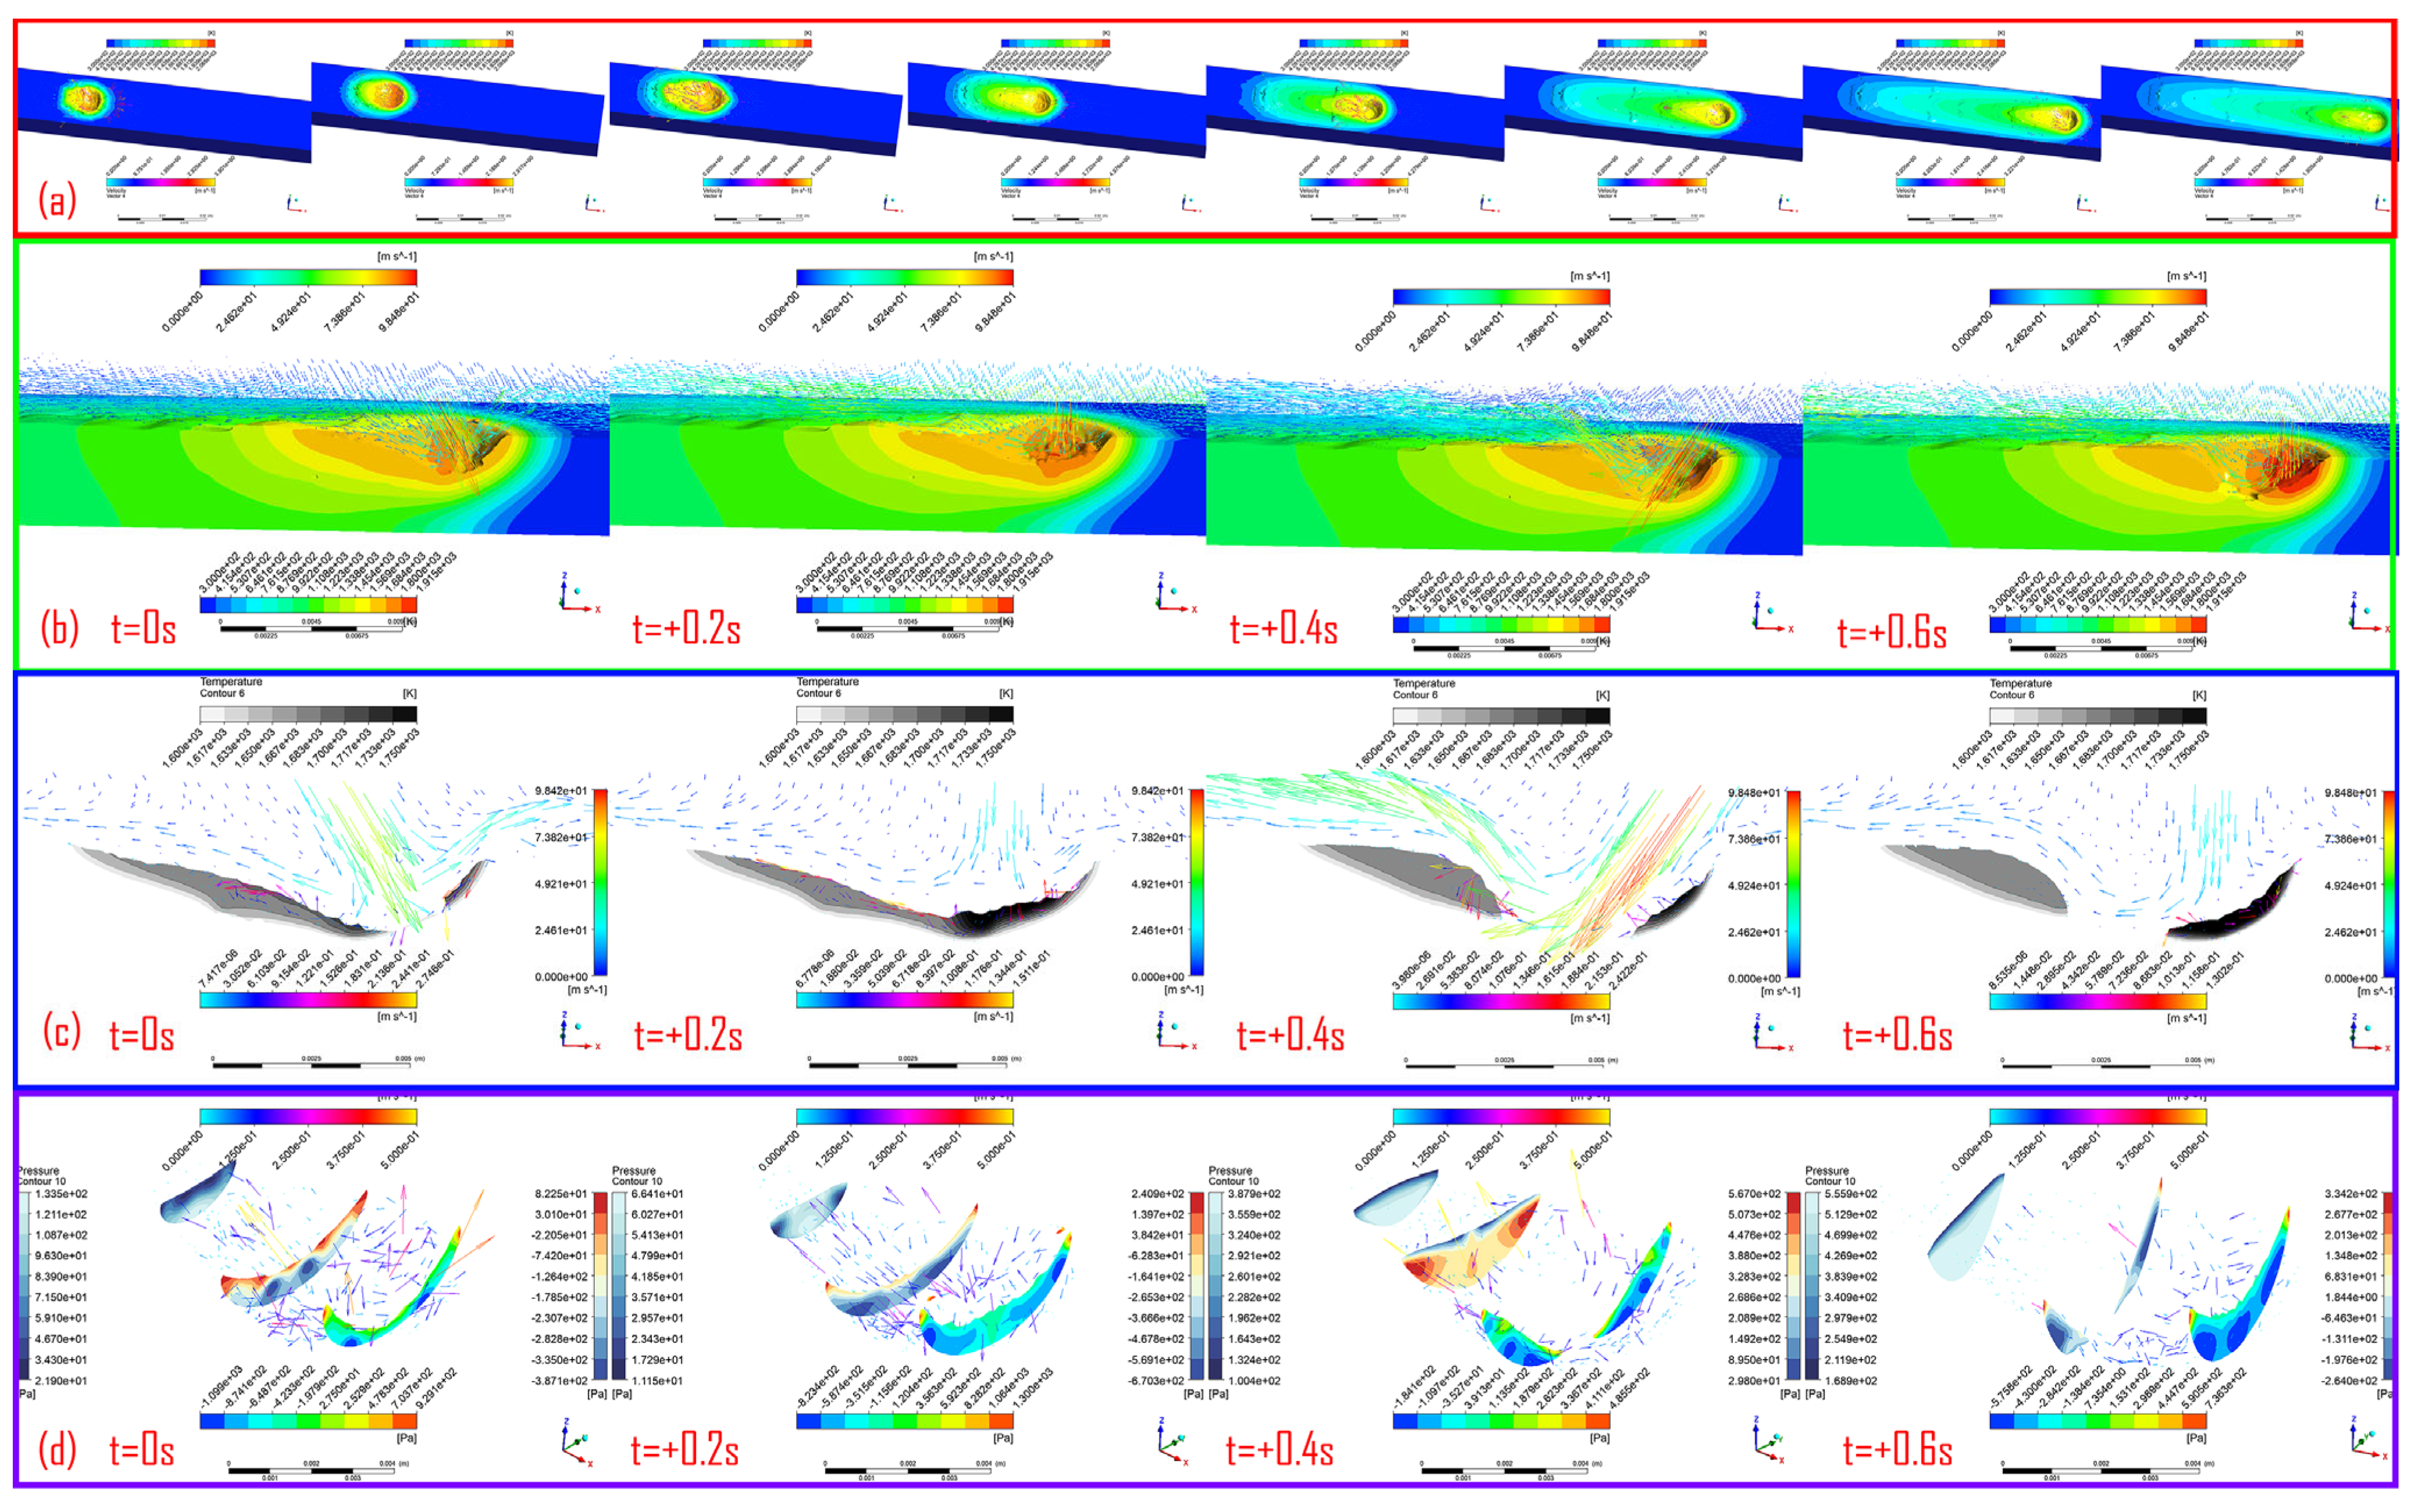
The simulated weld pool flow under welding parameter 2 is shown in Figure 12. At low tungsten arc alternation frequencies, the weld pool size is significantly reduced and the plasma flow force is weakened. Due to the greatly extended cycle duration, Figure 12c shows that the weld pool nearly disappears twice at the arc center position within a single cycle. When the rear tungsten arc is burning, the weld pool tends to flatten, whereas when the front tungsten arc is burning, the pool accumulates toward the rear center. Under the influence of surface tension, a local bulge forms at the pool tail (solidification line), leading to a lack of liquid metal at the fusion line and resulting in undercut defects. The pool morphology oscillates repeatedly over a relatively long time span (0.4 s), which is the main reason for the weld surface ripples observed in the macroscopic morphology (Figure 9b). Meanwhile, the stress state of the liquid inside the pool also changes with its morphology: molten metal flows rapidly backward along the upper sides of the pool and undergoes strong backflow along the mid-side or bottom regions. At different moments within the cycle, the pressure difference induced by the backflow can reach about 800 Pa.

3.3. Microstructure of the Weld Joint

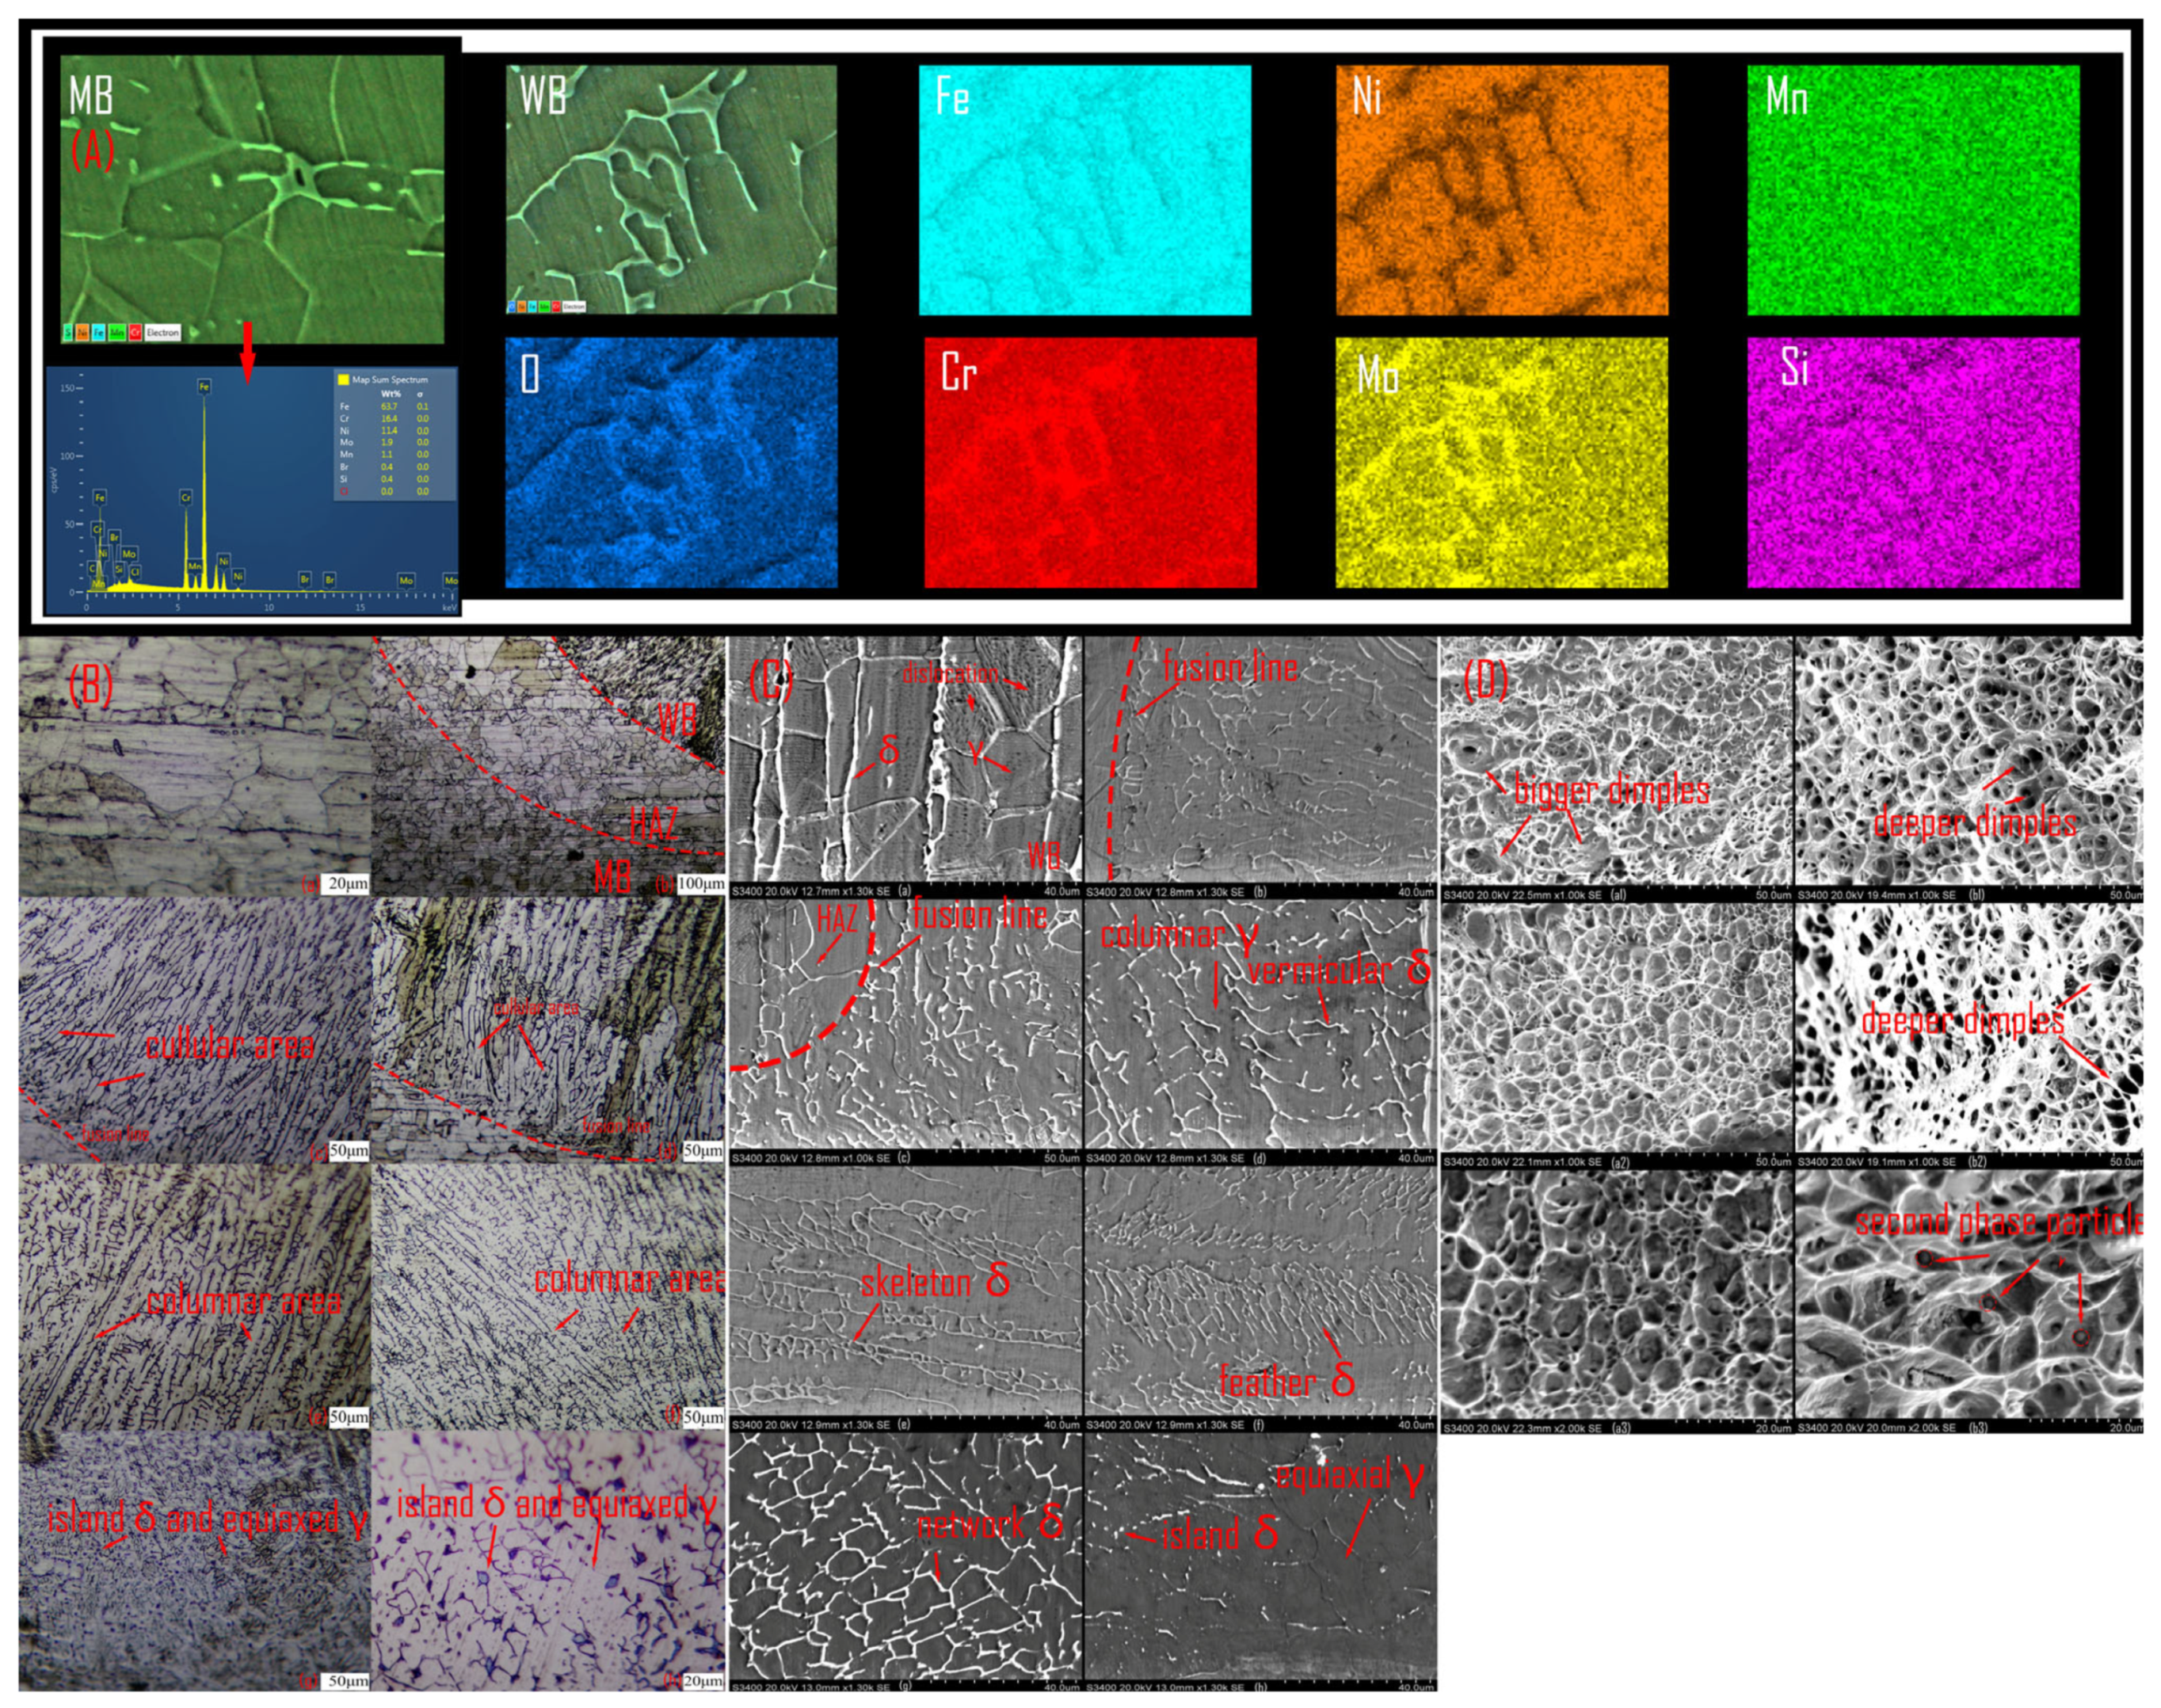
Based on the EDS results of the 316L base metal in this experiment, the chromium equivalent and nickel equivalent were calculated [36,37,38]. As shown in Figure 13A,
Creq = Cr + Mo + 1.5Si + 0.5Nb + 2Ti = 18.9, Nieq = Ni + 30C + 30(N−0.06) + 0.5Mn = 12.4, Creq/Nieq = 1.52.
The weld composition falls within the L→F→F+A solidification region of the Fe-Cr-Ni phase diagram [39]. Due to the high cooling rate, the eutectic point shifts, resulting in a weld pool eutectic reaction (L→F+A) [40]. Under welding parameter 1, pronounced elemental segregation occurs: Cr and Mo enrichment promotes δ-ferrite formation, while Ni stabilizes γ-austenite (Figure 13).
In the base metal, γ grains are equiaxed and lamellar, with coarse grains fractured by rolling stress (Figure 13B(a)). In the HAZ, grains coarsen due to heat input, degrading mechanical properties (Figure 13B(b)). Near the fusion line, γ grows as cellular or short columnar grains (Figure 13B(c,d)), while the weld center exhibits long columnar dendrites along the thermal gradient. As constitutional supercooling increases and temperature gradient decreases, central γ grains transform into short columnar or equiaxed forms (Figure 13B(e,f)).
δ-Ferrite in the base metal is concentrated at grain boundaries (Figure 13C(a)). Near the fusion line, δ-ferrite is vermicular and disordered (Figure 13C(b,c)). In the weld midsection, δ-ferrite grows along the thermal gradient but shows diverse morphologies—vermicular, skeletal, acicular, and reticulated (Figure 13C(d–g)). In the weld center, δ-ferrite content is reduced, nucleating mainly along grain boundaries with disordered orientation due to high constitutional supercooling and low thermal gradient, promoting solute homogenization and suppressing δ-ferrite formation.
Macroscopically, 316L welds from FFPTT welding remain predominantly columnar, similar to conventional TIG. To explain enhanced mechanical properties, microstructural differences were examined. Fracture surfaces (Figure 13D) show ductile fracture in both methods, but conventional TIG exhibits larger, shallower dimples, whereas twin-TIG shows smaller, deeper dimples, indicating higher local toughness. Spherical inclusions (~350 nm silicon oxide compounds) are observed in twin-TIG dimples but absent in conventional TIG [41]. EDS results indicate Si reacts with O at δ-ferrite/γ-austenite boundaries after δ-ferrite formation. Higher arc heat and prolonged high-temperature exposure in twin-TIG promote δ-ferrite growth and partial decomposition, allowing silicon oxide compound precipitation. The high melting point and pinning effect of these particles may influence weld performance, warranting further investigation.
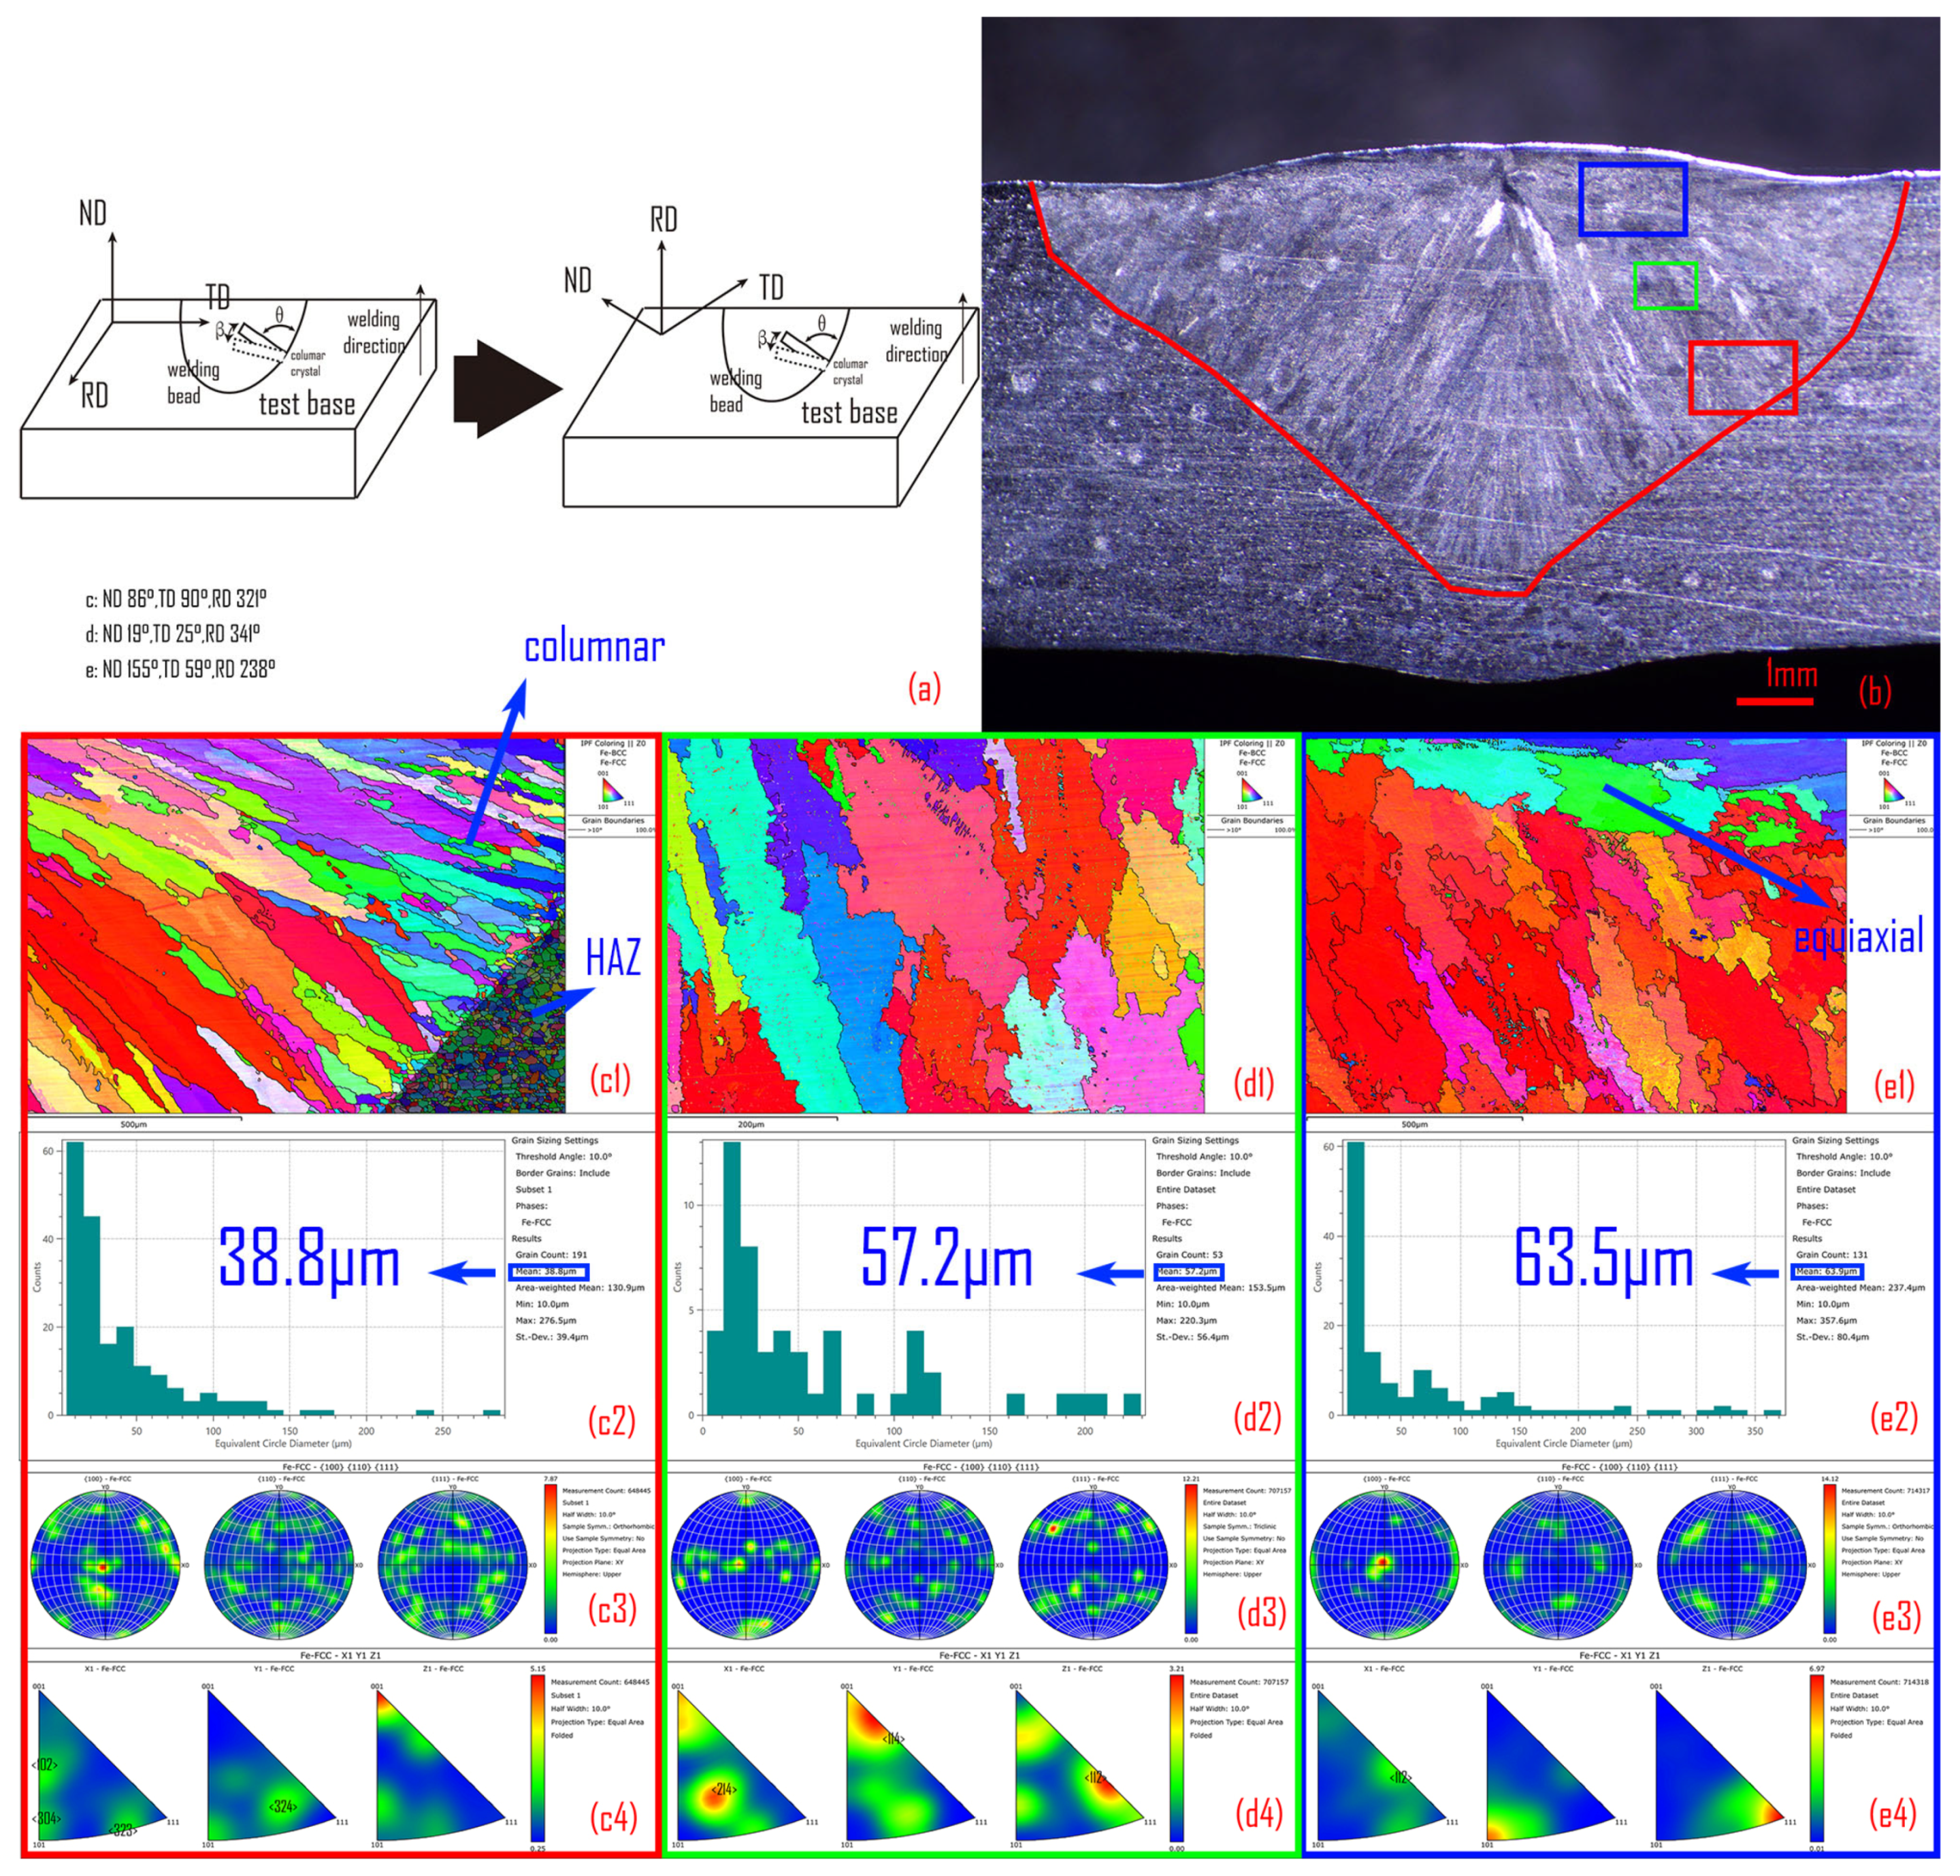
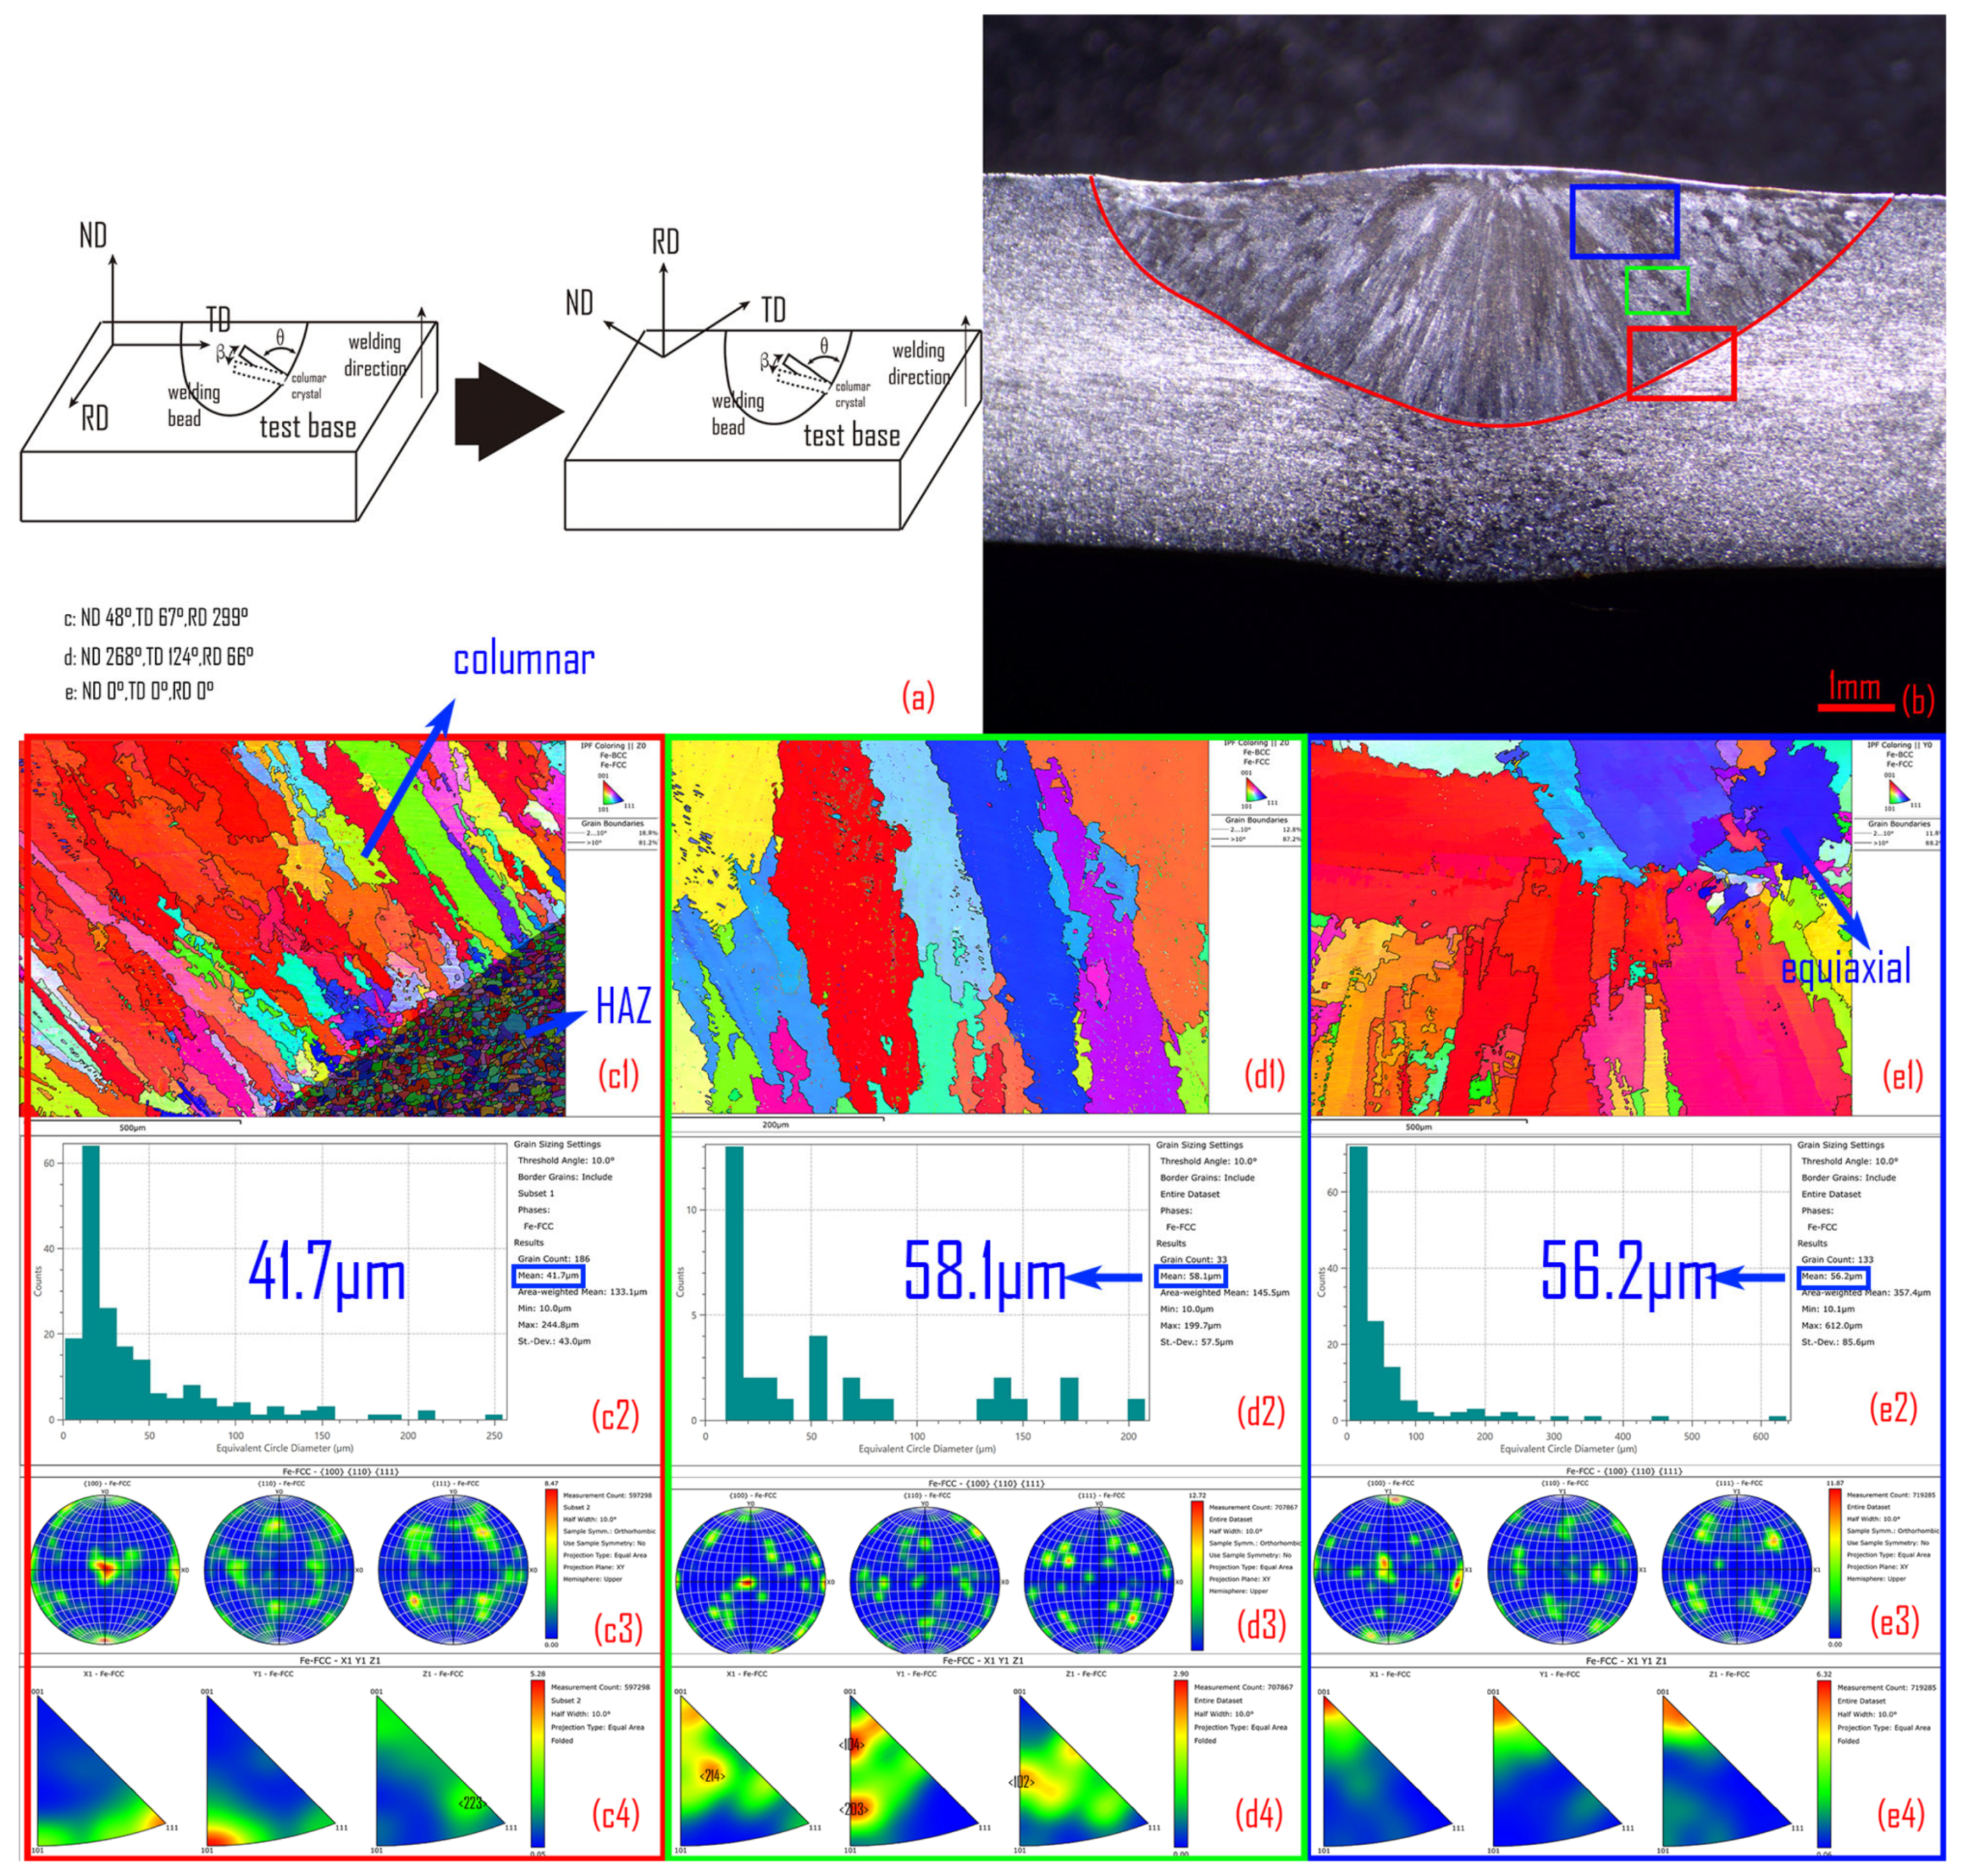
During the formation of the weld microstructure, there exists an almost fixed temperature gradient direction, extending from the weld root toward the weld center. This direction corresponds to the fastest lattice growth direction of Fe atoms during solidification, which is [1 0 0] in the γ phase and [1 1 0] in δ-ferrite. To facilitate the observation of texture distribution within the weld microstructure in Figure 14a and Figure 15a, the EBSD-sampled specimen was first rotated from its original ND [0 0 1] direction to the [1 0 0] direction of the γ-phase crystal.
EBSD analysis was performed on the welds produced under welding parameter 1 and conventional TIG welding at different locations along the weld, including the weld root, midsection, and upper region. In both processes, a cubic γ-phase texture was observed. Notably, under welding parameter 1, in Figure 14, the γ-phase grains at the weld root exhibited more varied orientations and weaker texture, while the texture became significantly stronger toward the upper weld region. The average grain sizes at the weld root, midsection, and upper region under welding parameter 1 were 38.8 µm, 57.2 µm, and 63.9 µm, respectively, whereas the corresponding grain sizes for conventional TIG welds were 41.7 µm, 58.1 µm, and 56.2 µm, in Figure 15. Grain refinement of approximately 7.5% was achieved at the weld root under welding parameter 1, but the midsection showed negligible change, and the grains at the upper central region were coarser than those in conventional TIG welding. Observations from the pole figures were consistent with the grain size trends: the weld root under welding parameter 1 exhibited lower pole density, and after rotation of the reference frame, the ND [0 0 1] direction of the sample was mainly aligned with the γ-phase [0 0 1] direction. At the weld midsection, the pole densities of both processes were similar. At the upper region, grains transformed from elongated columnar to short columnar or equiaxed morphologies, while conventional TIG welds exhibited lower pole densities.
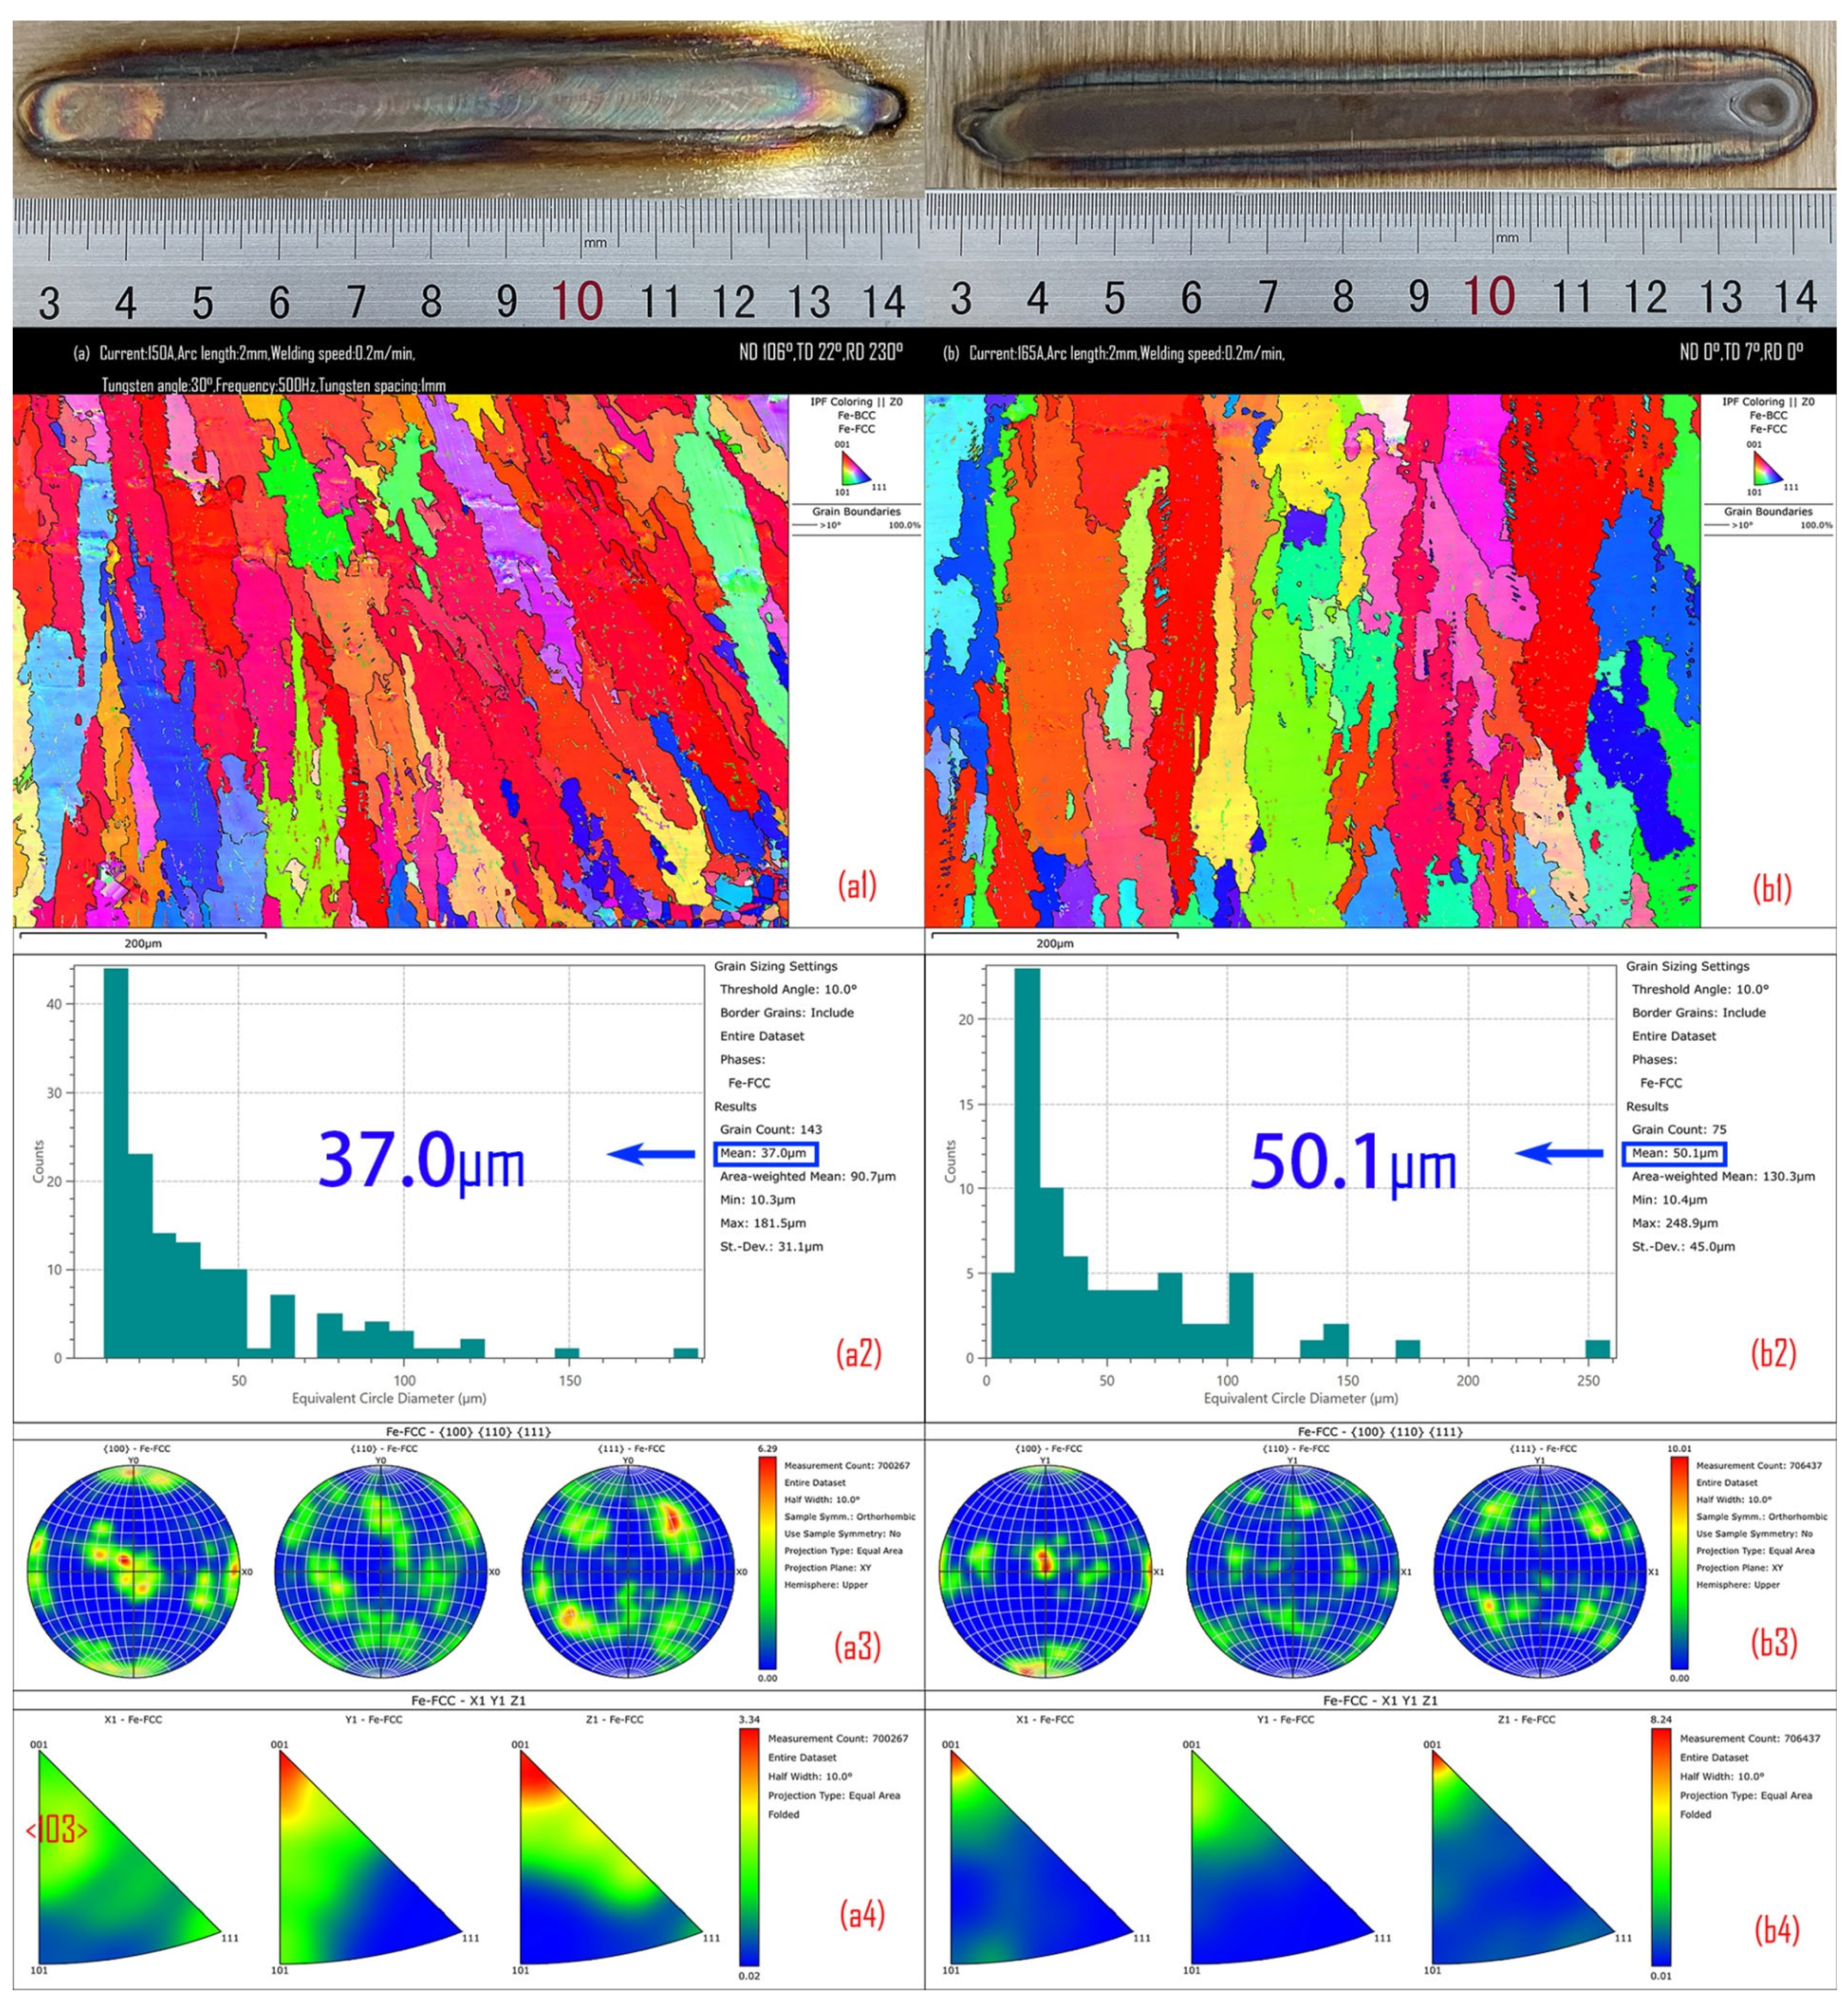
Figure 16 presents a comparison of γ-phase microstructure growth between fast-frequency pulsed twin-TIG welding (current: 150 A, welding speed: 0.2 m/min, arc length: 2 mm, tungsten angle: 30°, tungsten spacing: 1 mm, switch frequency: 500 Hz) and conventional TIG welding (current: 150 A, welding speed: 0.2 m/min, arc length: 2 mm) under medium-current conditions. After reducing the welding current, the average grain size of the γ-phase in fast-frequency pulsed twin-TIG welding is 37 µm, which is 38% finer than that of conventional TIG welding (50.1 µm). The texture pole density also decreases from 10 to 6.29.
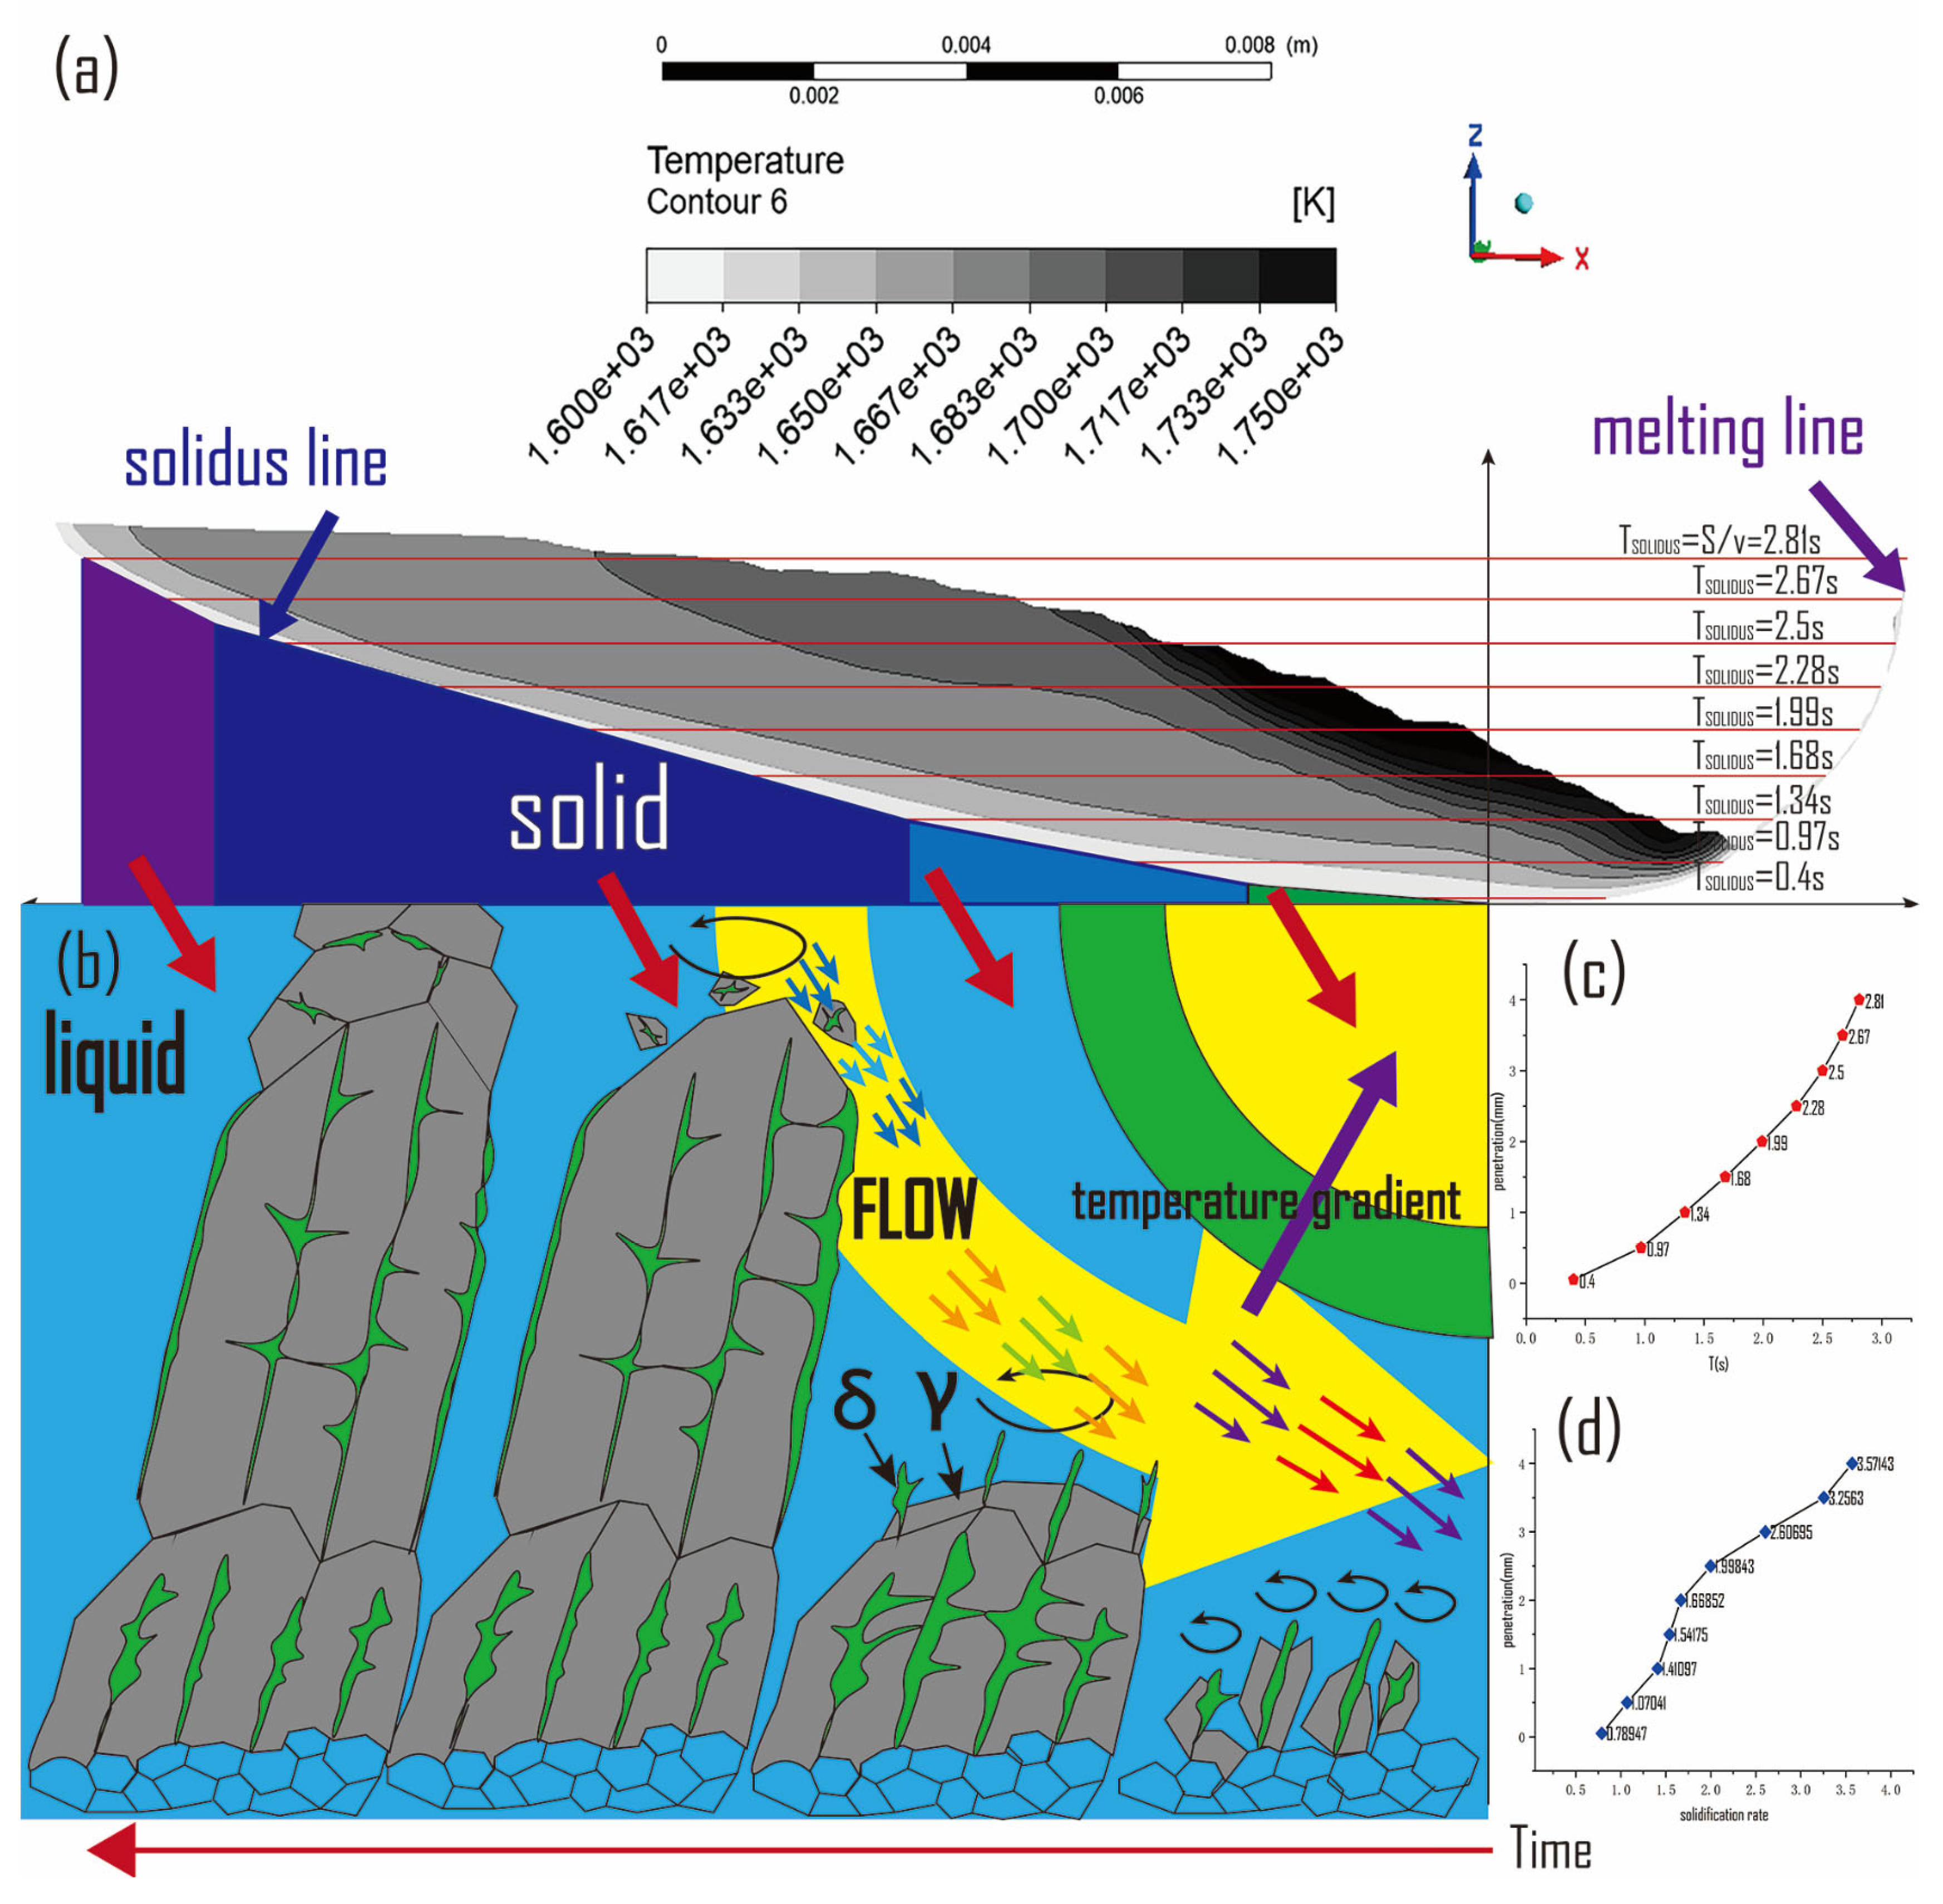
Based on the previous study of the molten pool flow and stress state in fast-frequency pulsed twin-TIG welding, once the welding process enters a stable stage, the overall morphology of the molten pool remains essentially unchanged (Figure 11c). At this stage, the horizontal distance from the molten front to the weld tail divided by the welding speed can be regarded as the solidification time required for the molten pool at a given height, as illustrated in Figure 17a. Taking the current moment as an example, the solidification time from the weld root to the surface at different heights is shown in Figure 17c. The slope of each point in the figure represents the cooling rate S high t at the corresponding weld depth, with S high denoting the weld depth (Figure 17d). At the weld root, the cooling rate r is relatively low (corresponding to the solid green region in Figure 17), while the temperature gradient G is large. According to the relation V = r G , the crystal growth rate is relatively slow, allowing crystals to grow preferentially as cellular tips or columnar structures with dendritic branching. Slow growth provides more time for solute diffusion between the liquid and solid phases, resulting in a solute field at the interface that is closer to equilibrium, thereby suppressing extreme local concentration spikes caused by severe solute trapping. However, this “extended thermal–chemical history” also allows sufficient time for the formation and growth of secondary phases (such as silicon oxide compounds, as mentioned above). For 316L stainless steel, slow cooling favors the precipitation of thermodynamic phases and may increase the amount of δ-ferrite formation. Meanwhile, as shown in Figure 17b, under the action of fast-frequency pulsing, the weld pool at the bottom experiences periodic forces at 250 Hz, which, as discussed above, are most pronounced at the weld root.
This effect imposes significant torsional and shear forces on newly formed cellular/columnar grains, causing the fine arms that would preferentially grow along the [0 0 1]γ direction or the [1 1 0]δ direction under the temperature gradient to twist or even fracture and reconnect. Consequently, orientation variations arise, multiple orientations coexist, and the texture is weakened. Additionally, the fracture of dendrites promotes grain refinement. In medium-current fast-frequency pulsed twin-TIG welding, the reduced molten pool size expands the effective range of the pulsed flow field, resulting in a more pronounced grain refinement effect. As solidification progresses, the lower-layer dendrites have developed into short columnar/cellular grains. However, under the influence of the pulsed flow field, their growth orientations are disordered and interlaced, solute distribution at the solid–liquid interface is uneven, local undercooling decreases, dendrite tips destabilize, and growth stalls. Grains whose growth directions deviate from the thermal gradient are preferentially eliminated, leaving only short grains aligned with the preferred growth direction to develop into long columnar grains. At this stage, due to remaining undercooling at the solid–liquid interface, new nuclei form at the tips of existing short grains and grow preferentially along the thermal gradient. These newly formed grains have orientations inconsistent with the previous short grains, forming new grain boundaries (corresponding to the blue region in Figure 17 solid). Grain growth is still influenced by fast-frequency pulsing, but numerical simulations indicate that the pulsed force is significantly weaker at this location. Compared with the molten pool bottom, fewer grains exhibit large-angle deviations, resulting in an increased pole figure density in the midsection. The central region of the molten pool is the last to solidify (corresponding to the purple region in Figure 17), where cooling rates are high, solute undercooling is large, temperature gradients are relatively small, and the effect of fast-frequency pulsing is negligible. Under these combined factors, γ grains transition from columnar to equiaxed growth, with more randomized orientations. Under the same conditions, δ-ferrite nucleates readily but its growth is constrained, leading to lower content, sparse distribution, and the formation of equiaxed island-like δ-ferrite.

4. Conclusions

Focusing on the fast-frequency pulsed twin-TIG welding power source independently developed by our team, this paper combines process experiments and numerical simulations to systematically study weld formation, joint interface morphology, mechanical properties and microstructures under different process parameters. The simulation obtains key physical field data such as temperature field, flow field and force field in the molten pool, and reveals the evolution of weld texture and grain refinement mechanism combined with crystallographic theory. The main conclusions are as follows:
  • The newly developed fast-frequency pulsed twin-TIG welding power source provides a highly stable arc output. Under optimized welding parameters, the surface of 316L stainless steel welds is smooth and defect-free. At a relatively high welding speed of 0.5 m/min, the weld penetration reaches up to 4.5 mm, with a depth-to-width ratio of 0.48. Compared to single-output high-frequency pulsed TIG welding and conventional TIG welding under similar parameters, the penetration is increased by 87.5% and 40.6%, respectively, while the depth-to-width ratio is improved by 37% and 55%, demonstrating the high efficiency of this welding method.
  • The established numerical model of the fast-frequency pulsed twin-TIG welding molten pool shows excellent agreement with experimental results in terms of weld morphology, weld cross-sectional dimensions (penetration and width), and molten pool characteristics during welding, confirming the model’s accuracy. Analysis of the model accurately reflects key physical quantities within the molten pool, including the temperature field, velocity field, and force field.
  • Mechanical testing of welded specimens indicates that under a high current output of 300 A, fast-frequency pulsed twin-TIG welding achieves simultaneous improvements in tensile strength and toughness compared to conventional TIG welding. The tensile strength increased by 13.6%, elongation by 26%, and the absorbed impact energy of the weld and heat-affected zone improved by 7.5% and 11.2%, respectively, while the Vickers hardness of the weld increased by 10%.
  • Microstructural characterization shows that the 316L welds fabricated by fast-frequency pulsed twin-TIG welding are still dominated by columnar grains. Compared with conventional TIG welding, secondary dendrites at the weld root present more dispersed orientations with weaker textures and finer grains. The grain refinement rate is 7.5% under high current and up to 38% under medium current. Combined with molten pool simulation results and crystallization theory, the intense pulsed flow and force fields at the weld root are the core factors adjusting grain orientation and refining grains.

Author Contributions

S.Z.: conceptualization, methodology, writing—original draft. H.Z.: conceptualization, collecting documents, writing—original draft. Y.L.: collecting documents, writing—original draft. B.Z.: collecting documents, writing—original draft. Y.C.: project administration, supervision. All authors have read and agreed to the published version of the manuscript.

Funding

National Natural Science Foundation of China (Grant No. 52175428).

Data Availability Statement

The original contributions presented in this study are included in the article. Further inquiries can be directed to the corresponding author.

Conflicts of Interest

The authors declare no competing interests.

References

  1. Wu, H.; Chang, Y.; Mei, Q.; Liu, D. Research advances in high-energy TIG arc welding. Int. J. Adv. Manuf. Technol. 2019, 104, 391–410. [Google Scholar] [CrossRef]
  2. Zhang, S.; Zhao, H.; Li, Y.; Miao, J.; Chang, C.; Chang, Y. TIG-based hybrid arc welding: A review. Int. J. Adv. Manuf. Technol. 2025, 139, 1105–1121. [Google Scholar] [CrossRef]
  3. Mills, K.C.; Keene, B.J. Factors affecting variable weld penetration. Int. Mater. Rev. 1990, 35, 185–216. [Google Scholar] [CrossRef]
  4. Singh, A.K.; Dey, V.; Rai, R.N. Techniques to improveweld penetration in TIG welding (A review). Mater. Today Proc. 2017, 4, 1252–1259. [Google Scholar] [CrossRef]
  5. Jarvis, B.L.; Ahmed, N.U. Development of keyhole mode gas tungsten arc welding process. Sci. Technol. Weld. Join. 2000, 5, 1–7. [Google Scholar] [CrossRef]
  6. Bao, W.; Liu, H.; Wang, F.; Du, J.; Wang, Y.; Li, H.; Ye, X. Keyhole critical failure criteria and variation rule under different thicknesses and multiple materials in K-TIG welding. J. Manuf. Process. 2024, 126, 48–59. [Google Scholar] [CrossRef]
  7. Cui, S.; Li, H.; Zhang, B.; Liu, X.; Mo, G. Study of microstructure, mechanical, and corrosion properties of K-TIG welded joints of 2205/316L dissimilar stainless steel. Metals 2025, 15, 910. [Google Scholar] [CrossRef]
  8. Liu, Z.; Fang, Y.; Cui, S.; Luo, Z.; Liu, W.; Liu, Z.; Yi, S. Stable keyhole welding process with K-TIG. J. Mater. Process. Technol. 2016, 238, 65–72. [Google Scholar] [CrossRef]
  9. Rosellini, C.; Jarvis, L. The keyhole TIG welding process: A valid alternative for valuable metal joints. Weld. Int. 2009, 23, 616–621. [Google Scholar] [CrossRef]
  10. Liu, Z.; Chen, S.; Yuan, X.; Zuo, A.; Zhang, T.; Luo, Z. Magnetic-enhanced keyhole TIG welding process. Int. J. Adv. Manuf. Technol. 2018, 99, 275–285. [Google Scholar] [CrossRef]
  11. Wang, Y.; Qi, B.; Cong, B.; Zhu, M.; Lin, S. Keyhole welding of AA2219 aluminum alloy with double-pulsed variable polarity gas tungsten arc welding. J. Manuf. Process. 2018, 34, 179–186. [Google Scholar] [CrossRef]
  12. Fang, Y.; Liu, Z.; Cui, S.; Zhang, Y.; Qiu, J.; Luo, Z. Improving Q345 weld microstructure and mechanical properties with high frequency current arc in keyhole mode TIG welding. J. Mater. Process. Technol. 2017, 250, 280–288. [Google Scholar] [CrossRef]
  13. Howse, D.S.; Lucas, W. Investigation into arc constriction by active fluxes for tungsten inert gas welding. Sci. Technol. Weld. Join. 2000, 5, 189–193. [Google Scholar] [CrossRef]
  14. Vidyarthy, R.S.; Dwivedi, D.K. Activating flux tungsten inert gas welding for enhanced weld penetration. J. Manuf. Process. 2016, 22, 211–228. [Google Scholar] [CrossRef]
  15. Baskoro, A.S.; Fauzian, A.; Basalamah, H.; Kiswanto, G.; Winarto, W. Improving weld penetration by employing of magnetic poles’ configurations to an autogenous tungsten inert gas (TIG) welding. Int. J. Adv. Manuf. Technol. 2018, 99, 1603–1613. [Google Scholar] [CrossRef]
  16. Fande, A.W.; Taiwade, R.V.; Raut, L. Development of activated tungsten inert gas welding and its current status: A review. Mater. Manuf. Process. 2022, 37, 841–876. [Google Scholar] [CrossRef]
  17. Wang, J.; Sun, Q.; Feng, J.; Wang, S.; Zhao, H. Characteristics of welding and arc pressure in TIG narrow gap welding using novel magnetic arc oscillation. Int. J. Adv. Manuf. Technol. 2017, 90, 413–420. [Google Scholar]
  18. Yamada, T. Development of High Efficiency TIG Welding Method (1st Report); JWS (Japan Welding Society): Tokyo, Japan, 1998; Volume 63, pp. 24–25. [Google Scholar]
  19. Yamada, T.; Kobayashi, I. Development of High Efficiency TIG Welding Method (2nd Report); JWS (Japan Welding Society): Tokyo, Japan, 1998; Volume 63, pp. 26–27. [Google Scholar]
  20. Kobayashi, K.; Nishimura, Y.; Iijima, T.; Ushio, M.; Tanaka, M.; Shimamura, J.; Ueno, Y.; Yamashita, M. Practical Application of High Efficiency Twin-Arc TIG Welding Method (SEDAR-TIG) For PCLNG Storage Tank. Weld. Res. ABROAD 2005, 51, 1. [Google Scholar]
  21. Leng, X.; Zhang, G.; Wu, L. The characteristic of twin-electrode TIG coupling arc pressure. J. Phys. D Appl. Phys. 2006, 39, 1120. [Google Scholar] [CrossRef]
  22. Schwedersky, M.B.; Gonçalves e Silva, R.H.; Dutra, J.C.; Reisgen, U.; Willms, K. Two-dimensional arc stagnation pressure measurements for the double-electrode GTAW process. Sci. Technol. Weld. Join. 2016, 21, 275–280. [Google Scholar] [CrossRef]
  23. Suga, Y.; Ogawa, K.; Matsumoto, H. Erosion characteristics and temperature distribution of tungsten electrodes in TIG welding. Weld. Int. 1992, 6, 362–367. [Google Scholar] [CrossRef]
  24. Wang, Z.; Jiang, D.; Wu, J.; Xu, M. A review on high-frequency pulsed arc welding. J. Manuf. Process. 2020, 60, 503–519. [Google Scholar] [CrossRef]
  25. Yang, M.; Li, L.; Qi, B.; Zheng, H. Arc force and shapes with high-frequency pulsed-arc welding. Sci. Technol. Weld. Join. 2017, 22, 580–586. [Google Scholar] [CrossRef]
  26. Mingxuan, Y.; Hao, Z.; Bojin, Q.; Zhexu, W.; Rainy, L. Pulsed arc light monitoring and temperature reconstruction with arc welding. Sci. Technol. Weld. Join. 2020, 25, 535–542. [Google Scholar] [CrossRef]
  27. Hua, C.; Lu, H.; Yu, C.; Chen, J.M.; Wei, X.; Xu, J.J. Reduction of ductility-dip cracking susceptibility by ultrasonic-assisted GTAW. J. Mater. Process. Technol. 2017, 239, 240–250. [Google Scholar] [CrossRef]
  28. Hua, C.; Lu, H.; Yu, C.; Li, D.; Chen, X. Probing Laves phase formation in Ni-alloy during ultrasonic arc-welding with atomistic modelling. Sci. Technol. Weld. Join. 2019, 24, 305–312. [Google Scholar] [CrossRef]
  29. Wang, Z.; Fan, W.; Xie, F.; Ye, C. An 8kW LLC resonant converter in plasma power supply based on SiC power devices for efficiency improvement. Circuit World 2019, 45, 181–188. [Google Scholar] [CrossRef]
  30. Wu, J.; Wang, Z.; Lin, S.; Xie, Z.; Xu, M.; Tian, J.; Guo, C. Effect of fast-frequency pulsed waveforms on the microstructure and mechanical properties of Ti–6Al–4V alloy welded by FFP-TIG. J. Mater. Res. Technol. 2022, 20, 516–531. [Google Scholar] [CrossRef]
  31. Li, L.; Yang, M.; Qi, B.; Liu, H. Study of high frequency pulsed arc on molten pool thermal properties of Ti-6Al-4V. J. Manuf. Process. 2019, 38, 308–312. [Google Scholar] [CrossRef]
  32. Wu, C.S.; Yan, F. Numerical simulation of transient development and diminution of weld pool in gas tungsten arc welding. Model. Simul. Mater. Sci. Eng. 2003, 12, 13. [Google Scholar] [CrossRef][Green Version]
  33. Tsao, K.C.; Wu, C.S. Fluid flow and heat transfer in GMA weld pools. Weld. J. 1988, 67, 70–75. [Google Scholar]
  34. Zhang, S.; Zhao, H.; Li, Y.; Miao, J.; Liu, Y.; Chang, Y. Forming mechanism of humping defects in stainless steel high-speed TIG welding. Weld. World 2026, 70, 75–86. [Google Scholar]
  35. Kumar, A.; DebRoy, T. Numerical Simulation of Electromagnetically Driven Flow in the Weld Pool During Arc Welding. In Proceedings of the ASME International Mechanical Engineering Congress and Exposition, Washington, DC, USA, 15–21 November 2003; Volume 37165, pp. 833–842. [Google Scholar]
  36. Hull, F.C. Delta ferrite and martnesite formation in stainless steels. Weld. J. 1973, 52, 193. [Google Scholar]
  37. DeLong, W.T. Measurement and calculation of ferrite in stainless steel weld metal. Weld. J. 1956, 21, 521–528. [Google Scholar]
  38. Güzey, B.N.; İrsel, G. Investigation of mechanical and microstructural properties in joining dissimilar P355GH and stainless 316L steels by TIG welding process. Int. J. Press. Vessel. Pip. 2023, 205, 104965. [Google Scholar] [CrossRef]
  39. Suutala, N.; Takalo, T.; Moisio, T. Ferritic-austenitic solidification mode in austenitic stainless steel welds. Metall. Trans. A 1980, 11, 717–725. [Google Scholar] [CrossRef]
  40. Wu, C.; Li, S.; Zhang, C.; Wang, X. Microstructural evolution in 316LN austenitic stainless steel during solidification process under different cooling rates. J. Mater. Sci. 2016, 51, 2529–2539. [Google Scholar]
  41. Zhu, Z.; Ma, X.; Wang, C.; Mi, G.; Zheng, S. The metallurgical behaviors and crystallographic characteristic on macro deformation mechanism of 316 L laser-MIG hybrid welded joint. Mater. Des. 2020, 194, 108893. [Google Scholar] [CrossRef]
Figure 1. Fast-frequency pulsed twin-TIG power supply waveforms and arc behavior.
Crystals 16 00406 g001
Figure 2. Schematic diagram of welding process parameters and experimental setup.
Crystals 16 00406 g002
Figure 3. Sampling position diagram of mechanical property specimens for welded test plates.
Crystals 16 00406 g003
Figure 4. Numerical model and mesh of the welding molten pool.
Crystals 16 00406 g004
Figure 5. Schematic diagram of heat force in fast-frequency pulsed twin-TIG welding.
Crystals 16 00406 g005
Figure 6. (A) Welding appearances under different welding parameters. (a1a3) tungsten angle: 30°, tungsten spacing: 1 mm, switch frequency: 500 Hz–100 Hz–5 Hz; (b1b3) tungsten angle: 30°, tungsten spacing: 3 mm, switch frequency: 500 Hz–100 Hz–5 Hz; (c1c3) tungsten angle: 60°, tungsten spacing: 3 mm, switch frequency: 500 Hz–100 Hz–5 Hz; (d1d3) tungsten angle: 30°, tungsten spacing: 3 mm, switch frequency: 500 Hz–100 Hz–5 Hz; (d3) schematic of sampling for performance tests; (e) single high-frequency welding; (f) conventional TIG welding. (B) Weld cross-sectional view. (C) Penetration depth and weld width of the weld seam.
Crystals 16 00406 g006
Figure 7. Tensile properties of the weld joints and impact properties of the weld joints and HAZ. (a) Tensile specimen and tensile strength curve; (b) Impact energy of welds under different parameters.
Crystals 16 00406 g007
Figure 8. Vickers hardness contour maps of the weld joints: (a) fast-frequency pulsed twin-TIG welding (Figure 6(a1)); (b) conventional TIG welding.
Crystals 16 00406 g008
Figure 9. Welding appearances and simulated weld morphology: (a) welding parameter 1, (b) welding parameter 2. Cross-sections of experimental welds and simulated results: (c) welding parameter 1, (d) welding parameter 2.
Crystals 16 00406 g009
Figure 10. High-speed images of the welding molten pool and simulated molten pool morphology. (A) Molten pool morphology at different times under welding parameter 1: (A (a1f1)) High-speed images of the weld seam in the transverse direction, (A (a2f2)) high-speed images of the weld seam in the longitudinal direction, (A (a3f3)) numerical simulation of the weld seam; (B) Molten pool morphology at different times under welding parameter 2: (B (a1f1)) High-speed images of the weld seam in the transverse direction, (B (a2f2)) high-speed images of the weld seam in the longitudinal direction, (B (a3f3)) numerical simulation of the weld seam.
Crystals 16 00406 g010
Figure 11. Weld pool flow field under welding parameter 1: (a) evolution of the welding pool throughout the welding process; (b) variation in the shielding gas flow field within one alternation cycle; (c) cross-sectional view of the central flow field of the welding pool; (d) overall welding pool flow field and internal force distribution of the pool.
Crystals 16 00406 g011
Figure 12. Weld pool flow field under welding parameter 2: (a) evolution of the welding pool throughout the welding process; (b) variation in the shielding gas flow field within one alternation cycle; (c) cross-sectional view of the central flow field of the welding pool; (d) overall welding pool flow field and internal force distribution of the pool.
Crystals 16 00406 g012
Figure 13. Microstructural morphology of the weld under welding parameter 1. (A) EDS mapping of the base metal and the weld under welding parameter 1 (B) Microstructural morphology under OM: (a) Base metal, (bh) Weld zone; (C) Microstructural morphology under SEM: (a) Base metal, (bh) Weld zone; (D) Fracture morphologies of tensile specimens from conventional TIG welding and FFPTT welding: (a1a3) conventional TIG welding, (b1b3) FFPTT welding.
Crystals 16 00406 g013
Figure 14. Growth characteristics of γ-phase in fast-frequency pulsed twin-TIG welding: (a) coordinate system transformation angle; (b) Weld morphology; (c1) grain orientation map; (c2) grain size; (c3) pole figure; (c4) inverse pole figure at the weld root; (d1) grain orientation map; (d2) grain size; (d3) pole figure; (d4) inverse pole figure at the weld root; (e1) grain orientation map; (e2) grain size; (e3) pole figure; (e4) inverse pole figure at the upper weld region.
Crystals 16 00406 g014
Figure 15. Growth characteristics of γ-phase in conventional TIG welding: (a) coordinate system transformation angle; (b) Weld morphology; (c1) grain orientation map; (c2) grain size; (c3) pole figure; (c4) inverse pole figure at the weld root; (d1) grain orientation map; (d2) grain size; (d3) pole figure; (d4) inverse pole figure at the weld root; (e1) grain orientation map; (e2) grain size; (e3) pole figure; (e4) inverse pole figure at the upper weld region.
Crystals 16 00406 g015
Figure 16. Growth characteristics of γ-phase microstructure in welds under medium current for fast-frequency pulsed twin-TIG and conventional TIG welding: (a) fast-frequency pulsed twin-TIG welding: (a1a4) grain orientation map, grain size, pole figure, and inverse pole figure; (b) the conventional TIG welding: (b1b4) grain orientation map, grain size, pole figure, and inverse pole figure.
Crystals 16 00406 g016
Figure 17. Fast-frequency pulsed twin-TIG welding molten pool solidification process: (a) stable molten pool morphology, (b) schematic of weld solidification, (c) weld depth versus solidification time, (d) weld depth versus solidification rate.
Crystals 16 00406 g017
Table 1. Chemical composition of the 316L base metal (wt%).
CCrNiMoMnSiSPFe
≤0.0316–1810–142–3≤2≤0.75≤0.03≤0.045Balance
Table 2. Thermophysical material properties of 316L in the simulation.
Nomenclature/ParametersValue
Density (kg/m3)7900
Thermal conductivity (W/m K)temperature dependent (16.4–30)
Viscosity (kg/m s)temperature dependent (2 × 10⁻³–8 × 10⁻³)
Specific heat of solid (J/kg K)temperature dependent (460–750)
Latent heat of fusion (J/kg)2.45 × 105
Liquidus temperature (K)1650
Solidus temperature (K)1600
Heat transfer coefficient (W/m2 K)100
Emissivity0.4
Table 3. Welding process parameters used in the simulation.
Welding Parameter 1Welding Parameter 2
Welding current (A)300300
Arc length (mm)/(Arc voltage)22
Welding speed (m/min)0.50.5
Argon flow (L/min)1515
Tungsten electrode diameter (mm)44
Tungsten angle (°)3060
Switch frequency (Hz)5005
Tungsten spacing (mm)13
Table 4. Boundary conditions.
Boundary
(Shown as in Figure 3)
ν /m⋅s−1T/K
IN v = V c exp ( ( x v 1 × t ) 2 + y 2 R 2 ) T = T c exp ( ( x v 1 × t ) 2 + y 2 R 2 )
OU ( ρ ν ) n = 0 T n = 0
WA ( ρ ν ) n = 0 k T n = q h ( T T 0 )
BO ( ρ ν ) n = 0 k T n = q h ( T T 0 ) σ ε ( T 4 T 0 4 )
IF--
Note: VC denotes the center velocity of the shielding gas at the inlet, Tc the center temperature of the inlet shielding gas, v 1 the welding speed, R the diameter of the arc action core, t the welding time, n the unit vector, q the heat input from the heat source, h the heat transfer coefficient, σ the Stefan–Boltzmann constant, and ε the emissivity.
Disclaimer/Publisher’s Note: The statements, opinions and data contained in all publications are solely those of the individual author(s) and contributor(s) and not of MDPI and/or the editor(s). MDPI and/or the editor(s) disclaim responsibility for any injury to people or property resulting from any ideas, methods, instructions or products referred to in the content.