Review

Development and Evolution of Crystallographic Software: From Standalone Tools to Intelligent Integrated Platforms


1
Sino-European School of Technology, Shanghai University, Shanghai 200444, China
2
Department of Physics, College of Sciences, Shanghai University, Shanghai 200444, China
3
Suzhou National Laboratory, Suzhou 215000, China
*
Authors to whom correspondence should be addressed.
Crystals 2026, 16(5), 328; https://doi.org/10.3390/cryst16050328
Submission received: 9 April 2026 / Revised: 28 April 2026 / Accepted: 2 May 2026 / Published: 12 May 2026
(This article belongs to the Section Crystal Engineering)

Abstract

Crystallography is fundamental to elucidating the relationship between microscopic structure and macroscopic material properties, and its progress is closely associated with advances in computational tools and software. This review traces the development of crystallographic software from its origins in the 1960s at Oak Ridge National Laboratory to contemporary integrated platforms. The main aspects covered include the establishment and advancement of structural databases such as CSD and ICSD, the development of single-crystal structure determination programs such as SHELX and Olex2, and the evolution of powder diffraction tools, represented by HighScore Suite and TOPAS, toward integrated platforms. Crystallographic visualization tools have likewise evolved from desktop-based programs such as VESTA and Mercury to modern web-based platforms (JSmol and NGL Viewer). Moreover, we discuss the future directions of crystallographic software, including machine-readable data ecosystems, the application of artificial intelligence in structure determination and prediction, and the development of cloud-based immersive visualization platforms. Overall, this review comprehensively shows the evolution, current situation, and future directions of crystallographic software, which is of certain help to the research and development in related fields.

1. Introduction

Crystallography is a fundamental discipline devoted to determining the three-dimensional atomic arrangement in crystalline materials. In addition to its theoretical significance, crystallography also serves as an important technical tool supporting research in a wide range of areas, including life sciences, materials science, and information technology. For example, X-ray crystallography has played a crucial role in structural biology [1]; the regulation of crystal structures has been used to improve the nonlinear optical properties of materials [2]; and crystallographic analysis has been applied in advanced semiconductor processes to optimize key parameters [3]. These studies collectively demonstrate the indispensable role of crystallography in modern scientific research.
A core objective of crystallographic research is the construction of reliable atomic structure models from experimental diffraction data. This process depends heavily on the development of crystallographic software. Since the 1960s, several important developments have contributed to progress in this field. The establishment of crystallographic databases has provided a data foundation for structural studies [4]. The introduction of automated structure determination methods has significantly improved the efficiency of structure solution [5]. In addition, the development of integrated workflows and advanced visualization tools has improved the efficiency of crystallographic analysis and expanded its range of applications [6]. While previous studies have described the development of individual crystallographic software packages, relatively few studies have attempted to review the crystallographic software ecosystem as a whole [5], and systematic reviews focusing on the overall crystallographic software ecosystem are still lacking. From the perspective of the crystallographic research workflow, this review therefore provides a comprehensive overview of the crystallographic software landscape, including crystallographic databases, structure determination programs (covering both single-crystal analysis and powder diffraction analysis), and visualization software. Building on this overview and considering the rapid development of artificial intelligence in recent years, potential future directions for crystallographic software are also discussed. In particular, an emerging research framework is considered in which machine-readable data ecosystems, AI-assisted structure determination and prediction, and cloud-native research platforms form an integrated workflow.
The remainder of this review is organized as follows. This review primarily focuses on crystallographic software for small-molecule systems, which has historically followed a separate history. Macromolecular crystallography has evolved its own specialized software suites, including different structure determination strategies and computational workflows, and is therefore not discussed in detail in this work. Section 2 first reviews the development and increasing openness of crystallographic databases. Structure determination software is then discussed along two main lines, namely single-crystal structure analysis and powder diffraction analysis, with a comparative examination of major programs. The transition of crystallographic software from standalone tools to integrated platforms is also analyzed, together with the potential role of scripting capabilities in enabling automated research workflows. The subsequent section examines the evolution of visualization software from traditional desktop applications toward web-based platforms. Section 3 focuses on the influence of machine-readable data ecosystems on future software development. The potential applications of artificial intelligence in structure determination, automated refinement, structure prediction, and result validation are further discussed. Finally, emerging technologies such as immersive visualization are considered, and possible future directions for crystallographic software are outlined, including the development of cloud-native platforms for crystallographic research.

2. Overview of the Development of Crystallographic Software

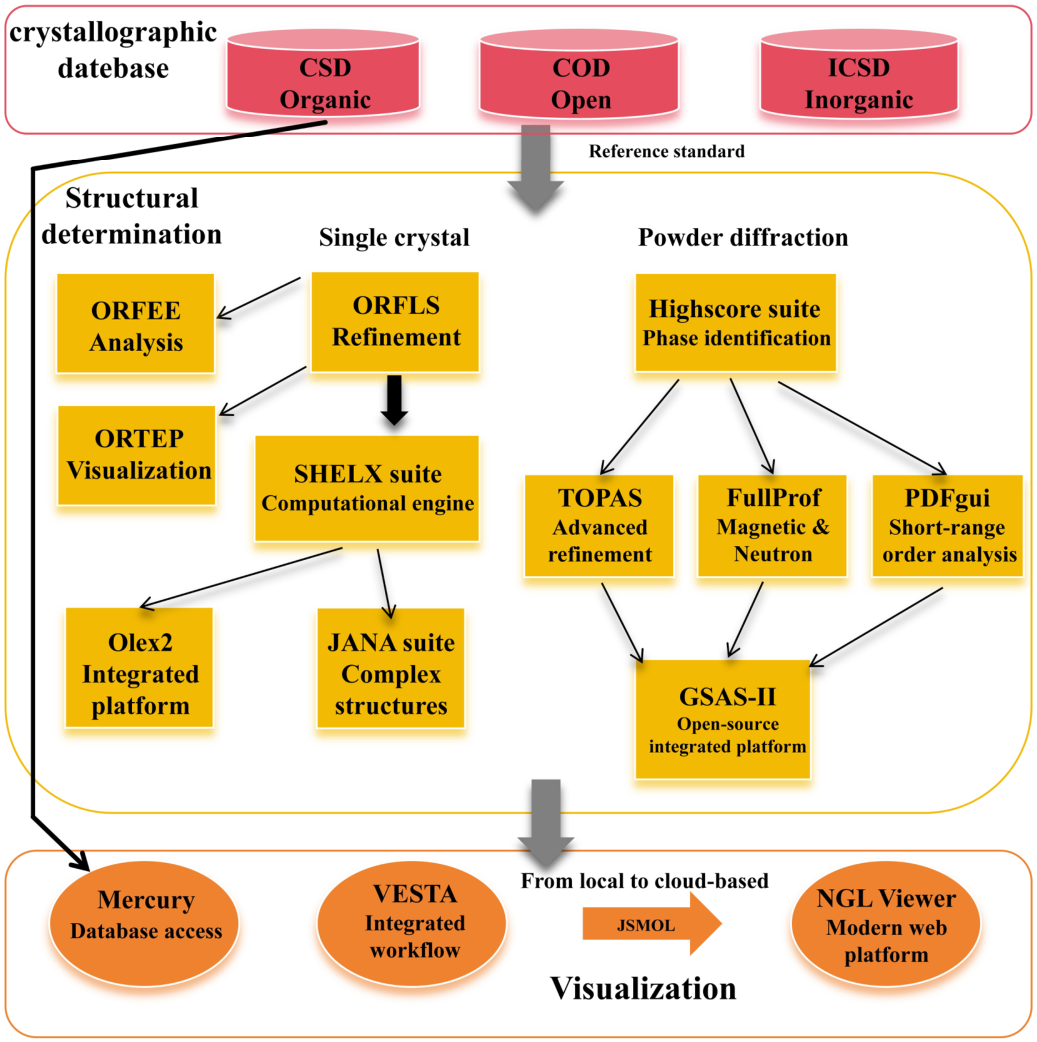
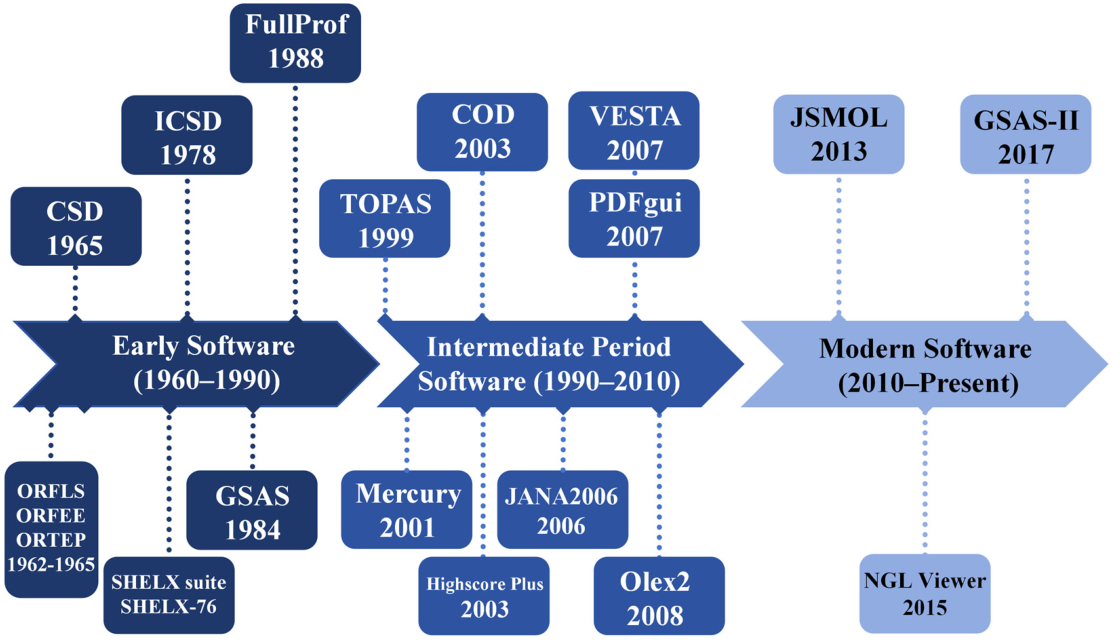
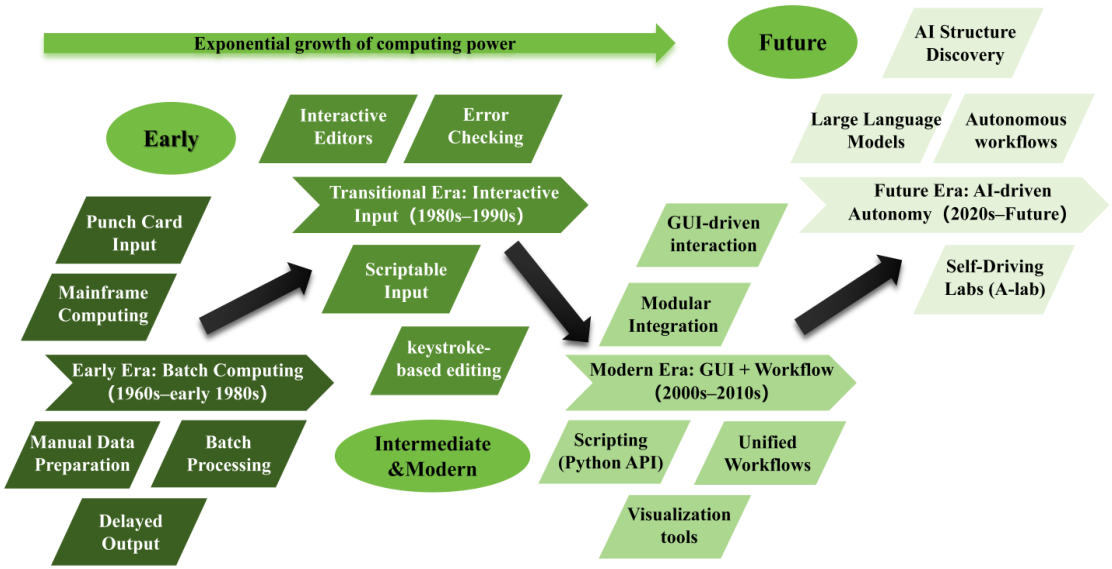
This section aims to review the development of crystallographic software. Historically, the origins of modern crystallographic computation originated in a series of general-purpose programs developed at Oak Ridge National Laboratory in the 1960s (shown in Figure 1). ORFLS established the framework for least-squares refinement; ORFEE enabled the calculation of derived structural parameters and their associated uncertainties; ORTEP revolutionized structural visualization by introducing thermal ellipsoid plotting [7,8,9]. These programs laid the computational basis for structure refinement, error analysis, and structural visualization, and these functionalities still remain the core of crystallographic software systems. Crystallographic software development has been driven by increases in computational power (Moore’s law) (Figure 2). Its evolution broadly shifted from early reliance on mainframe-based batch processing, to personal computer–driven interactive operation, and ultimately to the modern integrated platforms and automated workflows that unify data processing, computation, and visualization, as reflected in the different periods shown in Figure 1. Figure 3 illustrates the crystallographic software ecosystem composed of crystallographic databases, structure determination software, and visualization tools.

2.1. Crystallographic Databases

Crystallographic databases are used to collect and store known crystal structures. They provide the fundamental data infrastructure for crystallographic research, serve as reference standards for phase identification, and offer data support for the development and optimization of material properties. Consequently, they represent an important source of information for research in materials science, chemistry, and related disciplines. At present, mainstream crystallographic databases can generally be divided into two categories: commercial subscription databases and open-access databases. (A summary of the databases mentioned in this section is provided in the table at the end of this subsection.)

2.1.1. Commercial Subscription Databases

Cambridge Structural Database (CSD) is one of the earliest crystallographic databases dedicated to organic and organometallic structures. A key contribution of this database lies in its early adoption and promotion of the CIF format, which was developed by the International Union of Crystallography (IUCr), helping to address the long-standing difficulty of exchanging and reusing heterogeneous structural data, enabling high-quality archiving and semantic standardization of crystallographic information. Their business subscription model supports the ongoing maintenance of the database, rigorous data review, and the development of new features, ensuring data quality and long-term sustainable operation [10], and its development also provided a foundation for later open-access databases such as COD.
ICSD (Inorganic Crystal Structure Database), in contrast, is one of the most representative databases for inorganic crystal structures, forming a complementary coverage to the structural domain of CSD [11].

2.1.2. Open-Access Crystal Structure Databases

To further reduce the barriers created by subscription-based models, open-access crystallographic databases have gradually emerged. Among them, Crystallography Open Database (COD) is one of the most representative platforms, providing free access to crystallographic data for all users. In terms of data acquisition, the database covers both organic and inorganic crystal structure data through collaboration with journals, direct submissions from authors, and the systematic integration of existing public data [12].
Table 1 lists supplementary databases across various fields, including materials science, biology, and metallurgy.

2.1.3. From Databases to Structure Determination—From Known to Unknown

Crystallographic databases are not only used to store known crystal structure information but also play an important role in the interpretation of experimental data. In practical research, experimental diffraction data are typically first used for phase identification by comparing the measured diffraction patterns with reference data derived from crystallographic databases or standardized diffraction datasets. This allows rapid determination of the phase composition of a sample and assessment of whether it corresponds to a known structure. If no match is found, and after excluding factors such as data quality, crystallinity, and multiphase mixtures, the analysis proceeds to the stage of structure determination. Crystallographic databases remain valuable at this stage as well. In inorganic materials research, initial structural models can often be constructed based on isostructural analogies or known structure prototypes, whereas in single-crystal diffraction studies of biological macromolecules, molecular replacement enables the use of known structures from databases as templates. In addition, commonly occurring structural motifs can be extracted from databases to assist model building, and statistical distributions of bond lengths and bond angles can be employed as geometric restraints during refinement. These strategies contribute to improved efficiency and reliability in structure determination.

2.2. Single-Crystal Structure Determination

Structure determination fundamentally aims to establish the atomic coordinates of a crystal. Depending on the type of starting material, this process can be divided into single-crystal structure analysis and powder structure analysis, with the latter generally being more challenging in terms of extracting structural information. This subsection focuses on single-crystal analysis.
Single-crystal structure determination relies on diffraction intensities, from which the phase information lost during measurement is recovered via specific methods to precisely determine the three-dimensional atomic coordinates within the unit cell. Methods for achieving this include the direct method, which is applied to small-molecule structures and derives phases directly from observed structure factor amplitudes based on probabilistic considerations [6], and the Patterson method, which is used for structures containing heavy atoms and locates atomic positions using vector maps [14]. Regardless of the method employed, the initial result is only an approximate atomic model. This model must then be refined by adjusting structural parameters so that the calculated diffraction intensities best match the experimental observations, ultimately producing the most accurate structural model.

2.2.1. Main Solving Techniques

Direct Methods: This probabilistic approach, created by Herbert Hauptman and Jerome Karle (awarded the Nobel Prize in 1985) [15], solves the phase problem by using observed diffraction intensities and prior constraints, such as known atomic compositions. By deriving phases directly from structure factor amplitudes, this approach compensates for the loss of phase information, enabling the reconstruction of the electron density and the final crystal structure. This method is essential to the SHELX suite because it provides initial phase estimates and atomic models directly from diffraction intensities, permitting ab initio structure solution and supplying the starting point required for subsequent least-squares refinement.
Charge Flipping: Charge Flipping: Introduced by Oszlányi and Sütő, this ab initio structure solution method addresses the phase problem through a dual-space iterative algorithm that alternates between real and reciprocal space [16]. Unlike Direct Methods, it does not rely on probabilistic relationships but instead imposes a simple real-space constraint: flipping the sign of electron density values below a specific threshold. Charge Flipping is effective for determining complex or modulated structures from high-resolution data. Today, it serves as alternative to traditional methods and has been integrated into major crystallographic software suites such as JANA and GSAS-II.
Other: These methods are primarily tailored for small molecules. And methods for biological macromolecules, including Molecular Replacement (MR), Single/Multiple Isomorphous Replacement (SIR/MIR), and Single/Multi-wavelength Anomalous Diffraction (SAD/MAD), are beyond the depth of this discussion.

2.2.2. The Cornerstone of Structure Determination—SHELX Series

Early structure determination relied heavily on labor-intensive manual calculations. In the 1970s, the automation of structure determination was significantly advanced by the development of the landmark software SHELX by George M. Sheldrick [17]. By effectively automating the Direct Methods, the early version, SHELX-76, addressed limited computational resources through highly compressed data formats, enabling efficient data processing. Furthermore, its dependency-free architecture ensures seamless compilation and execution across diverse computing platforms, which remains a key reason for its continued widespread use today.
In the 1990s, SHELX-93 introduced a technical breakthrough by implementing refinement based on F2, improving its performance for complex structures. SHELX-97 further optimized F2 refinement and supported output in CIF format. Its widespread adoption in the crystallographic community facilitated the universal acceptance of the CIF format, which is defined by the data dictionaries in Volume G of the International Tables for Crystallography [18]. This integration catalyzed the standardization of crystallographic data [19].
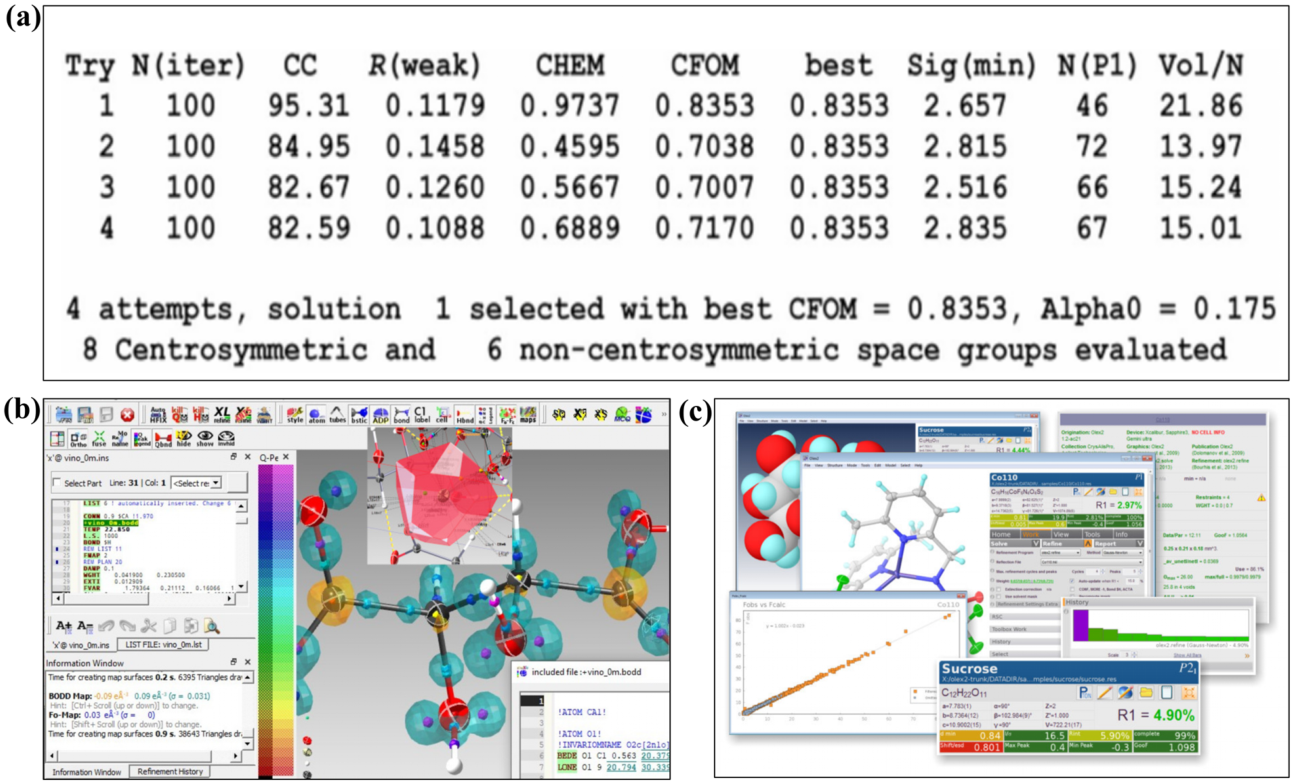
The SHELX software suite is modular, including SHELXL for refinement, SHELXT for automated structure solution (integrating advanced Direct Methods with dual-space recycling), and SHELXD for substructure solutions and locating heavy atoms using direct or Patterson methods [17]. As shown in Figure 4a, SHELXT generates an initial model that serves as the starting point for subsequent refinement with SHELXL. Nevertheless, these methods are primarily effective for small-molecule crystallography and often struggle with complex or disordered structures, where alternative approaches may be required.

2.2.3. User-Friendly Integrated Platform—Olex2

Although the SHELX series holds a central position in structure determination, its command-line interface poses a certain barrier to new users. To improve user experience, several graphical user interface programs have been developed. As shown in Figure 4b, SHELXLE serves as a graphical front end for SHELXL, reducing operational difficulty to some extent. In comparison, Olex2 provides a highly integrated approach to structure determination. As illustrated in Figure 4c, Olex2 consolidates structure solution, refinement, visualization, and CIF file generation within a single interface [20], significantly lowering the barrier to use. Consequently, Olex2 is widely applied for routine small-molecule single-crystal structures.
However, when dealing with highly disordered or complex structures, researchers often still require the fine parameter control available through SHELX’s command-line tools. Therefore, in practice, Olex2 and SHELX are often used in a complementary manner.
Figure 4. (a) SHELXT Structure Solution Result Evaluation Interface (for selecting the best initial model) [21], licensed under CC BY 2.0. (b) SHELXLE Interface for Interactive, Manual Structure Refinement [22], licensed under CC BY 2.0. (c) Olex2′s Multi-Window, Multi-Task Operation Mode software interface screenshot sourced from the Olex2 official website (https://www.olexsys.org/olex2/ (accessed on 19 December 2025)).
Crystals 16 00328 g004

2.2.4. Handling Complex Structures—JANA Series

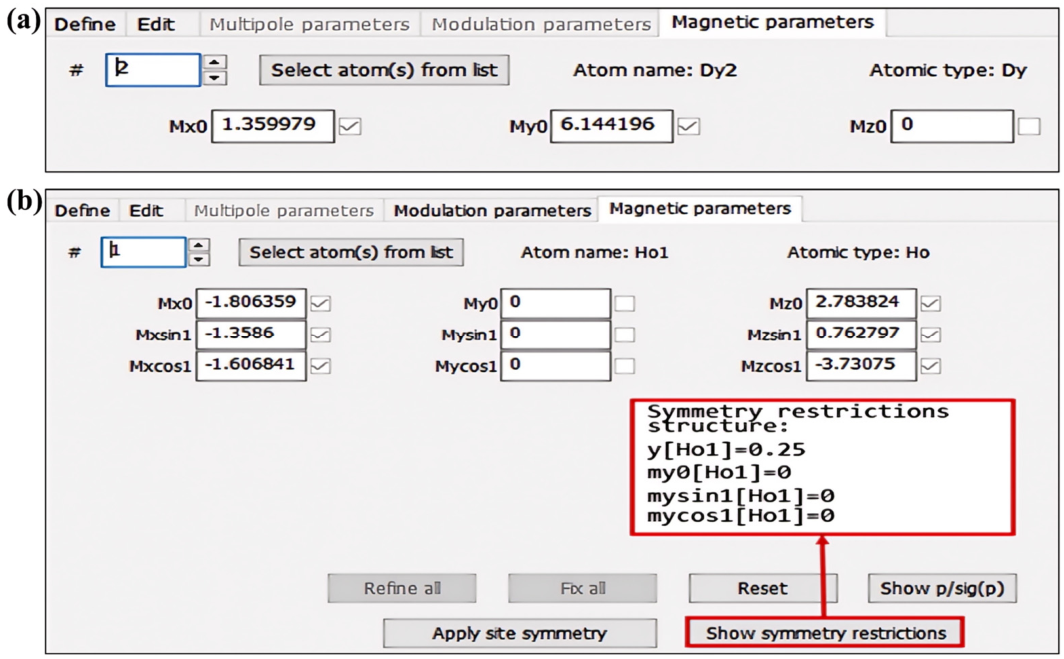
For complex systems such as modulated structures, magnetic structures, and composite structures, conventional structure determination software is often insufficient. The JANA software series was specifically developed with a strong focus on handling such complex structures. Early versions, JANA1998 and JANA2000, were based on super-space group theory and designed for the analysis of modulated, magnetic, and composite structures. The subsequent release, JANA2006, represents a landmark in the series, providing a multifunctional integrated platform for analyzing complex structures. Figure 5 shows the user interface of the software.
At the technical level, this version further integrated methods such as rigid-body refinement to enhance the precision and professional capabilities of structural refinement. JANA2020 [23] further incorporated more automated workflows and improved user interaction features, continuing to lower the barrier for handling complex structural problems.
At the end of this subsection, Table 2 presents a comparison of the aforementioned software in terms of open-source status, core functionalities, and related aspects.

2.2.5. Structure Validation and Error Detection

While the increasing automation of structure determination procedures has greatly improved research efficiency, it also inevitably introduces the risk of human oversight. Historical examples of this kind are not uncommon. These include cases in which a praseodymium complex was incorrectly solved in a non-centrosymmetric space group [24], as well as instances where an N–H group on a key ring of an anticancer natural product was misassigned as an oxygen atom, leading synthetic efforts based on the erroneous structure to deviate from the correct direction for several years [25]. There have even been reports in which a common compound such as borax was misidentified as an entirely new heterocyclic species [24]. Consequently, within the crystallographic workflow, the completion of refinement does not represent the end of the analysis. Rigorous validation tools are still required to ensure the reliability and quality of the structural data.
In the context of structure validation, PLATON, developed by A. L. Spek, remains one of the most representative core tools. The program also serves as a major implementation platform for the checkCIF validation framework promoted by the International Union of Crystallography, enabling a systematic quality assessment of crystallographic structure models. Its functions include the automated identification of potentially missed symmetry elements through the ADDSYM routine, detection of abnormal atomic displacement parameters (Ueq), and quantitative evaluation of unusual bond lengths, bond angles, as well as void volumes within the crystal structure [24].
In addition, IUCRVal was developed as a local implementation of the checkCIF framework to meet validation needs in offline environments. This tool allows researchers to perform preliminary checks of structural files before submission to public databases or journal systems, helping determine whether the data meet the requirements for academic publication and database deposition.
Finally, Table 3 supplements the relevant software associated with different types of validation.

2.3. Structure Determination from Powder Diffraction

While single-crystal X-ray diffraction remains the most direct method for obtaining unknown crystal structures, it is often constrained by the technical challenges of crystal growth and inherent material properties, making the preparation and preservation of experimental-grade single crystals difficult. Consequently, powder diffraction analysis has become an essential alternative approach. However, powder diffraction data represent a projection (or radial averaging) of three-dimensional reciprocal space information onto a one-dimensional diffraction pattern, leading to severe peak overlap and significant loss of information.
To overcome the ambiguity of 1D data, structure determination from powder diffraction data requires a multi-step strategy. Integrated intensities are extracted using pattern-decomposition techniques such as Le Bail or Pawley methods. These extracted intensities can be used for ab initio structure solution through approaches such as Direct Methods or Charge Flipping (mentioned in Section 2.2.1.), to produce an initial structural model.
The resulting model is then optimized using the Rietveld refinement method. Originally introduced by Hugo Rietveld in 1967–1969 for neutron constant-wavelength data [26], has become the standard approach for refining the structure. Unlike methods based on integrated intensities, Rietveld treats each data point in the step-scanned pattern as an independent observation. It performs a least-squares minimization of the residual between the observed and calculated intensities, simultaneously adjusting structural parameters (such as atomic coordinates, occupancies, and thermal factors) alongside background variables.
Over time, a variety of software packages have been developed to implement this method. Historically, the freeware program PowderCell was widely used in early crystallographic analysis with an intuitive graphical interface that allowed users to manipulate crystal structures and calculate X-ray powder patterns in real time. Its user-friendly design and stable performance made structural visualization and basic structural modeling more accessible to researchers [27]. Some programs such as RIETAN, GSAS [28], DBWS (LPHM was one of the early predecessors of DBWS), and Full-Prof were established, significantly expanding the method’s application from simple structure refinement to more complex tasks such as quantitative phase analysis. In contrast, modern suites such as GSAS-II and TOPAS can incorporate structure solution strategies such as Direct Methods or Charge Flipping. This design allows them to resolve intricate structural features that go beyond the capabilities of basic Rietveld codes.

2.3.1. HighScore Suite: Professional Commercial Software for Phase Identification

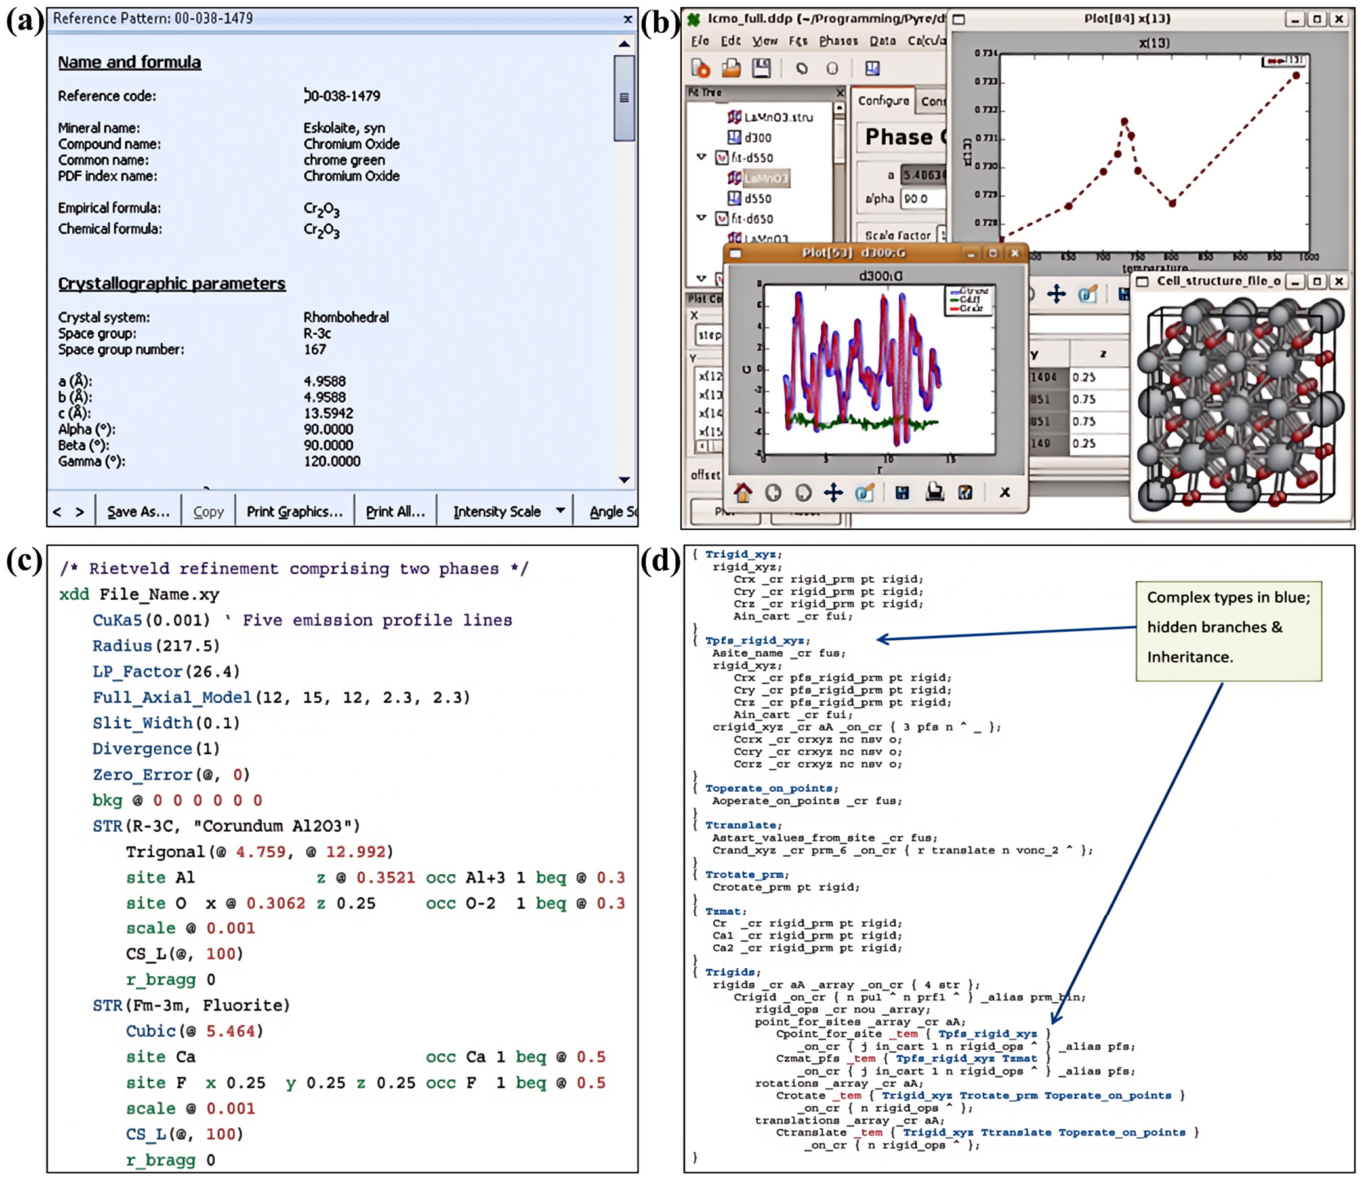
Phase identification constitutes the initial stage of powder diffraction analysis. As a widely used commercial integrated platform, HighScore Suite’s core advantages lie in its multi-database joint retrieval and highly automated workflows, providing robust phase identification capabilities. The software supports simultaneous identification of major and minor phases through efficient database search algorithms, enhancing analytical efficiency while ensuring identification accuracy [29]. As illustrated in Figure 6a, HighScore supports the retrieval of crystallographic information directly from the PDF-4+ database. Recent developments of HighScore Suite have focused on improving computational efficiency, enhancing fitting performance, and expanding compatibility with various detector formats. In addition, the software has been optimized for handling large-scale diffraction datasets, enabling more efficient data processing and more flexible analysis of complex systems.

2.3.2. TOPAS: Optimized Human–Computer Interaction

In contrast to the highly encapsulated environment of HighScore, TOPAS emphasizes high flexibility in Rietveld refinement and structure determination, specifically targeting complex problems. Utilizing an internal mathematical parser and macro language, it allows users to directly define parameter relationships in the form of mathematical expressions (Figure 6c). Furthermore, Figure 6d demonstrates a flexible, template-based programming framework of TOPAS. This architecture enables the handling of intricate issues such as magnetic and modulated structures, while providing a versatile platform for developing novel refinement methodologies [30]. However, the flexibility of such parameterized approaches also requires substantial user expertise, and the risk of overfitting or non-unique solutions remains a persistent challenge. TOPAS and HighScore maintain a complementary relationship similar to that of SHELX and Olex2: the former emphasizes research depth and flexibility, whereas the latter focuses on workflow standardization and ease of operation.

2.3.3. Addressing Short-Range Order and Local Complexity: PDFgui

Traditional Rietveld refinement primarily characterizes long-range ordered structures; however, modern materials science increasingly encounters amorphous phases, nanomaterials, or crystals exhibiting significant local distortions. The Atomic Pair Distribution Function (PDF) analysis addresses these challenges by performing a Fourier transform of the total scattering structure function S(Q), providing a probability distribution function G(r) that reflects the atomic pair distances in real space. This approach enables the analysis of local atomic arrangements, offering insights into structural features beyond the limitations of traditional diffraction methods.
PDFgui, developed by the group of Simon J. L. Billinge, is part of the DiffPy software suite and is designed for atomic pair distribution function (PDF) analysis. It supports multi-model fitting, structural modeling, and the application of symmetry constraints, making it well-suited for the study of disordered systems and nanostructured materials. Complementary to programs such as TOPAS, which focus on average structure refinement. PDFgui exemplifies the increasing integration and improved user accessibility in crystallographic software, as illustrated by the multi-window workflow shown in Figure 6b [31]. Notably, PDF analysis is sensitive to data quality and modeling assumptions, and the interpretation of local structures may not always be unique.

2.3.4. GSAS-II: An Integrated Open-Source Platform

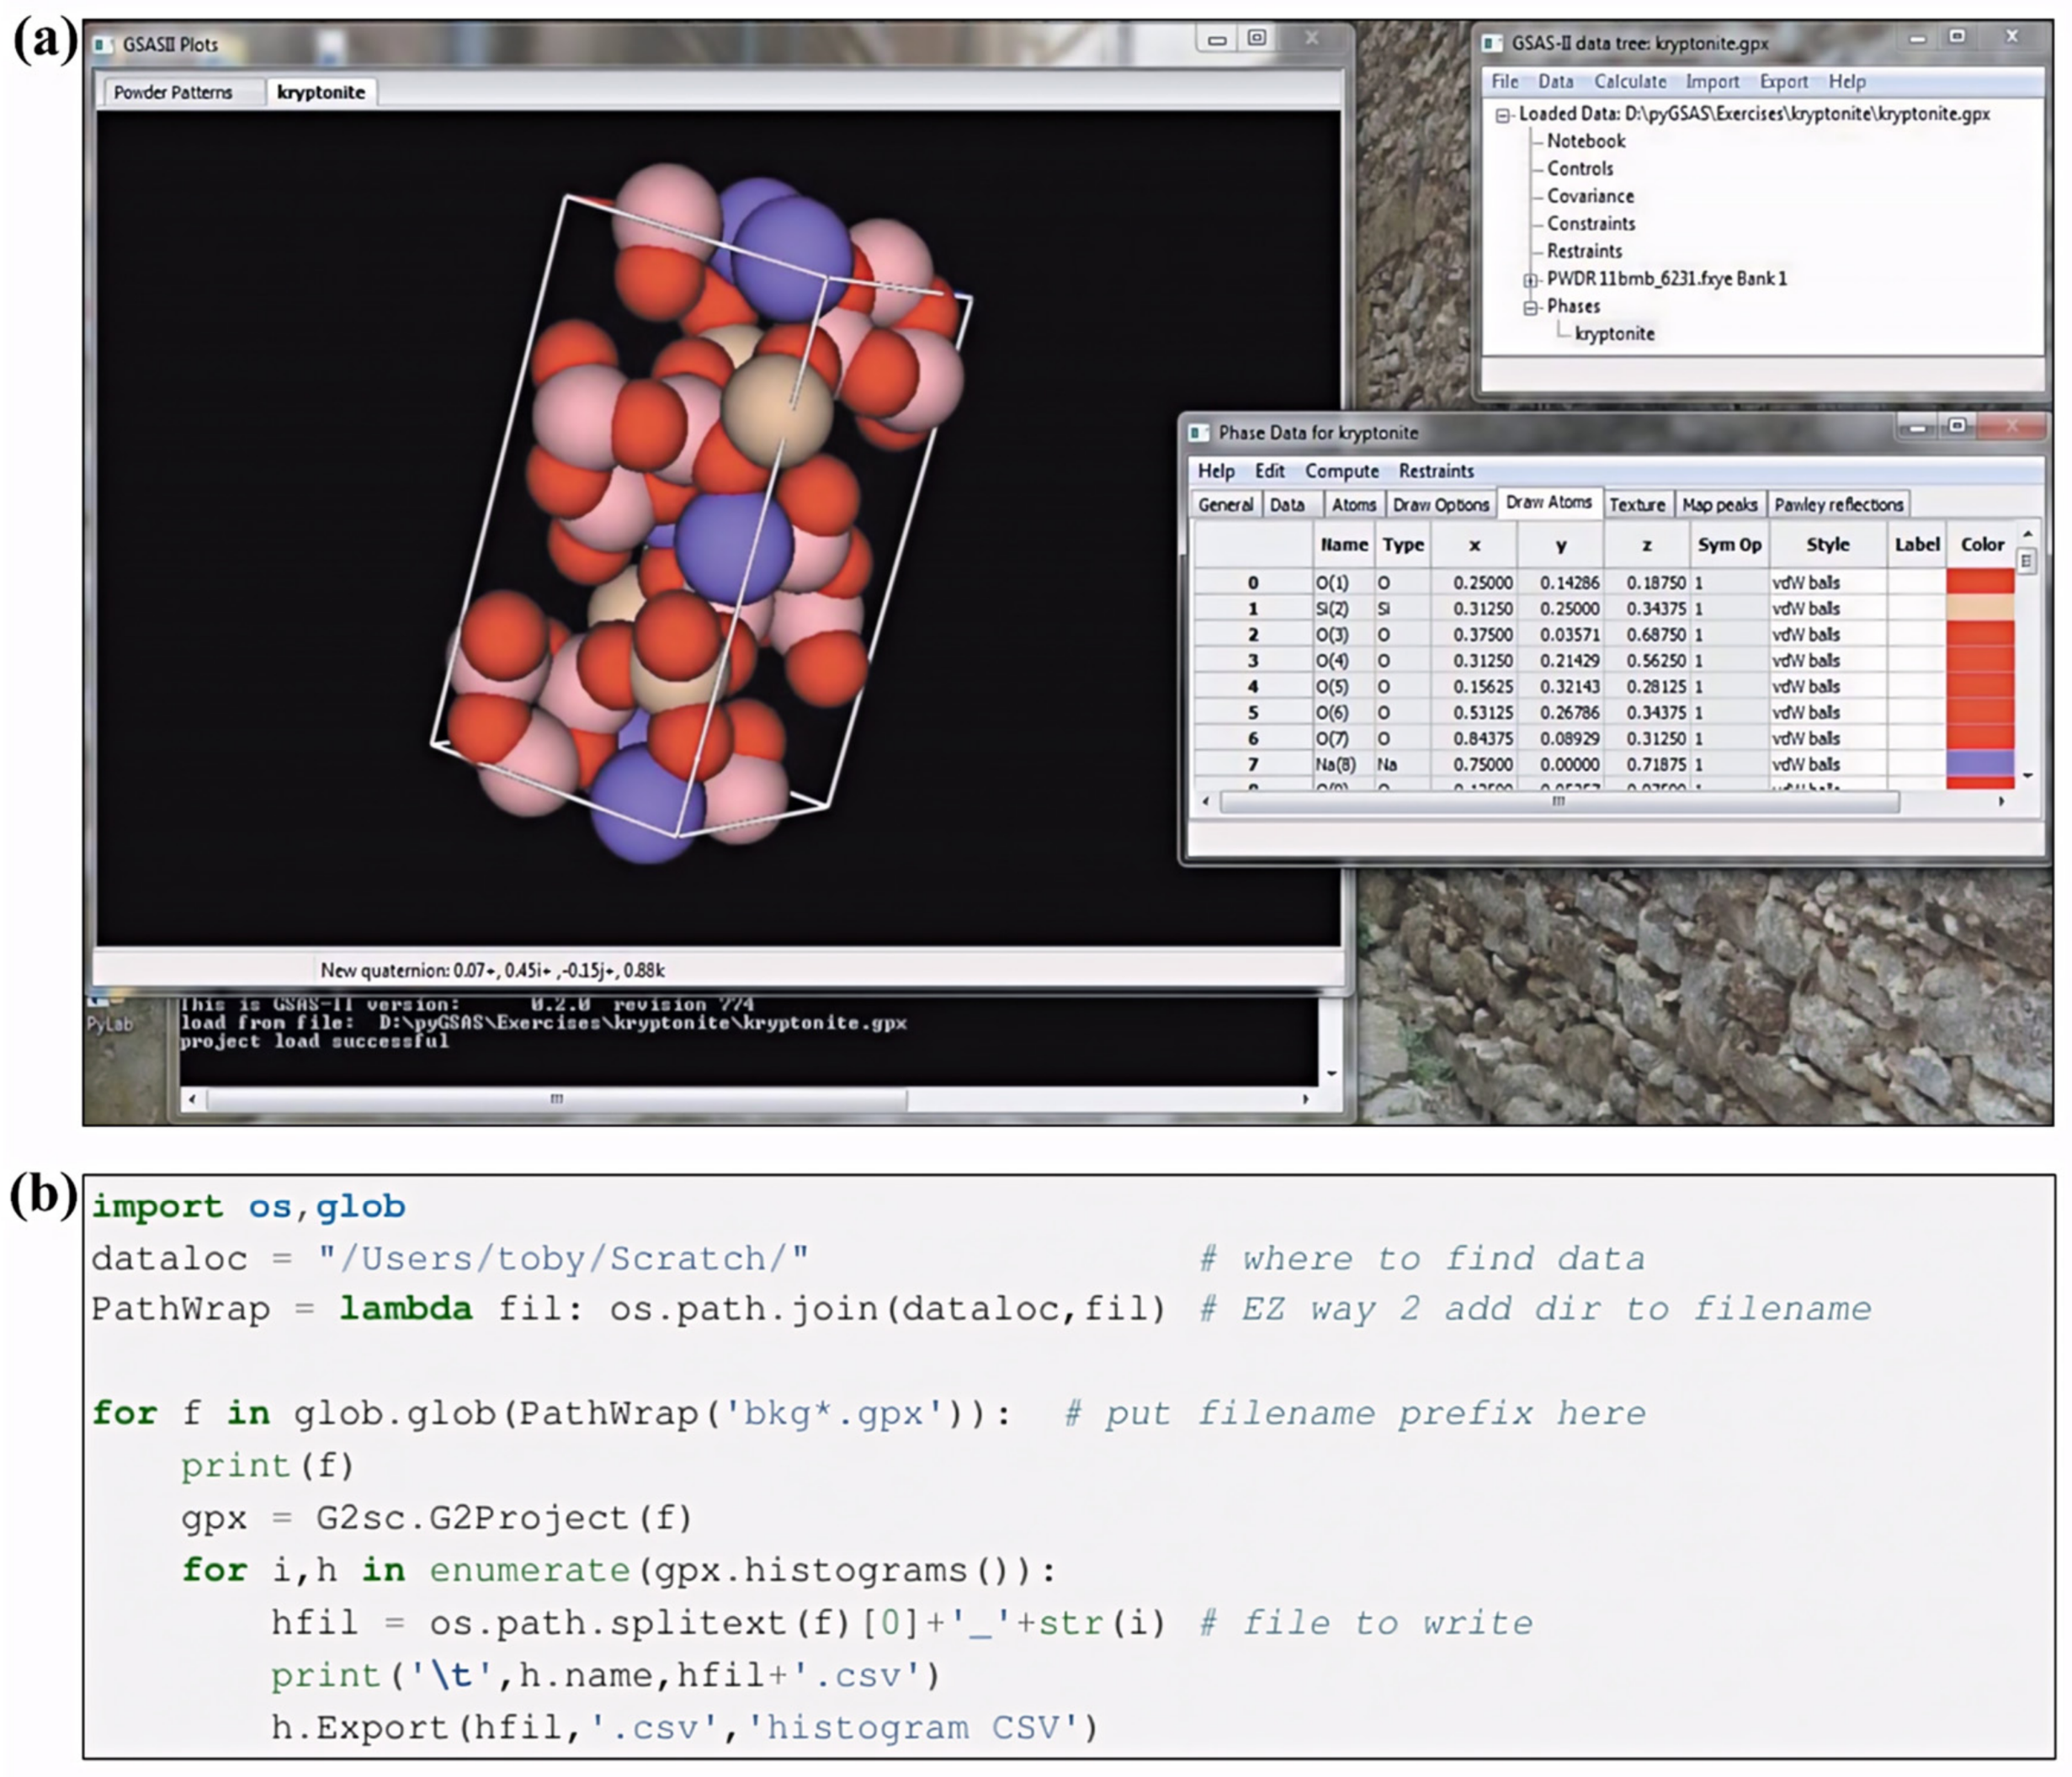
Unlike the proprietary design approaches of the aforementioned software suites, GSAS-II stands out as a powerful and comprehensive open-source alternative. As a modern revisualization of the classic GSAS and EXPGUI programs, GSAS-II achieved near-comprehensive coverage of the powder diffraction analysis process. As a paradigm of modern open-source platforms, GSAS-II provides both a fully integrated graphical interface (Figure 7a) and a Python API, enabling seamless integration with libraries such as NumPy (NumPy 1.24.4) and Matplotlib (Matplotlib 3.7.2). This versatile architecture not only facilitates complex data processing but also supports the automation of workflows. Developed by Brian H. Toby and Robert B. Von Dreele, GSAS-Jupyter NotebookII has been available as an open-source Python platform since 2013, incorporating core functionalities such as Rietveld refinement and structure solution, while supporting the simultaneous refinement of multiple datasets. The true innovation of GSAS-II lies in its ability to combine diverse data types, including powder and single-crystal data from both X-ray and neutron sources, for the solution of a single crystallographic problem [32]. Despite its versatility, the complexity of its interface and workflow may cause a barrier for new users.

2.3.5. Full-Prof: A Benchmark for Full-Profile Fitting and Magnetic Structure Refinement

Although GSAS-II offers a relatively comprehensive solution for powder diffraction analysis, specialized tools remain essential for addressing specific structural complexities, particularly in magnetic structure determination and neutron diffraction data analysis. In this context, FullProf, as a classical program dedicated to neutron diffraction and magnetic structure refinement, plays an important role.
Originally developed by Rodríguez-Carvajal and his group, FullProf is a descendant of the DBWS program (developed by Young and coworkers in the 1970s). Although core neutron scattering capabilities were already present in the early Rietveld refinement programs, FullProf represents an extension of these methodologies and has become one of the foundational platforms for neutron powder diffraction analysis. By leveraging the unique sensitivity of neutrons to both nuclear positions and magnetic moments, the software is exceptionally well-suited for investigating magnetic materials and multiphase systems [33]. In practical applications, FullProf is widely used for the determination and refinement of magnetically ordered structures. Unlike conventional X-ray methods, neutron diffraction enables the direct probing of spin configurations, providing the requisite experimental data to elucidate complex magnetic models [33]. From a methodological perspective, FullProf supports the refinement of incommensurate magnetic structures and facilitates the modeling of modulated phases within the super-space formalism [34]. Its integrated symmetry analysis capabilities further ensure the rigor and reliability of complex structure determination. With the evolution of the crystallographic ecosystem, FullProf has progressively transitioned toward high-throughput workflows. Nonetheless, its command-line style input and relatively steep learning curve may limit accessibility for less experienced users. For instance, the Python-based FullProfAPP functions as a modern GUI wrapper that introduces sequential refinement, batch processing, and automated whole-pattern analysis, significantly enhancing data processing efficiency and user interaction [35].

2.3.6. Evolution from Computational Tools to Research Platforms

A comprehensive survey of the development of single-crystal and powder structural analysis software reveals a clear transition from isolated mathematical utilities toward integrated research platforms. This evolution is characterized by the advancement of scripting capabilities. Early command-line-driven architectures, as exemplified by programs such as SHELX and FullProf, enabled batch processing through streamlined instruction flows, establishing the foundation for automated structural analysis. This was followed by the introduction of embedded macro languages, such as those found in TOPAS, which allowed domain-specific customization and complex constraint modeling. More recently, the seamless integration of application programming interfaces (APIs) into general-purpose languages like Python has significantly augmented the flexibility of crystallographic software. This direction is further exemplified by GSAS-II and the Python-based FullProfApp, and such integration enables the development of end-to-end automated workflows and facilitates interaction with advanced data analysis libraries.
Finally, Table 4 presents a concise comparison between the aforementioned structure determination software in terms of core functionalities and scripting capabilities, while Table 5 provides a brief overview of other structure determination programs, highlighting their application scenarios and key characteristics.

2.4. Evolution of Crystal Structure Visualization Software

Visualization software transforms atomic coordinates and experimental data into intuitive three-dimensional representations, serving as a central tool for structural validation and physical property analysis. The field is currently advancing toward high levels of integration and real-time interaction.

2.4.1. VESTA: An Integrated Tool for the Comprehensive Visualization Workflow

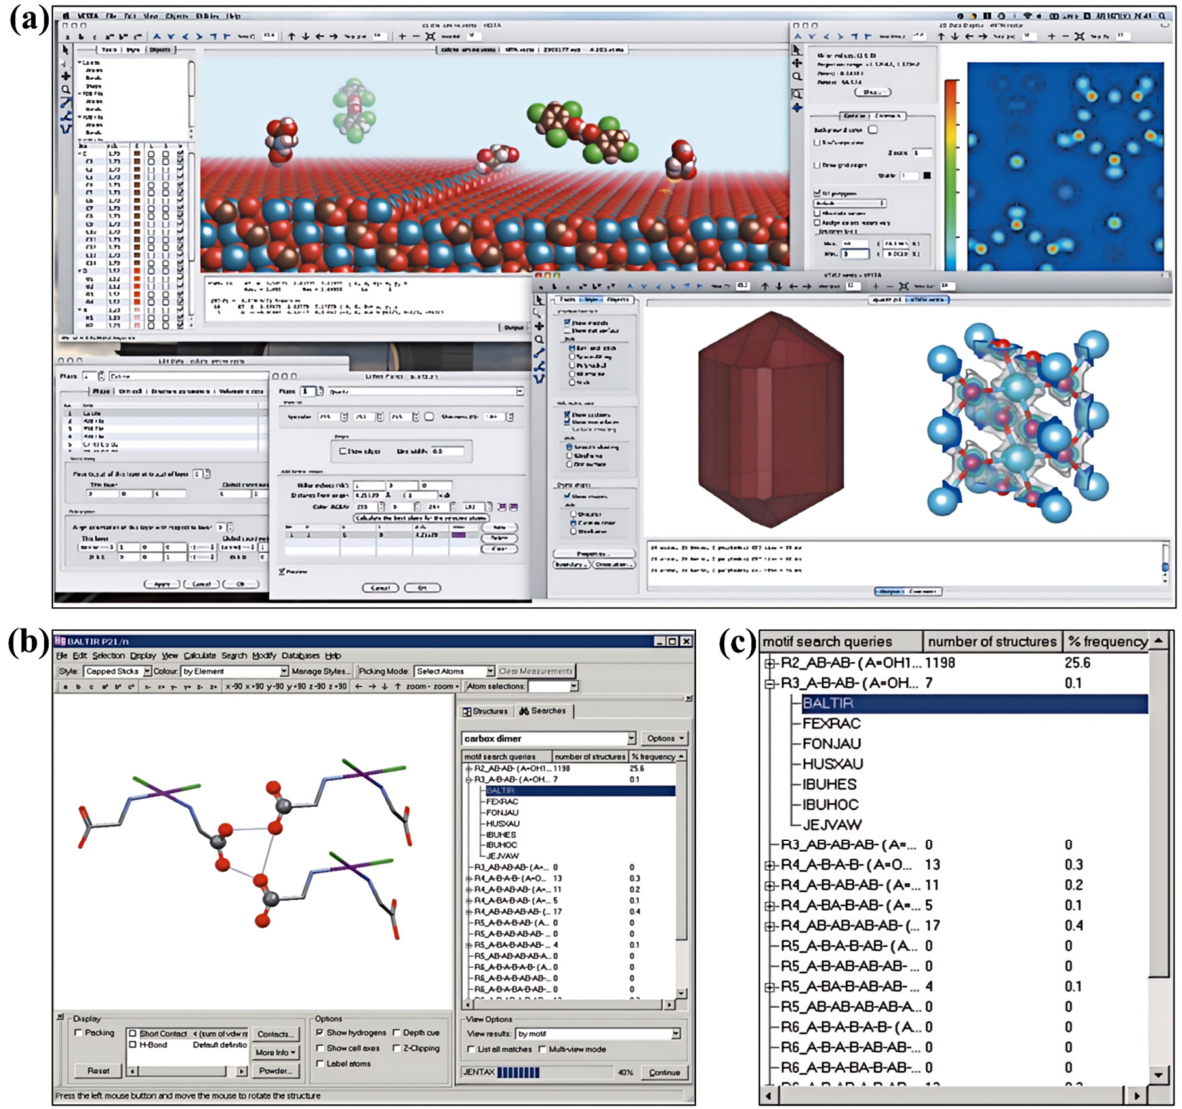
Early crystal structure visualization software was characterized by fragmented functionality, necessitating frequent transitions between disparate programs to validate structures, observe models, inspect electron density maps, and generate figures. The emergence of VESTA provided an integrated platform for these procedures; as illustrated in Figure 8a, it integrates structural modeling, diffraction simulation, and volumetric data visualization [44]. With continuous development, the capabilities of VESTA have gradually evolved from simple visualization toward quantitative structural analysis. VESTA 2.0 incorporated Voronoi-based topological analysis, enabling quantitative investigation of local structural environments. Through successive iterations, VESTA has evolved from a visualization tool into a platform that supports both qualitative and quantitative structural analysis. Its functionality has been expanded to include topological analysis, improved volumetric data visualization, and enhanced rendering performance through hardware acceleration, significantly strengthening its capability to handle complex three-dimensional structures and large datasets. However, VESTA is primarily a visualization tool and does not provide advanced structure analysis or refinement. Overall, the development of VESTA illustrates the transition of crystallographic visualization software from qualitative display tools toward integrated platforms that combine quantitative analysis with high-performance visualization.

2.4.2. Mercury: Data-Driven Visualization and Analysis Tool

As the companion visualization tool for the CSD, Mercury facilitates the inspection of structures across vast datasets. A pivotal development was the introduction of the Materials Module, which provides advanced tools for analyzing intermolecular interactions and crystal packing motifs [45].
Mercury features two primary innovations: it allows users to define geometric parameters for specific interactions and subsequently search the CSD for matching structures; in addition, it can quantify the degree of similarity between packing modes in different structures (see Figure 8c). Currently, the CCDC continuously enhances Mercury’s functionality and strengthens its integration with the broader CCDC ecosystem, for example, coordinating with ConQuest for advanced database retrieval and integrating statistical knowledge from the Mogul and IsoStar libraries. This “search–visualization–statistical analysis” paradigm has established Mercury as an important tool in pharmaceutical polymorph prediction and supramolecular engineering.

2.4.3. Transitioning from Desktop to Cloud-Based Architectures: JSmol and NGL Viewer

Driven by the escalating demands for collaborative scientific research, visualization platforms are undergoing a transition from standalone local execution toward cloud-integrated environments.
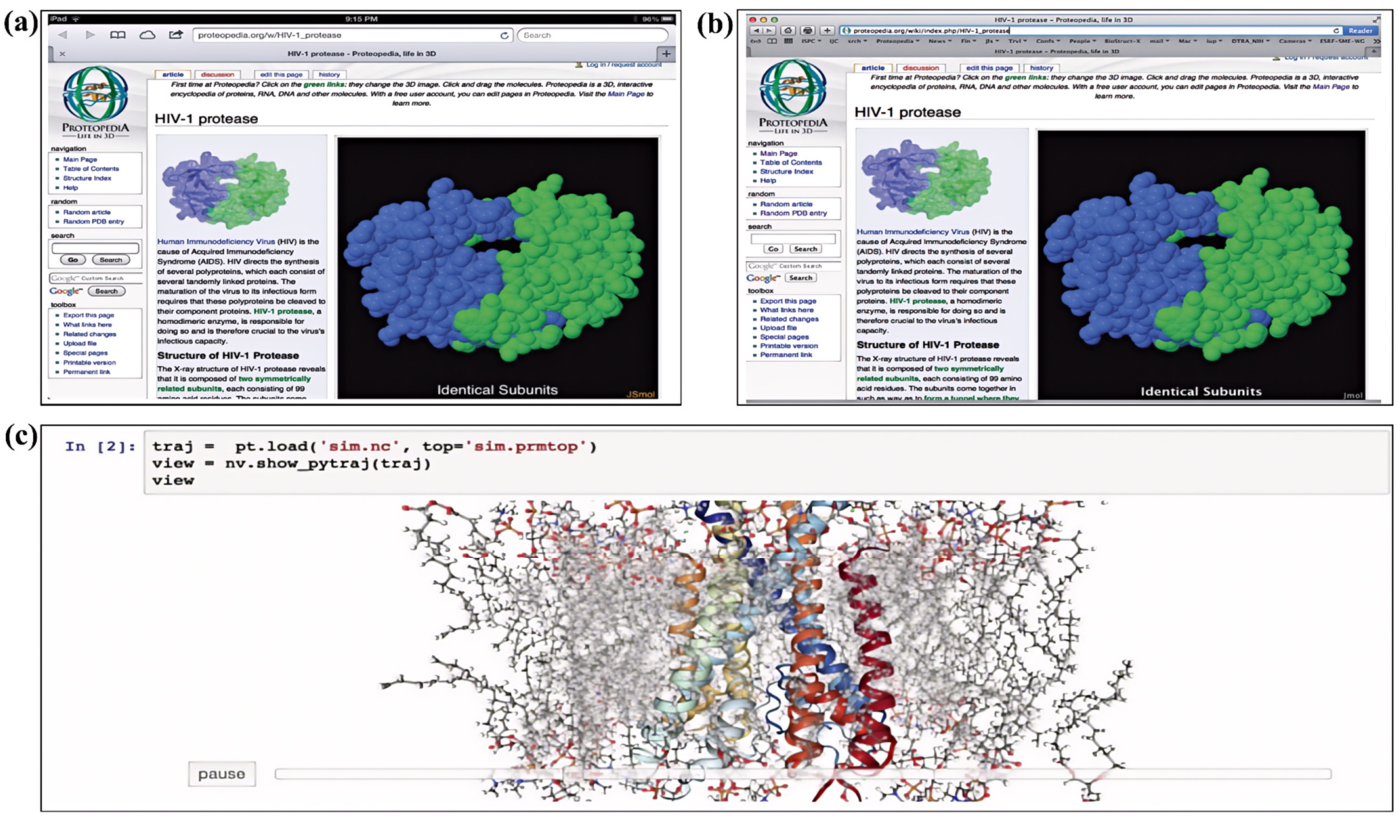
JSmol provided a JavaScript-based alternative to legacy Java Applet implementations, effectively resolving long-standing web compatibility constraints [46]. This transition enabled fully functional, plugin-free web-based visualization. It also ensured that extensive online scientific resources previously dependent on Java remained accessible. As illustrated in Figure 9a,b, the successful deployment across both mobile and desktop platforms demonstrates the feasibility of purely browser-based visualization.
Despite these advances, the rendering performance of JSmol remains constrained by browser-side computational efficiency, particularly when handling large biomacromolecules or complex trajectory data [46]. Consequently, native WebGL-based tools, exemplified by NGL Viewer, leverage GPU acceleration to achieve performance levels approaching those of local desktop applications. The primary value of NGL Viewer lies in its excellent integration capabilities within diverse computational environments; Figure 9c depicts its integration within a Jupyter Notebook (Jupyter Notebook 6.5.4) environment, enabling real-time characterization of dynamic processes such as molecular dynamics (MD) trajectories [47]. The success of NGL Viewer has not only challenged the traditional perception that web-based visualization tools are inherently limited in performance but also contributed to the development of modular design frameworks that paved the way for subsequent high-performance visualization platforms such as Mol* [48].
Finally, Table 6 provides a comparative analysis of the aforementioned visualization software from multiple dimensions, including rendering quality and output formats. Table 7 further supplements additional visualization tools, summarizing their respective application domains and core functionalities.
Figure 9. (a) Mobile version: An HIV-1 protease page accessed in an iPad browser, based on JSmol technology. (b) Desktop version: The full view of the same page in a desktop browser [46]. (c) Visualization analysis of molecular dynamics simulation trajectories using the NGL Viewer library [49].
Crystals 16 00328 g009
Table 7. Index of Visualization Software in Other Domains.
SoftwareApplication FieldCore FeaturesLicense Type
CrystalMaker
[50]
Small-molecule and materials crystallographyInteractive modeling and high-quality visualizationCommercial
PyMOL
https://pymol.org/
(accessed on 19 December 2025)
BiomacromoleculesProduction of publication-quality images and animationsOpen source and subscription
COOT [51]BiomacromoleculesInteractive macromolecular model building and electron density visualizationOpen source
Diamond
https://www.crystalimpact.de/diamond (accessed on 19 December 2025)
Small-molecule and materials crystallography High-quality visualization, analysis, and publication-ready plotting of crystal structuresCommercial
VMD
[52]
Biomacromolecules/SimulationsVisualization of molecular dynamics simulation trajectoriesOpen source
RasMolGeneral-purpose (historical)Early command-line visualizationOpen source
ChemDoodle
https://www.chemdoodle.com/ (accessed on 19 December 2025)
Organic chemistry
/Web
Specialized in handling 2D chemical notations and interactive 3D visualizationCommercial
Avogadro [53]General-purpose molecular modeling and simulationInteractive building, real-time geometry optimization, and computational chemistry interfaceOpen source

2.5. Development and Contribution of Domestic Crystallographic Software

In recent years, Chinese research groups have made notable progress in the development of crystallography-related software and platforms, covering areas such as powder diffraction, large-scale facility data, high-throughput computation, and database construction. For instance, the Institute of Physics, Chinese Academy of Sciences has advanced powder diffraction analysis and automated refinement workflows, promoting the scripting and integration of software tools. The Institute of High Energy Physics, Chinese Academy of Sciences, together with the Shanghai Synchrotron Radiation Facility, has developed software and platforms for synchrotron diffraction data processing, facilitating the upgrading of data handling for large-scale facilities and the automation of experimental procedures. At the computational level, the Materials Genome Engineering Research Center at Peking University has established high-throughput materials computation platforms, contributing to the development of data infrastructure. In addition, the Computer Network Information Center of the Chinese Academy of Sciences has integrated cloud computing with materials simulation, fostering the transition toward cloud-native research environments. Overall, crystallographic software in China is evolving from standalone tools toward integrated, platform-oriented, and increasingly intelligent systems.
This development trend is further reflected in the research practices of Chinese research groups, particularly in the automation of full workflows for powder diffraction analysis. Significant contributions have been made by the Feng group, which has long focused on the development of core algorithms for powder X-ray diffraction data analysis and the localization of software systems, systematically establishing a domestic software ecosystem that spans the full analytical workflow. Centered on the independently developed iPowder integrated platform, the team has addressed several key challenges, including automatic integration of two-dimensional diffraction data (iRing) [54], intelligent recognition of multiple data formats, fully automated background subtraction, and high-speed phase identification based on relational databases (iQual) [55]. In the area of crystal structure solution, genetic algorithms and particle swarm optimization have been introduced into direct-space methods, leading to the development of programs such as GEST and PeckCrsyt [56,57]. For the refinement stage, artificial intelligence techniques have been incorporated into the Rietveld method, resulting in tools such as AutoFP and the Q-learning–based PowderBot, which enable automated refinement [58,59]. The team has also developed a three-dimensional crystal structure visualization program, iModel, and constructed an in-house database comprising tens of thousands of powder diffraction datasets [60]. At present, the iPowder platform supports automated peak searching, background subtraction, phase identification, and matching of XRD data, and has been interfaced with large language models to enable natural language–driven interactive structure solution [61]. These developments have significantly advanced the autonomy of X-ray diffraction data analysis in China.

3. Outlook

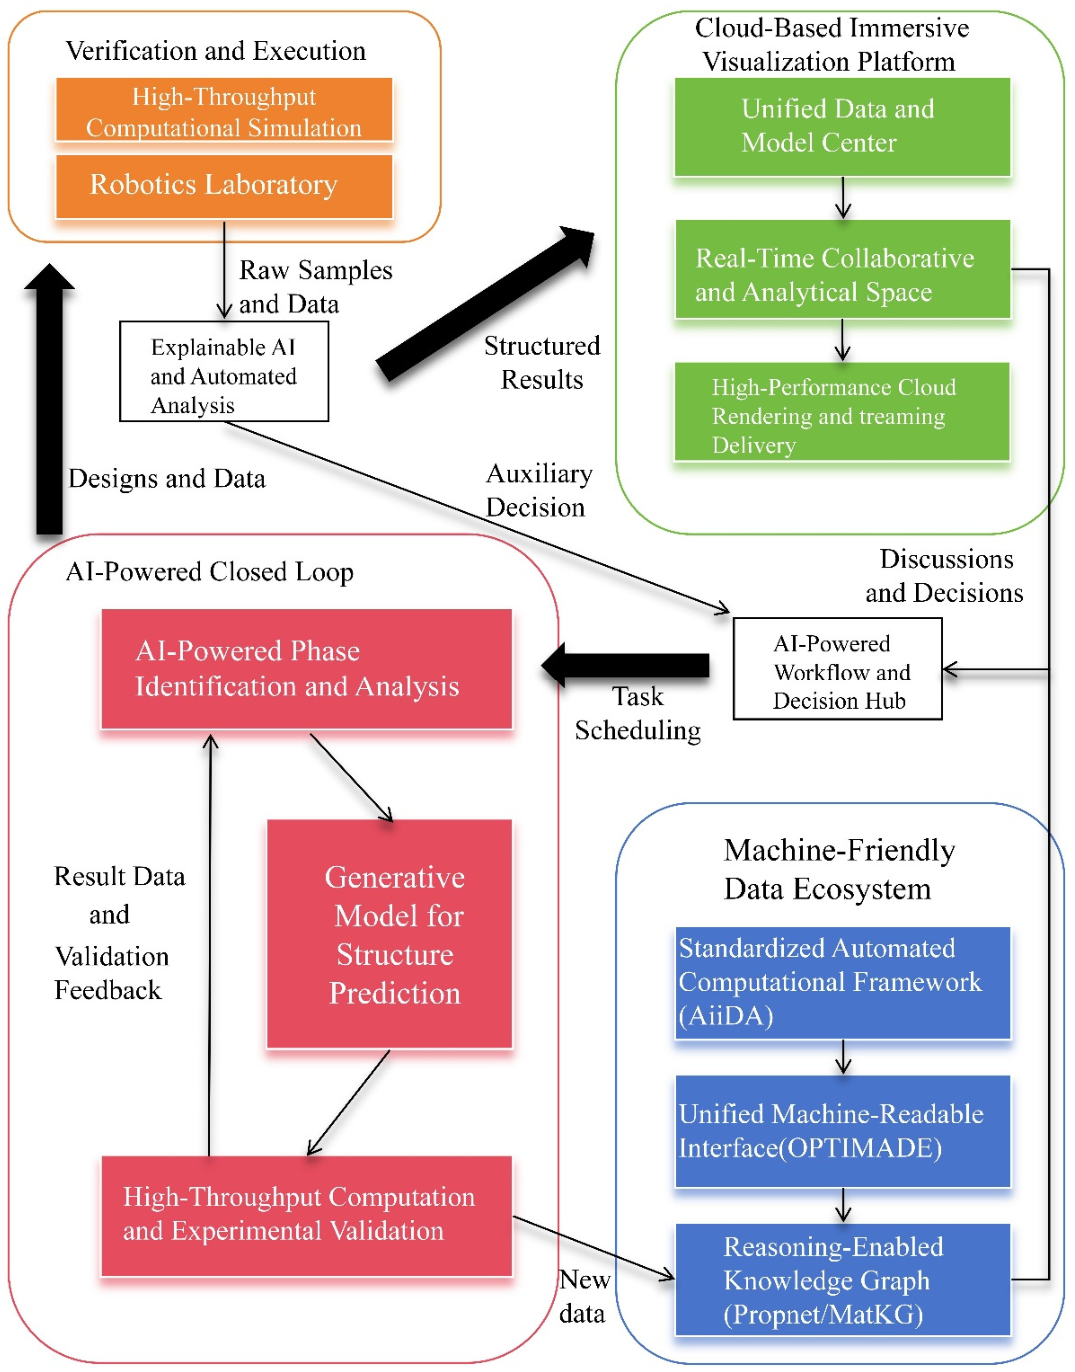
Current trends indicate that crystallographic software is evolving from standalone tools toward multifunctional integrated platforms. Databases, structure determination software, and visualization modules are becoming deeply interconnected, enhancing research efficiency. With the revolutionary development of artificial intelligence and the explosive growth of data, one can envision the future research paradigm in crystallography, as illustrated in Figure 10, as a highly automated, human–machine collaborative, and self-optimizing intelligent loop. In this framework, a machine-readable data ecosystem serves as the foundation, high-throughput computation and robotic laboratories provide the primary driving force, and AI-driven analysis and decision-making guide the research process. Cloud-based collaborative visualization platforms enable fully automated workflows for crystallographic studies. Such a human–machine collaborative model may fundamentally reshape the workflow of crystallographic research.

3.1. Future Machine-Readable Crystallographic Data Ecosystems

Traditional crystallographic databases, such as CSD and ICSD, rely heavily on manual curation and expert knowledge. Their operational models face efficiency limitations in the context of today’s explosive growth of data. To achieve intelligent data management, the establishment of machine-readable crystallographic databases has become an important trend. This transformation is not merely a change in the mode of data storage; it also provides the fundamental basis for the logical coupling among different modules within an intelligent closed-loop experimental system.

3.1.1. AiiDA: A Computational Framework for Automated Data Injection into Databases

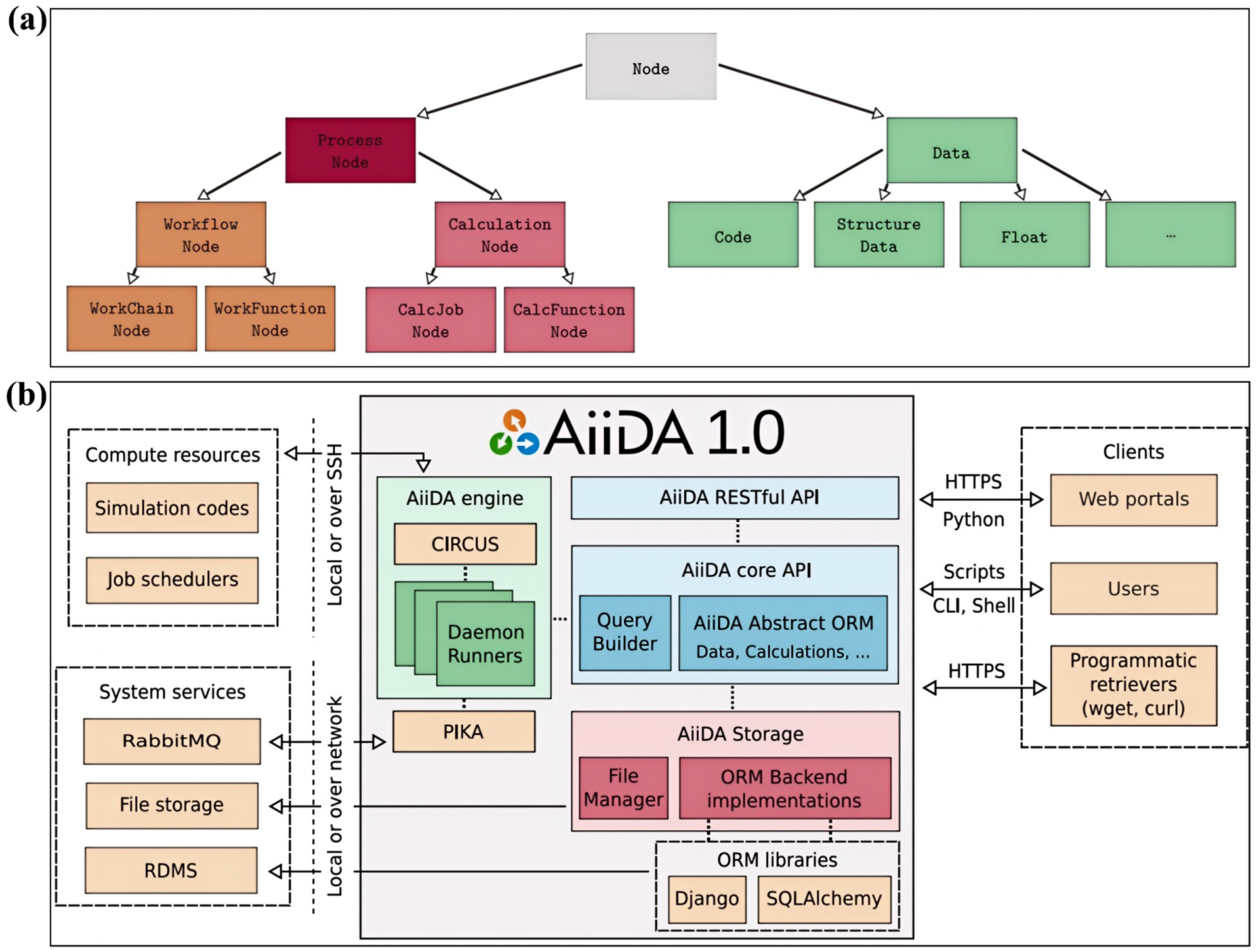
Unlike conventional static databases, the key feature of AiiDA lies in establishing a rigorous automated data provenance mechanism. AiiDA models computational processes as directed acyclic graphs (DAGs) by abstracting data, code, and computational instances into a hierarchical node system (Figure 11a). The framework records the entire workflow from raw input to final results [62,63], enhancing data reusability and research traceability. This is a foundation for machine readability.
Within future closed-loop architectures, AiiDA serves as a provenance hub. As shown in Figure 11b, it coordinates the standardized encapsulation of heterogeneous computational software through its modular, plugin-based architecture. This paradigm ensures that complex computational operations are converted into machine-actionable logical primitives, maintaining operational robustness across heterogeneous environments while providing a modular foundation for seamless software iteration [64].

3.1.2. Machine-Readable Data—OPTIMADE

To overcome format barriers among crystallographic databases, the OPTIMADE protocol was introduced. It defines a unified syntax, JSON-based standardized return data, and standard API endpoints [65], laying the foundation for machine understanding of semantics. This allows users to build a single client to access resources from all databases participating in the OPTIMADE protocol. Such universal protocols are addressing challenges in cross-platform collaboration and data sharing, driving a shift in software development focus from serving individual databases to integrating global resources [65].
However, the effective integration of data relies not only on application-layer transmission protocols but also on coordinated support from underlying physical storage standards. For the high-throughput, multi-dimensional, and large-scale experimental data generated by synchrotron radiation and high-energy light sources, the NeXus/HDF5 storage standard provides an important architectural foundation. While the OPTIMADE protocol focuses on enabling semantic interoperability among heterogeneous databases, NeXus, in combination with HDF5 technology, achieves deep integration and encapsulation of massive raw datasets together with rich metadata through a hierarchical data model [66]. This highly extensible and self-describing standard represents a solution for the efficient storage and cross-platform access of large-scale diffraction data, and it provides essential infrastructure for the development of future cloud-native visualization platforms and high-performance online analysis systems [67,68].

3.1.3. Future Database Models—Knowledge Graphs

Building on the standardized semantics provided by OPTIMADE, knowledge graphs are driving the evolution of databases from mere data storage toward knowledge engines with reasoning capabilities. Two representative examples are discussed below.
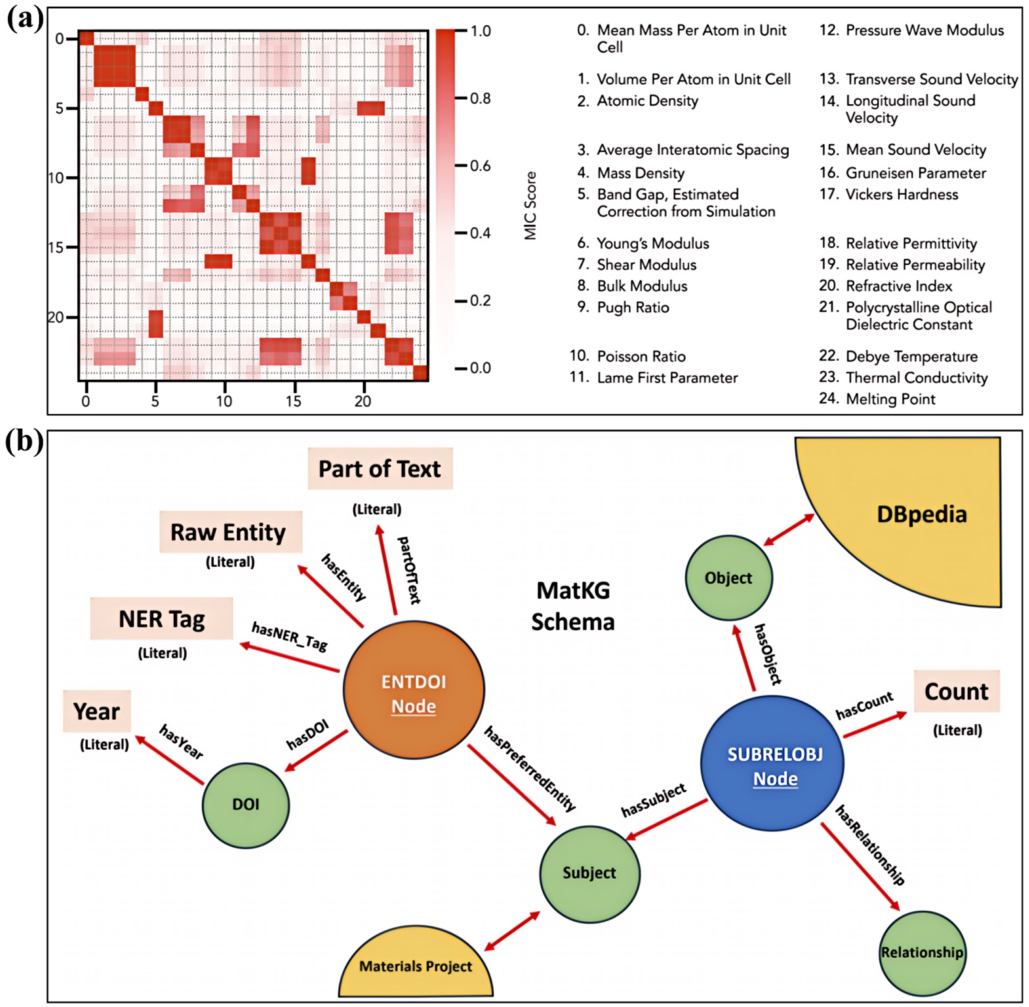
PropNet is a physics-rule-driven, inferable knowledge graph. When a user inputs specific values for several attributes, PropNet automatically derives other attributes according to the activated rules. These derived attributes then become new nodes, and the process repeats. The team led by Kristin A. Persson demonstrated that starting from 20 initial attributes, 629 derived attributes could be automatically inferred, with the entire process being physically interpretable [69]. Figure 12a shows the use of the maximal information coefficient (MIC) to quantify dependencies among attributes. This suggests that future “database” software may integrate reasoning modules similar to PropNet, actively completing missing data, predicting properties of new materials, and even assisting researchers in discovering potential physical laws.
MatKG, developed by Elsa Olivetti’s team, is a literature-driven, large-scale materials science knowledge graph. It uses the deep learning model MatBERT to automatically extract seven entity types, including materials, properties, and characterization applications (from millions of publications). Figure 12b illustrates MatKG’s underlying data model, demonstrating the transformation from textual data to structured knowledge [70]. During this process, large language models (LLMs) demonstrate strong potential: beyond performing semantic disambiguation, they can automatically extract crystallographic descriptions, such as bond lengths, bond angles, and synthesis conditions (from PDF literature) and convert them into machine-readable formats [71]. This LLM-driven extraction approach provides an important source of data and historical knowledge for closed-loop systems [72].

3.2. AI-Driven Structure Determination and Prediction

Traditional structure determination software was primarily developed as a tool to assist researchers. However, the command-line batch-processing capability of the SHELX suite, the parameterized modeling represented by TOPAS, and the fully programmable scripting workflow introduced by GSAS-II have gradually enabled automated and machine-driven workflows. In addition, the emergence of large language models (LLMs) has further lowered the barrier to working within complex scripting environments, making natural language–driven automated refinement and workflow orchestration increasingly feasible [73]. As a result, crystallographic software is gradually evolving toward intelligent platforms capable of providing autonomous decision support.

3.2.1. Foundations for Software Transformation—From General Frameworks to Embedded Specialized Modules

The development of AI models relies heavily on comprehensive open-source libraries such as PyTorch (e.g., version 1.x–2.x series) and TensorFlow. These frameworks provide functionalities including tensor computation, automatic differentiation, and predefined neural network layers [74], allowing researchers to focus on model architecture design rather than low-level programming.
On this basis, specialized neural network architectures tailored to crystallographic data characteristics have begun to emerge. For example, convolutional neural networks (CNNs) have been applied to the analysis of one-dimensional diffraction patterns [75]. In crystallographic research, in crystallographic research, platforms such as DiffPy-CMI allow trained AI models to be embedded as callable modules within existing computational environments. This development suggests that future software design may shift away from the traditional focus on refinement algorithms, such as those emphasized in PDFfit2, toward the efficient integration of experimental data, simulations, and multi-source AI prediction modules [76].

3.2.2. AI-Driven Closed Loop for Phase Identification, Refinement, Prediction, and Validation

As artificial intelligence becomes increasingly involved in crystallographic research, future software systems are likely to integrate tasks such as phase identification, structure refinement, property prediction, and experimental validation within unified workflows. In this review, this process can be conceptually divided into three stages.
Phase identification: In the current era of rapidly expanding data, deep learning has significantly improved the efficiency of diffraction data analysis. For example, Sharma and coworkers developed a one-dimensional fully convolutional neural network architecture combined with data augmentation strategies, including simulated peak intensity variation and preferred orientation effects. Their approach achieved a crystal system classification accuracy of 95.6% and a space group recognition accuracy of 86% [77]. Zhao and coworkers incorporated approximately 5% real experimental data during model training, which increased the analysis accuracy to above 90% (an improvement of about 30%) [78]. In addition, the introduction of explainable AI methods, such as class activation mapping (CAM), has helped mitigate the “black box” problem often associated with deep learning. Related studies have reported Top-5 accuracies of up to 96.7% [79], improving the reliability of automated phase identification.
Structure refinement: Traditional refinement procedures rely heavily on expert experience. With the development of AI, both the level of automation and the efficiency of this stage have improved, marking a transition from workflow automation to generative design strategies. The AutoPD framework developed by Zhang and coworkers encapsulates multiple crystallographic software modules into a unified workflow, enabling the complete process from experimental data input to structural model output. Evaluation on its test dataset reported a structure solution success rate exceeding 92% [80]. This type of integrated meta-workflow concept represents a possible direction for future software development. Moreover, LLMs are gradually emerging as important interfaces within such automated frameworks. Beyond assisting researchers in developing and debugging complex refinement automation scripts, LLMs also demonstrate the capability to perform deep semantic analysis of refinement log files. By identifying the causes of refinement divergence, they can provide targeted parameter-adjustment strategies, thereby supporting these frameworks in handling more complex refinement tasks [72]. In addition, to address the challenge of unknown structure determination, Li and coworkers developed the generative model PXRDGen, which produces new and chemically reasonable structural models based on textual descriptions of target properties [81]. This approach fundamentally changes the starting point of the refinement stage by enabling inverse design strategies for structure determination.
Structure prediction and validation: This represents a highly transformative stage, with its central concept being the construction of a closed-loop system linking hypothesis generation and validation. The GNoME system developed by Google DeepMind implements an active learning strategy that integrates graph neural network (GNN) screening, density functional theory (DFT) calculations, and iterative retraining based on high-quality computational results. Within this framework, DFT calculations are used to evaluate the energy stability of candidate structures on the convex hull, thereby helping to filter out spurious structures that may appear statistically plausible but are physically unstable. Through this approach, approximately 2.2 million thermodynamically stable crystal structures were identified, among which 381,000 were confirmed as previously unknown materials [82]. Beyond evaluating energy stability on the convex hull through DFT calculations, future software systems are expected to incorporate multi-level validation chains. At the dynamical level, phonon spectrum calculations can be employed to eliminate imaginary frequencies and ensure structural stability [83]. At the efficiency level, universal machine learning potentials such as CHGNet can be introduced for rapid stress screening [84]. At the chemical level, traditional crystallochemical rules, such as the bond valence sum (BVS) method, can be applied for further validation [85]. The integration of such multi-tiered “physicochemical filters” is expected to improve the success rate of AI-driven materials discovery. These virtual computational validations strategies can further extend to physical laboratories workflows. Platforms such as A-lab and Rainbow use prediction and validation results to schedule experimental resources, where automated robotic systems perform tasks including sample preparation and characterization. The resulting experimental data can then be fed back into subsequent rounds of prediction or experimental design [86,87]. However, an important limitation should be noted in the development of closed-loop and on-demand analysis systems. As experimental data acquisition reaches ultrafast timescales (Von Dreele et al. obtained a powder diffraction pattern sufficient for structure refinement using a single 100 picosecond synchrotron radiation pulse) [88], it becomes possible to track structural evolution in real time. The integration of DFT, machine learning, and multi-level validation has made processing far more computationally demanding. This creates a widening latency gap that remains a primary barrier for on-demand analysis. Even so, the AI-driven closed-loop research paradigm is gradually shaping future software architectures. On the one hand, crystallographic software development is shifting from algorithm-centered implementation toward the integration of AI modules, enabling highly automated and intelligent research workflows. On the other hand, software is evolving toward a system-level platform in which standardized APIs coordinate computational resources, AI models, and laboratory equipment, thereby supporting an intelligent research environment.

3.3. Future Perspectives on Immersive Visualization

In contemporary data-driven crystallographic research, the spatial complexity and dynamic evolution of large-scale datasets increasingly challenge the cognitive capacity of traditional two-dimensional displays. As a result, the focus of software development may gradually shift from pursuing higher rendering quality toward building immersive research environments that support dynamic interaction and multi-user collaboration.

3.3.1. A Comprehensive Visualization Foundation—ChimeraX

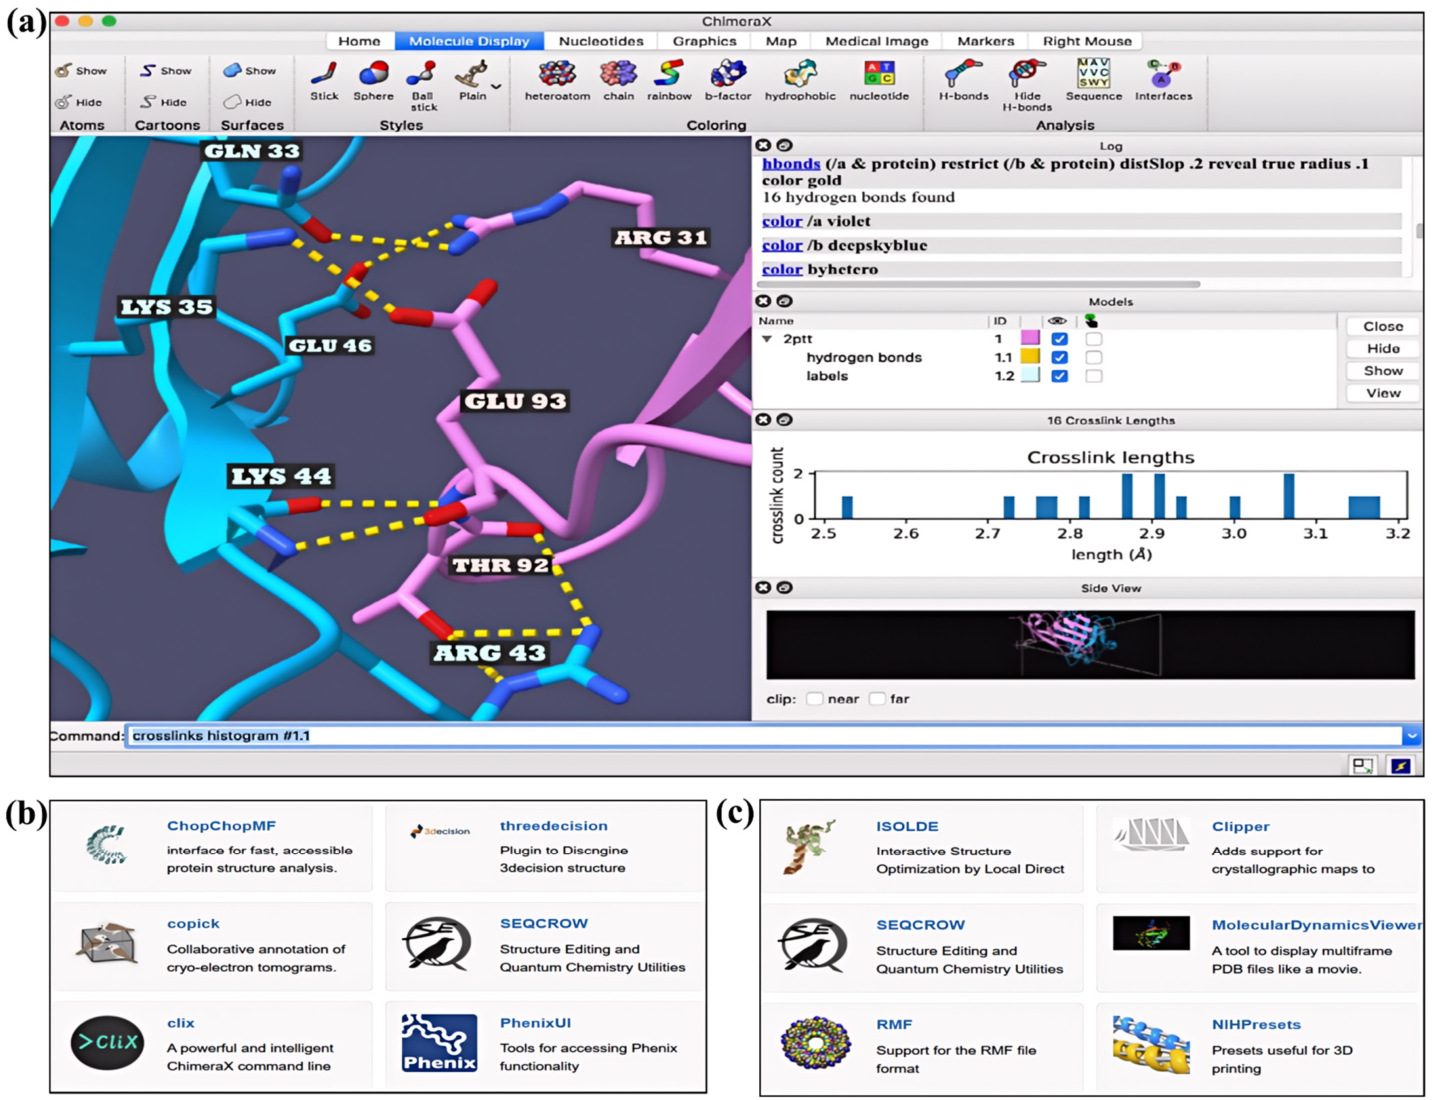
ChimeraX is a modern visualization platform originally designed to address the large-scale data challenges brought by modern structural biology [89]. It functions as a highly integrated platform that incorporates multiple modules, including visualization, interactive analysis, and quantitative analysis of structures and interactions, as illustrated in Figure 13a. In addition, the tabs shown at the top of Figure 13a together with the command log on the right indicate that ChimeraX supports extensibility through plugins, as illustrated in Figure 13b [90]. This architectural design not only improves the professional capabilities of the software but also accelerates the pace of software development and iteration. Moreover, ChimeraX has introduced virtual reality (VR) functionality to enhance immersive visualization. However, its interaction design is primarily oriented toward visual exploration. For deeper operations involving complex modeling or real-time structural modification, more specialized software tools are still required [90].

3.3.2. IMD-VR and Narupa: Dynamic Evolution of Crystal Structures Through Immersive Manipulation

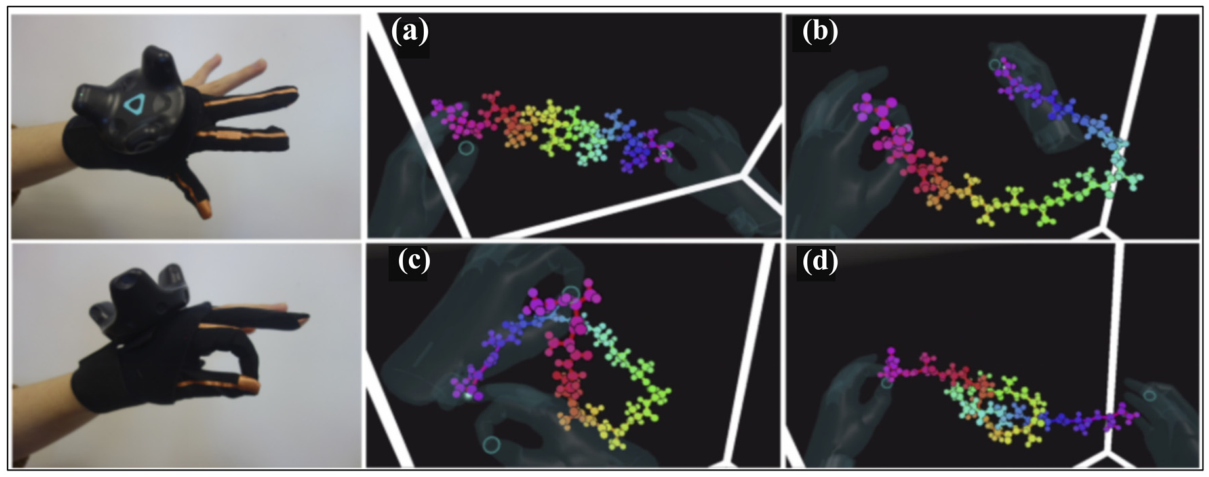
Molecular dynamics (MD) simulation is a key approach for understanding how microscopic structures determine the macroscopic properties of materials. In traditional MD simulations, limited computational resources and short simulation times often make it difficult to sample rare events that involve high energy barriers under normal conditions. The introduction of interactive molecular dynamics in virtual reality (IMD-VR) has helped address this limitation by allowing direct human intervention during the simulation process [91]. As illustrated in Figure 14a–d, researchers can apply forces directly to an alanine peptide chain using data gloves.
The core design follows the principle of “separation of concerns.” The server is responsible for running the MD simulations, while the client handles three-dimensional rendering and user interaction. The two components communicate through an efficient protocol, enabling users to smoothly intervene in the dynamic process using VR controllers. In addition, this architecture incorporates force-haptic feedback, allowing users to directly perceive the magnitude of interatomic forces. By adjusting parameters such as damping and stiffness [91], the system extends interaction from purely visual observation toward direct structural manipulation.
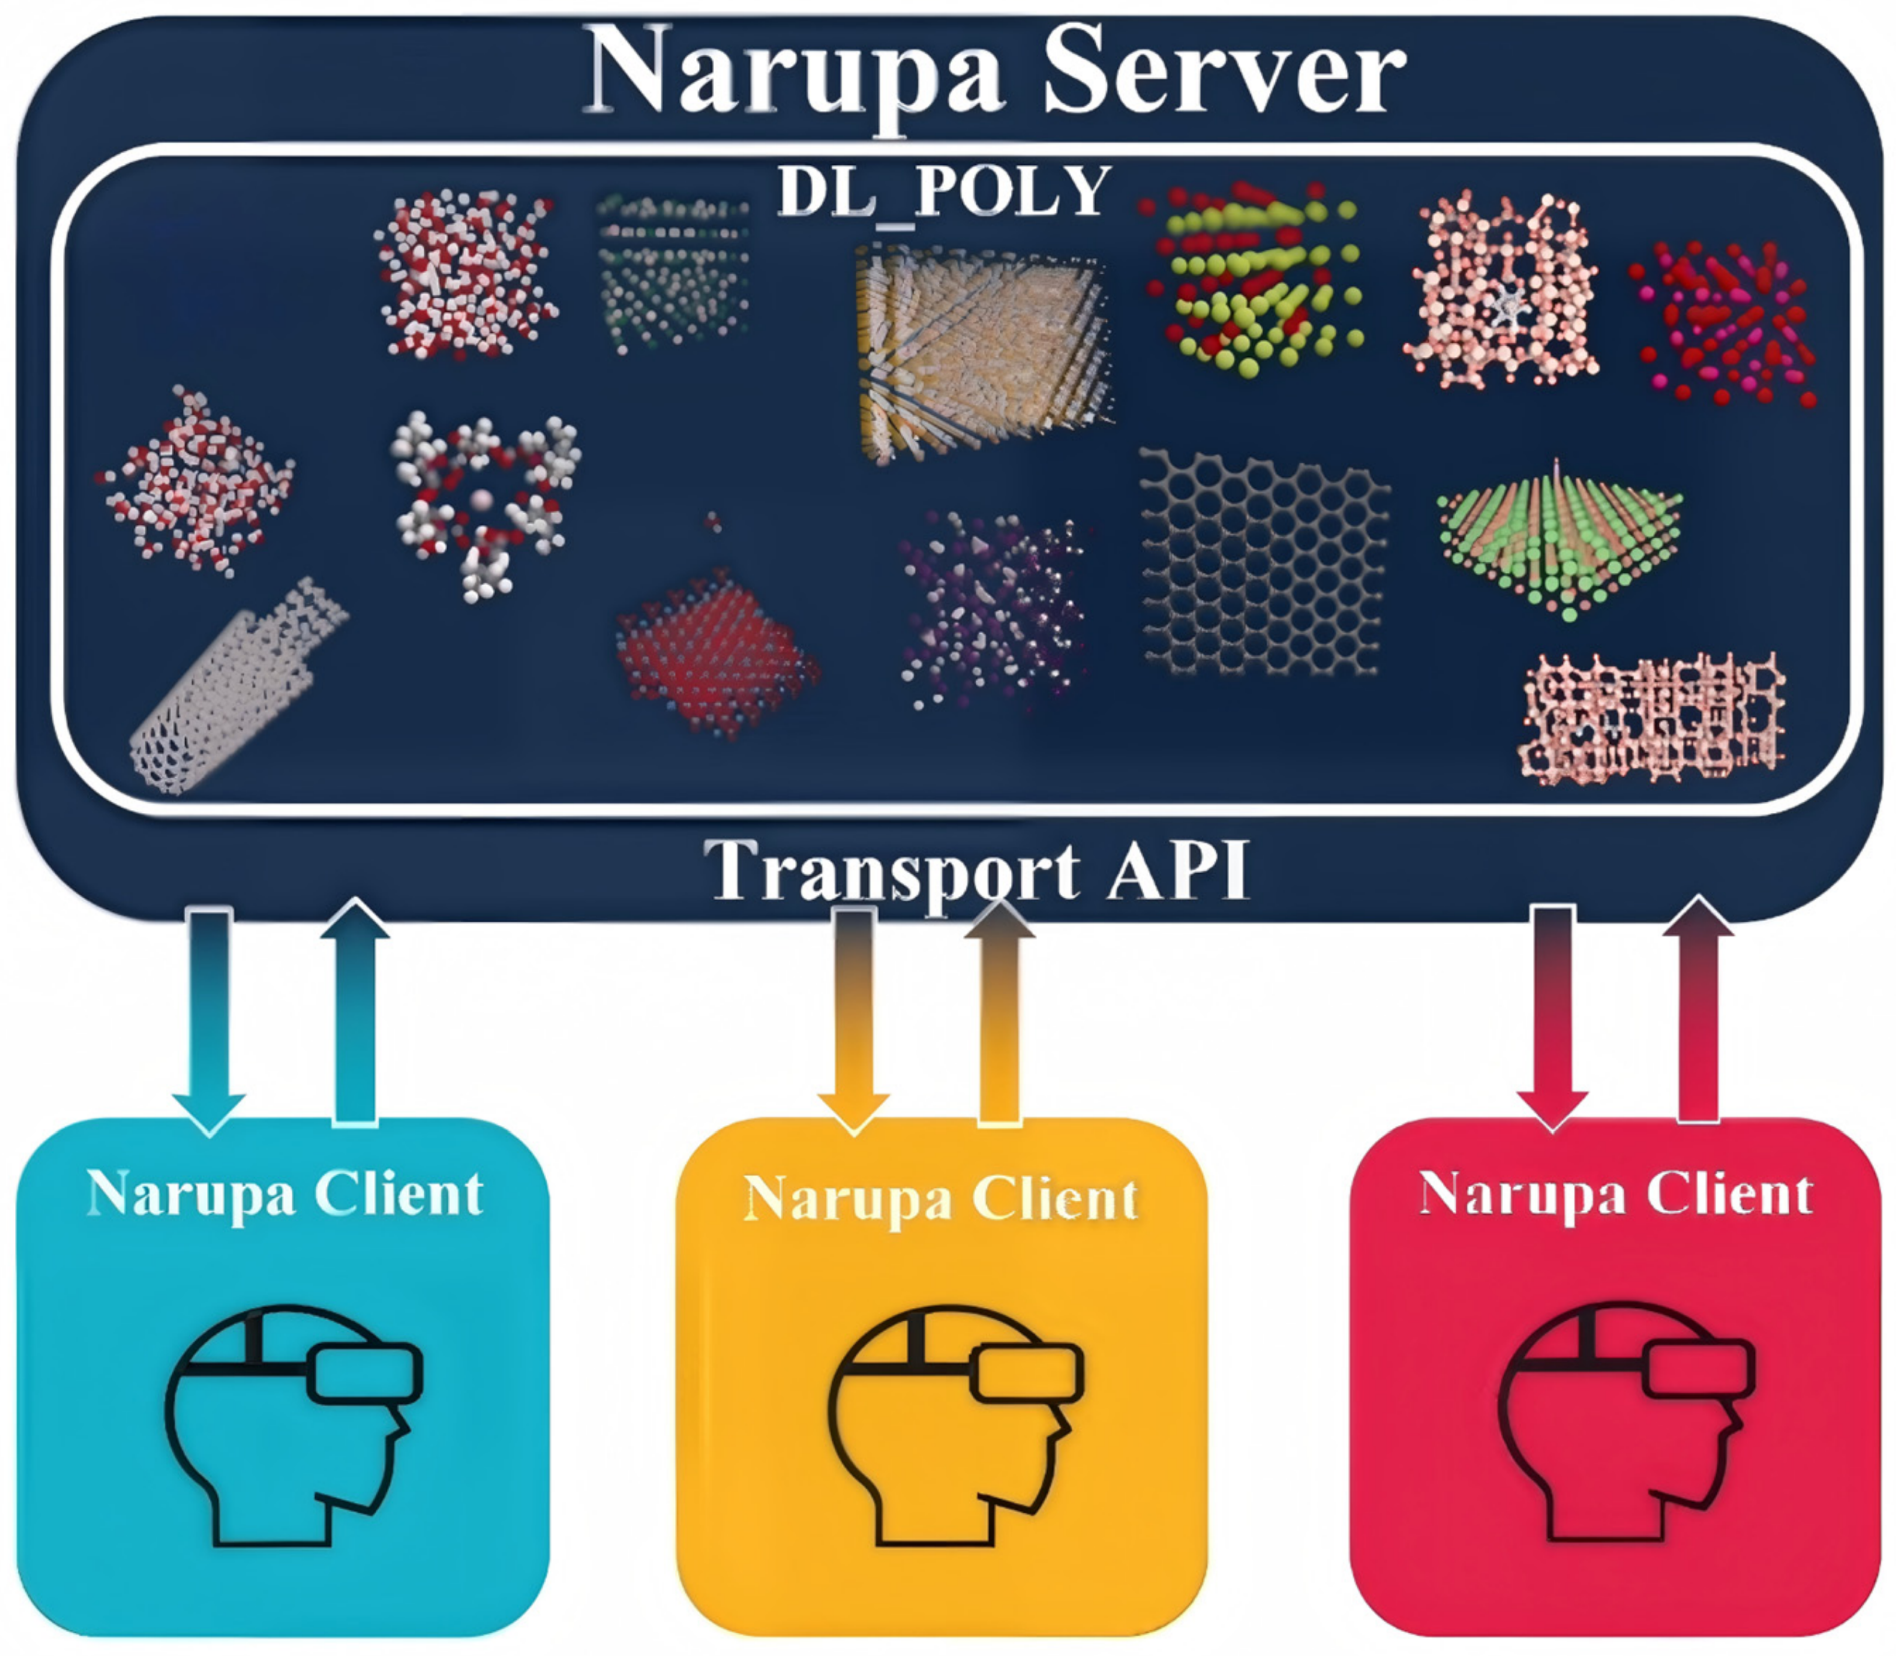
Narupa is an open-source software framework for implementing IMD-VR technology. It follows design principles that emphasize ease of use and high extensibility, significantly lowering the barriers to both application and development of this approach. Furthermore, its flexible APIs enable compatibility with simulation packages such as OpenMM, DL_POLY, and SCINE, allowing users to switch between different levels of computational accuracy [92].
In addition, as shown in Figure 15, Narupa allows multiple users to enter the same virtual environment simultaneously and collaborate in real time [93]. This mode of interaction places higher demands on the network architecture of the software. Developers must optimize conflict-handling mechanisms and state synchronization algorithms in order to maintain consistent interactions across different environments.

3.3.3. Architecture of Future Cloud-Based Platforms

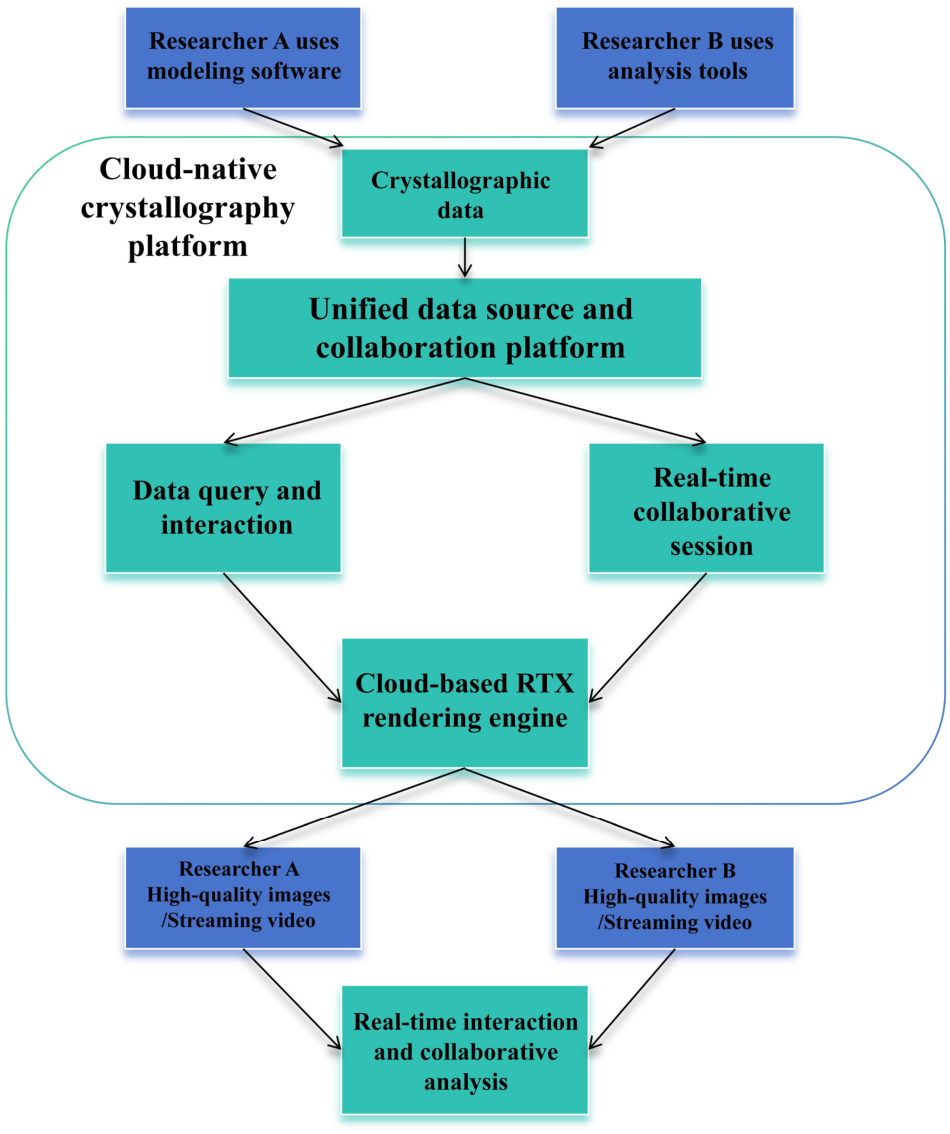
Although ChimeraX and IMD-VR have achieved notable advances in immersive visualization, their application is still constrained by local deployment and local network environments. Therefore, the next stage of visualization software development is likely to focus on building cloud-native platforms that combine high performance, low access barriers, and efficient collaboration. As illustrated in Figure 16, technologies such as NVIDIA Omniverse make it possible to migrate key components of the workflow—from data input to decision-making—onto a cloud-based infrastructure.
Data standardization and unified storage: The open USD format can be adopted as the storage standard, allowing heterogeneous experimental data to be integrated into Nucleus Cloud so that all participants operate on a unified dataset.
Real-time cross-terminal interaction: Collaborative research can be conducted through the browser-based Omniverse Channel, enabling participants to annotate and manipulate structures simultaneously in real time.
Computational acceleration and in-depth analysis: Data extraction and structural analysis can be carried out through the querying and interaction capabilities provided by the USD Query API. At the same time, cloud-based multi-GPU parallel acceleration enables real-time ray-tracing rendering.
Low-latency streaming presentation: The processed results are streamed back to the front end in the form of video streams or high-resolution images, providing users with a highly immersive and high-fidelity visual experience [94].
Cloud-native platforms built on infrastructures similar to Omniverse, which integrate heterogeneous 3D tools while supporting real-time collaboration and high-fidelity simulation, are expected to play an increasingly important role in future crystallographic research and may represent a promising direction for the development of visualization software.

4. Discussion and Summary

This review provides a systematic overview of the development and technological evolution of crystallographic software from three perspectives: crystallographic databases, structure determination programs, and visualization platforms. Early crystallographic software primarily focused on computational tasks such as structure solution and refinement. With the continuous expansion of database resources and advances in computational capabilities, modern crystallographic software has gradually moved towards deep integration of data management, structure determination, and visualization analysis. At the same time, enhanced data sharing and extensibility among different software systems have enabled crystallographic research to form a coherent, complete research framework, in which databases serve as the foundational infrastructure, algorithmic tools provide the core analytical capabilities, and visualization platforms act as a key interface for data interpretation and interaction. With the development of machine-readable data infrastructures, deep learning techniques, and automated experimental platforms, crystallographic software is expected to further evolve toward more intelligent and automated research paradigms, potentially promoting a human–machine collaborative framework for crystallographic research.

Author Contributions

R.Y.: Writing—original draft, Writing—review and editing, Methodology, Investigation, Formal analysis, and Data curation. R.J.: Writing—review and editing and Validation. Z.F.: Formal analysis, Supervision, and Conceptualization. All authors have read and agreed to the published version of the manuscript.

Funding

This research was funded by Suzhou Laboratory grant number SZLAB-1508-2024-TS018.

Data Availability Statement

The datasets generated and analyzed during the current study are available from the corresponding author upon reasonable request.

Acknowledgments

In the preparation of this manuscript, generative artificial intelligence tools, including ChatGPT (OpenAI, GPT-5.3) and Gemini (Gemini 3 Flash), were used mainly for language translation, expression polishing, in order to improve the overall readability and linguistic fluency of the article.

Conflicts of Interest

The authors declare no conflicts of interest. The authors declare that they have no known competing financial interests or personal relationships that could have appeared to influence the work reported in this paper.

References

  1. Liu, Y.L.; Ma, L.L.; Li, M.; Tian, Z.Z.; Yang, M.T.; Wu, X.; Wang, X.; Shang, G.H.; Xie, M.J.; Chen, Y.Y.; et al. Structures of human TR4LBD-JAZF1 and TR4DBD-DNA complexes reveal the molecular basis of transcriptional regulation. Nucleic Acids Res. 2023, 51, 1443–1457. [Google Scholar] [CrossRef]
  2. Yan, Z.T.; Fan, J.B.; Pan, S.L.; Zhang, M. Recent advances in rational structure design for nonlinear optical crystals: Leveraging advantageous templates. Chem. Soc. Rev. 2024, 53, 6568–6599. [Google Scholar] [CrossRef]
  3. Li, T.T.; Guo, W.; Ma, L.; Li, W.S.; Yu, Z.H.; Han, Z.; Gao, S.; Liu, L.; Fan, D.X.; Wang, Z.X.; et al. Epitaxial growth of wafer-scale molybdenum disulfide semiconductor single crystals on sapphire. Nat. Nanotechnol. 2021, 16, 1201–1207. [Google Scholar] [CrossRef]
  4. Berman, H.M.; Westbrook, J.; Feng, Z.; Gilliland, G.; Bhat, T.N.; Weissig, H.; Shindyalov, I.N.; Bourne, P.E. The Protein Data Bank. Nucleic Acids Res. 2000, 28, 235–242. [Google Scholar] [CrossRef] [PubMed]
  5. White, P.S.; Rodgers, J.R.; Le Page, Y. CRYSTMET: A database of the structures and powder patterns of metals and intermetallics. Acta Crystallogr. A-Found. Adv. 1999, 55, 574. [Google Scholar] [CrossRef] [PubMed]
  6. Fan, H.F. Direct methods beyond small-molecule crystallography. Phys. Status Solidi A-Appl. Mater. Sci. 2010, 207, 2621–2638. [Google Scholar] [CrossRef]
  7. Busing, W.R.; Martin, K.T.; Levy, H.A. OR FLS, a Fortran Crystallographic Least-Squares Program; Oak Ridge National Lab., Tenn.: Oak Ridge, TN, USA, 1962. [Google Scholar]
  8. Busing, W.R.; Martin, K.; Levy, H. OR FFE—A Fortran Crystallographic Function and Error Program; Oak Ridge National Lab., Tenn.: Oak Ridge, TN, USA, 1964. [Google Scholar]
  9. Johnson, C.K. OR TEP: A fortran thermal-ellipsoid plot program for crystal structure illustrations. Comput. Codes 1965, 5138. [Google Scholar]
  10. Groom, C.R.; Bruno, I.J.; Lightfoot, M.P.; Ward, S.C. The Cambridge Structural Database. Acta Crystallogr. Sect. B-Struct. Sci. Cryst. Eng. Mater. 2016, 72, 171–179. [Google Scholar] [CrossRef]
  11. Hellenbrandt, M. The Inorganic Crystal Structure Database (ICSD)—Present and Future. Crystallogr. Rev. 2004, 10, 17–22. [Google Scholar] [CrossRef]
  12. Grazulis, S.; Daskevic, A.; Merkys, A.; Chateigner, D.; Lutterotti, L.; Quiros, M.; Serebryanaya, N.R.; Moeck, P.; Downs, R.T.; Le Bail, A. Crystallography Open Database (COD): An open-access collection of crystal structures and platform for world-wide collaboration. Nucleic Acids Res. 2012, 40, 420–427. [Google Scholar] [CrossRef]
  13. Curtarolo, S.; Setyawan, W.; Hart, G.L.W.; Jahnatek, M.; Chepulskii, R.V.; Taylor, R.H.; Wanga, S.D.; Xue, J.K.; Yang, K.S.; Levy, O.; et al. AFLOW: An automatic framework for high-throughput materials discovery. Comput. Mater. Sci. 2012, 58, 218–226. [Google Scholar] [CrossRef]
  14. Patterson, A.L. A Fourier Series Method for the Determination of the Components of Interatomic Distances in Crystals. Phys. Rev. 1934, 46, 372–376. [Google Scholar] [CrossRef]
  15. Hauptman, H. The Direct Methods of X-ray Crystallography. Science 1986, 233, 178–183. [Google Scholar] [CrossRef]
  16. Oszlányi, G.; Sütő, A. Ab initio structure solution by charge flipping. Found. Crystallogr. 2004, 60, 134–141. [Google Scholar] [CrossRef]
  17. Sheldrick, G.M. A short history of SHELX. Acta Crystallogr. A-Found. Adv. 2008, 64, 112–122. [Google Scholar] [CrossRef]
  18. Hall, S.; McMahon, B. Volume G: Definition and exchange of crystallographic data. Acta Crystallogr. Sect. A 2005, 61, c132. [Google Scholar] [CrossRef]
  19. Sheldrick, G.M. Crystal structure refinement with SHELXL. Acta Crystallogr. Sect. C-Struct. Chem. 2015, 71, 3–8. [Google Scholar] [CrossRef]
  20. Dolomanov, O.V.; Bourhis, L.J.; Gildea, R.J.; Howard, J.A.K.; Puschmann, H. OLEX2: A complete structure solution, refinement and analysis program. J. Appl. Crystallogr. 2009, 42, 339–341. [Google Scholar] [CrossRef]
  21. Sheldrick, G. SHELXT—Integrated space-group and crystal-structure determination. Acta Crystallogr. Sect. A 2015, 71, 3–8. [Google Scholar] [CrossRef]
  22. Hubschle, C.B.; Sheldrick, G.M.; Dittrich, B. ShelXle: A Qt graphical user interface for SHELXL. J. Appl. Crystallogr. 2011, 44, 1281–1284. [Google Scholar] [CrossRef] [PubMed]
  23. Henriques, M.S.; Petrícek, V.; Goswami, S.; Dusek, M. Analysis of magnetic structures in JANA2020. Acta Crystallogr. Sect. B-Struct. Sci. Cryst. Eng. Mater. 2024, 80, 409–423. [Google Scholar] [CrossRef]
  24. Spek, A.L. Structure validation in chemical crystallography. Acta Crystallogr. Sect. D-Struct. Biol. 2009, 65, 148–155. [Google Scholar] [CrossRef] [PubMed]
  25. Spek, A. Single-crystal structure validation with the program PLATON. Appl. Crystallogr. 2003, 36, 7–13. [Google Scholar] [CrossRef]
  26. Rietveld, H.M. A profile refinement method for nuclear and magnetic structures. Appl. Crystallogr. 1969, 2, 65–71. [Google Scholar] [CrossRef]
  27. Kraus, W.; Nolze, G. POWDER CELL–a program for the representation and manipulation of crystal structures and calculation of the resulting X-ray powder patterns. Appl. Crystallogr. 1996, 29, 301–303. [Google Scholar] [CrossRef]
  28. Von Dreele, R.; Larson, A. General structure analysis system (GSAS). Los Alamos Natl. Lab. Rep. 2004, 748, 86–748. [Google Scholar]
  29. Degen, T.; Sadki, M.; Bron, E.; König, U.; Nénert, G. The HighScore suite. Powder Diffr. 2014, 29, 13–18. [Google Scholar] [CrossRef]
  30. Coelho, A.A. TOPAS and TOPAS-Academic: An optimization program integrating computer algebra and crystallographic objects written in C plus. J. Appl. Crystallogr. 2018, 51, 210–218. [Google Scholar] [CrossRef]
  31. Farrow, C.L.; Juhas, P.; Liu, J.W.; Bryndin, D.; Bozin, E.S.; Bloch, J.; Proffen, T.; Billinge, S.J.L. PDFfit2 and PDFgui: Computer programs for studying nanostructure in crystals. J. Phys. Condens. Matter 2007, 19, 335219. [Google Scholar] [CrossRef] [PubMed]
  32. Toby, B.H.; Von Dreele, R.B. GSAS-II: The genesis of a modern open-source all purpose crystallography software package. J. Appl. Crystallogr. 2013, 46, 544–549. [Google Scholar] [CrossRef]
  33. Rodríguez-Carvajal, J. Recent advances in magnetic structure determination by neutron powder diffraction. Phys. B Condens. Matter 1993, 192, 55–69. [Google Scholar] [CrossRef]
  34. Rodriguez-Carvajal, J.; Gonzalez-Platas, J.; Katcho, N.A. Magnetic structure determination and refinement using FullProf. Acta Crystallogr. Sect. B 2025, 81, 302–317. [Google Scholar] [CrossRef]
  35. Arcelus, O.; Rodríguez-Carvajal, J.; Katcho, N.A.; Reynaud, M.; Black, A.P.; Chatzogiannakis, D.; Frontera, C.; Serra-no-Sevillano, J.; Ismail, M.; Carrasco, J. FullProfAPP: A graphical user interface for the streamlined automation of powder diffraction data analysis. Appl. Crystallogr. 2024, 57, 1676–1690. [Google Scholar] [CrossRef]
  36. Adams, P.D.; Afonine, P.V.; Bunkóczi, G.; Chen, V.B.; Davis, I.W.; Echols, N.; Headd, J.J.; Hung, L.W.; Kapral, G.J.; Grosse-Kunstleve, R.W.; et al. PHENIX: A comprehensive Python-based system for macromolecular structure solution. Acta Crystallogr. Sect. D-Struct. Biol. 2010, 66, 213–221. [Google Scholar] [CrossRef] [PubMed]
  37. Winn, M.D.; Ballard, C.C.; Cowtan, K.D.; Dodson, E.J.; Emsley, P.; Evans, P.R.; Keegan, R.M.; Krissinel, E.B.; Leslie, A.G.W.; McCoy, A.; et al. Overview of the CCP4 suite and current developments. Acta Crystallogr. Sect. D-Struct. Biol. 2011, 67, 235–242. [Google Scholar] [CrossRef] [PubMed]
  38. Betteridge, P.W.; Carruthers, J.R.; Cooper, R.I.; Prout, K.; Watkin, D.J. CRYSTALS version 12: Software for guided crystal structure analysis. J. Appl. Crystallogr. 2003, 36, 1487. [Google Scholar] [CrossRef]
  39. Burla, M.C.; Caliandro, R.; Carrozzini, B.; Cascarano, G.L.; Cuocci, C.; Giacovazzo, C.; Mallamo, M.; Mazzone, A.; Polidori, G. Crystal structure determination and refinement via SIR2014. J. Appl. Crystallogr. 2015, 48, 306–309. [Google Scholar] [CrossRef]
  40. Altomare, A.; Cuocci, C.; Giacovazzo, C.; Moliterni, A.; Rizzi, R.; Corriero, N.; Falcicchio, A. EXPO2013: A kit of tools for phasing crystal structures from powder data. J. Appl. Crystallogr. 2013, 46, 1231–1235. [Google Scholar] [CrossRef]
  41. Favre-Nicolin, V.; Cerny, R. FOX, ‘free objects for crystallography’: A modular approach to ab initio structure determination from powder diffraction. J. Appl. Crystallogr. 2002, 35, 734–743. [Google Scholar] [CrossRef]
  42. Wojdyr, M. Fityk: A general-purpose peak fitting program. J. Appl. Crystallogr. 2010, 43, 1126–1128. [Google Scholar] [CrossRef]
  43. Basham, M.; Filik, J.; Wharmby, M.T.; Chang, P.C.Y.; El Kassaby, B.; Gerring, M.; Aishima, J.; Levik, K.; Pulford, B.C.A.; Sikharulidze, I.; et al. Data Analysis WorkbeNch (DAWN). J. Synchrotron Radiat. 2015, 22, 853–858. [Google Scholar] [CrossRef]
  44. Momma, K.; Izumi, F. VESTA 3 for three-dimensional visualization of crystal, volumetric and morphology data. J. Appl. Crystallogr. 2011, 44, 1272–1276. [Google Scholar] [CrossRef]
  45. Macrae, C.F.; Bruno, I.J.; Chisholm, J.A.; Edgington, P.R.; McCabe, P.; Pidcock, E.; Rodriguez-Monge, L.; Taylor, R.; van de Streek, J.; Wood, P.A. Mercury CSD 2.0–new features for the visualization and investigation of crystal structures. J. Appl. Crystallogr. 2008, 41, 466–470. [Google Scholar] [CrossRef]
  46. Hanson, R.M.; Prilusky, J.; Renjian, Z.; Nakane, T.; Sussman, J.L. JSmol and the next-generation web-based representation of 3D molecular structure as applied to Proteopedia. Isr. J. Chem. 2013, 53, 207–216. [Google Scholar] [CrossRef]
  47. Rose, A.S.; Hildebrand, P.W. NGL Viewer: A web application for molecular visualization. Nucleic Acids Res. 2015, 43, 576–579. [Google Scholar] [CrossRef]
  48. Sehnal, D.; Bittrich, S.; Deshpande, M.; Svobodová, R.; Berka, K.; Bazgier, V.; Velankar, S.; Burley, S.K.; Koca, J.; Rose, A.S. Mol* Viewer: Modern web app for 3D visualization and analysis of large biomolecular structures. Nucleic Acids Res. 2021, 49, 431–437. [Google Scholar] [CrossRef] [PubMed]
  49. Nguyen, H.; Case, D.A.; Rose, A.S. NGLview–interactive molecular graphics for Jupyter notebooks. Bioinformatics 2017, 34, 1241–1242. [Google Scholar] [CrossRef]
  50. Gao, M.; Palmer, D.C.; Dove, M.T. A new approach to molecular and lattice simulations with CrystalMaker® 11. MRS Commun. 2025, 15, 1007–1016. [Google Scholar] [CrossRef]
  51. Emsley, P.; Cowtan, K. Coot: Model-building tools for molecular graphics. Acta Crystallogr. Sect. D 2004, 60, 2126–2132. [Google Scholar] [CrossRef]
  52. Humphrey, W.; Dalke, A.; Schulten, K. VMD: Visual molecular dynamics. J. Mol. Graph. Model. 1996, 14, 33–38. [Google Scholar] [CrossRef]
  53. Hanwell, M.D.; Curtis, D.E.; Lonie, D.C.; Vandermeersch, T.; Zurek, E.; Hutchison, G.R. Avogadro: An advanced semantic chemical editor, visualization, and analysis platform. J. Cheminformatics 2012, 4, 17. [Google Scholar] [CrossRef]
  54. Sun, X.W.; Feng, Z.J.; Lv, B.F.; Cao, J.; Chang, S.H.; Dong, C. iRing: A program for two-dimensional powder diffraction image integration with automatic calibration. J. Appl. Crystallogr. 2024, 57, 567–571. [Google Scholar] [CrossRef]
  55. Lv, B.; Feng, Z.; Sun, X.; Cao, J.; Gao, Y.; Chang, S.; Dong, C.; Zhang, J. IQual: A new computer program for qualitative phase analysis with efficient search–match capability. Appl. Crystallogr. 2024, 57, 572–579. [Google Scholar] [CrossRef]
  56. Feng, Z.J.; Dong, C. GEST:: A program for structure determination from powder diffraction data using a genetic algorithm. J. Appl. Crystallogr. 2007, 40, 583–588. [Google Scholar] [CrossRef]
  57. Feng, Z.J.; Dong, C.; Jia, R.R.; Di Deng, X.; Cao, S.X.; Zhang, J.C. PeckCryst: A program for structure determination from powder diffraction data using a particle swarm optimization algorithm. J. Appl. Crystallogr. 2009, 42, 1189–1193. [Google Scholar] [CrossRef]
  58. Cui, X.P.; Feng, Z.J.; Jin, Y.; Cao, Y.M.; Deng, D.M.; Chu, H.; Cao, S.X.; Dong, C.; Zhang, J.C. AutoFP: A GUI for highly automated Rietveld refinement using an expert system algorithm based on FullProf. J. Appl. Crystallogr. 2015, 48, 1581–1586. [Google Scholar] [CrossRef]
  59. Feng, Z.J.; Hou, Q.; Zheng, Y.L.; Ren, W.; Ge, J.Y.; Li, T.; Cheng, C.; Lu, W.C.; Cao, S.X.; Zhang, J.C.; et al. Method of artificial intelligence algorithm to improve the automation level of Rietveld refinement. Comput. Mater. Sci. 2019, 156, 310–314. [Google Scholar] [CrossRef]
  60. Cao, J.; Feng, Z.J.; Lv, B.F.; Sun, X.W.; Chang, S.H.; Zhang, J.C.; Zhang, T.Y. iModel: An interactive 3D crystal structure visualization program. J. Appl. Crystallogr. 2024, 57, 859–864. [Google Scholar] [CrossRef]
  61. Chang, S.H.; Lv, B.F.; Yang, W.T.; Dong, C.; Katcho, N.A.; Cao, S.X.; Zhang, J.C.; Rodriguez-Carvajal, J.; Feng, Z.J. iPowder: Advanced software for automated high-throughput X-ray diffraction analysis. J. Appl. Crystallogr. 2025, 58, 296–301. [Google Scholar] [CrossRef]
  62. Pizzi, G.; Cepellotti, A.; Sabatini, R.; Marzari, N.; Kozinsky, B. AiiDA: Automated interactive infrastructure and database for computational science. Comput. Mater. Sci. 2016, 111, 218–230. [Google Scholar] [CrossRef]
  63. Huber, S.P.; Zoupanos, S.; Uhrin, M.; Talirz, L.; Kahle, L.; Häuselmann, R.; Gresch, D.; Müller, T.; Yakutovich, A.V.; Andersen, C.W.; et al. AiiDA 1.0, a scalable computational infrastructure for automated reproducible workflows and data provenance. Sci. Data 2020, 7, 300. [Google Scholar] [CrossRef]
  64. Uhrin, M.; Huber, S.P.; Yu, J.S.; Marzari, N.; Pizzi, G. Workflows in AiiDA: Engineering a high-throughput, event-based engine for robust and modular computational workflows. Comput. Mater. Sci. 2021, 187, 110086. [Google Scholar] [CrossRef]
  65. Andersen, C.W.; Armiento, R.; Blokhin, E.; Conduit, G.J.; Dwaraknath, S.; Evans, M.L.; Fekete, A.; Gopakumar, A.; Grazulis, S.; Merkys, A.; et al. OPTIMADE, an API for exchanging materials data. Sci. Data 2021, 8, 217. [Google Scholar] [CrossRef]
  66. Folk, M.; Heber, G.; Koziol, Q.; Pourmal, E.; Robinson, D. An overview of the HDF5 technology suite and its applications. In Proceedings of the EDBT/ICDT 2011 Workshop on Array Databases; Association for Computing Machinery: Uppsala, Sweden, 2001; pp. 36–47. [Google Scholar]
  67. Könnecke, M.; Akeroyd, F.A.; Bernstein, H.J.; Brewster, A.S.; Campbell, S.I.; Clausen, B.; Cottrell, S.; Hoffmann, J.U.; Jemian, P.R.; Männicke, D.; et al. The NeXus data format. J. Appl. Crystallogr. 2015, 48, 301–305. [Google Scholar] [CrossRef]
  68. Breitenfeld, M.S.; Tang, H.J.; Zheng, H.H.; Henderson, J.; Byna, S. HDF5 in the exascale era: Delivering efficient and scalable parallel I/O for exascale applications. Int. J. High Perform. Comput. Appl. 2025, 39, 65–78. [Google Scholar] [CrossRef]
  69. Mrdjenovich, D.; Horton, M.K.; Montoya, J.H.; Legaspi, C.M.; Dwaraknath, S.; Tshitoyan, V.; Jain, A.; Persson, K.A. propnet: A Knowledge Graph for Materials Science. Matter 2020, 2, 464–480. [Google Scholar] [CrossRef]
  70. Venugopal, V.; Olivetti, E. MatKG: An autonomously generated knowledge graph in Material Science. Sci. Data 2024, 11, 217. [Google Scholar] [CrossRef]
  71. Dagdelen, J.; Dunn, A.; Lee, S.; Walker, N.; Rosen, A.S.; Ceder, G.; Persson, K.A.; Jain, A. Structured information extraction from scientific text with large language models. Nat. Commun. 2024, 15, 1418. [Google Scholar] [CrossRef]
  72. Lei, G.; Docherty, R.; Cooper, S.J. Materials science in the era of large language models: A perspective. Digit. Discov. 2024, 3, 1257–1272. [Google Scholar] [CrossRef]
  73. Li, Y.J.; Choi, D.; Chung, J.; Kushman, N.; Schrittwieser, J.; Leblond, R.; Eccles, T.; Keeling, J.; Gimeno, F.; Dal Lago, A.; et al. Competition-level code generation with AlphaCode. Science 2022, 378, 1092–1097. [Google Scholar] [CrossRef]
  74. Alawi, Z.B. A Comparative Survey of PyTorch vs TensorFlow for Deep Learning: Usability, Performance, and Deployment Trade-offs. arXiv 2025, arXiv:2508.04035. [Google Scholar] [CrossRef]
  75. Gómez-Peralta, J.I.; Bokhimi, X.; Quintana, P. Convolutional Neural Networks to Assist the Assessment of Lattice Parameters from X-ray Powder Diffraction. J. Phys. Chem. A 2023, 127, 7655–7664. [Google Scholar] [CrossRef]
  76. Juhas, P.; Farrow, C.L.; Yang, X.; Knox, K.R.; Billinge, S.J.L. Complex modeling: A strategy and software program for combining multiple information sources to solve ill posed structure and nanostructure inverse problems. Acta Crystallogr. Sect. A 2015, 71, 562–568. [Google Scholar] [CrossRef]
  77. Chakraborty, A.; Sharma, R. A deep crystal structure identification system for X-ray diffraction patterns. Vis. Comput. 2022, 38, 1275–1282. [Google Scholar] [CrossRef]
  78. Zhao, X.D.; Luo, Y.X.; Liu, J.J.; Liu, W.J.; Rosso, K.M.; Guo, X.F.; Geng, T.; Li, A.; Zhang, X. Machine Learning Automated Analysis of Enormous Synchrotron X-ray Diffraction Datasets. J. Phys. Chem. C 2023, 127, 14830–14838. [Google Scholar] [CrossRef]
  79. Wang, H.C.; Fu, T.F.; Du, Y.Q.; Gao, W.H.; Huang, K.X.; Liu, Z.M.; Chandak, P.; Liu, S.C.; Van Katwyk, P.; Deac, A.; et al. Scientific discovery in the age of artificial intelligence. Nature 2023, 620, 47–60. [Google Scholar] [CrossRef]
  80. Zhang, X.; Sun, H.K.; Hu, Y.; Li, Z.R.; Geng, Z.; Gao, Z.Q.; Hao, Q.; Qi, F.Z.; Ding, W. AutoPD: An integrated meta-pipeline for high-throughput X-ray crystallography data processing and structure determination. J. Appl. Crystallogr. 2025, 58, 746–758. [Google Scholar] [CrossRef]
  81. Li, Q.; Jiao, R.; Wu, L.M.; Zhu, T.N.; Huang, W.B.; Jin, S.F.; Liu, Y.; Weng, H.M.; Chen, X.L. Powder diffraction crystal structure determination using generative models. Nat. Commun. 2025, 16, 7428. [Google Scholar] [CrossRef]
  82. Merchant, A.; Batzner, S.; Schoenholz, S.S.; Aykol, M.; Cheon, G.; Cubuk, E.D. Scaling deep learning for materials discovery. Nature 2023, 624, 80–85. [Google Scholar] [CrossRef]
  83. Togo, A.; Tanaka, I. First principles phonon calculations in materials science. Scr. Mater. 2015, 108, 1–5. [Google Scholar] [CrossRef]
  84. Deng, B.W.; Zhong, P.C.; Jun, K.; Riebesell, J.; Han, K.; Bartel, C.J.; Ceder, G. CHGNet as a pretrained universal neural network potential for charge-informed atomistic modelling. Nat. Mach. Intell. 2023, 5, 1031–1041. [Google Scholar] [CrossRef]
  85. Brown, I.D. Recent Developments in the Methods and Applications of the Bond Valence Model. Chem. Rev. 2009, 109, 6858–6919. [Google Scholar] [CrossRef]
  86. Szymanski, N.J.; Rendy, B.; Fei, Y.X.; Kumar, R.E.; He, T.J.; Milsted, D.; McDermott, M.J.; Gallant, M.; Cubuk, E.D.; Merchant, A.; et al. An autonomous laboratory for the accelerated synthesis of novel materials. Nature 2023, 624, 86–91. [Google Scholar] [CrossRef]
  87. Xu, J.G.; Moran, C.H.J.; Ghorai, A.; Bateni, F.; Bennett, J.A.; Mukhin, N.; Latif, K.; Cahn, A.; Jha, P.; Licona, F.D.; et al. Autonomous multi-robot synthesis and optimization of metal halide perovskite nanocrystals. Nat. Commun. 2025, 16, 7841. [Google Scholar] [CrossRef]
  88. Von Dreele, R.B.; Clarke, S.M.; Walsh, J.P.S. ‘Pink’-beam X-ray powder diffraction profile and its use in Rietveld refinement. J. Appl. Crystallogr. 2021, 54, 3–6. [Google Scholar] [CrossRef]
  89. Goddard, T.D.; Huang, C.C.; Meng, E.C.; Pettersen, E.F.; Couch, G.S.; Morris, J.H.; Ferrin, T.E. UCSF ChimeraX: Meeting modern challenges in visualization and analysis. Protein Sci. 2018, 27, 14–25. [Google Scholar] [CrossRef]
  90. Pettersen, E.F.; Goddard, T.D.; Huang, C.R.C.; Meng, E.E.C.; Couch, G.S.; Croll, T.I.; Morris, J.H.; Ferrin, T.E. UCSF ChimeraX: Structure visualization for researchers, educators, and developers. Protein Sci. 2021, 30, 70–82. [Google Scholar] [CrossRef]
  91. O’Connor, M.B.; Bennie, S.J.; Deeks, H.M.; Jamieson-Binnie, A.; Jones, A.J.; Shannon, R.J.; Walters, R.; Mitchell, T.J.; Mulholland, A.J.; Glowacki, D.R. Interactive molecular dynamics in virtual reality from quantum chemistry to drug binding: An open-source multi-person framework. J. Chem. Phys. 2019, 150, 220901. [Google Scholar] [CrossRef]
  92. Crossley-Lewis, J.; Dunn, J.; Buda, C.; Sunley, G.J.; Elena, A.M.; Todorov, I.T.; Yong, C.W.; Glowacki, D.R.; Mulholland, A.J.; Allan, N.L. Interactive molecular dynamics in virtual reality for modelling materials and catalysts. J. Mol. Graph. Model. 2023, 125, 108606. [Google Scholar] [CrossRef]
  93. Jamieson-Binnie, A.D.; O’Connor, M.B.; Barnoud, J.; Wonnacott,, M.D.; Bennie, S.J.; Glowacki, D.R. Narupa iMD: A VR-Enabled Multiplayer Framework for Streaming Interactive Molecular Simulations. In Proceedings of the ACM SIGGRAPH 2020 Immersive Pavilion, Association for Computing Machinery, Virtual Event, 17 August, 2020; p. 13. [Google Scholar]
  94. Ahmed, N.; Afyouni, I.; Dabool, H.; Al Aghbari, Z. A systemic survey of the Omniverse platform and its applications in data generation, simulation and metaverse. Front. Comput. Sci. 2024, 6, 1423129. [Google Scholar] [CrossRef]
Figure 1. Historical Development of Major Crystallography Software.
Crystals 16 00328 g001
Figure 2. Schematic illustration of the evolutionary paradigm of crystallographic software with increasing computational power, from batch processing to interactive operation and ultimately to integrated and automated workflows.
Crystals 16 00328 g002
Figure 3. Diagram of the Crystallography Software Ecosystem Composed of Core Software with Diverse Functions.
Crystals 16 00328 g003
Figure 5. (a) In JANA, the definition of fundamental magnetic parameters for individual magnetic atoms when handling complex magnetic structures [23]. (b) When handling complex magnetic atoms with spatial modulation, the advanced features and systematic refinement strategies in Jana [23], licensed under CC BY 3.0.
Crystals 16 00328 g005
Figure 6. (a) HighScore retrieves and displays the detailed crystallographic information of a standard phase from the PDF-4+ database (HighScore|XRD Analysis Software|Malvern Panalytical). (b) The working mode of PDFgui featuring multi-task parallel processing and real-time linkage between data and models, sourced from the official PDFgui website (https://www.diffpy.org/products/pdfgui (accessed on 19 December 2025)). (c) A TOPAS script that defines a specific refinement problem by invoking and configuring advanced mathematical models [30]. (d) Schematic diagram of the Topas type system structure [30].
Crystals 16 00328 g006
Figure 7. (a) The Plot, Data, and Data Tree windows in GSAS-II [32]. (b) A script example for batch processing and exporting data using the GSAS-II Python API (https://gsas-ii-scripting.readthedocs.io (accessed on 19 December 2025)).
Crystals 16 00328 g007
Figure 8. (a) The integrated modeling and visualization workspace of VESTA [44]. (b) The structure visualization and search query interface of the Mercury software [45]. (c) The search bar on the right side of figure (b).
Crystals 16 00328 g008
Figure 10. Framework for the Future Materials Research Paradigm Leveraging Existing Technology Stacks.
Crystals 16 00328 g010
Figure 11. The underlying logic and architectural framework of AiiDA. (a) Hierarchy of node types. AiiDA classifies all entities into a tree-like inheritance structure, where ProcessNodes represent computational actions and Data nodes represent physical or mathematical objects. (b) Modular architecture of AiiDA 1.0. The framework acts as a provenance hub, coordinating heterogeneous compute resources and system services through a plugin-centric engine and a standardized Core API [63], licensed under CC BY 4.0.
Crystals 16 00328 g011
Figure 12. (a) An interpretable heatmap based on the strength of inter-property correlations within the PropNet graph [69]. (b) Schema design diagram of the materials knowledge graph “MatKG” [70], licensed under CC BY 4.0.
Crystals 16 00328 g012
Figure 13. UCSF Chimera Software: An Integrated Core Analysis Platform with a Diverse Plugin Ecosystem [90]. (a) The Molecular Visualization and Interactive Analysis Interface of UCSF Chimera. (b,c) Representative Plugins Extending the Functionality of UCSF Chimera, Source from the official UCSF ChimeraX website (https://cxtoolshed.rbvi.ucsf.edu/ (accessed on 20 December 2025).
Crystals 16 00328 g013
Figure 14. Operational modes and trajectory visualization of a data glove in an Interactive Molecular Dynamics–Virtual Reality (IMD-VR) environment [91], licensed under CC BY 4.0. Left: A schematic diagram of the data glove. Right (ad): First-person perspective views from a real-time simulation showing the process of knotting a 17-alanine peptide chain.
Crystals 16 00328 g014
Figure 15. The core architecture of Narupa, a multi-user collaborative and immersive molecular simulation platform [92], licensed under CC BY 4.0.
Crystals 16 00328 g015
Figure 16. Flowchart of the Operational Process for Building a Crystallography Research Platform Based on a Cloud-Native Architecture (Researcher A and Researcher B are merely illustrative examples and should be adapted to the specific context).
Crystals 16 00328 g016
Table 1. Crystallographic Databases for Other Specialized Domains.
DatabasePrimary DomainCore SpecialtyAccess
PDB [4]Structural BiologyExperimental 3D structures of biological
macromolecules.
Open access
AFLOW [13]Computational Materials ScienceHigh-throughput ab initio property prediction;Open access
CRYSTMET [5] Inorganic CrystallographyExperimental structures of metals/alloys;Subscription
Pearson’s Crystal DataMetallurgy and
Phase Analysis
Integrated crystal structures, phase diagrams, and crystal chemistry data.Commercial
Table 2. Multi-Dimensional Comparison of Mainstream Single-Crystal Structure Analysis Software.
AspectSHELX (SHELXL, SHELXTL)Olex2JANA
LicensingAcademic (free); commercial versions existFree for academic; commercial license requiredAcademic (free)
OS SupportWindows/Linux/macOSWindows/Linux/macOSWindows/Linux/macOS
Core MethodDirect/Patterson methods, least-squares refinement.Integrates SHELX engines; primarily a frameworkOriginal super-space group
algorithms
GUIYesYesYes
ScriptingVia instruction files (.ins, .lst)Extensive Python 3.10.12 (embedded)/JavaScript scripting.Supports macros and scripts
Key FeaturesGold standard for refinement with powerful constraints/restraints.Integrated one-click solution (olex2.solve) and automated reportingSpecialized in modulated, magnetic, and highly disordered structures
Table 3. Complementary software tools for crystallographic structure validation.
CategorySoftware/Tool
CIF validationcheckCIF/IUCRVal (local implementation)
Geometric statistical validationMogul (CSD-based)
Crystal-chemical validationBond Valence Sum (BVS) calculation
Database validationCCDC Pre-deposition Validation (by the Cambridge Crystallographic Data Center)
Structure visual inspectionOlex2 built-in validation tools
Table 4. Multi-Dimensional Comparison of Mainstream Powder Diffraction Analysis Software.
AspectHighScore Suite (Panalytical)TOPAS (Bruker)GSAS-IIPDFguiFULLPROF
LicensingCommercialCommercial
Academic(cheap)
Open sourceOpen sourceAcademic(free)
OS SupportWindowsWindows, LinuxWindows/Linux
/macOS
Windows/Linux
/macOS
Windows/Linux
/macOS
Core MethodRietveld refinement; Pattern decompositionRietveld refinement
Pawley/Le Bail
Rietveld refinement
Pawley/Le Bail
Pair distribution function (PDF) modelingRietveld refinement Pawley/Le Bail
GUIYesYes (poor in Academic version)YesYesYes
ScriptingBasicExcellent (macros, custom models)Excellent (Python PI)Moderate (Python)Moderate (batch)
Key FeaturesPhase identification, Quantitative analysisAdvanced structure
modeling
Integrated analysis
workflow
Local structure analysisMagnetic structure refinement
Structure SolutionSearch-MatchDirect Methods; Simulated AnnealingCharge FlippingN/ASimulated Annealing
Table 5. Classification and Index of Other Important Crystallographic Software.
SoftwarePrimary FieldCore Features/ExpertiseLicensing
PHENIX [36]
CCP4 [37]
Macromolecular CrystallographyPHENIX: Integrated platform for automated structure solution
CCP4: Comprehensive suite for the entire macromolecular workflow
Open Source
CRYSTALS [38]
SIR [39]
Small-Molecule CrystallographyCRYSTALS: Refinement with a strong focus on validation.
SIR: Automated direct-methods phasing
Academic
(free)
EXPO [40]Powder Diffraction Structure SolutionDirect-space structure solution from powder data; excels at handling severely overlapped peaksAcademic (free)
FOX [41]Powder Diffraction/Total ScatteringGlobal optimization for solving disordered structuresOpen Source
DIFFRAC.Suite
Fityk [42]
Powder Diffraction Data Analysis and FittingDIFFRAC.Suite: Commercial package integrated with Bruker hardware
Fityk: Lightweight tool for profile fitting
Commercial
Open Source
DAWN [43]2D Diffraction Image ProcessingDAWN: Scientific workflow platform for synchrotron/XFEL dataOpen Source
POWDE CELLPowder Diffraction Simulation and VisualizationIntuitive GUI for crystal structure manipulation and real-time X-ray pattern simulation; generates starting models for refinement.Freeware
GSAS/EXPGUIPowder Diffraction/Rietveld AnalysisGSAS: Industry-standard platform for multi-dataset (X-ray and neutron) Rietveld refinement.
EXPGUI: Tcl/Tk-based GUI for GSAS; streamlines parameter editing and visualization.
Open Source
Table 6. Multi-Dimensional Comparison of Visualized Software.
AspectVESTAMercuryJSmolNGL Viewer
Rendering QualityHigh, GPU-accelerated, publication-readyHigh, focus on molecular packingBasic, performance-limitedHigh, WebGL-based, desktop-level
performance
Volumetric Data SupportComprehensive electron/neutron densitySupported (electron density maps)Limited (supports basic isosurfaces)Limited support
Data Analysis CapabilityExtensive (porosity, charge, topology)Powerful (CSD-integrated interaction and packing analysis)Very limited (basic measurements)Basic (real-time measurements)
Output FormatsExcellent (multiple formats, images, 3D models)Good (CCDC-compatible, publication-quality images)Web-dependent (snapshots)Web-dependent (snapshots/video)
Disclaimer/Publisher’s Note: The statements, opinions and data contained in all publications are solely those of the individual author(s) and contributor(s) and not of MDPI and/or the editor(s). MDPI and/or the editor(s) disclaim responsibility for any injury to people or property resulting from any ideas, methods, instructions or products referred to in the content.