Article

PbS-Decorated TiO2 Nanotubes via SILAR for Enhanced Wear and Corrosion Protection in Technical Coatings


by
Hafedh Dhiflaoui
1,
Karim Choubani
2,
Jabeur Ghozlani
1,
Syrine Sassi
3,
Wissem Zayani
1,
Mohamed Aziz Hajjaji
3,
Lotfi Khezami
4,
Mohamed Salah
1,
Mounir Gaidi
5,
Mohamed Ben Rabha
6,*,
Mohammed A. Almeshaal
2 and
Anouar Hajjaji
3
1
Laboratoire de Mécanique, Matériaux et Procédés LR99ES05, Ecole Nationale Supérieure d’Ingénieurs de Tunis, Université de Tunis, Tunis 1008, Tunisia
2
College of Engineering, Imam Mohammad Ibn Saud Islamic University (IMSIU), Riyadh 11432, Saudi Arabia
3
Laboratoire de Photovoltaïque, Centre de Recherches et des Technologies de l’Energie, Technopôle de Borj Cédria, BP 95, Hammam-Lif, Tunis 2050, Tunisia
4
Department of Chemistry, College of Science, Imam Mohammad Ibn Saud Islamic University (IMSIU), Riyadh 11623, Saudi Arabia
5
Center of Advanced Research Materials, Research Institute of Sciences and Engineering, University of Sharjah, Sharjah P.O. Box 27272, United Arab Emirates
6
Laboratoire de Nanomatériaux et Systèmes pour Énergies Renouvelables, Centre de Recherches et des Technologies de l’Énergie, Technopôle de Borj-Cédria, BP 95, Hammam-Lif, Tunis 2050, Tunisia
*
Author to whom correspondence should be addressed.
Crystals 2026, 16(4), 254; https://doi.org/10.3390/cryst16040254
Submission received: 20 January 2026 / Revised: 26 February 2026 / Accepted: 27 February 2026 / Published: 11 April 2026

Abstract

TiO2 nanotubes were synthesized using the anodization method on Ti foils and decorated with PbS nanoparticles by the SILAR method at different cycle numbers (10, 15, 20, 25, and 30). These samples were characterized using SEM, TEM, XRD, and microhardness tests. Morphologically, the PbS nanoparticles were evenly dispersed on TiO2 nanotubes in the shape of small spheres. With an increase in the number of cycles, the size and shape of the nanoparticles increased. This also affected the structure and crystallinity of the PbS NPs, as the crystallite size of PbS increased. The in-depth analysis of the tribological characteristics of the coatings conducted using the scratch test allowed us to evaluate the adhesion of the coatings, a crucial aspect in determining their effectiveness and durability. Furthermore, we found that the wear resistance of the coatings increased with the number of PbS cycles up to 15 cycles. However, for the samples with higher size distribution and crystallite size, such as those with more than 15 cycles, the microhardness continued to decrease. This indicates that the addition of PbS can improve the durability of TiO2 coatings, making them a potential candidate for advanced surface coatings in demanding engineering applications. Electrochemical measurements were conducted to assess the corrosion resistance of the samples. The electrochemical impedance spectra (EIS) results revealed that the PbS/TiO2 coatings with 15 deposition cycles exhibited the most effective corrosion resistance, with a dense and uniform distribution of PbS nanoparticles forming a compact barrier that effectively protects against corrosion. The charge transfer resistance (Rct) and the absorption capacitance (Qab) values were higher for the 15-cycle sample (4.49 Ω·cm2 and 0.9 Fsn−1cm−2, respectively).

1. Introduction

The relentless demands of modern engineering, spanning aerospace, marine, chemical processing, automative, and energy sectors, necessitate the development of advanced surface coatings that can withstand extreme mechanical wear, aggressive chemical environments, and prolonged operational lifetimes [1,2]. To meet these challenges, there is a critical and growing need for multifunctional protective layers that not only resist degradation but also enhance the performance and durability of underlying metallic substrates, particularly titanium and its alloys, which are favored for their high strength-to-weight ratio and corrosion resistance in demanding applications. However, under severe tribological loads and corrosive media, even Ti-based components are susceptible to surface degradation, including abrasive wear, fatigue cracking, and localized pitting corrosion, which can lead to premature failure and significant economic losses [3]. Consequently, the pursuit of innovative surface modification strategies that significantly improve hardness, wear resistance, adhesion, and corrosion protection has become a focal point of materials research and engineering. Among various surface engineering approaches, the formation of titanium dioxide TiO2 nanotubes via anodization offers a promising route due to the simplicity, controllability, and scalability of the process [4,5].
The highly organized, controlled, and uniform structure of the nanotubes makes them an effective surface modification method due to their simplicity compared to other Ti surface modification techniques. Studies have shown that TiO2 nanotubes possess unique surface characteristics that improve surface functionality and overall material performance. Moreover, TiO2 nanotubes enhance corrosion resistance and improve the elastic modulus of Ti. These characteristics make them particularly suitable for protective layer applications, where enhanced durability and stability are required; biomedical implants represent a prominent example of such applications [6,7,8,9]. The ideal method for synthesizing TiO2 nanotubes is anodization, which ensures the attainment of an organized, vertically controlled topography grown directly on the Ti surface, according to Zhang Jing et al. [10] This unique morphology controlled by the anodization method exhibited a hardness H of 30 MPa and a friction coefficient of 0.45, which are higher than those of TiO2 nanotubes synthesized by the sputtering method, which exhibited a hardness H of 12 MPa and a friction coefficient of 0.21, according to Sun Yong et al. [11]. Further modification to the surface was done by coupling TiO2 nanotubes with other nanoparticles to further enhance their mechanical, tribological, and structural properties. PbS nanoparticles deposited on TiO2 nanotubes were largely studied for photocatalytic activities such as water splitting, bacterial inactivation, organic pollutant photodegradation, and photoelectrochemical and electrochemical applications [12]. However, the influence of PbS nanoparticles incorporation on the mechanical, tribological, and anti-corrosion properties of TiO2 nanotube coatings remains largely unexplored. Such investigations are vital for developing robust, wear-resistant, and corrosion-protective surface layers for use in harsh operational environments. There are several methods for the deposition of PbS nanoparticles, including pulsed laser deposition (PLD), physical vapor deposition (PVD), chemical vapor deposition (CVD), sputtering, hydrothermal, and successive ionic layer adsorption reaction (SILAR) [13,14,15]. The latter method is the most used due to its simplicity and low cost. Hajjaji et al. [16] deposited PbS nanoparticles on TiO2 nanotubes using the SILAR method. The obtained results were significant, as the sample with 15 cycles reported a 75% photodegradation of amido black in 30 min under visible light and a 1.36% photoconversion efficiency (PCE). These values were the highest compared to the other samples and bare TiO2 NTs.
In this work, we investigate the influence of PbS nanoparticles deposition on the mechanical, tribological, and electrochemical properties of TiO2 nanotube-based coatings for applications requiring enhanced durability, wear resistance, and corrosion protection. The deposition will be carried out using the SILAR method with varying cycles (10, 15, 20, 25, and 30 cycles) to assess the impact of the distribution, loading, and size, as well as the morphology of PbS nanoparticles on the properties and tribological behavior of TiO2. Scratch testing was employed to assess coating adhesion and cohesive strength, while tribological tests under varying loads quantified the wear resistance and frictional behavior. Electrochemical measurements in simulated aggressive environments were conducted to determine the corrosion protection efficacy of the coatings. The findings of this study aim to provide fundamental insights into the design of PbS/TiO2 nanocomposite coatings for high-performance surface protection in technical applications.

2. Experimental

2.1. Chemicals

Titanium foils (second grade), ammonium fluoride (NH4F), ethylene glycol (CH2H6O2), lead nitrate (Pb (NO3)2), ethanolamine (C2H7NO), thiourea (CH4N2S), acetone, ethanol, and water. All chemical products were purchased from SRLChem (SRL Chemicals, Mumbai, India).

2.2. Samples Elaboration

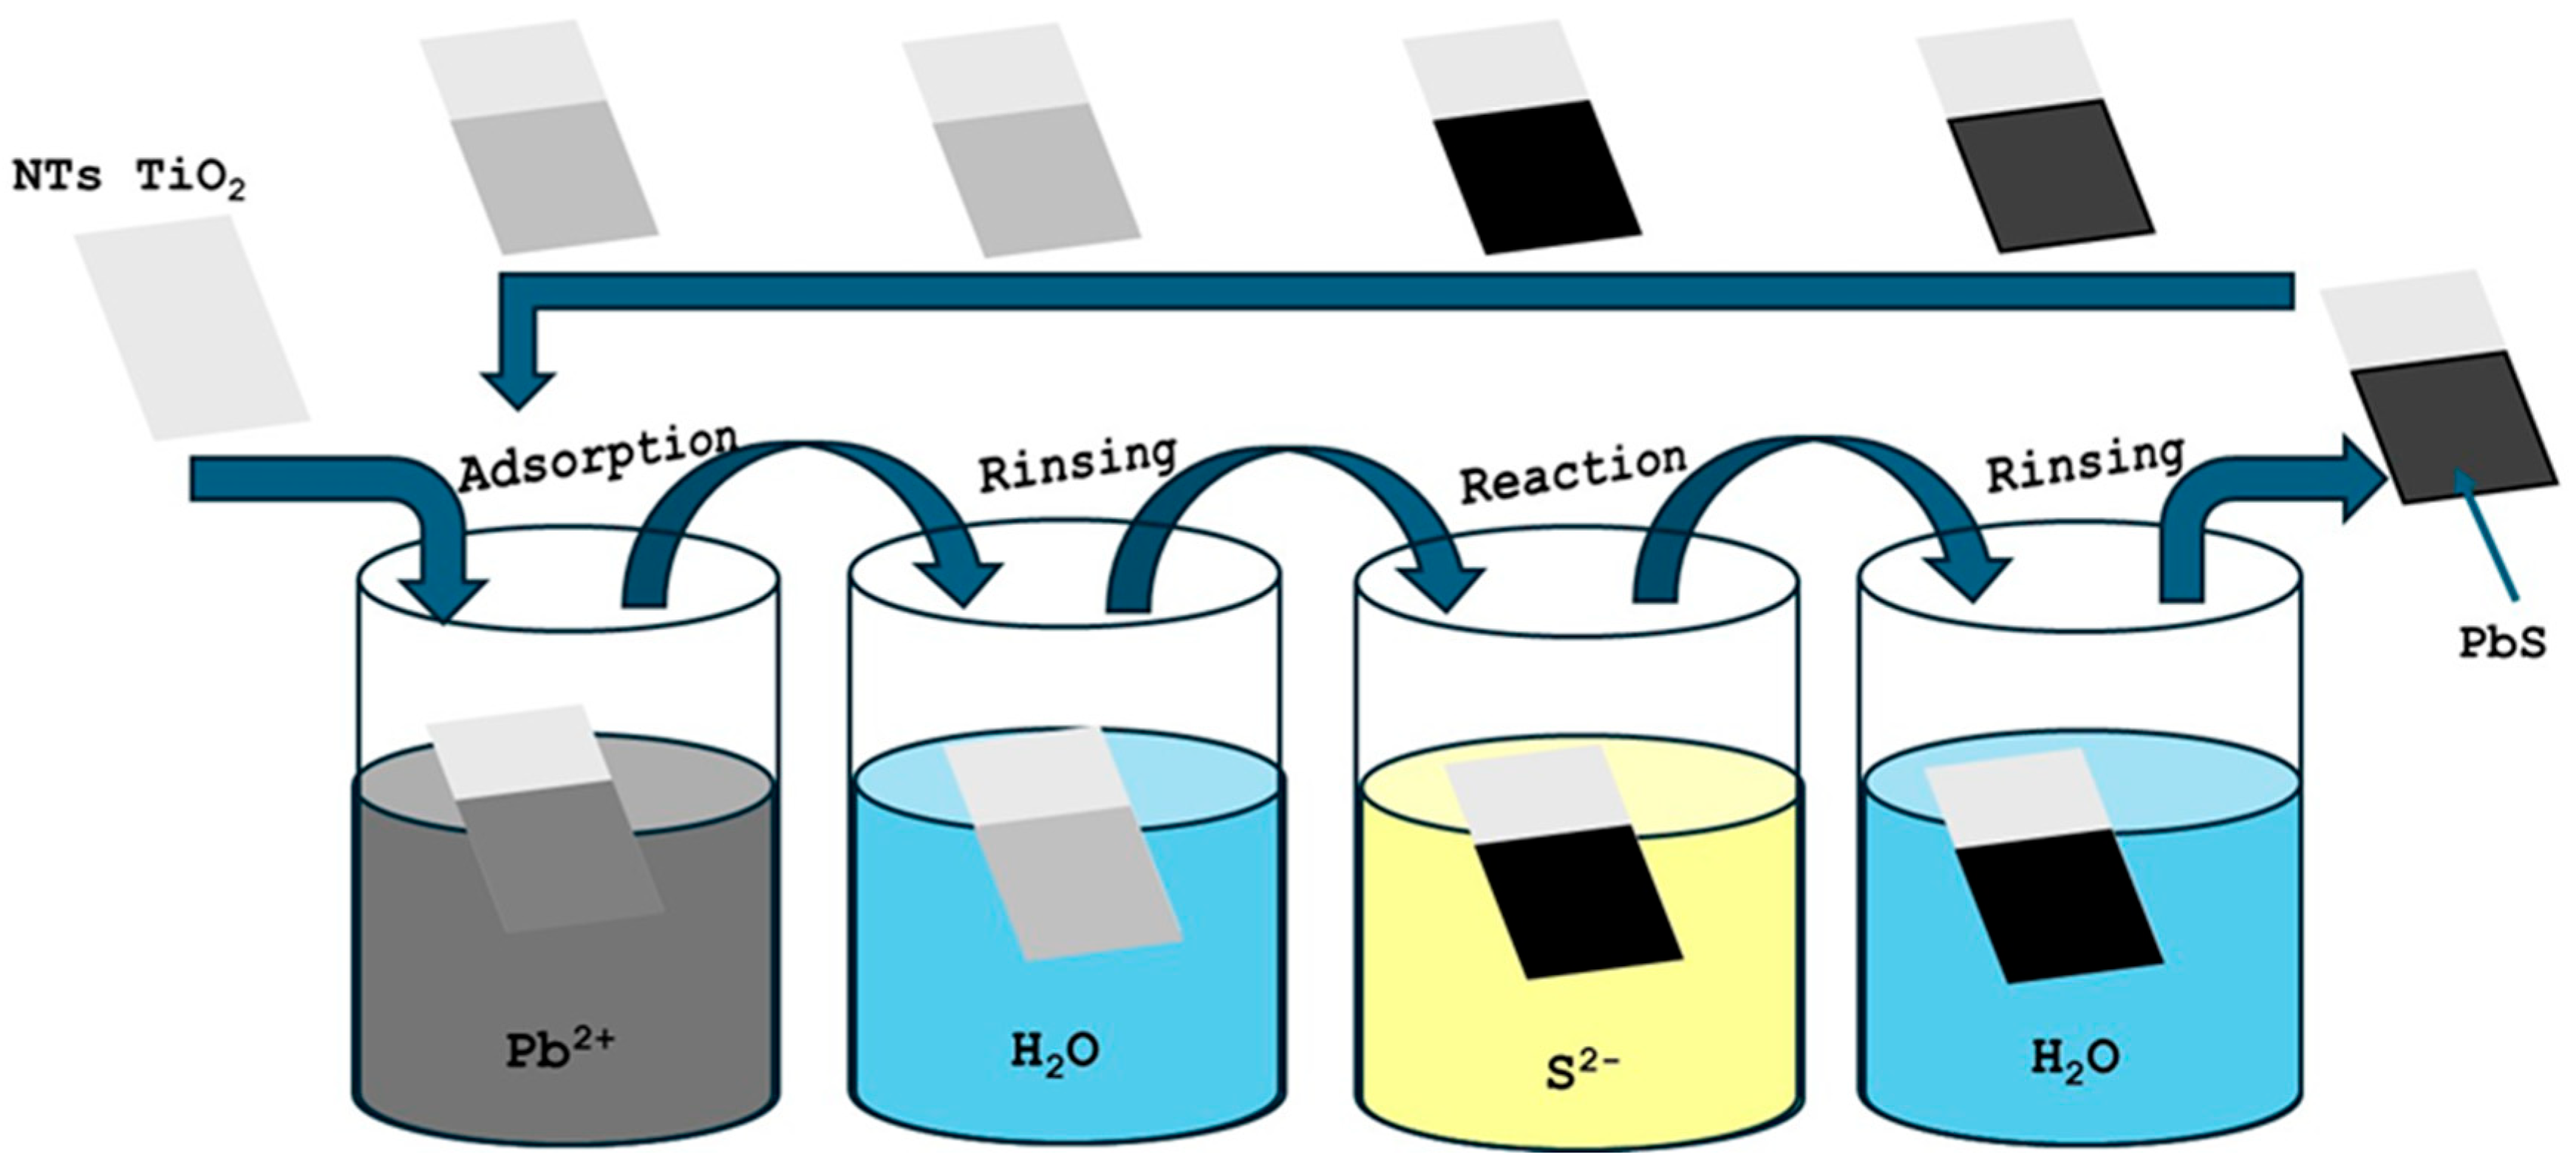
The TiO2 NTs (titanium dioxide nanotubes) were synthesized directly on Ti foils with dimensions of 2.5 × 2.5 cm2, polished, and ultrasonically cleansed in acetone, ethanol, and water. The anodization method was used with a two-electrode system where the Ti foil served as an anode and a platinum wire as the cathode. These two electrodes were immersed in an electrolytic solution that contained ethylene glycol, 1% ammonium fluoride, and 2% water. The process was carried out for 2 h at a potential of 60 V and an applied current of 200 mA. Finally, the samples were cleaned with ethanol and water, then annealed at 400 °C for 3 h. For the deposition of PbS NPs (lead sulfide nanoparticles) on the surface of TiO2 nanotubes, a SILAR method (successive ionic layer adsorption and reaction) was used for the adsorption of Pb2+ and S2− precursors. The immersion in the two precursor solutions was successive for different cycles (10, 15, 20, 25, 30) and finally rinsed with water to eliminate the excess absorbed material (Figure 1).

2.3. Sample Characterization

Physicochemical, structural, and mechanical characterizations were carried out for all the samples.

2.3.1. Morphological Characterization

This step was carried out using scanning electron microscopy (SEM) paired with microanalyse X (EDX), operated with the model THERMO SCIENTIFIC (5 XRH) (manufactured by Thermo Fisher Scientific, Waltham, MA, USA), with a primary electron beam diameter ranging from 5 to 20 nm and an energy ranging from a few keV up to 50 keV. Transmission electron microscopy (TEM) was also used, which is similar to optical microscopy but employs an electron beam accelerated up to 200 kV.

2.3.2. Structural Characterization

The analyses were carried out through an X-ray diffraction (XRD) study with a Bruker D8 Advance diffractometer equipped with a copper source (CuKa), a wavelength of λ = 1.5406 Å, and a tension generator of 40 kV (Bruker, Billerica, MA, USA).

2.3.3. Mechanical Characterization

The mechanical characterization (Vickers hardness) of the nanotubes was carried out using a Microvickers-DM2A microdurometer (ES-France, Garches, France) equipped with an indenter with a standardized diamond pyramidal tip with a square base and a vertex angle of 136°. The Vickers microhardness measurement is done in two stages: loading for a few seconds (with a load of 50 gf = 0.5 N), then unloading. The permanent imprint left by the indentation makes it possible to determine the HV hardness using the following equation:
H V = 2 · F · s i n 136 ° 2 d 2     1.854   F d 2
where F is the applied load, and d is the diagonal of the indentation.

2.3.4. Scratch Test

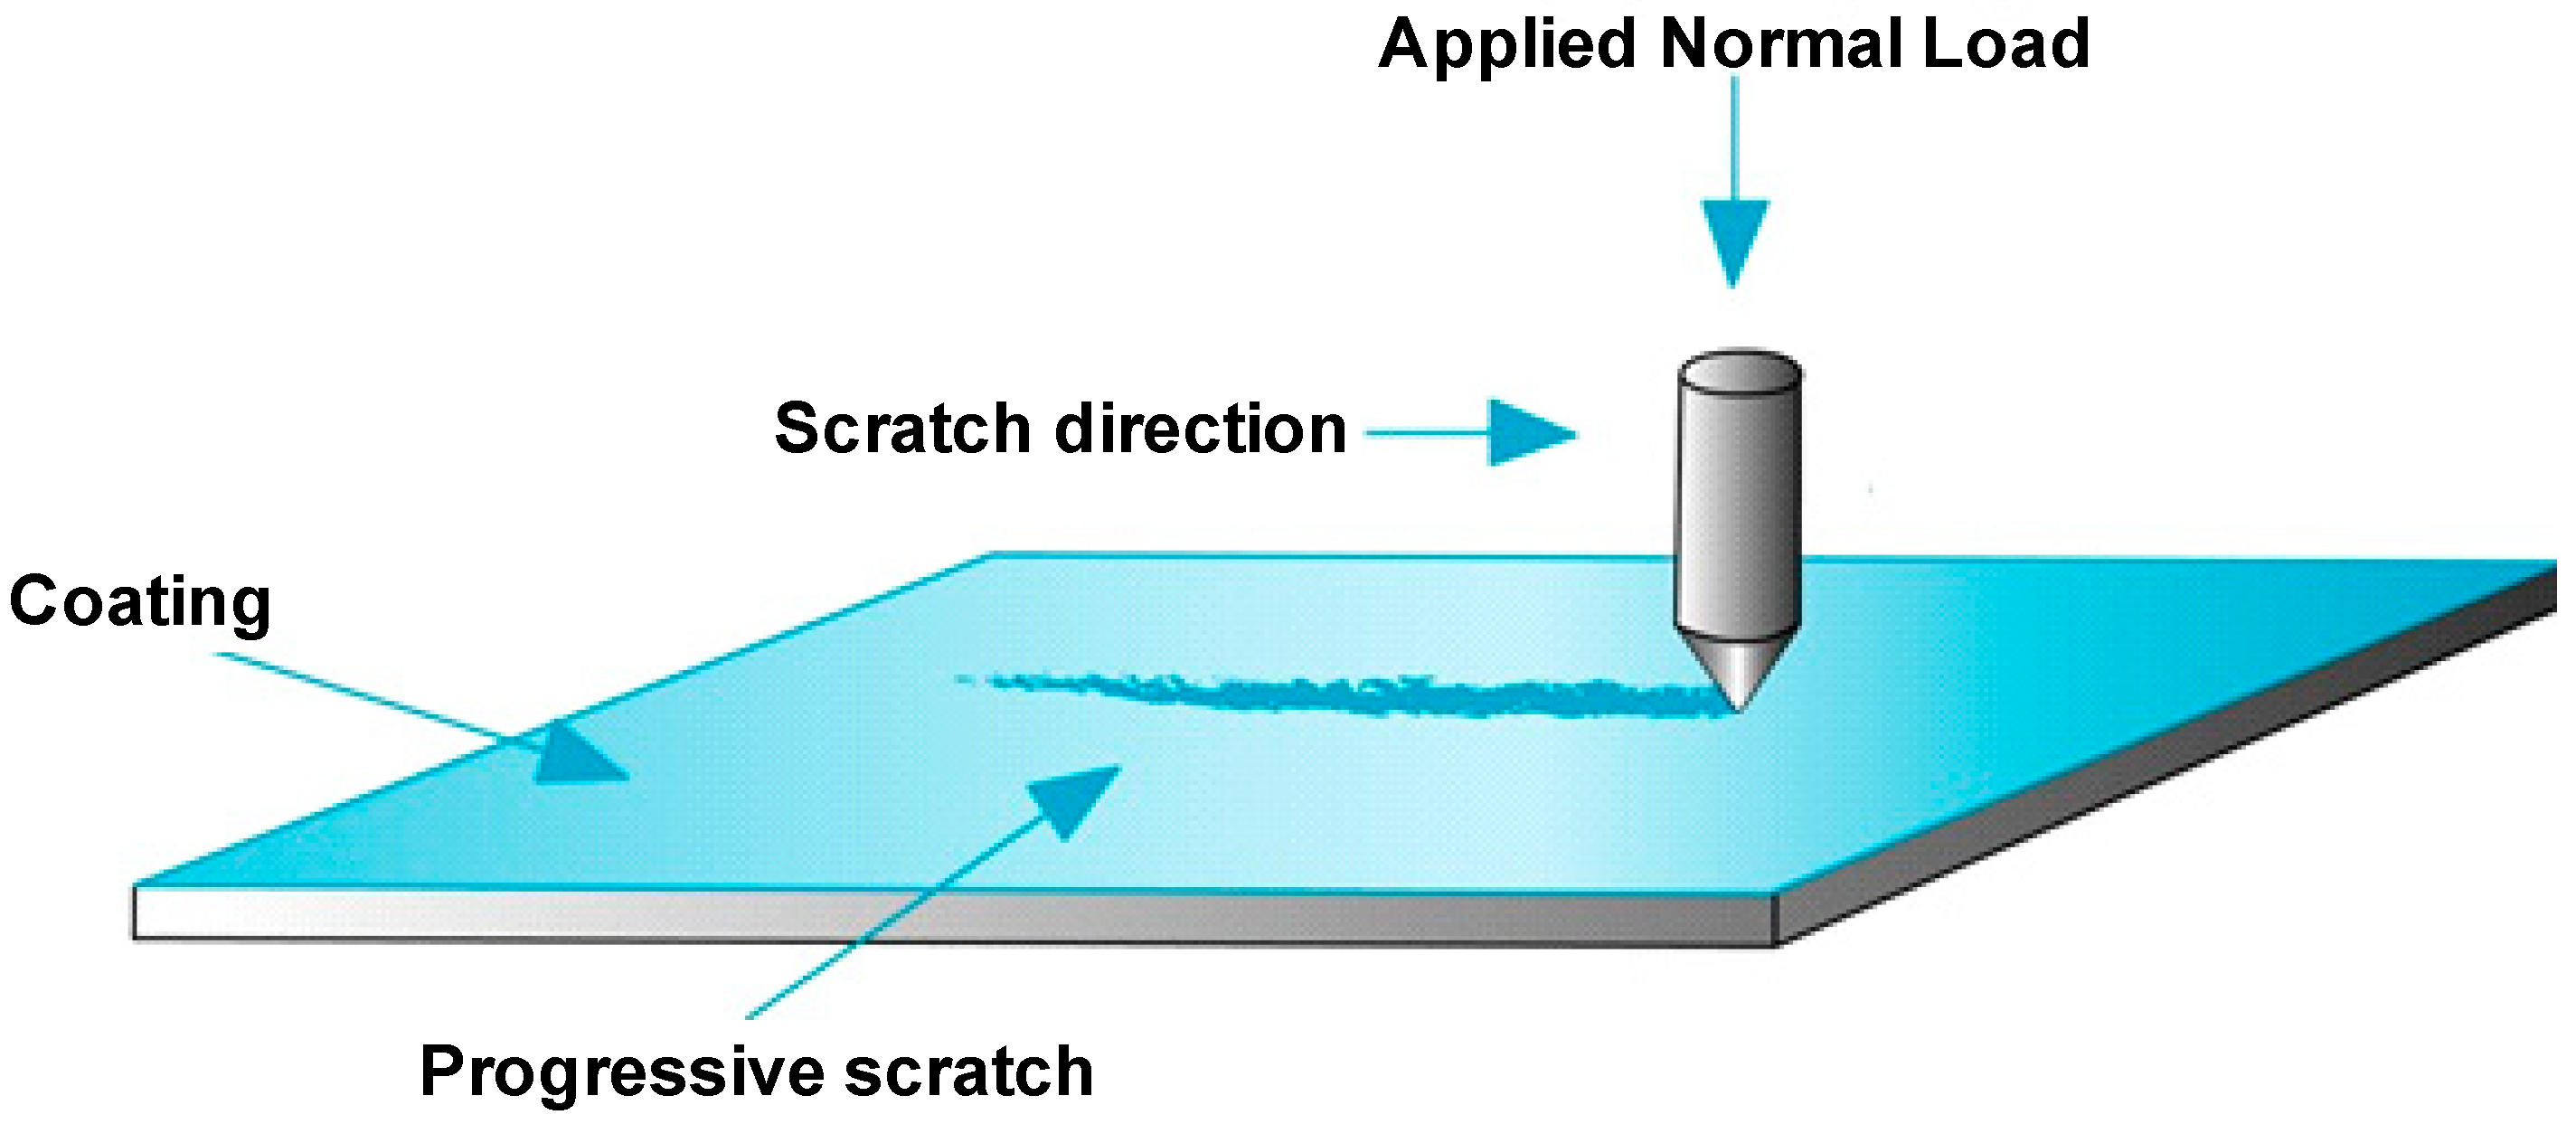
The general principle of the scratch test consists of moving an indenter parallel to the surface of the sample at a constant speed, with a gradual increase in the normal force (FN) until visible damage to the deposit occurs (Figure 2). The indenter can be of various shapes (spherical, pyramidal, or conical), and the quality of adhesion of the deposit can be evaluated by analyzing the trace in order to differentiate cohesive cracks from adhesive cracks. The trace of the scratch left on the sample makes it possible to analyze damage phenomena. This experiment consists of measuring the tangential friction force FT exerted by the sample surface on the indenter as a function of the increasing applied normal force FN while performing an SEM observation of the scratch. The scratch tests were conducted at room temperature on the surface of the TiO2 NTs decorated with PbS NPs using an MST micro-scratch tester (Anton Paar, Baden, Switzerland). This tester was equipped with a conical Rockwell-type diamond indenter C, featuring a radius of 200 µm and an apex angle of 120°. The tests were performed with an incrementally increasing load from 30 mN to 10 N, a table speed of 3.01 mm/min, and a total scratch distance of 300 µm.
The tribological behavior was studied through wear tests conducted over a 3 mm stroke using a constant load scratch to determine friction and wear resistance. Several tests were carried out with normal loads of 1, 2, and 3 N and a sliding speed of 10 mm/min.

2.3.5. Corrosion Test

The electrochemical measurements were conducted at room temperature using a cell system consisting of the following components: (i) a reference electrode (Ag/AgCl) with 1 M KCl, used for potential calculation, (ii) an auxiliary electrode made of coiled nickel wire, and (iii) a working electrode, which was the test sample. Tafel curves were obtained under open-circuit conditions within a potential range of 200 to 1500 mV (at a scan rate of 1 mV/s). The potentiodynamic polarization curves for PbS/TiO2 nanotubes were recorded in a simulated body fluid (SBF) solution at room temperature. Each corrosion test was repeated three times for consistency. All measurements were performed using electrochemical impedance spectroscopy (EIS) across a wide frequency range from 10 mHz to 10 kHz.

3. Results and Discussion

3.1. Morphological Properties

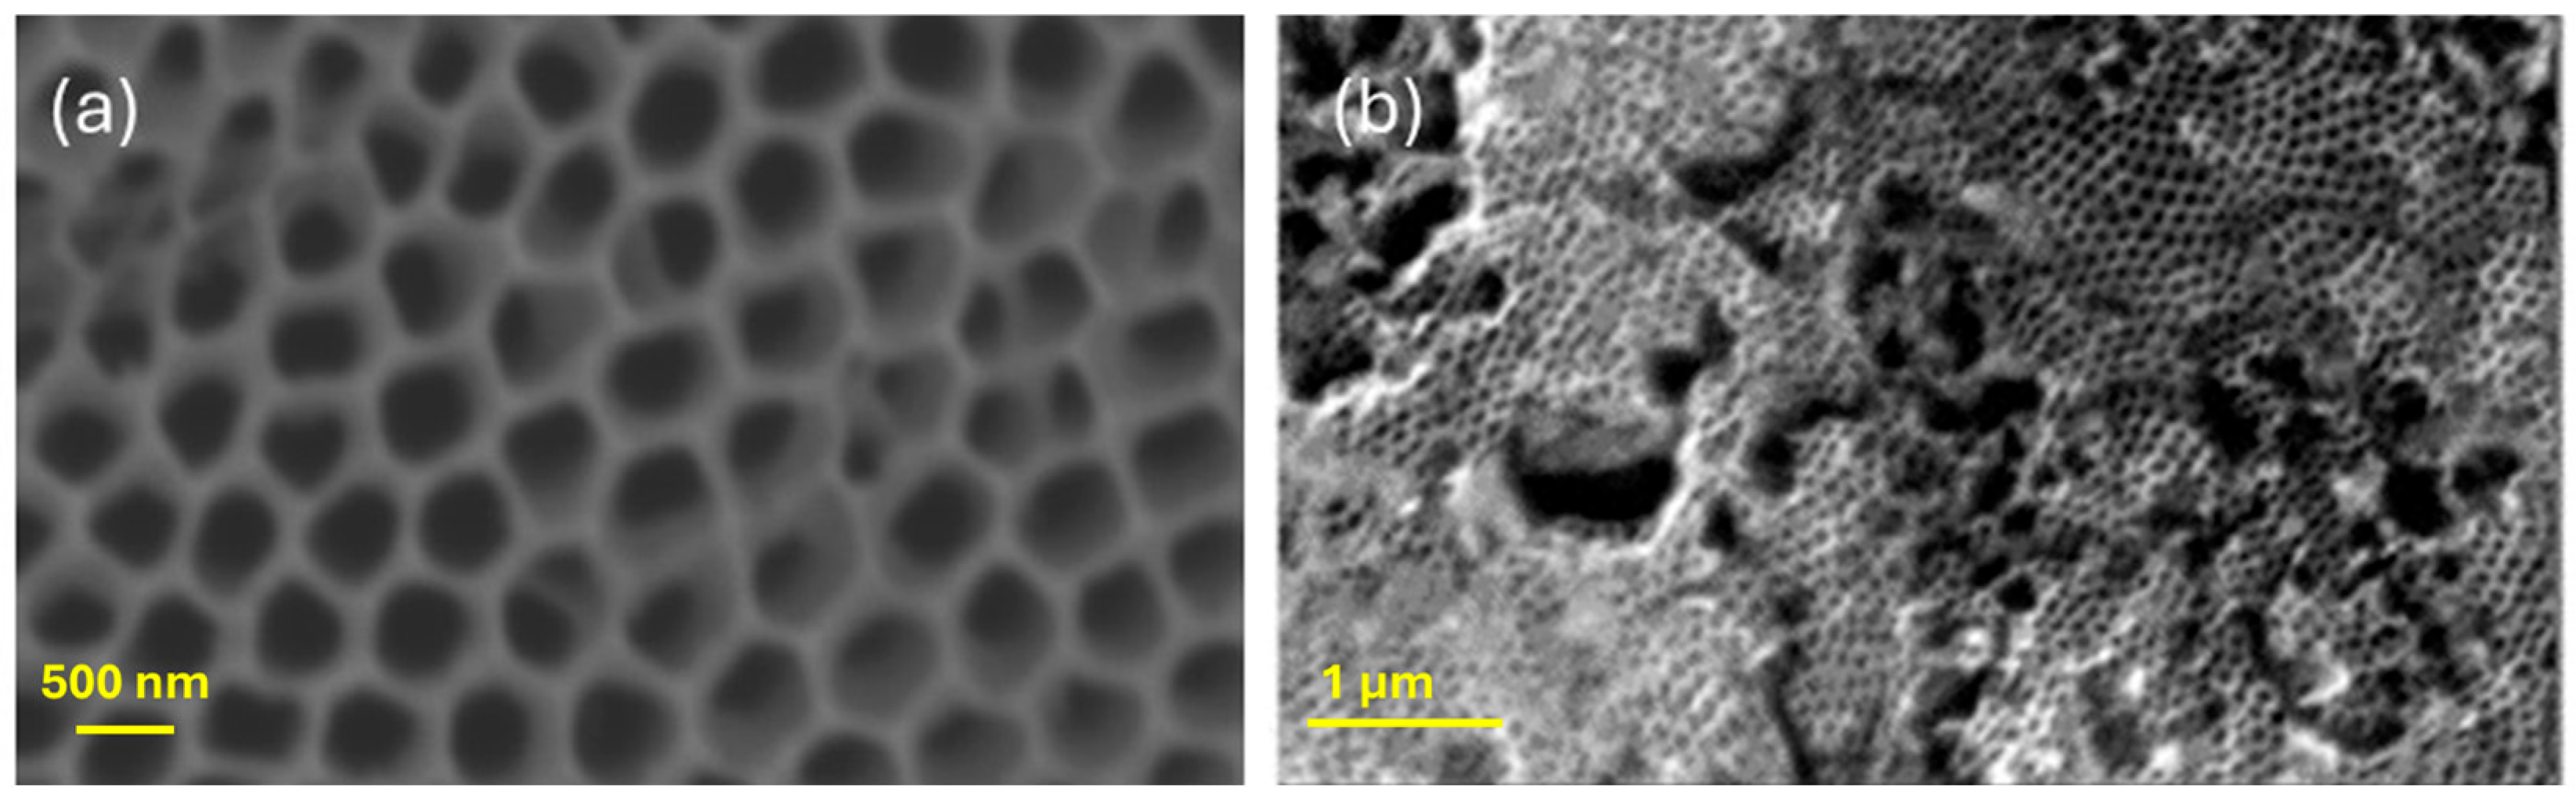
The morphology and size distribution of the PbS NPs deposited by SILAR were determined by SEM and TEM images. Figure 3 shows SEM images of TiO2 NTs before and after the deposition of PbS NPs with the number of SILAR cycles Nc = 15. The bare TiO2 nanotubes show an inner diameter of 100 nm, a wall thickness of 50 nm, and a length of about 15 µm. After the deposition of PbS nanoparticles (NPs) (Figure 3b), some clusters can be observed on the surface of the nanotubes, indicating the agglomeration of PbS nanoparticles. With an increase in the number of cycles, both the number and size of PbS nanoparticles increase from 300 nm to 1 µm, covering the surface of the nanotubes.
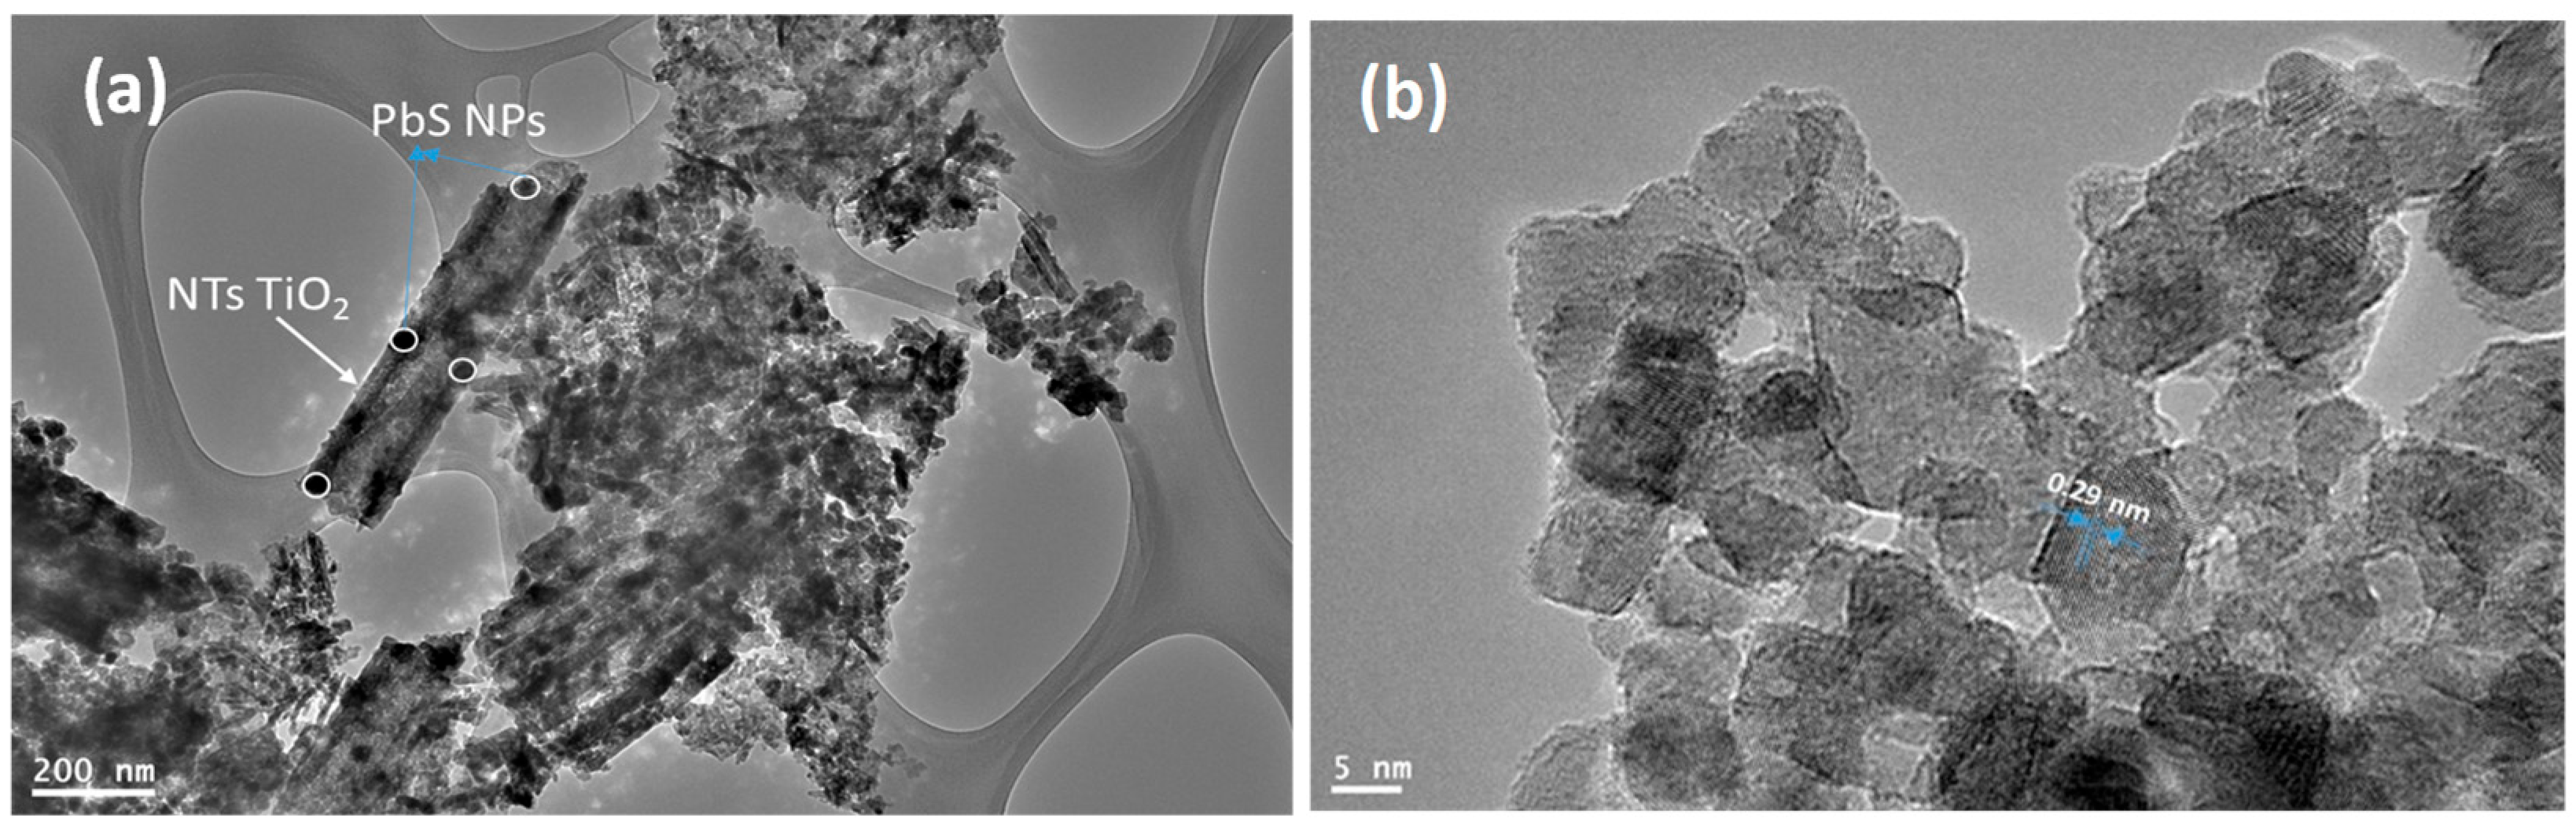
Figure 4a shows the PbS NPs/TiO2 NTs at 15 SILAR cycles. The dark spots circled in yellow clearly indicate the deposited PbS nanoparticles on the inside and outside walls of TiO2 NTs, which are spherically shaped with an average size of 10–15 nm. The HRTEM image in Figure 4b exhibits an interplanar distance d = 0.29 Å related to PbS (200), confirming the presence of PbS nanoparticles. The size distribution of PbS NPs on TiO2 NTs was determined (Table 1).
Table 1 showcases the relationship between the average diameter of PbS NPs and the number of SILAR cycles (NC). Notably, in the sample with NC = 30, the average diameter increases from 13 nm to 22 nm. It is evident that as the number of cycles increases, the size of PbS nanoparticles also increases, attributed to a greater amount of material being absorbed onto the surface of TiO2 NTs.
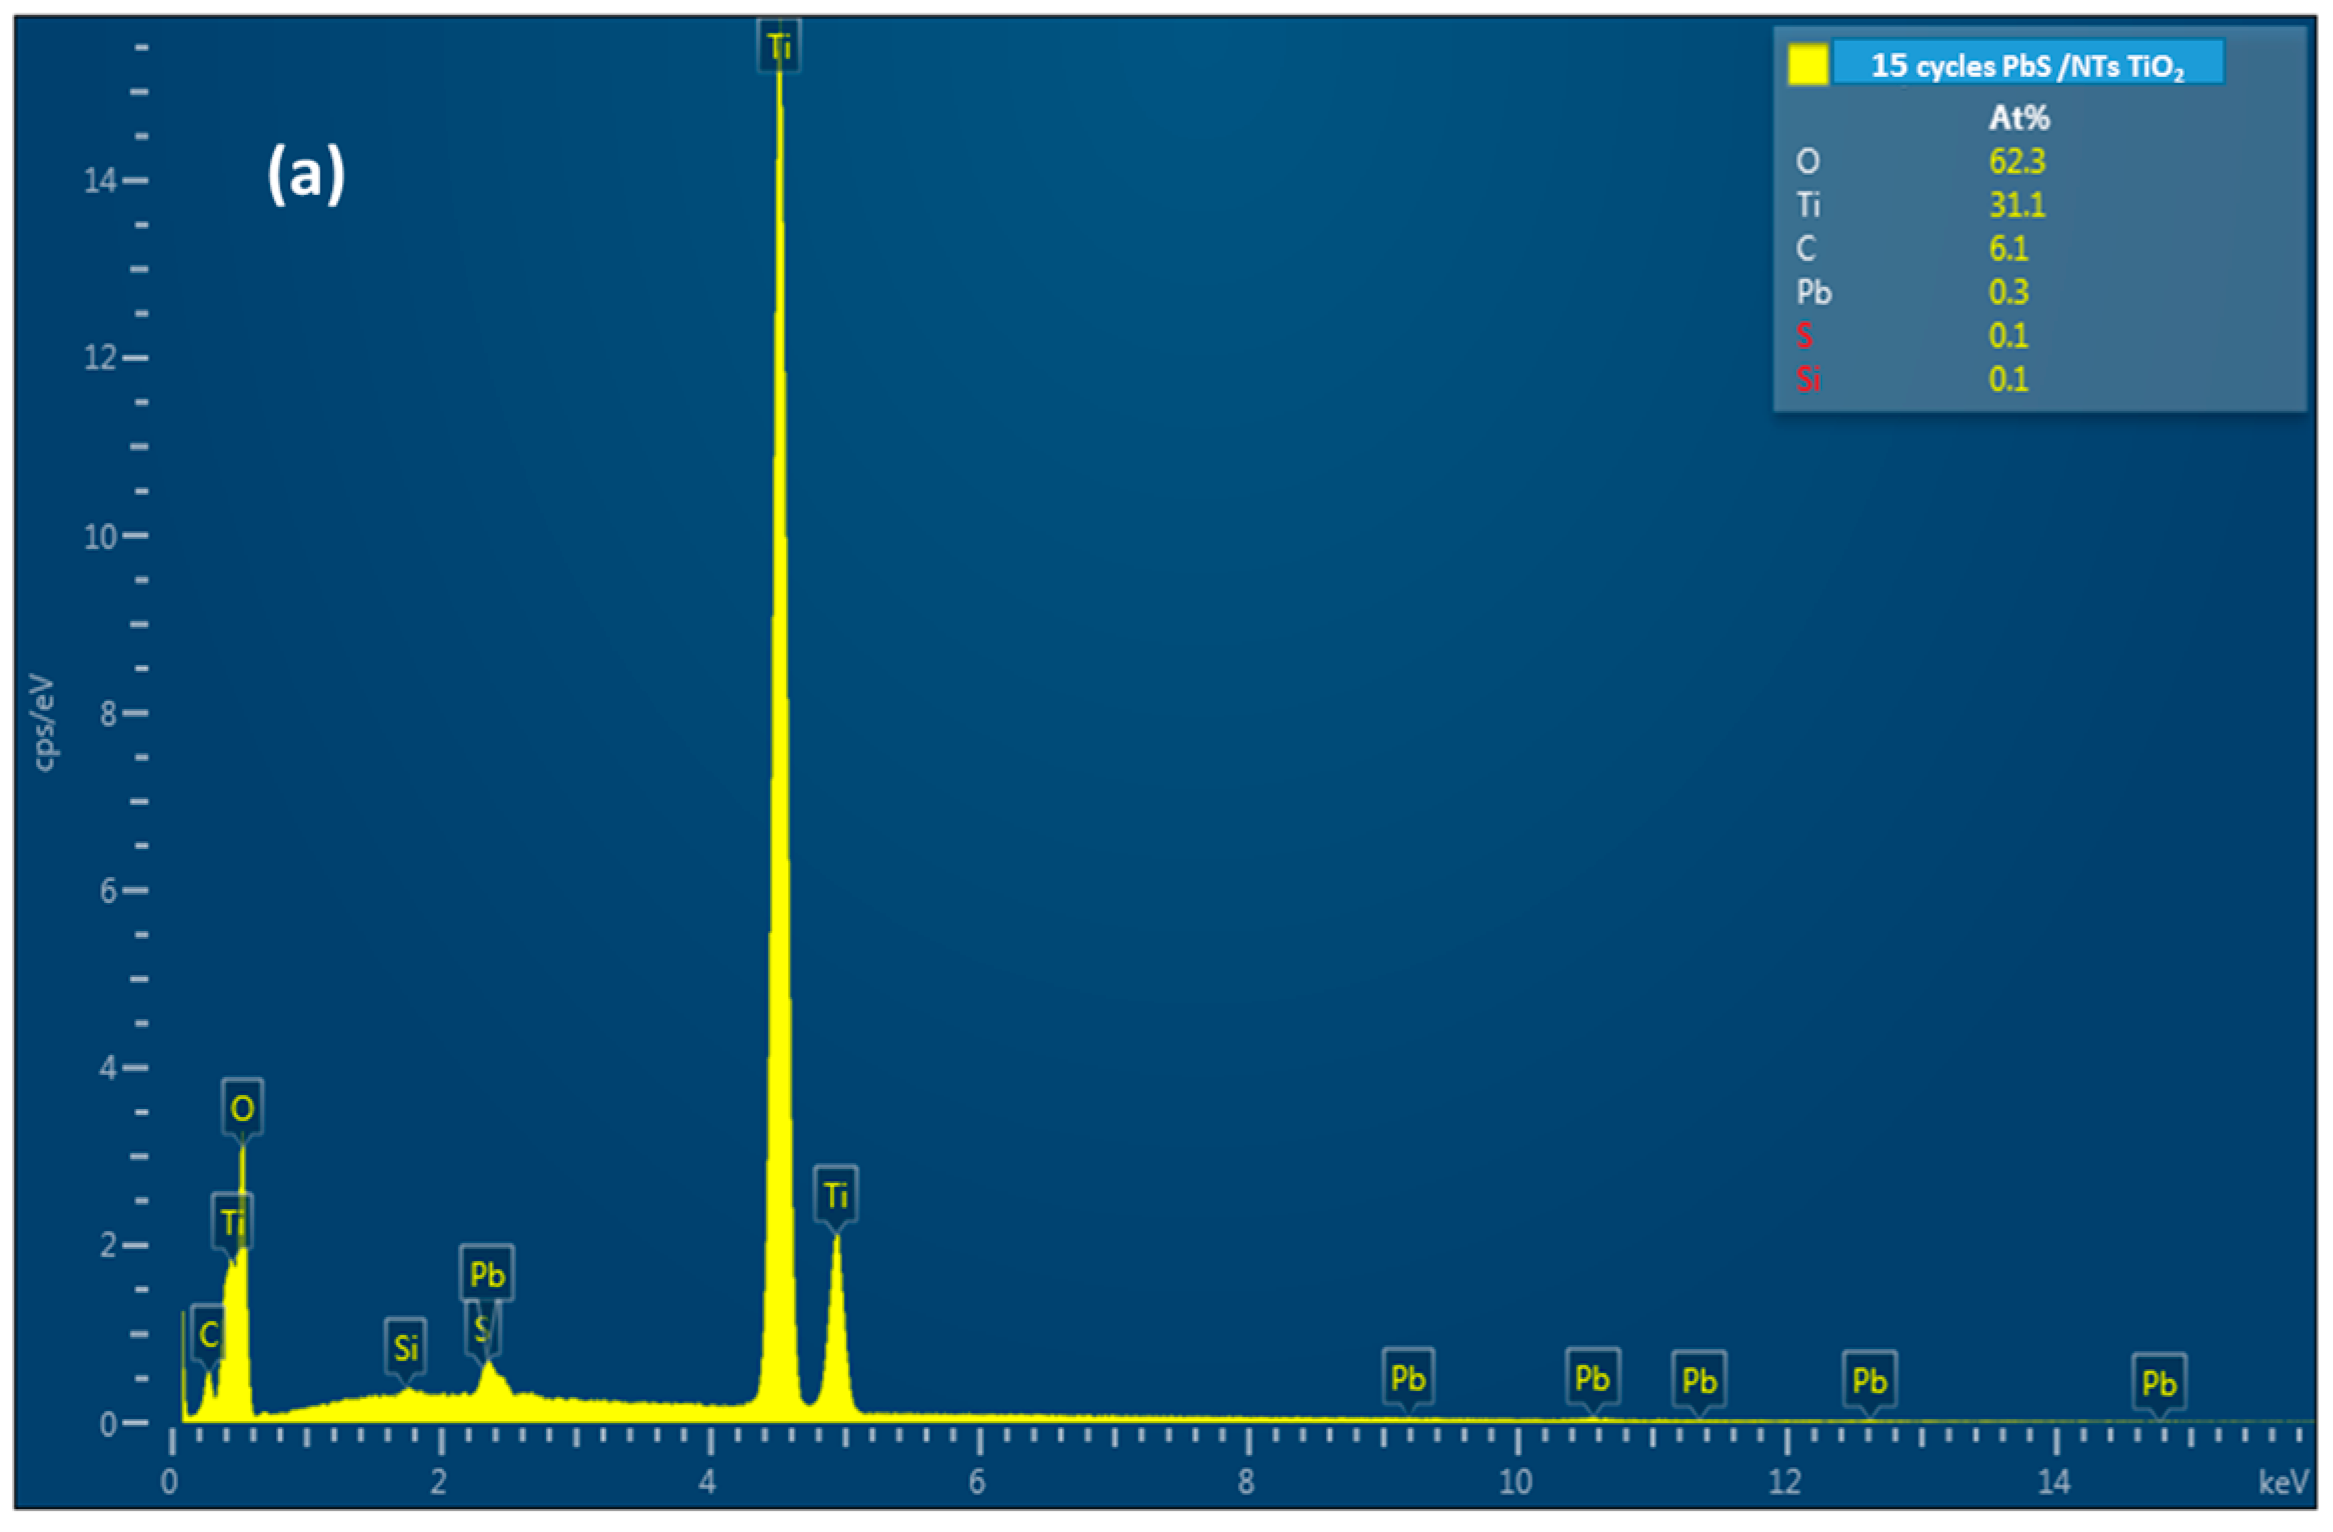
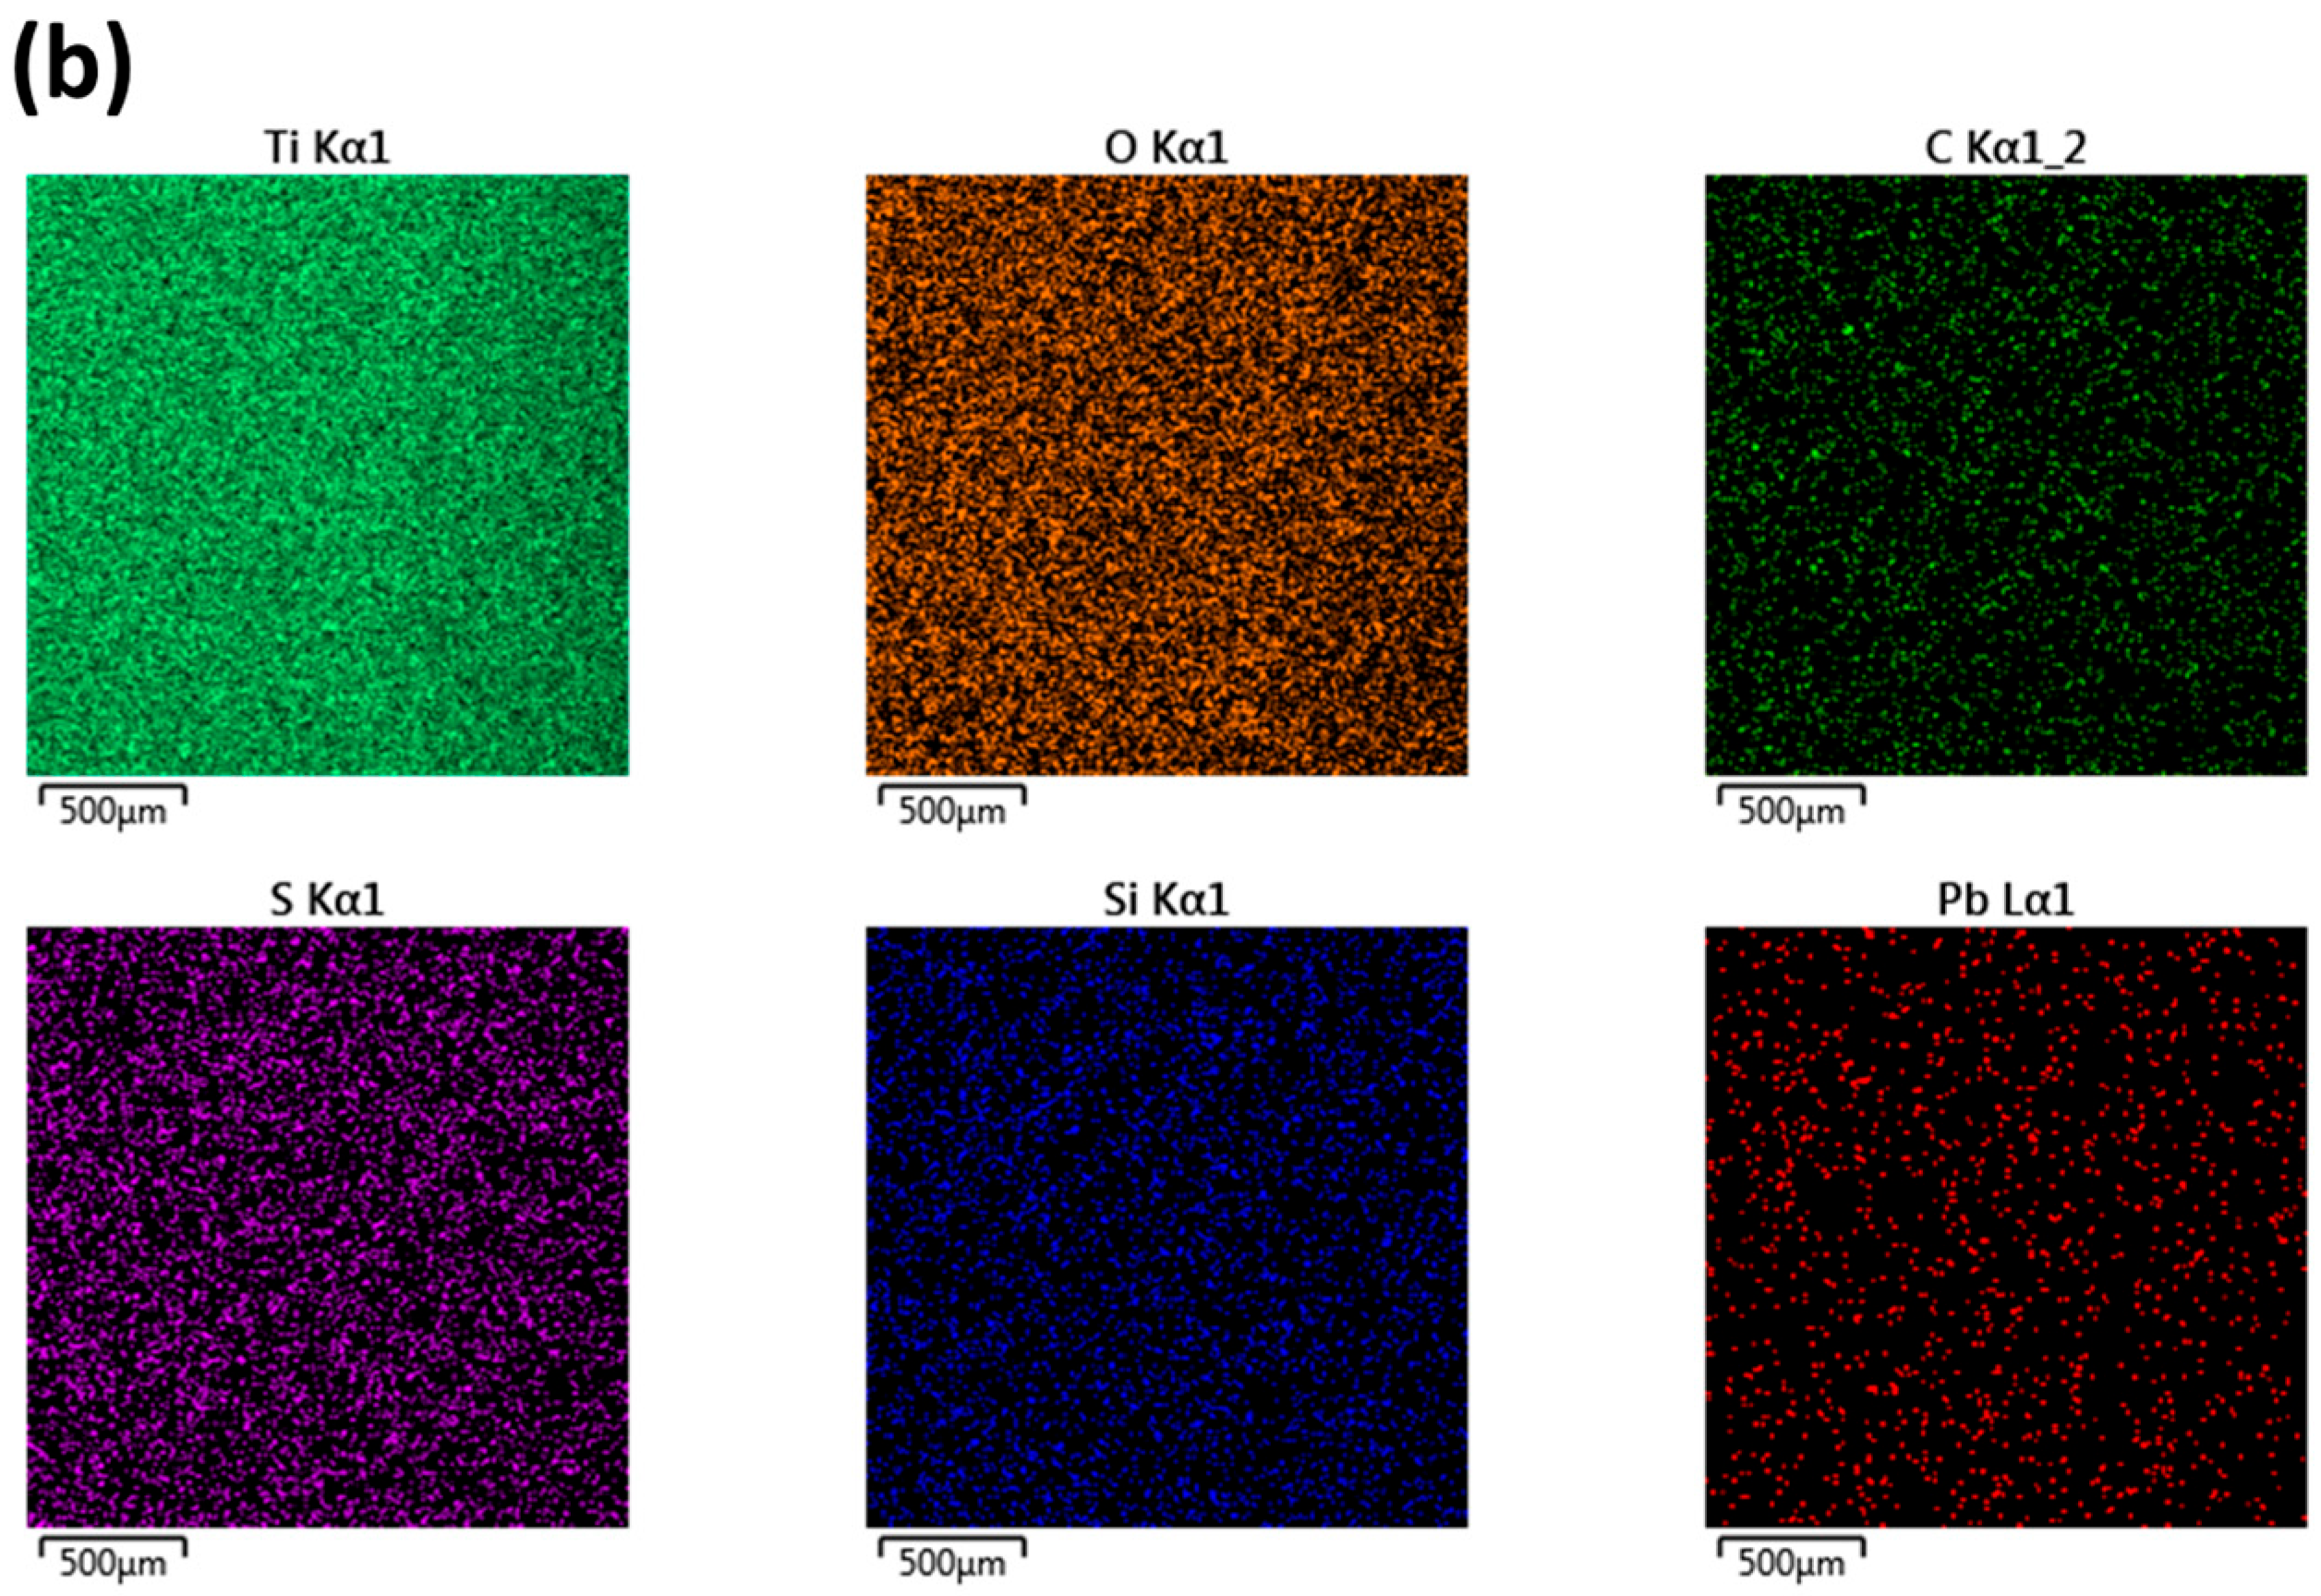
In Figure 5, the EDX spectra for the 15 SILAR cycles sample are presented alongside the mapping of elements, indicating the presence of Ti, Pb, S, O, and C. Moreover, it is noteworthy that the atomic ratio of Pb/S increases from 1 to 1.16 with the rise in the number of cycles.
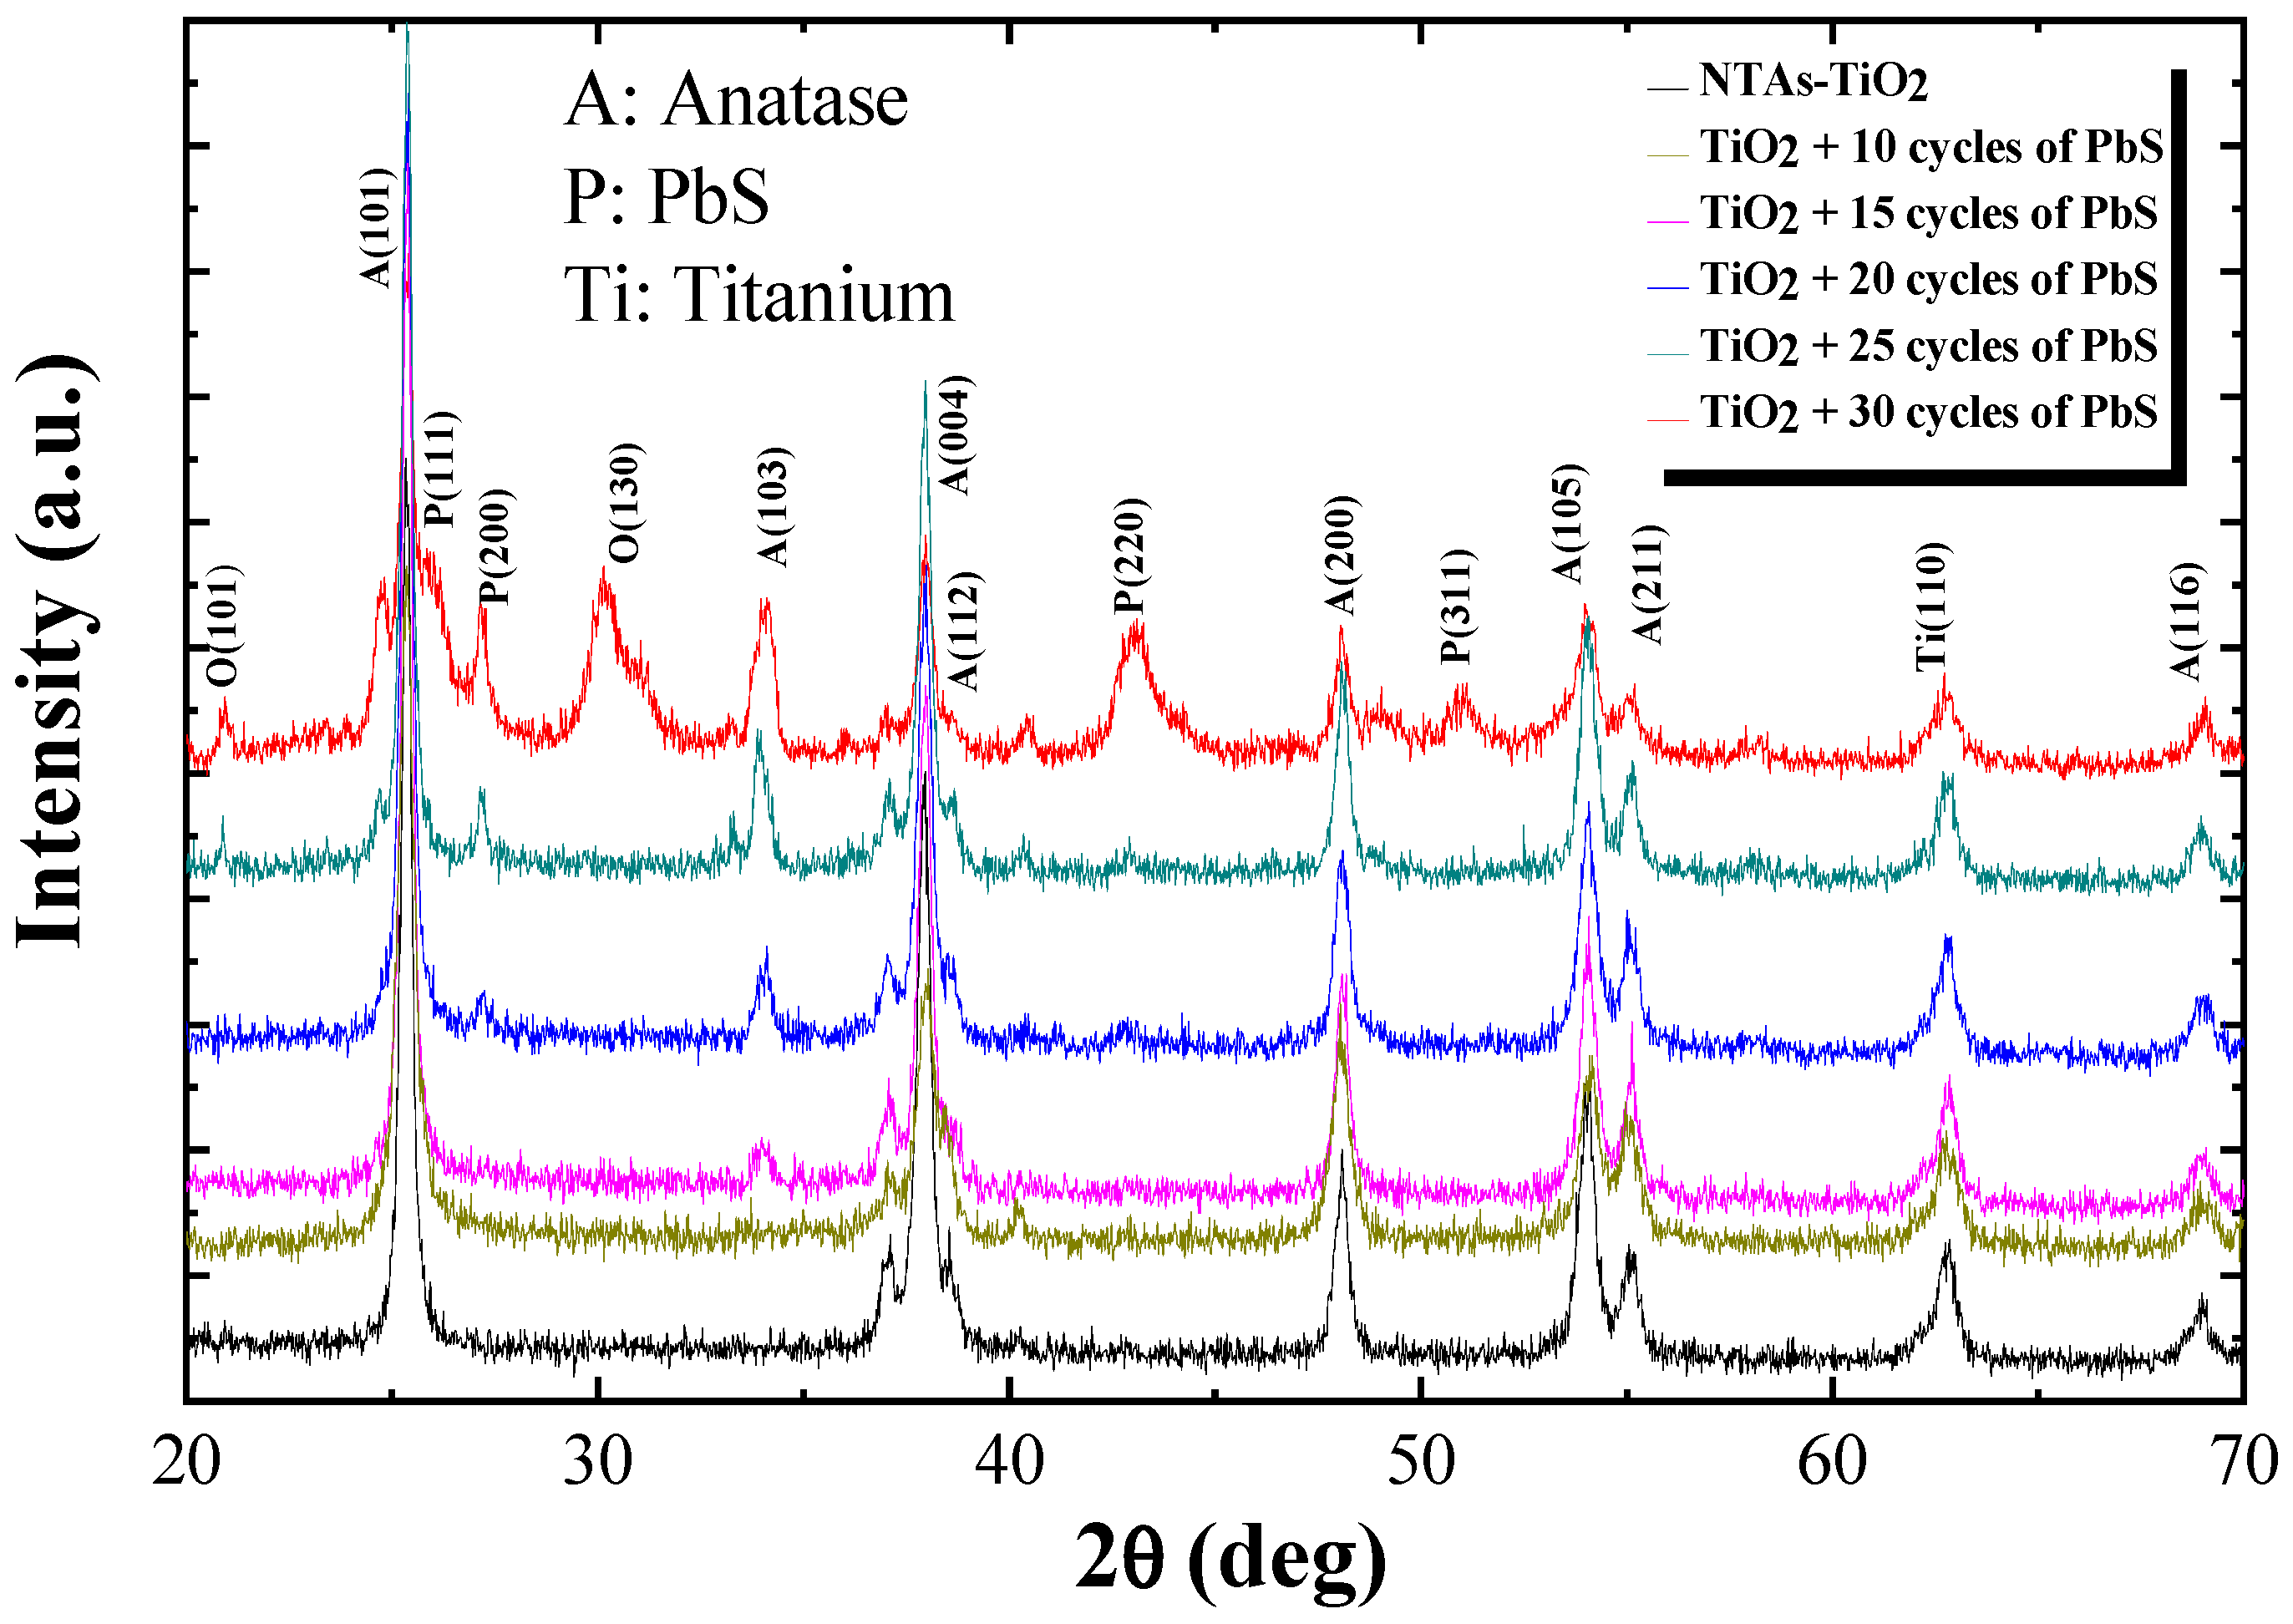
From the diffractogram in Figure 6, we can determine the structural properties of the sample with an increase in the number of SILAR cycles from 10 to 30. Upon observation of Figure 6, it is evident that anatase titanium dioxide TiO2 with a preferred orientation (101) is formed at 2θ = 25.34°, in accordance with reference card JCPDS No: 894921. Additionally, the peaks related to PbS nanoparticles become more pronounced with an increase in the number of SILAR deposition cycles at 2θ = 25.96°, 30.18°, 43.15°, and 50.96°, corresponding to crystallographic orientations (111), (200), (220), and (311) (JCPDS No: 781901). Meanwhile, peaks at 2θ = 20.81° and 34.20° are associated with Pb(SO4) with crystallographic orientations (101) and (130), respectively; the presence of this phase is likely due to surface oxidation.
To assess the structural properties for the different number of SILAR cycles, the grain size was determined using the following equation [17]:
D =   K   λ β cos θ
where K is a constant (0.9 for spherical crystallites), β (rad) is the line broadening at half the maximum intensity FWHM, λ (nm) is the X-ray wavelength, and θ (◦) is the Bragg angle.
Table 2 presents the results of the crystallite size of the preferred orientation of PbS nanoparticles PbS (200) at different SILAR cycles. The peaks at 10 and 15 cycles were so small that it was impossible to calculate D, but with the increase in the number of cycles, the peaks became more visible and detectable. The crystallite size D appears to increase with the number of SILAR cycles.
In our study, micro-hardness measurements were conducted using a Vickers-type indenter. If the penetration depth exceeds the coating thickness, the indenter continues to sink into the substrate. At this point, the deformed area no longer precisely matches the shape of the indenter, especially if the hardness of the substrate significantly differs from that of the coating. This scenario can lead to alterations in the morphology of the imprint. It is essential to consider these factors to correctly interpret the data obtained and achieve an accurate assessment of the mechanical properties of the sample.
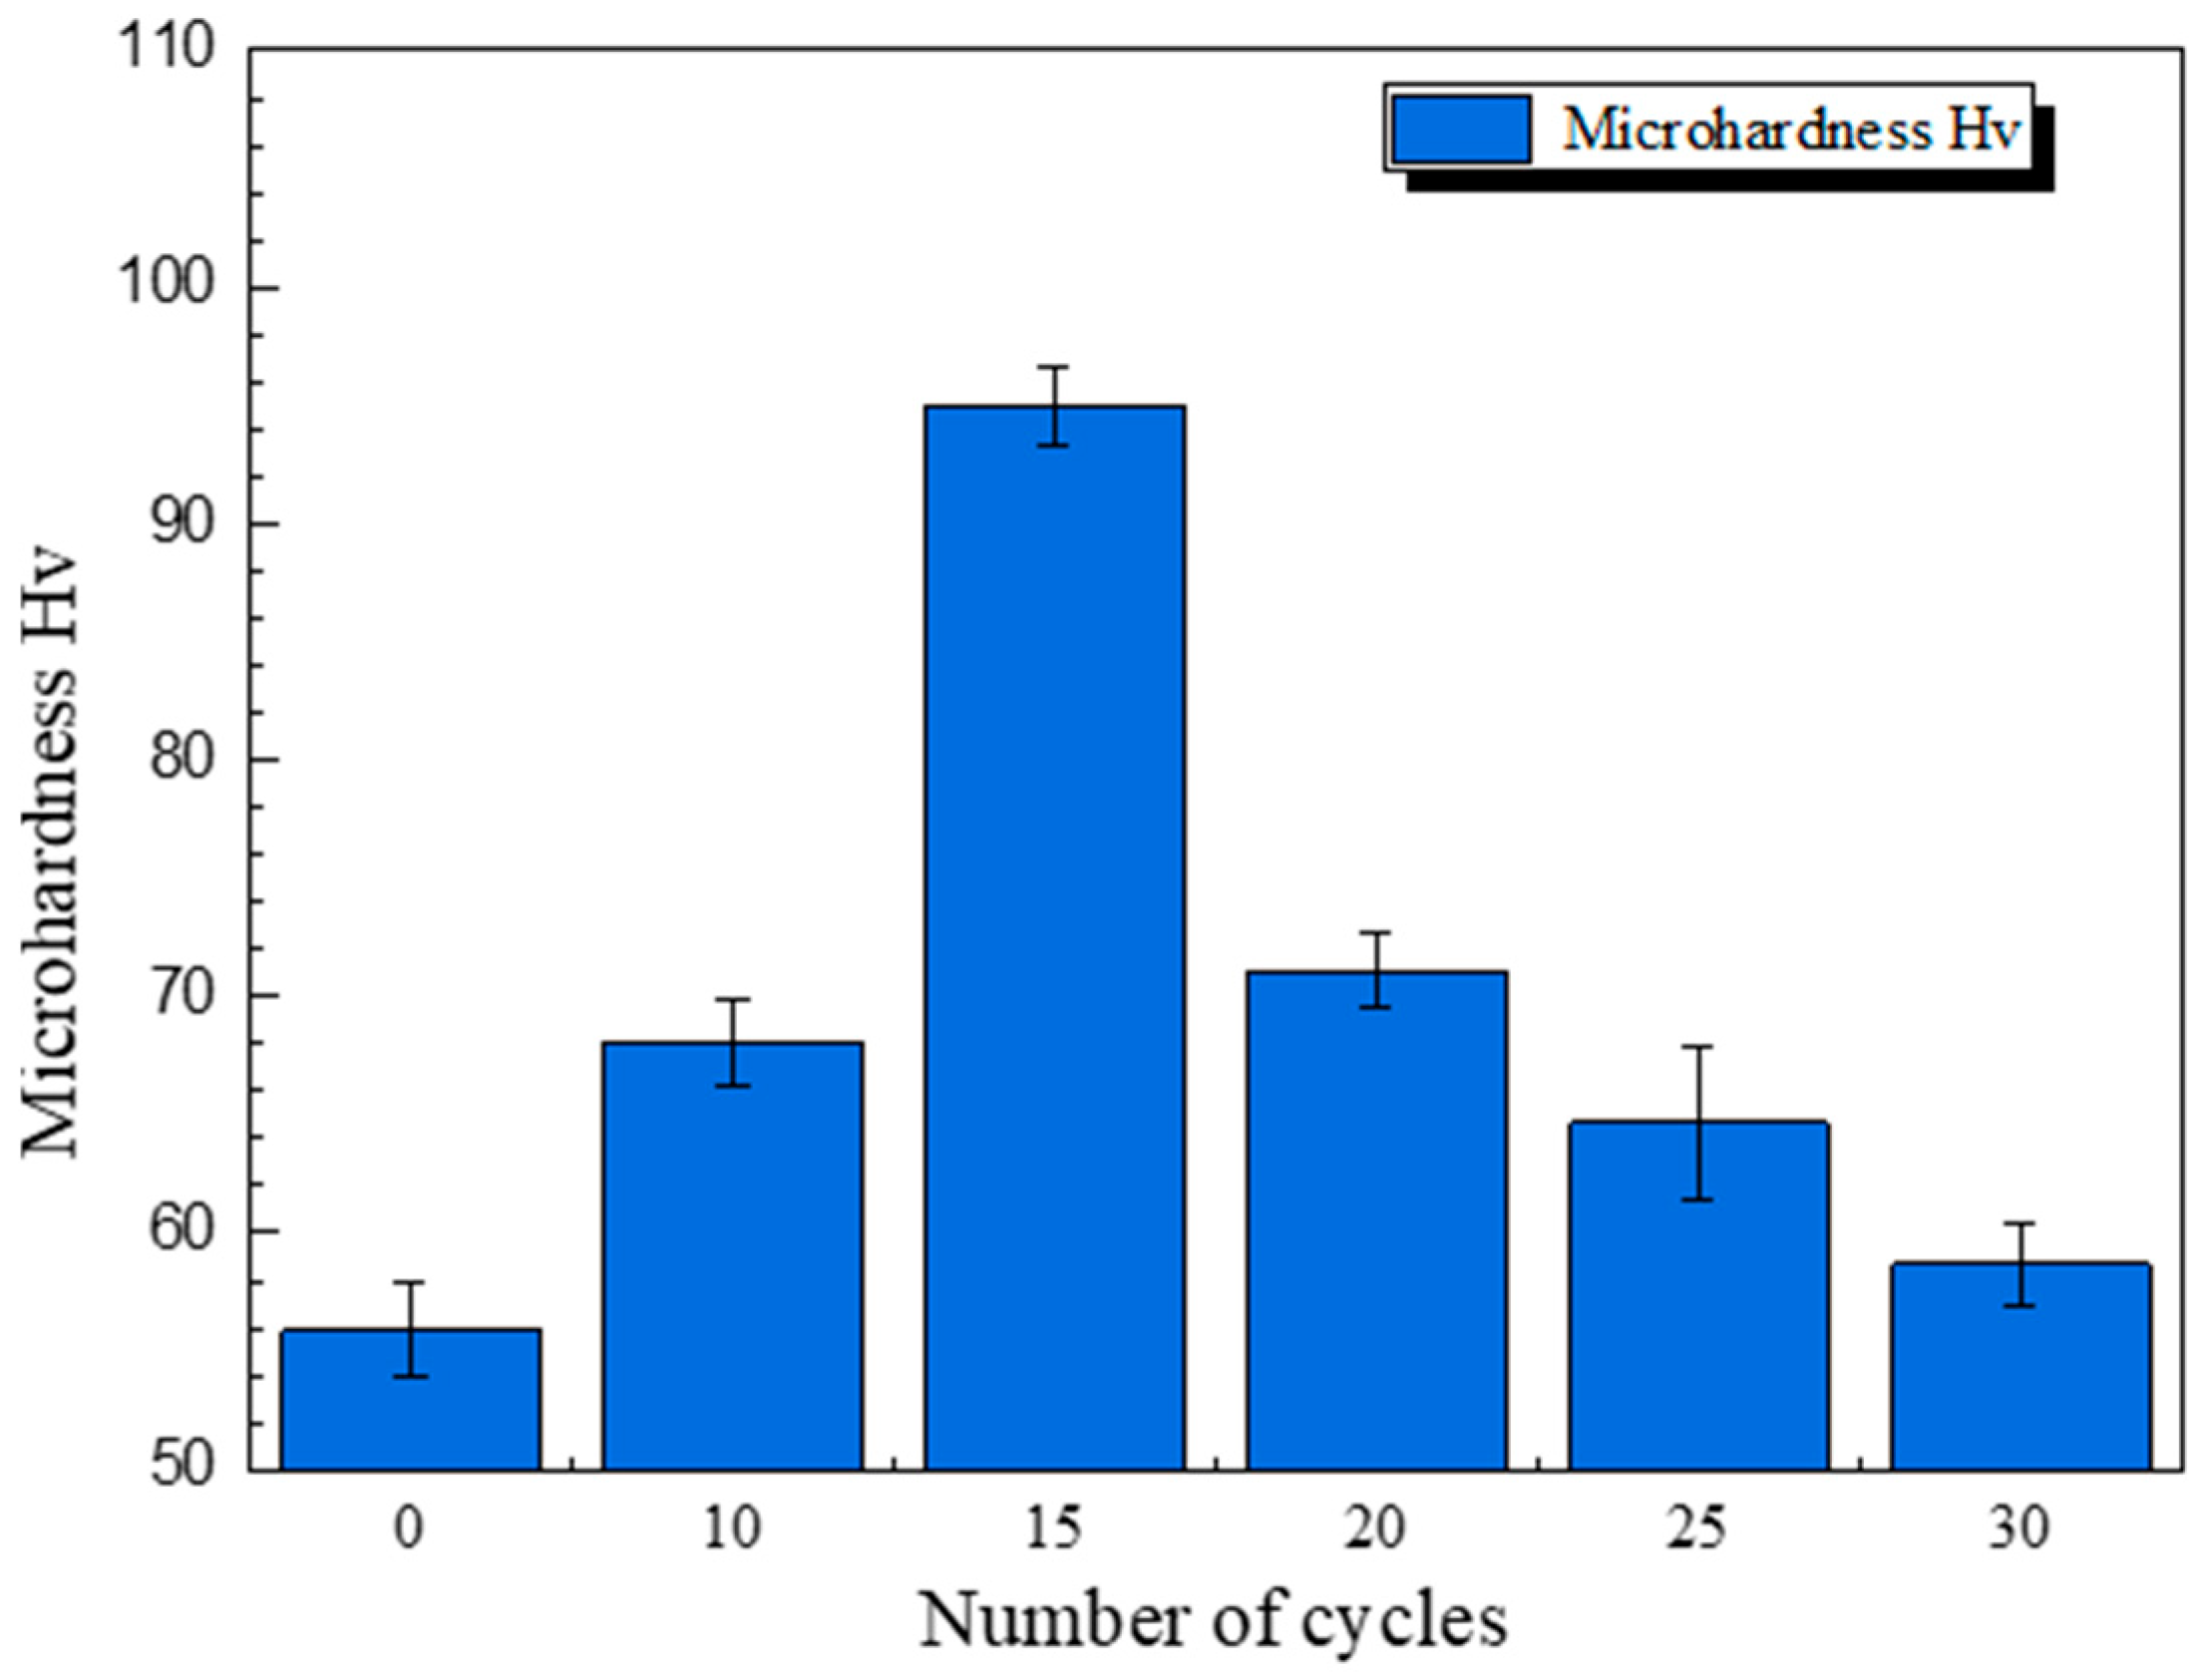
To examine the influence of increasing PbS layers on the hardness of TiO2, Vickers microhardness tests were carried out, and the results are presented in Table 3 and Figure 7.
Table 3 and Figure 7 highlight that pure TiO2 exhibits a hardness of 55.9 Hv, the lowest among the samples. The hardness increases with an increasing number of PbS deposition cycles, reaching a peak of 94.96 Hv after 15 cycles. This observation suggests that the incorporation of PbS leads to a significant improvement in the hardness of the composite material, resulting from the penetration of the PbS nanoparticles into the porous structure of the TiO2 nanotubes and thus forming interpenetrating heterojunctions [18]. However, beyond 20 cycles of PbS, the microhardness begins to decrease, reaching 71.1 Hv at 20 cycles, then 64.67 Hv at 25 cycles, and finally 58.86 Hv at 30 cycles. This progressive decrease is attributable to the increase in the grain size of the PbS NPs (Table 2). This relationship between grain size and microhardness is in agreement with the Hall-Petch model, which describes an increase in hardness as grain size decreases [19].

3.2. Determination of Critical Loads

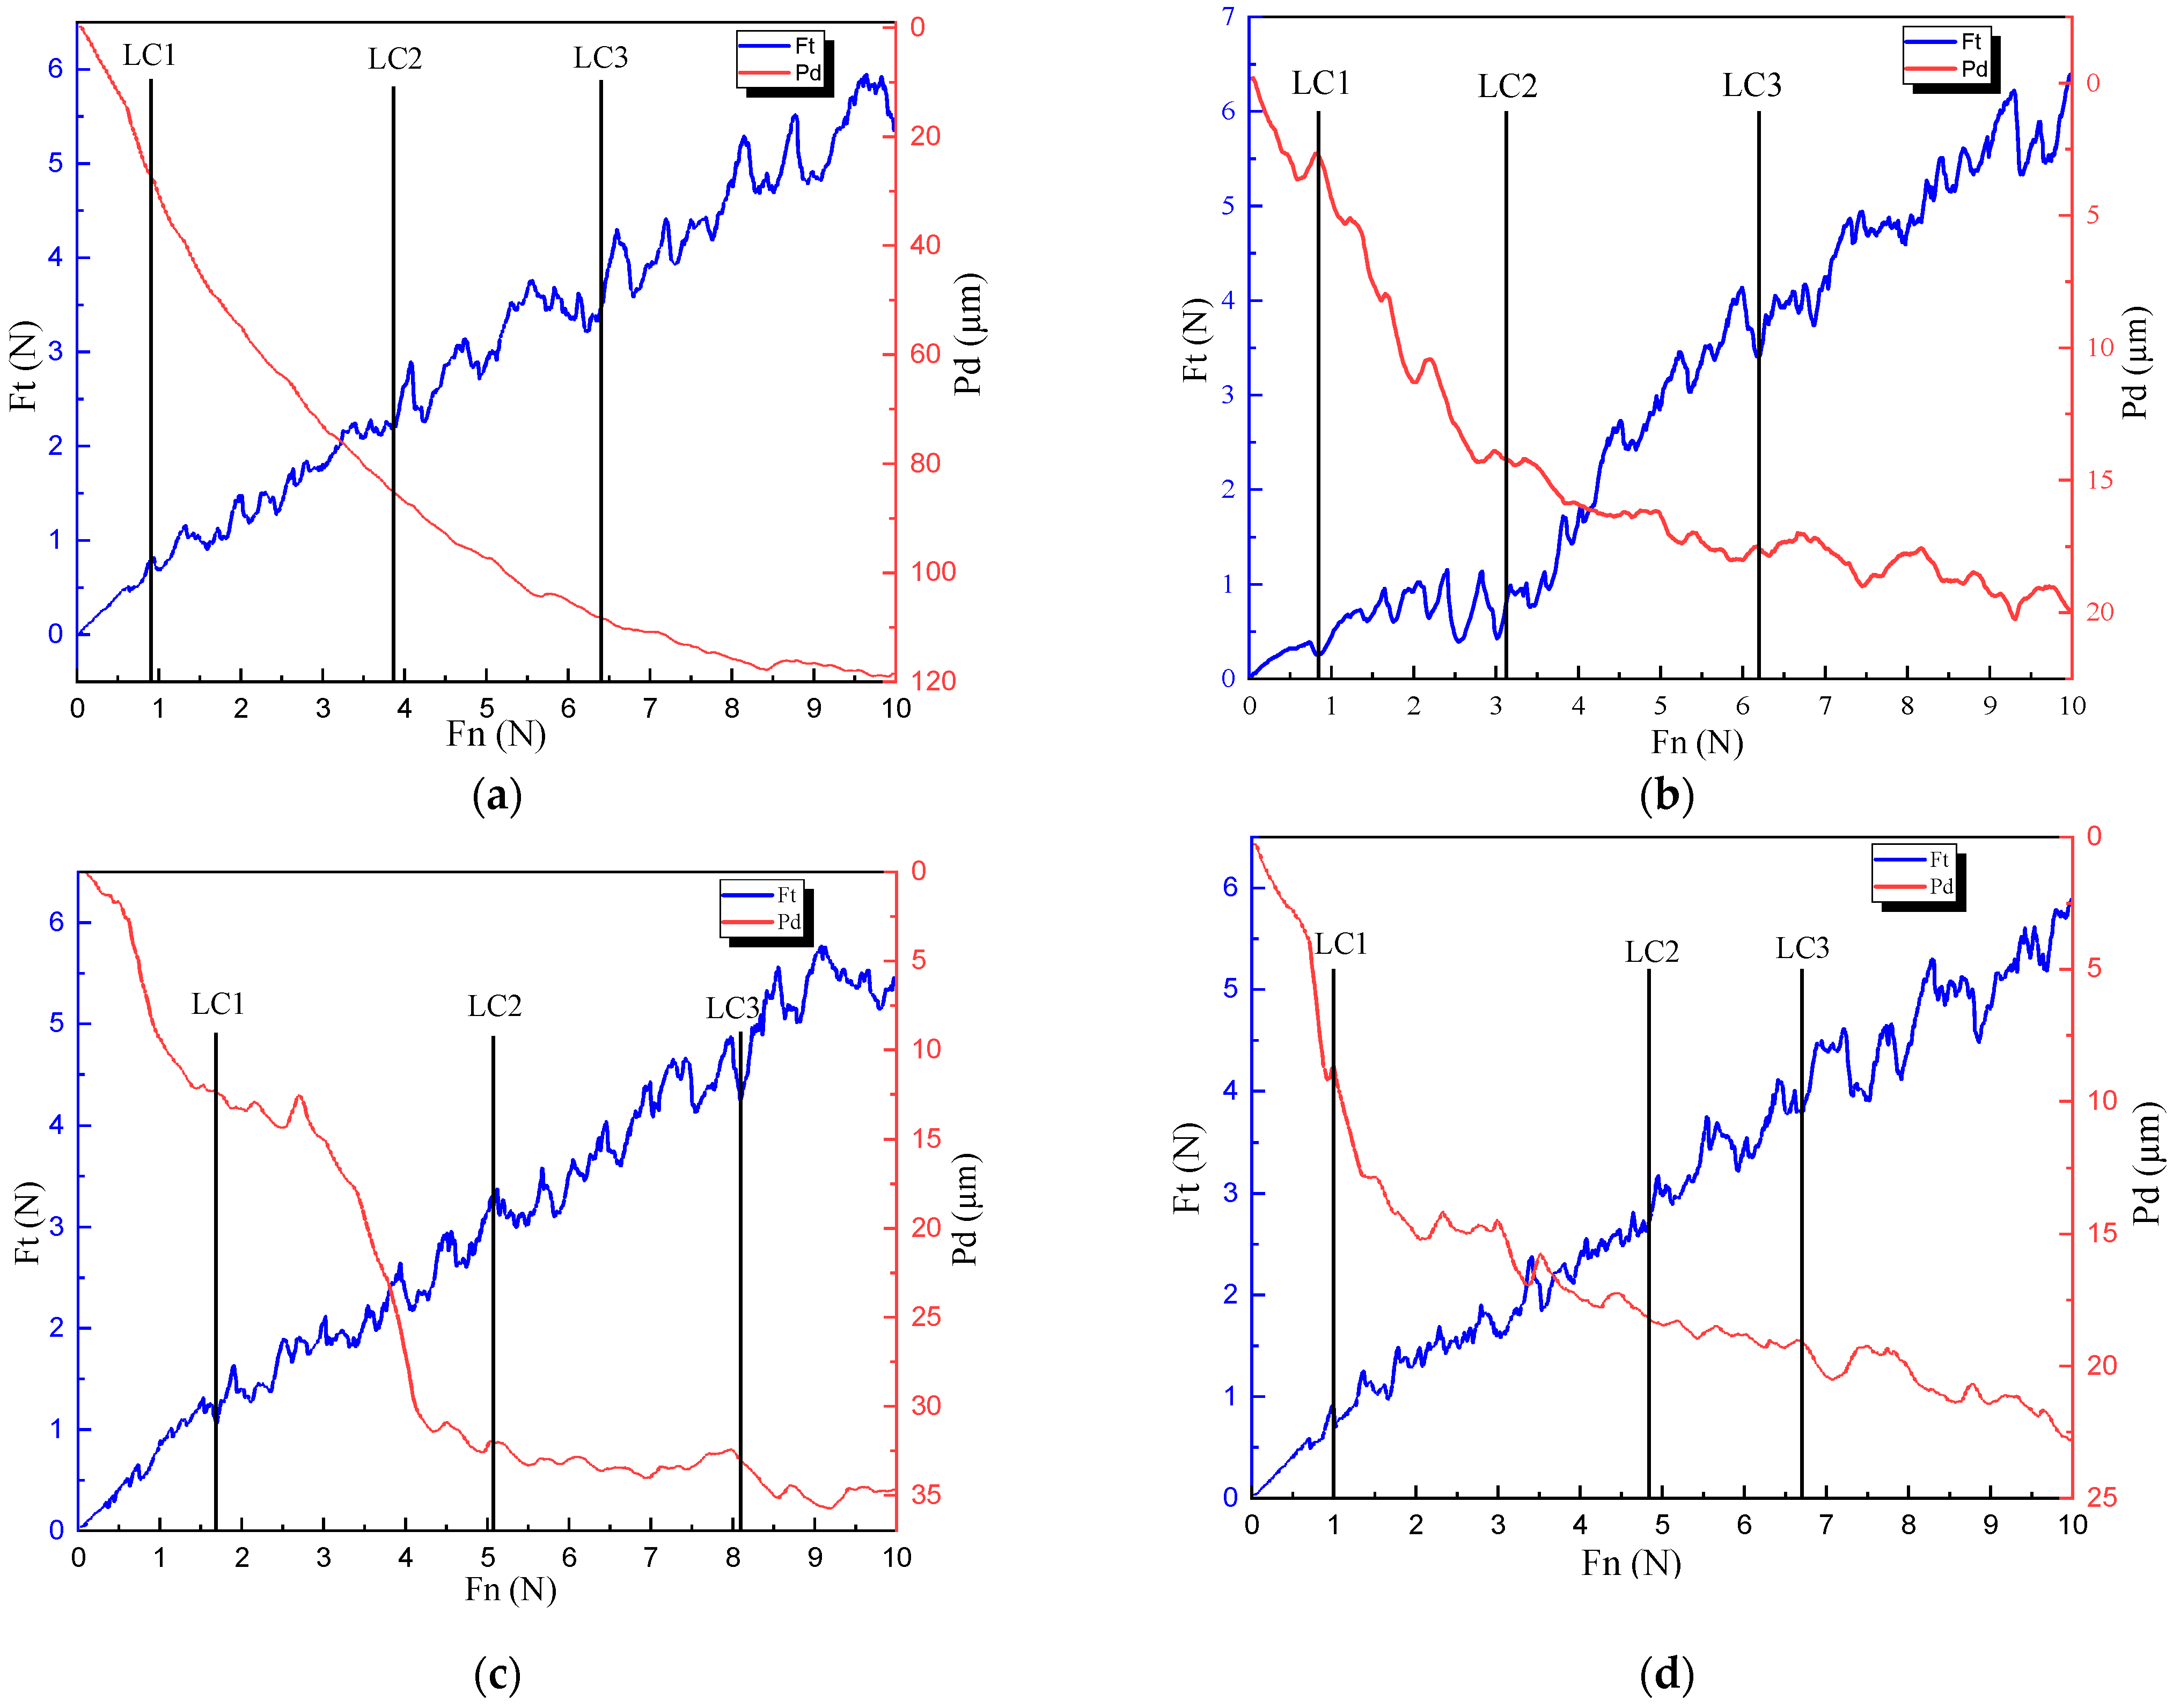
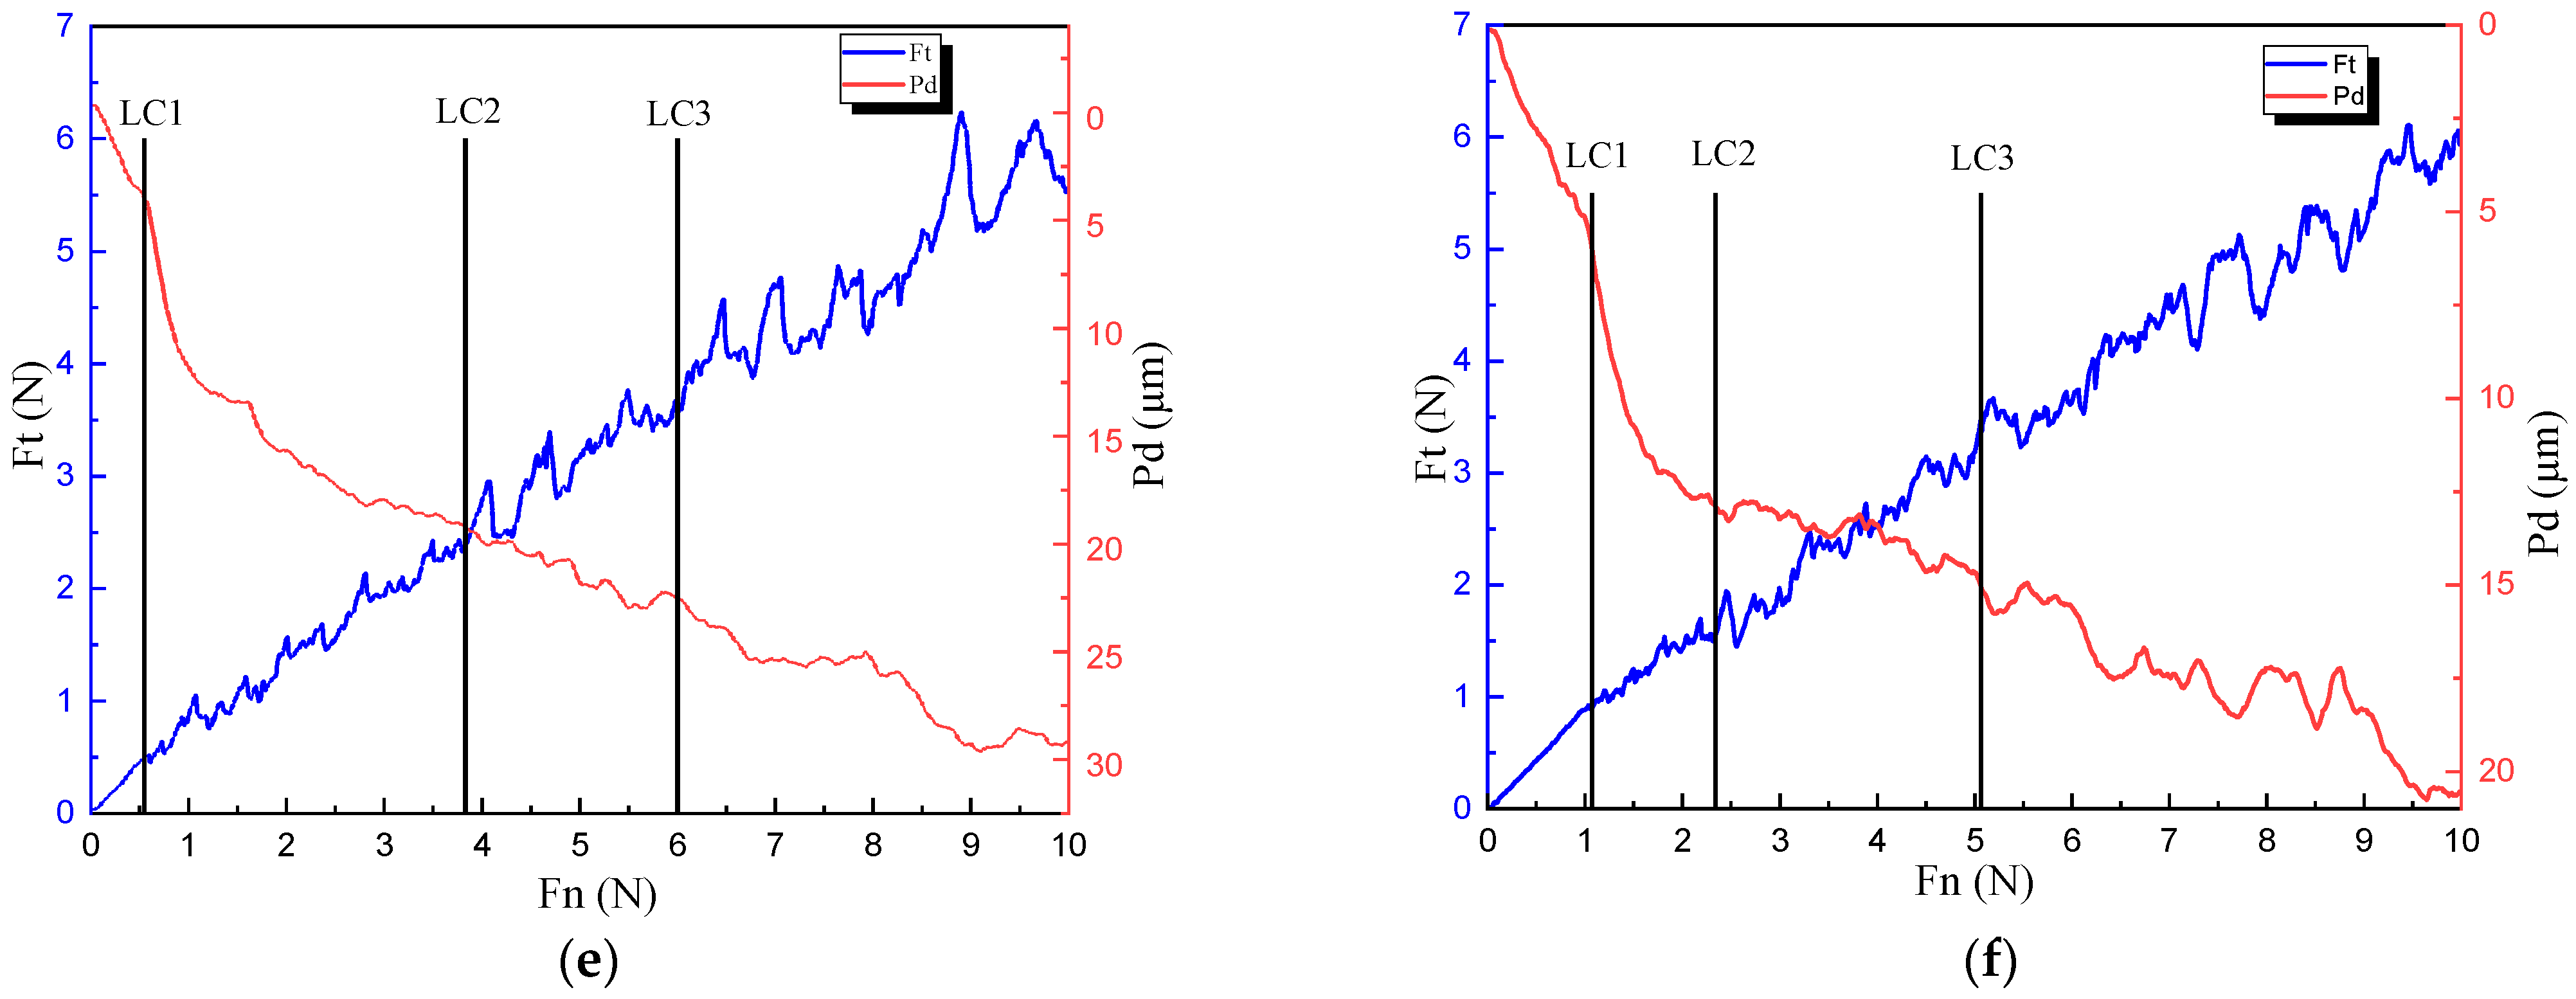
Figure 8 depicts the evolution of the tangential force as a function of the applied normal load, as well as the evolution of the indenter penetration depth on TiO2 nanotubes before and after the deposition of PbS nanoparticles obtained by SILAR. As the normal load is progressively increased, the slopes of the friction curves change, and cracks appear under critical loads [20,21,22].
Table 4 summarizes the measured critical loads (LC1, LC2, and LC3) for different numbers of cycles of PbS NPs obtained by the SILAR method.
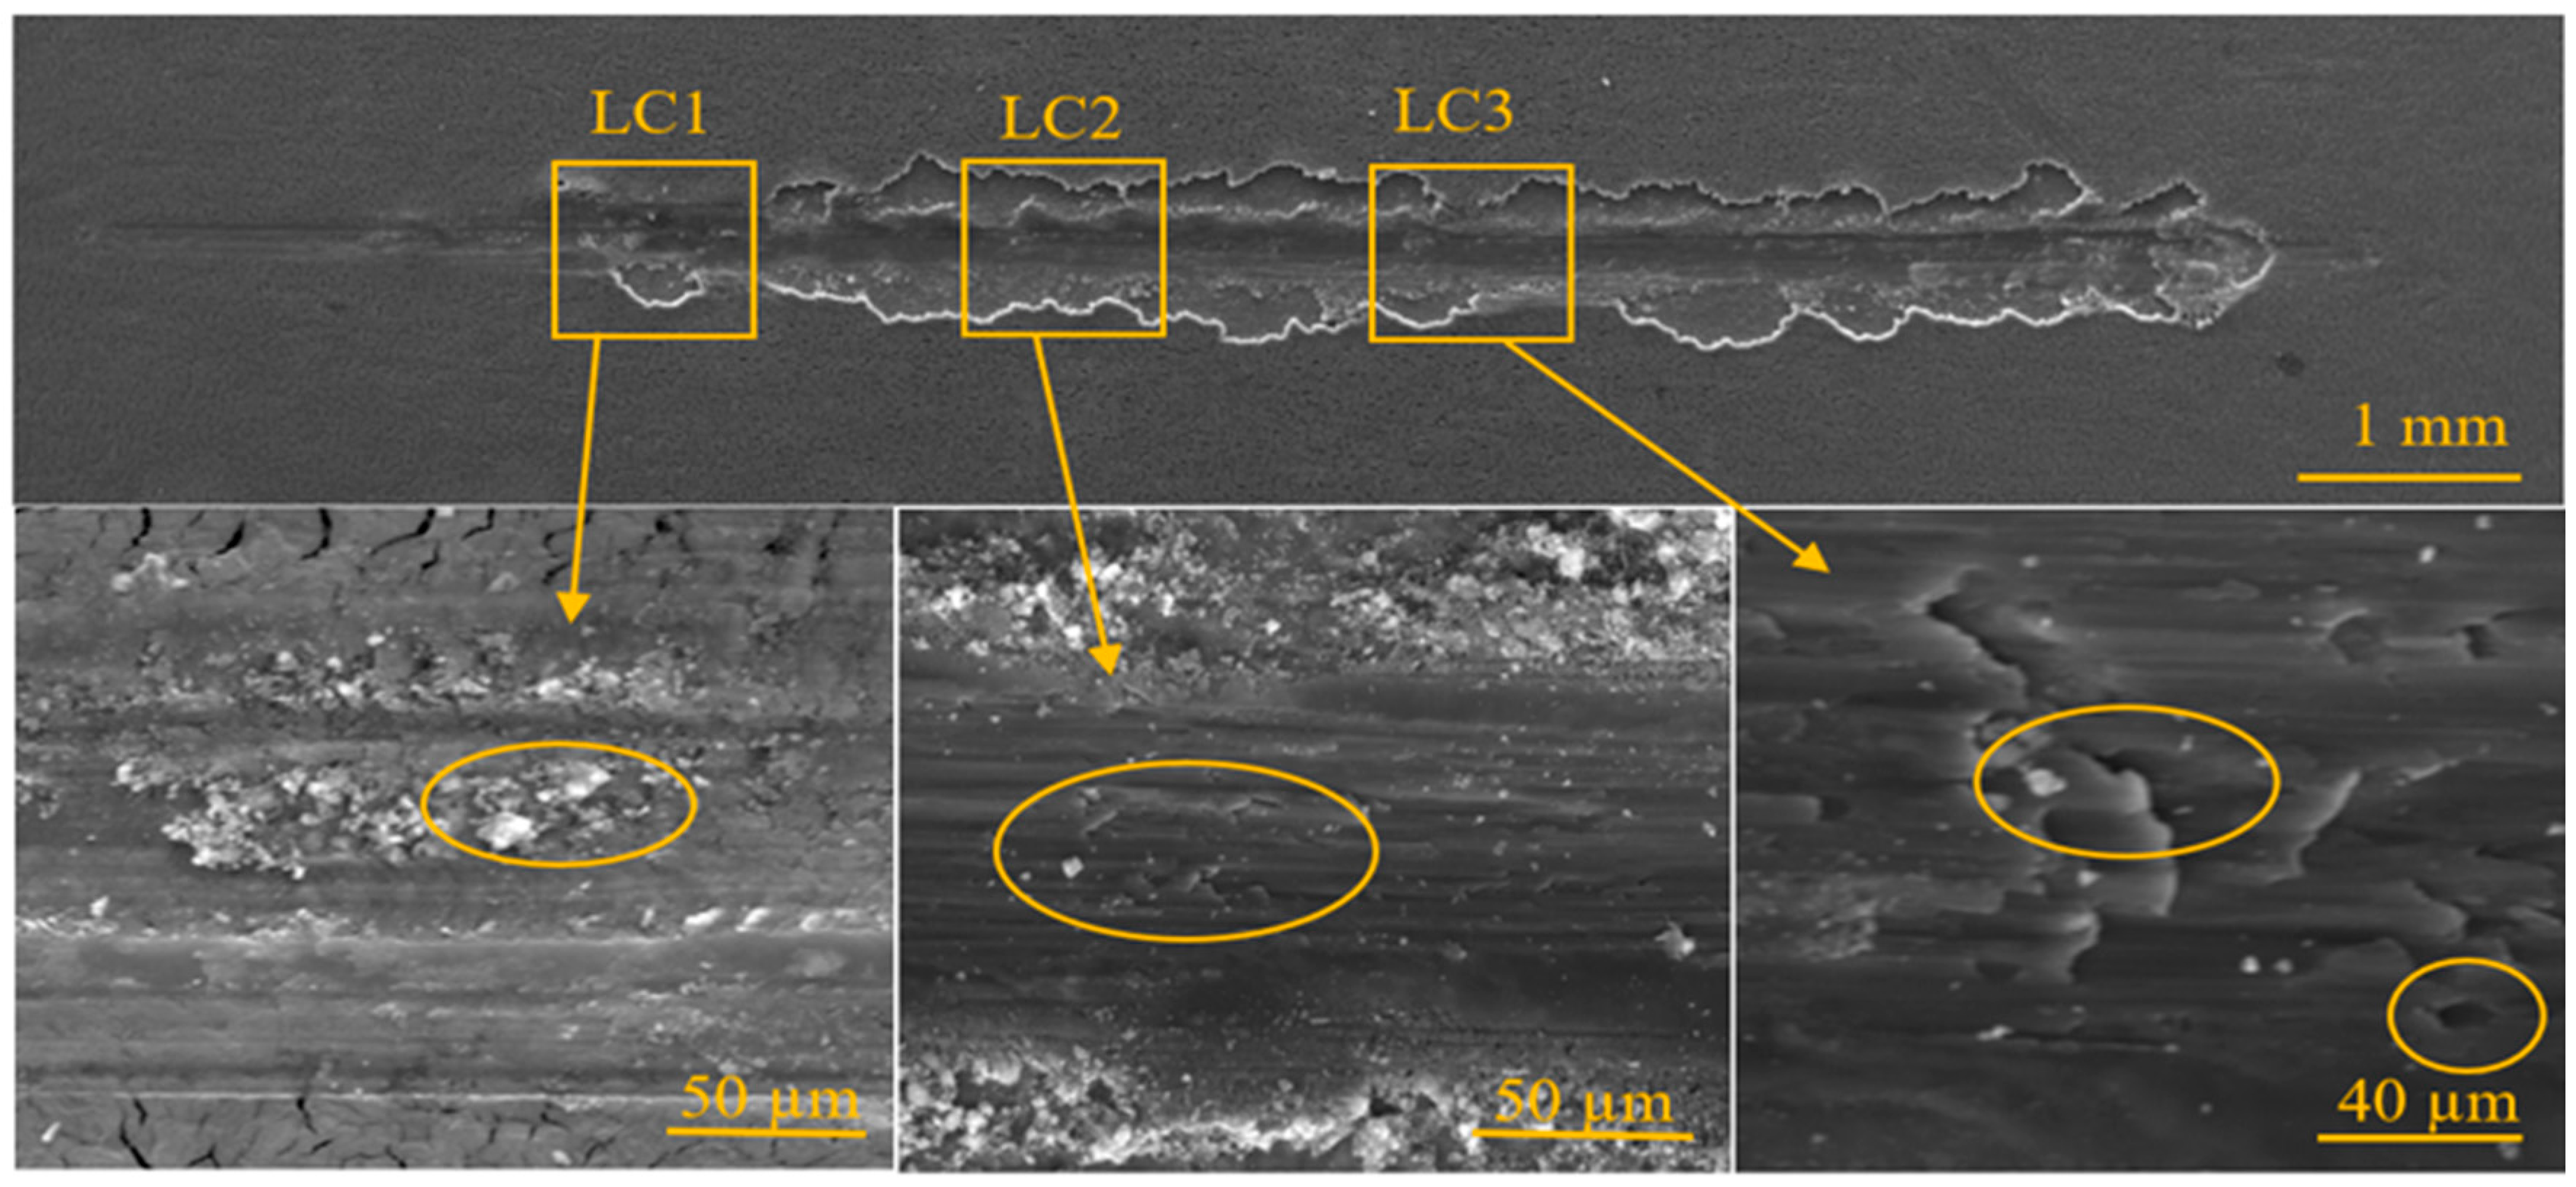
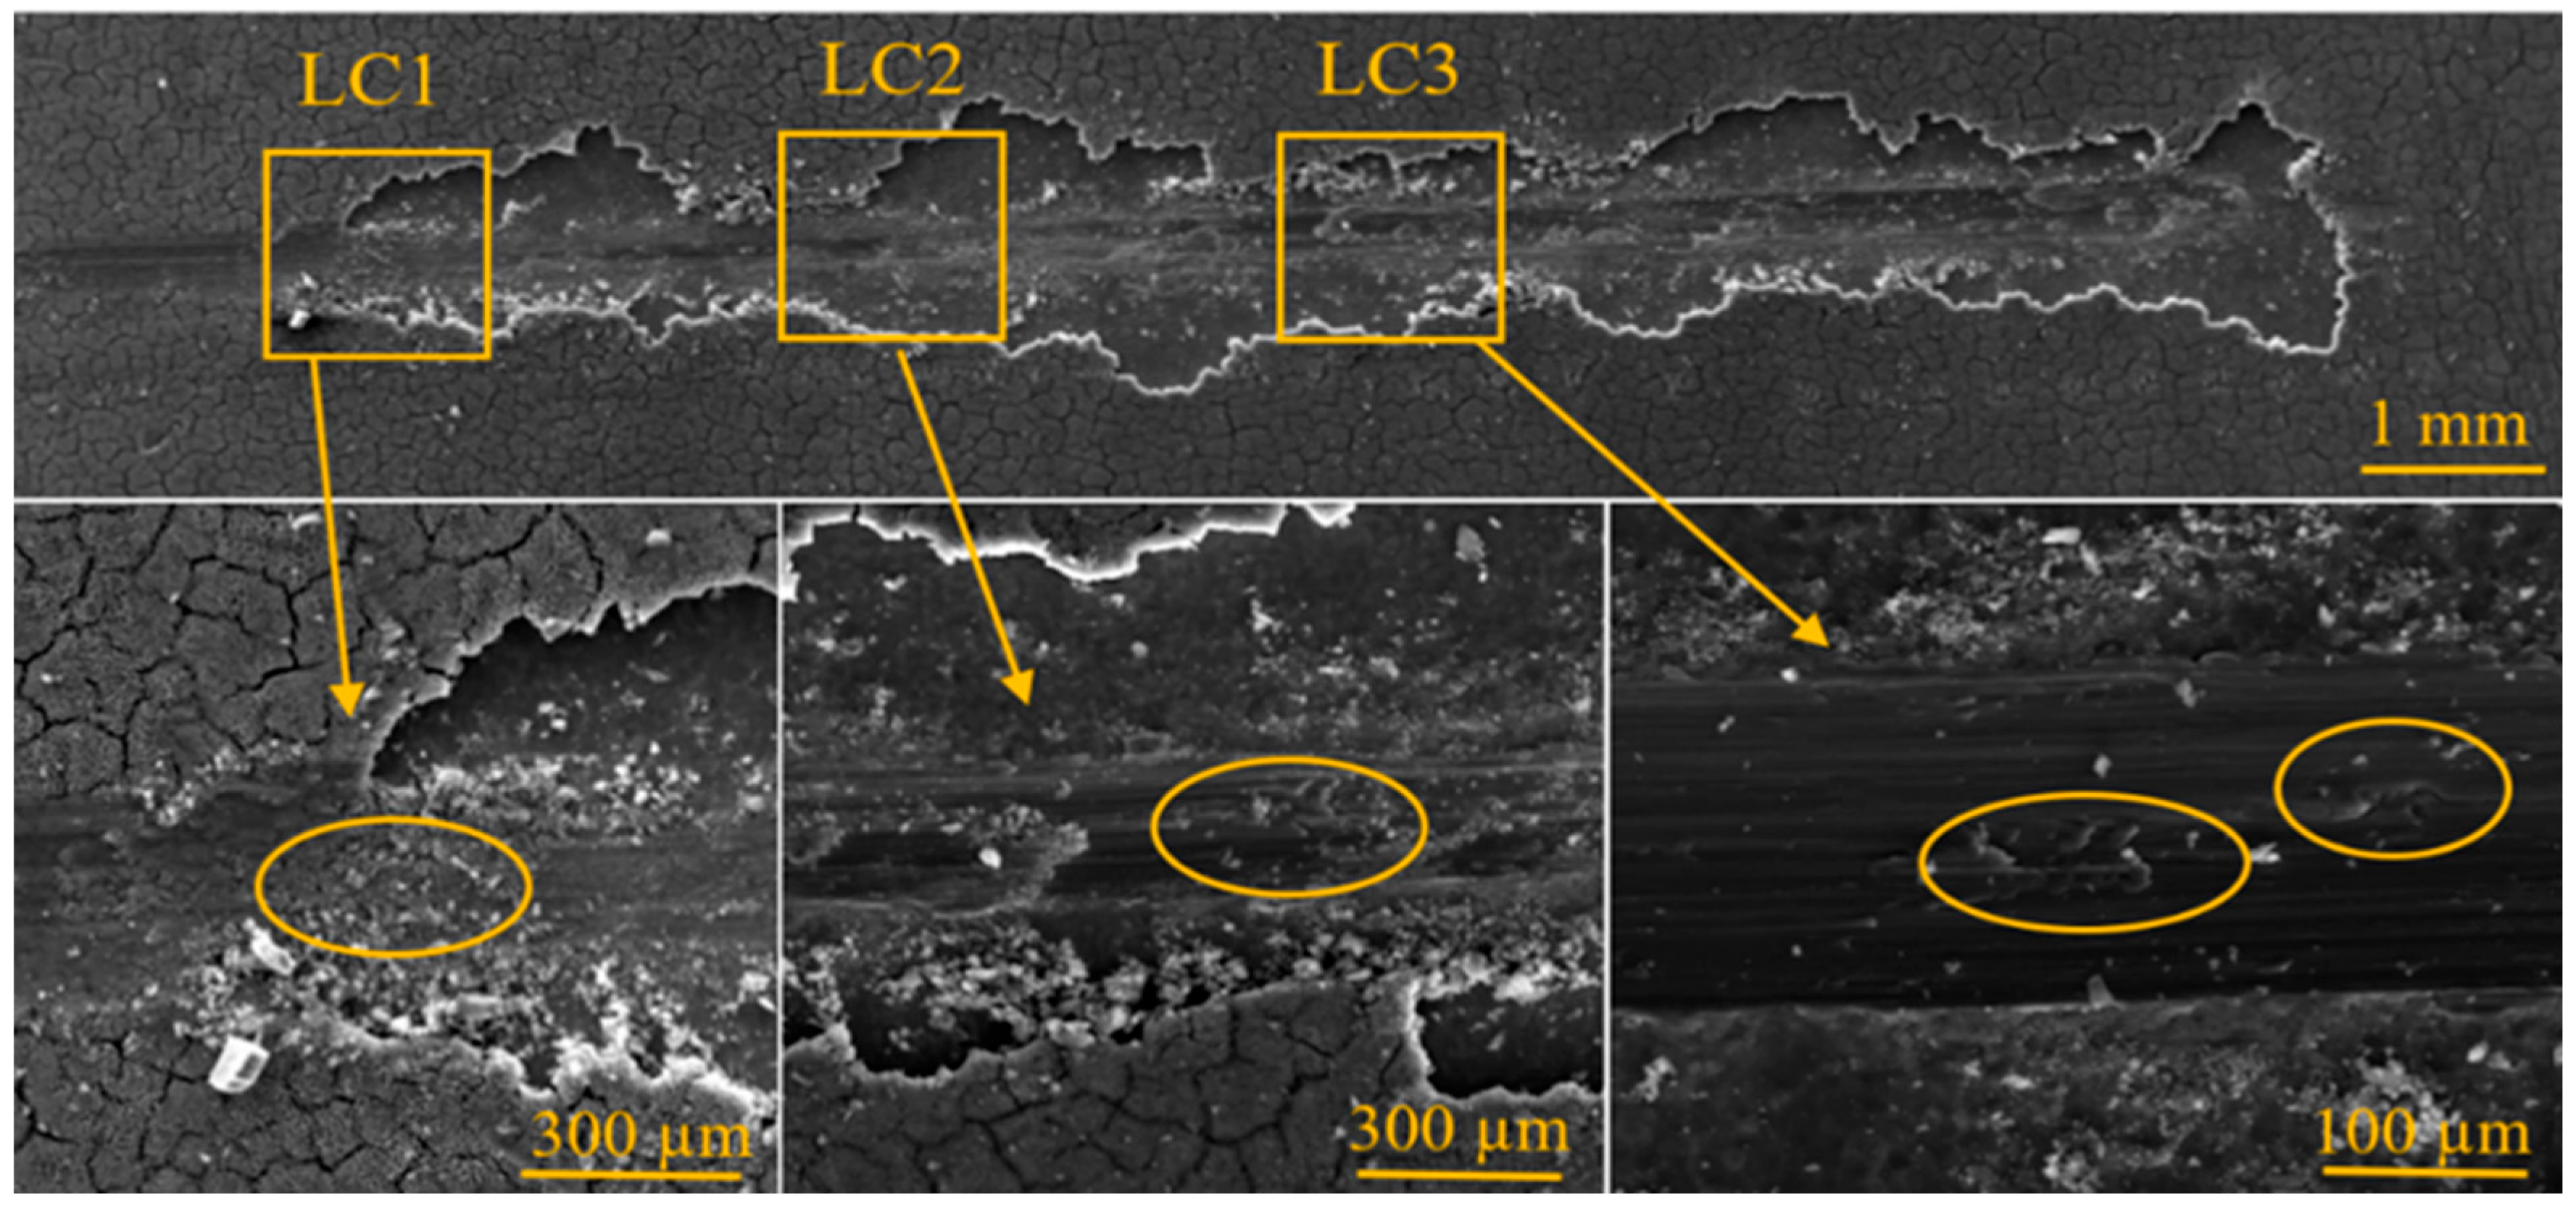
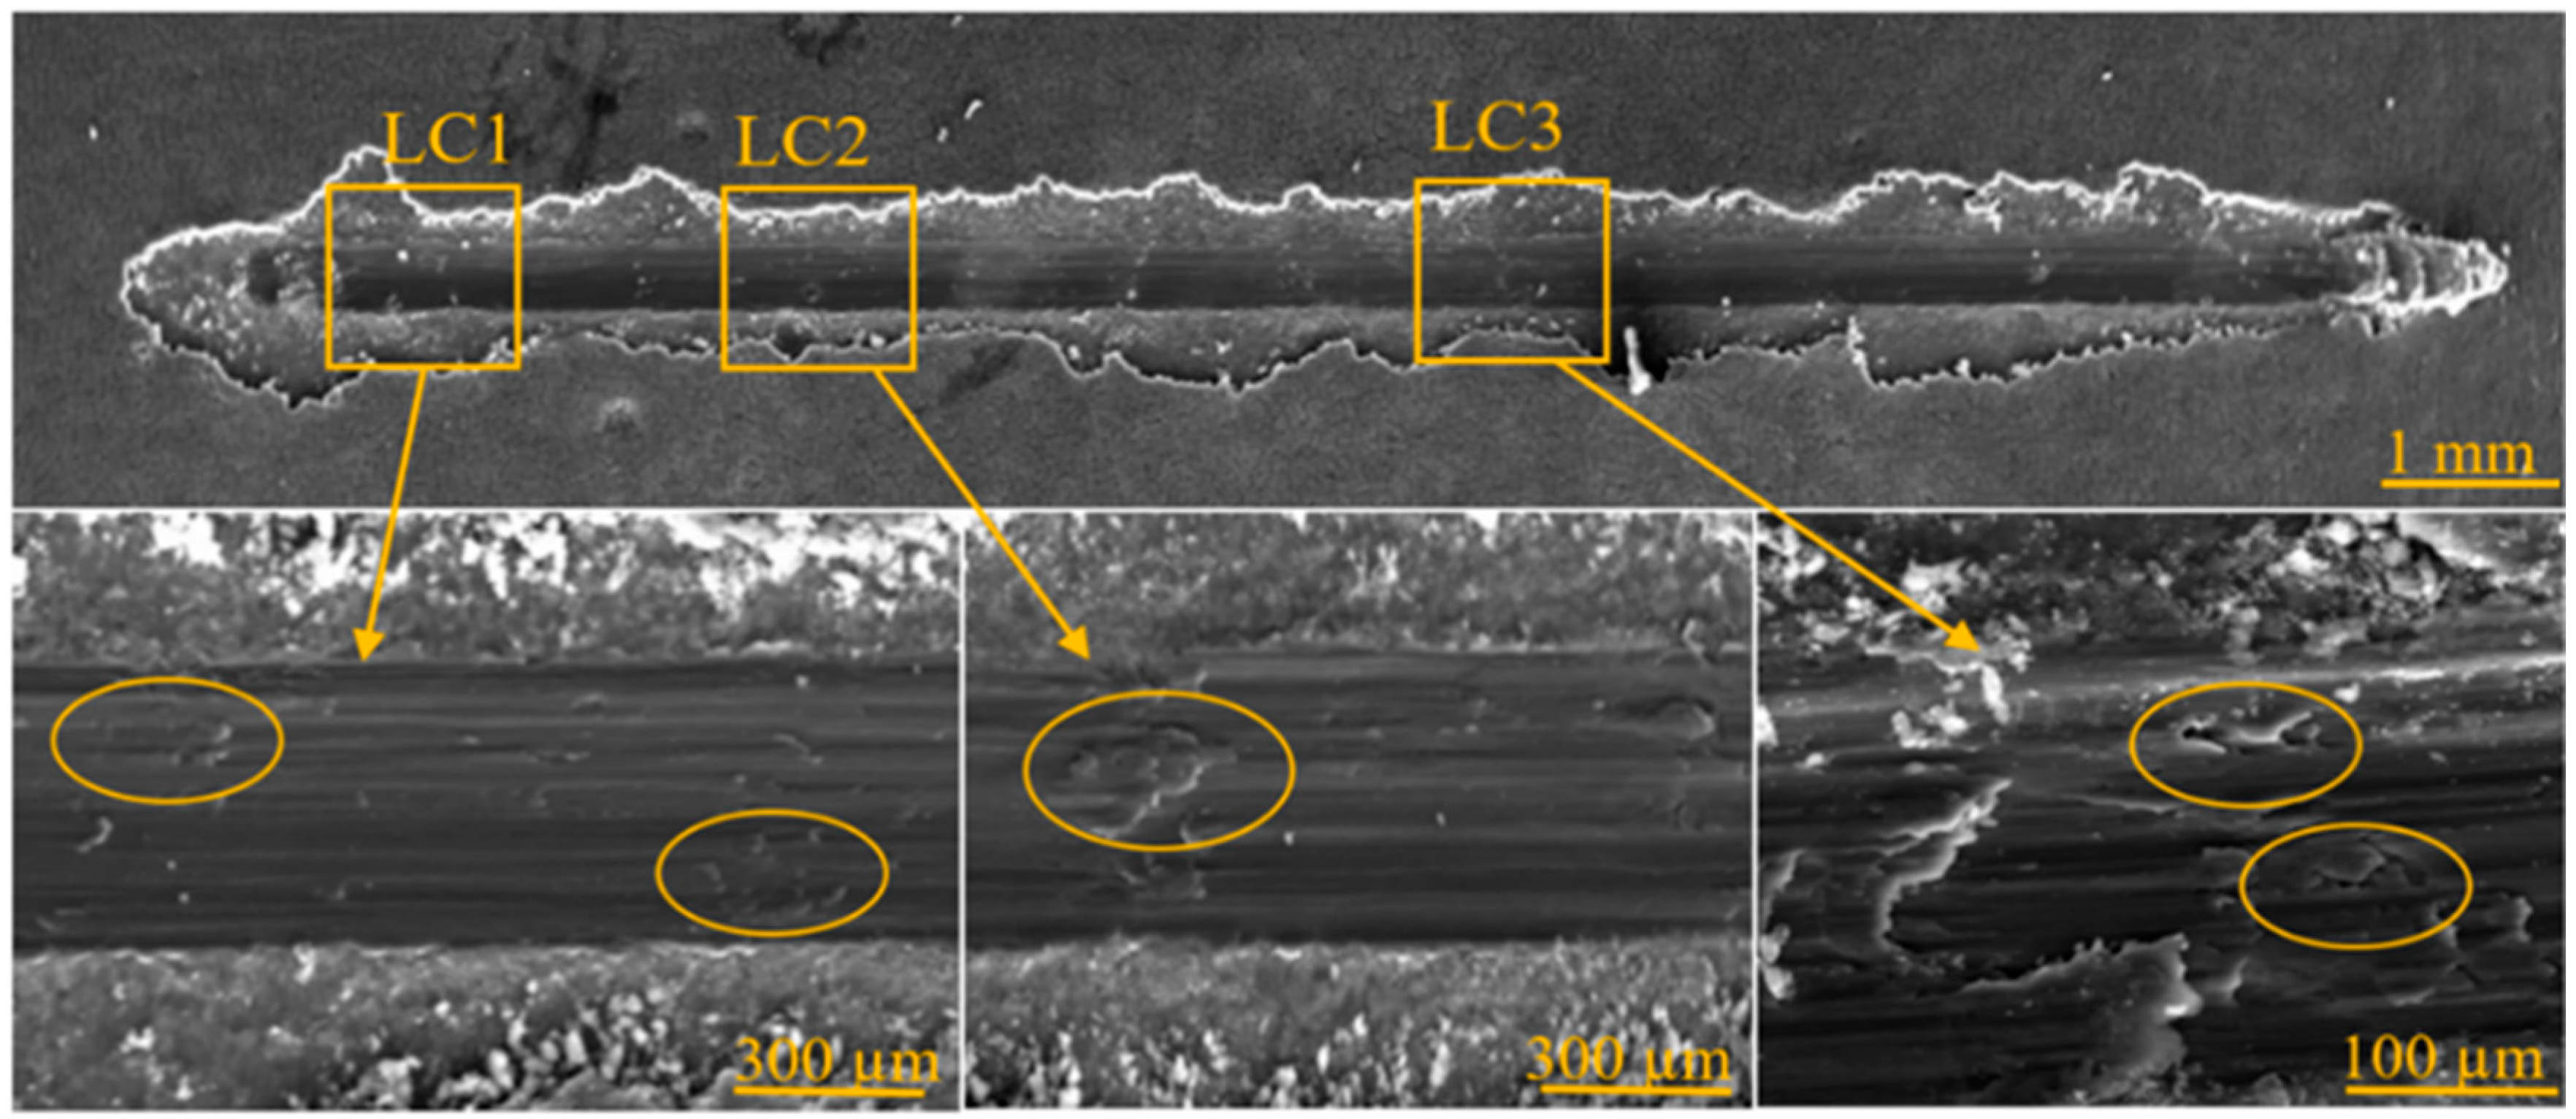
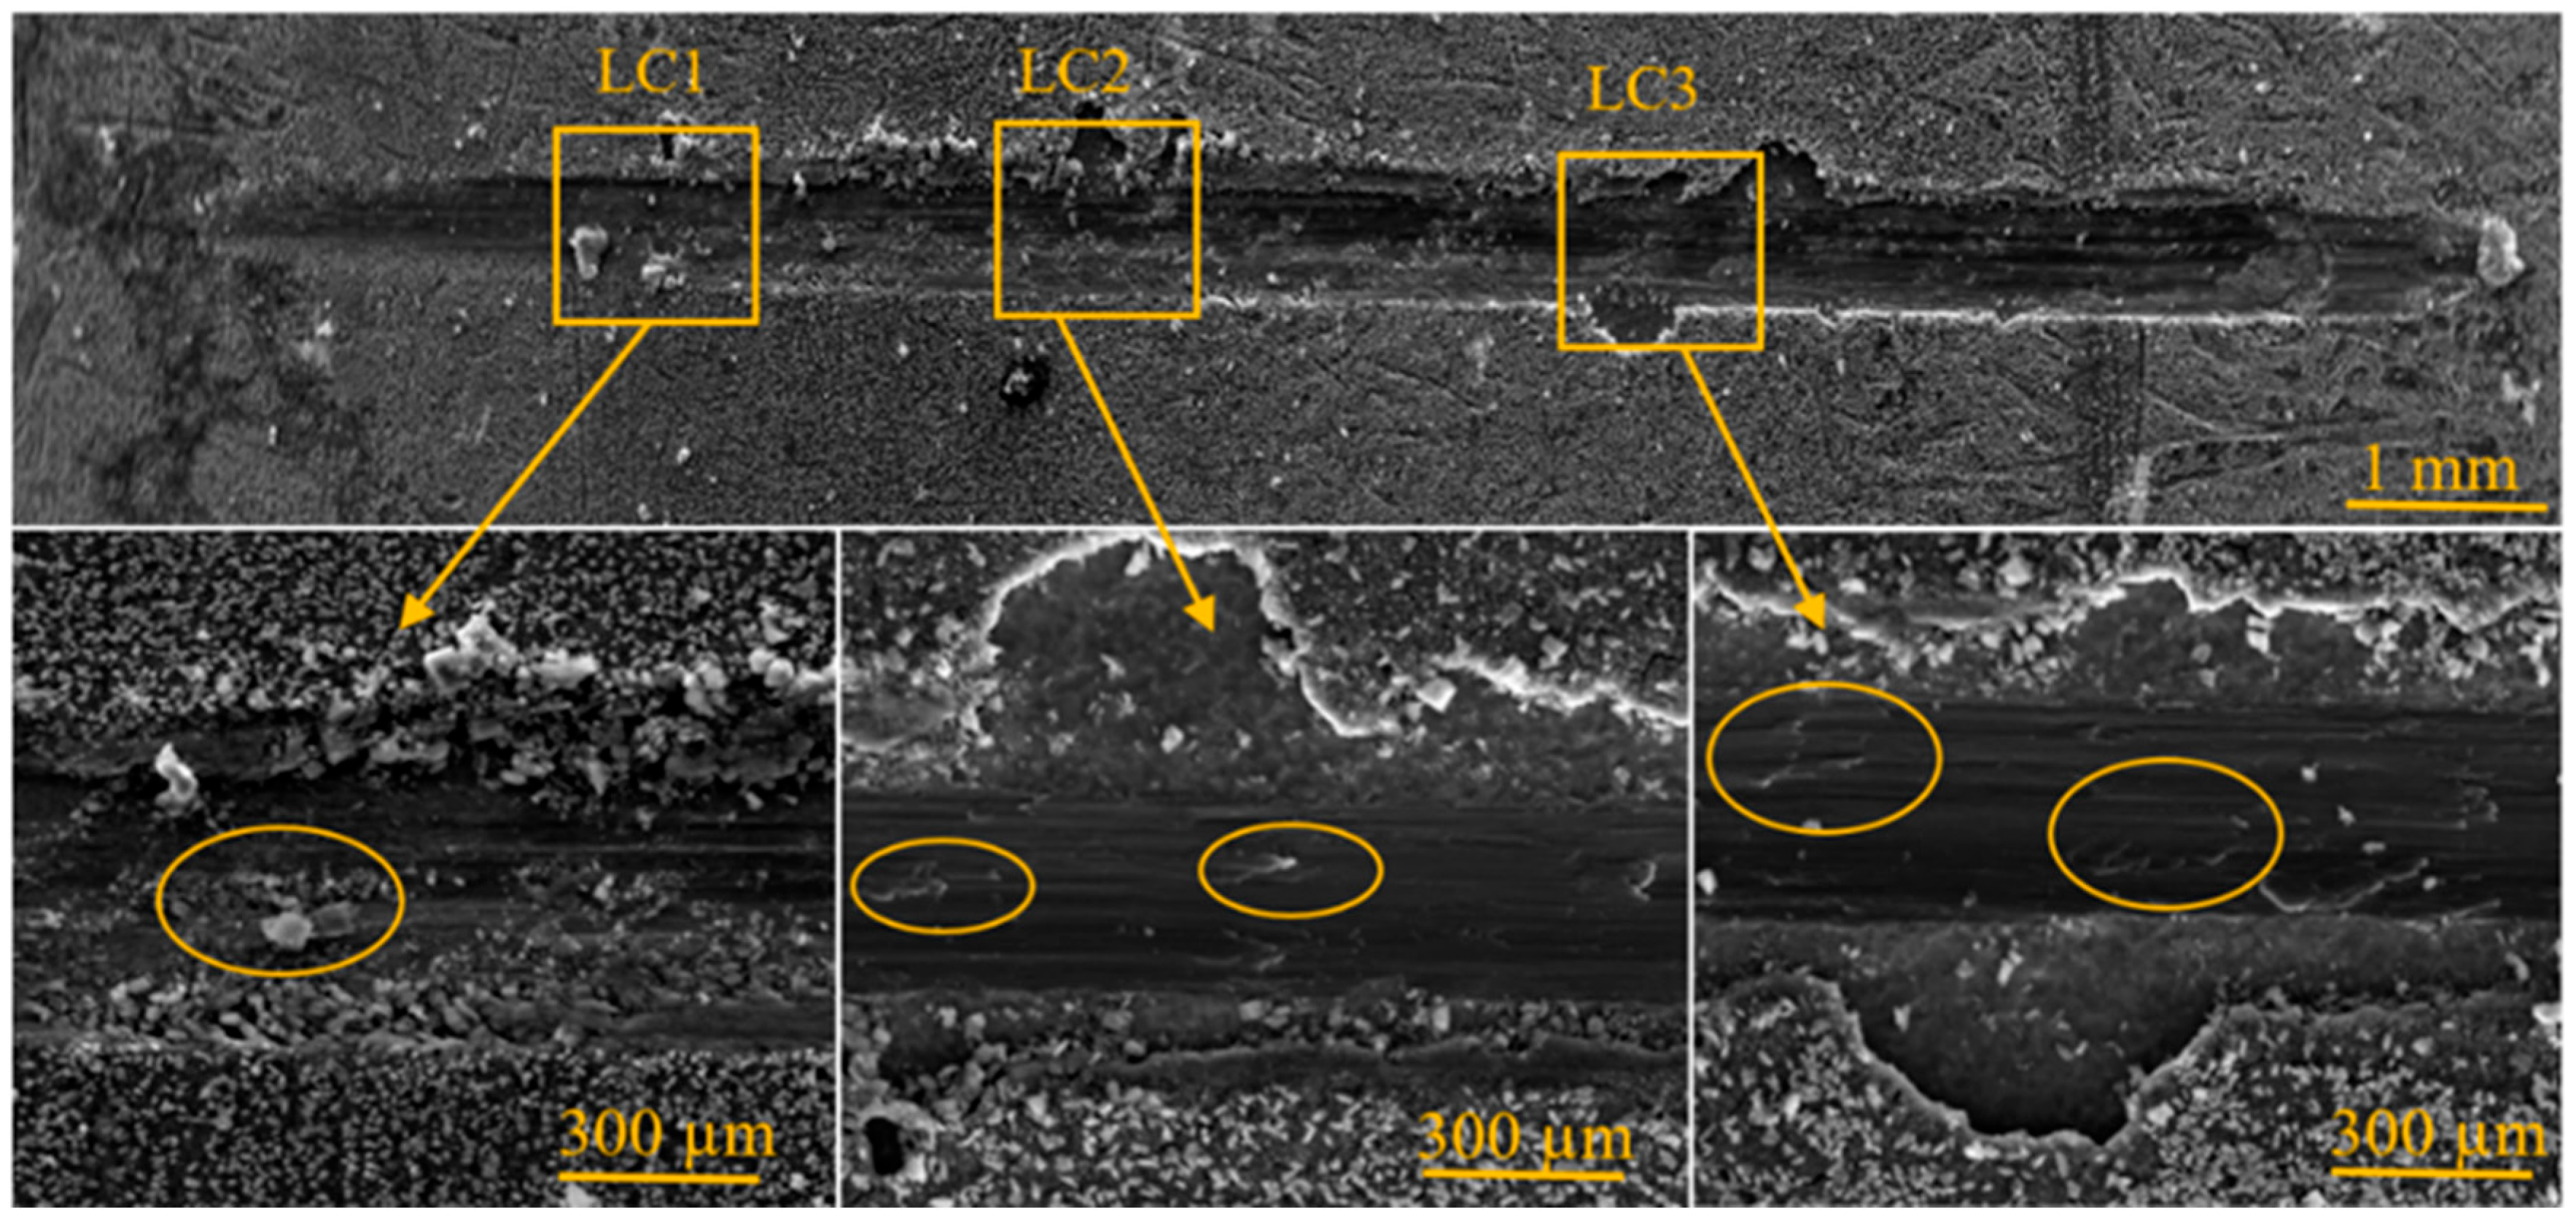
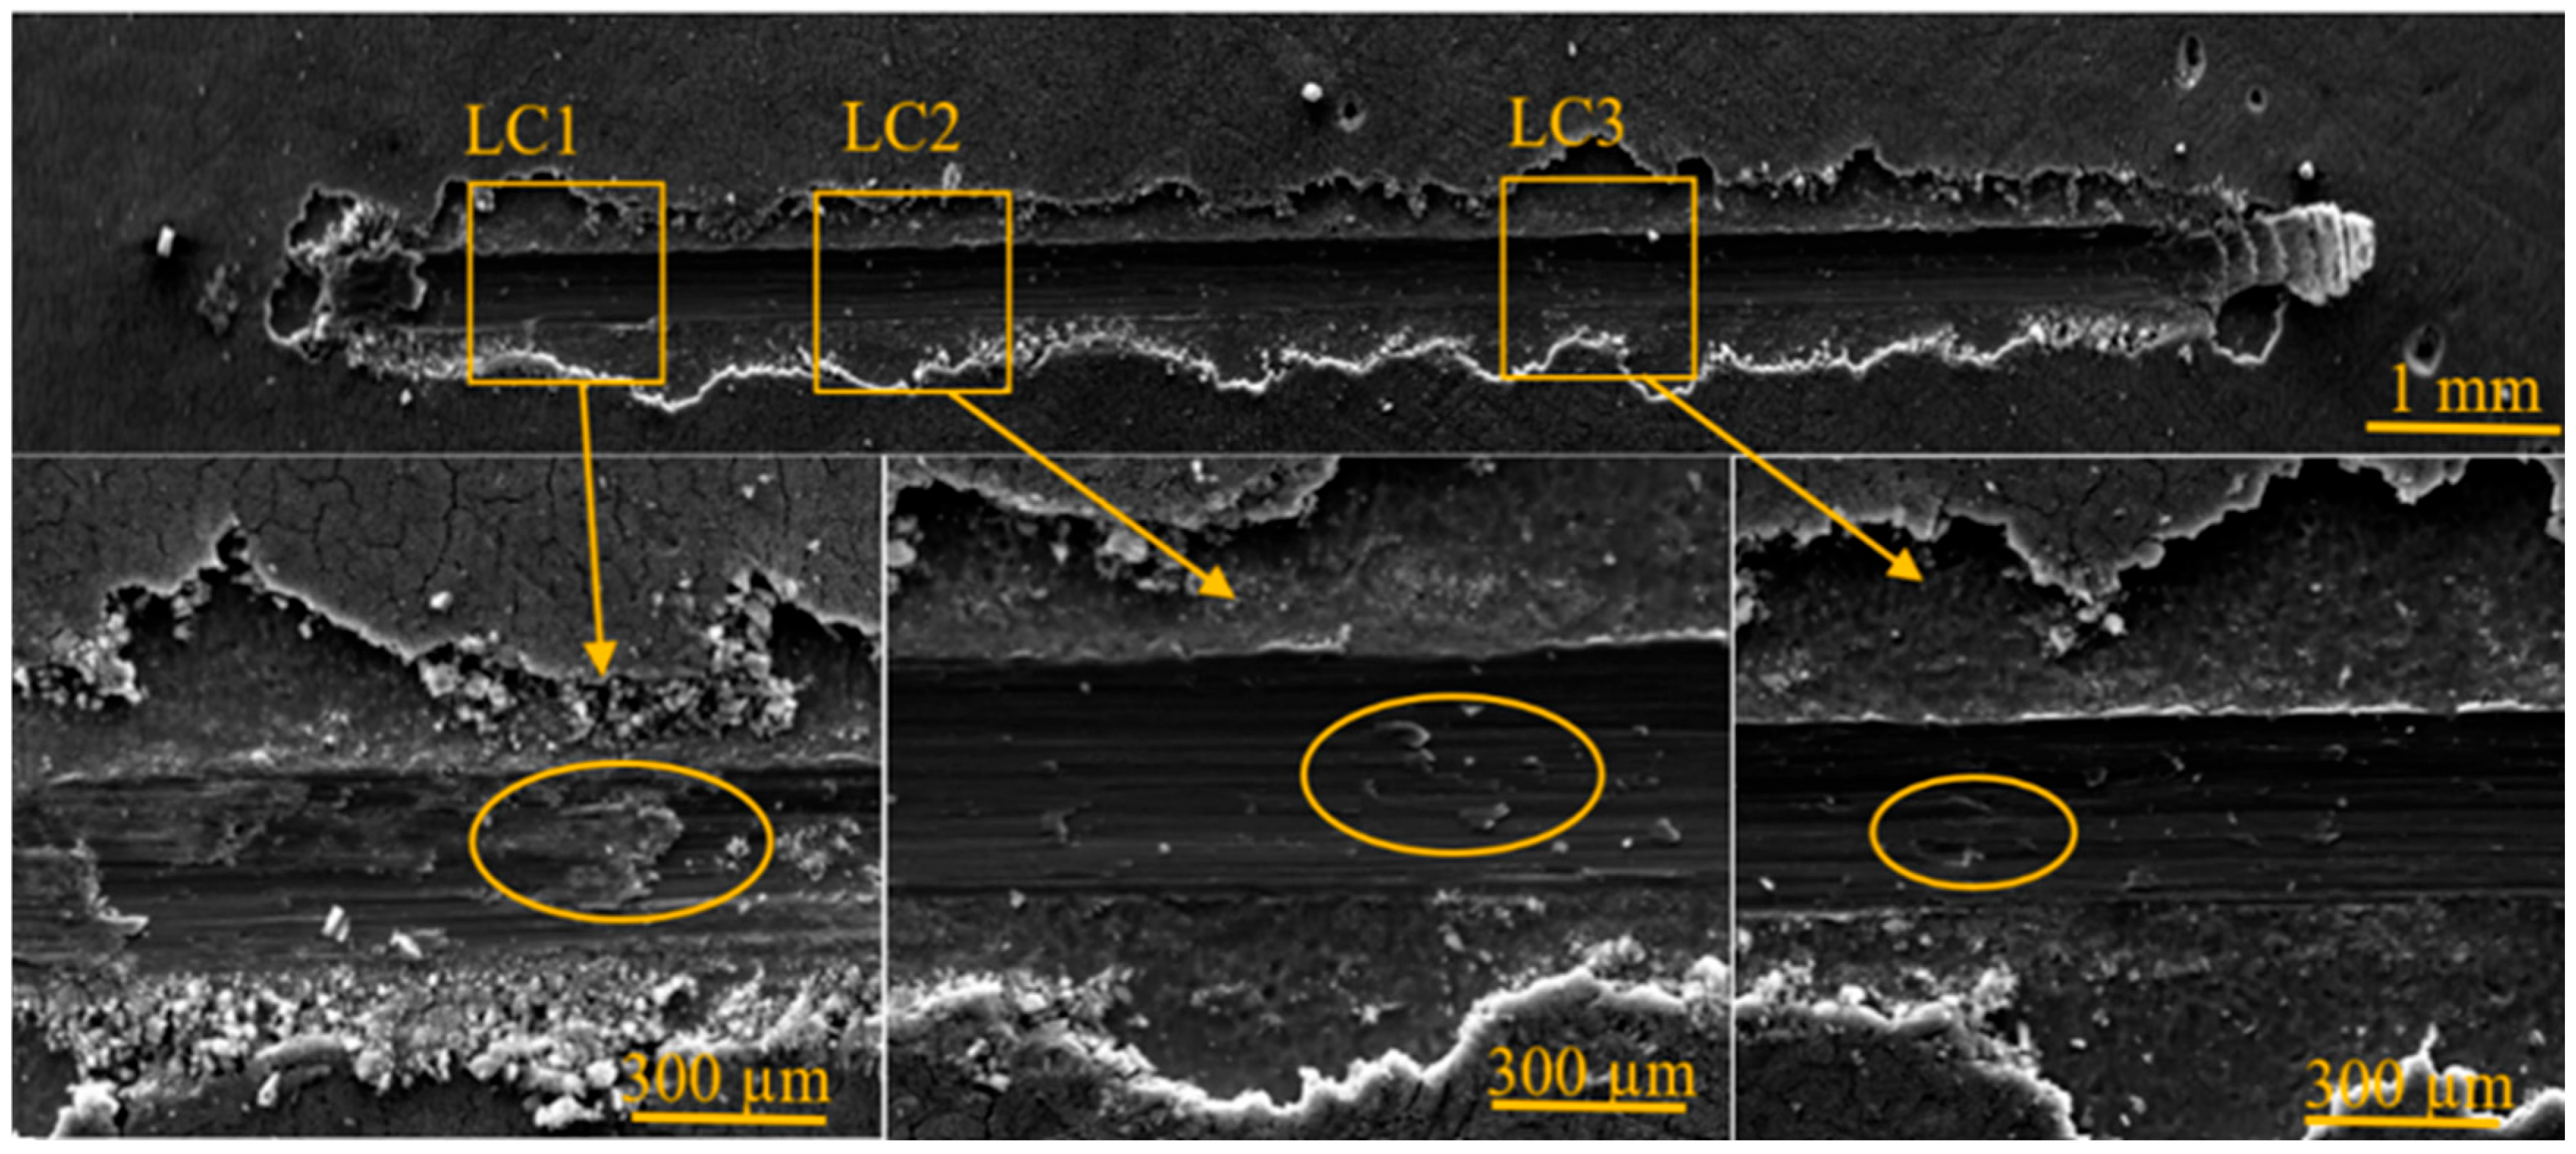
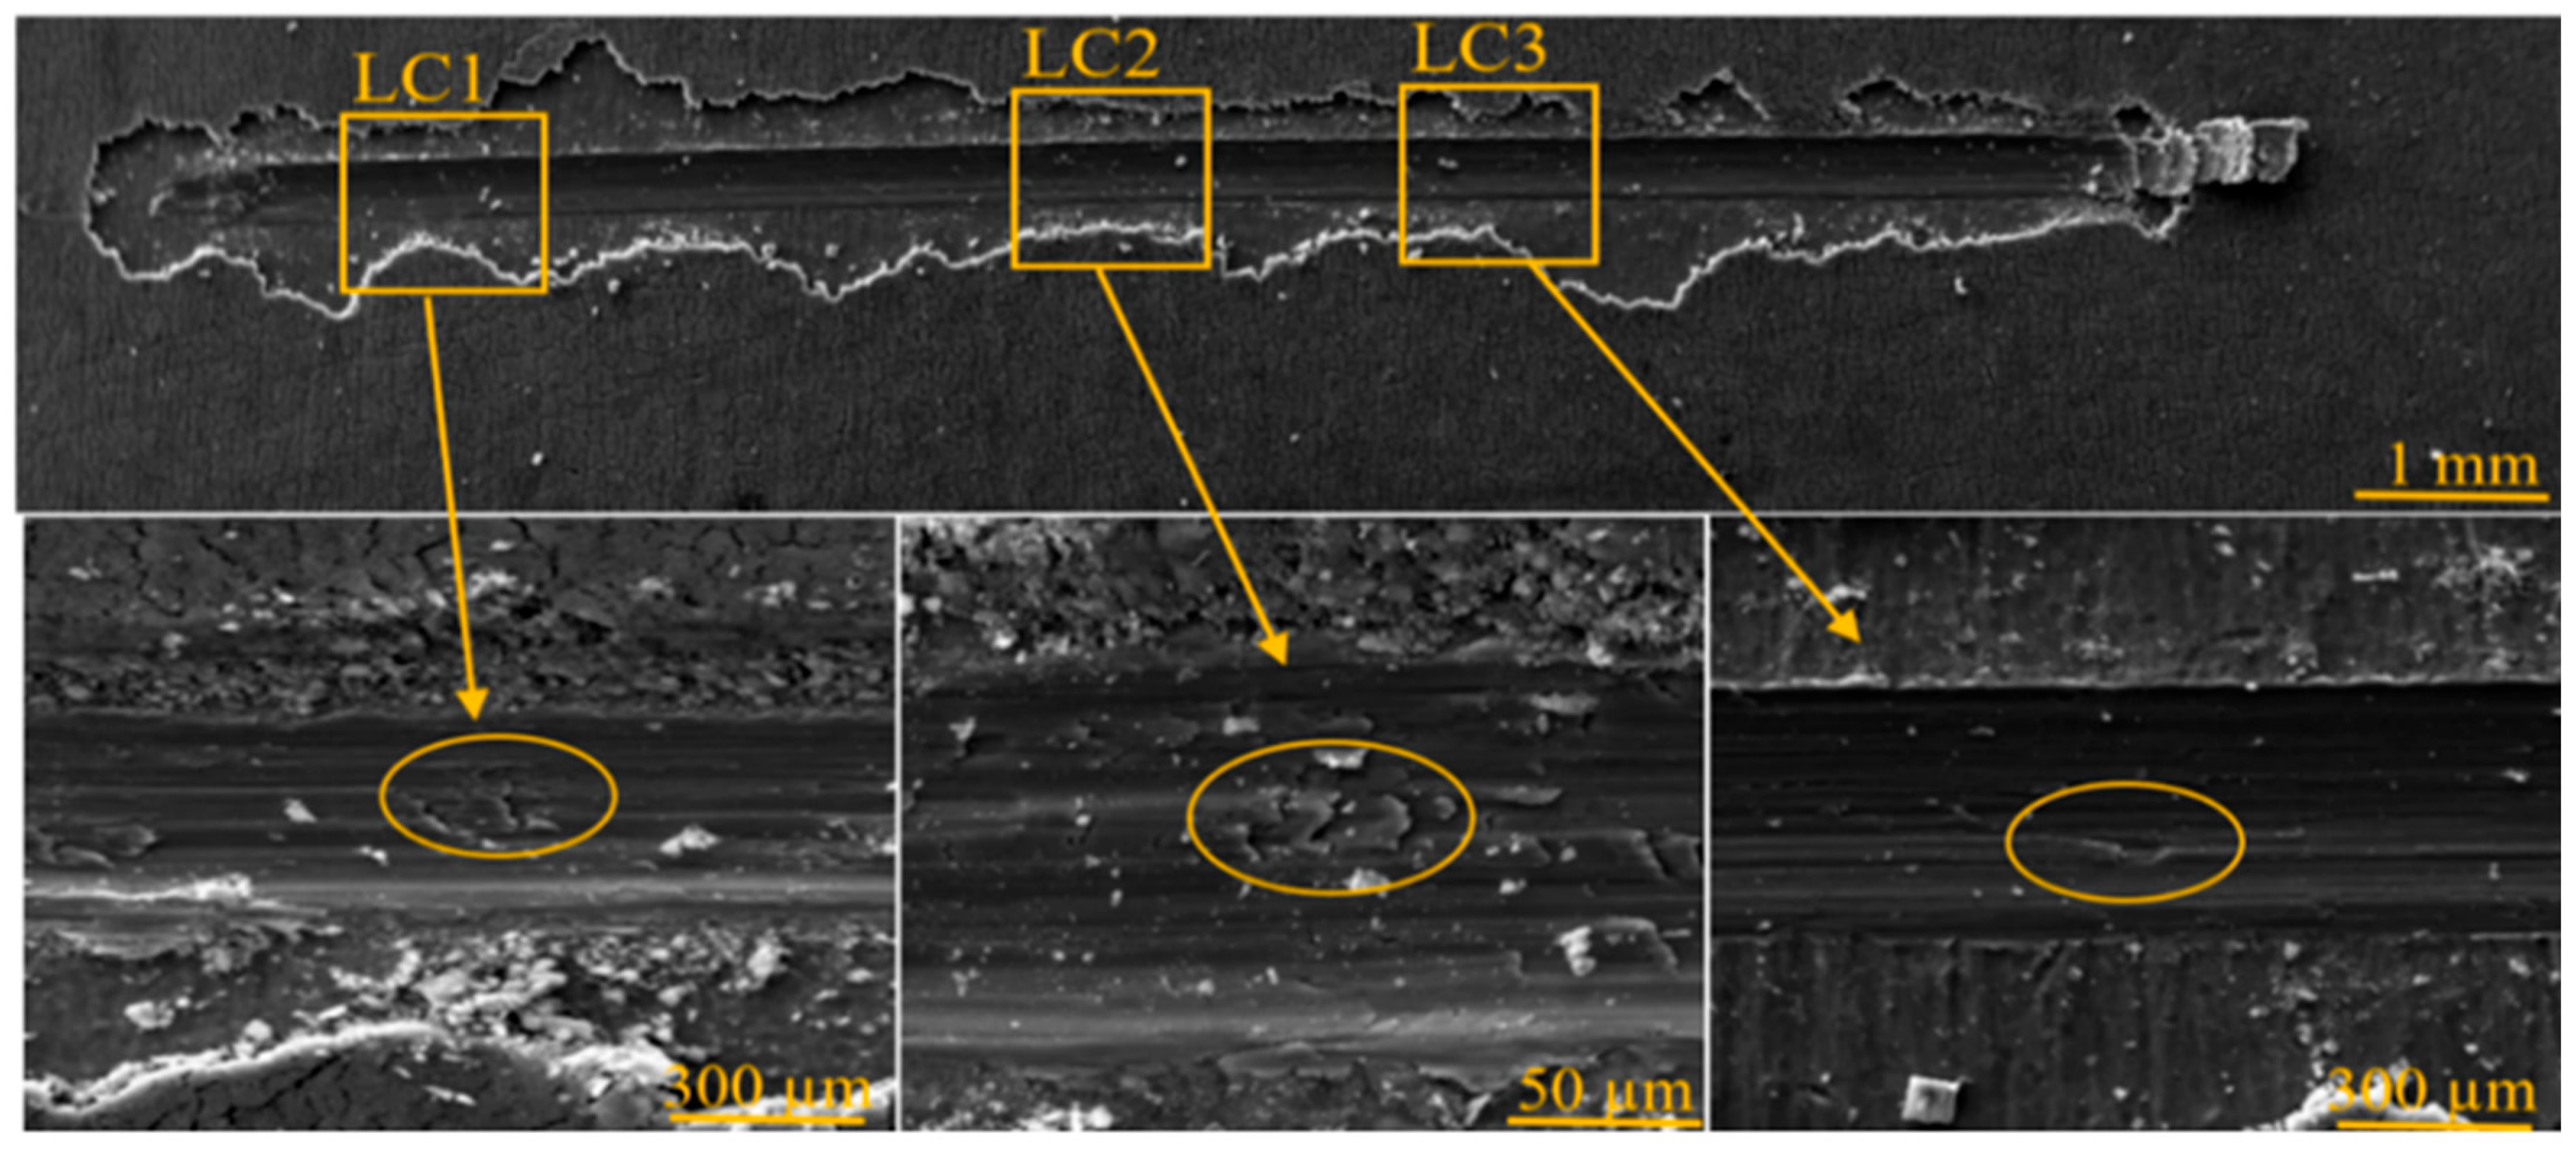
The critical load values were corroborated by corresponding SEM images of the residual scratches after the scratch test (Figure 9, Figure 10, Figure 11, Figure 12, Figure 13 and Figure 14). An increase in critical loads (LC1, LC2, and LC3) was observed with the number of PbS nanoparticle cycles obtained via the SILAR method (0, 10, and 15), clearly indicating that adding cycles enhances the cohesion of the TiO2–PbS coating. The improvement in adhesion can be attributed to better mechanical anchoring, resulting from increased substrate roughness. This finding is significant because it suggests the potential for improving TiO2 materials by incorporating PbS layers. Improving the adhesion and mechanical strength of protective layers is crucial for ensuring long-term durability and performance. Better adhesion of the coating can prevent delamination and coating failure under mechanical stress, thereby increasing the durability and reliability of protective coatings. For instance, a well-adhered TiO2–PbS coating can reduce the risk of rejection by the body, limit corrosion, and promote improved bone integration. TiO2 fortified with 15 layers of PbS yields the best outcomes regarding the critical load, with an improvement of 30.65% compared to pure TiO2. This finding suggests that 15 cycles of PbS could be the optimal number for maximizing the adhesion of the TiO2–PbS thin film in this specific context. However, it is crucial to note that the critical load declines after 15 cycles. This behaviour could indicate a saturation point beyond which adding more PbS layers no longer enhances the adhesion of the TiO2 thin film and might even deteriorate it. This decline could be due to various factors, such as changes in the structure or composition of the material following the addition of extra layers. These results underscore the importance of balancing the number of cycles to achieve optimal adhesion while avoiding saturation, which could potentially compromise the material’s performance, consistent with numerous other reports [23,24].
The adhesion strength of the PbS–TiO2 nanotube layers was assessed using a scratch test in which an indenter was moved parallel to the surface of the coated sample at a constant speed. The applied normal force (Fn) was progressively increased until the deposit was damaged. The failure modes are shown schematically in Figure 9, Figure 10, Figure 11, Figure 12, Figure 13 and Figure 14. During scratching, cracks appeared in the TiO2–PbS layer. These cracks were perpendicular to the edges of the scratch [25]. The deposit underwent deformation due to buckling, as it was located in a compression zone upstream of the indenter. As the applied load increased, the coating underwent total delamination.

3.3. Effect of Normal Load on the Coefficient of Friction Response

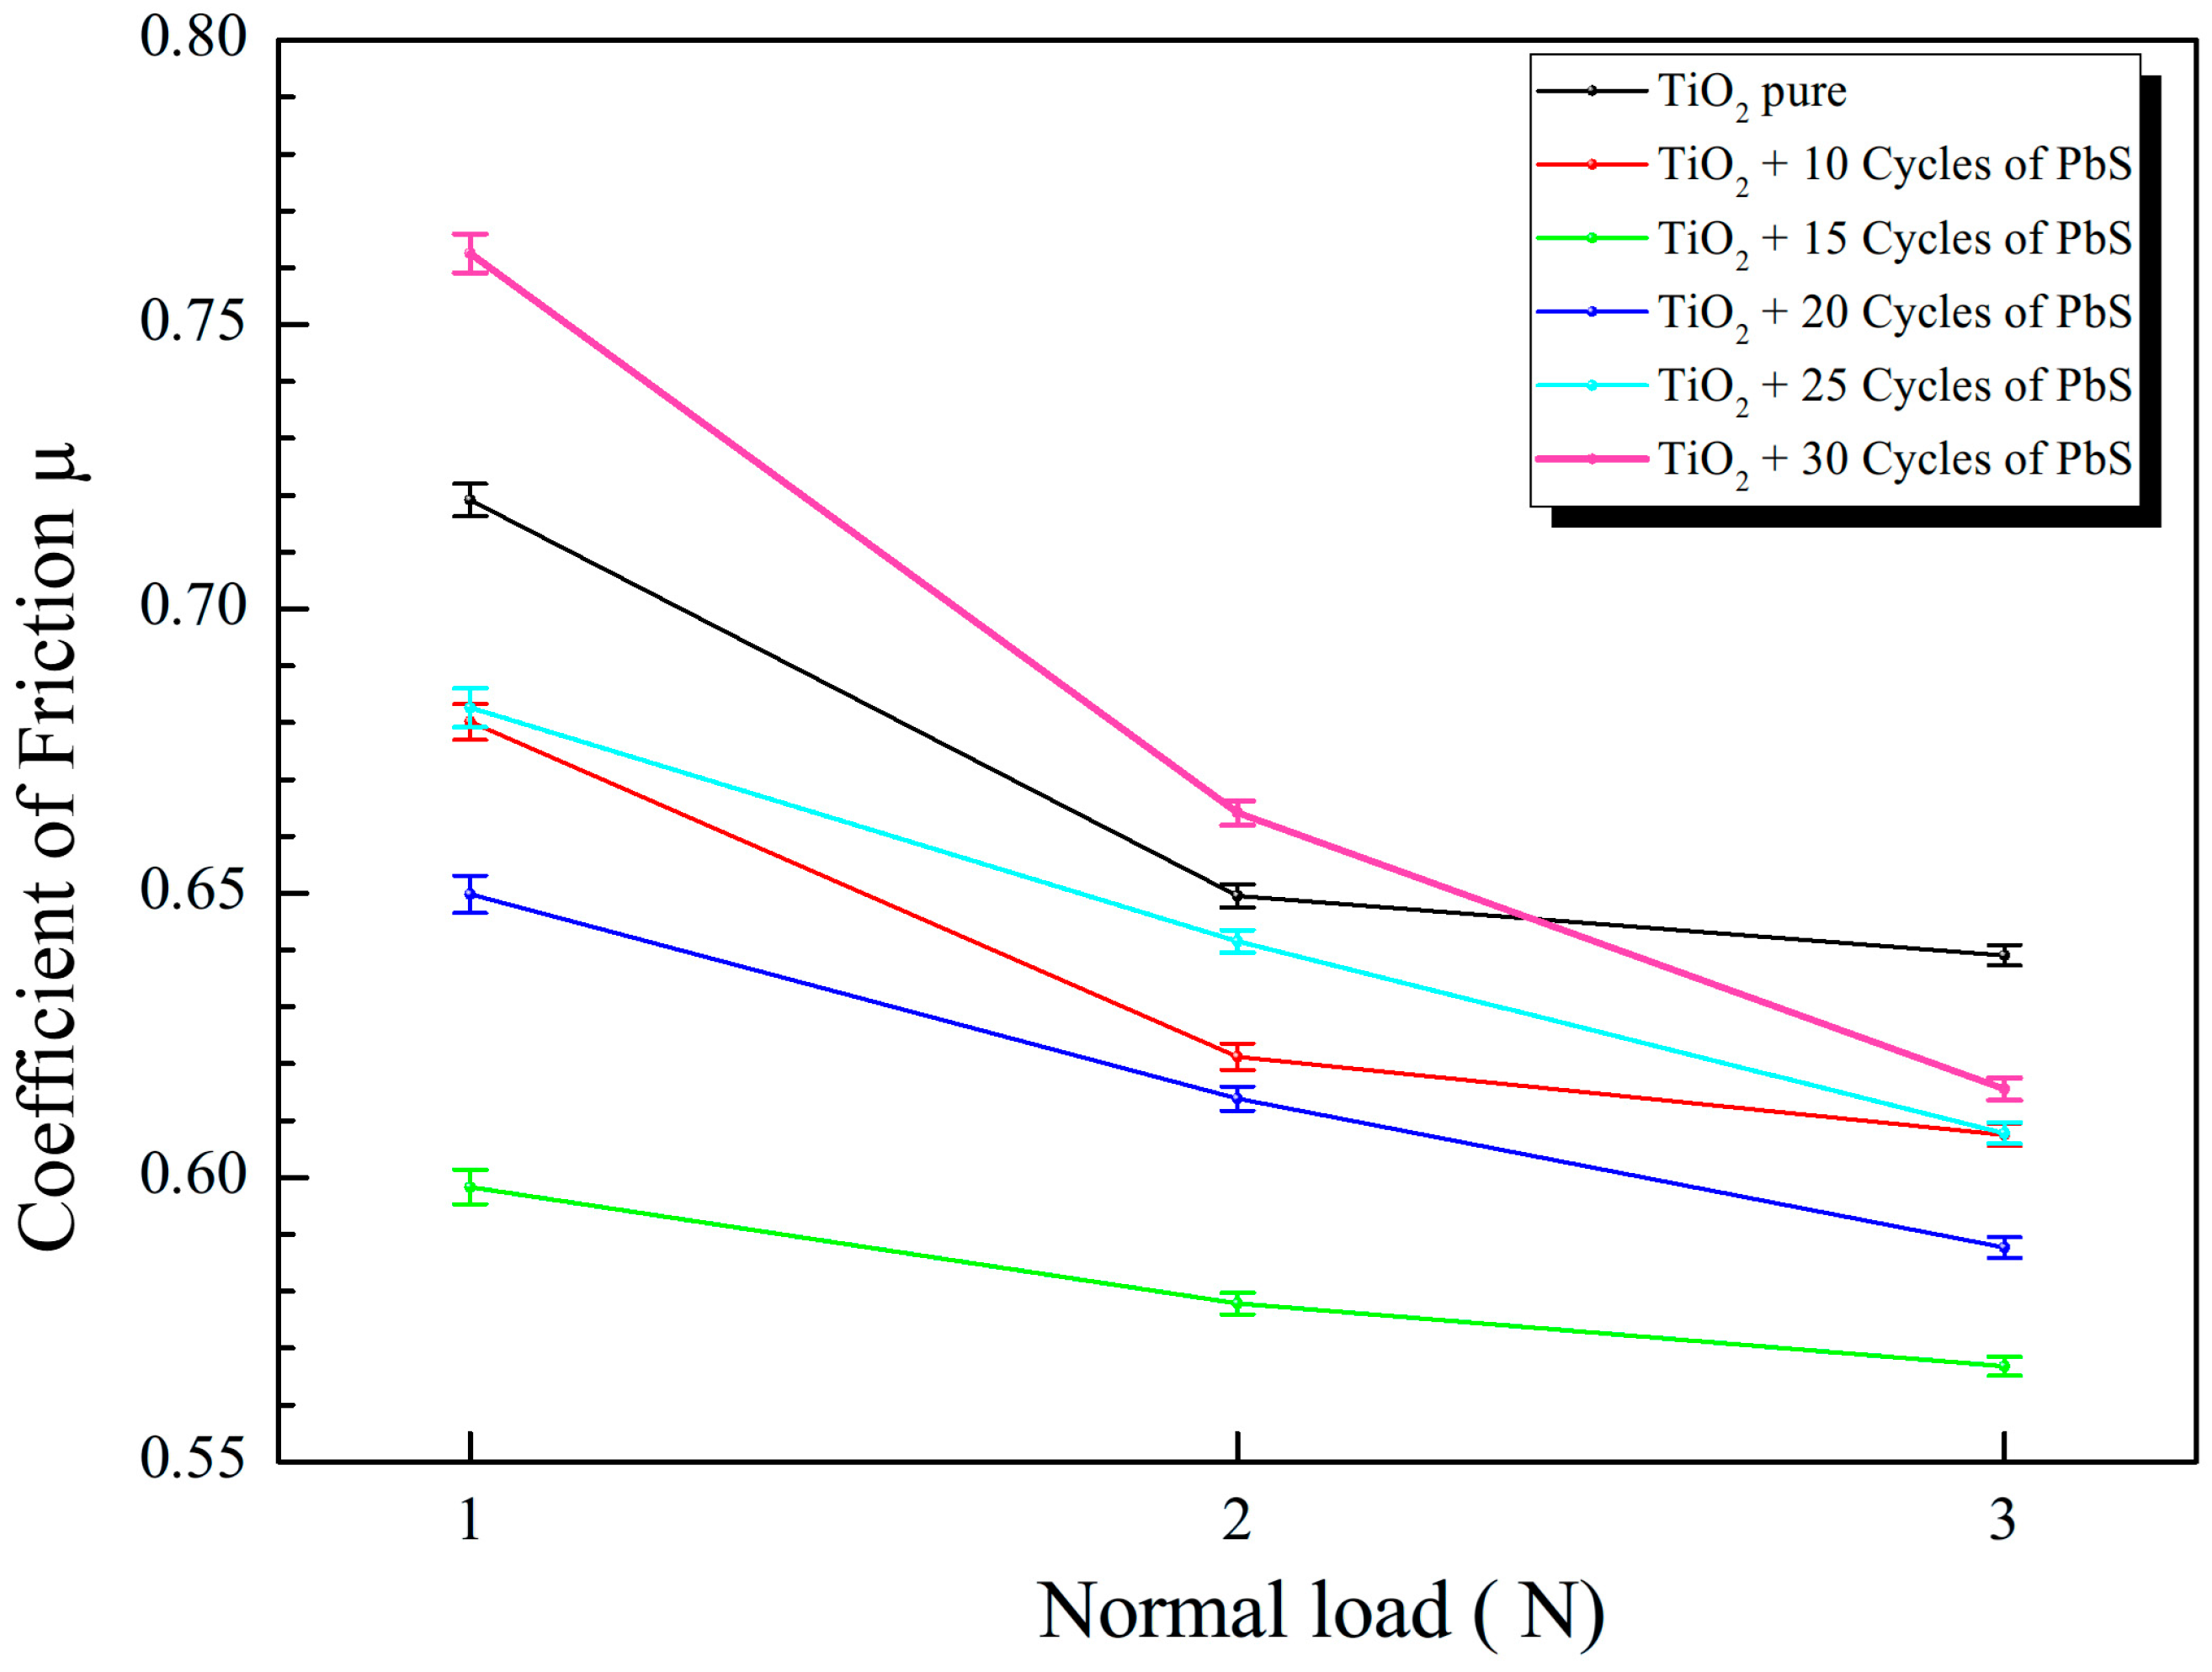
Figure 15 shows the variation in the coefficient of friction μ as a function of the normal force. Detailed observation reveals a rapid decrease in the coefficient of friction between 1 N and 2 N. This is followed by a more gradual reduction up to a load of 3 N, after which the coefficient of friction appears to stabilize.
In general, an increase in load leads to a decrease in the coefficient of friction [26]. The contact conditions illustrate a proportional reduction in the coefficient of friction with increasing normal load, as shown in Figure 15. Initially, after the application of low normal loads, elastic contact between the surface of the thin film and the indenter induces slippage that extends to the contact zone. The debris generated during this process was trapped in the contact zone, resulting in an increase in the coefficient of friction at low normal loads. Conversely, high normal loads induce a mixed state, both elastic and plastic, on the surface, resulting in a lower coefficient of friction [27]. These observations are consistent with previous results [28,29], which contribute to the increase in adhesion of surfaces in contact with low loads. Indeed, under low loads, surfaces tend to cling to each other owing to the interlocking (entanglement) of asperities on opposing surfaces. This tendency stabilizes under these conditions. This reduction in the coefficient of friction is particularly advantageous for protective coatings applications, as it translates to a significant reduction in wear and tear at the interface of the metallic coatings, thereby enhancing their durability and performance. For protective layers, this implies less frictional resistance during movement, leading to greater patient comfort and fewer complications. Additionally, improved adhesion of coatings, as demonstrated by TiO2 reinforced with PbS NPs, enhances the performance of protective layers by ensuring stronger bonding between the coating and the substrate. This reduces the risk of delamination and coating failure, thereby improving corrosion resistance and wear protection. As a result, the durability, reliability, and long-term stability of anticorrosive and anti-wear protective layers are significantly enhanced under demanding environmental and mechanical conditions.
In the pure TiO2 state, the coefficient of friction was higher than that when different numbers of PbS NPs cycles (10, 15, 20, and 25) were deposited using the SILAR method. This clearly demonstrates that increasing the number of cycles significantly improved the adhesion of the coatings. The values show that the lowest coefficients of friction correspond to surfaces with the smallest particle sizes, irrespective of the number of PbS NP cycles. This underscores the effectiveness of the research, as TiO2 reinforced with 15 layers of PbS NPs shows the best results, highlighting its potential for enhancing the performance and integration of anti-wear protective layers.

3.4. Variation of Dissipated Energy with Different Normal Loads

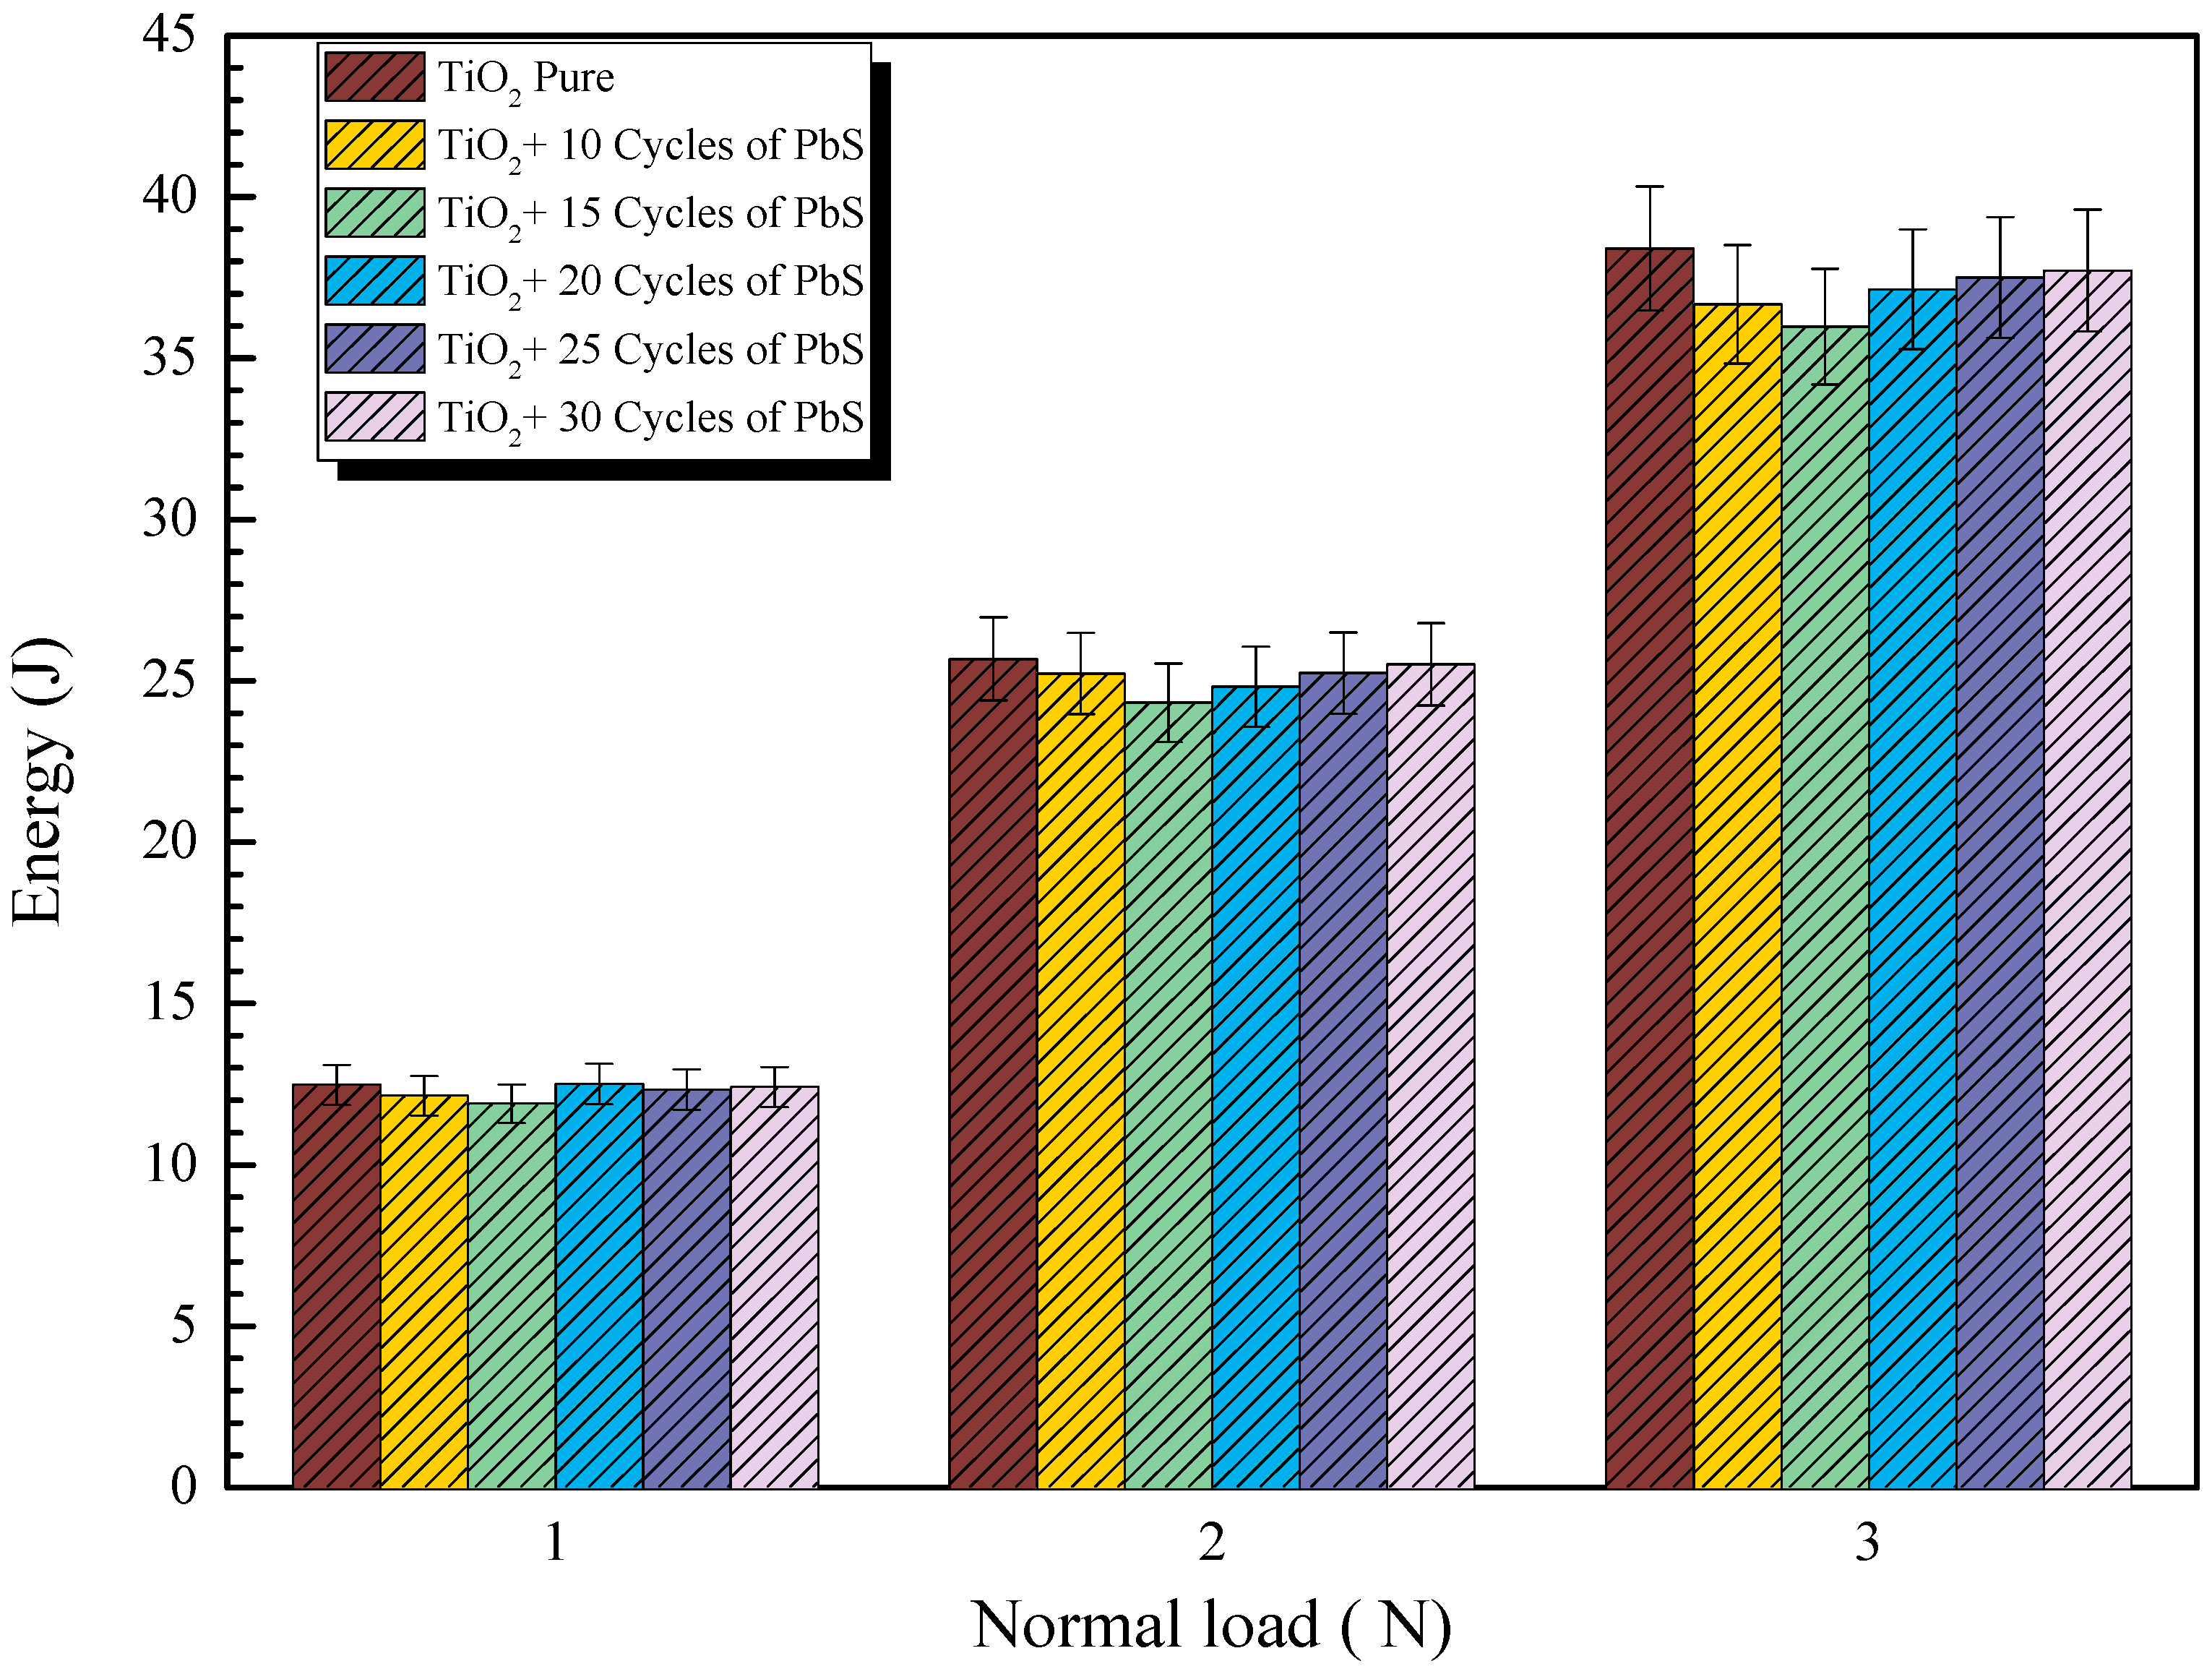
The following Figure 16 depicts the evolution of the energy dissipated as a function of the normal load on the samples for different numbers of cycles of the PbS NPs obtained by the SILAR method.
This energy increases with increasing normal force and shows that the number of cycles of PbS NPs deposited by the SILAR method makes it possible to reduce the energy dissipated during the wear process. This observation is consistent with the prediction that the most wear-resistant coating is the one with the lowest dissipated energy, as also confirmed by Nader et al. [30].
Generally, the importance of the energy aspect of wear becomes fully apparent when this dissipated energy is associated with the quantity of material worn. The investigations carried out during this study made it possible to establish this relationship, and the corresponding results are presented in the following graphs (Figure 16).
The values show that the lowest coefficients of friction correspond to surfaces with the smallest particle sizes, irrespective of the number of cycles of the PbS NPs. This reflects the fact that TiO2 reinforced with 15 layers of PbS NPs shows the best results.

3.5. Variation of Wear with Different Normal Forces

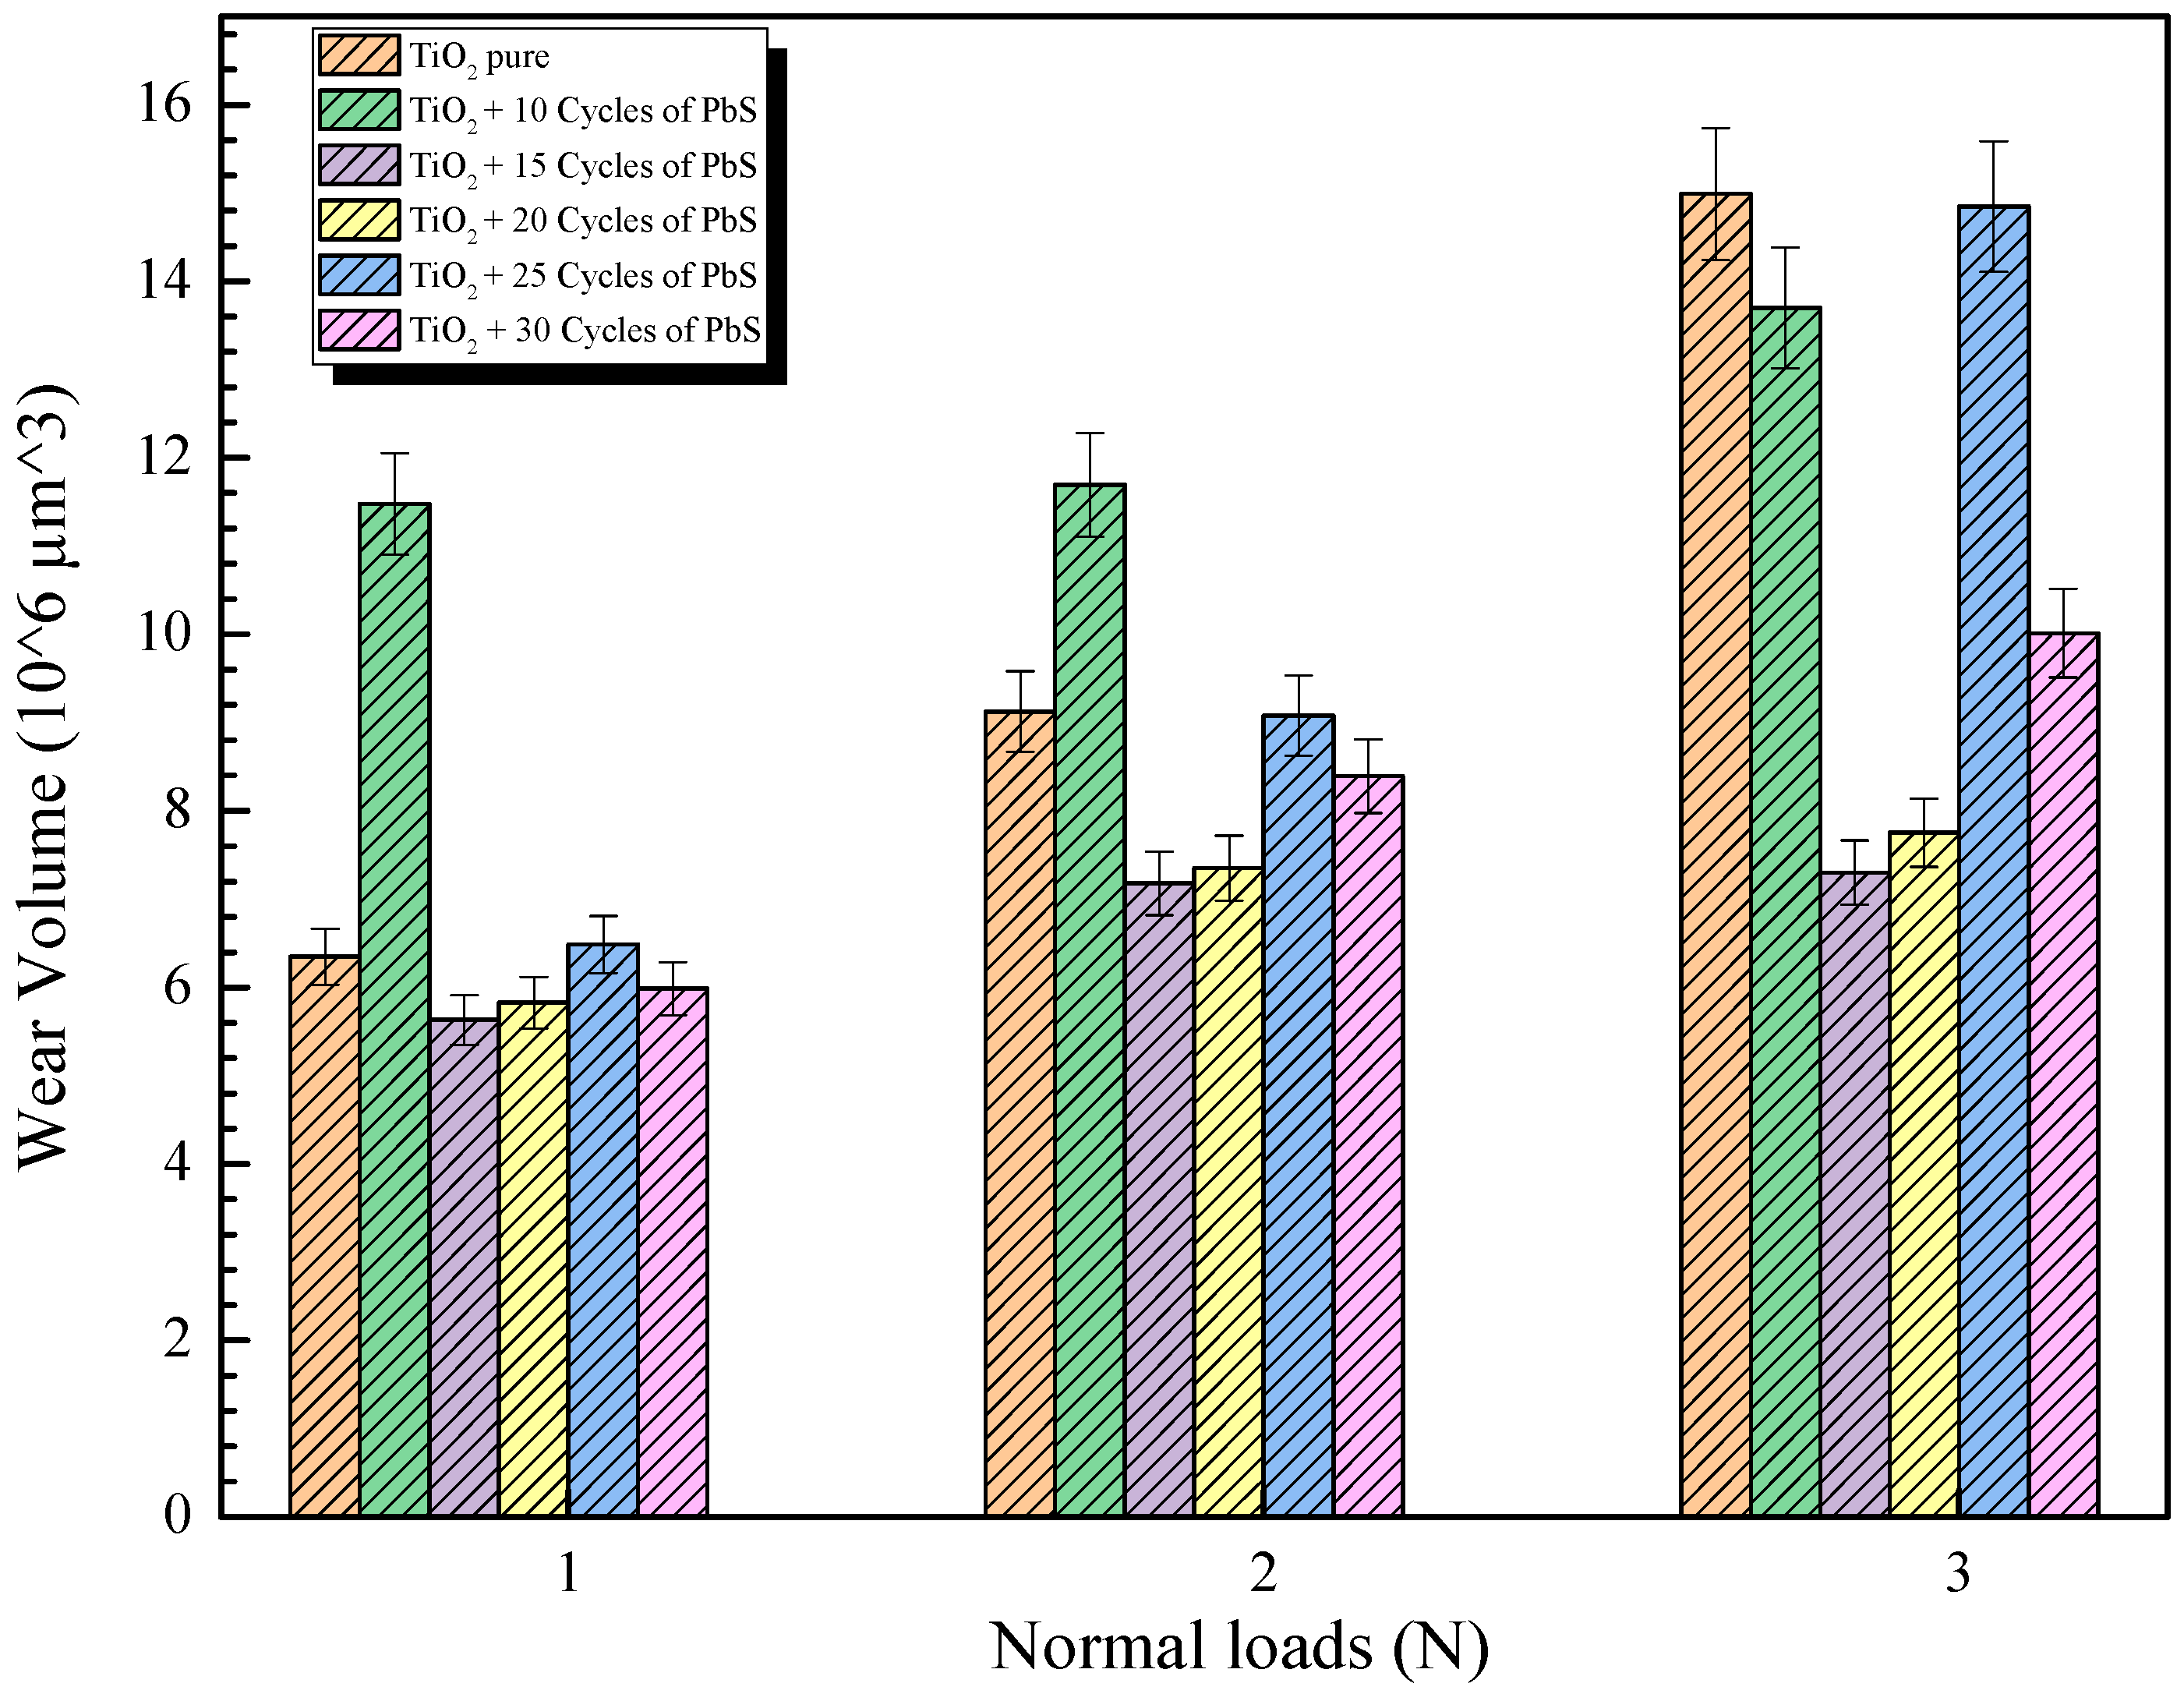
The variation of the wear volume as a function of the normal force for the coatings with different numbers of PbS cycles is illustrated in Figure 17.
The deposition of 15 cycles of PbS significantly reduced the wear volume, decreasing it to 5.63 × 106 µm3 under a low load and 7.30 × 106 µm3 at a 3 N load. This reduction in wear volume indicates that TiO2 decorated with 15 layers of PbS is more cohesive and wear-resistant than pure TiO2. During the sliding of the indenter, two types of debris were formed at the interface: coarse debris, which was ejected from the friction track, and fine debris, which remained at the interface and promoted abrasive wear by increasing the material removal. Fine debris accumulates on the surface, exacerbating wear. A lower generation of debris and wear elements associated with PbS coatings reduces the risk of inflammatory reactions and complications at the implantation site. Furthermore, an increase in load leads to the deterioration of the coating (see Figure 17), which is attributed to the changes induced by the rise in surface temperature.

3.6. Variation in Wear Volume as a Function of Dissipated Energy

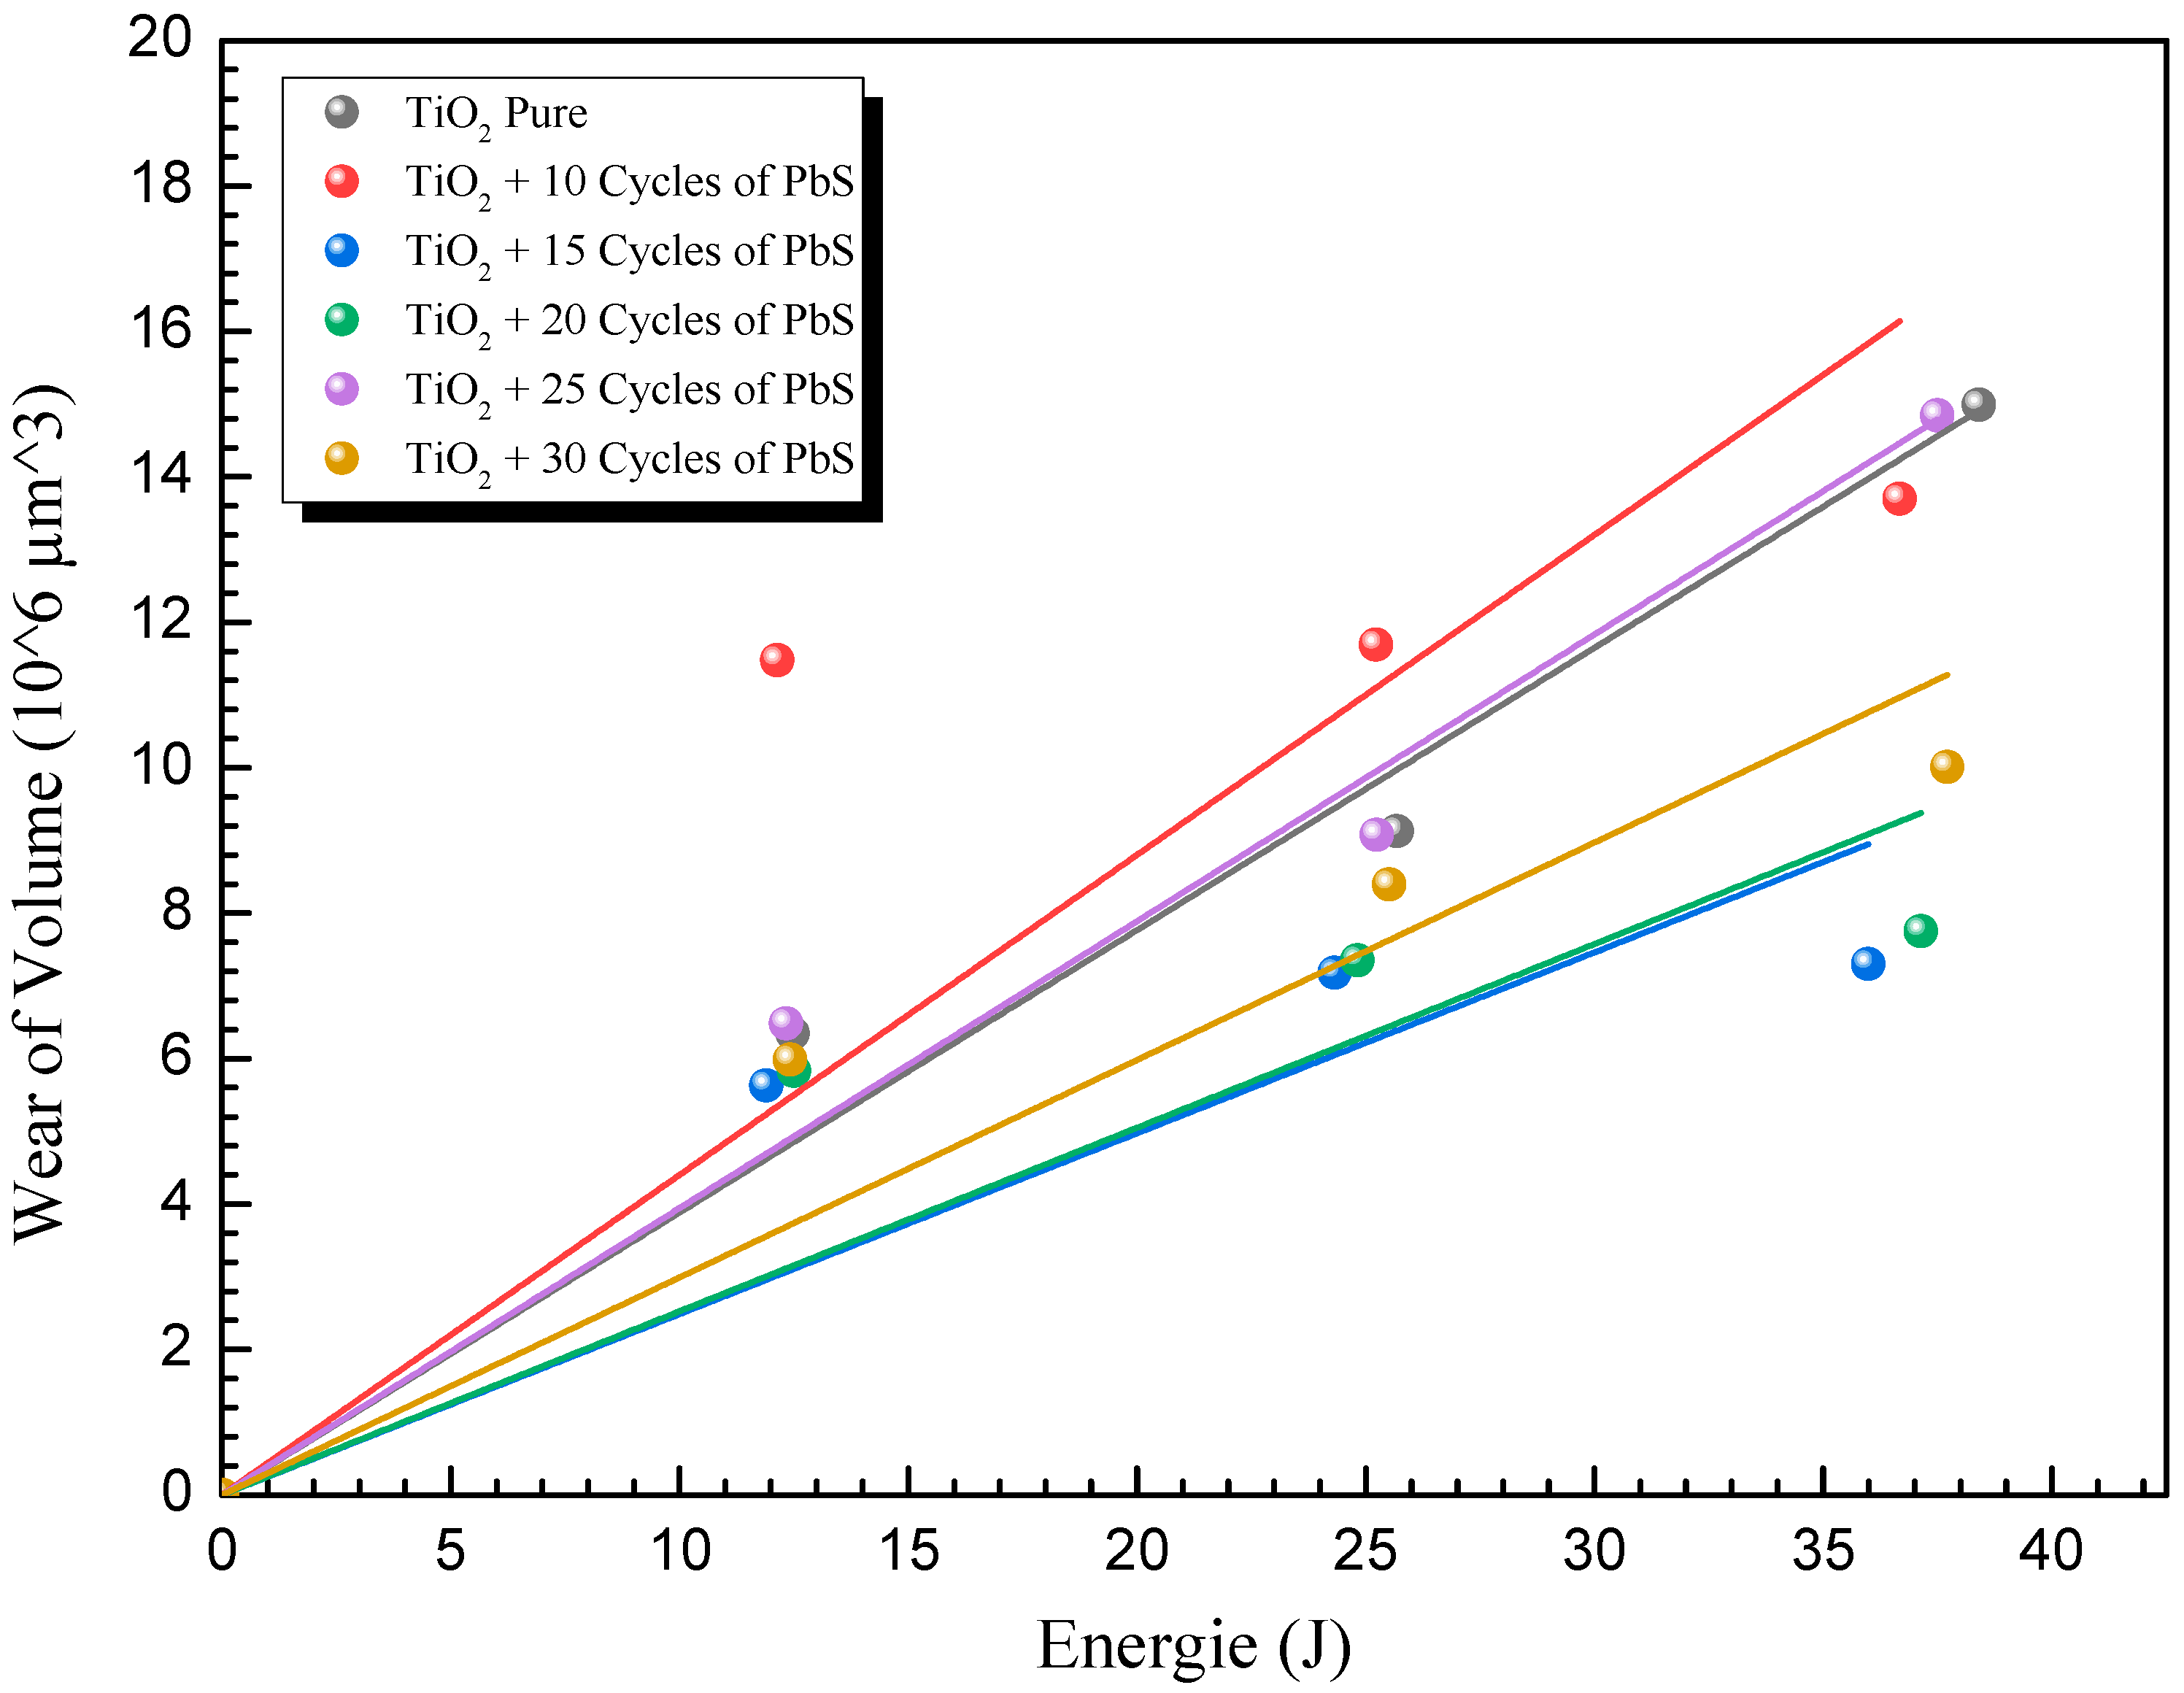
The wear volume was calculated by overlaying SEM images taken before and after the wear tests and subsequently measuring the variance in the scratch trace. The results of this calculation are illustrated in Figure 18, depicting the relationship between wear volume and energy dissipated upon contact. This relationship demonstrates near linearity.
This finding aligns with predictions made by Archard’s relation [31], confirming previous literature results [32,33,34,35,36]. The linearity coefficient, also known as the wear coefficient (α), which represents the linear slope of wear volume against cumulative dissipated energy, provides insight into the intrinsic wear resistance of each surface layer. This wear energy coefficient also corresponds to the ratio of the wear coefficient to the hardness of the layer, as defined in reference [37]. The following Table 5 contains the values of the wear energy coefficients for the coatings.
The wear coefficient values, determined from the slope, are α = 388,320 µm3/J for pure TiO2 NTs and α = 248,690 µm3/J after being subjected to 15 cycles of PbS NPs, the lowest among the various coatings. This result confirms the excellent wear resistance of the TiO2 coating decorated with 15 cycles of PbS NPs. Thus, as mechanical properties such as hardness increase, the coating experiences less wear, leading to a decrease in the wear coefficient.

3.7. Corrosion Resistance and Electrochemical Impedance Spectroscopy

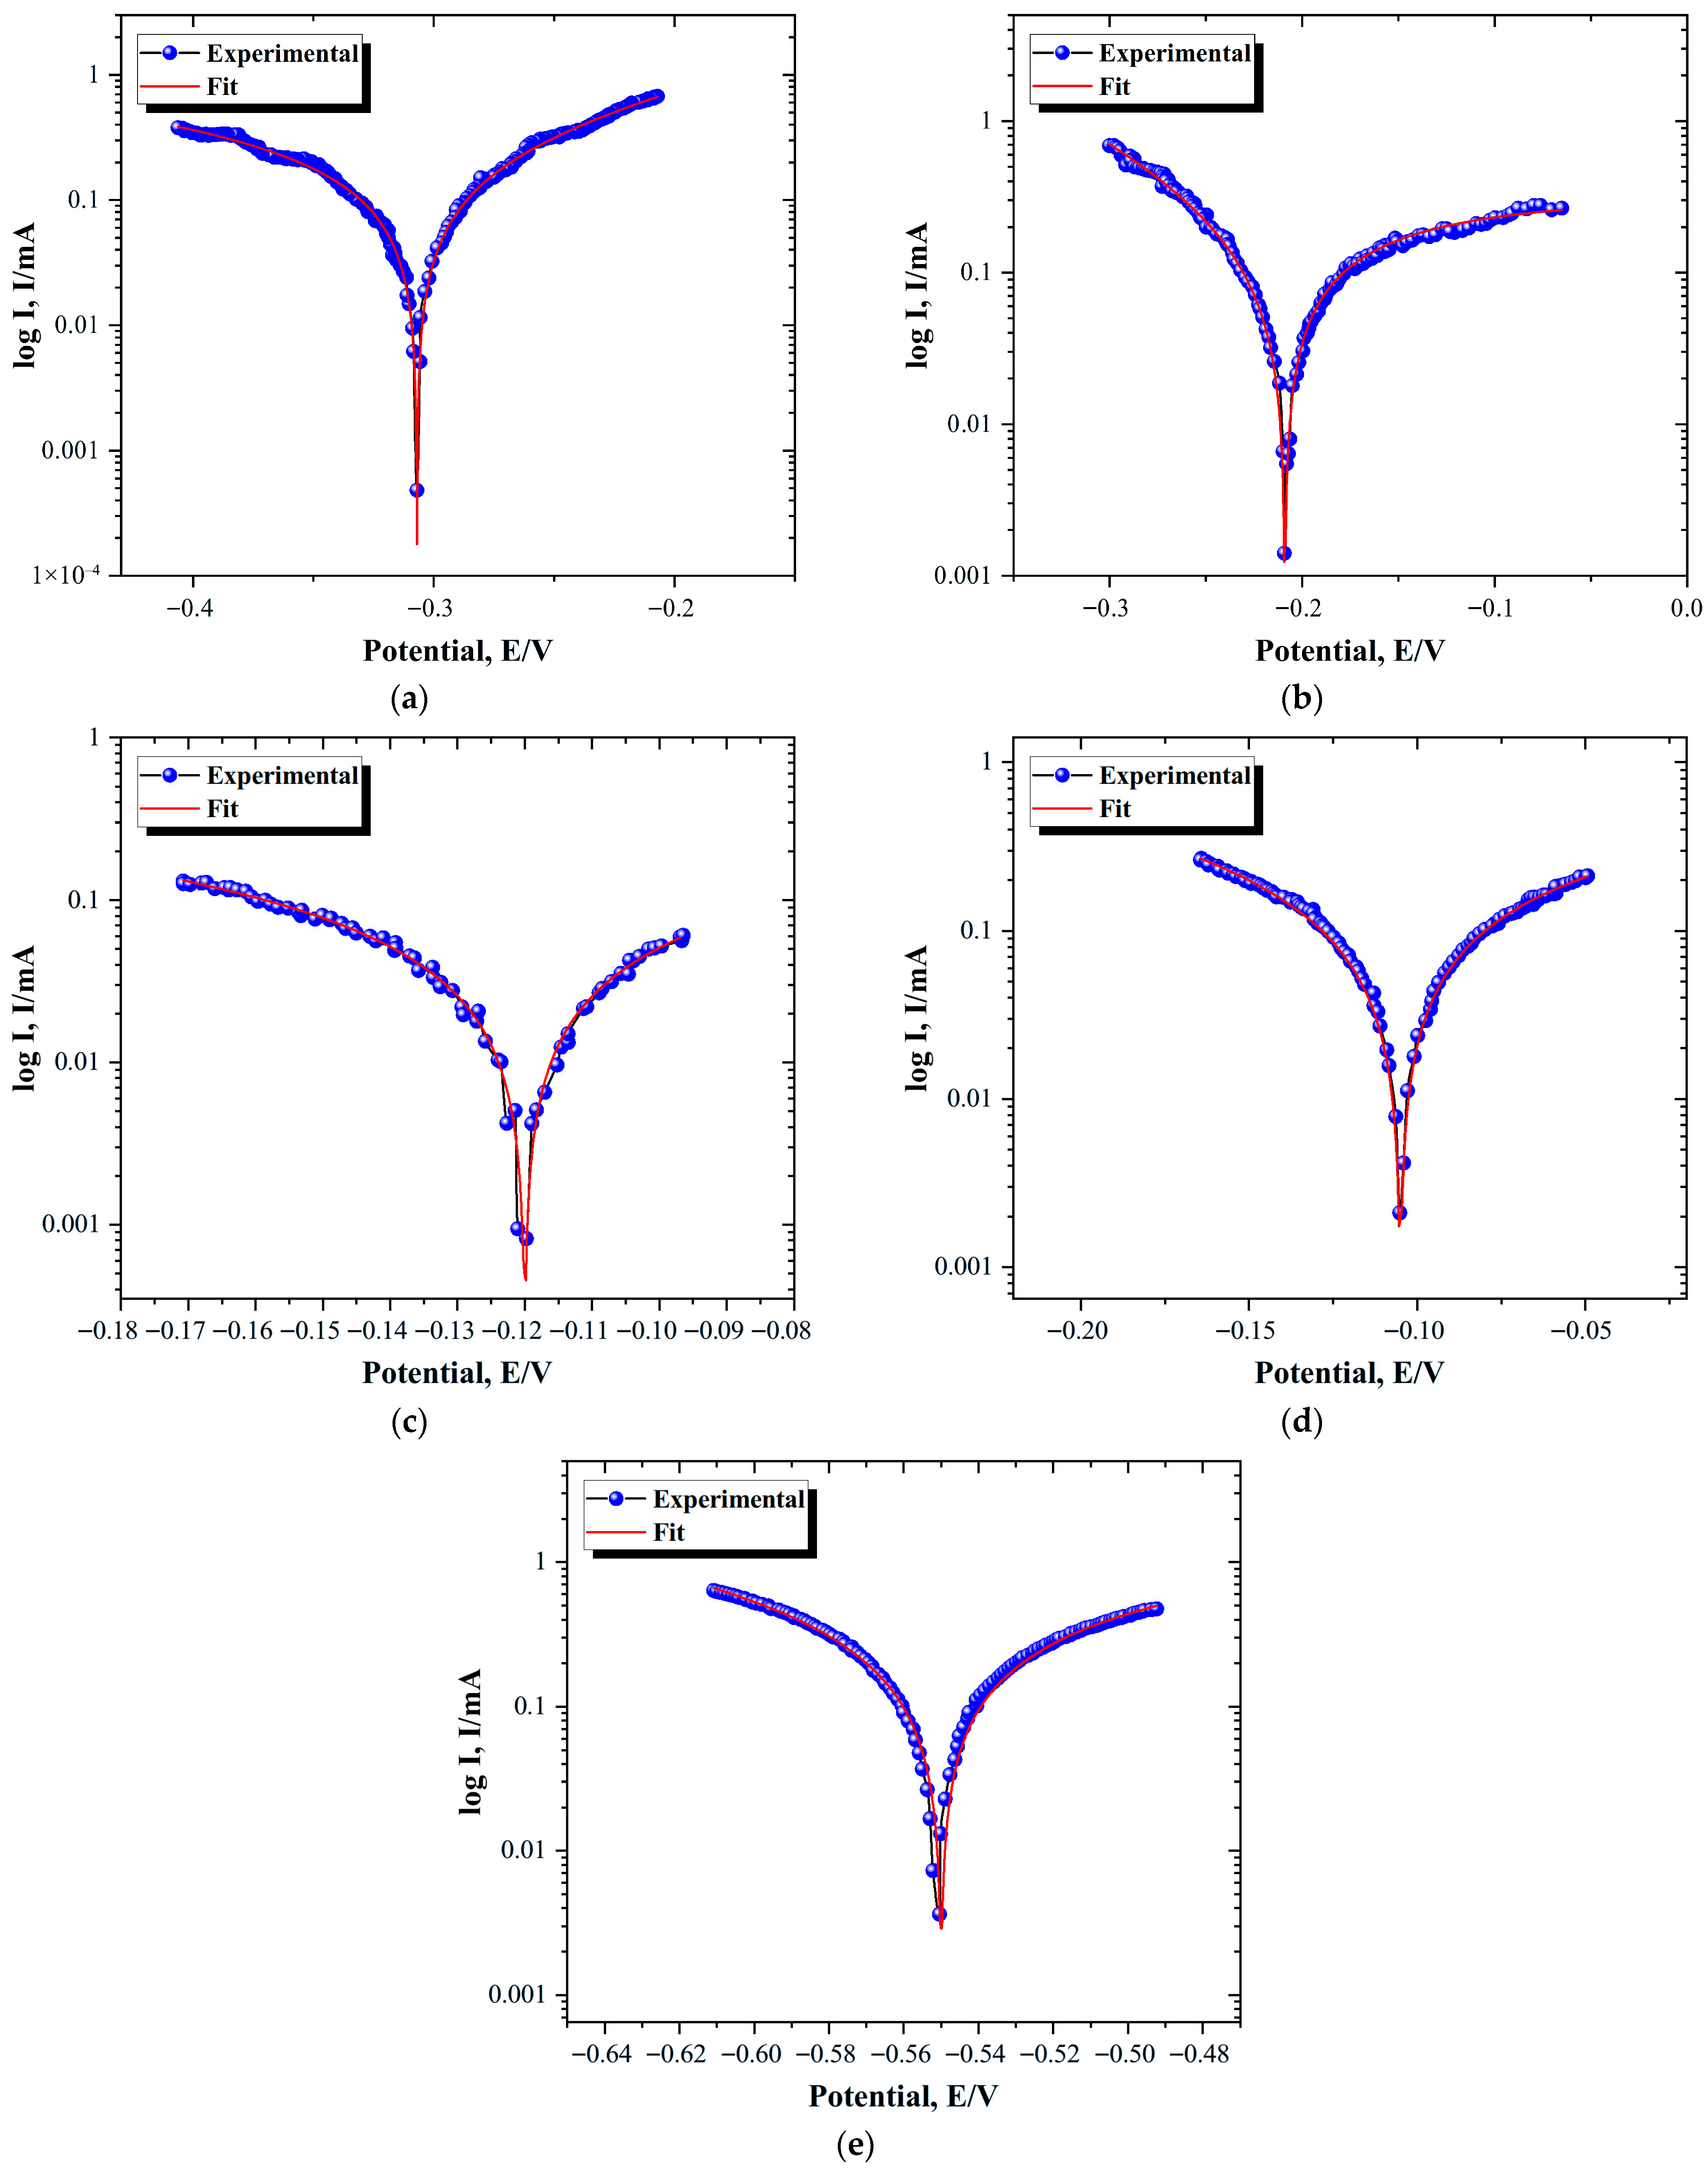
Understanding the corrosion behavior of PbS/TiO2 nanotubes is essential for optimizing their application in areas such as anticorrosive protective coatings. Figure 19 shows the Tafel plots of the as-prepared samples. This study aims to analyze the corrosion resistance of PbS/TiO2 nanotubes by exploring the effects of synthesis conditions involving 10, 15, 20, 25, and 30 SILAR deposition cycles. To determine the corrosion parameters such as corrosion potential (Ecorr), corrosion current density (icorr), and Tafel constants (ba and bc), an extrapolation of the Tafel curves was conducted.
Table 6 exhibits the extracted values, and it seems that as the deposition cycles increase from 10 to 25, the corrosion potential (Ecorr) increases, which indicates an improvement in thermodynamic stability of the coatings. This suggests enhanced resistance to corrosion. However, the sample with 30 deposition cycles possesses the lowest Ecorr −0.55 V. As for the corrosion current density (icorr), it shows some fluctuations, with lower icorr values of 0.269 mA, 0.298 mA, and 0.27 mA observed at 10, 15, and 25 cycles, respectively, suggesting enhanced electrochemical activity or reactivity at this stage. Herein, the cathodic slope Bc is physically negative, which could indicate either a change in reaction mechanism, the formation of a passive film, or a limitation in mass transport (diffusion control) [38,39]. Moreover, the 15-cycle sample presents a more negative cathodic slope (Bc), which could be due to faster cathodic reactions. Whereas the anodic slope is at its highest value for the 10-cycle sample and at its lowest for the 15-cycle sample. Furthermore, this critical deposition cycle emerges as a turning point, with an optimal balance between corrosion resistance and electrochemical activity. Lower slopes at later cycles suggest a slowdown in corrosion reactions.
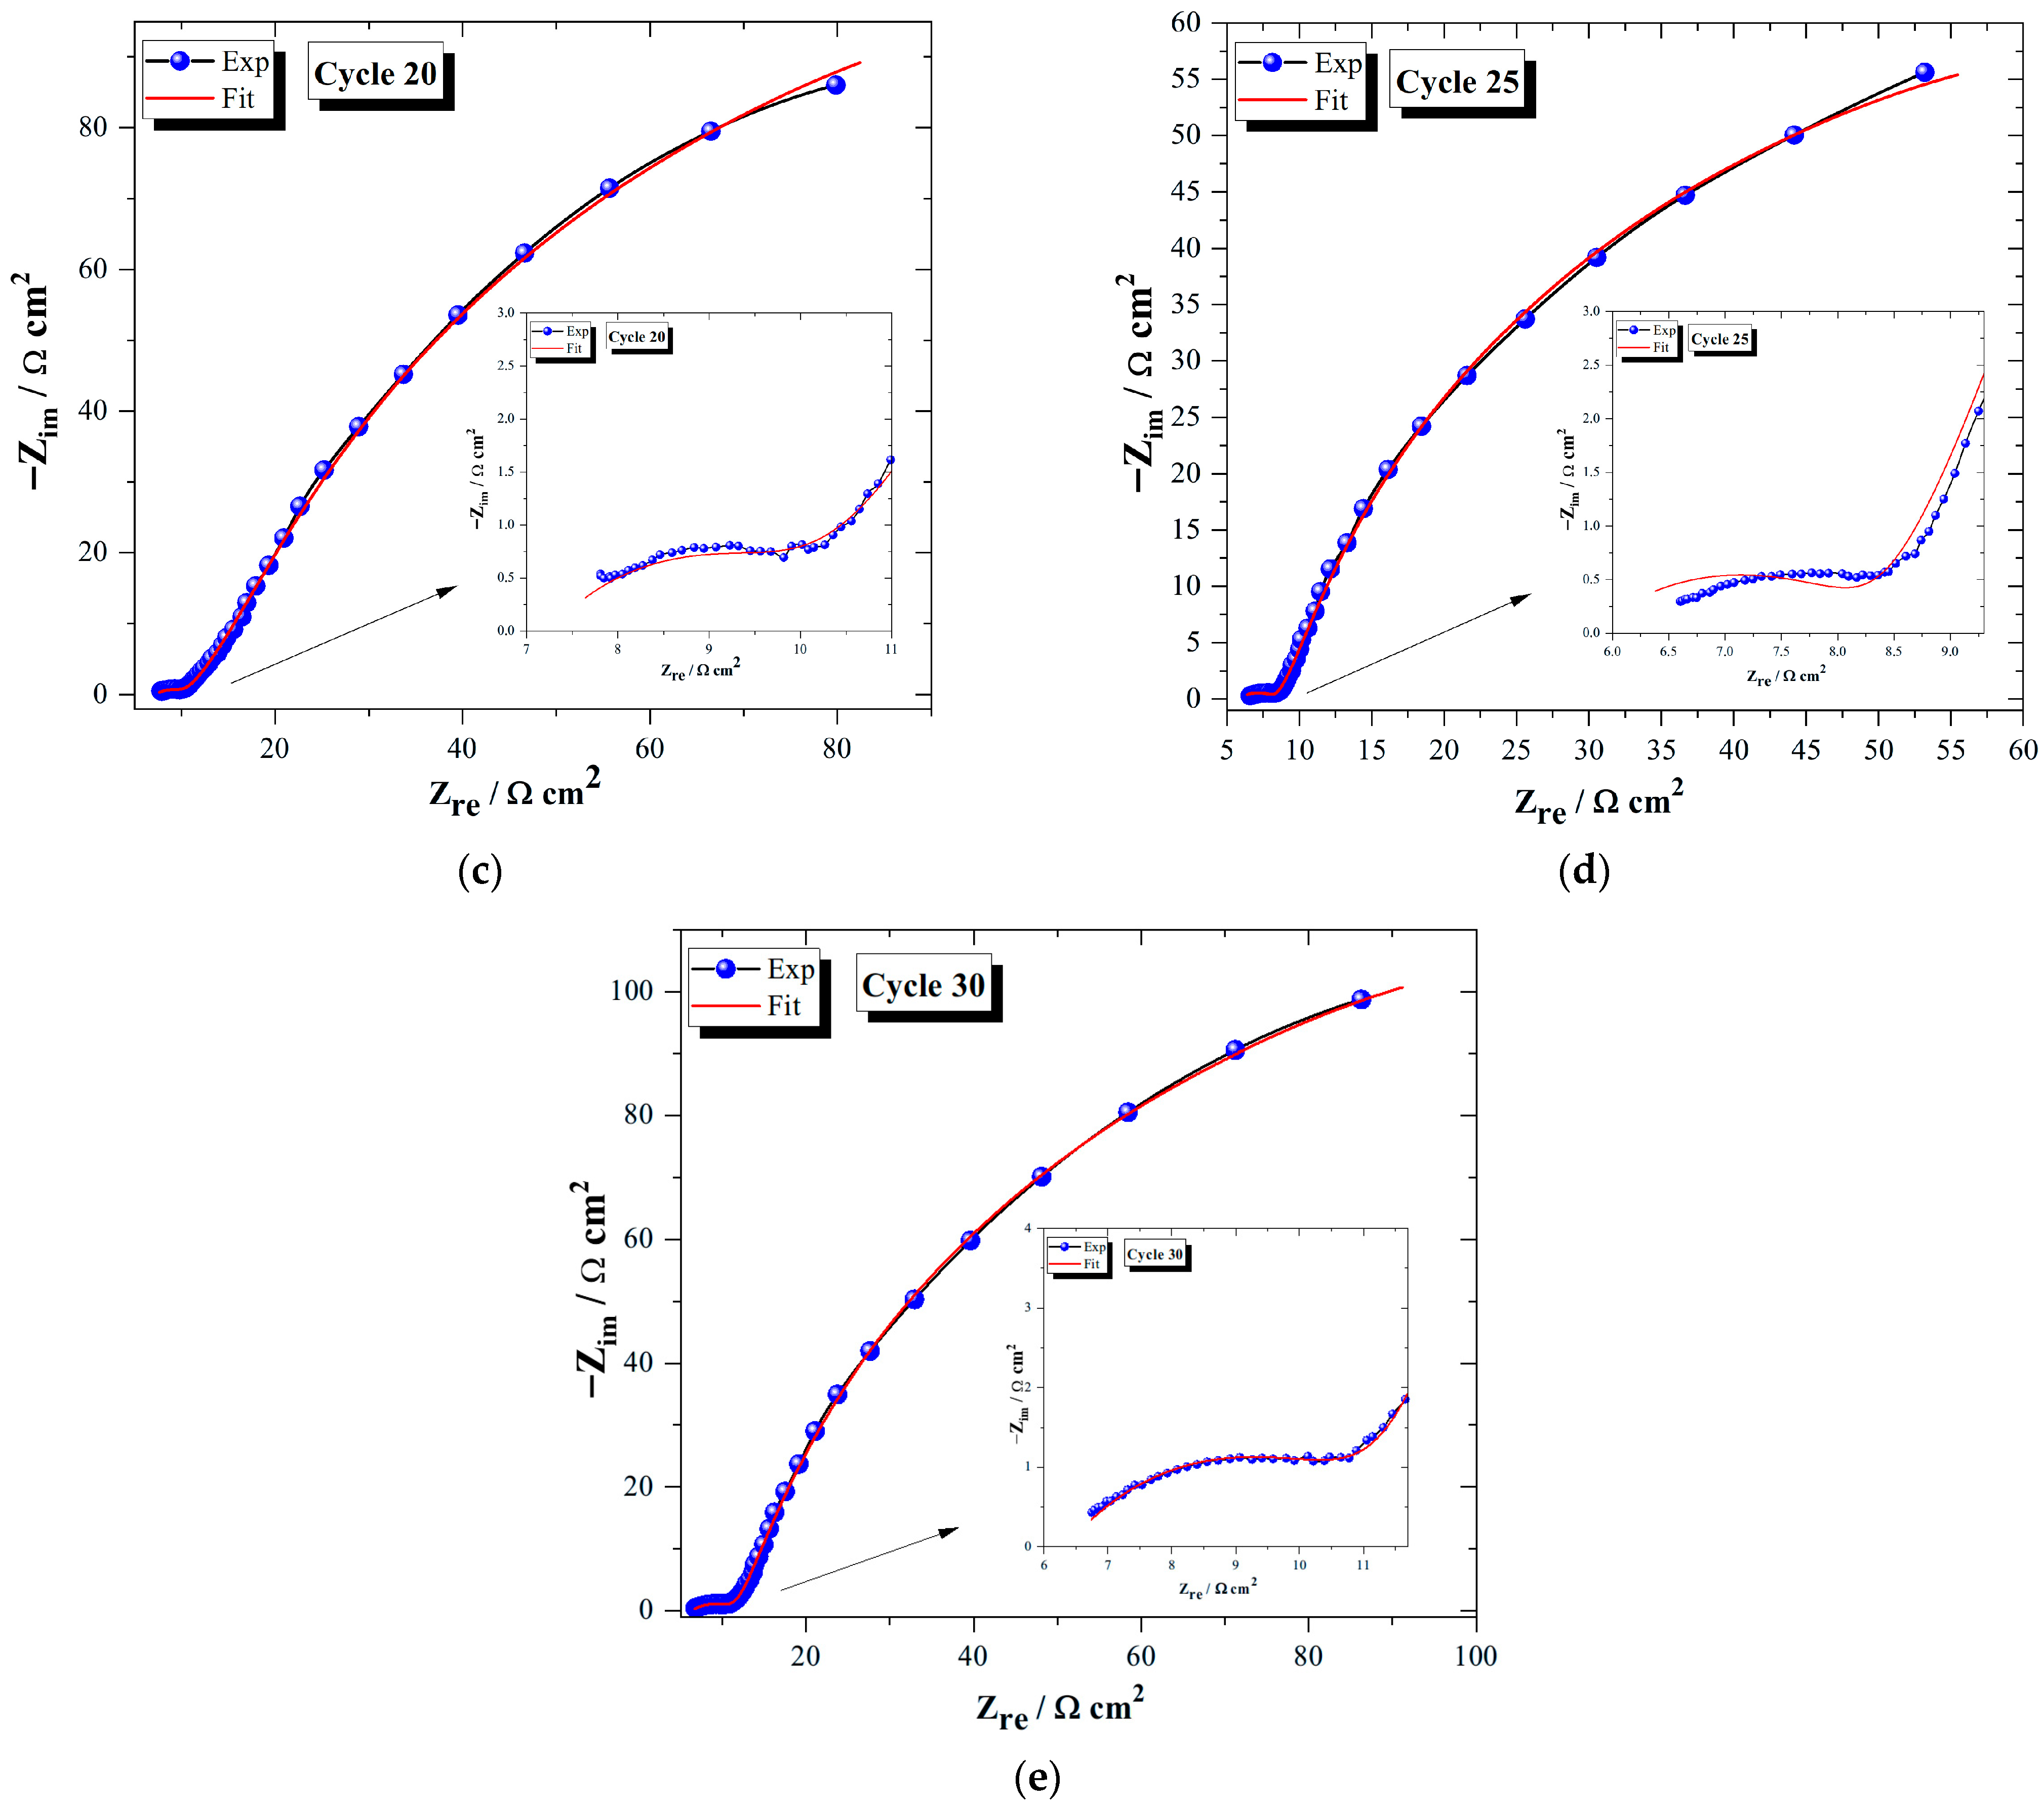
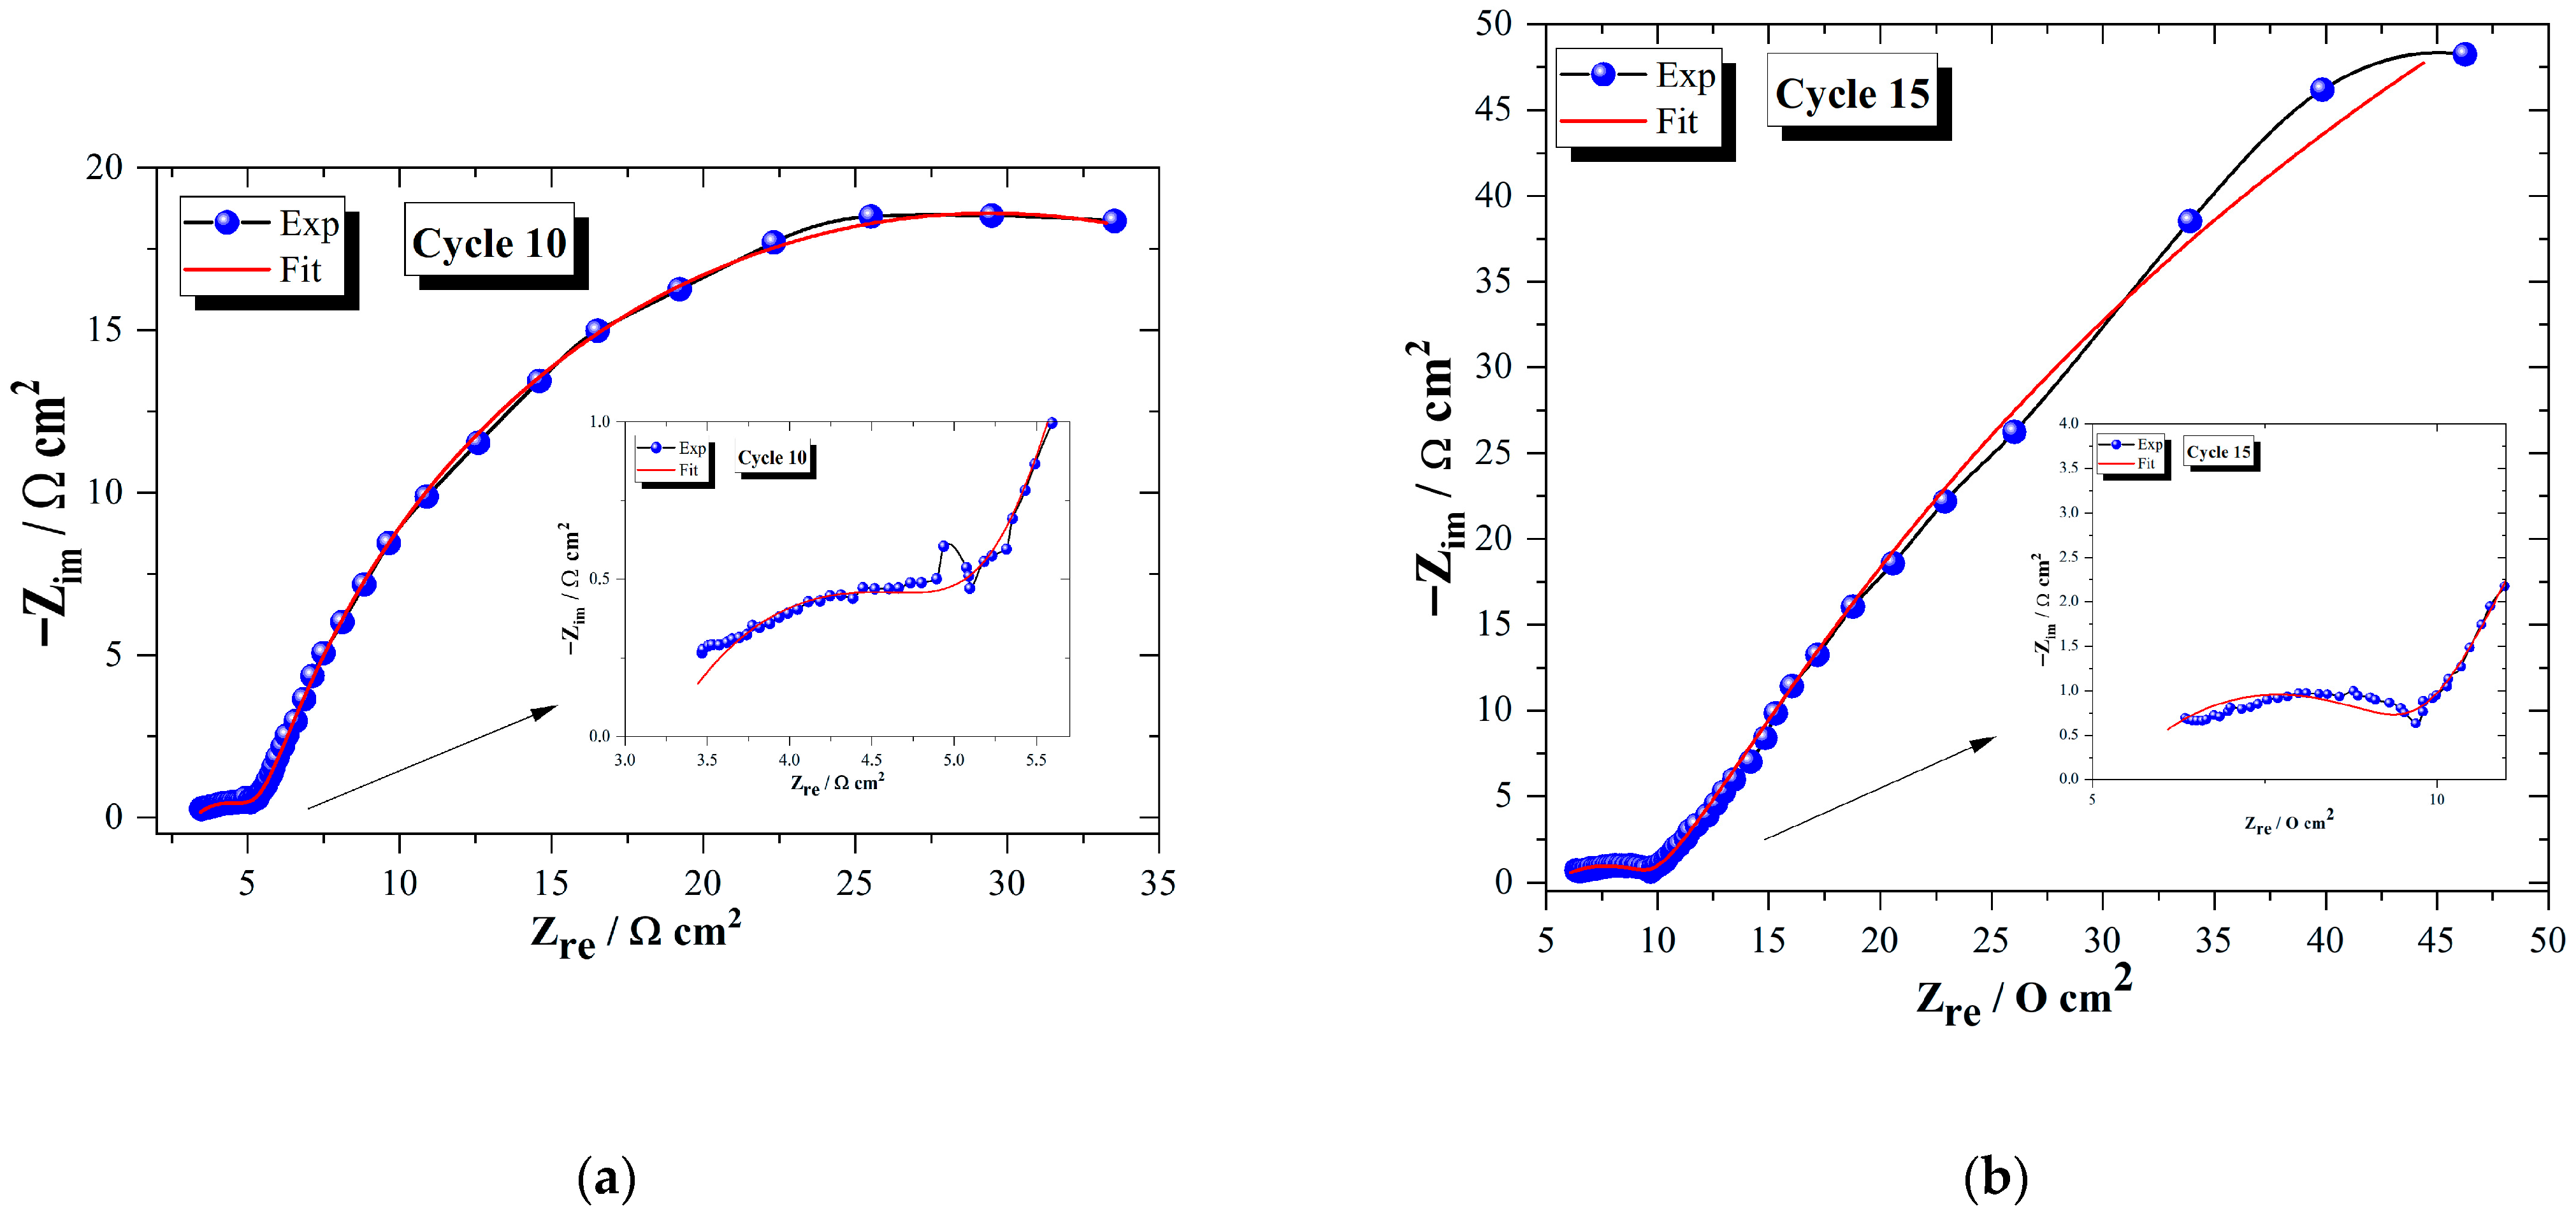
To better understand the electrochemical properties of the samples, including corrosion behavior and charge transfer process, and due to the Tafel results for a more accurate corrosion analysis, electrochemical impedance spectroscopy (EIS) was conducted. Figure 20 shows the Nyquist plot of PbS/TiO2 nanotubes. It illustrates the charge transfer between the electrode and the electrolyte, which is conventionally presented as a semicircular arc. The observed singular half-circle is indicative proof that the system has an electrochemical interface. The Nyquist plot represents the real component of complex impedance on the horizontal axis and the negative imaginary component on the vertical axis [40].
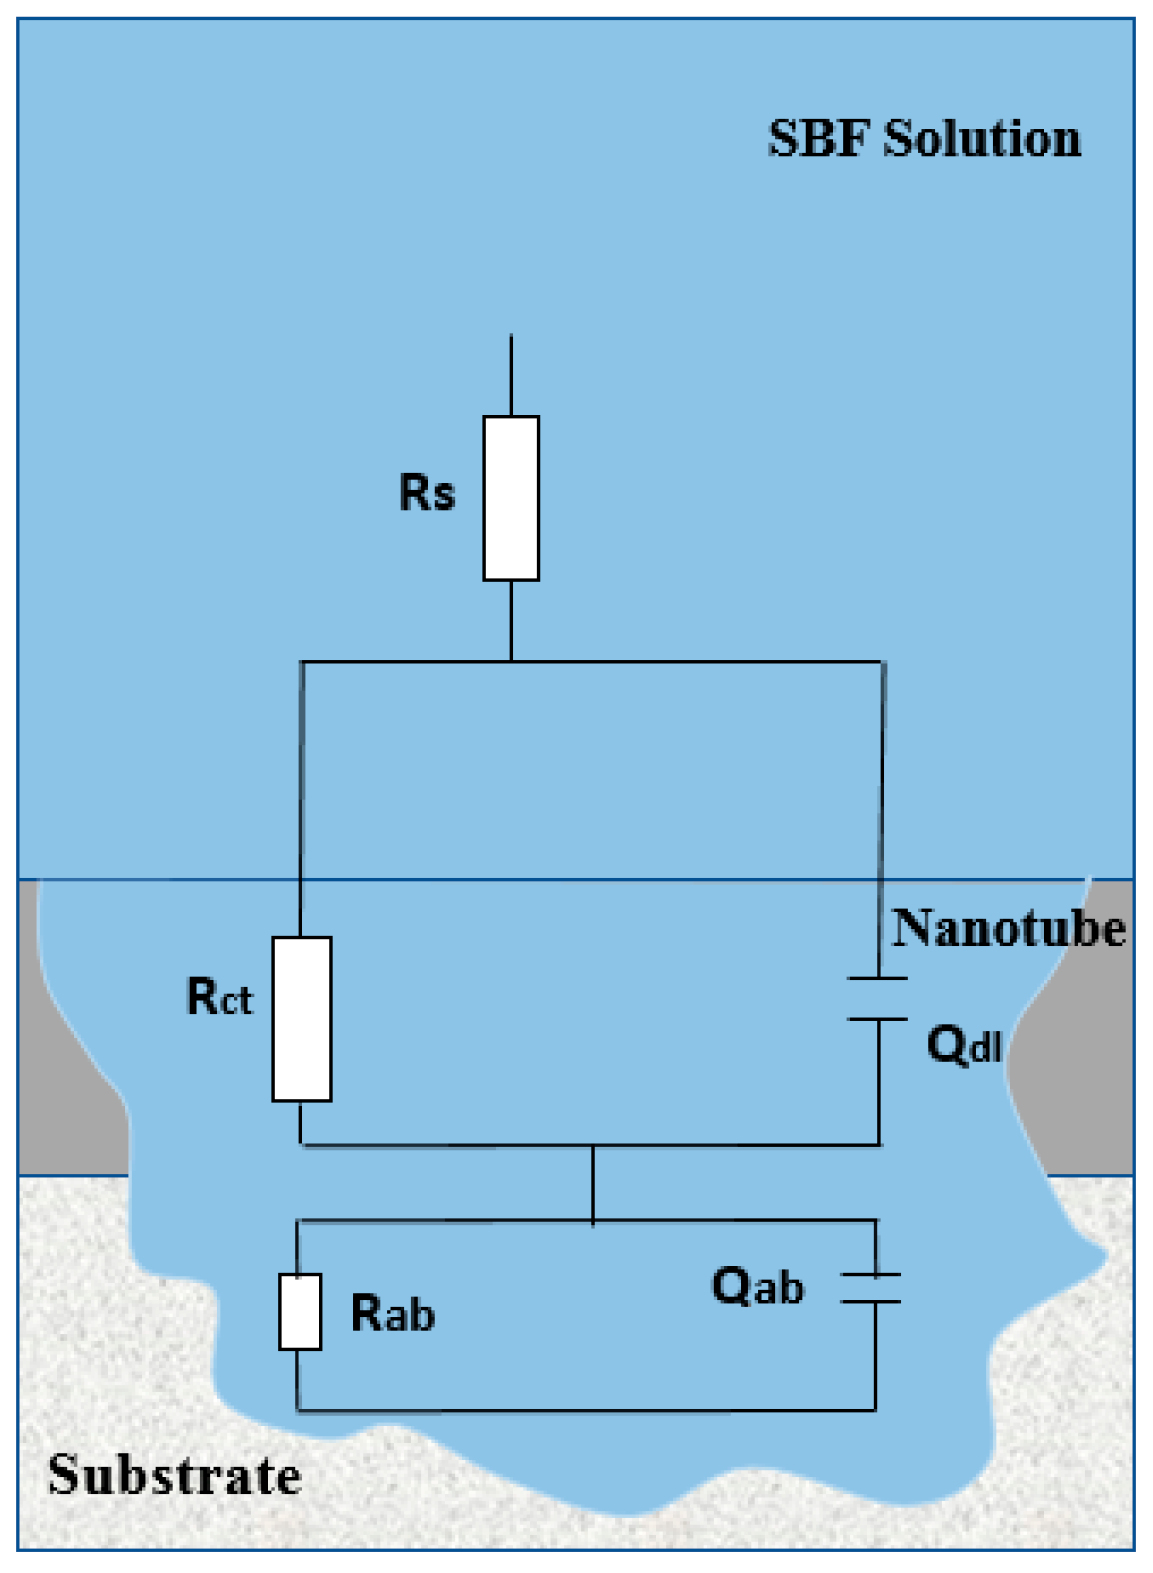
The equivalent circuit proposed (Figure 21) for fitting the experimental data is Rs (Qdl·Rct)(Qab·Rab).
Table 7 and Table 8 hold the values of the key parameters such as the solution resistance Rs (the high-frequency intercept of the impedance curve with the real axis (Z’)) and charge transfer resistance Rct (the diameter of the semicircle in the Nyquist plot) were extracted, to determine the double-layer capacitance Cdl, the following equation is used for ideal electrochemical systems [41]:
C d l = ( Y d l R c t ) 1 n d l R c t
where Ydl stands for double-layer admittance, obtained by fitting the Nyquist curves of the EIS, and Rct is the charge transfer resistance. Moreover, Qdl, Yab, and nab are the constant phase element (CPE) parameters in non-ideal electrochemical systems, which is our case. Qdl is used to replace the ideal double-layer capacitance Cdl. These parameters account for surface roughness, inhomogeneities, and non-ideal capacitive behavior at the electrode/electrolyte interface; the relation between them is given by the following equation [41]:
Z C P E = 1 Y C P E ( j w ) n
where YCPE and n are the admittance and the exponent parameter different from unity, respectively.
Assessing the results, it seems that the Rs shows minimal variation, implying consistency in electrolyte resistance. This value is at its highest for the 20-cycle sample, which may indicate a less conductive electrolyte, but it does not directly indicate corrosion resistance. As for the Rct, it represents the resistance to charge transfer at the electrode/electrolyte interface; however, it peaks at 15 and 30 cycles, revealing the highest resistance to charge transfer, hence better corrosion resistance. Rab increases with the increase of PbS deposition to a maximum of 205 Ω·cm2 for 30 cycles. This means that excessive PbS nanoparticle coverage reduces charge mobility and traps electrons at the interface by forming a Schottky barrier. On the contrary, Table 8 exhibits a variation of Qab (absorption capacitance) value with the variation of the number of PbS deposition cycles. It seems that it is decreasing with the expansion of deposition cycles, which could mean that as the PbS nanoparticles build up, potentially forming a denser protective layer, they reduce the active surface area and, therefore, reduce charge trapping. This is specifically the case for the 30-cycle sample. As observed in the SEM images, PbS NPs may passivate or block these defect sites, reducing charge absorption and lowering Qab. However, this value seems to be higher for the 15-cycle sample (0.9 Fsn−1cm−2), which could be due to the good dispersion of PbS nanoparticles. It introduces more electrochemically active sites as well as bulk defect states, which can trap and store charge effectively, thus enhancing Qab while forming a thicker passive layer and improving corrosion resistance [42,43]. Also, Warburg impedance (W) appears if diffusion of reactants or corrosion products is a factor, which indicates the existence of passive films [43]. The moment TiO2 nanotubes were in contact with PbS nanoparticles for the first 10 cycles, the W value reached 7.8 × 10⁻³ Fs−0.5cm−2 due to the formation of a smoother surface and a more intact layer compared to the other samples, as the deposition continued the Warburg Impedance decreases for a minimum 1.99 × 10⁻³ Fs−0.5cm−2 for 25 cycles and increases again to a maximum of 3.19 Fs−0.5cm−2 for 30 cycles, which is three times higher than the other samples indicating a thicker passive film slowing ion movement and possible diffusion-controlled corrosion. In addition, these results are in correlation with charge transfer resistance Rct; they highlight the influence of film composition and morphology on corrosion resistance. Hafedh et al. [44] studied the corrosion behavior, where the EIS results show that the TiO2 + 10-min coated sample demonstrates the best corrosion resistance. The coating features a dense, uniform distribution of well-crystallized particles, creating a compact barrier that effectively shields against corrosion. Moreover, the Chi-squared (χ2) values less than 10−3 affirm the accuracy of the fit of the used model.

4. Conclusions

The synthesis of TiO2 NTs by anodization of titanium proves to be a significant method for improving the surface properties of the material, especially for protective layer applications.
This study focused on the development of thin layers based on titanium dioxide (TiO2), obtained through anodization and decorated with PbS NPs deposited via the SILAR method on a titanium substrate. We particularly focused on the effect of the association of PbS NPs with TiO2 NTs for the purpose of improving their performance in various fields of application, particularly for protective applications, so the samples were characterized morphologically, structurally, mechanically, and electrochemically.
Furthermore, it is concluded that the quality of the deposit, the structure, and the crystalline size of the prepared systems depend on the number of SILAR cycles, as well as the distribution and the size of PbS NPs. The size increases from 8 to 14 nm when the number of SILAR cycles increases from 10 to 30. The mechanical characterization by microhardness test showed that the coatings presented good intrinsic properties after being deposited with different numbers of PbS cycles: the hardness increased from 55.9 ± 2.02 HV for pure TiO2 NTs to 94.96 ± 1.68 HV after being deposited with 15 cycles of PbS by SILAR. Furthermore, it was demonstrated that wear resistance increased with increasing number of cycles, with the greatest resistance to wear obtained with 15 cycles. An energetic wear evaluation revealed that the energetic wear coefficient of pure TiO2 NTs was higher than that of the films after being subjected to different numbers of cycles. This result confirms the good wear resistance of the coatings at 15 cycles. Additionally, the adhesion of the coating to the substrate was measured by the scratch test, which demonstrated better cohesion and adhesion of the coating. The Tafel curves and EIS results proved that the deposition of PbS nanoparticles improves corrosion resistance. Based on the results, the sample with 15 cycles appears to have the best corrosion resistance. This is indicated by the peak in charge transfer resistance (Rct) at 15 cycles, which suggests higher resistance to charge transfer at the electrode/electrolyte interface, a key factor in corrosion resistance. Additionally, the absorption capacitance (Qab) is higher for the 15-cycle sample, likely due to better dispersion of PbS nanoparticles that increase electrochemically active sites and enhance corrosion protection. These combined properties highlight the potential of PbS/TiO2 nanotube coatings as high-performance protective layers for components operating in harsh mechanical and corrosive environments, such as in aerospace, marine, chemical processing, and automotive systems.

Author Contributions

Conceptualization, H.D., J.G. and M.B.R.; methodology, H.D. and S.S.; software, W.Z.; validation, M.A.H., S.S. and A.H.; formal analysis, M.G. and A.H.; investigation, M.S. and K.C.; resources, M.S. and M.B.R.; data curation, L.K. and M.A.A.; writing—original draft preparation, H.D., W.Z. and M.G.; writing—review and editing, J.G., M.A.A., M.B.R. and A.H.; visualization, A.H.; supervision, M.B.R., L.K. and A.H.; project administration, K.C.; funding acquisition, K.C. All authors have read and agreed to the published version of the manuscript.

Funding

This work was supported and funded by the Deanship of Scientific Research at Imam Mohammad Ibn Saud Islamic University (IMSIU) (grant number: IMSIU-DDRSP2602).

Data Availability Statement

The original contributions presented in the study are included in the article; further inquiries can be directed to the corresponding author.

Conflicts of Interest

The authors declare no conflicts of interest.

References

  1. Antony Jose, S.; Lapierre, Z.; Williams, T.; Hope, C.; Jardin, T.; Rodriguez, R.; Menezes, P.L. Wear-and corrosion-resistant coatings for extreme environments: Advances, challenges, and future perspectives. Coatings 2025, 15, 878. [Google Scholar] [CrossRef] [Scilit]
  2. Firoozi, A.A.; Firoozi, A.A.; Saidani, T. Advancing durability in the energy sector: Novel high-temperature resistant coatings and their challenges. Ain Shams Eng. J. 2025, 16, 103431. [Google Scholar] [CrossRef] [Scilit]
  3. Dhiflaoui, H.; Khlifi, K.; Barhoumi, N.; Ben Cheikh Larbi, A. The tribological and corrosion behavior of TiO2 coatings deposited by the electrophoretic deposition process. Proc. Inst. Mech. Eng. Part C 2020, 234, 1231–1238. [Google Scholar] [CrossRef] [Scilit]
  4. Serov, D.A.; Gritsaeva, A.V.; Yanbaev, F.M.; Simakin, A.V.; Gudkov, S.V. Review of antimicrobial properties of titanium dioxide nanoparticles. Int. J. Mol. Sci. 2024, 25, 10519. [Google Scholar] [CrossRef] [Scilit]
  5. Podelinska, A.; Neilande, E.; Pankratova, V.; Serga, V.; Bandarenka, H.; Burko, A.; Piskunov, S.; Pankratov, V.A.; Sarakovskis, A.; Popov, A.I.; et al. Structural and Spectroscopic Characterization of TiO2 Nanocrystalline Materials Synthesized by Different Methods. Nanomaterials 2025, 15, 498. [Google Scholar] [CrossRef] [Scilit]
  6. Nogueira, R.P.; Jose, D.U.; Fanny, H.; de Fátima Santana-Melo, G.; Luana, M.R.V.; Fernanda, R.M.; Virginie Ro Alberto, M.J.J.; Anderson, O.L. Characterization of optimized TiO2 nanotubes morphology for medical implants: Biological activity and corrosion resistance. Int. J. Nanomed. 2021, 2021, 667–682. [Google Scholar] [CrossRef] [Scilit]
  7. Cheng, Y.; Hui, Y.; Yun, Y.; Jianying, H.; Ke, W.; Zhong, C.; Xiaoqin, W.; Changjian, L.; Yuekun, L. Progress in TiO2 nanotube coatings for biomedical applications: A review. J. Mater. Chem. B 2018, 6, 1862–1886. [Google Scholar] [CrossRef] [Scilit]
  8. Wang, Y.; Cuie, W.; Peter, H.; Yuncang, L. Biocompatibility of TiO2 nanotubes with different topographies. J. Biomed. Mater. Res. A 2014, 102, 743–751. [Google Scholar] [CrossRef] [Scilit]
  9. Su, E.P.; Justin, D.F.; Pratt, C.R.; Sarin, V.K.; Nguyen, V.S.; Jin, S. Effects of titanium nanotubes on the osseointegration, cell differentiation, mineralisation and antibacterial properties of orthopaedic implant surfaces. Bone Jt. J. 2018, 100, 9–16. [Google Scholar] [CrossRef] [Scilit]
  10. Zhang, J.; Li, G.; Zhang, X.; Liu, Z.; Guo, Z.; Ullah, I.; Zhang, S.; Man, J.; Li, D. Systematically evaluate the physicochemical property and hemocompatibility of phase dependent TiO2 on medical pure titanium. Surf. Coat. Technol. 2020, 404, 126501. [Google Scholar] [CrossRef] [Scilit]
  11. Sun, Y. Tribological rutile-TiO2 coating on aluminium alloy. Appl. Surf. Sci. 2024, 233, 328–335. [Google Scholar] [CrossRef] [Scilit]
  12. Du, K.; Liu, G.; Chen, X.; Wang, K. PbS Quantum Dots Sensitized TiO2 Nanotubes for Photocurrent Enhancement. J. Electrochem. Soc. 2015, 162, 251. [Google Scholar] [CrossRef] [Scilit]
  13. Pérez-García, C.E.; Meraz-Dávila, S.; Arreola-Jardón, G.; Moure-Flores, F.; Ramírez-Bon, R.; Vorobiev, Y.V. Characterization of PbS films deposited by successive ionic layer adsorption and reaction (SILAR) for CdS/PbS solar cells application. Mater. Res. Express 2020, 7, 015530. [Google Scholar] [CrossRef] [Scilit]
  14. Jemai, S.; Anouar, H.; Faisal, B.; Imen, H.; Bernabé, M.S.; Brahim, B. Crystal growth and design of various shapes of PbS micro and nanocrystals from a hydrothermal process. Mater. Charact. 2021, 175, 111036. [Google Scholar] [CrossRef] [Scilit]
  15. Yun, G.; Juanrui, Z.; Rongjie, G. Preparation of PbS/TiO2 nanotube films for enhanced photoelectrochemical response and cathodic protection performance. Mater. Today Commun. 2024, 41, 110757. [Google Scholar]
  16. Hajjaji, A.; Jemai, S.; Rebhi, A.; Trabelsi, K.; Gaidi, M.; Alhazaa, A.N.; Al-Gawati, M.A.; El Khakani, M.A.; Bessais, B. Enhancement of photocatalytic and photoelectrochemical properties of TiO2 nanotubes sensitized by SILAR-Deposited PbS nanoparticles. J. Materiomics. 2020, 6, 62–69. [Google Scholar] [CrossRef] [Scilit]
  17. ElZein, B.; Abulikemu, M.; Barham, A.S.; AlKilani, A.; Alkhatab, M.I.; Hamdan, S.M.; Dogheche, E.; Jabour, G.E. In situ Growth of PbS Nanoparticles Without Organic Linker on ZnO Nanostructures via Successive Ionic Layer Adsorption and Reaction (SILAR). Coatings 2022, 12, 1486. [Google Scholar] [CrossRef] [Scilit]
  18. Algethami, F.K.; Khaled, T.; Anouar, H.; Mohamed, B.R.; Lotfi, K.; Mohamed, R.E.; Brahim, B.; My Ali El, K. Photocatalytic activity of silicon nanowires decorated with PbS nanoparticles deposited by pulsed laser deposition for efficient wastewater treatment. Materials 2022, 15, 4970. [Google Scholar] [CrossRef] [Scilit]
  19. Steinmann, P.A.; Tardy, Y.; Hintermann, H.E. Adhesion testing by the scratch test method: The influence of intrinsic and extrinsic parameters on the critical load. Thin Solid Film. 1987, 154, 333–349. [Google Scholar] [CrossRef] [Scilit]
  20. Chernozem, R.V.; Surmeneva, M.A.; Krause, B.; Baumbach, T.; Ignatov, V.P.; Tyurin, A.I.; Loza, K.; Epple, M.; Surmenev, R.A. Hybrid biocomposites based on titania nanotubes and a hydroxyapatite coating deposited by RF-magnetron sputtering: Surface topography, structure, and mechanical properties. Appl. Surf. Sci. 2017, 426, 229–237. [Google Scholar] [CrossRef] [Scilit]
  21. Dhiflaoui, H.; Khlifi, K.; Barhoumi, N.; Ben Cheikh Larbi, A. Effet de la tension sur la microstructure et son influence sur la corrosion et les propriétés tribologiques des revêtements TiO2. J. Mater. Rés. Technol. 2020, 9, 5293–5303. [Google Scholar] [CrossRef] [Scilit]
  22. Banday, S.; Wani, M.F. Nanoscratch resistance and nanotribological performance of Ti/MoS2 coating on Al-Si alloy deposited by pulse laser deposition technique. J. Tribol. 2019, 141, 022003. [Google Scholar] [CrossRef] [Scilit]
  23. Yang, Y.; Edward, C. Influence of residual stress on bonding strength and fracture of plasma-sprayed hydroxyapatite coatings on Ti–6Al–4V substrate. Biomaterials 2001, 22, 1827–1836. [Google Scholar] [CrossRef] [Scilit] [PubMed]
  24. Yoon, Y.; Jeongwon, P. The effects of nanostructures on the mechanical and tribological properties of TiO2 nanotubes. Nanotechnology 2018, 29, 165705. [Google Scholar] [CrossRef] [Scilit]
  25. Jaworski, R.; Pawlowski, L.; Roudet, F.; Kozerski, S.; et Petit, F. Caractérisation des propriétés mécaniques des revêtements de TiO2 pulvérisés au plasma en suspension à l’aide d’un test de rayure. Surf. Manteau. Technol. 2008, 202, 2644. [Google Scholar]
  26. Djamel, B.; Ali, B.; Hamid, Z.; Youcef, M. Étude de l’influence du paramètre charge sur le comportement en frottement et usure du couple dynamique sec bronze-acier. Sci. Technol. B 2016, 44, 17–21. [Google Scholar]
  27. Martínez-González, C.J.; Flores-Jiménez, M.F.; Bravo-Barcenas, D.I.; Jiménez-Alemán, O.; Flores-Martínez, M. Mechanical and Tribological Properties of the CrAl/CrAlN and CrAl/CrAlN-(a-CNx) Multilayers Deposited by HIPIMS. Coatings 2023, 13, 1344. [Google Scholar] [CrossRef] [Scilit]
  28. Shima, M.; Okado, J.; McColl, I.R.; Waterhouse, R.B.; Hasegawa, T.; Kasaya, M. The influence of substrate material and hardness on the fretting behaviour of TiN. Wear 1999, 225–229, 38–45. [Google Scholar] [CrossRef] [Scilit]
  29. Ramesh, R.; Gnanamoorthy, R. Development of a fretting wear test rig and preliminary studies for understanding the fretting wear properties of steels. Mater. Des. 2006, 27, 141–146. [Google Scholar] [CrossRef] [Scilit]
  30. Ben Jaber, N.; Drevet, R.; Fauré, J.; Demangel, C.; Potiron, S.; Tara, A.; Ben Cheikh Larbi, A.; Benhayoune, H. A New Process for the Thermal Treatment of Calcium Phosphate Coatings Electrodeposited on Ti6Al4V Substrate. Adv. Eng. Mater. 2015, 17, 1608–1615. [Google Scholar] [CrossRef] [Scilit]
  31. Cartier, M.; Kapsa, P. Usure des Contacts Mécaniques—Problématique et Définitions. Tech. L’ingénieur 2001. [Google Scholar] [CrossRef] [Scilit]
  32. Lavella, M. Propriétés de contact et comportement à l’usure du superalliage à base de nickel rené 80. Métaux 2016, 6, 159. [Google Scholar]
  33. Mohd Tobi, A.L.; Sun, W.; Shipway, P.H. Contact size, frequency and cyclic normal force effects on Ti–6Al–4V fretting wear processes: An approach combining friction power and contact oxygenation. Tribol. Int. 2017, 113, 474–486. [Google Scholar]
  34. Fouvry, S.; Liskiewicz, T.; Kapsa, P.; Hannel, S.; Sauger, E. An energy description of wear mechanisms and its applications to oscillating sliding contacts. Wear 2003, 255, 287–298. [Google Scholar] [CrossRef] [Scilit]
  35. Magaziner, R.S.; Jain, V.K.; Mall, S. Wear characterization of Ti–6Al–4V under fretting–reciprocating sliding conditions. Wear 2008, 264, 1002–1014. [Google Scholar] [CrossRef] [Scilit]
  36. Huq, M.Z.; Celis, J.P. Expressing Wear Rate in Sliding Contacts Based on Dissipated Energy. Wear 2002, 252, 375–383. [Google Scholar] [CrossRef] [Scilit]
  37. Wan, C.; Ling, Y.; Wang, S.; Pu, H.; Huang, Y.; Duan, X. Unraveling and Resolving the Inconsistencies in Tafel Analysis for Hydrogen Evolution Reactions. ACS Cent. Sci. 2024, 10, 658–665. [Google Scholar] [CrossRef] [Scilit] [PubMed]
  38. Kelly, R.G.; Scully, J.R.; Shoesmith, D.; Buchheit, R.G. Electrochemical Techniques in Corrosion Science and Engineering; Schweitzer, P.A., Ed.; CRC Press: Boca Raton, FL, USA, 2003. [Google Scholar]
  39. Hernández, H.H.; Reynoso, A.M.R.; Juan, C.; González, T.; Morán, C.O.G. Electrochemical impedance spectroscopy (EIS): A review study of basic aspects of the corrosion mechanism applied to steels. In Electrochemical Impedance Spectroscopy; IntechOpen: London, UK, 2020; Chapter 8; pp. 137–144. Available online: https://hdl.handle.net/20.500.11799/110050 (accessed on 26 February 2026).
  40. Lazanas, A.C.; Prodromidis, M.I. Electrochemical impedance spectroscopy—A tutorial. ACS Meas. Sci. 2023, 3, 162–193. [Google Scholar] [CrossRef] [Scilit] [PubMed]
  41. Qiao, J.; Wang, Q.; Xiao, Y. High-efficiency photoelectrochemical performance of PbS nanoparticles sensitized TiO2 nanotube arrays. J. Appl. Electrochem. 2014, 44, 1007–1011. [Google Scholar] [CrossRef] [Scilit]
  42. Hong, J.; Hou, B.; Lim, J.; Pak, S.; Kim, B.S.; Cho, Y.; Lee, J.; Lee, Y.W.; Giraud, P.; Lee, S.; et al. Enhanced charge carrier transport properties in colloidal quantum dot solar cells via organic and inorganic hybrid surface passivation. J. Mater. Chem. A 2016, 4, 18769–18775. [Google Scholar] [CrossRef] [Scilit]
  43. Liu, M.; Zhu, J.N.; Popovich, V.A.; Borisov, E.; Mol, J.M.C.; Gonzalez-Garcia, Y. Corrosion and passive film characteristics of 3D-printed NiTi shape memory alloys in artificial saliva. Rare Met. 2023, 42, 3114–3129. [Google Scholar] [CrossRef] [Scilit]
  44. Dhiflaoui, H.; Zayani, W.; Dabaki, Y.; Hajjaji, M.A.; Bessadok-Jemai, A.; Khezami, L.; Karrech, A.; Gaidi, M.; Amlouk, M.; Larbi, A.B.C.; et al. Corrosion Study of TiO2 Nanotubes Decorated with Ag Silver Nanoparticles Prepared by Photoreduction Process. J. Mater. Eng. Performance 2024, 34, 16230–16243. [Google Scholar] [CrossRef] [Scilit]
Figure 1. Schematic illustration of the PbS/NTs TiO2 NPs fabrication using the SILAR method.
Crystals 16 00254 g001
Figure 2. Schematic illustrating the process of scratch testing.
Crystals 16 00254 g002
Figure 3. SEM images of (a) TiO2 NTs and (b) PbS NPs (15 cycles)/TiO2 NTs.
Crystals 16 00254 g003
Figure 4. (a) TEM images of PbS NPs (15 cycles)/TiO2 NTs and (b) HRTEM images of PbS NPs (15 cycles)/TiO2 NTs.
Crystals 16 00254 g004
Figure 5. (a) EDX analysis and (b) mapping of Ti, O, Pb, and S for PbS NPs deposited on TiO2 NTs (15 cycles).
Crystals 16 00254 g005aCrystals 16 00254 g005b
Figure 6. Diffractogram of pure TiO2 nanotubes decorated with PbS (A, P, and O represent TiO2, PbS, and Pb(SO4), respectively) [16].
Crystals 16 00254 g006
Figure 7. Variation of microhardness with the number of cycles.
Crystals 16 00254 g007
Figure 8. Evolution of the tangential force and the indenter penetration depth in TiO2 nanotubes as a function of the applied normal load, (a) before deposition of PbS NPs (Pure TiO2) and after deposition of (b) 10, (c) 15, (d) 20, (e) 25, and (f) 30 SILAR cycles of PbS NPs.
Crystals 16 00254 g008aCrystals 16 00254 g008b
Figure 9. SEM observation of the scratch mark (Pure TiO2).
Crystals 16 00254 g009
Figure 10. SEM observation of the scratch mark (TiO2 + 10 cycles of PbS).
Crystals 16 00254 g010
Figure 11. SEM observation of the scratch mark (TiO2 + 15 cycles of PbS).
Crystals 16 00254 g011
Figure 12. SEM observation of the scratch mark (TiO2 + 20 cycles of PbS).
Crystals 16 00254 g012
Figure 13. SEM observation of the scratch mark (TiO2 + 25 cycles of PbS).
Crystals 16 00254 g013
Figure 14. SEM observation of the scratch mark (TiO2 + 30 cycles of PbS).
Crystals 16 00254 g014
Figure 15. Coefficient of friction as a function of different normal loads.
Crystals 16 00254 g015
Figure 16. Evolution of dissipated energy as a function of different normal loads.
Crystals 16 00254 g016
Figure 17. Evolution of wear volume as a function of different normal loads.
Crystals 16 00254 g017
Figure 18. Variation of wear volume as a function of dissipated energy for the pure TiO2 coating before and after the deposition of a different number of cycles of PbS NPs.
Crystals 16 00254 g018
Figure 19. Tafel curves of (a) TiO2 + 10 cycles of PbS, (b) TiO2 + 15 cycles of PbS, (c) TiO2 + 20 cycles of PbS, (d) TiO2 + 25 cycles of PbS, and (e) TiO2 + 30 cycles of PbS.
Crystals 16 00254 g019
Figure 20. Nyquist experimental and modeling curves of (a) TiO2 + 10 cycles of PbS, (b) TiO2 + 15 cycles of PbS, (c) TiO2 + 20 cycles of PbS, (d) TiO2 + 25 cycles of PbS, and (e) TiO2 + 30 cycles of PbS.
Crystals 16 00254 g020aCrystals 16 00254 g020b
Figure 21. Proposed equivalent circuit.
Crystals 16 00254 g021
Table 1. Average size of PbS NPs deposited on TiO2 NTs with the variation of the number of cycles (Nc).
Number of CyclesDiameter (nm)
1013.5
1511.5
2016.5
2520
3022
Table 2. Variation of grain size at different deposition cycles for the preferred orientation PbS (200).
SamplesFWHM (rad)D (nm)
PbS (200) 10 cycles--
PbS (200) 15 cycles--
PbS (200) 20 cycles0.0034241.72706
PbS (200) 25 cycles0.0039536.14023
PbS (200) 30 cycles0.0039835.86729
Table 3. Variation of microhardness with the number of cycles.
Number of CyclesTiO2 PureTiO2 + 10
Cycles of PbS
TiO2 + 15 Cycles of PbSTiO2 + 20 Cycles of PbSTiO2 + 25 Cycles of PbSTiO2 + 30 Cycles of PbS
Microhardness
Hv
55.9 ±2.0268.13 ±1.8394.96 ±1.6871.1 ±1.5464.67 ±3.1858.86 ±1.73
Table 4. Critical loads obtained by scratch tests of the TiO2 coatings.
Numbers of CyclesLC1 (N)LC2 (N)LC3 (N)
TiO2 pure0.84 ± 0.043.12 ± 0.156.2 ± 0.31
TiO2 + 10 cycles of PbS0.9 ± 0.043.86 ± 0.196.4 ± 0.32
TiO2 + 15 cycles of PbS1.69 ± 0.085.07± 0.258.1 ± 0.4
TiO2 + 20 cycles of PbS1 ± 0.054.84 ± 0.246.7 ± 0.33
TiO2 + 25 cycles of PbS0.55 ± 0.023.83 ± 0.196 ± 0.3
TiO2 + 30 cycles of PbS1.07 ± 0.052.34 ± 0.115.07 ± 0.25
Table 5. Energetic wear coefficients and associated correlation parameter (R2) values for studied coatings.
ConditionEnergetic Wear Coefficient µm3/JCorrélation Paramètre
R2
TiO2 pure388,3200.99
TiO2 + 10 cycles of PbS440,0800.90
TiO2 + 15 cycles of PbS248,6900.91
TiO2 + 20 cycles of PbS252,5700.92
TiO2 + 25 cycles of PbS394,4300.99
TiO2 + 30 cycles of PbS299,0500.96
Table 6. Variation of Tafel key parameters of PbS/TiO2 with the number of SILAR cycles.
CyclesEcorr (V)icorr (mA)BaBc
10−0.300.2611.13 ± 0.4−5.71 ± 0.5
15−0.200.290.1 ± 0.76−13.26 ± 0.86
20−0.120.43.30 ± 0.23−5.2 ± 0.28
25−0.100.270.1 ± 1.18−1.81 ± 1.18
30−0.550.353.43 ± 4.12−0.1 ± 4.16
Table 7. Variation of EIS key parameters of PbS/TiO2 with the number of SILAR cycles.
CycleRs
(Ω·cm2)
Rct
(Ω·cm2)
QdlRab
(Ω·cm2)
Ydl
(μFsn−1cm−2)
ndl
103.42
0%
1.9
2.74%
0.45
18.4%
0.4
1.59%
65.2
4.57%
155.32
0%
4.49
2.56%
0.14
8.76%
0.5
1.26%
139.3
8.93%
207.25
0%
3.20
3.13%
0.051
5.98%
0.51
1.78%
150
5.01%
255.79
0%
2.65
3.24%
0.013
13.71%
0.52
1.33%
111.3
7.65%
306.34
0%
4.8
1.23%
0.1
11.78%
0.53
1.09%
205
4.69%
Table 8. Variation of EIS key parameters of PbS/TiO2 for a non-ideal system.
CycleQabW
Y0 (Fs−0.5cm−2)
χ2
(10−4)
Yab (Fsn−1cm−2)nab
100.0731.6%0.870.83%7.8 × 10−35.2%1.39
150.094.62%0.832.08%2.3 × 10−32.3%8.55
200.0364.31%0.940.58%2.8 × 10−35.4%2.49
250.0283.24%0.921.84%1.99 × 10−33.4%3.91
300.0312.85%0.931.04%3.19 × 10−33.49%4.59
Disclaimer/Publisher’s Note: The statements, opinions and data contained in all publications are solely those of the individual author(s) and contributor(s) and not of MDPI and/or the editor(s). MDPI and/or the editor(s) disclaim responsibility for any injury to people or property resulting from any ideas, methods, instructions or products referred to in the content.