1. Introduction
Thin metallic sheets are integral to the design of lightweight structures across diverse engineering sectors, including pressure vessels, aircraft fuselages, ship hulls, bridges, and automotive components. Their widespread adoption is largely attributed to their superior plane-stress fracture toughness relative to thicker sections, which enhances resistance to ductile crack propagation under service loads [
1]. However, the accurate characterization of fracture resistance in such thin configurations necessitates advanced methodologies capable of accounting for extensive plasticity, stable crack growth, and the development of a substantial fracture process zone ahead of the crack tip.
In ductile fracture mechanics, the load separation criterion provides a foundational framework for evaluating fracture parameters from single-specimen tests. Originally formalized by Sharobeam and Landes [
2,
3], this criterion posits that, in the post-yield regime, the applied load
can be decomposed into the product of two independent functions: a geometry-dependent function
, governed by the uncracked ligament size, and a material-deformation function
, characteristic of the plastic response. This decomposition enables the determination of key fracture parameters such as the
-integral and crack growth resistance curves—using the relation
, where
is derived from the geometry function. The approach not only facilitates precise identification of crack initiation and propagation but also eliminates the need for resource-intensive multi-specimen testing.
For metallic materials, single-specimen methods based on load separation have been successfully employed to determine
curves with minimal experimental effort [
4], in contrast to polymers, which often require extensive multi-specimen campaigns [
5]. This disparity has motivated the extension of load separation-based techniques—such as the normalization method and the separable parameter
method—to polymeric systems, where accurate fracture characterization remains challenging due to time-dependent deformation and complex damage mechanisms [
5].
Building on the dimensionless load separation principle introduced by Sharobeam and Landes [
2,
3], Bao et al. [
6] developed an improved normalization method specifically for compact tension (CT) and single-edge-notched bend (SEB) specimens, addressing limitations in traditional crack growth measurements. These techniques—such as the multiple specimen method, unloading compliance, and direct current potential drop—enable the determination of J-R curves by separating the load into geometry and material-deformation functions, facilitating single-specimen testing without extensive calibration. This methodology was subsequently validated for small-sized C-shaped specimens in the evaluation of J-R curves for SA-508 steel [
7]. In parallel, a range of direct and indirect techniques—including the multiple specimen method, unloading compliance [
8,
9]. Electric potential drop [
10], the normalized method [
11,
12,
13], and the
method [
14,
15,
16] have been widely employed to monitor crack extension in ductile fracture tests.
Despite their utility, both the normalization and
methods are subject to certain constraints. The normalization method relies on an empirical function to describe the normalized load–displacement relationship, which can compromise accuracy in post-blunting crack size estimation. The
method, in turn, is sensitive to the selection of the reference blunt-notched specimen. Recent refinements, such as the introduction of dual calibration points for initial and final crack lengths, have mitigated this dependency and enhanced
curve accuracy in rotor steels [
17].
The essential work of fracture (EWF) method offers a complementary energy-based approach for characterizing fracture in thin ductile sheets. Applied to 1.2 mm thick aluminum DENT specimens, Abdellah [
18] reported an essential work value
, with load–displacement curves exhibiting yielding at peak load followed by necking and tearing. Finite-element simulations—including both
-integral-based models and the extended finite-element method (XFEM)—validated these experimental findings, with XFEM demonstrating superior accuracy in predicting crack opening displacement and establishing a robust correlation between EWF parameters and the critical
-integral
[
18].
The load separation criterion further unifies experimental and numerical perspectives on ductile fracture. In the context of thin aluminum alloys, it complements both the EWF methodology [
18] and dynamic fracture investigations of 2024-T3 alloy [
19]. The criterion enables the extraction of essential work values consistent with conventional methods while offering additional insights through the separation parameter
, which serves as an internal indicator of crack initiation. This framework bridges experimental observations of rate-dependent toughness [
19] with numerical validations of stress and strain fields [
20], establishing a direct link between EWF parameters and
, thereby enhancing predictive capabilities for fracture in thin aluminium components [
13].
The versatility of load separation-based methods extends beyond metals. Rodríguez et al. [
21] evaluated both the normalization and
methods for determining
curves in ductile polymers. While both methods proved applicable, the normalization method exhibited superior accuracy and ease of implementation when validated against experimental data. For polycarbonate materials, these techniques have enabled reliable determination of fracture parameters from single-specimen tests, underscoring the broader relevance of the load separation principle across material classes [
22].
The load separation criterion has been extensively developed through modified normalization and variable separation approaches for fracture toughness evaluation. Several studies have demonstrated its effectiveness in analyzing ductile fracture under large-scale yielding and enabling single-specimen testing by separating geometry and deformation functions without direct crack growth monitoring. In addition, complementary experimental techniques, including digital image correlation and quantitative fractography, have been applied to capture strain fields and analyze fracture surface features, providing deeper insight into the relationship between microstructural characteristics and macroscopic toughness in engineering materials [
23,
24,
25,
26,
27].
In summary, the load separation criterion provides a robust and unified framework for ductile fracture characterization, applicable to both metallic and polymeric thin sheets. By enabling efficient single-specimen evaluation of fracture toughness and crack growth resistance, it supports improved design and safety assessment in lightweight engineering structures. The present study leverages this methodology to investigate the fracture behavior of thin aluminum sheets, integrating experimental EWF data with numerical simulations to validate and extend current understanding of ductile fracture mechanics.
It is hypothesized that the load separation criterion can be reliably applied to thin aluminum sheets under plane-stress conditions to extract fracture toughness parameters ( and ) that are consistent with those obtained from the established essential work of fracture (EWF) method. This would validate the load separation approach as a robust single-specimen alternative for ductile fracture characterization, eliminating the need for crack growth monitoring or extensive multi-specimen testing while maintaining accuracy and physical consistency.
The novelty of this work lies in its systematic validation of the load separation criterion against the EWF method using identical material (1.2 mm commercial aluminum), specimen geometry (DENT), and test conditions—a direct comparison not previously reported in the literature. The study further introduces a multi-faceted analytical framework integrating multiple curve-fitting techniques, three-dimensional surface visualization, heatmap analysis, and fractographic examination to comprehensively assess load separation applicability. The primary objectives are: (i) to experimentally characterize load–displacement behavior across ligament lengths of 4–20 mm; (ii) to determine the separation parameter , geometry function , and factor; (iii) to compute single-specimen values and compare them with the EWF benchmark ( kJ/m2); and (iv) to provide visual and analytical corroboration of size-dependent fracture behavior, thereby establishing the load separation criterion as a reliable tool for plane-stress fracture toughness evaluation in thin ductile sheets.
The novelty of this work lies in its systematic validation of the load separation criterion against the EWF method using identical material (1.2 mm commercial aluminum), specimen geometry (DENT), and test conditions—a direct comparison not previously reported in the literature. While Sharobeam and Landes [
2,
3] established the theoretical framework decades ago, its application to thin aluminum sheets lacked experimental validation against established energy-based methods. Recent advances in normalization techniques and the
method have extended LSC applications, yet no study has provided a comprehensive comparison with EWF for thin ductile sheets under identical conditions.
4. Results and Discussion
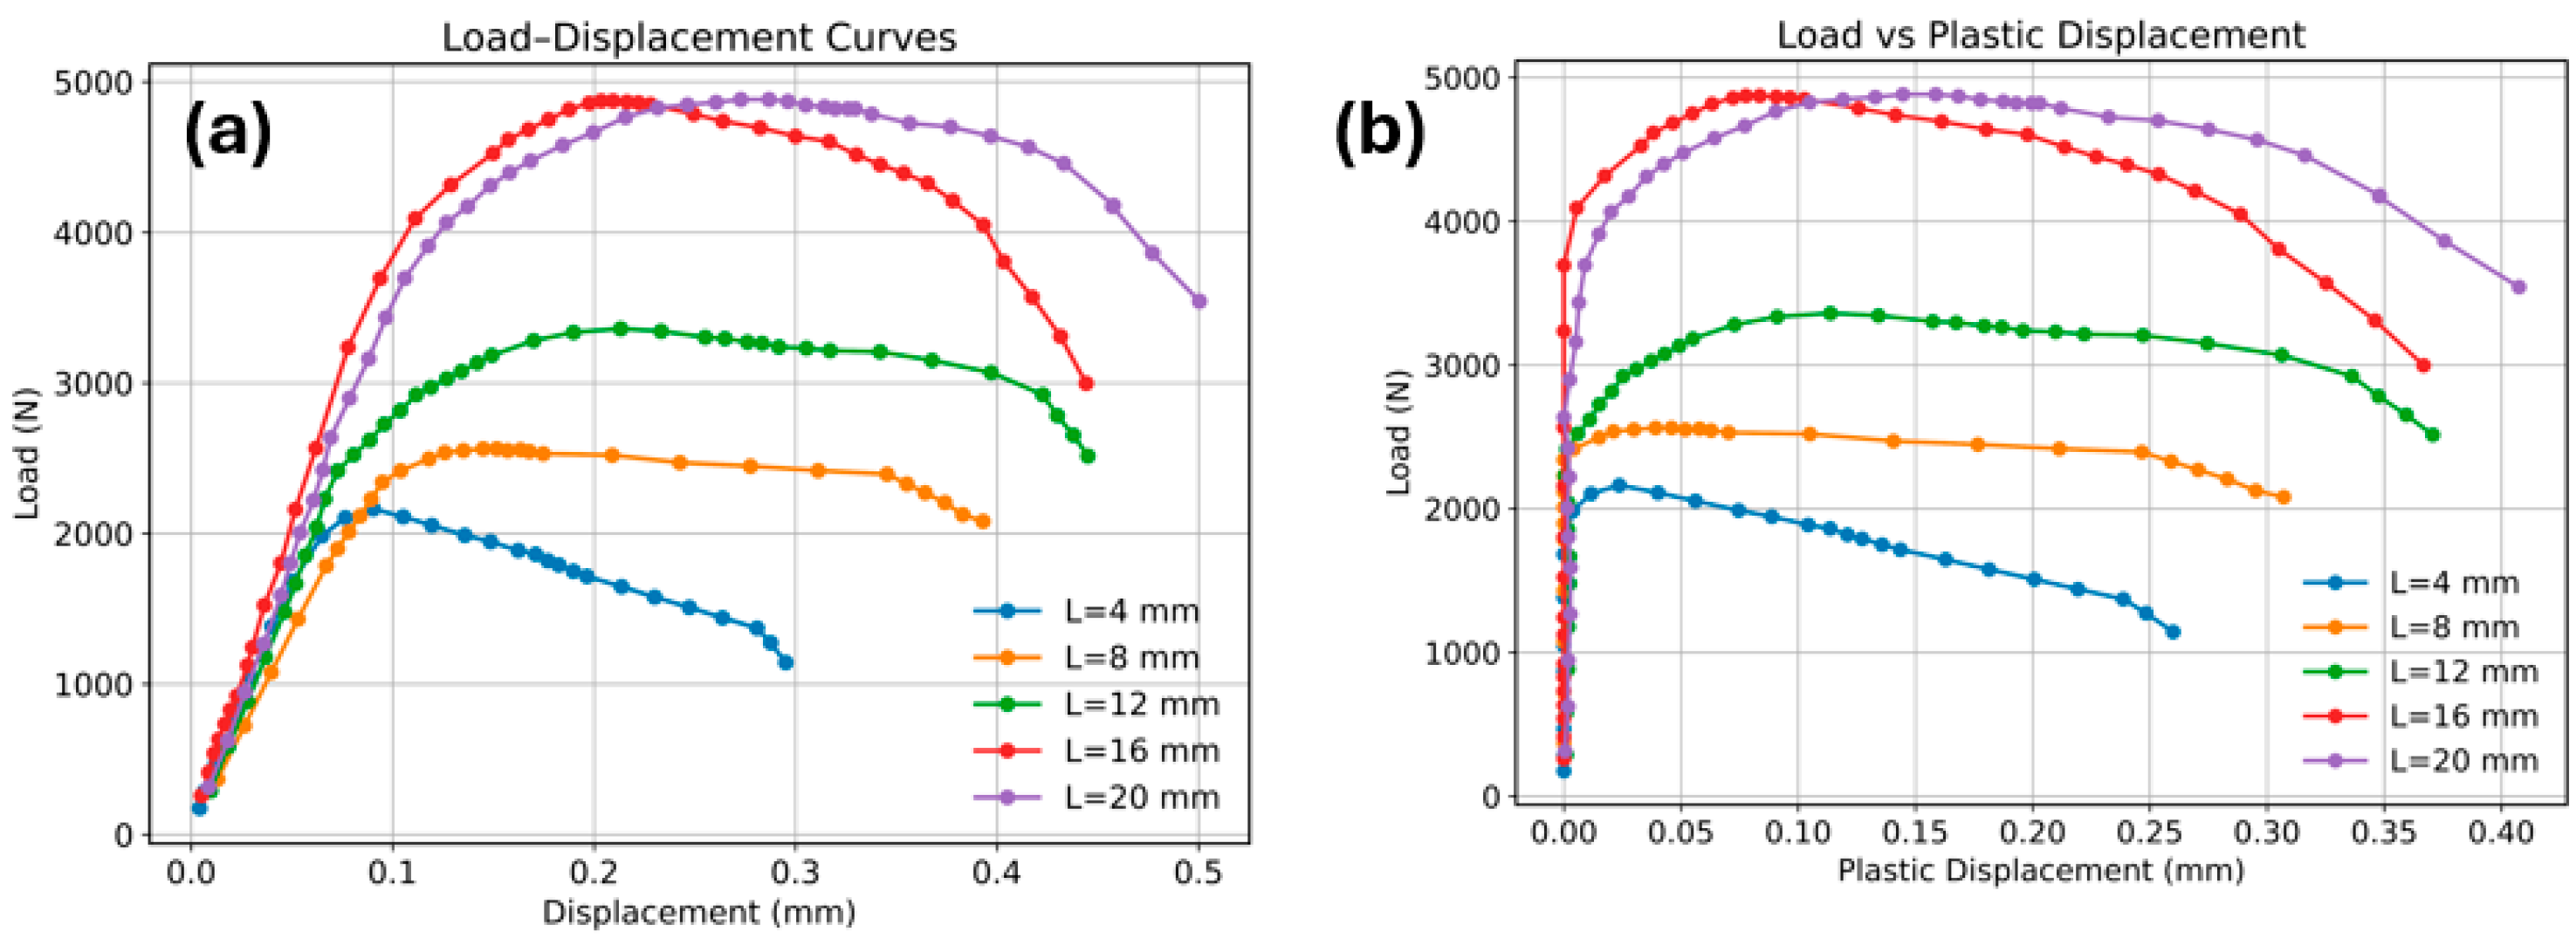
Figure 3 shows the load–displacement response of the DENT specimens with different ligament lengths (
and
mm).
Figure 3a presents the conventional load–total displacement curves, while
Figure 3b shows the corresponding load versus plastic displacement after subtracting the elastic component.
In
Figure 3a, all specimens exhibit a similar overall response characterized by an initial linear elastic region, followed by nonlinear plastic deformation and a gradual reduction in load after reaching the peak value due to stable crack growth. As the ligament length increases, both the maximum load and the total displacement at failure increase significantly. The specimen with the shortest ligament (
mm) reaches a peak load of approximately 2.1 kN, whereas the longest ligament (
mm) attains a peak load close to 4.9 kN. This trend reflects the larger effective load-bearing cross-section and greater plastic deformation capacity associated with longer ligaments. Additionally, specimens with larger ligaments display broader load–displacement curves, indicating greater energy absorption prior to fracture.
The same trend is observed in
Figure 3b, where the load is plotted against plastic displacement. After removing the elastic contribution, the curves reveal the plastic deformation behavior more clearly. The plastic displacement increases substantially with ligament length, and the load levels remain higher for longer ligaments across the entire deformation range. The
mm specimen maintains the highest load level, followed by
mm and
mm, while the shorter ligaments (
mm and
mm) show lower load-carrying capacity and earlier softening.
The gradual decline in load after the peak in both plots indicates stable crack propagation accompanied by significant plastic deformation, which is typical for ductile aluminum alloys tested under plane-stress-dominated conditions [
37,
38,
39]. The separation of the curves according to ligament length also confirms the strong geometric dependence of the load response, which forms the basis for the subsequent load separation analysis and geometry function evaluation presented in the following sections.
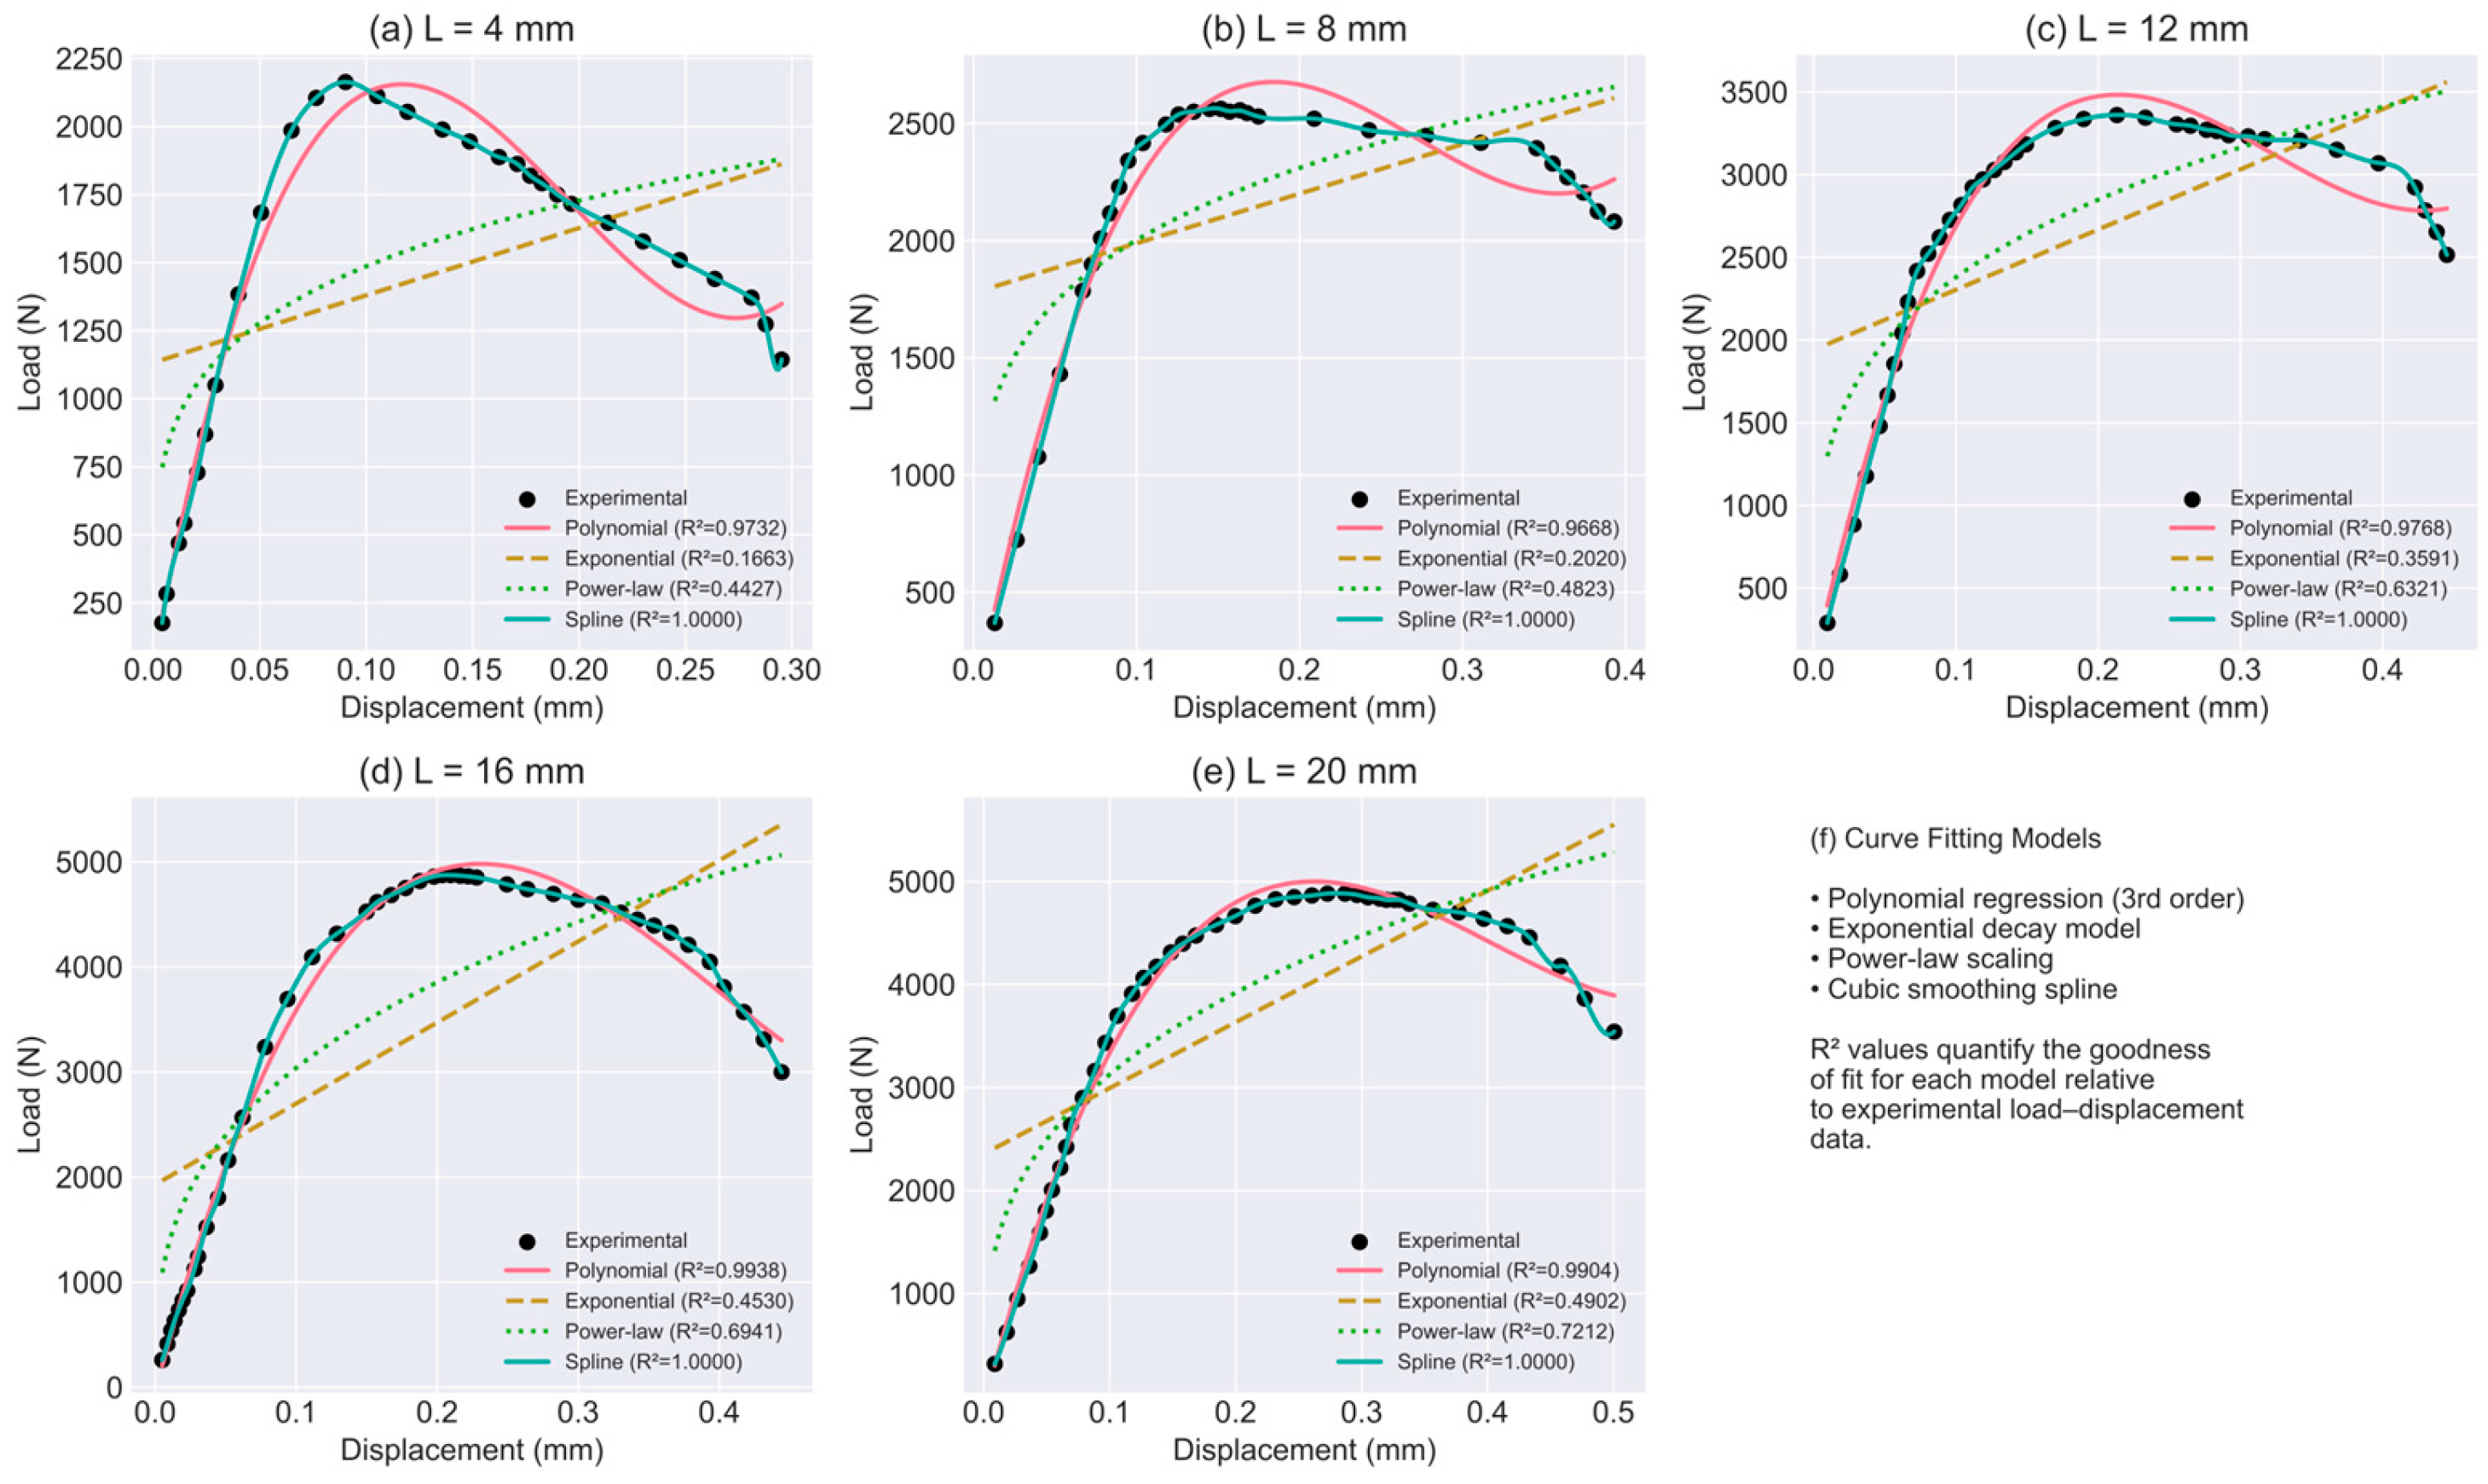
Figure 4 presents the experimental load–displacement responses of DENT specimens with ligament lengths of 4, 8, 12, 16, and 20 mm together with several fitting models, including a third-order polynomial, exponential decay, power-law, and cubic spline interpolation. The fitting comparison shows that the cubic spline interpolation provides the most accurate representation of the experimental data for all ligament lengths with R
2 ≈ 1.0000. The third-order polynomial regression also demonstrates very good agreement with the experimental curves, yielding R
2 values of 0.9732, 0.9668, 0.9768, 0.9938, and 0.9904 for L = 4, 8, 12, 16, and 20 mm, respectively. In contrast, the exponential model shows moderate fitting accuracy with R
2 values of 0.1663, 0.2002, 0.3591, 0.4530, and 0.4902, while the power-law model produces relatively lower agreement with R
2 values of 0.4427, 0.4823, 0.6231, 0.6941, and 0.7212 for the same ligament lengths. These results demonstrate that spline interpolation and polynomial regression provide the most reliable representation of the nonlinear load–displacement response and are therefore more suitable for subsequent fracture analyses such as load separation and essential work of fracture (EWF) evaluation.
For the load separation analysis, the load–displacement records were not extended to complete specimen failure. Instead, the analysis was truncated at a displacement corresponding to 50% of the maximum load on the post-peak softening branch. This limitation ensures that the separation criterion is applied within the regime of stable crack propagation, prior to ligament instability or uncontrolled tearing that could violate the assumptions of stationary crack geometry and proportional loading inherent in the load separation framework. Consequently, the separation parameters and the geometry function are determined from a deformation range characterized by stable plastic deformation and controlled crack growth, thereby improving the reliability of the extracted factor and the subsequent -integral estimation.
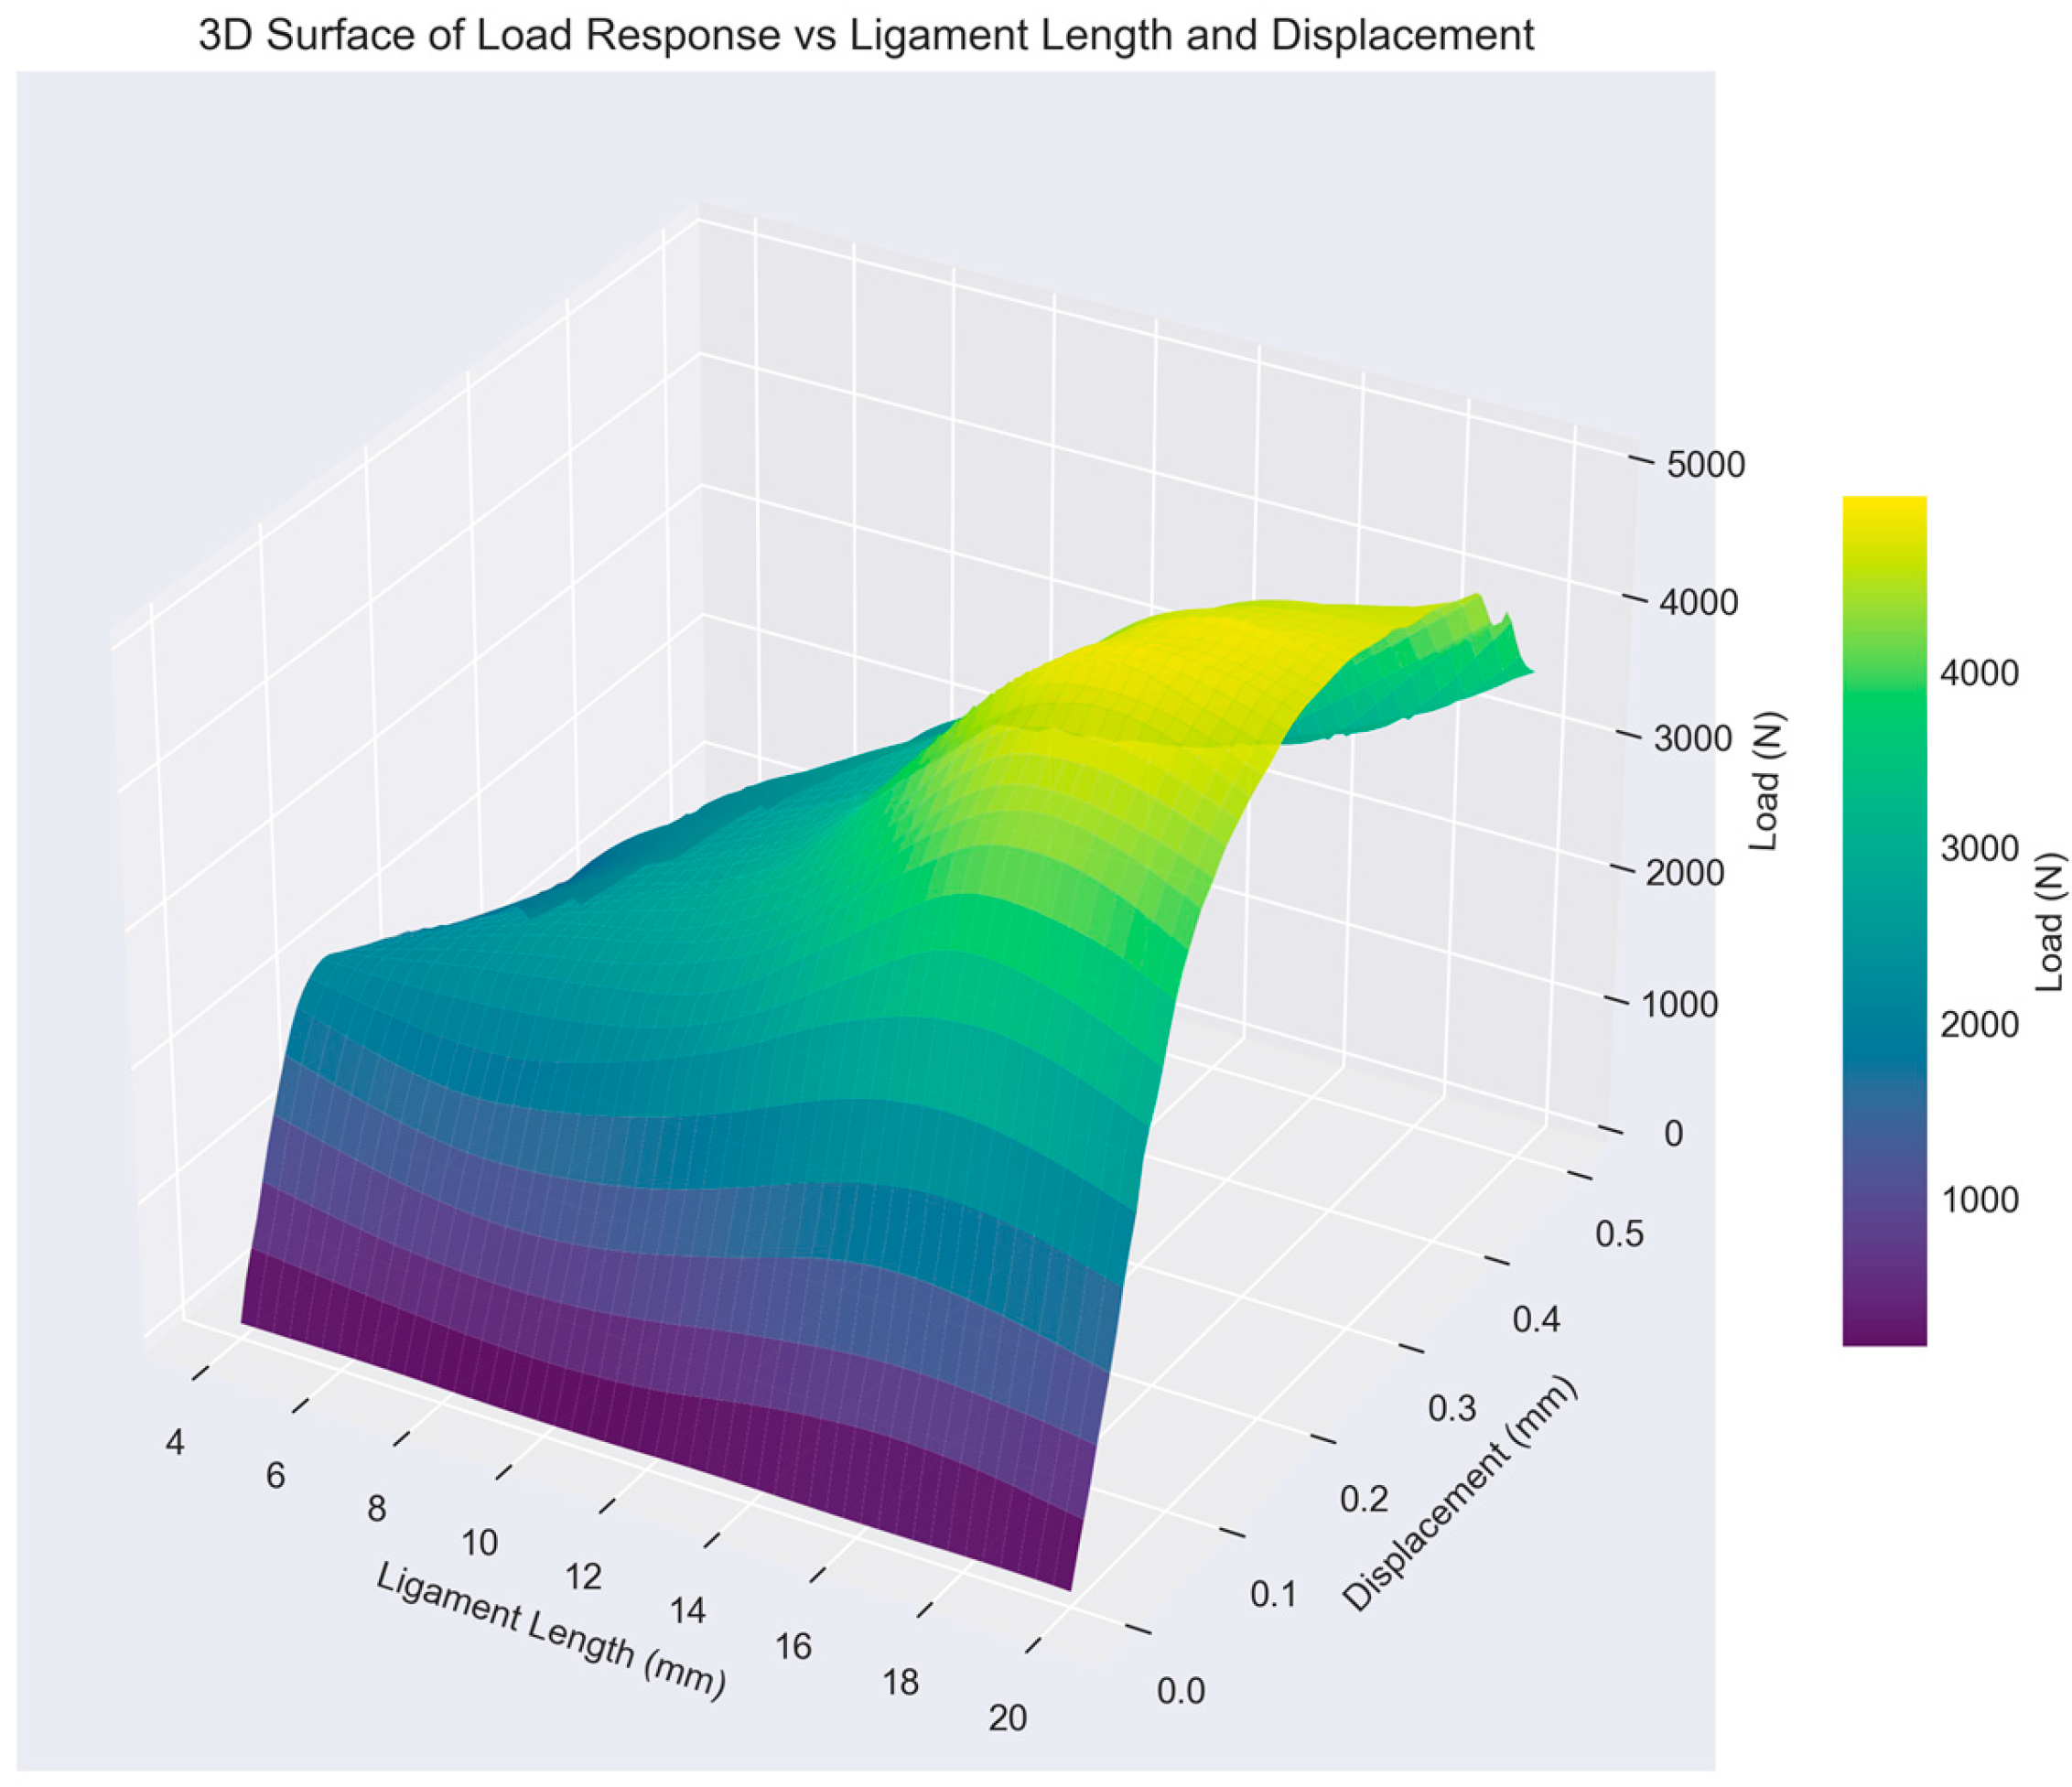
The three-dimensional surface plot in
Figure 5 illustrates the coupled dependence of load on both displacement and ligament length across the full experimental dataset (L = 4–20 mm). The surface displays a characteristic rising and peaking form, with loads increasing progressively from near-zero at small displacements to peak values reaching approximately 4000–5000 N. These peak loads are concentrated in the region of longer ligament lengths (around 16–20 mm) and moderate displacements (approximately 0.15–0.35 mm, with the highest density evident near 0.2–0.3 mm), reflecting the transition from an initially elastic response through pronounced yielding, necking, and eventual ductile tearing.
For shorter ligament lengths (L ≤ 8 mm), the surface remains significantly lower, showing reduced peak loads (often below 2000–3000 N) and an earlier onset of load plateauing or drop with increasing displacement. This is consistent with more constrained plastic zone development, limited ductility, and accelerated crack propagation or failure initiation in shorter ligaments.
The color gradient (from deep purple/blue at low loads to yellow at the highest loads) clearly highlights the highest load-carrying capacity in the mid-to-long ligament regime (L ≈ 10–20 mm), where the material can sustain substantially greater forces before failure. Across all ligament lengths, a steep drop-off in load is observed at larger displacements (>0.35–0.4 mm), indicating the point of final ligament rupture or complete failure, after which load-carrying capacity diminishes rapidly toward zero.
This visualization captures the strong nonlinear interaction between geometric constraint (ligament length) and deformation (displacement), emphasizing how longer ligaments enable higher peak loads and more extensive plastic deformation prior to failure.
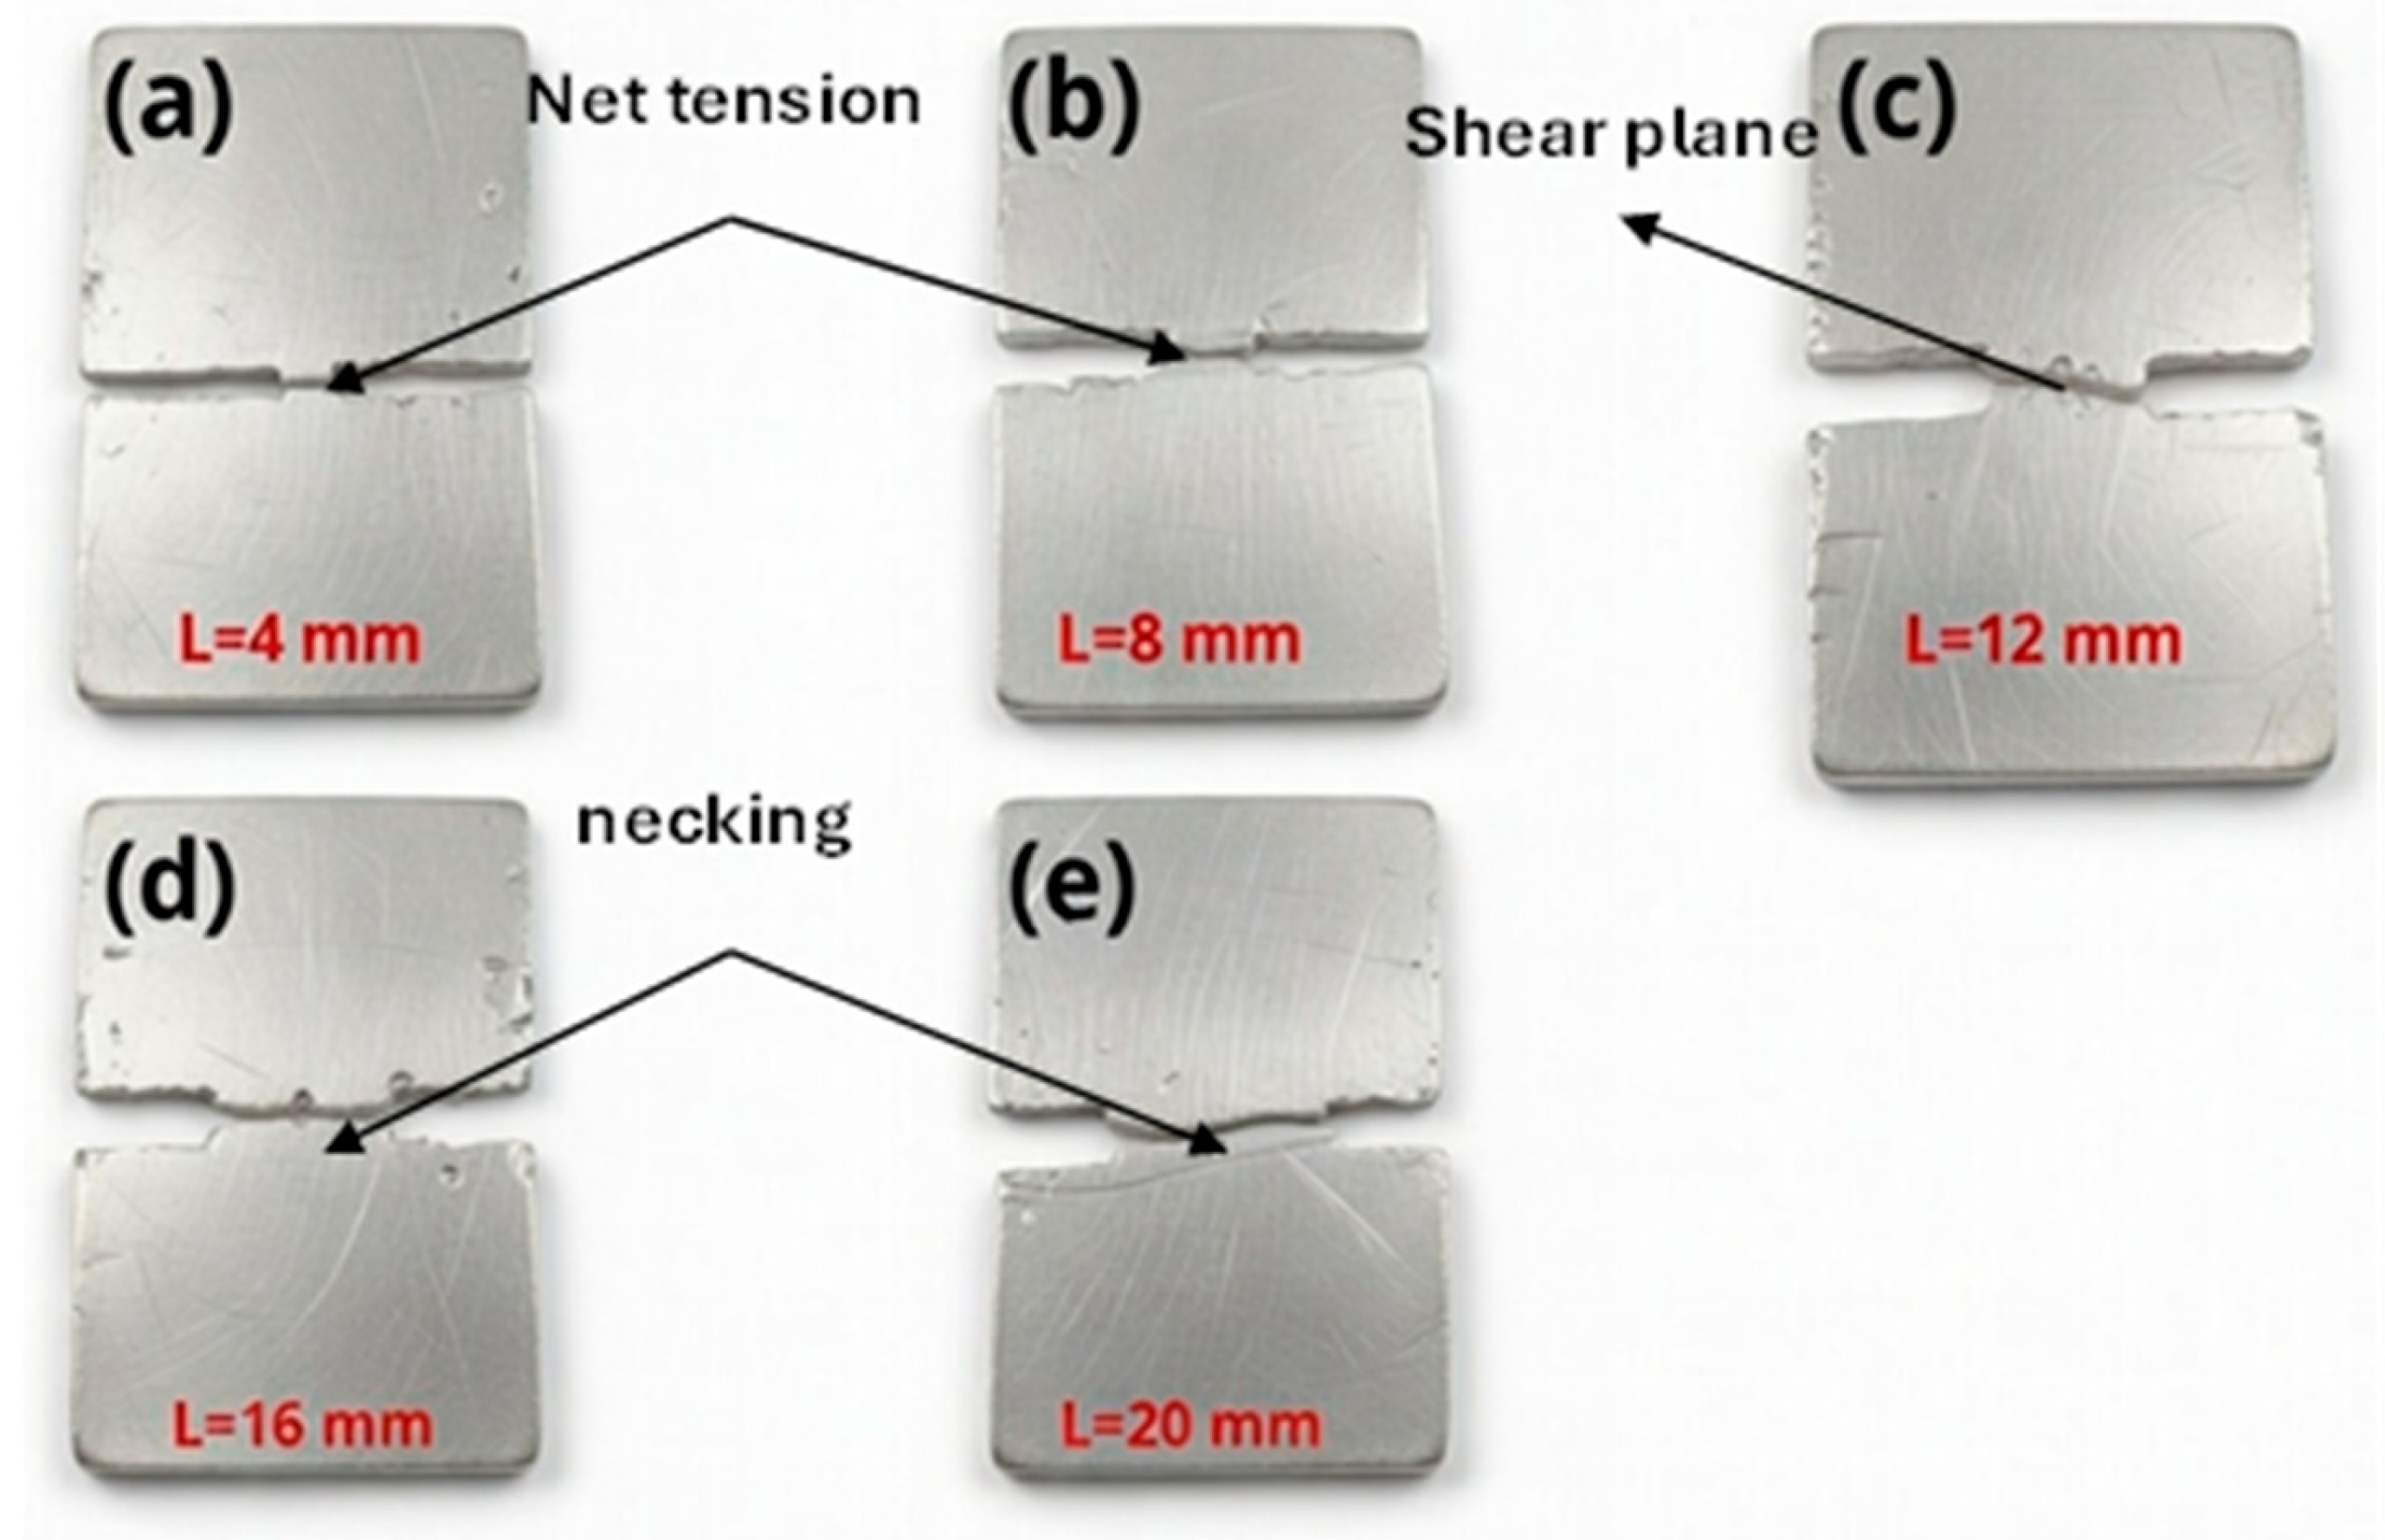
Post-fracture photographs of the double-edge-notched tension (DENT) specimens reveal a clear change in fracture morphology with increasing ligament length (see
Figure 6). For the shortest ligaments (L = 4 and 8 mm), the fracture surfaces are relatively flat and oriented nearly perpendicular to the loading direction. This morphology indicates predominantly net-section tensile fracture with limited plastic deformation prior to crack propagation. The small remaining ligament produces high stress concentration at the notch tips, leading to rapid crack coalescence across the ligament and a fracture path dominated by mode I opening.
At an intermediate ligament length (L = 12 mm), the fracture morphology begins to change, and a distinct shear plane becomes visible. The fracture surface shows a slight inclination relative to the loading axis, indicating the development of mixed-mode fracture where both tensile and shear components contribute to crack propagation. This transition suggests increased plastic deformation ahead of the crack tip and a tendency for crack growth along a maximum shear stress path.
For larger ligament lengths (L = 16 and 20 mm), pronounced necking and noticeable plastic deformation are observed before final rupture. The fracture surfaces become more irregular, reflecting ductile tearing accompanied by localized thinning in the ligament region. The larger ligament allows greater plastic deformation and more stable crack growth prior to final separation.
Overall, the fracture morphology evolves from net-section tensile fracture in short ligaments to mixed shear–tension fracture and finally to ductile tearing with necking in longer ligaments. This progression highlights the strong influence of ligament length on plastic deformation and crack growth stability in DENT specimens. The absence of brittle features across all specimens indicates ductile fracture under plane-stress dominant conditions, supporting the suitability of the DENT configuration for applying the load separation method in fracture toughness evaluation (Sharobeam and Landes, 1991 [
2,
3]).
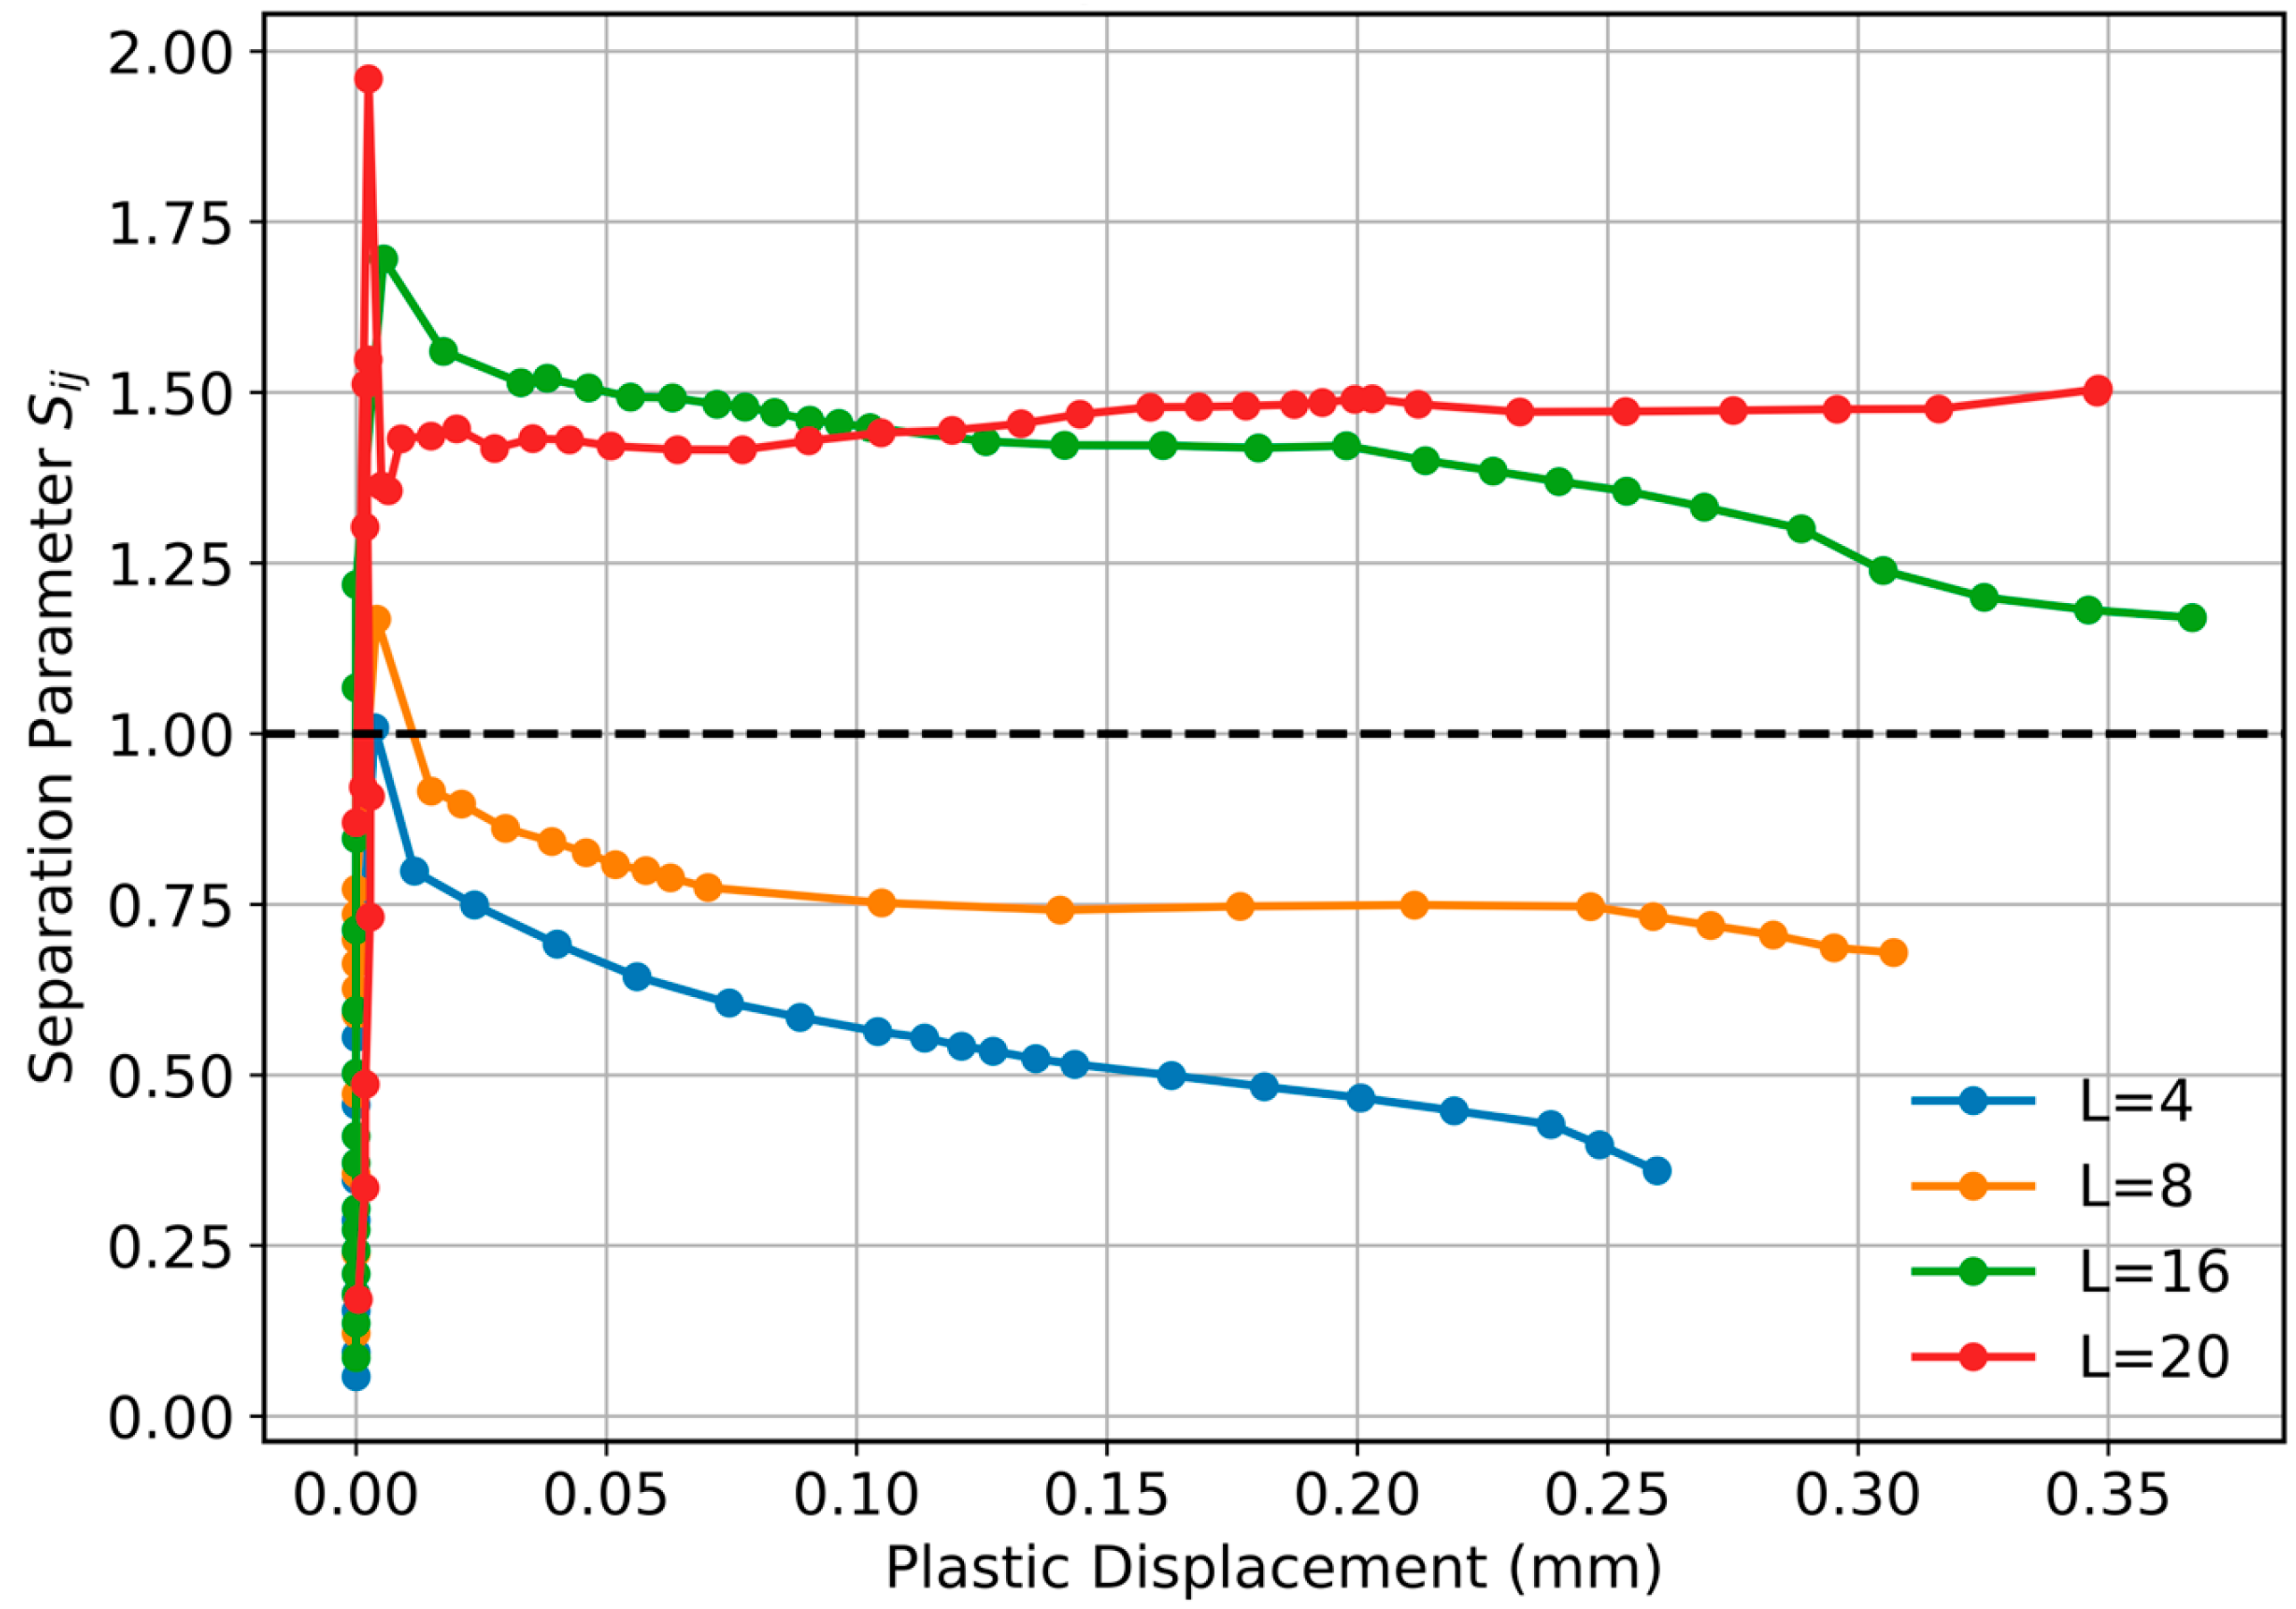
The load separation behavior of the double-edge-notched tension (DENT) specimens is illustrated in
Figure 7, where the separation parameter
(defined at constant plastic displacement with reference ligament
mm) is plotted against plastic displacement for all tested ligament lengths (
and
mm). The dashed horizontal line at
represents the ideal load separation condition corresponding to the reference ligament. As observed in the figure, the shorter ligaments (
mm and
mm) exhibit
values consistently below unity, gradually decreasing with increasing plastic displacement. This behavior indicates a reduced load-carrying capacity relative to the reference ligament, which can be attributed to the stronger constraint of the plastic zone and the earlier development of stable tearing.
In contrast, the longer ligaments (
mm and
mm) show
values above unity over most of the plastic displacement range. A pronounced peak is observed at very small plastic displacement, particularly for
mm, followed by a gradual stabilization. The
mm curve decreases progressively with increasing displacement but remains above unity for most of the loading range, while
mm stabilizes around approximately
–
. Overall, the convergence of the curves toward relatively stable values with increasing plastic displacement supports the applicability of the load separation concept in the plastic regime. The deviations observed at small plastic displacements reflect the transition from initial yielding to fully developed plasticity and highlight the influence of ligament geometry on the early deformation response [
37,
40].
Complementing this observation,
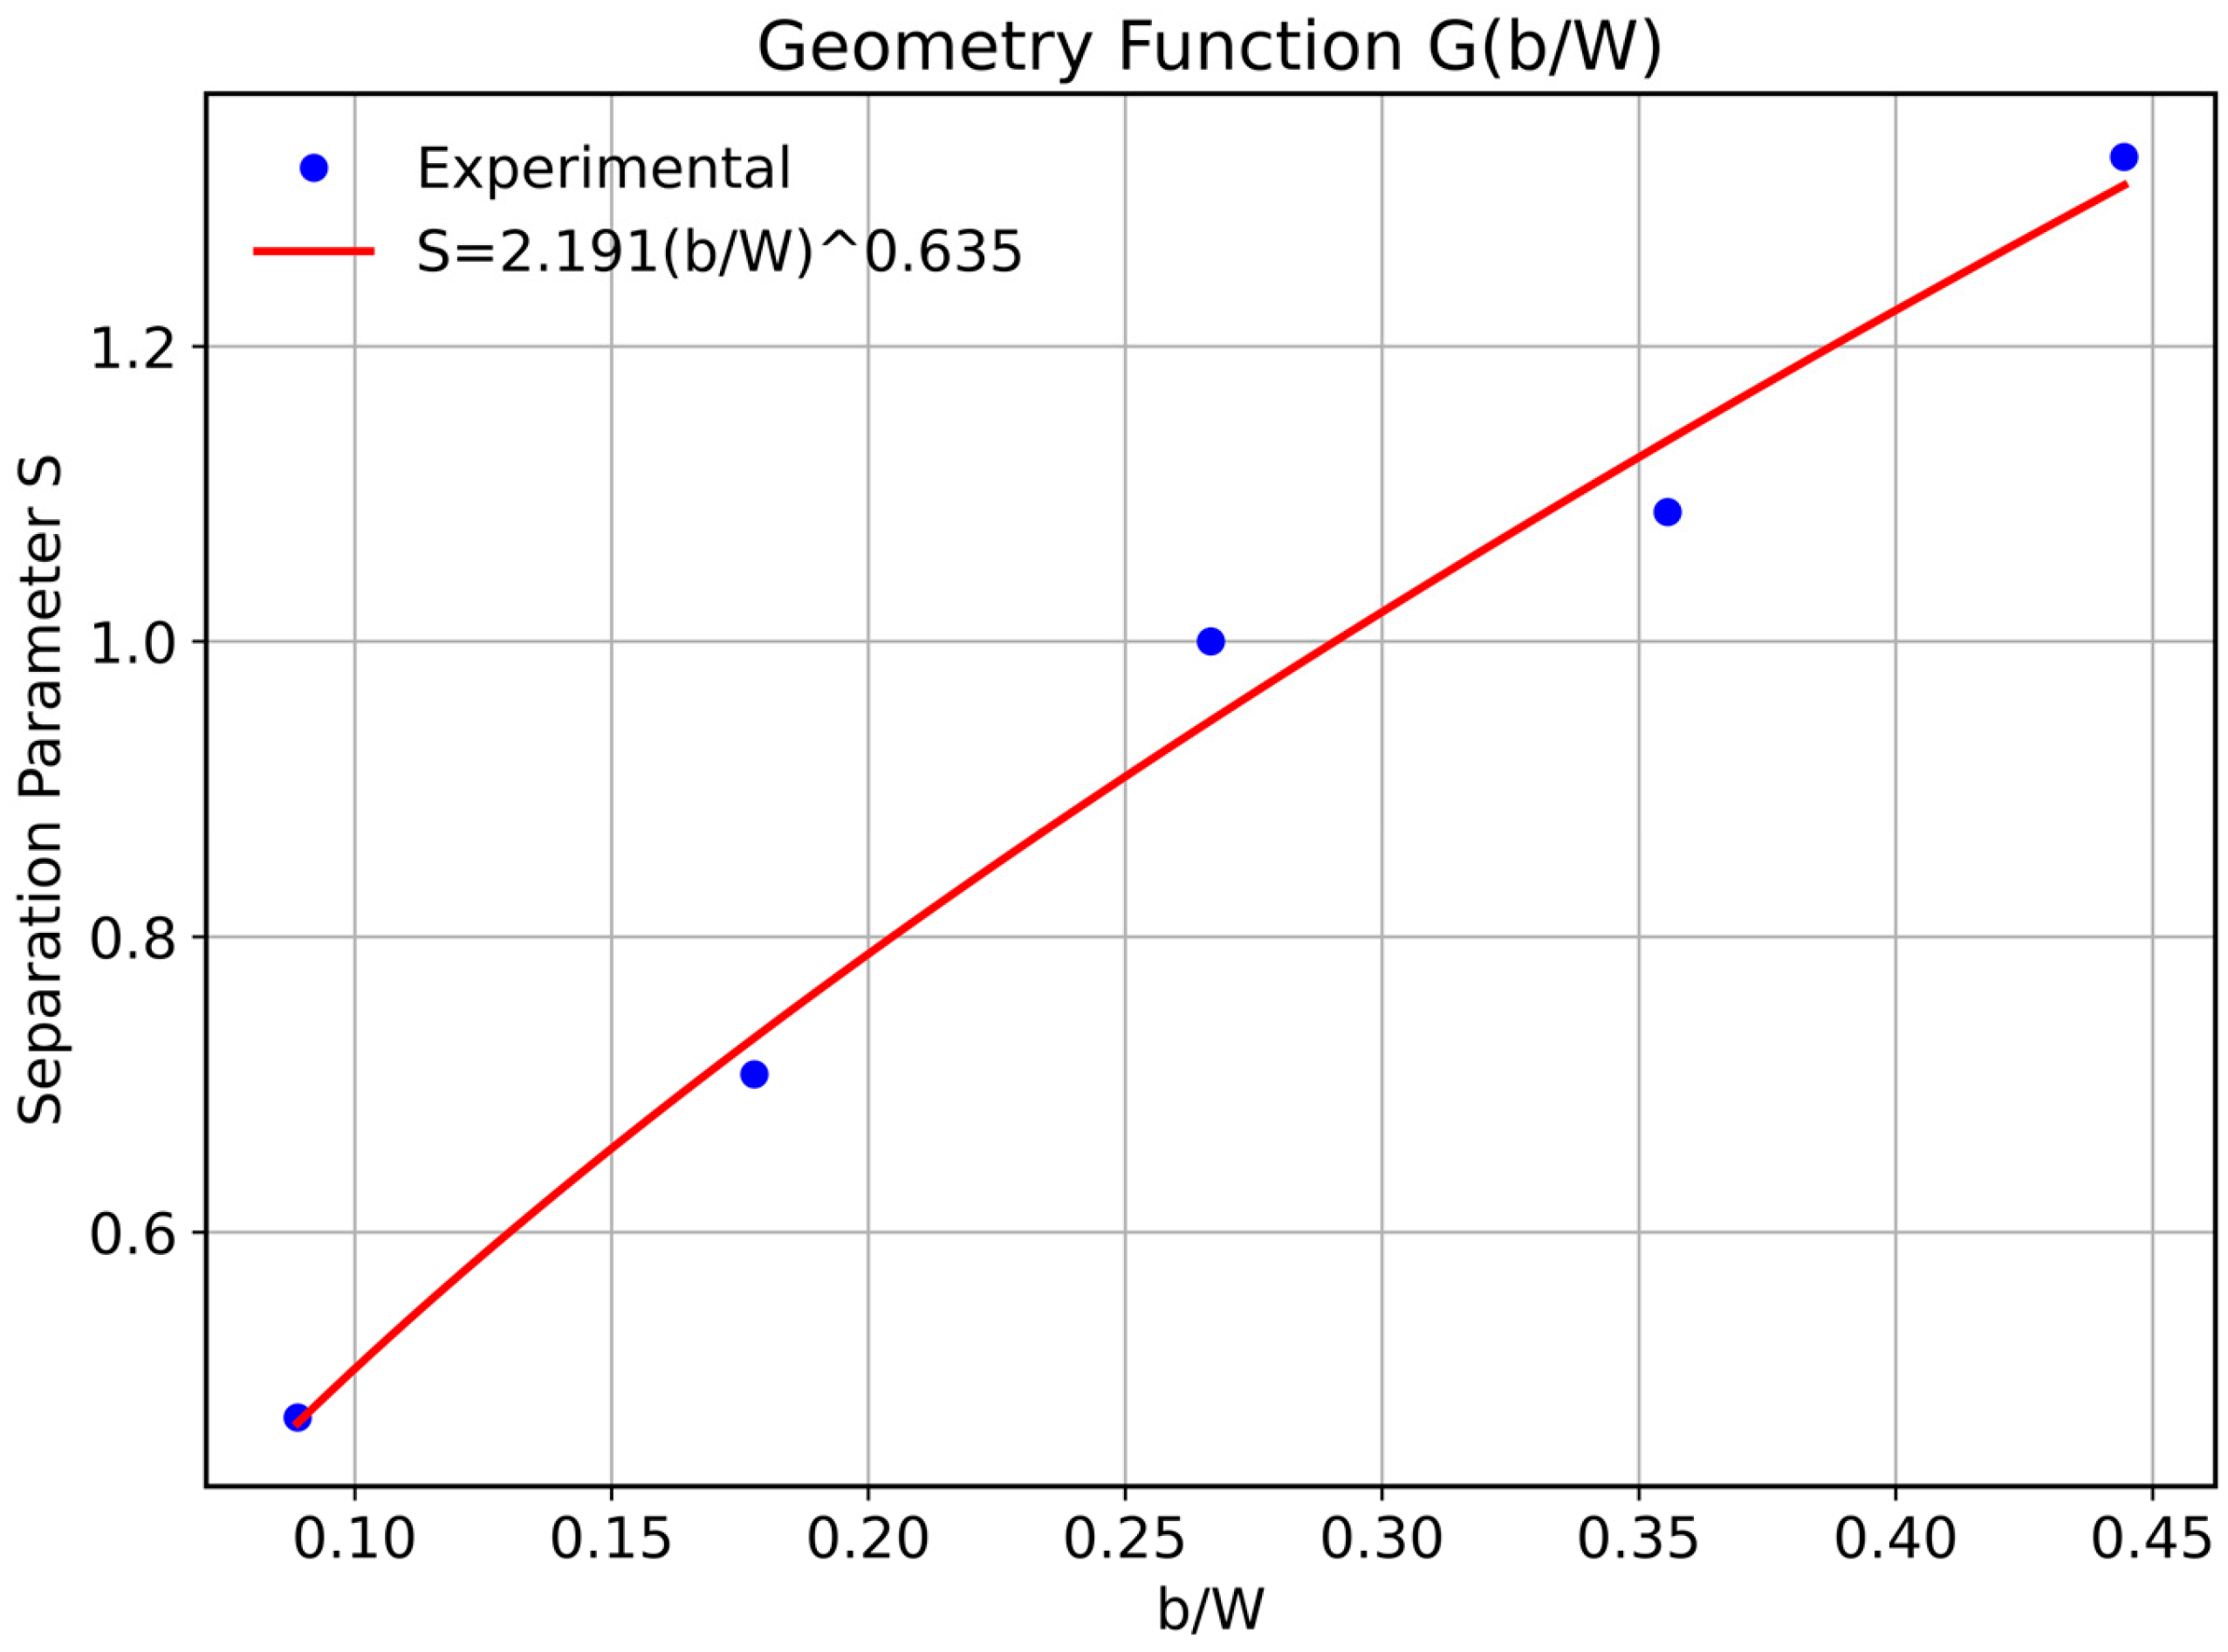
Figure 8 presents the geometry function
, expressed as the average separation parameter
versus the normalized uncracked ligament ratio
. The relationship between the separation parameter and the ligament ratio is well described by a power-law function of the form
.
As shown in the figure, the experimental data points follow the increasing trend predicted by the fitted curve, indicating that the separation parameter increases with increasing ligament ratio. As increases from approximately 0.09 (corresponding to mm) to about 0.44 ( mm), the separation parameter exhibits a nonlinear increase from roughly 0.47 to 1.30. This behavior reflects the progressive reduction in geometric constraint and the enhanced load separation response of the DENT specimens as the ligament length increases.
The exponent value (0.635) indicates a sub-linear dependence of the geometry function on the ligament ratio within the investigated range. This behavior is consistent with the characteristics of thin aluminum sheets tested under plane-stress-dominated conditions, where extensive plastic deformation develops ahead of the crack tips.
Overall, the fitted power-law function captures the general trend of the experimental data reasonably well and supports the applicability of the load separation framework for evaluating fracture behavior in the present DENT configuration.
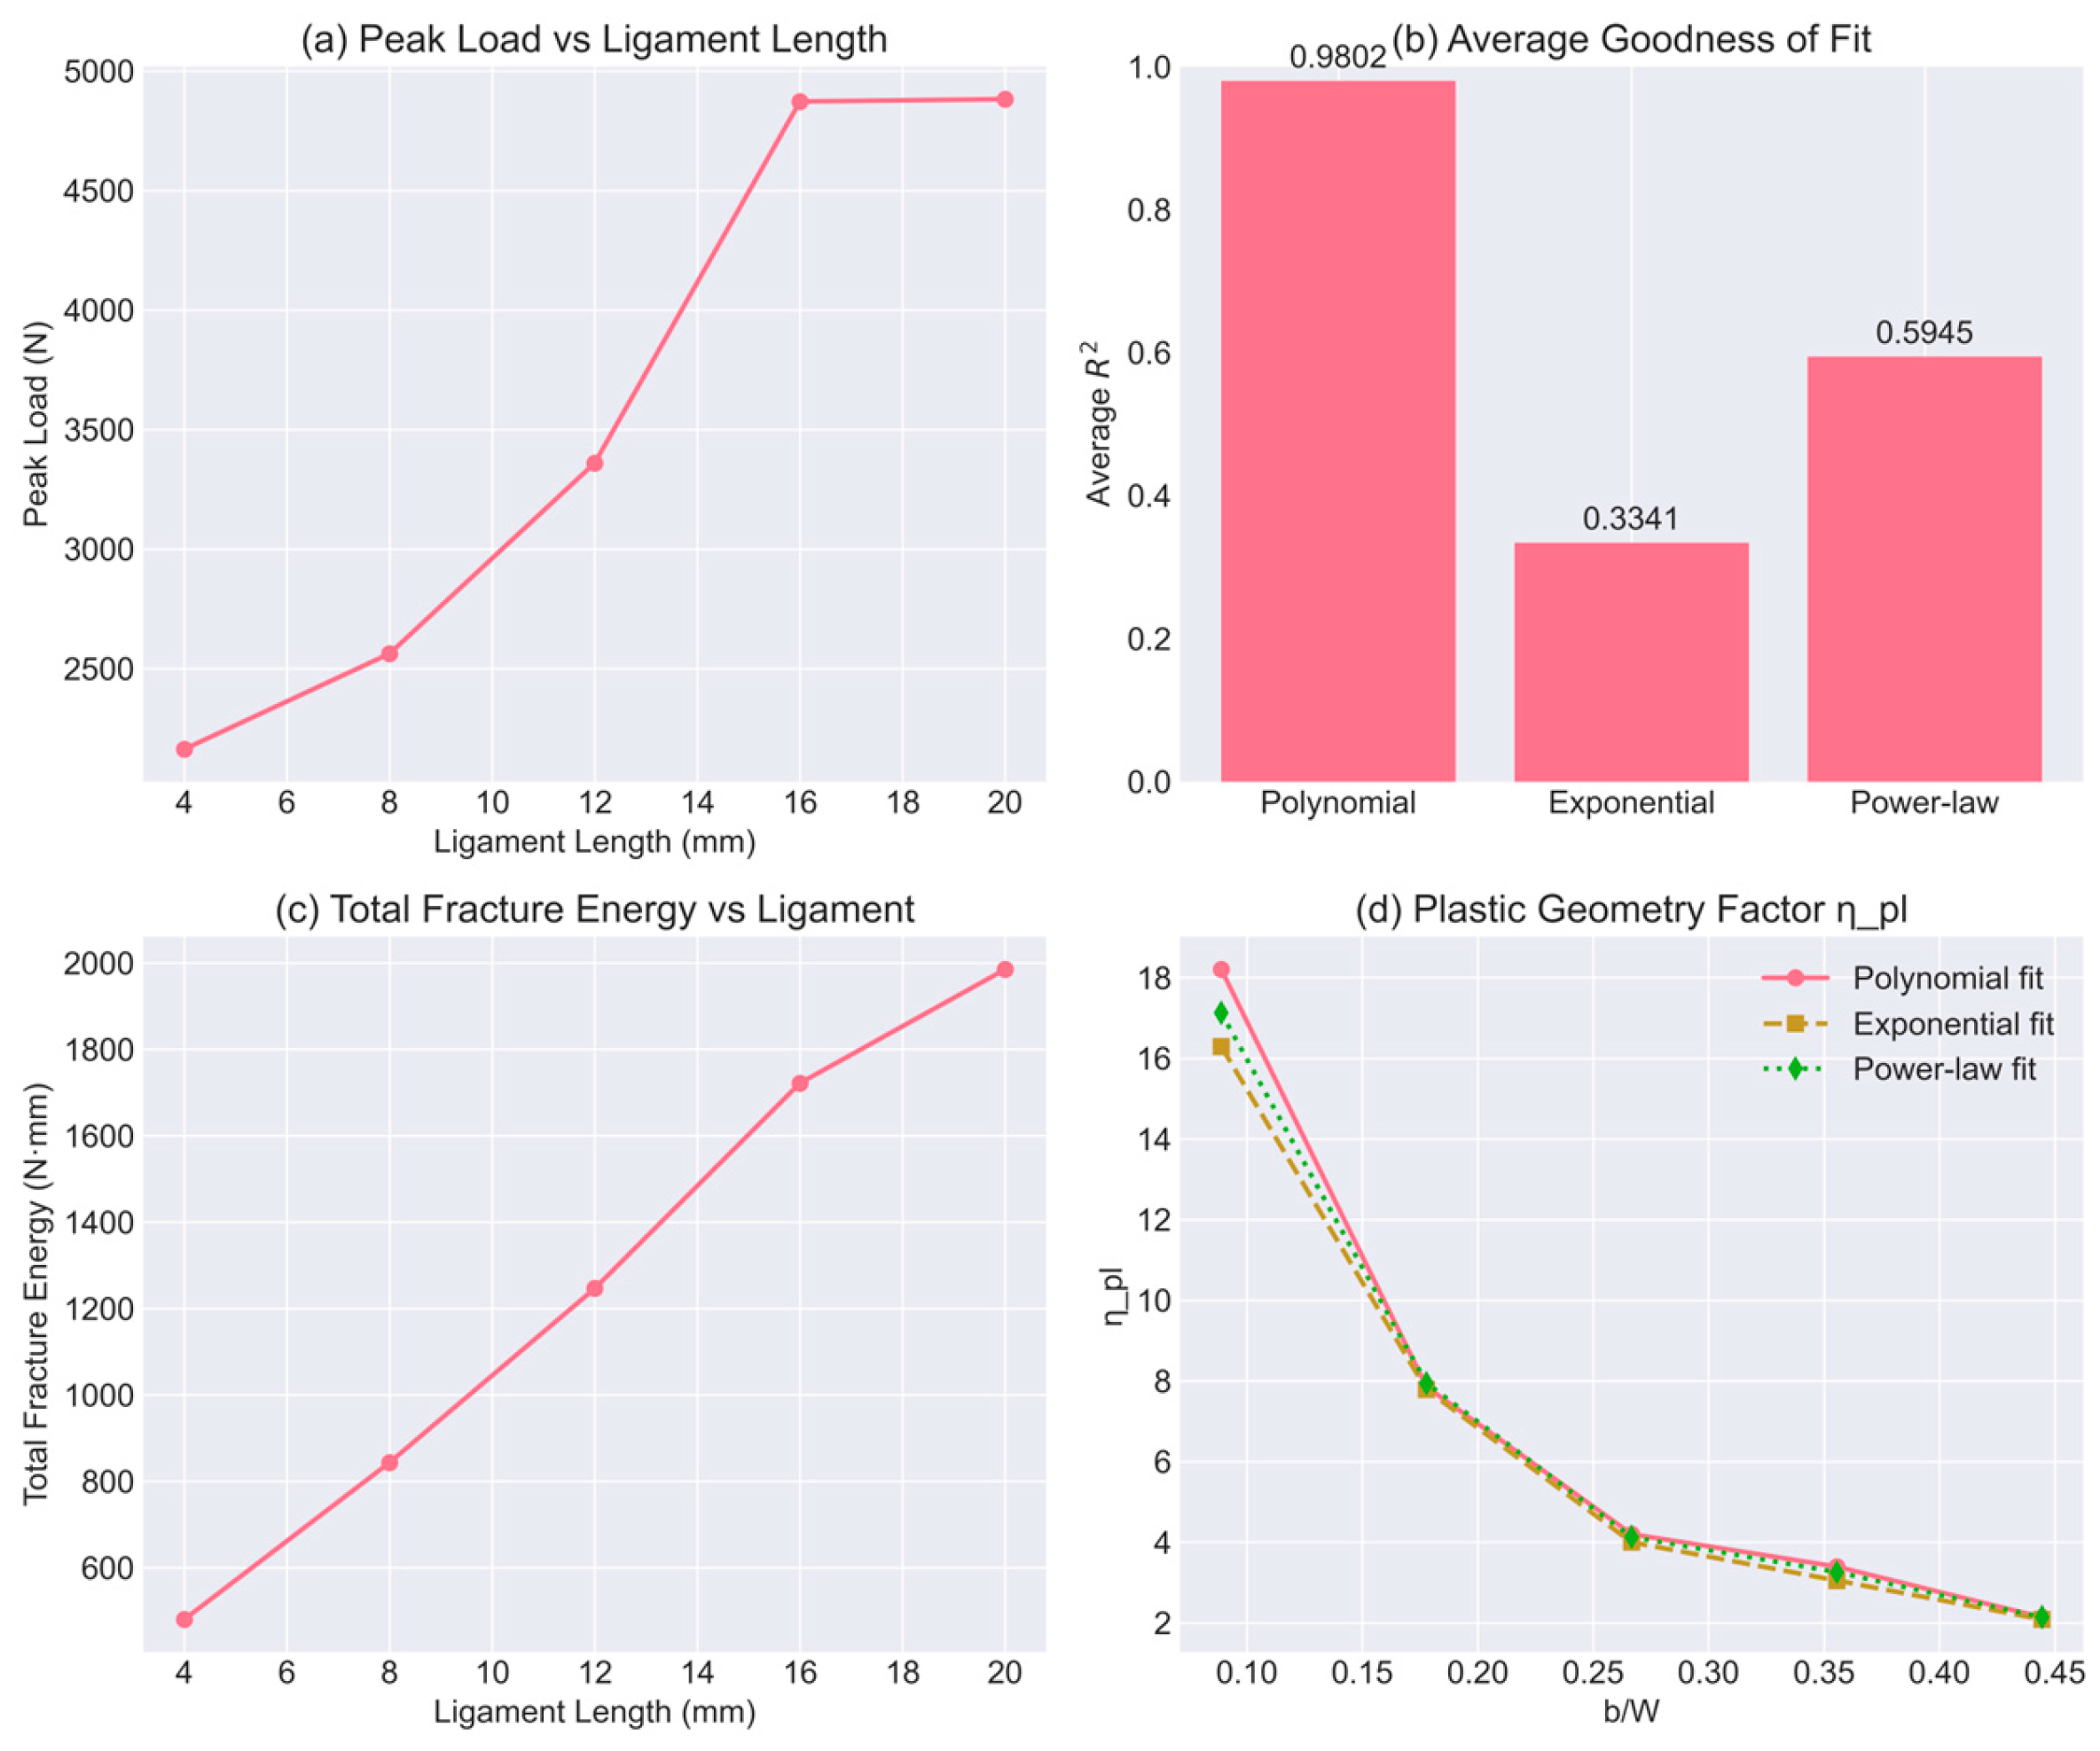
The overall outcome of the load separation analysis applied to the experimental double-edge-notched tension (DENT) dataset is summarized in
Figure 9, which consolidates several complementary indicators of fracture behavior. Specifically, the figure presents: (a) the variation in peak load with ligament length, (b) a comparative assessment of the goodness of fit obtained from different functional representations of the load–displacement response, (c) the evolution of total fracture energy with ligament size, and (d) the plastic geometry factor
derived from the separation method and plotted as a function of the normalized ligament ratio
. As shown in
Figure 9a, the peak load increases nonlinearly with ligament length, rising from approximately 2.16 kN at
mm to nearly 4.8–4.9 kN for ligaments in the range of 16–20 mm. The trend suggests a gradual tendency toward saturation at larger ligaments, reflecting the diminishing influence of notch constraint as the remaining ligament approaches the specimen width. The comparison of regression models (
Figure 9b) indicates that the polynomial representation provides the most accurate description of the experimental load–displacement response, yielding an average coefficient of determination of
. In contrast, the exponential decay model and the power-law model show substantially poorer agreement, with average
values of approximately 0.334 and 0.595, respectively.
The total fracture energy, obtained by numerical integration of the load–displacement records, exhibits a nearly linear dependence on ligament length over the investigated range (
Figure 9c), increasing from roughly 550 N·mm at
mm to about 2000 N·mm at
mm. This behavior reflects the progressively larger volume of plastically deforming material available for energy dissipation as the ligament increases. The corresponding plastic geometry factor
, determined from the separated plastic work component, is presented in
Figure 9d as a function of the normalized ligament ratio
. A pronounced decrease in
is observed as
increases from approximately 0.10 to 0.45, with values declining from about 16–18 at small ligament ratios to nearly 2–3 for the largest ligaments. Notably, the curves obtained from the polynomial, exponential, and power-law fits are nearly coincident, indicating that the final estimation of
is relatively insensitive to the specific functional representation of the load–displacement curve once the plastic work component has been properly separated.
Taken together, these results demonstrate that the load separation framework proposed by Sharobeam and Landes [
2,
3] provides a reliable methodology for evaluating ligament-dependent fracture parameters in thin ductile sheet specimens. The excellent agreement between the polynomial representation and the experimental response, combined with the consistent trend in the derived
factor, confirms that the separation approach can effectively capture the geometric dependence of plastic dissipation without requiring extensive crack-growth measurements or detailed finite-element calibration. Consequently, the present analysis supports the use of the load separation technique as a robust and efficient alternative—or complement—to conventional multi-specimen fracture toughness methodologies for plane-stress-dominated ductile fracture conditions.
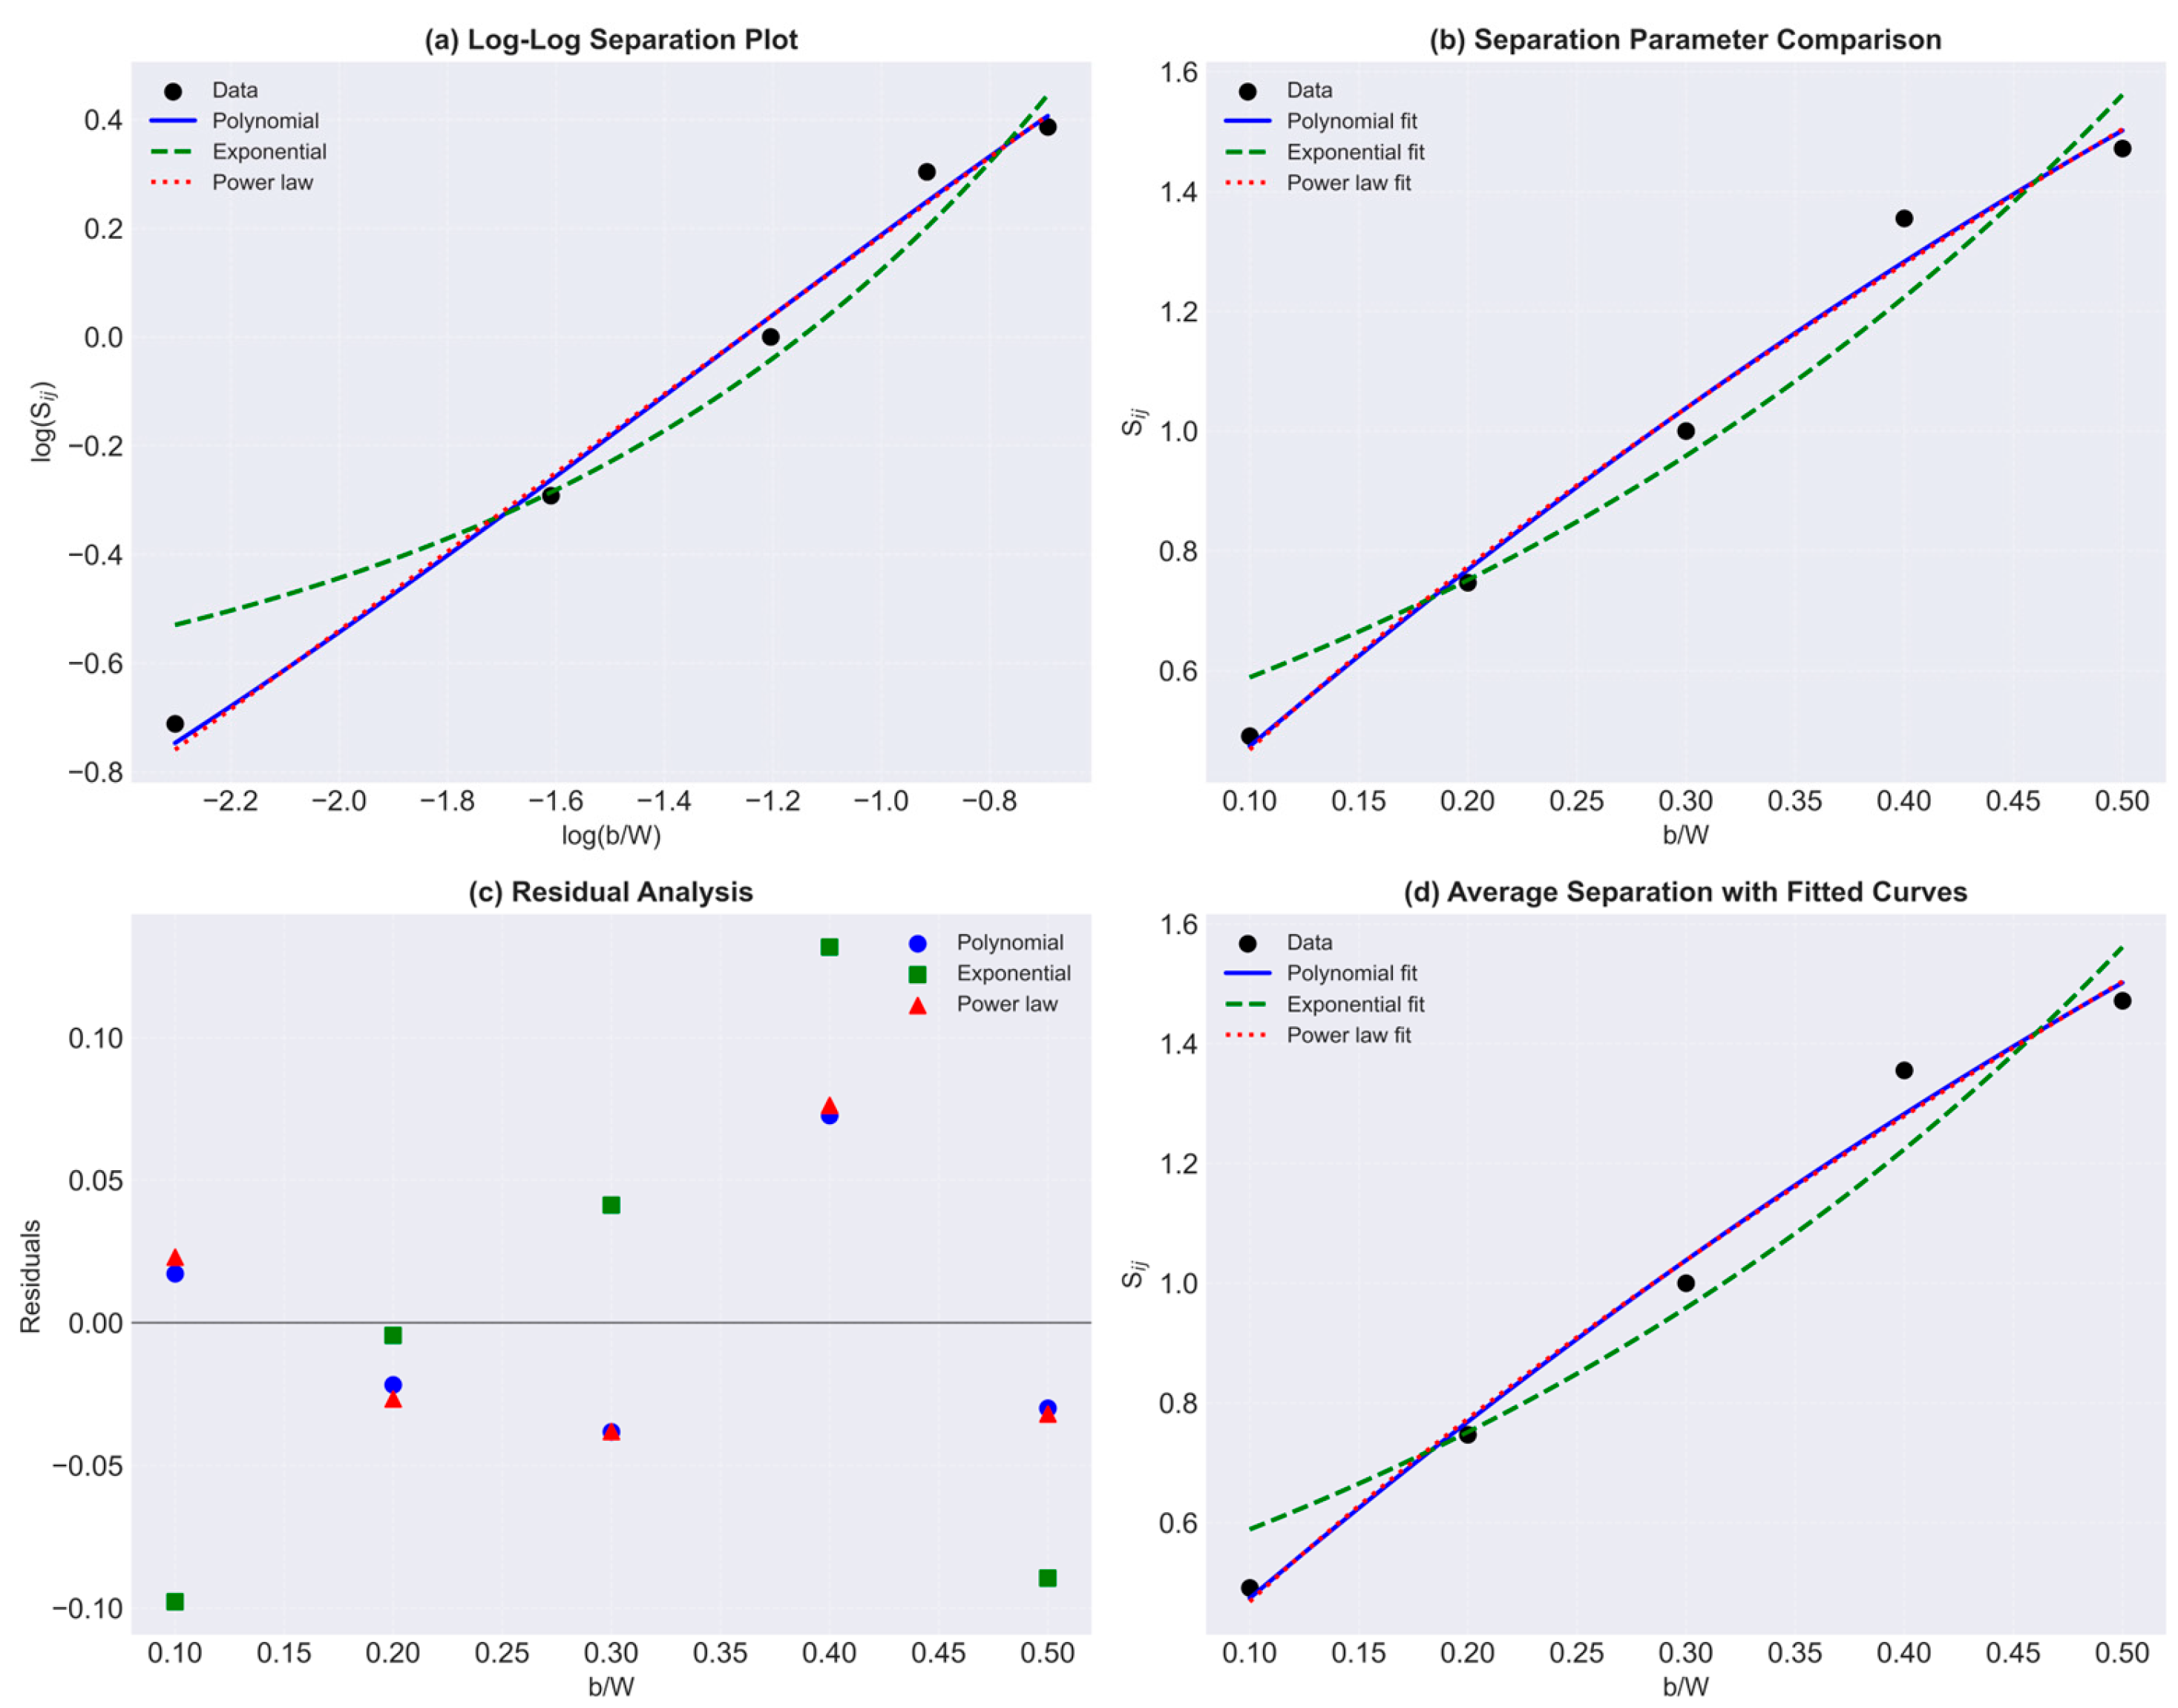
The load separation behavior is examined in
Figure 10 through a log—log representation of the separation parameter
versus the normalized uncracked ligament
, together with linear-scale representations (
Figure 10b), residual inspection (
Figure 10c), and the variation in the average
with
(
Figure 10d). These regressions are used only as mathematical approximations of the experimental trend to describe the geometry dependence of the separation parameter and to obtain the corresponding geometry function.
On the log—log scale (
Figure 10a), the experimental data points show an approximately linear trend, indicating that the separation parameter varies systematically with the normalized ligament
. Such behavior is consistent with the expected form of the load separation relationship, where the geometry dependence of the separation function can be expressed through a simple analytical representation. The regression curves shown in the figure serve only to visualize the experimental trend and to estimate the corresponding functional parameters.
The linear scale representation (
Figure 10b) illustrates that the selected analytical forms reproduce the general variation in the measured separation parameter with
. Minor deviations between curves reflect only the mathematical form of the regression functions rather than differences in the underlying physical interpretation of the load separation criterion.
The residual plot (
Figure 10c) is included solely to illustrate the level of approximation between the regression functions and the experimental measurements. These residuals provide a graphical indication of how closely the analytical expressions represent the measured data, but they are not used to assess the validity of the load separation approach itself.
The average separation parameter (
Figure 10d) increases monotonically with increasing
, rising from approximately
at
to about
at
. This trend reflects the progressive increase in load-carrying capacity associated with larger uncracked ligament ratios in the DENT geometry. The analytical curves shown in the figure simply provide continuous representations of this experimentally observed relationship.
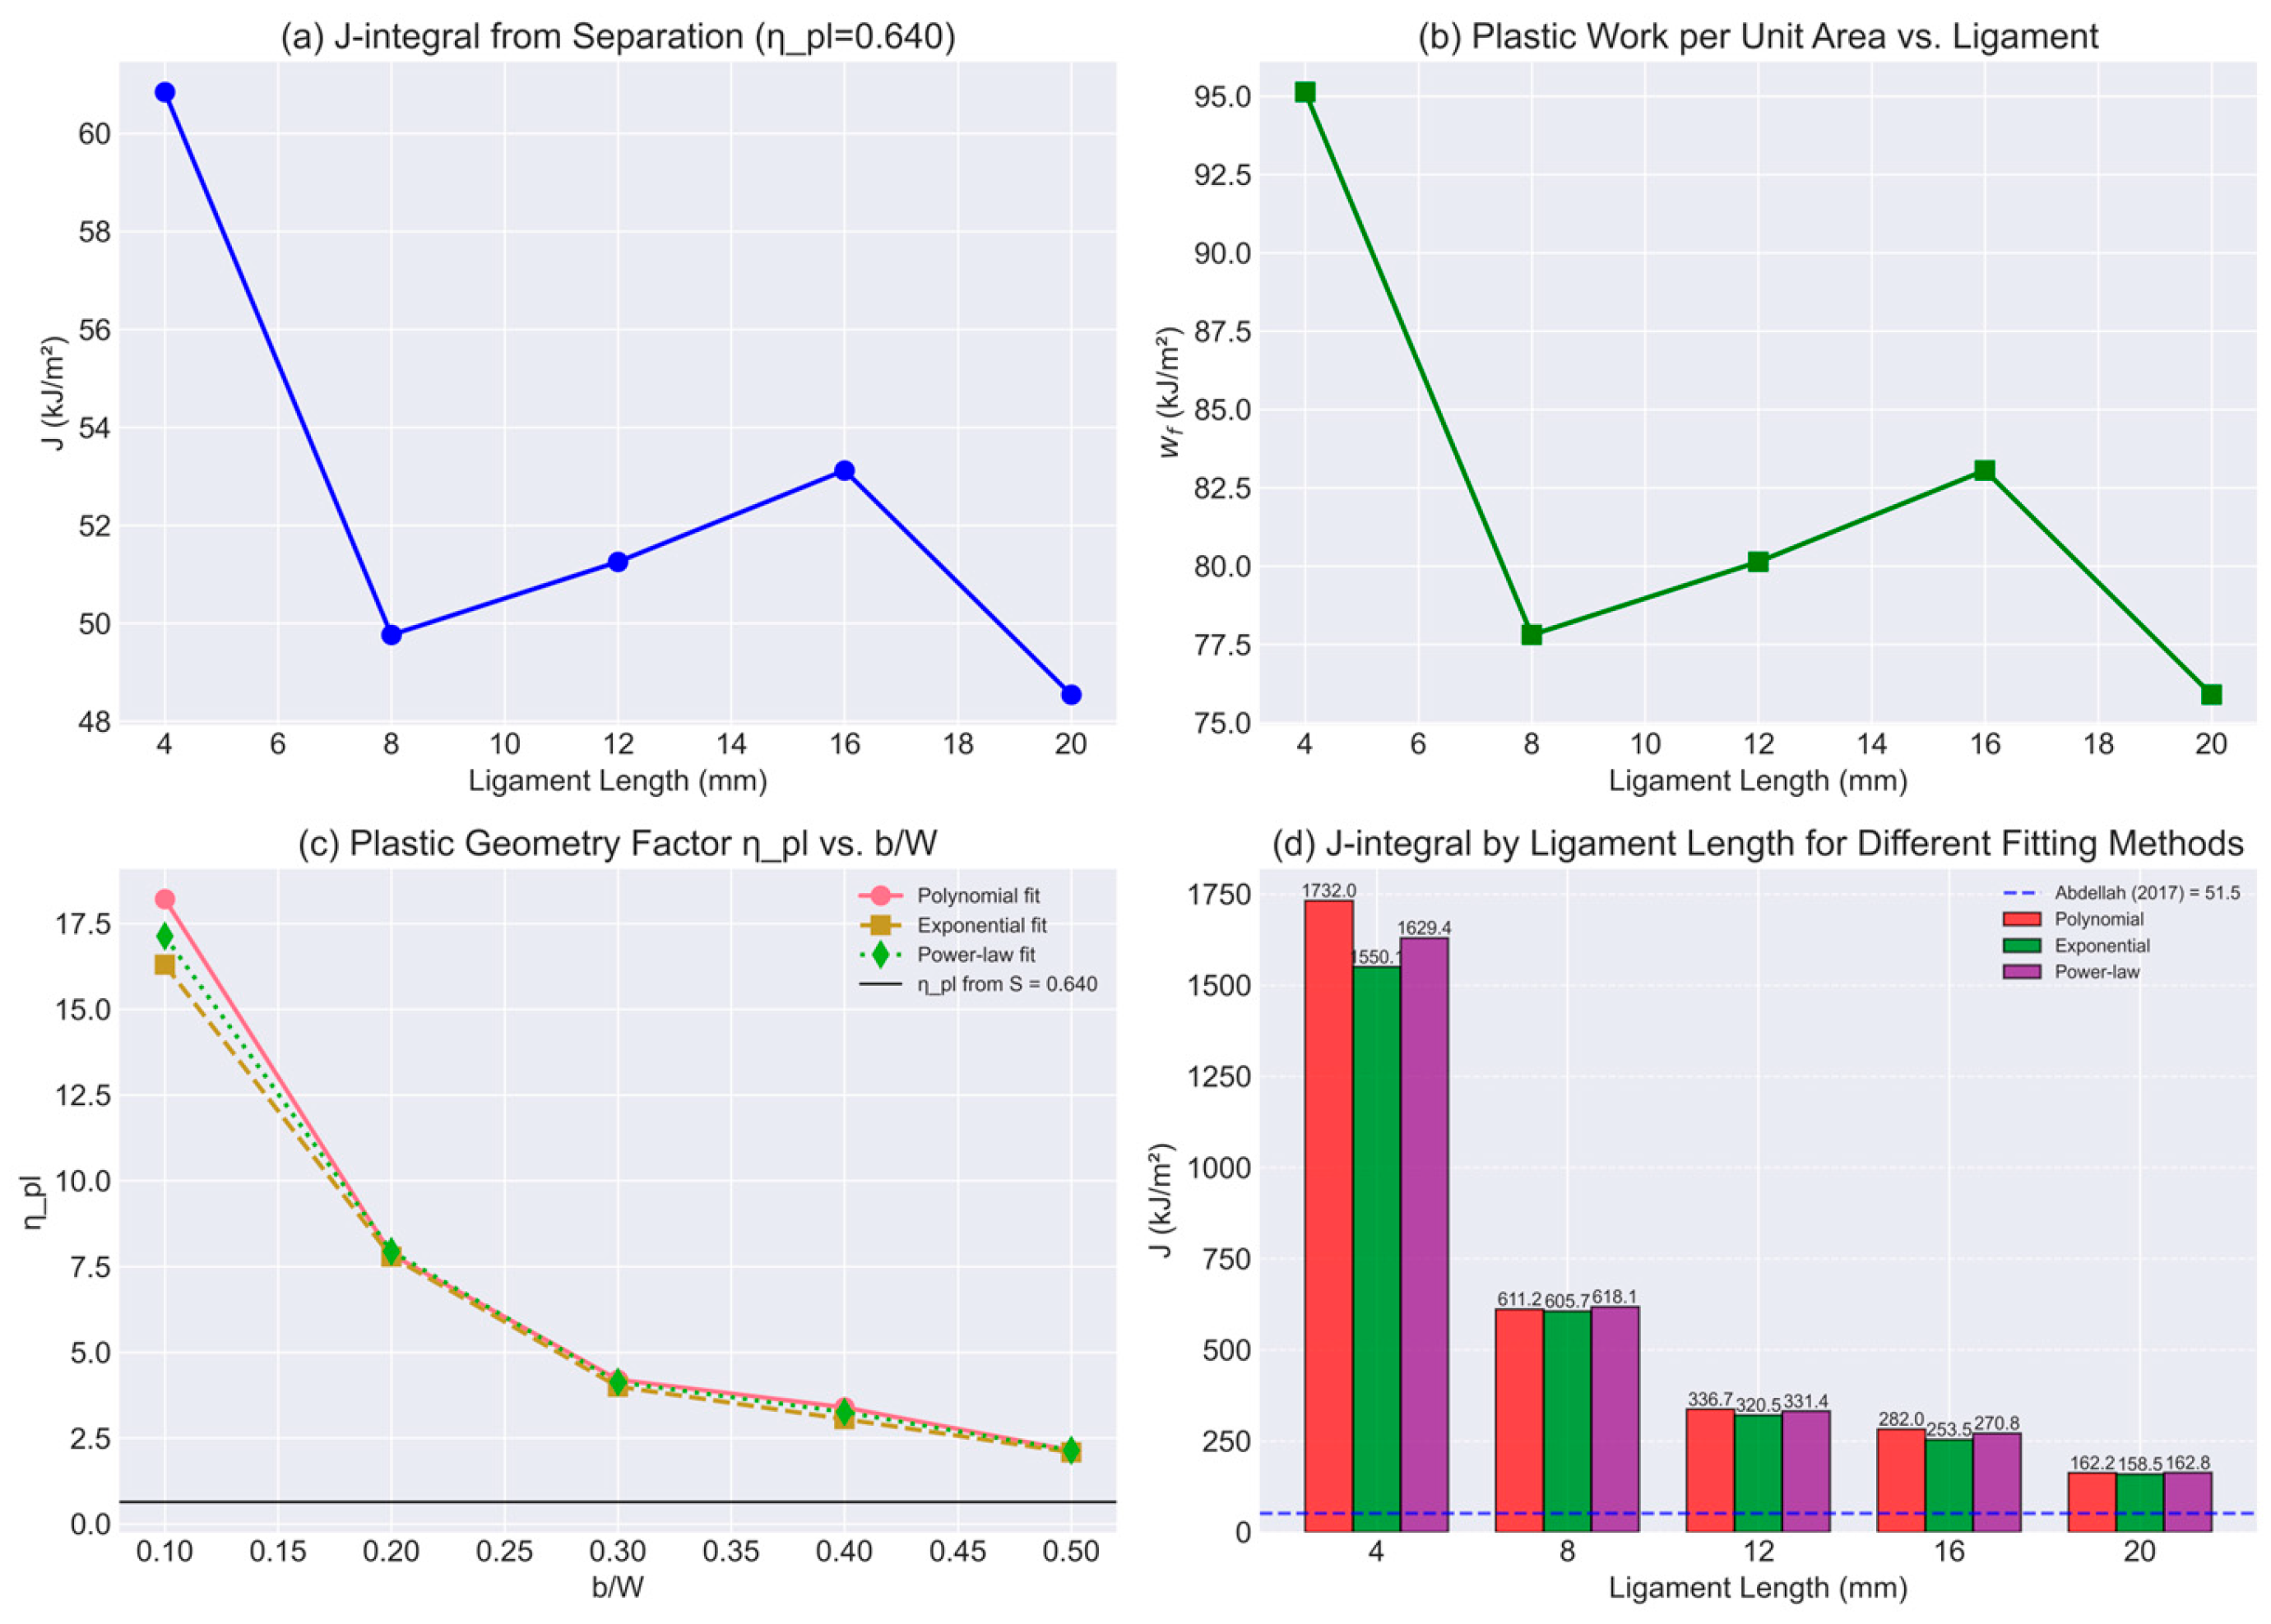
The plastic component of the J-integral
calculated using the single-specimen load separation method is presented in
Figure 11 as a function of ligament length
for three different
estimation approaches (power-law, polynomial, and exponential fitting).
Figure 11a shows the variation in the J-integral obtained from the separation approach using
. The calculated
values vary moderately with ligament length, decreasing from approximately 61 kJ/m
2 at
mm to about 50 kJ/m
2 at
mm, followed by a gradual increase to ≈53 kJ/m
2 at
mm, and then a slight reduction to ≈49 kJ/m
2 at
mm. Overall, the results remain within a relatively narrow range of ≈48–61 kJ/m
2, indicating that the separation-based J-integral estimation remains reasonably stable across the investigated ligament lengths.
The plastic work per unit fracture area
(
Figure 11b) shows a similar trend. The value decreases sharply from about 95 kJ/m
2 at
mm to approximately 78 kJ/m
2 at
mm, then gradually increases to ≈ 83 kJ/m
2 at
mm, before dropping again to ≈76 kJ/m
2 at
mm. This behavior reflects the combined effects of ligament geometry and plastic deformation development as the uncracked ligament increases.
Figure 11c presents the variation in the plastic geometry factor
with normalized ligament
obtained using polynomial, exponential, and power-law fitting functions. All three fitting approaches show a monotonic decrease of
with increasing
, dropping from values near 16–18 at
to approximately ≈ 2 at
. The three fitting methods produce very similar trends, with only minor deviations at the smallest ligament ratio, indicating that the choice of fitting function has a limited influence on the resulting geometry factor within the studied range. The constant reference line
, obtained from the separation parameter analysis, is also shown for comparison.
Finally,
Figure 11d compares the J-integral values predicted by the three fitting methods for each ligament length. All methods produce similar magnitudes and consistent decreasing trends with increasing ligament length. The largest differences appear at the shortest ligament (
mm), where the polynomial fit predicts approximately 1732 kJ/m
2, compared with ≈ 1550 kJ/m
2 for the exponential fit and ≈ 1629 kJ/m
2 for the power-law fit. As the ligament length increases, the predicted values converge, reaching approximately 160–170 kJ/m
2 at
mm. The dashed reference line corresponding to
kJ/m
2 (reported by Abdellah, 2017 [
18]) is included for comparison.
Overall, the three fitting approaches yield comparable J-integral estimations and similar trends with ligament length, although the polynomial and power-law fits generally track the experimental separation behavior more consistently than the exponential model. These results further demonstrate the applicability of the single-specimen load separation method for evaluating fracture parameters in DENT specimens under large-scale yielding conditions.
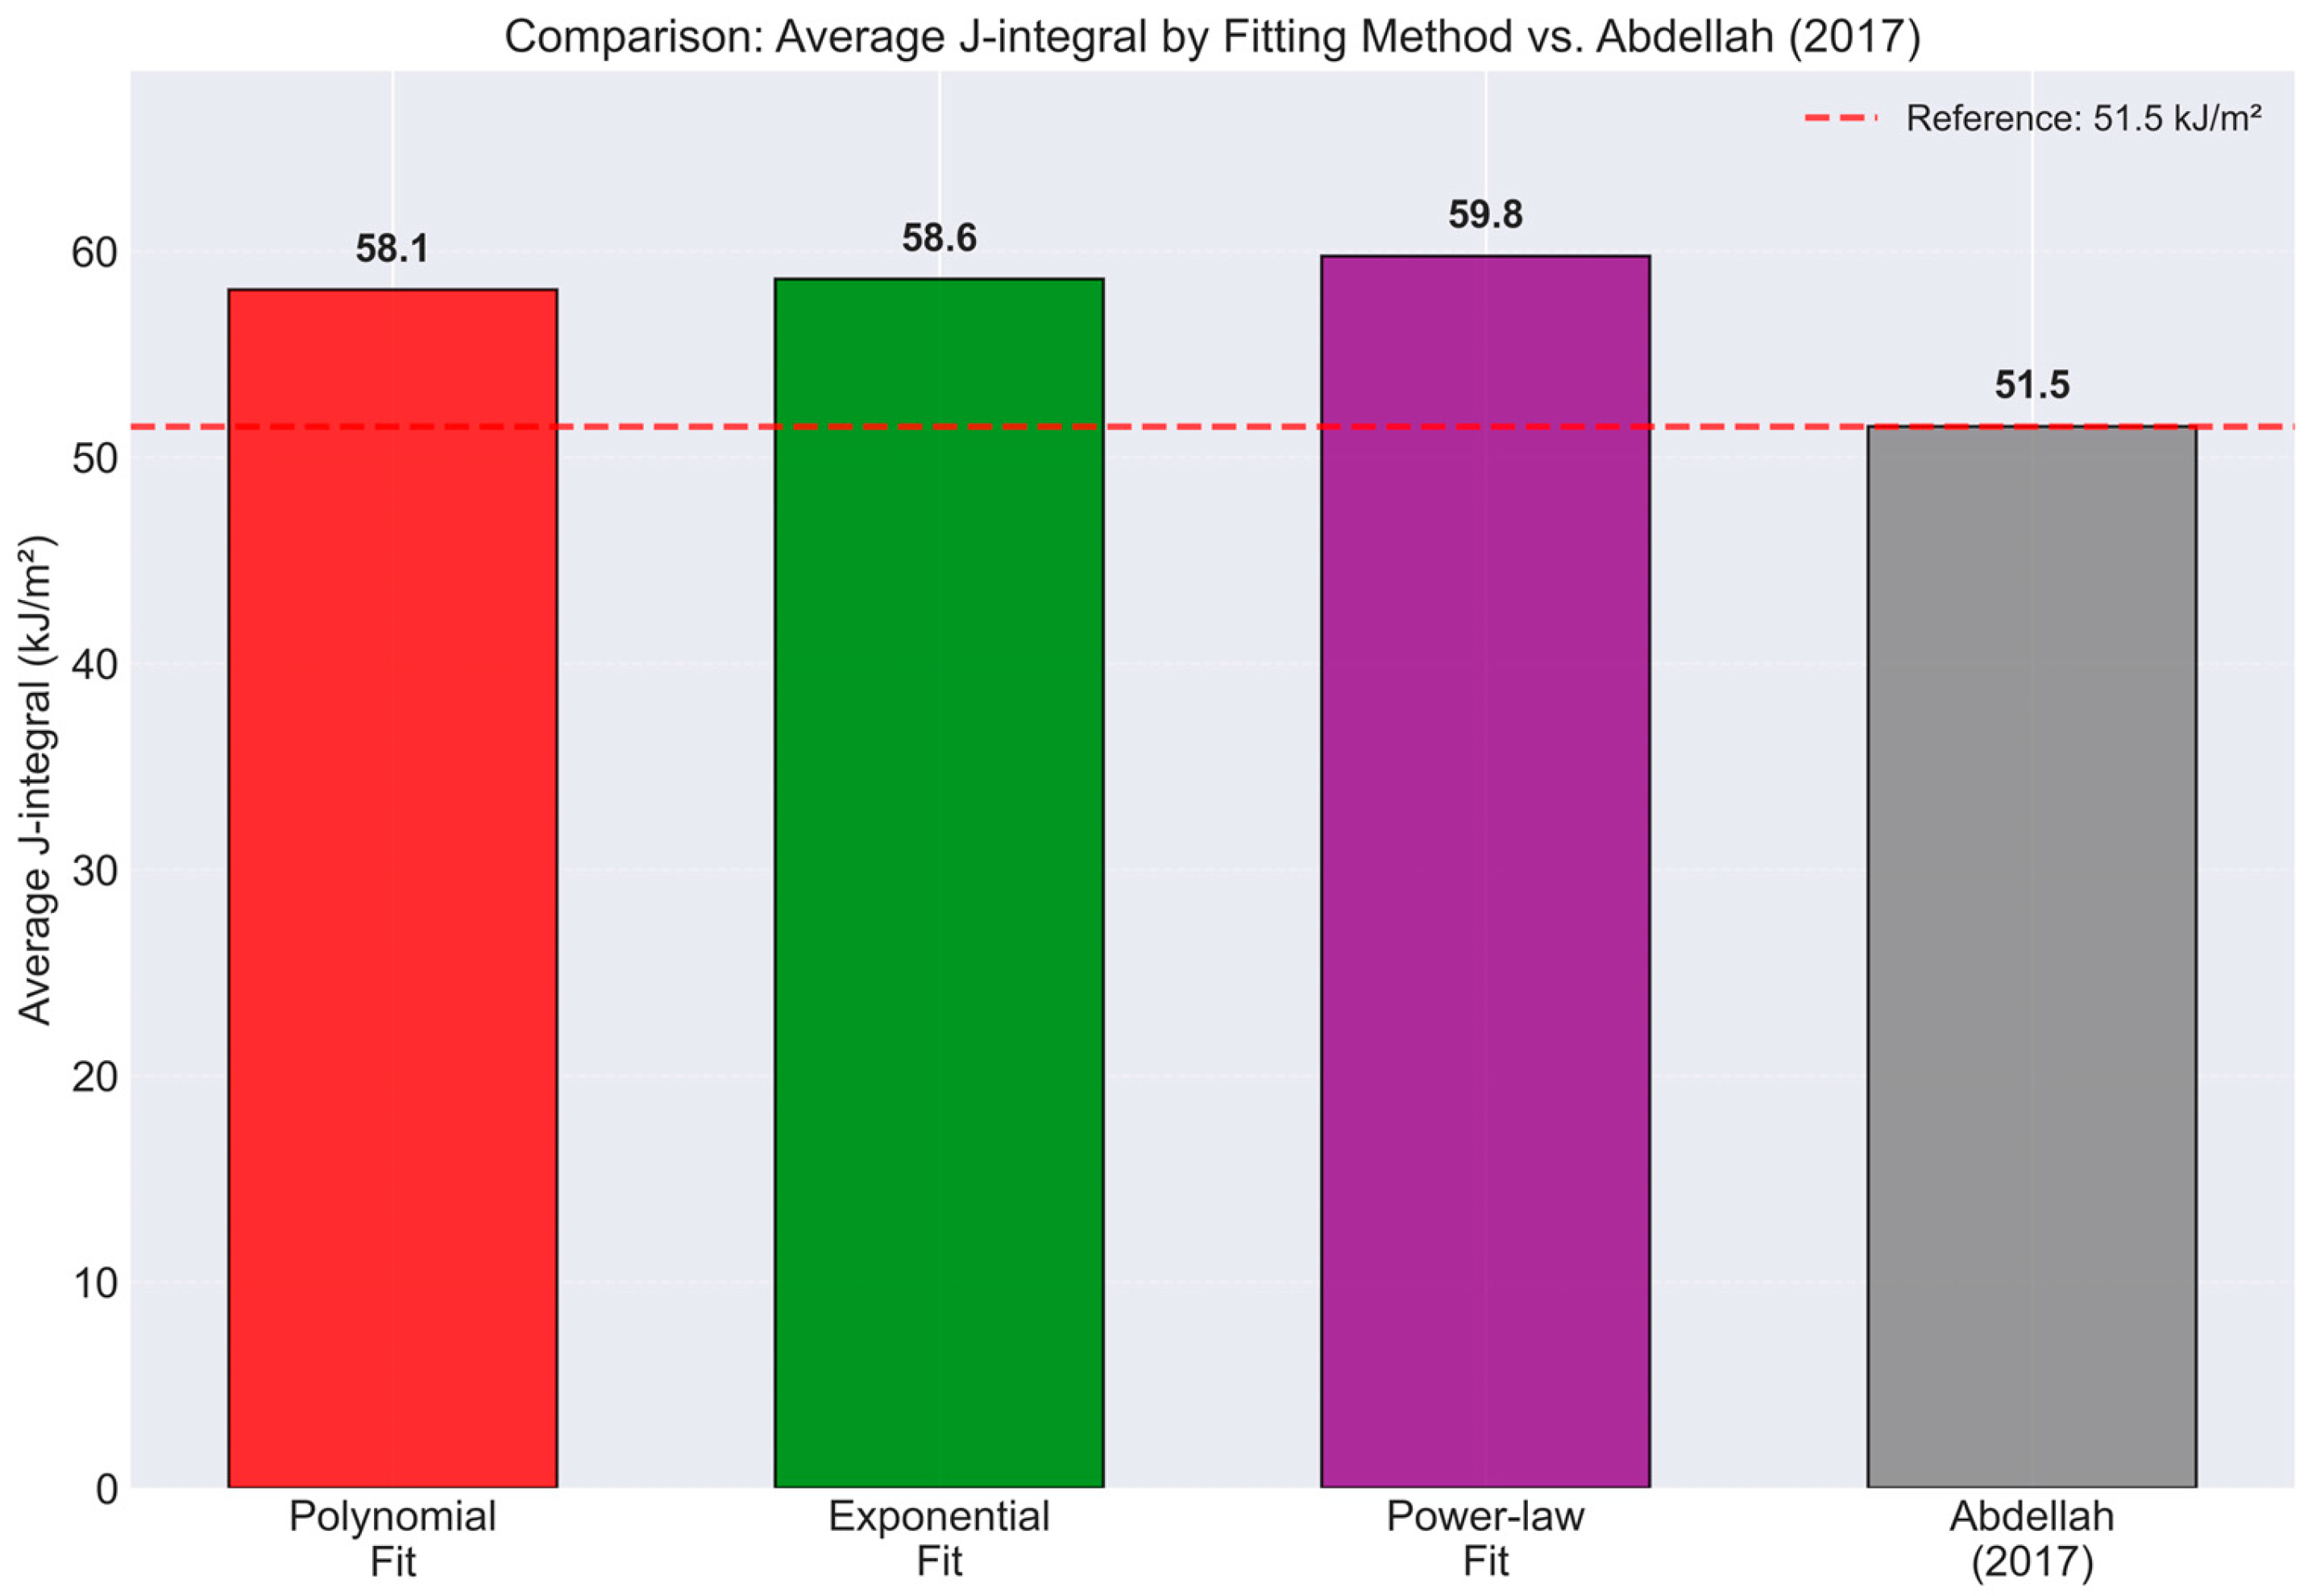
The load separation results are directly compared with the essential work of fracture (EWF) reference reported by Abdellah (2017) [
18] in
Figure 12, which presents the average J-integral values obtained from different fitting methods applied to the load separation analysis for the 1.2 mm commercial aluminum sheet tested under double-edge-notched tension (DENT) conditions.
As shown in
Figure 12, the average J-integral values derived from the three fitting approaches are very close to one another. The polynomial fit yields an average value of 58.1 kJ/m
2, the exponential fit gives 58.6 kJ/m
2, and the power-law fit results in 59.8 kJ/m
2. These values are compared with the reference fracture toughness
reported by Abdellah (2017) [
18], indicated by the dashed horizontal line in the figure.
All three load separation estimates slightly exceed the reference value but remain within a relatively small deviation range. The differences correspond to approximately +12.8% for the polynomial fit, +13.8% for the exponential fit, and +16.1% for the power-law fit relative to the Abdellah (2017) [
18] value. Despite this moderate overestimation, the results demonstrate good overall consistency among the fitting approaches, with variations of less than about 3% between the three models.
The comparison indicates that the load separation method produces fracture toughness values of the same order of magnitude as the essential work of fracture method, confirming the reliability of the separation-based approach for characterizing fracture resistance in thin ductile aluminum sheets under plane-stress conditions. The close clustering of the polynomial, exponential, and power-law predictions further suggests that the J-integral estimation is not highly sensitive to the specific fitting function used, provided that the overall load–displacement behavior is captured accurately.




 ,
,