Article

Effect of Zinc Content on the Mechanical, Corrosion, Tribological and Electrical Properties of Spark Plasma-Sintered Copper/Graphene Composites

by
Serdar Özkaya
1,2,*,
Yaren Adabaş
1,
Müslim Çelebi
1,
Abdullah Hasan Karabacak
1 and
Ertuğrul Çelik
3
1
Engineering Faculty, Department of Metallurgy and Materials Engineering, Karadeniz Technical University, Trabzon 61080, Türkiye
2
Trabzon Teknokent, Korya Marine Technologies, Trabzon 61081, Türkiye
3
Department of Mechanical Engineering, Munzur University, Tunceli 62000, Türkiye
*
Author to whom correspondence should be addressed.
Crystals 2026, 16(3), 208; https://doi.org/10.3390/cryst16030208
Submission received: 27 February 2026 / Revised: 14 March 2026 / Accepted: 16 March 2026 / Published: 19 March 2026
(This article belongs to the Special Issue Performance and Processing of Metal Materials)

Abstract

Copper-based hybrid metal matrix composites reinforced with graphene and zinc were developed to achieve a balanced combination of mechanical strength, corrosion resistance, wear performance, and electrical conductivity. In this study, Cu matrix composites containing a constant graphene content of 1 wt.% and varying Zn contents (0, 5, 10, and 15 wt.%) were fabricated through mechanical alloying followed by Spark Plasma Sintering (SPS). The effects of zinc content on microstructure, densification, hardness, corrosion behavior, tribological performance, and electrical conductivity were systematically investigated. Microstructural analyses revealed that the combined use of graphene and Zn significantly influenced grain refinement, interfacial stability, and densification behavior. The composite containing 10 wt.% Zn exhibited the highest relative density (~90.5%) and maximum hardness (62 HB), indicating an optimal reinforcement level. Corrosion tests conducted in 3.5 wt.% NaCl solution demonstrated that the 10 wt.% Zn composite showed the most noble corrosion potential and the lowest corrosion current density, which was attributed to reduced porosity and improved microstructural homogeneity. Tribological results confirmed that graphene contributed to a self-lubricating effect, while Zn enhanced load-bearing capacity, leading to improved wear resistance under increasing normal loads. Electrical conductivity measurements showed a gradual decrease with increasing Zn content, mainly due to solid-solution-induced electron scattering in the Cu matrix; however, the fixed graphene addition and effective SPS consolidation helped preserve conductive pathways, allowing all composites to retain acceptable conductivity levels. The results indicate that the hybrid Cu–graphene–Zn composites exhibit a balanced combination of mechanical, corrosion, tribological, and electrical properties, with 10 wt.% Zn emerging as the optimal composition.

1. Introduction

Metal Matrix Composites (MMCs) have emerged as advanced engineering materials that effectively combine the high toughness and ductility of metals with the superior strength and stiffness of ceramic reinforcements. The incorporation of hard ceramic phases into ductile metal or alloy matrices significantly enhances mechanical performance, particularly under high-temperature conditions, and improves properties such as compressive and shear strength [1,2,3]. Owing to their exceptional mechanical and functional properties compared to monolithic metals, MMCs have attracted increasing attention in various industrial sectors, including aerospace, automotive, electronics, and defense. In recent years, extensive research has focused on improving MMC performance by exploring various reinforcement materials and fabrication techniques. The addition of nano-sized reinforcements has proven especially effective in enhancing strength and elastic modulus while preserving the inherent ductility and toughness of the matrix material. However, conventional MMCs with a single type of reinforcement often fall short of meeting the growing performance requirements of modern engineering applications. To address these limitations, Hybrid Metal Matrix Composites (HMMCs)—which incorporate two or more types of reinforcement phases—have become a prominent area of study. The hybrid approach enables the combination of different reinforcement characteristics, leading to synergistic effects that improve the overall performance of the composite while balancing potential trade-offs [4,5]. The type, morphology, and volume fraction of the reinforcements play a crucial role in defining the mechanical, thermal, and tribological behavior of HMMCs. Copper-based HMMCs have gained particular interest due to copper’s excellent electrical and thermal conductivity, combined with the potential for enhanced mechanical strength and wear resistance through hybrid reinforcement [6,7,8,9,10]. Conventional ceramic reinforcements such as SiC, Al2O3, and B4C have been extensively investigated and remain widely utilized in copper matrix composites [11]. However, recent studies have shown that the incorporation of carbon-based nanomaterials (e.g., graphene and carbon nanotubes) as well as transition metal additives can significantly improve the mechanical, tribological, and functional properties of copper-based composites [12,13,14,15]. Notably, graphene provides high electrical conductivity, exceptional mechanical strength, and a self-lubricating effect that improves tribological behavior, while zinc contributes to microstructural refinement and increased wear resistance [16,17,18,19,20]. Despite the advantages of these reinforcements, achieving a uniform distribution within the metal matrix remains challenging, particularly in liquid-state processes. Advanced fabrication methods such as Spark Plasma Sintering (SPS) have been developed to overcome such challenges by enabling rapid densification at lower temperatures, minimizing grain growth, and promoting homogeneous microstructures [20,21]. Although Cu–graphene composites have been widely investigated for improving strength and electrical conductivity, and Cu–Zn alloys are traditionally used as brass materials with enhanced mechanical properties, the combined effect of Zn alloying and graphene reinforcement within a Cu matrix has received limited attention in the literature. In particular, the simultaneous influence of Zn addition on densification behavior, graphene dispersion, tribological performance, corrosion resistance, and electrical conductivity in SPS-processed Cu–graphene systems has not yet been systematically clarified [22,23,24,25,26]. Therefore, the present study introduces a Cu–graphene–Zn hybrid composite system fabricated through mechanical alloying followed by spark plasma sintering (SPS).
In this study, the Zn content was systematically varied (0, 5, 10, and 15 wt.%) while maintaining a constant graphene content of 1 wt.%. This approach enables the investigation of the synergistic interaction between graphene-induced lubrication effects and Zn-induced strengthening and densification mechanisms. The produced composites were comprehensively characterized in terms of microstructure, phase composition using X-ray diffraction (XRD), density, hardness, corrosion resistance, and wear behavior. The primary objective of this work is to clarify how Zn addition influences the microstructure, densification behavior, corrosion resistance, tribological performance, and electrical conductivity of graphene-reinforced Cu composites, and to determine the optimum Zn content that provides a balanced combination of mechanical performance and electrical conductivity. The novelty of this research lies in the development and systematic investigation of a Cu–graphene–Zn hybrid composite system, where Zn alloying and graphene reinforcement act synergistically to improve the multifunctional performance of copper-based materials. The findings of this study are expected to contribute to the development of advanced materials for applications requiring a combination of high electrical conductivity, improved wear resistance, and enhanced corrosion performance, particularly in electronics, automotive, and defense industries.

2. Materials and Methods

2.1. Materials and Fabrication Process

In this study, copper powder (99.99% purity, d50: 50 μm, Nanografi, Ankara, Türkiye) was utilized as the matrix material. Graphene was incorporated at a fixed content of 1 wt.% (Nanografi, Ankara, Türkiye), while zinc (Zn) was added at 0, 5, 10, and 15 wt.% to examine its influence on the composite properties. The hybrid composite specimens were designated as Z0, Z5, Z10, and Z15, where Z0 corresponds to the sample reinforced solely with 1 wt.% graphene. The milling parameters applied for each composition are presented in Table 1. To achieve a homogeneous distribution of the powders, mechanical alloying was conducted using a Retsch PM100 planetary ball mill (Verder company, Düsseldorf, Germany). The milling conditions were set to a duration of 2 h, a rotational speed of 400 rpm, a ball-to-powder weight ratio of 10:1, and 2 wt.% methanol as a process control agent. These parameters were selected based on preliminary investigations, which revealed that lower milling intensities resulted in inadequate dispersion of the reinforcements, while higher intensities caused excessive cold welding and adhesion of the powder particles to the milling vial. The mechanically alloyed hybrid composite powders were consolidated using a 160V spark plasma sintering system (Çelmak Makina, Elazığ, Türkiye). The sintering schedule consisted of a heating rate of 150 °C/min, a pulse on/off ratio of 12:2, a sintering temperature of 800 °C with a 4 min holding time, and an applied pressure of 35 MPa. The SPS process was carried out under a combined vacuum and nitrogen atmosphere. The selected sintering parameters were optimized based on preliminary trials, which demonstrated that lower temperatures or shorter holding durations led to incomplete densification, whereas higher temperatures promoted grain coarsening and the formation of localized defects. Similarly, the fixed graphene content of 1 wt.% and the selected Zn reinforcement levels of 0–15 wt.% were established through initial assessments aimed at achieving a clear strengthening response and lubrication contribution while maintaining acceptable electrical conductivity and densification behavior.

2.2. Characterization

Following completion of the SPS process, the consolidated hybrid composite specimens were machined into rectangular prisms with approximate dimensions of 40 mm × 10 mm × 5 mm and subsequently metallographically prepared for microstructural and phase analyses. Comprehensive microstructural characterization of the consolidated materials was performed using a Thermo Scientific Apreo 2S field-emission scanning electron microscope (FE-SEM, ThermoFisher Scientific, Eindhoven, The Netherlands), equipped with a Thermo Scientific UltraDry energy-dispersive spectroscopy (EDS) detector. The wear tracks and surface deformations formed during tribological testing were also examined by SEM to elucidate the wear behavior and the corresponding dominant mechanisms. Phase analyses were conducted using X-ray diffraction (XRD) with a PANalytical X’Pert3 Pro diffractometer (Bruker, Westborough, MA, USA), operating with a Cu Kα radiation source (λ = 1.541874 Å). XRD measurements were performed over a 2θ range of 30–90°, employing a step size of 0.01° and a dwell time of one second per step. The theoretical densities of the hybrid composites were calculated according to the rule of mixtures. Experimental density values were determined by Archimedes’ method, and based on these measurements, the relative density of each sample was calculated. The electrical conductivity of the hybrid composite specimens was evaluated using a portable SIGMASCOPE SMP10 measurement device (Fischer, Sindelfingen, Germany). For each specimen, three independent measurements were conducted, and the average value of these measurements was reported in %IACS (International Annealed Copper Standard). Hardness tests were performed using the Brinell method with a digital hardness tester (Innovatest–Nemesis 9000, Maastricht, The Netherlands) under a load of 31.25 kg, and a dwell time of 10 s. The average of three indentations per sample was reported.
The tribological behavior of the composites was examined at room temperature using a UTS linear reciprocating ball-on-disk wear tester (UTS design, Trabzon, Türkiye). 100Cr6 steel balls with a diameter of 6 mm and a hardness of approximately 840 HV served as the counter surfaces in the wear experiments. Wear experiments were performed under three normal loads—2 N, 5 N, and 10 N—over a sliding distance of 100 m, a value widely adopted in the literature for short- and medium-range wear assessments in Cu-based systems. The test protocol and reporting procedure adhered to the ASTM G133 standard [27]. The sliding speed was maintained at 40 mm/s, and the oscillation frequency was fixed at 2 Hz throughout the experiments. Each test was repeated three times using a new steel ball to ensure reproducibility. Post-test mass loss was measured with an analytical balance having a precision of ±0.0001 g (Mettler Toledo, Columbus, OH, USA), and the specific wear rate (SWR) was calculated using Equation (1). These standardized procedures enabled a comprehensive evaluation of the influence of graphene and zinc on the friction and wear performance of the composites under different load conditions. All tribological tests were performed under controlled laboratory conditions at stable room temperature, without intentional humidity regulation, corresponding to standard dry sliding conditions. Although copper is known to be sensitive to humidity variations, the consistent environmental conditions ensured that moisture effects did not influence the comparative wear behavior of the composites.
S W R   ( m m 3 N m ) = W e i g h t   l o s s   g D e n s i t y × D i s t a n c e   m × N o r m a l   l o a d   ( N )
Corrosion tests were conducted on specimens with dimensions of 40 × 10 × 5 mm, which were extracted from the region affected by the stirring tool. The experiments were carried out using a Gamry Reference 3000 electrochemical workstation (Gamry Instruments, Warminster, PA, USA), operating with an open-circuit potential range of 500 mV and a scan rate of 1 mV s−1. All measurements were performed in a 3.5 wt.% NaCl aqueous solution. The corrosion behavior of the samples was evaluated based on the corrosion potential (Ecorr) and corrosion current density (Icorr). Each experiment was repeated three times to ensure reproducibility, and the averaged results were used to construct corrosion behavior plots. The corrosion rate was subsequently calculated using the corrosion current density (Icorr) obtained from the Tafel polarization curves, according to the equation given below.
C o r r o s i o n   R a t e   ( m p y ) = 0.13 × I c o r r × E W ρ
where Icorr: corrosion current density (μA·cm2), EW (equivalent weight): equivalent weight of metal, ρ: density of the metal (g/cm3), 0.13: unit conversion factor (to convert to mpy unit). The experimental flowchart of this study is shown in Figure 1.

3. Results

3.1. Microstructural and Structural Analysis

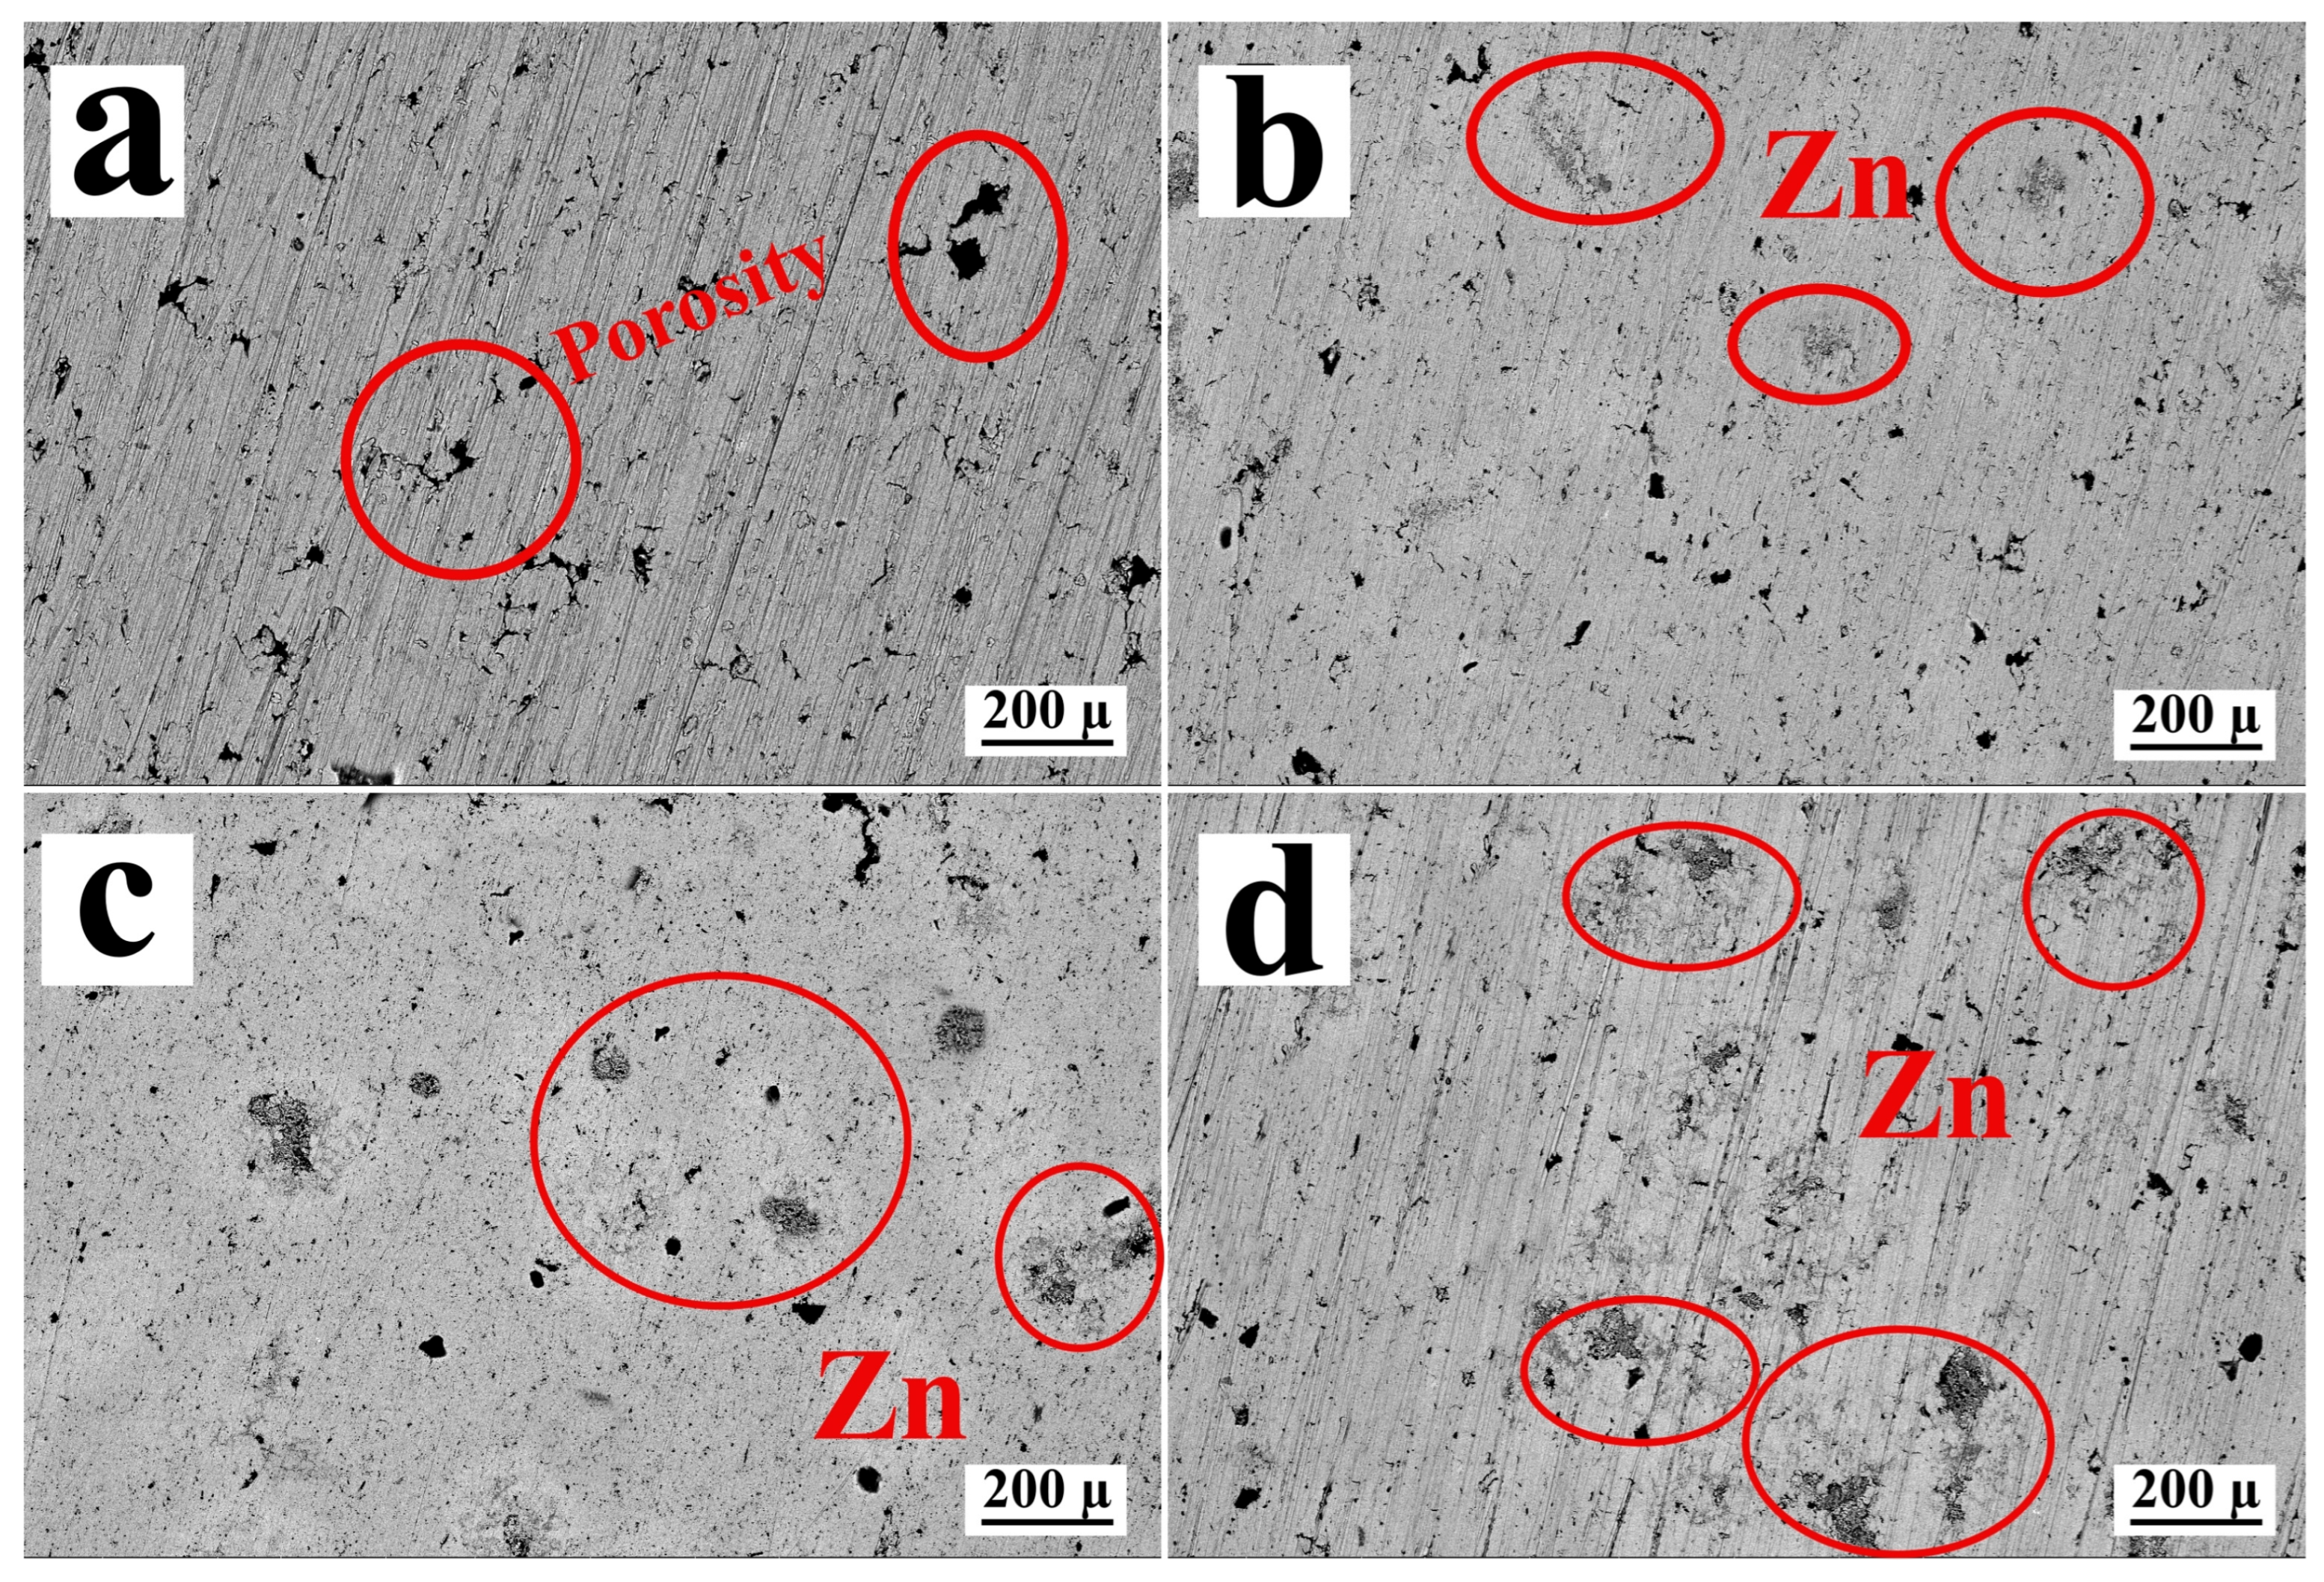
The microstructural evolution of the Cu-matrix composites reinforced with varying weight percentages of Zn was systematically investigated using Scanning Electron Microscopy (SEM) and Energy Dispersive X-ray Spectroscopy (EDS). In the unreinforced copper matrix (Figure 2a), the microstructure is characterised by a relatively homogeneous copper phase; however, significant localized porosity is observed, as indicated by the red circular markers. These voids are indicative of typical areas of incomplete densification, which are frequently encountered in the field of powder metallurgy. Following the incorporation of Zn reinforcement, a discernible secondary phase emerges, manifesting as dark, irregularly shaped clusters within the lighter Cu matrix. At a concentration of 5% Zn, these reinforcement zones are minimal and dispersed, sporadically distributed throughout the matrix. As the reinforcement content increases to 10% Zn (Figure 2c) and further to 15% Zn (Figure 2d), there is a notable increase in both the size and the population density of these Zn-rich regions. The progression from (Figure 2b–d) illustrates a clear trend where the secondary phase begins to coalesce, suggesting that higher Zn concentrations lead to a more interconnected reinforcement network.
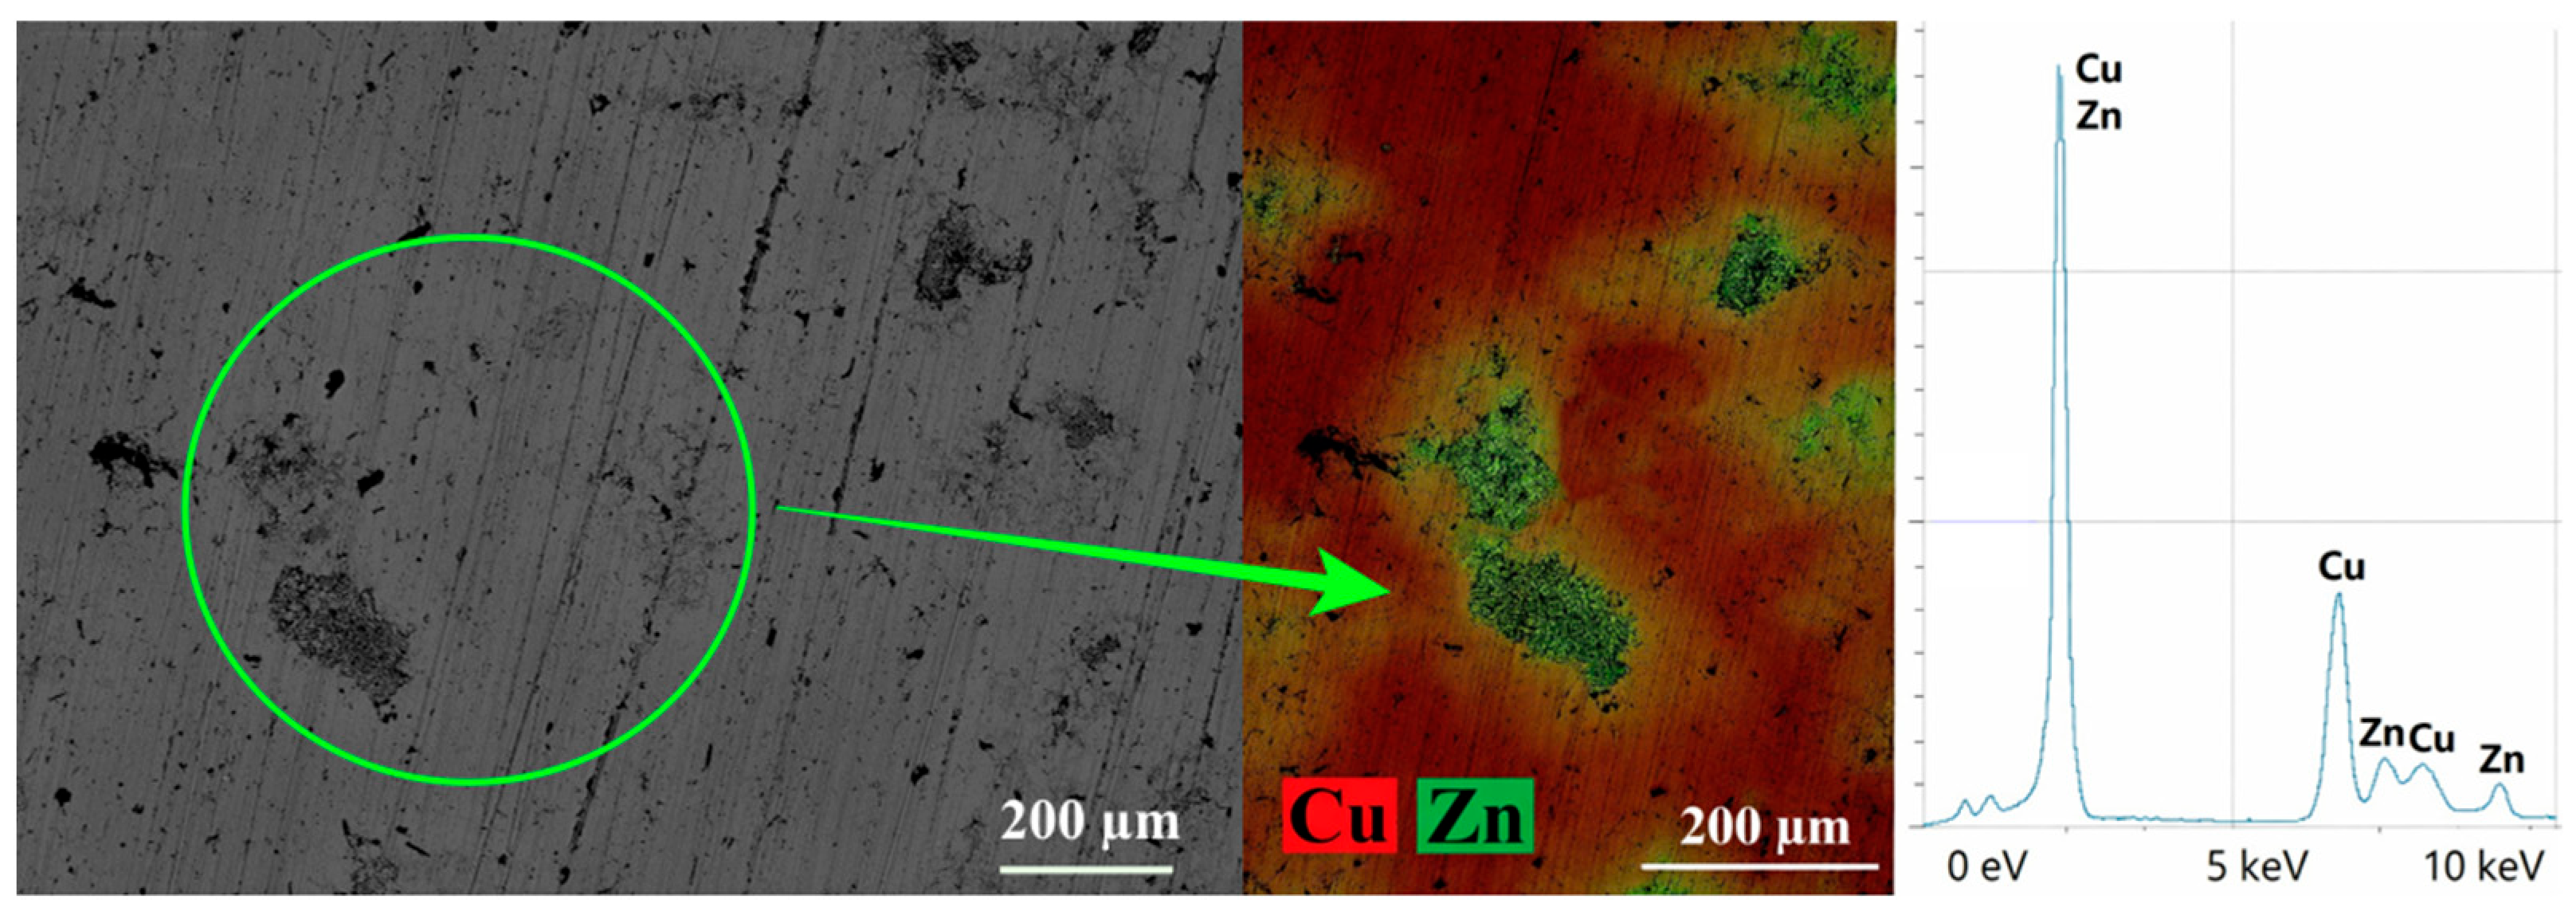
The elemental distribution and chemical composition were further verified through the analysis provided in Figure 3. The EDS elemental mapping provides confirmation of the spatial distribution of the components, with the red-coloured regions representing the Cu matrix and the green clusters corresponding to the Zn reinforcement. This mapping demonstrates that while the Zn is distributed across the sample, it remains concentrated in discrete clusters rather than forming a fully homogeneous solid solution at this scale. The EDS spectrum, which corresponds to the aforementioned samples, lends further support to these findings by demonstrating high-intensity peaks for both Cu and Zn. The presence of overlapping peaks, specifically labeled as Zn-Cu, suggests a degree of inter-diffusion at the matrix-reinforcement interface. This interfacial diffusion is a critical observation, as it indicates the potential formation of a metallurgical bond or intermetallic phases, which are essential for efficient load transfer and enhanced mechanical performance in metal matrix composites. The addition of Zn appears to influence the overall densification process, as evidenced by the observation of large, isolated pores in the pure Cu sample. These pores appear to be partially occupied or refined by the increasing volume fraction of the Zn-rich phase.

3.2. XRD Analysis

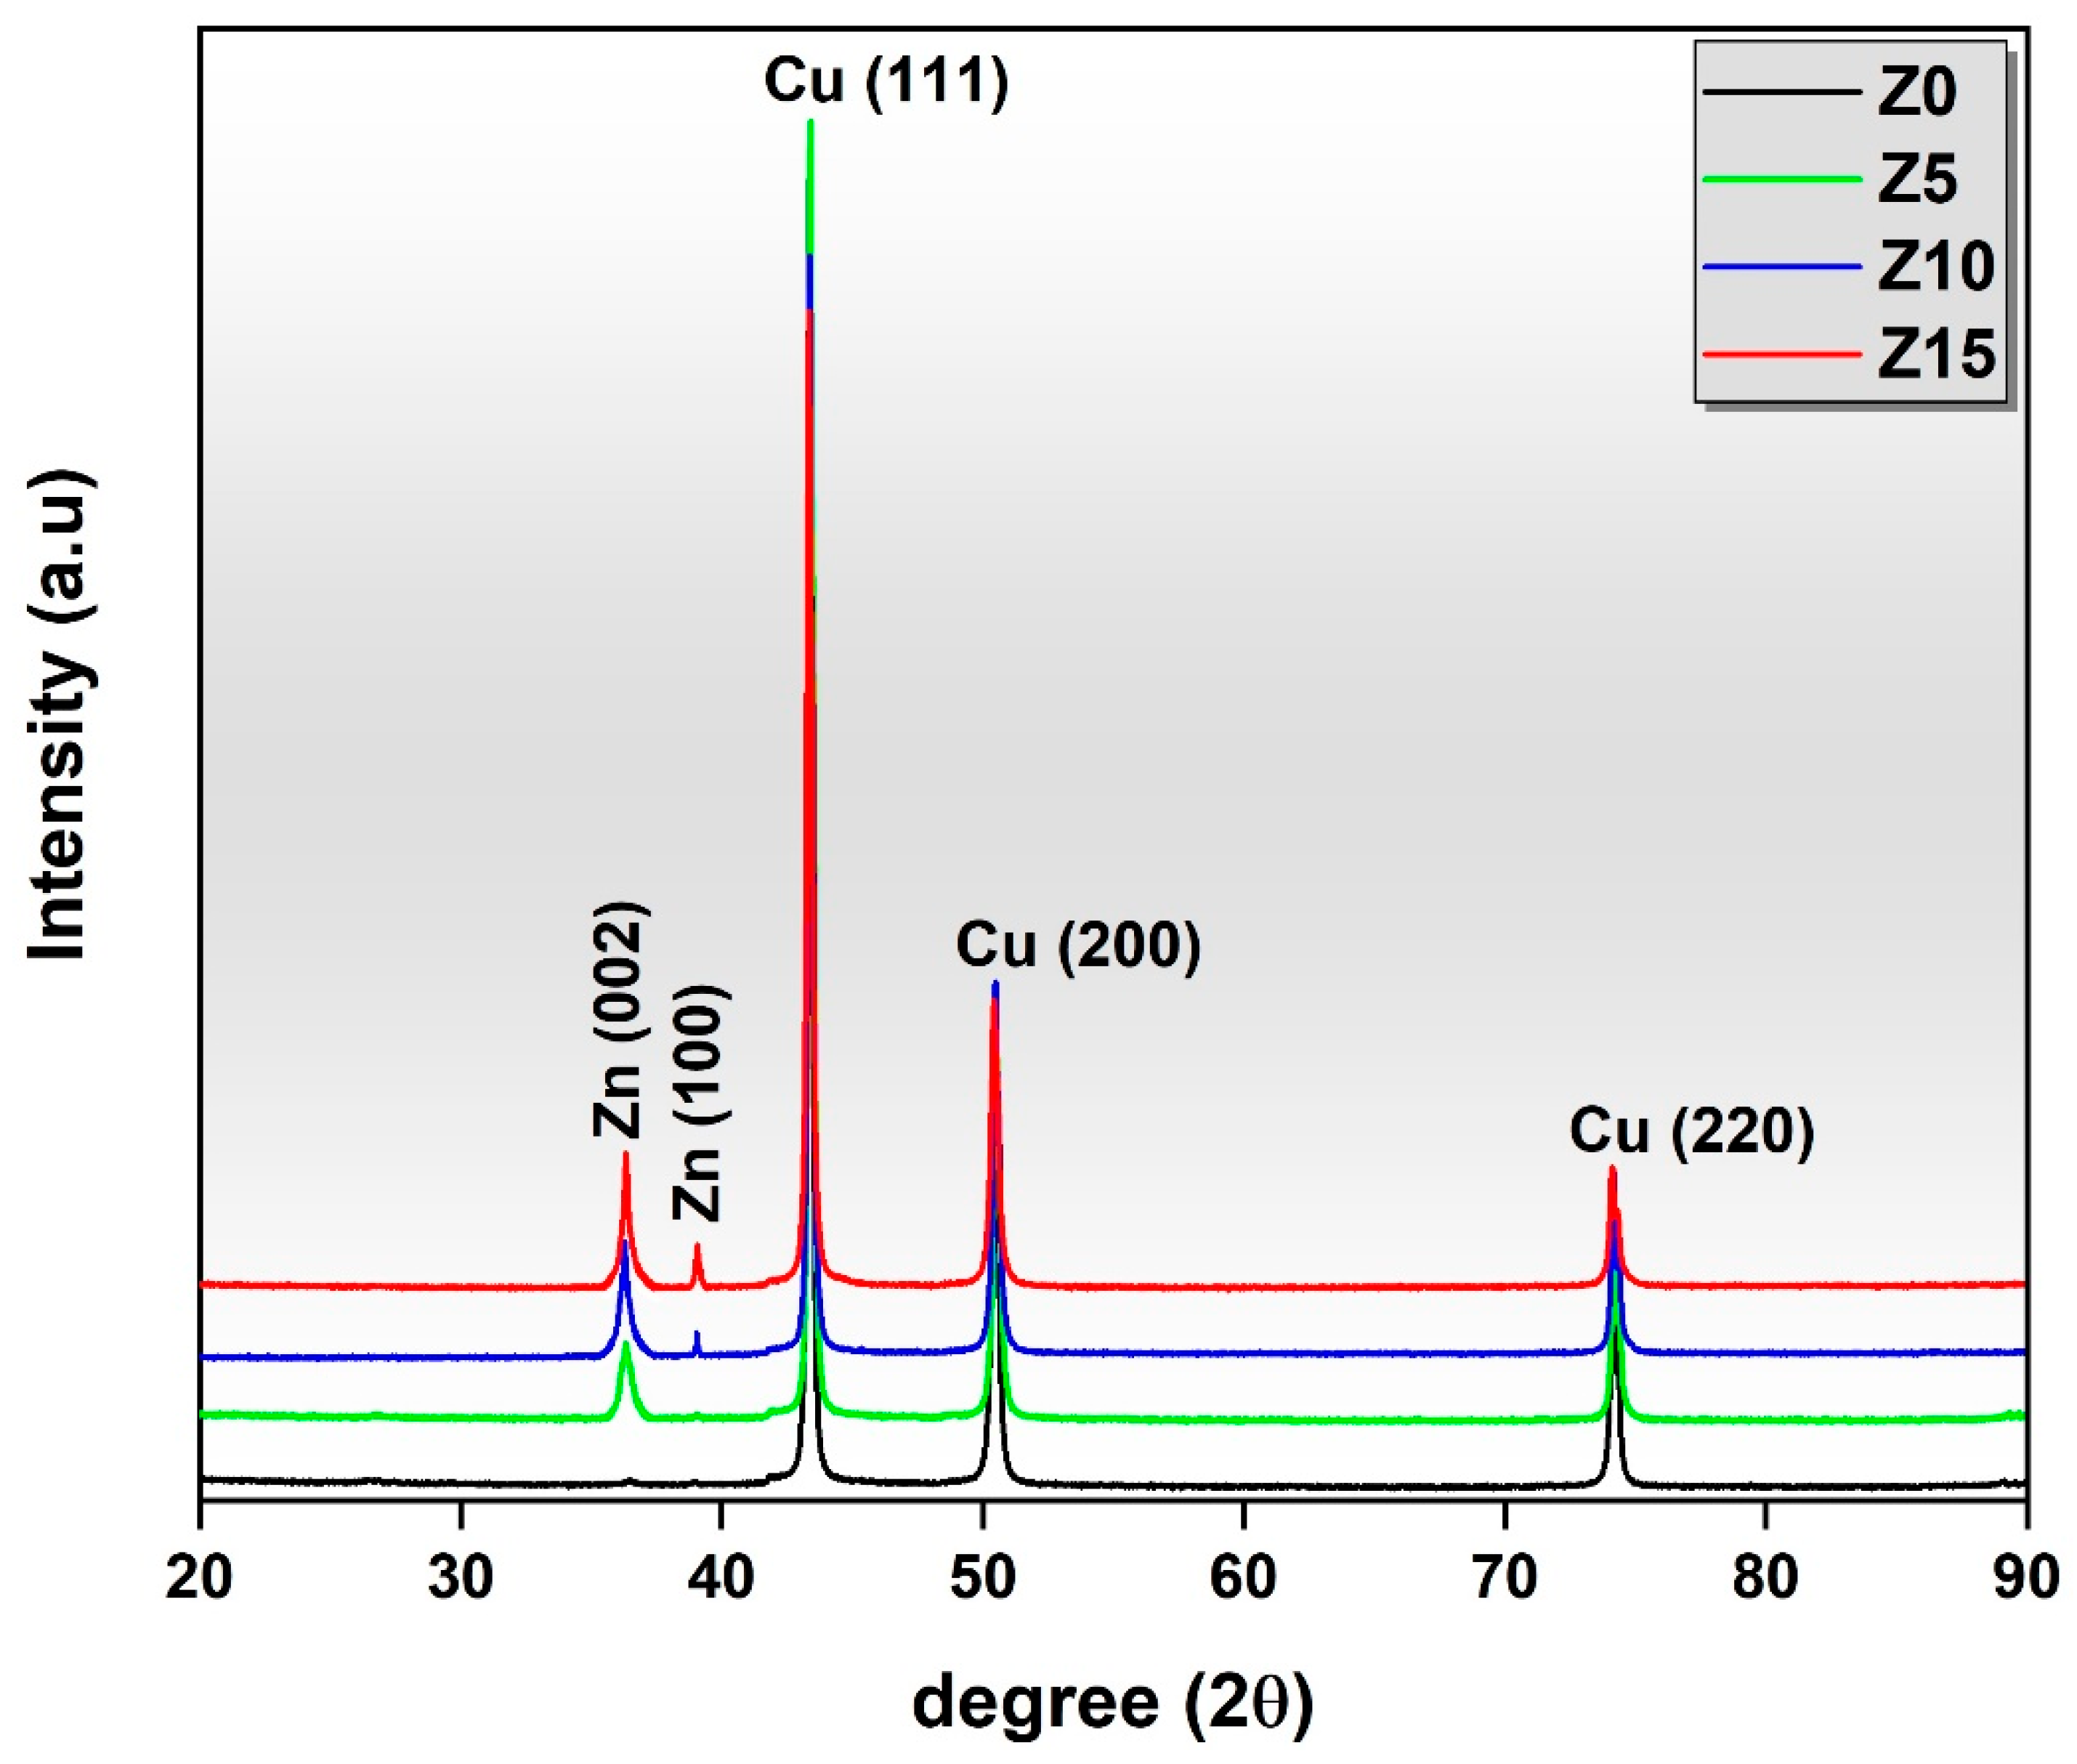
Figure 4 presents the XRD patterns of hybrid composites with a Cu matrix, containing 1% graphene by weight, and with additions of 0%, 5%, 10%, and 15% Zn, respectively, produced by the SPS method and coded as Z0, Z5, Z10, and Z15. It is clearly seen that the dominant phase in all samples is the Cu matrix, and the characteristic peaks at 2θ = 43.28°, 50.44°, and 74.12° correspond to the (111), (200), and (220) planes of Cu, respectively, and are consistent with the JCPDS 04-0836 chart [28]. With the addition of Zn, peaks at 36.34° and 39.06°, which are attributed to the (002) and (100) planes of Zn, respectively, appear, especially in samples Z10 and Z15, and their intensity becomes more pronounced as the Zn ratio increases. These peaks are consistent with the JCPDS 36-1451 chart [29]. Although there is an overlap of Cu (111) and Zn peaks around 43.28°, the Cu peak exhibits a dominant character in this region due to the presence of Cu in the matrix material. The absence of a significant shift in peak positions indicates that no new intermetallic phase formed between Cu and Zn during the SPS process, and that Zn is predominantly dissolved in the Cu matrix or present as a secondary phase [27]. Furthermore, the absence of a characteristic graphene peak in all samples can be attributed to the low proportion of graphene and its good dispersion within the Cu matrix during SPS. The XRD results reveal that the addition of Zn does not alter the phase composition of Cu matrix hybrid composites, but the Zn phases become more prominent in the structure depending on the amount [30].

3.3. Hardness

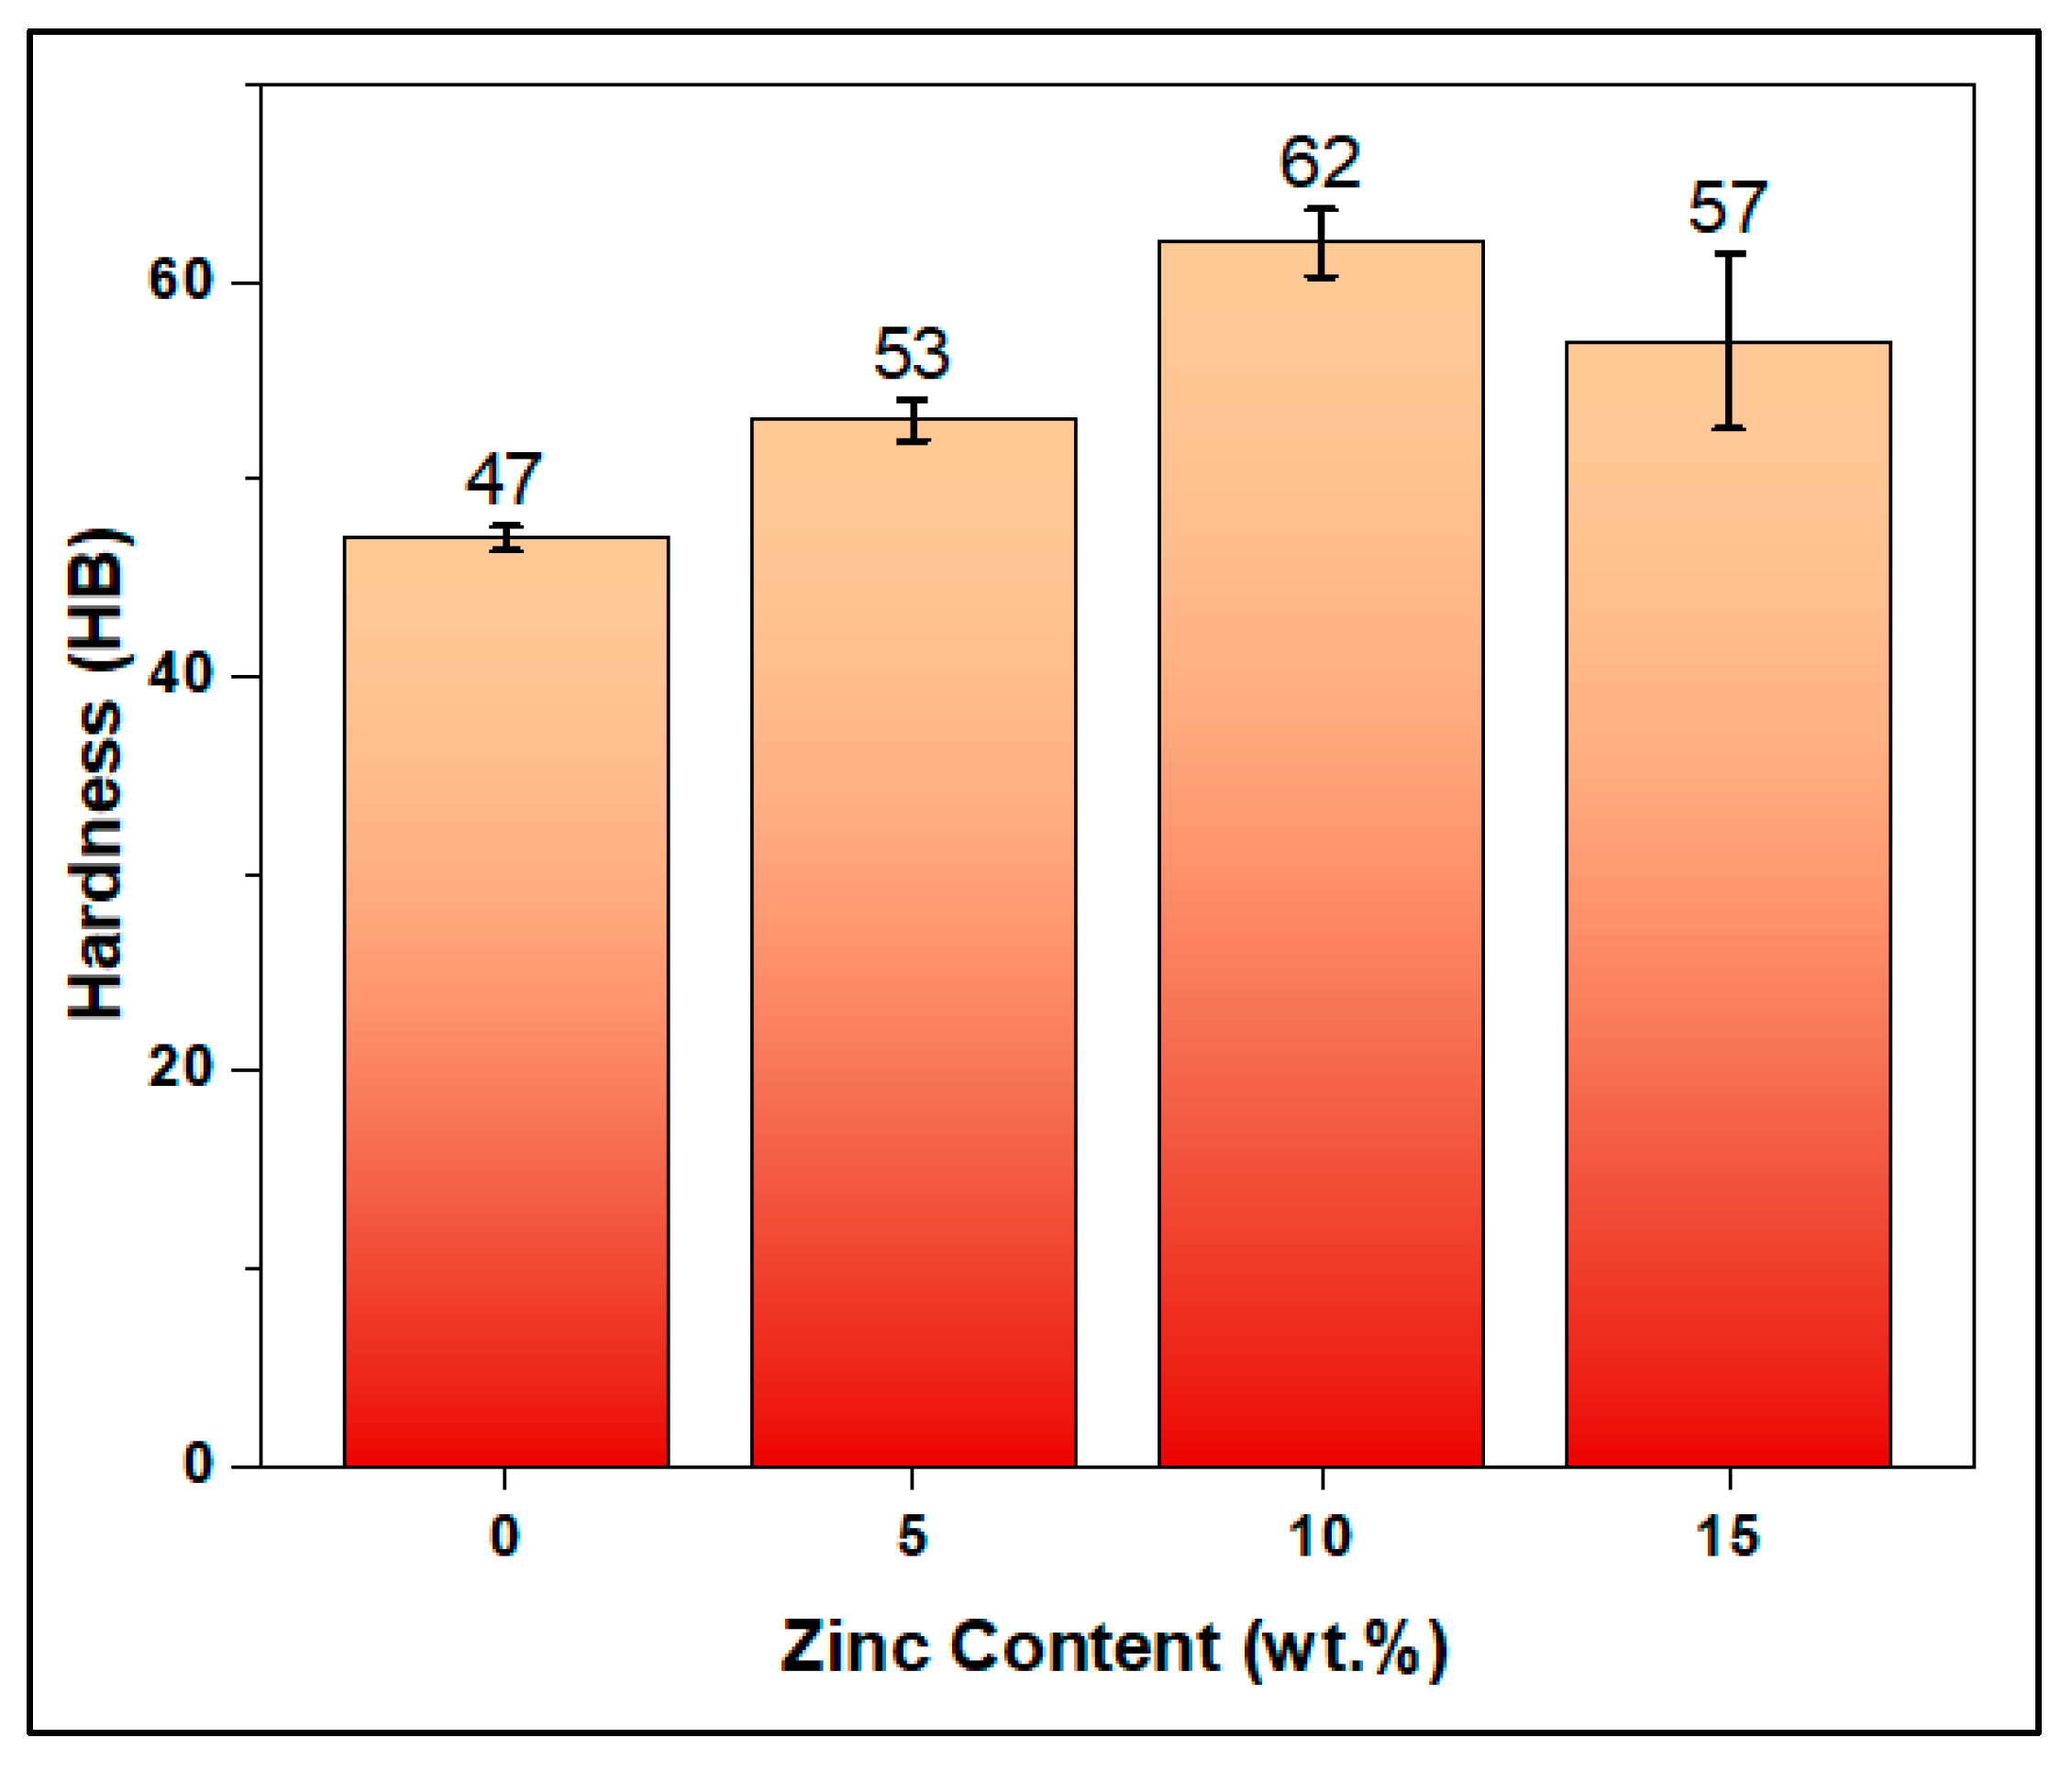
The hardness of the Cu–1 wt.% graphene matrix increases significantly up to 10 wt.% Zn, before decreasing slightly at higher concentrations (Figure 5). The Zn-free composite has a hardness of 47 HB, whereas the addition of 5, 10 and 15 wt.% Zn increases the hardness to 53, 62 and 57 HB respectively. This indicates that 10 wt.% Zn is the optimal level of reinforcement. This enhancement arises from a combination of mechanisms that are activated during mechanical alloying and preserved through spark plasma sintering (SPS). Zn atoms substitute into the Cu lattice, generating localised strain fields due to the mismatch in atomic size. This impedes the motion of dislocations in line with the principles of Hume-Rothery, thereby contributing to the strengthening of the solid solution. At the same time, severe plastic deformation refines the grain structure, increasing the density of grain boundaries, which act as effective obstacles to dislocation glide, in accordance with the Hall–Petch effect. The presence of graphene at a concentration of 1 wt.% across all samples stabilises the refined microstructure by forming thin interfacial layers that limit localised shear, inhibit dislocation transmission and suppress particle agglomeration. This indirectly enhances strengthening from Zn and grain-boundary mechanisms. The slight reduction in hardness at 15 wt.% Zn is likely due to the formation of Zn-rich clusters or partially segregated regions that relax lattice strains and reduce microstructural uniformity. It is noteworthy that the hardness trend displays a close correlation with the relative density behaviour of the composites, where the maximum hardness is at 10 wt.% Zn corresponds with the highest relative density [31,32,33]. This correlation underscores the pivotal function of densification in facilitating effective load transfer, mitigating porosity-induced stress concentration sites, and enabling the complete expression of intrinsic strengthening mechanisms. The overall hardness behaviour reflects the concurrent contributions of solid-solution strengthening, grain refinement, graphene-mediated interfacial stabilization, and SPS-assisted densification. The hardness peak observed at 10 wt.% Zn clearly indicates the optimum interplay of these multiscale reinforcement mechanisms [34,35].

3.4. Relative Density

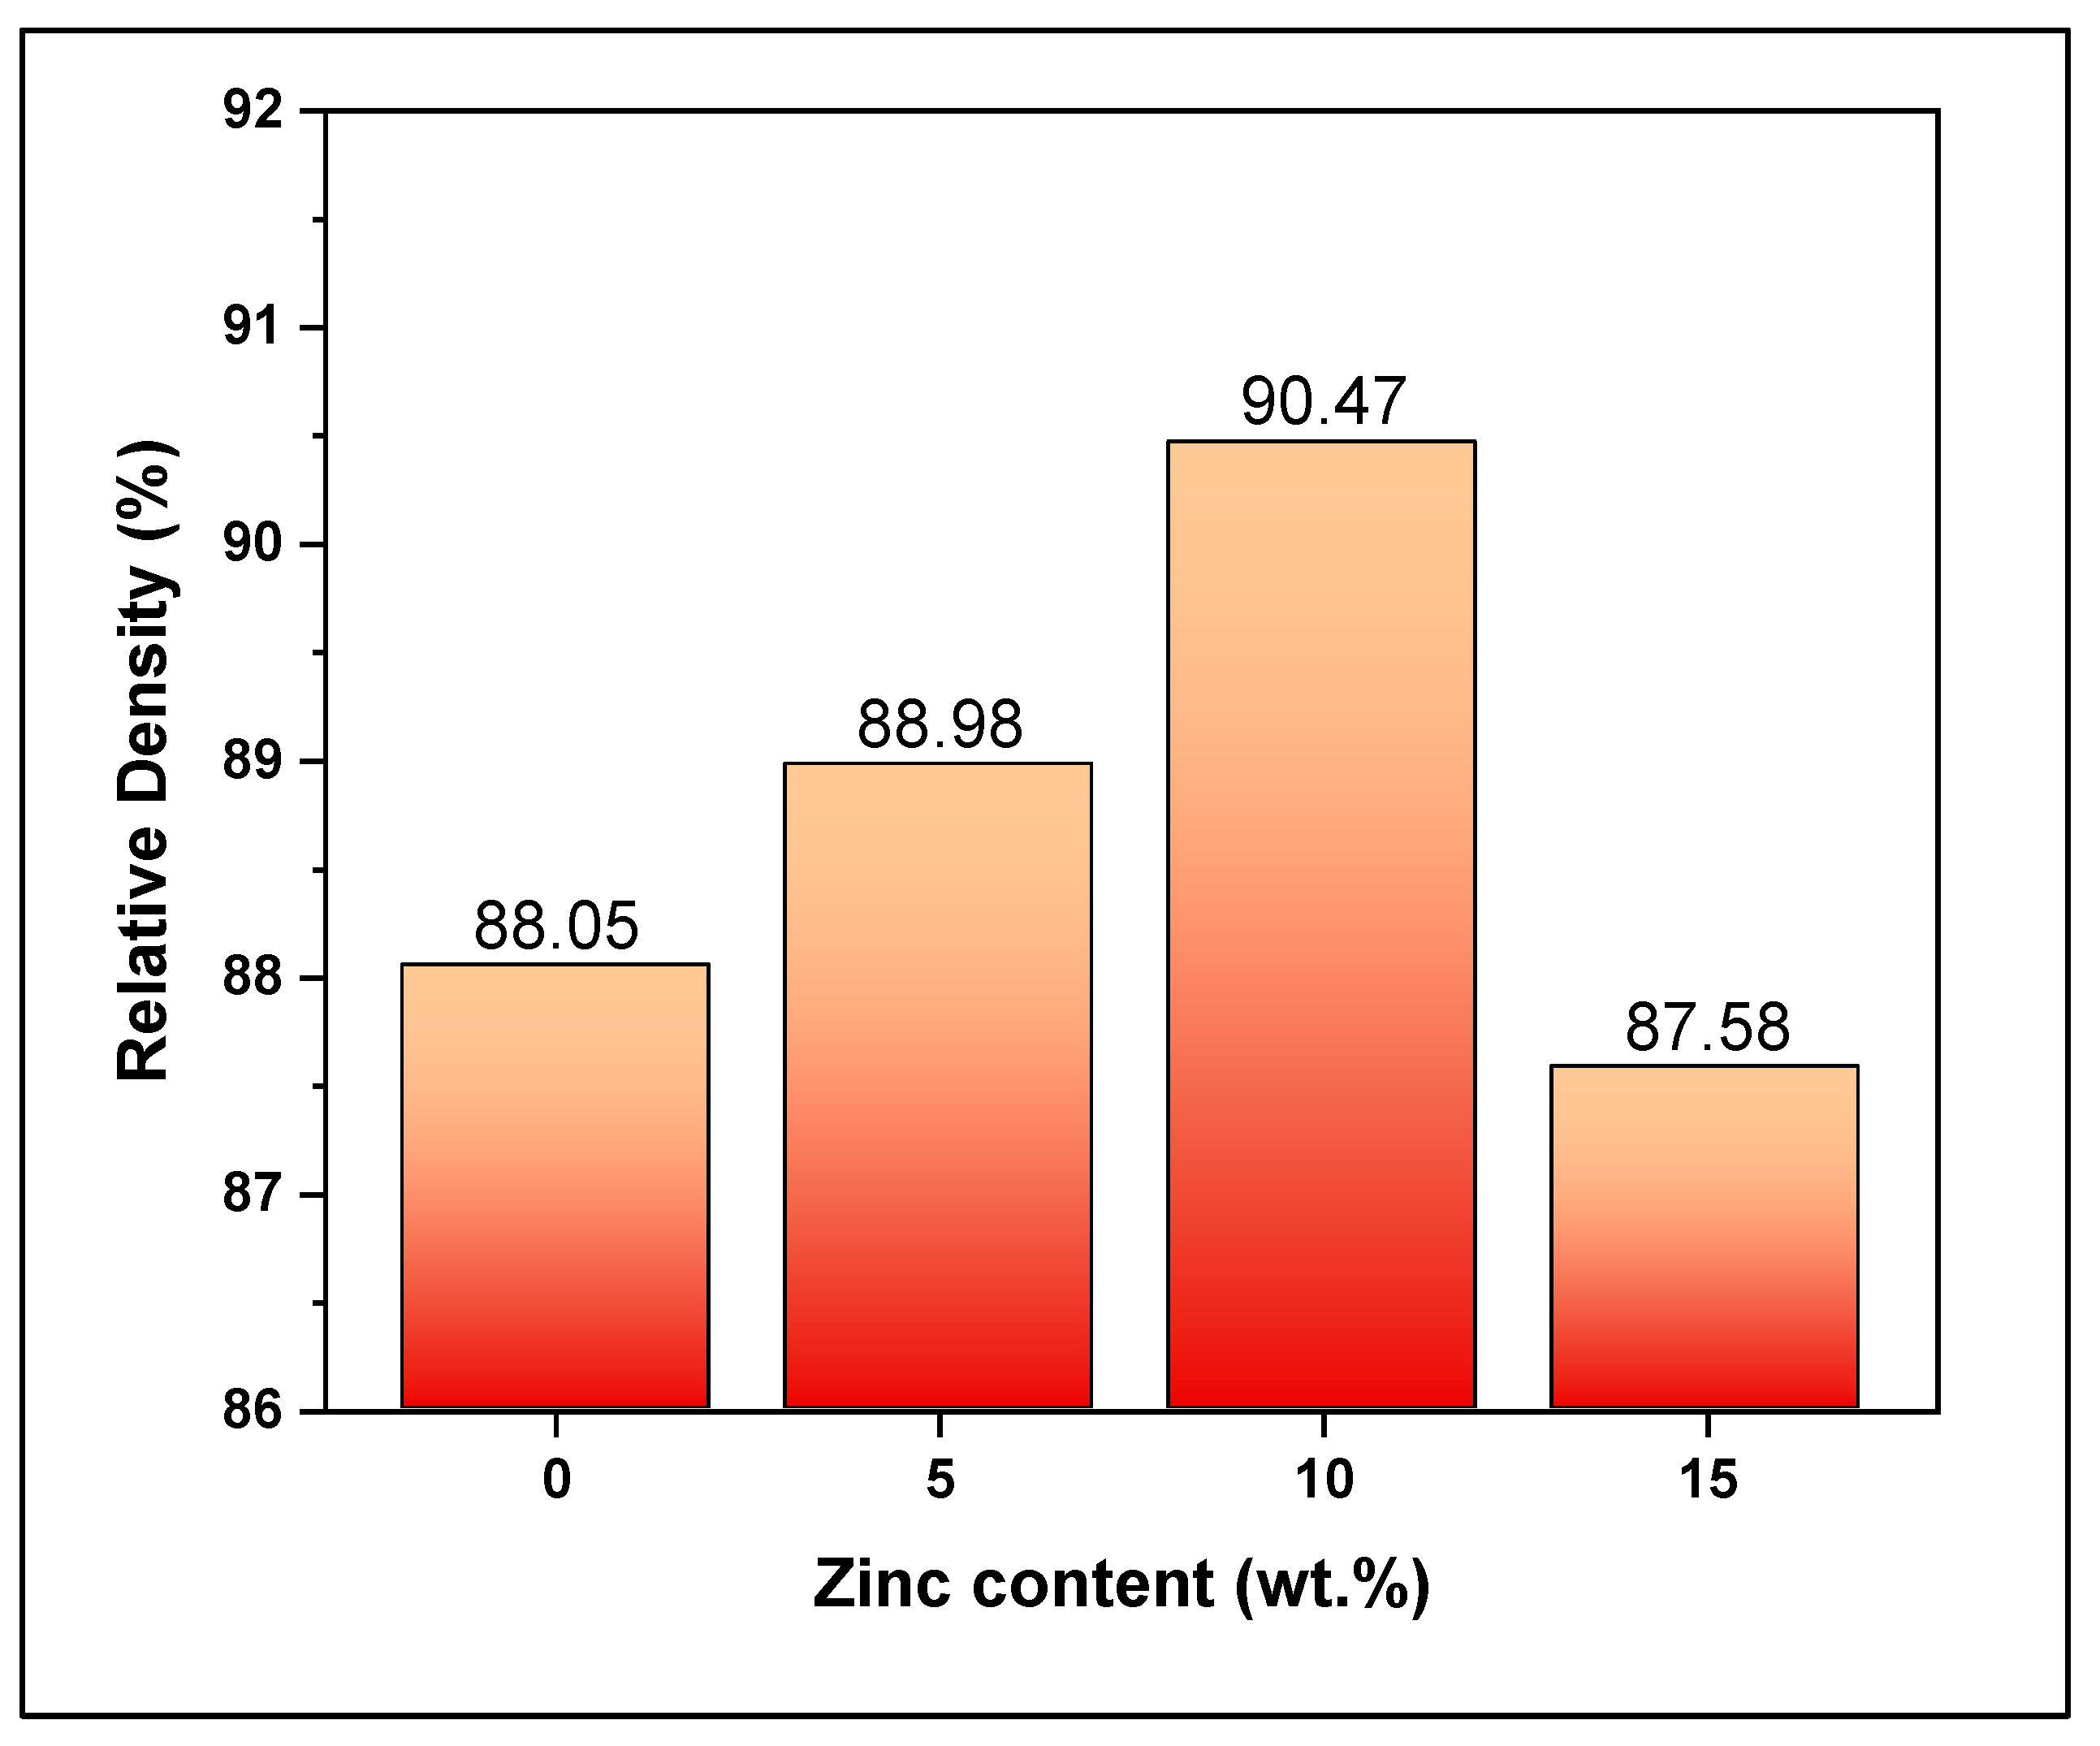
The relative density evolution of the Cu–1 wt.% graphene matrix composites reinforced with varying Zn contents exhibits a non-monotonic trend, where densification improves up to 10 wt.% Zn and decreases at higher concentrations, as shown in Figure 6. The Zn-free Cu–graphene composite shows a relative density of 88.05%, reflecting the intrinsic densification challenges associated with graphene incorporation. Graphene nanosheets possess an extremely high specific surface area and tend to agglomerate due to strong van der Waals interactions. These agglomerated regions often accumulate at particle boundaries and act as physical diffusion barriers that restrict atomic transport and hinder metallurgical bonding during Spark Plasma Sintering (SPS) [15,36]. In addition, the intrinsic poor wettability between copper and carbon-based reinforcements limits effective interfacial bonding and further restricts densification. The high aspect ratio of graphene nanosheets may also promote pore stabilization by preventing effective particle-to-particle neck growth during sintering. Despite these diffusion-limiting effects, graphene also plays a dual role during powder processing. Owing to its solid-lubricant nature, graphene can reduce interparticle friction during mechanical alloying and compaction, facilitating particle rearrangement and improving the green density of the powder compact. However, this lubrication effect alone is insufficient to fully overcome diffusion limitations in the absence of a sintering activator. The addition of Zn significantly influences the densification behavior of the composites. With the incorporation of 5 and 10 wt.% Zn, the relative density increases to 88.98% and 90.47%, respectively. This improvement can be attributed to several mutually contributing mechanisms. Zn has a lower melting point and higher diffusivity compared with Cu, which enhances atomic mobility during SPS and promotes interfacial diffusion and neck growth between Cu particles. Furthermore, Zn addition can partially improve interfacial bonding at Cu–graphene boundaries, thereby compensating for the diffusion-blocking effect of graphene. Zn may also locally reduce the effective sintering temperature and accelerate pore shrinkage kinetics, leading to more efficient pore elimination [37,38]. Consequently, the peak densification observed at 10 wt.% Zn indicates an optimal balance between Zn-assisted diffusion enhancement and the microstructural stabilization provided by graphene. However, when the Zn content increases to 15 wt.%, the relative density decreases to 87.58%. This reduction is attributed to Zn-related microstructural instabilities. Excess Zn may lead to localized enrichment, compositional heterogeneity, and particle agglomeration during milling. In addition, due to the relatively high vapor pressure of Zn at SPS temperatures, partial Zn evaporation may occur during sintering, generating microvoids and residual porosity. Excessive Zn can also disrupt the continuity of the Cu matrix and reduce structural integrity, thereby limiting densification efficiency.
Although the achieved relative density values (~90.5% at maximum) are lower than those typically reported for monolithic SPS-processed copper systems (>95–99%), they can be physically justified for mechanically alloyed Cu–graphene–Zn hybrid composites. In such systems, densification is governed by the combined effects of graphene-induced diffusion barriers, limited Cu–graphene wettability, reinforcement dispersion challenges, and possible Zn volatilization during SPS processing. Therefore, the overall densification behavior results from the competing influences of graphene-driven diffusion restriction, Zn-enhanced atomic mobility, lubrication-assisted compaction, and SPS-enabled rapid consolidation, with 10 wt.% Zn identified as the optimal composition for maximizing densification.

3.5. Electrical Conductivity

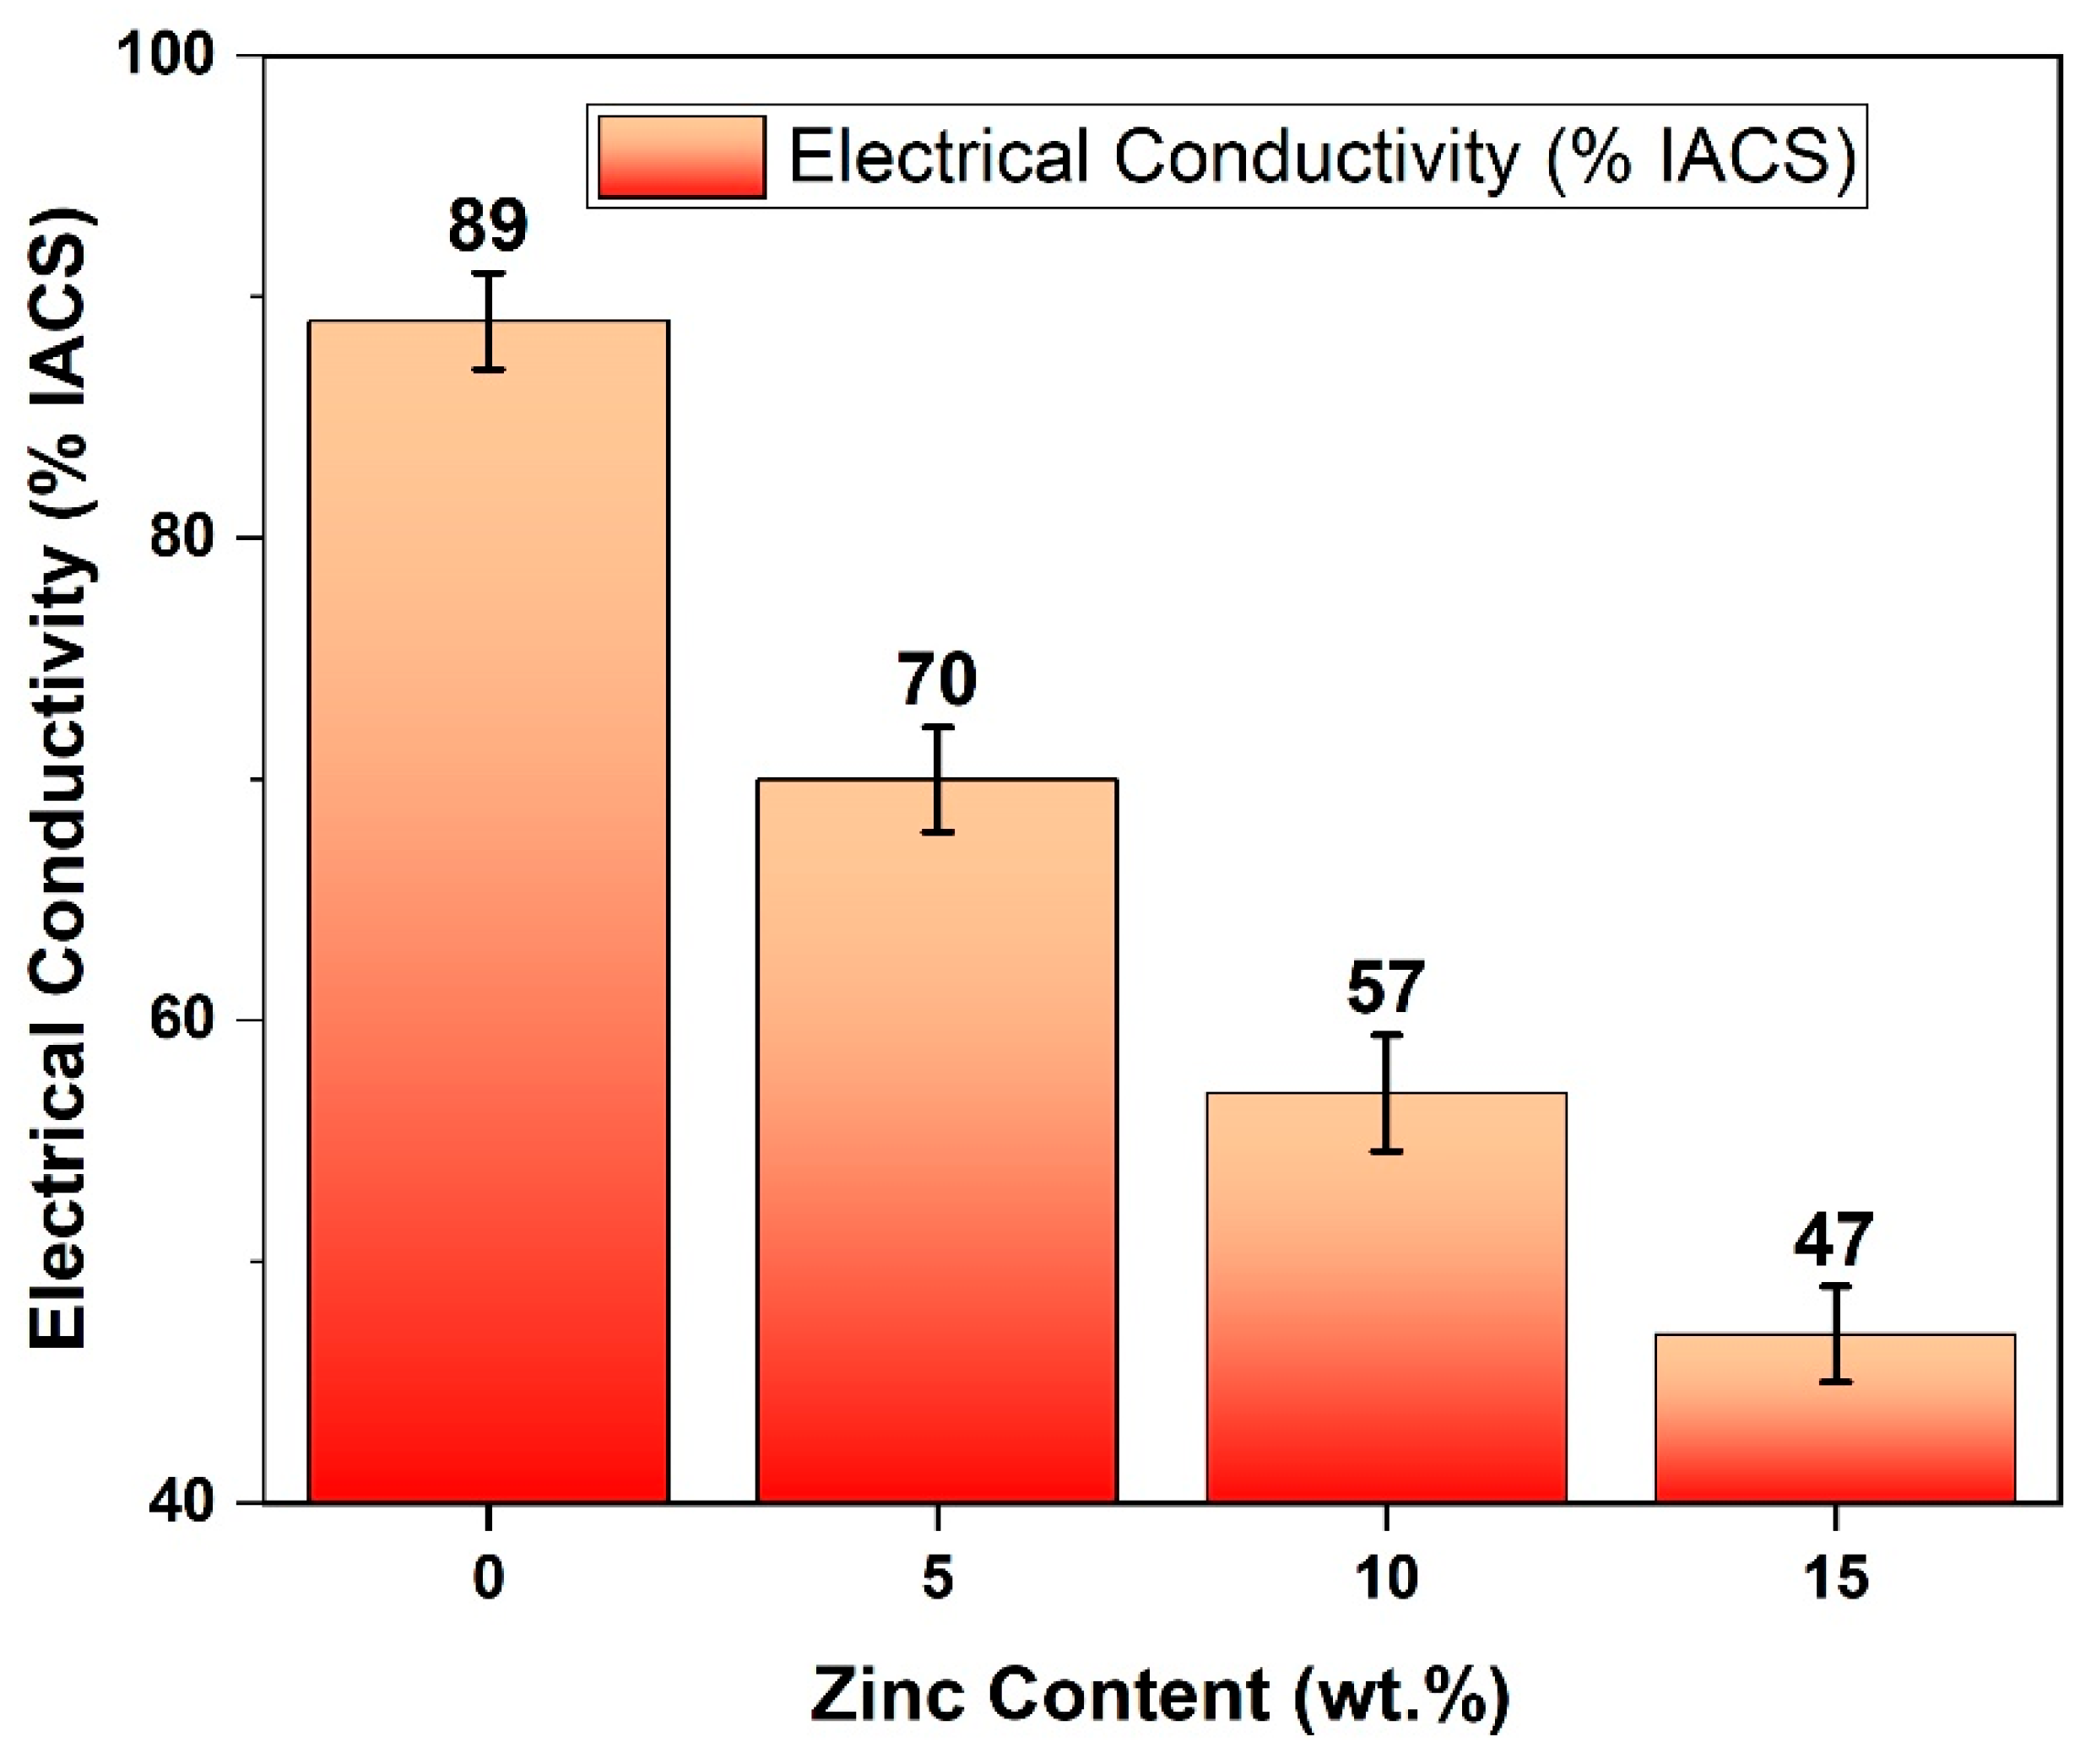
The electrical conductivity values of the composites fabricated with varying Zn contents are presented in Figure 7. The electrical conductivity of the Cu–1 wt.% graphene hybrid composites exhibits a clear and systematic dependence on composition, with the Zn-free composite (Z0) demonstrating the highest conductivity and a gradual, controlled reduction observed with increasing Zn content. Since the graphene content was fixed at 1 wt.% in all samples, graphene did not control the compositional trend in conductivity. Instead, its role was to support electrical transport by contributing intrinsically conductive pathways and by helping maintain interfacial continuity in the SPS-consolidated microstructure. In addition to compositional effects, the continuity of the conductive network is also influenced by the degree of densification and the associated porosity level, since pore formation can interrupt electron transport paths and increase local resistance. This evolution in electrical conductivity therefore reflects the combined effects of alloying-induced electron scattering and microstructural factors related to SPS-assisted densification. In the Z0 sample, the superior conductivity is primarily attributed to the continuous copper matrix combined with the inherently high electrical conductivity of graphene. Although graphene–Cu interfaces and minor residual porosity are present, the rapid heating rate, pulsed current, and short dwell time characteristic of the SPS process promote effective metallurgical bonding and minimize interfacial defects. As a result, continuous conductive pathways are preserved, allowing efficient charge transport even in the presence of non-metallic reinforcement phases.
The progressive decrease in electrical conductivity with increasing Zn content is mainly governed by solid-solution effects [39]. The substitutional incorporation of Zn atoms into the Cu lattice introduces lattice distortions that act as electron scattering centers, thereby reducing the electron mean free path and electrical conductivity. However, changes in porosity also contribute to this behavior. A reduction in porosity supports interparticle contact and conductive continuity, which can partially offset the conductivity loss arising from electron scattering, whereas an increase in porosity tends to further disrupt charge transport by introducing additional discontinuities within the conductive network. Therefore, the conductivity trend is controlled not only by intrinsic lattice-level scattering mechanisms but also by the evolution of microstructural compactness. Among the investigated compositions, the Z10 composite represents a critical balance between electrical and mechanical performance. Although its electrical conductivity decreases with increasing Zn content, it simultaneously exhibits the highest hardness, maximum relative density, and superior corrosion resistance. Its relatively compact microstructure helps preserve conductive pathways more effectively than would be expected from composition alone, confirming that the combined effects of graphene reinforcement and SPS consolidation stabilize the conductive copper network. Consequently, the electrical conductivity of all reinforced samples remains within acceptable limits for engineering applications involving moderate current loads. At a Zn content of 15 wt.%, the electrical conductivity further decreases due to cumulative lattice distortion, compositional heterogeneity, and a deterioration in conductive continuity associated with microstructural imperfections. In particular, the combined influence of stronger electron scattering, Zn-rich regions, and less effective densification promotes interruption of conductive paths, leading to the lowest conductivity among the studied composites. However, the absence of a sharp conductivity drop still highlights the overall robustness of the SPS-processed microstructure, even at higher reinforcement levels.

3.6. Corrosion Behavior

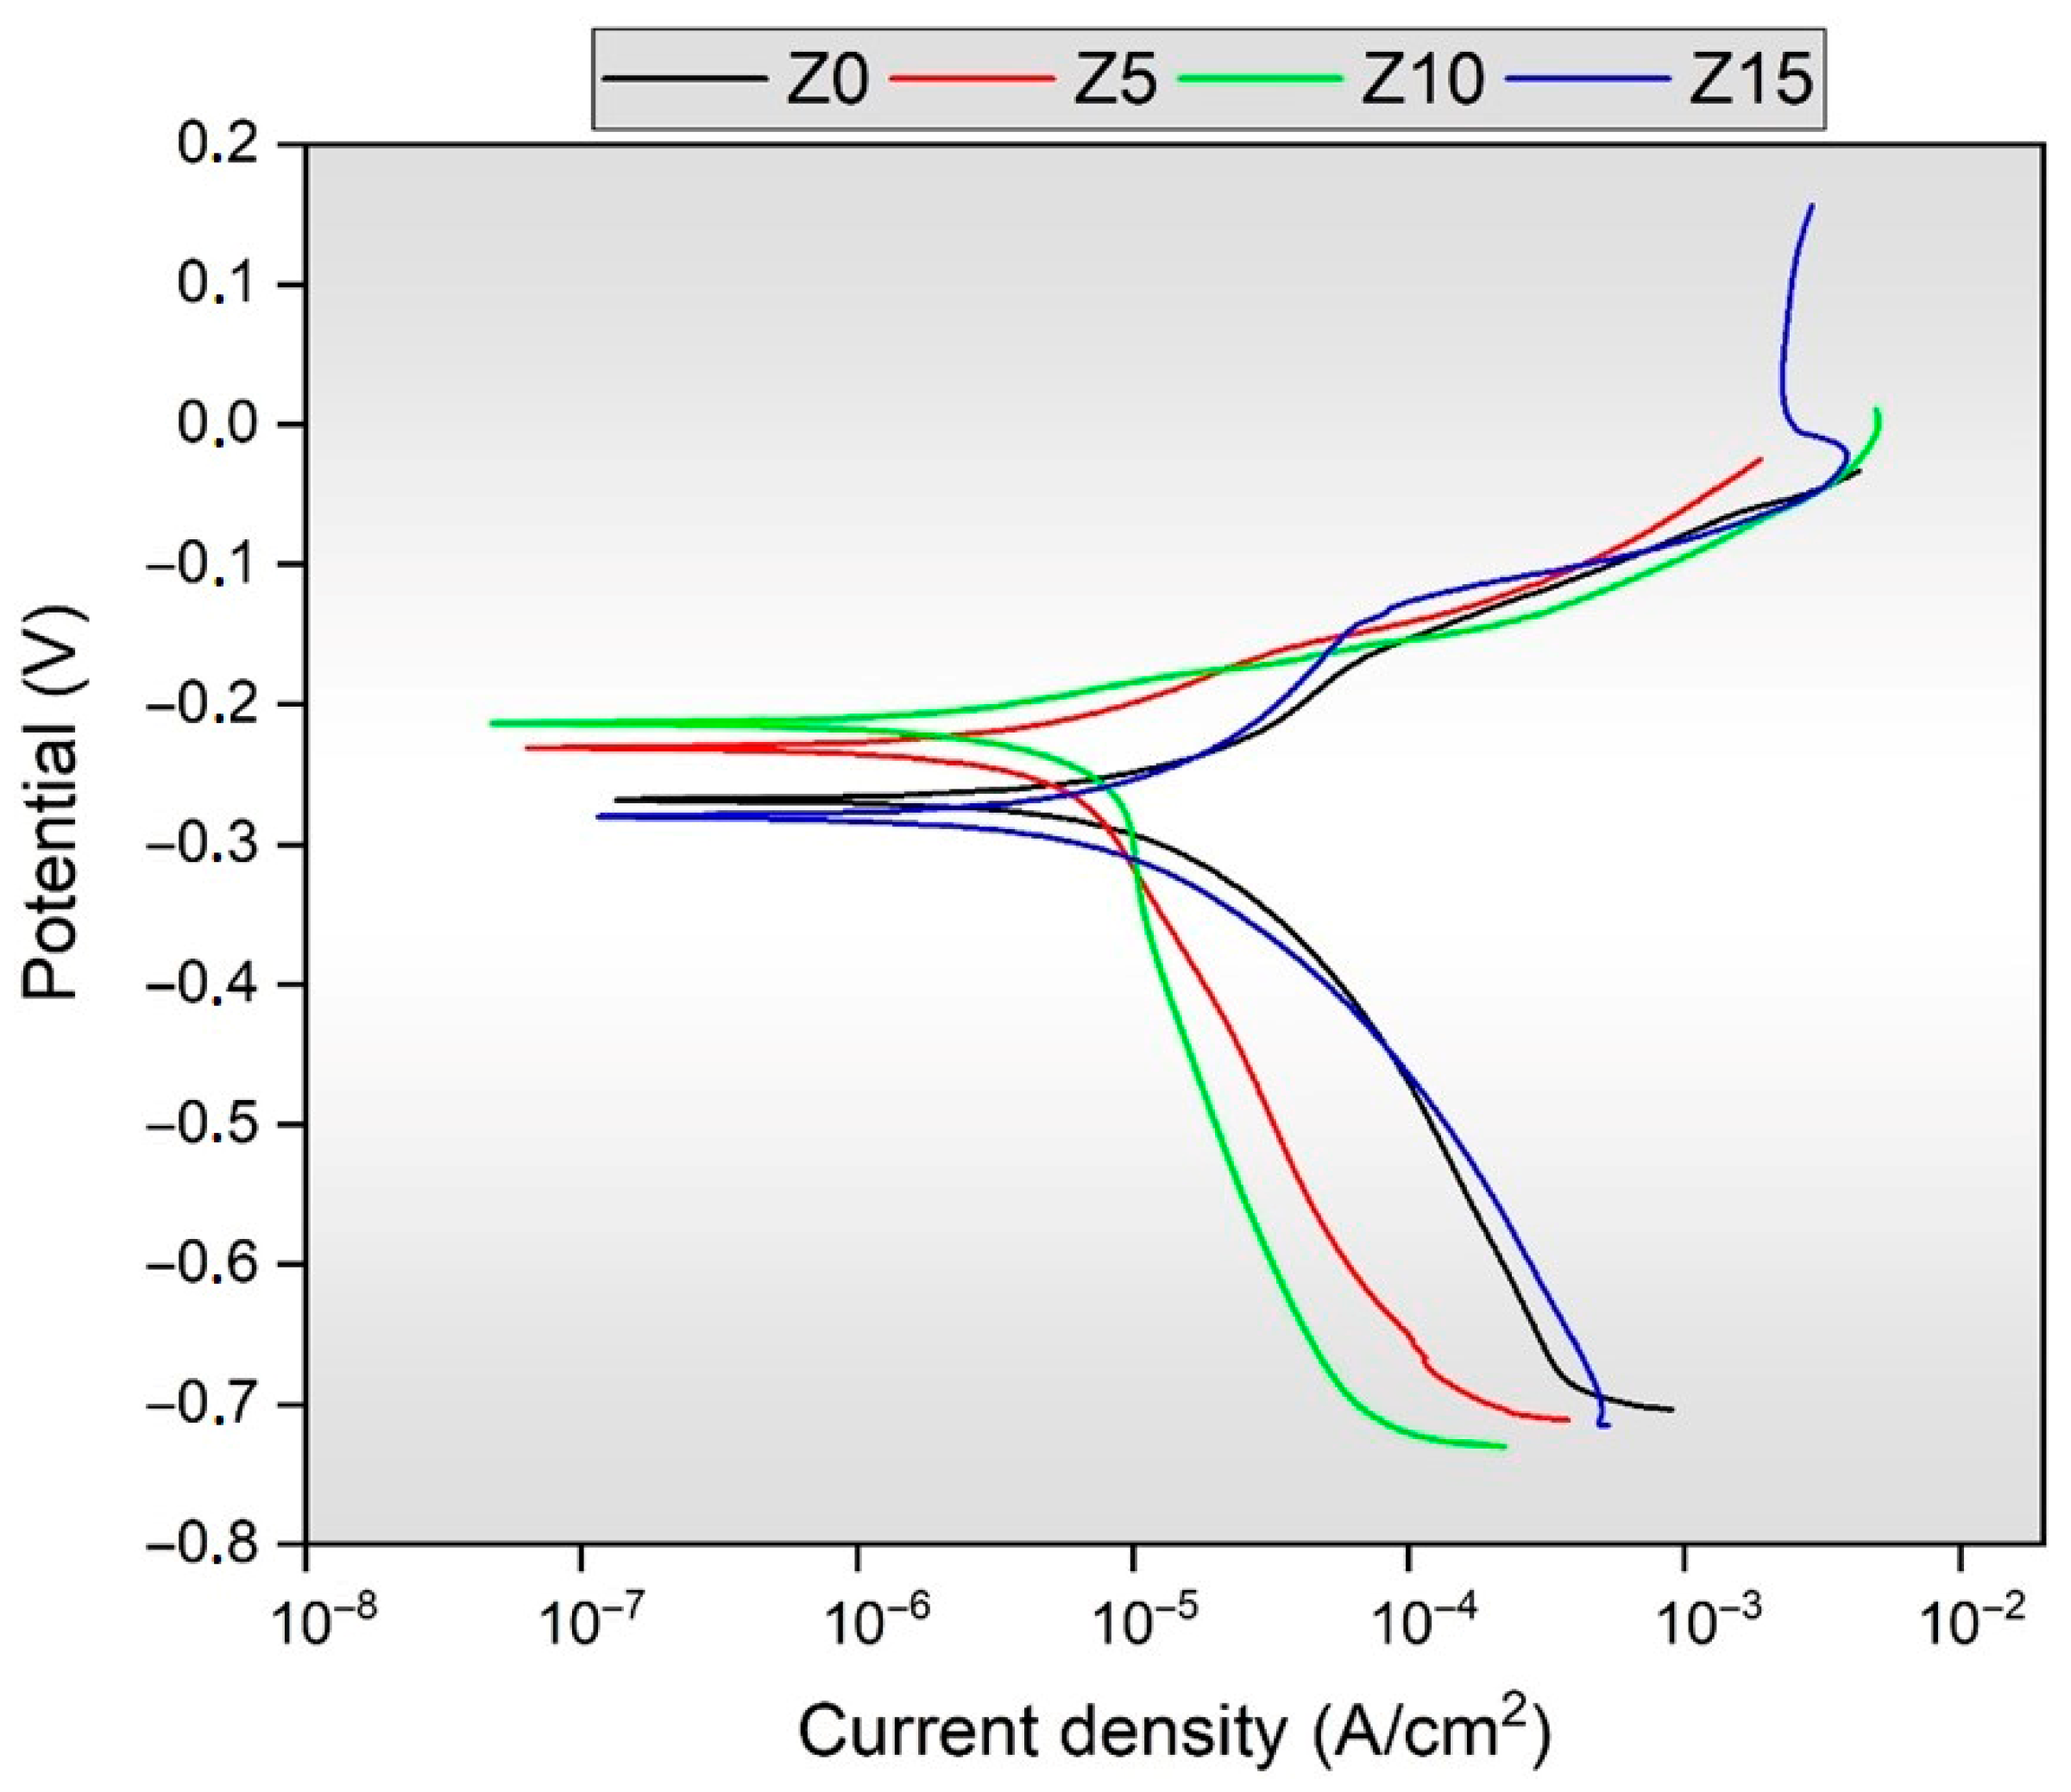
The corrosion behavior of Cu matrix hybrid composites containing 1 wt.% graphene and reinforced with different Zn ratios (0%, 5%, 10%, and 15%) was evaluated using potentiodynamic polarization tests performed in a 3.5 wt.% NaCl solution. The polarization curves presented in Figure 8 and the electrochemical parameters listed in Table 2 reveal that the addition of Zn has a significant and nonlinear effect on the corrosion behavior. The Z0 sample, without Zn, exhibited the lowest corrosion resistance with a relatively more negative corrosion potential (Ecorr) of −268 mV and a high corrosion current density (Icorr) of 19.60 μA/cm2. This behavior can be attributed to the higher porosity level reported in the Z0 sample, which allows the electrolyte to penetrate the structure more easily and increases the active anode areas. Z5 resulted in a significant improvement in corrosion resistance, causing Ecorr to shift towards more noble values of −231 mV and Icorr to decrease to 13.30 μA/cm2. This improvement can be explained by Zn supporting the sintering kinetics in the SPS process, contributing to the formation of a more compact microstructure and limiting porosity [40,41]. The best corrosion performance was obtained in sample Z10 with the most noble Ecorr value of −214 mV and the lowest Icorr value of only 2.25 μA/cm2, which is also confirmed by the lowest corrosion rate (1.879 mpy) given in Table 2. The superior corrosion resistance of sample Z10 can be attributed to a more homogeneous microstructure, reduced porosity, and suppression of local galvanic cell formation due to the more balanced distribution of Zn within the Cu matrix. In contrast, increasing the Zn content to 15% (Z15) resulted in a significant decrease in corrosion resistance, causing Ecorr to shift back to more active values towards −280 mV and Icorr to rise to 16.30 μA/cm2. This negative effect can be explained by the decrease in microstructural homogeneity at high Zn content, the formation of Zn-rich regions, and the acceleration of local corrosion processes by the formation of micro-galvanic pairs between these regions and the Cu matrix. The corrosion behaviour of Cu-graphene-Zn hybrid composites appears to be directly related to the Zn content; however, this relationship is most beneficial within an optimum composition range. The results demonstrate that the incorporation of 10% Zn provides the most balanced composition in terms of microstructural integrity, porosity control, and electro-chemical stability, thereby ensuring optimal corrosion resistance for Cu-based hybrid composites. In a similar study, the effect of Zn addition on the corrosion behavior of Cu-Zn alloys was systematically investigated, and it was reported that moderate Zn content provided more noble corrosion potentials and lower corrosion current densities, while high Zn ratios accelerated micro-galvanic corrosion with the formation of Zn-rich regions [37,42]. This directly coincides with the fact that the Z10 sample containing 10% Zn exhibited the lowest Icorr and the most noble Ecorr values in the present study. In another study conducted on graphene-reinforced Cu matrix composites, it was stated that corrosion resistance is closely related to microstructural integrity and porosity level rather than the presence of graphene, and that when sufficient densification is achieved, graphene acts as an effective diffusion barrier, limiting electrolyte passage [43,44]. This finding demonstrates that the low porosity and homogeneous microstructure obtained in sample Z10 maximize the contribution of graphene to corrosion resistance. Furthermore, it has been previously reported that excessively increasing the alloy content in graphene-reinforced Cu composites negatively impacts corrosion resistance by leading to electrochemical incompatibilities at the matrix-reinforcement interfaces [45]. The more negative Ecorr and increased Icorr values observed in sample Z15 containing 15% Zn in the present study are consistent with this micro-galvanic effect-based corrosion mechanism reported in the literature. It is evident from the results that the quantity of zinc (Zn) is a pivotal optimisation parameter in Cu-graphene-Zn hybrid composites. The findings indicate that attaining a Zn content of approximately 10% results in the most balanced composition, characterised by microstructural homogeneity, densification, and electrochemical stability.

3.7. Wear Behavior

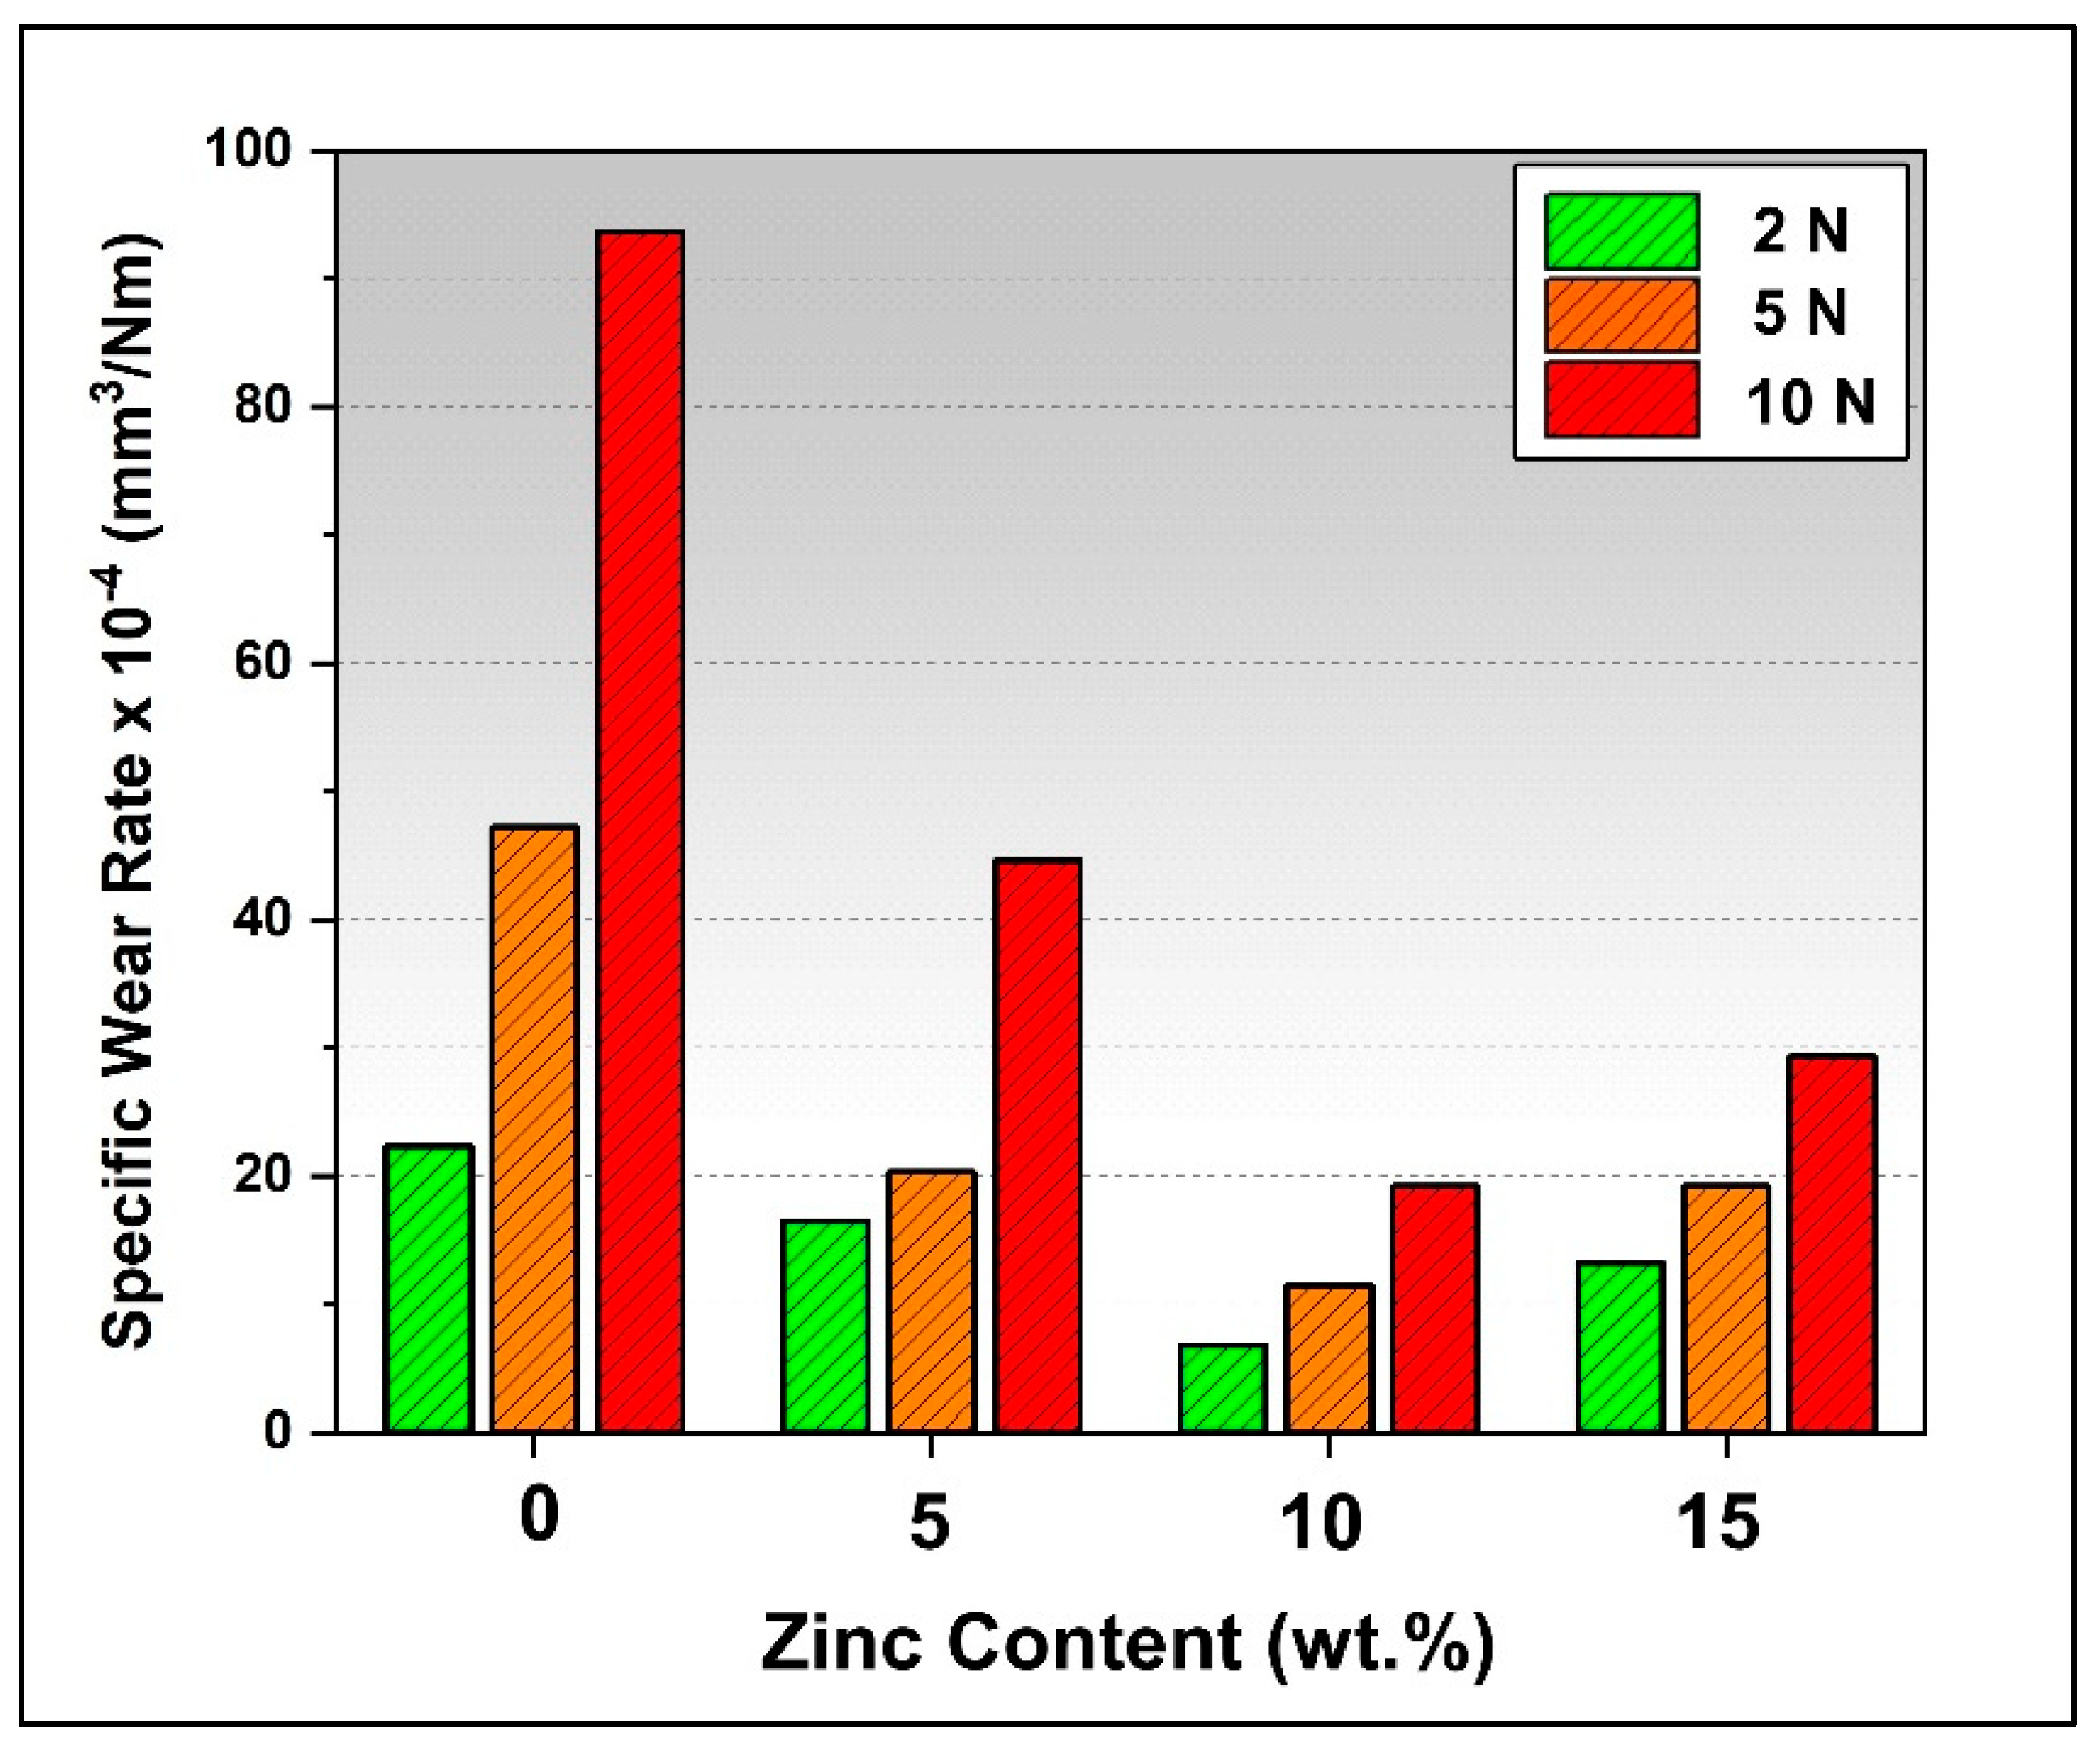
Figure 9 presents the specific wear rates measured under varying normal loads (2 N, 5 N, and 10 N) for specimens with different Zn contents. First, it should be emphasized that the specific wear rate increased with increasing wear load for all specimens. A higher normal load intensifies both plastic deformation in the contact zone and friction-induced local temperature rise, which can disrupt the continuity of the graphene-assisted protective film and aggravate subsurface damage in the Cu–Zn matrix [5]. Consequently, the tendency for material removal and detachment increases, leading to higher specific wear rates across all Zn levels. For the Z0 specimen (Cu–Graphene), the specific wear rates were 22.3 × 10⁻⁴ mm3/N·m at 2 N, 47.24 × 10⁻⁴ mm3/N·m at 5 N, and 93.66 × 10⁻⁴ mm3/N·m at 10 N. A pronounced load-dependent increase is observed for Z0, which can be attributed to the relatively low hardness of the material and its limited ability to withstand the applied load as the load increases. For the Z5 specimen, the specific wear rates were 16.48 × 10⁻⁴ mm3/N·m, 20.33 × 10⁻⁴ mm3/N·m, and 44.6 × 10⁻⁴ mm3/N·m under 2 N, 5 N, and 10 N, respectively. Compared with Z0, a substantial reduction in wear rate is evident. This improvement can primarily be associated with (i) the contribution of Zn to the mechanical strength of the Cu-based matrix and (ii) Zn’s ability to form a relatively robust ZnO film during sliding, which may impart a lubricious effect and promote more stable interfacial shear [46]. The fact that the wear rates of Z5 remain low and very close to each other in the 2–5 N range indicates that the graphene-assisted tribofilm/transfer layer remains stable within this load interval and that the Zn-containing matrix provides sufficient load-bearing capacity. However, at 10 N, the load likely exceeds a critical threshold, promoting cracking and fragmentation of the tribofilm as well as increased subsurface delamination and third-body abrasive action; therefore, the wear rate nearly doubles compared with that at 5 N. When the reinforcement level is increased to 10% Zn (Z10), the wear rates decrease markedly, yielding 6.8 × 10⁻⁴ mm3/N·m at 2 N, 11.46 × 10⁻⁴ mm3/N·m at 5 N, and 19.24 × 10⁻⁴ mm3/N·m at 10 N. Notably, the load-induced increase is relatively moderate. This behavior can be explained by the strengthening of the Cu matrix through Zn-induced solid-solution and/or precipitation effects, together with enhanced stability of the graphene-assisted transfer layer. As a result, the growth of the real contact area and the propensity for subsurface delamination are suppressed [47]. Moreover, the higher densification and lower porosity after SPS can homogenize load transfer and reduce local stress concentrations, thereby limiting microcrack initiation and particle pull-out, which weakens the load sensitivity of the wear rate [48]. In contrast, when the Zn content is increased to 15% (Z15), an increase in wear rate is observed. One key reason is the reduction in hardness due to increased porosity, which adversely affects the load-bearing capability of the material. For the Z15 specimen, the specific wear rates were 13.24 × 10⁻⁴ mm3/N·m at 2 N, 19.22 × 10⁻⁴ mm3/N·m at 5 N, and 29.36 × 10⁻⁴ mm3/N·m at 10 N.
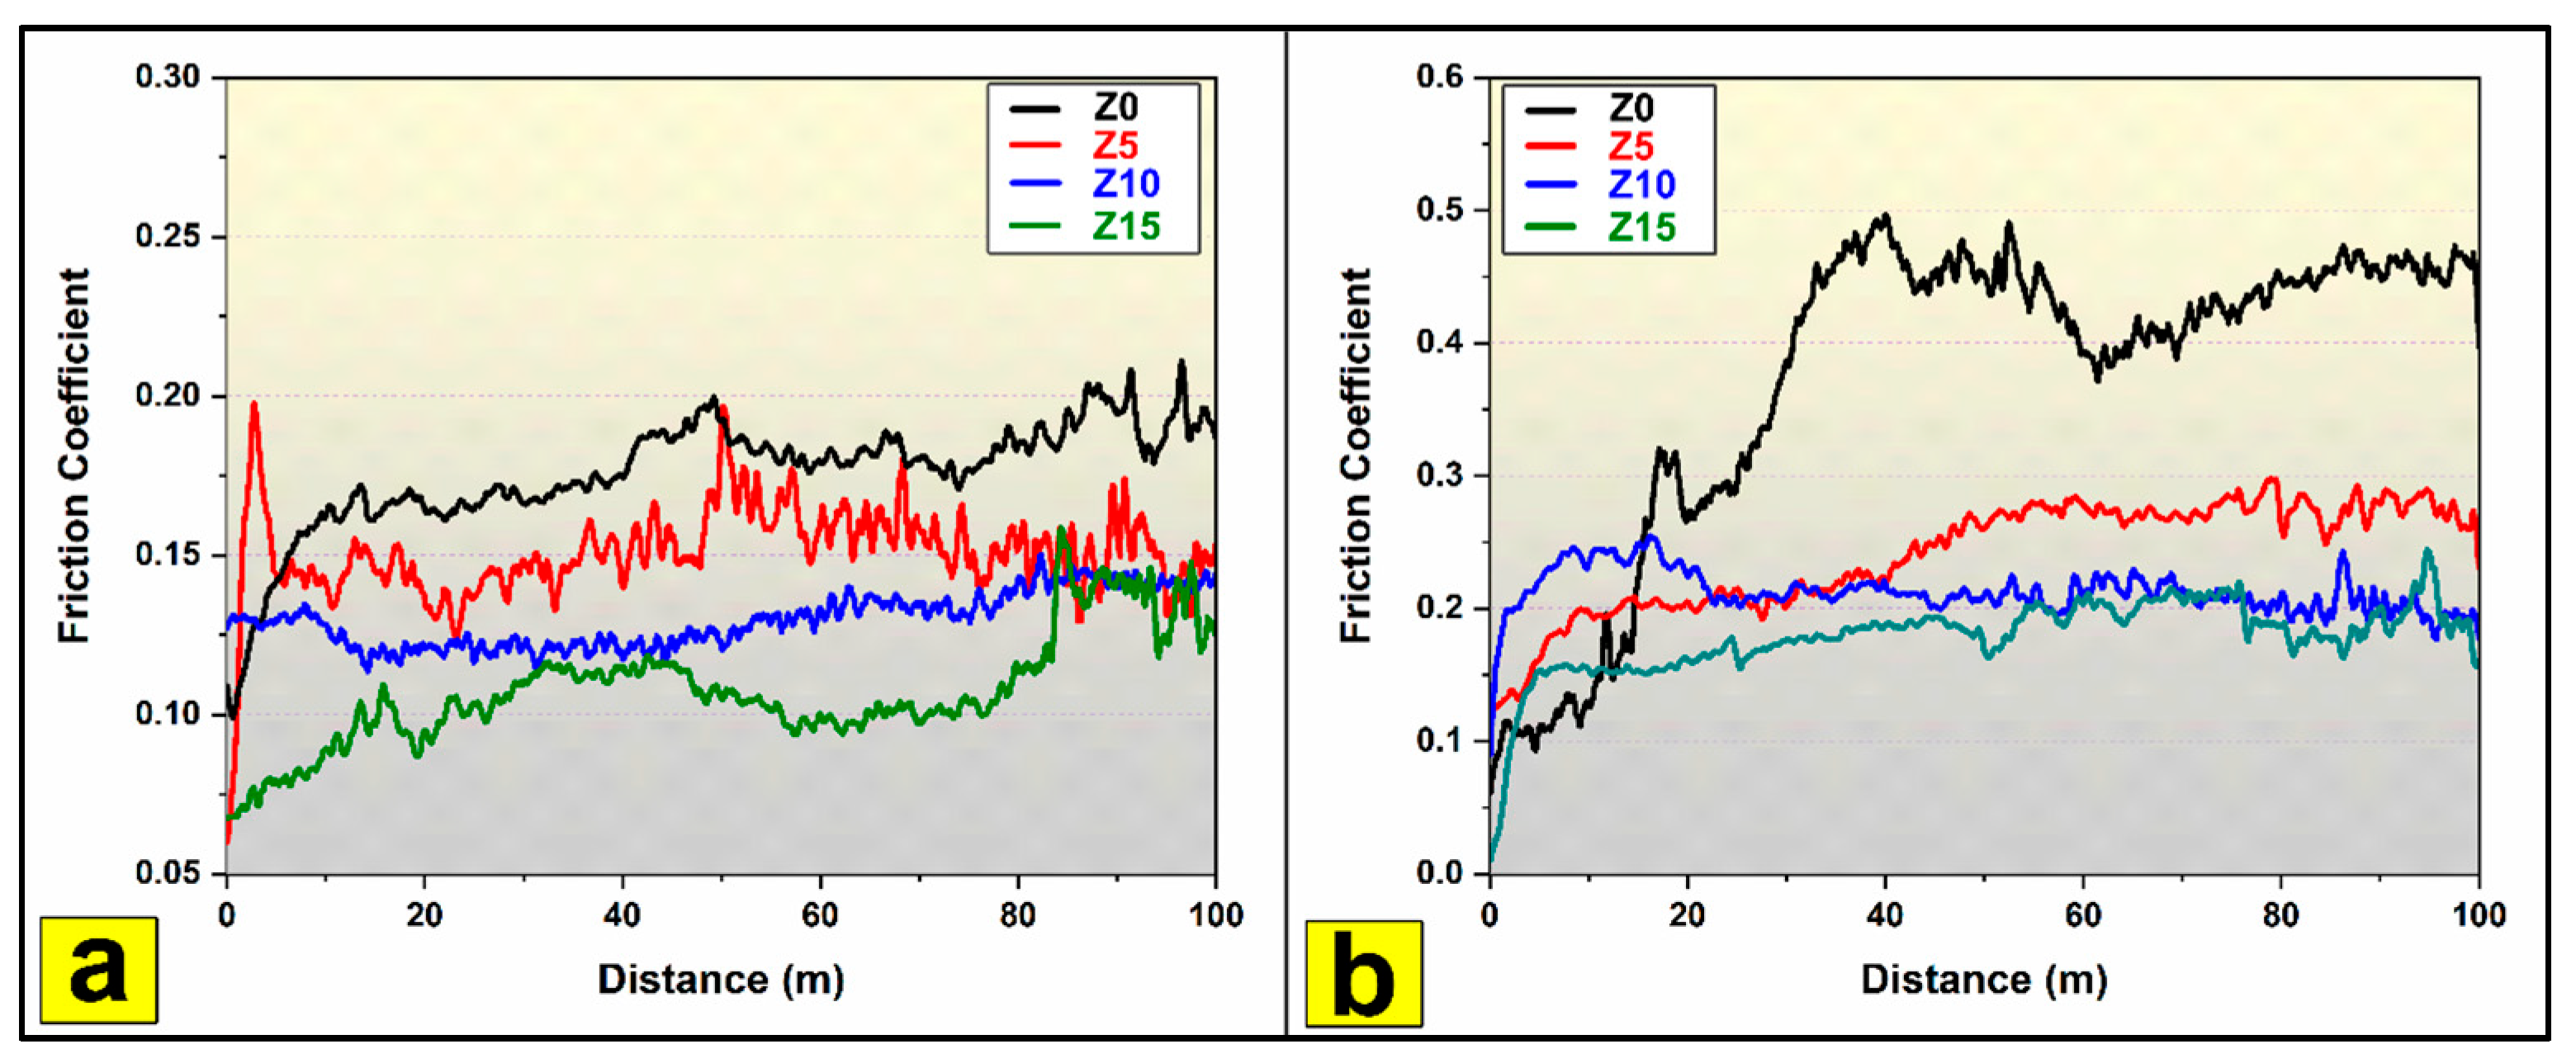
Figure 10 presents the coefficient of friction (COF)–distance curves of Cu–graphene-based composites containing different Zn contents, measured under normal loads of 2 N (Figure 10a) and 10 N (Figure 10b). At both load levels, the COF profiles delineate an initial running-in regime—characterized by surface smoothing, asperity fracture, and the establishment of a transfer layer/tribofilm—followed by a steady-state regime in which the tribological contact becomes comparatively stable. The addition of Zn markedly decreases the COF, particularly under the higher load, and reduces frictional fluctuations. This observation is in direct agreement with the specific wear-rate results shown in Figure 9, since a lower and more stable COF generally reflects a more stable tribofilm/transfer layer and reduced subsurface damage, thereby leading to diminished material removal. Under 2 N (Figure 10a), the Zn-free Z0 specimen exhibits the highest COF values, with a gradual increase in COF as the sliding distance increases. This behavior can be attributed to the absence of a ZnO-based protective/lubricious tribo-oxide film, causing the contact to be governed predominantly by metal–metal adhesion (adhesive junction growth) and plastic smearing of the Cu matrix. This interpretation is consistent with the relatively high specific wear rate of Z0 at 2 N (22.3 × 10⁻⁴ mm3/N·m), because a higher COF and an unstable tribofilm elevate interfacial shear stresses, thereby promoting subsurface crack initiation and micro-fracture events. In contrast, the Z5 specimen shows a pronounced reduction in COF and oscillates within a narrower band. This improvement can be associated with the formation of a ZnO-containing tribofilm during sliding, which stabilizes the shear plane and enhances the continuity of the graphene-assisted transfer layer. Accordingly, the wear rate of Z5 at 2 N decreases significantly compared with Z0 (16.48 × 10⁻⁴ mm3/N·m). The Z10 specimen exhibits one of the most stable friction responses at low load, maintaining a comparatively low COF with limited variation. This behavior can be rationalized by Zn-induced strengthening of the matrix (solid-solution and/or precipitation contributions) together with the development of a more robust graphene+ZnO-assisted tribofilm/transfer layer. Notably, this interpretation strongly correlates with the minimum specific wear rate recorded for Z10 (6.8 × 10⁻⁴ mm3/N·m). For Z15, although the initial COF appears relatively low, an increasing trend with distance and occasional fluctuations are observed. This response is likely related to the increased porosity/heterogeneity that may accompany higher Zn contents, which can locally destabilize the tribofilm and progressively alter the contact conditions [49]. A similar tendency is reflected in the wear-rate data, where the wear rate of Z15 at 2 N increases again relative to Z10 (13.24 × 10⁻⁴ mm3/N·m). Under 10 N (Figure 10b), the effect of increased load is particularly pronounced for Z0: the COF rises rapidly and exhibits substantial fluctuations in the ~0.4–0.5 range. Such a profile is consistent with intensified plastic deformation of the Cu matrix, enlargement of the real contact area, and a transition toward an unstable sliding regime dominated by adhesive wear and stick–slip behavior. In addition, cracking and fragmentation of the tribofilm/transfer layer can generate wear debris, which enhances third-body effects and further amplifies COF oscillations [50]. These mechanisms are fully consistent with the very high wear rate of Z0 under 10 N (93.66 × 10⁻⁴ mm3/N·m). Although Z5 displays a considerably lower COF than Z0, suggesting that the ZnO-based film provides partial protection, the applied load at 10 N may exceed a critical threshold and impair tribofilm integrity. As a result, while the COF remains at a moderate level, the wear rate increases sharply relative to 5 N (44.6 × 10⁻⁴ mm3/N·m), indicating that not only friction but also film breakdown and subsurface delamination govern the material removal process. The Z10 and Z15 specimens maintain lower and more stable COF values under 10 N, which can be attributed to improved load-bearing capacity and enhanced tribofilm continuity promoted by Zn addition. Nevertheless, the superior wear resistance of Z10 compared with Z15 is noteworthy: the wear rate increases from 19.24 × 10⁻⁴ mm3/N·m for Z10 to 29.36 × 10⁻⁴ mm3/N·m for Z15. This discrepancy indicates that, even at similar COF levels, increased porosity in Z15 can reduce effective hardness and interfacial cohesion, facilitating particle pull-out and subsurface delamination and thus increasing material removal. Therefore, the Zn content that yields optimal tribological performance is determined not solely by minimizing COF, but also by the combined influence of densification/porosity and tolerance to subsurface damage. The results demonstrate that Zn addition to the Cu–graphene system reduces friction and lowers wear rates, with the beneficial effect maximized at an optimum Zn level (≈10% in the present study). At higher Zn contents, the wear resistance may deteriorate despite low COF values due to the increasing contribution of microstructural defects, particularly porosity. This integrated assessment confirms that the outcomes of Figure 9 and Figure 10 are mutually consistent and that the tribological response is governed by the coupled effects of tribofilm stability, mechanical load-bearing capacity, and microstructural integrity [51,52].
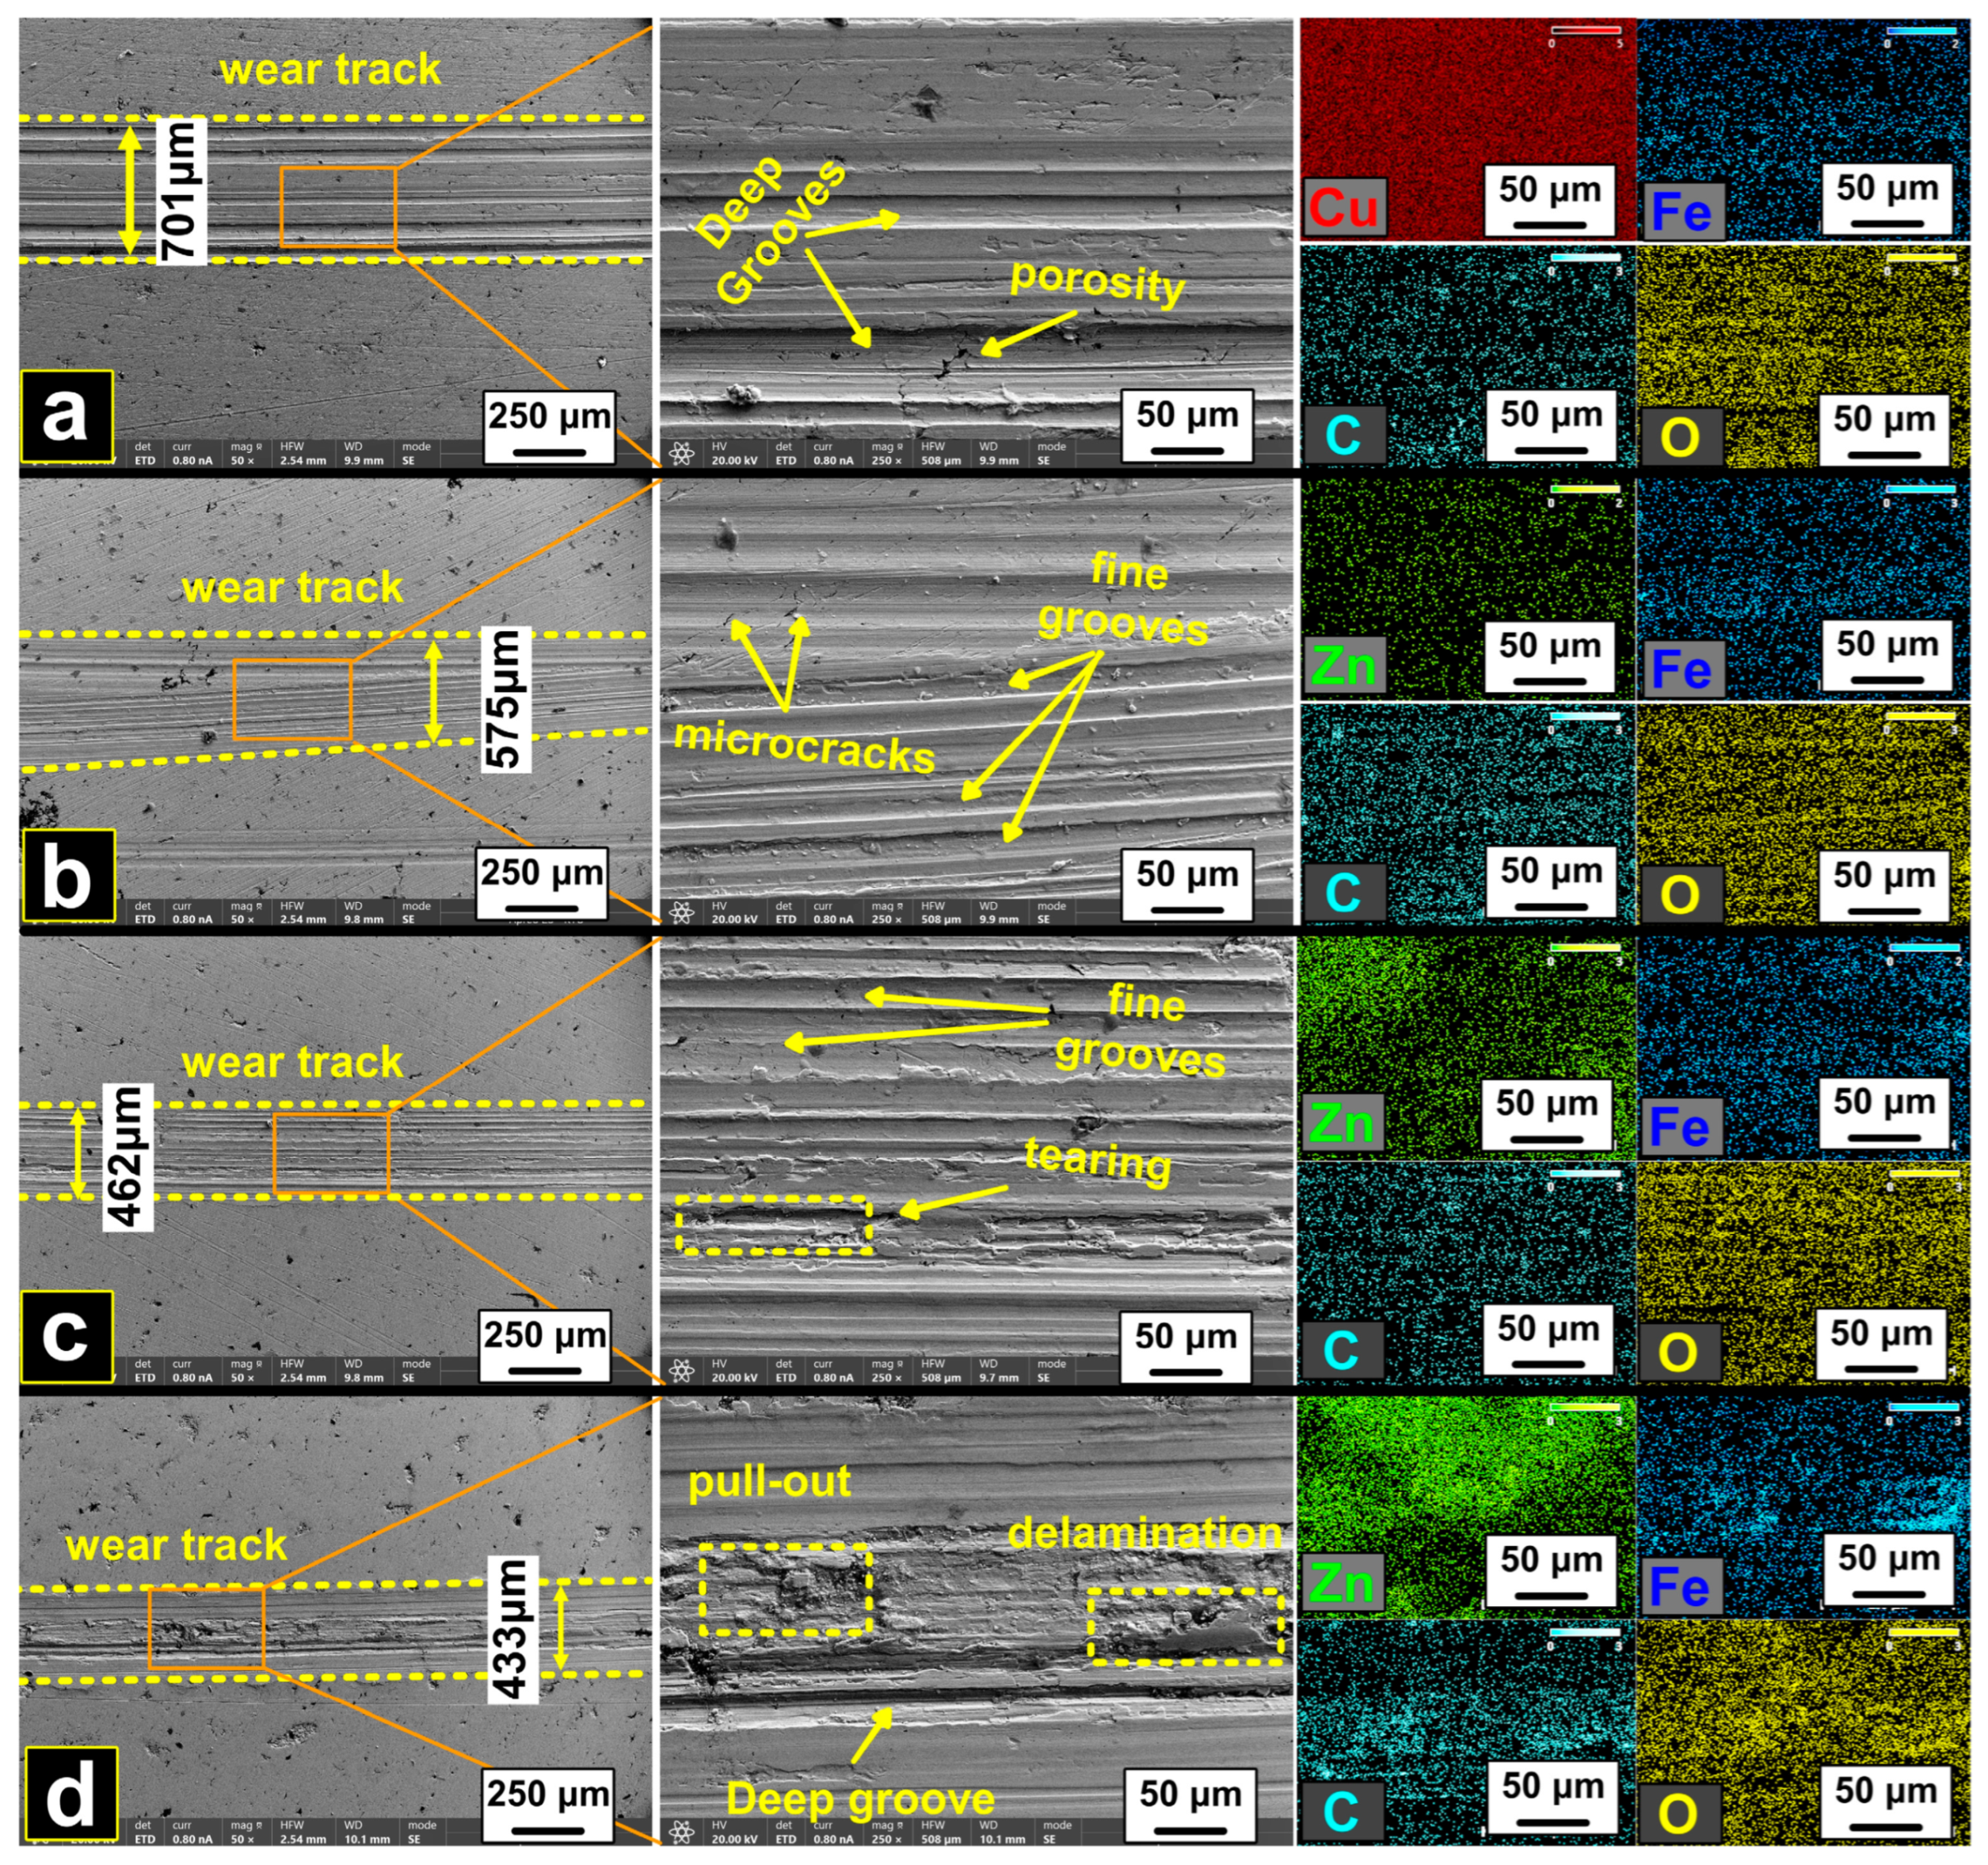
Figure 11 shows the worn surfaces obtained under a normal load of 2 N, clearly demonstrating how Zn addition modifies the tribological contact regime even under mild loading conditions, and how these observations are consistent with the COF and specific wear-rate results (Figure 9 and Figure 10). For each specimen, the low-magnification SEM images on the left depict the overall morphology and the measured wear-track width, while the middle column provides higher-magnification (zoom-in) views taken from the regions highlighted by the orange boxes. The EDS elemental maps (Zn, Fe, C, and O) presented in the right column were acquired from the same areas as the corresponding zoom-in images; therefore, the tribofilm/transfer-layer characteristics and counterface-derived transfer processes can be evaluated directly from these localized regions. The Z0 specimen exhibits the widest wear track (~701 µm). This indicates that, even at a relatively low load of 2 N, the real contact area expands substantially and the surface experiences elevated interfacial shear stresses during sliding. The zoomed-in image reveals pronounced, deep, line-shaped features (deep groove-like channels) together with local pores/voids. This morphology suggests that the contact evolves predominantly through significant plastic deformation and surface smearing (ploughing-type deformation), and that local weaknesses associated with porosity facilitate micro-fracture and material removal. As expected, no Zn signal is detected in the EDS maps. In contrast, the presence of distinct Fe and O signals within the wear track indicates Fe transfer from the counterface and concurrent tribo-oxidation processes. However, the limited continuity of this oxide/transfer layer may lead to an interface that repeatedly forms and breaks down during sliding. This interpretation is consistent with the previously reported high COF and the highest specific wear rate of Z0 at 2 N. For the Z5 specimen, the wear-track width decreases to ~575 µm. This reduction suggests that Zn addition renders the contact more controlled and mitigates subsurface damage under the same load. The zoom-in image shows finer line-shaped traces (fine grooves) and occasional microcracks. The finer surface marks are consistent with sliding at lower shear resistance (i.e., lower COF), whereas the microcracks imply that stress accumulation may occur near the surface without necessarily developing into extensive lamellar separation at 2 N. The EDS maps display co-localized Zn and O signals along the wear track, indicating the formation of a ZnO-containing tribo-oxide/tribofilm during sliding. Such a film can stabilize the shear plane and reduce the severity of metal–metal interaction, providing a microstructural basis for the lower COF and the reduced wear rate of Z5 relative to Z0 [53]. The Fe signal further suggests that counterface transfer is not completely eliminated; rather, the ZnO/transfer layer shifts the contact toward a less damaging regime. The Z10 specimen shows an even narrower and more uniform wear track (~462 µm), in accordance with its “optimum” tribological response in terms of both friction and wear. The zoom-in image is dominated by regular, fine line-shaped features, with only limited evidence of local tearing. This indicates the development of a more stable transfer layer/tribofilm and a steadier sliding condition. In the EDS maps, the more homogeneous Zn–O distribution implies improved continuity of a ZnO-based tribofilm compared with Z5 [30,52,54,55]. In addition, the pronounced C signal within the wear track supports the presence of a graphene-derived transfer layer at the interface, suggesting the formation of a composite tribofilm structure in which ZnO and graphene jointly contribute to interfacial stabilization. Although the Z15 specimen exhibits the smallest wear-track width (~433 µm), the zoom-in image reveals clear pull-out features (localized detachments), pronounced delamination regions, and locally deep line-shaped damage. This highlights a critical point: a narrower wear track does not necessarily translate into superior wear resistance. If the dominant damage mode proceeds through localized lamellar separation and detachment, the volumetric material loss can still increase even when the apparent track width is reduced. Consistently, the wear rate of Z15 increases relative to Z10, which can be attributed to the higher Zn content promoting increased porosity/heterogeneity and reduced local cohesion, thereby facilitating delamination under load [5,51].
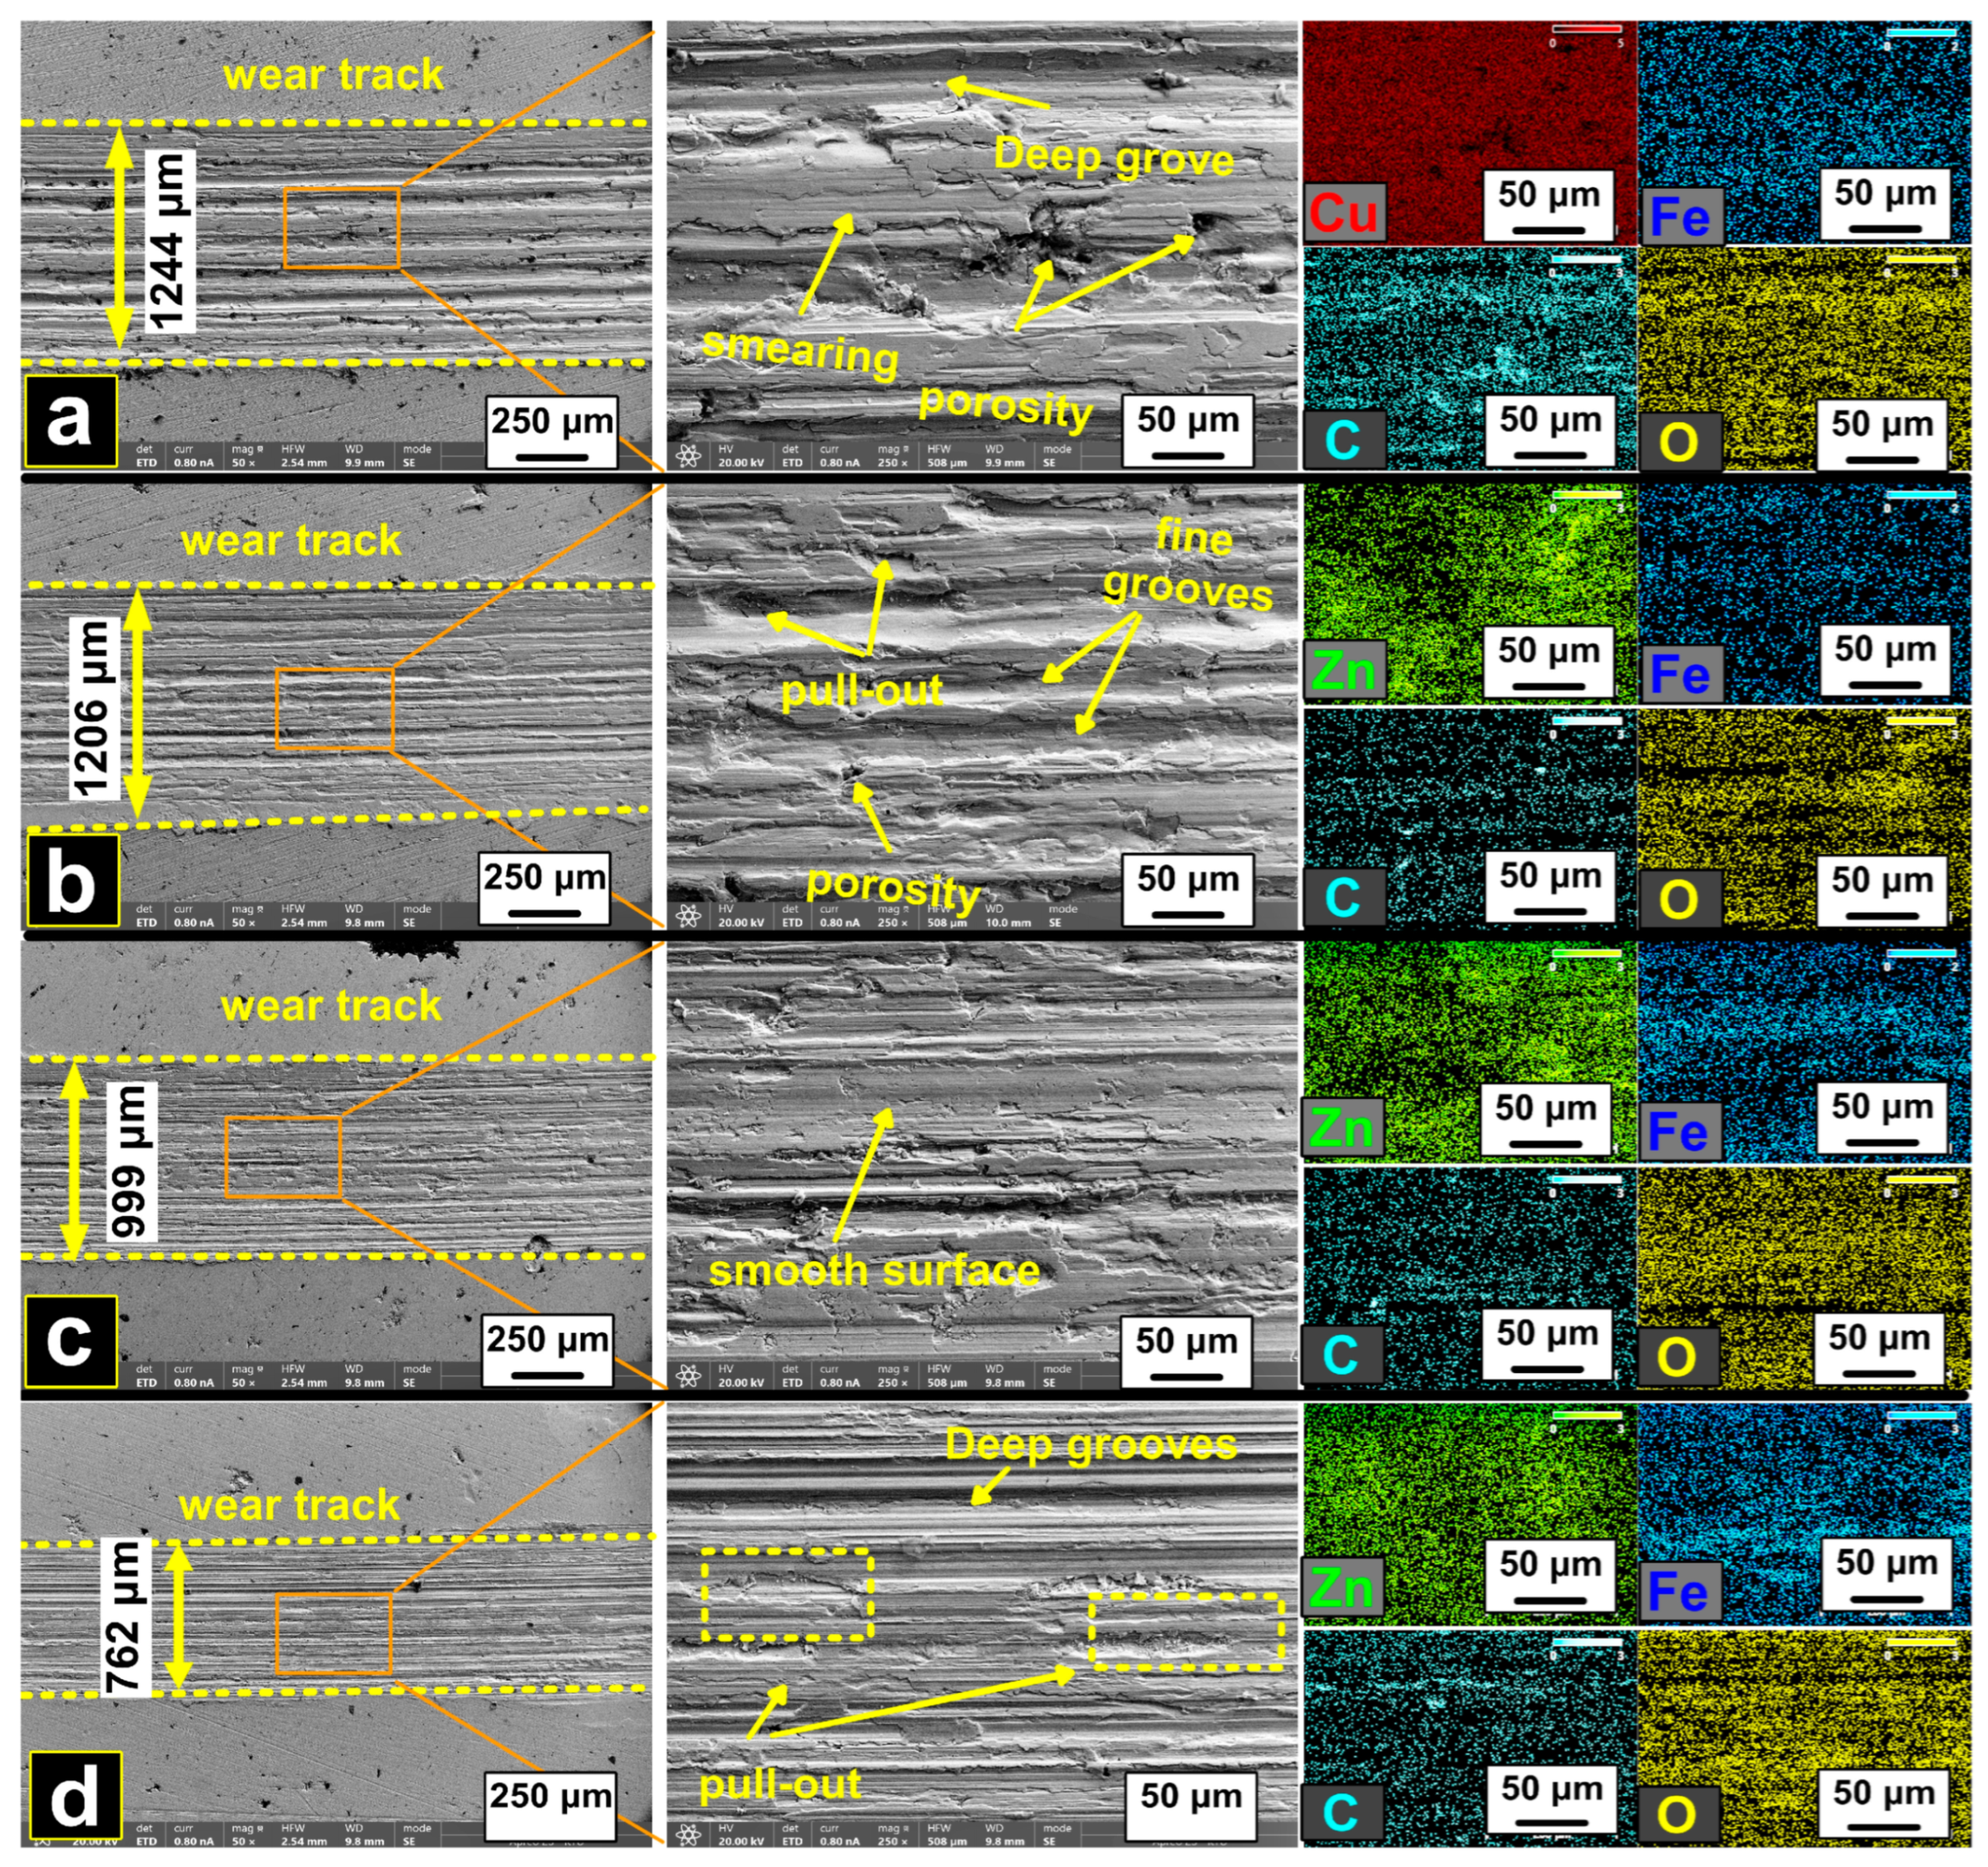
Figure 12 shows the worn surfaces after testing under a higher normal load of 10 N and highlights the load-driven amplification of the mechanisms inferred at 2 N. In general, increasing the load substantially enlarges the wear tracks and intensifies near-surface deformation for Z0–Z10 (track widths rising to ~1244, ~1206, and ~999 µm, respectively), reflecting increased real contact area and higher interfacial shear stresses. This evolution is consistent with the higher COF levels and the increased wear rates at 10 N relative to 2 N. Notably, Z15 remains the narrowest (~762 µm), yet the surface shows pronounced localized damage, underscoring that track width alone is not sufficient to rank wear resistance under high-load conditions. For Z0 (Figure 12a), the worn surface is dominated by extensive plastic smearing and deep line-shaped damage with visible porosity, indicating severe deformation and repeated disruption of any protective interfacial layer as the load increases. Relative to 2 N, the transition is marked by both a strong increase in track width and more severe surface damage, consistent with its high friction response and the highest wear rate at 10 N. Z5 (Figure 12b) remains close to Z0 in track width, but the magnified morphology more clearly exhibits pull-out features and porosity-related local defects than at 2 N. The increased prominence of pull-out at 10 N suggests easier subsurface damage accumulation and localized decohesion under higher stress, which rationalizes the strong load sensitivity of Z5 in wear despite the presence of ZnO-related tribofilm signatures. In contrast, Z10 (Figure 12c) continues to better confine damage under high load, exhibiting a more uniform and relatively smoother worn surface compared with Z0 and Z5. The more homogeneous Zn–O distribution within the track, together with the persistent C signal, indicates that the ZnO-containing tribofilm and graphene-derived transfer remain operative at 10 N, supporting the comparatively lower wear rate and improved stability for Z10. For Z15 (Figure 12d), although the wear track is narrow, the magnified view reveals deep grooves and extensive pull-out regions. Compared with 2 N, the delamination/pull-out tendency becomes more critical at 10 N, where higher stresses can activate subsurface cracking and interfacial decohesion more readily. In such regions, tribofilm continuity is expected to be disrupted, enabling repeated local failure and debris-assisted damage, which explains why excessive Zn does not translate into proportional wear improvement under high load [56]. The combined SEM/EDS evidence across Figure 11 and Figure 12 indicates that Zn addition promotes interfacial stabilization through ZnO-related tribofilm formation and significantly moderates deformation and damage. However, the most robust performance is achieved at an intermediate Zn content (Z10), where film continuity and load-bearing capacity are simultaneously optimized. At higher Zn content (Z15), microstructural vulnerabilities associated with porosity/heterogeneity and reduced local cohesion facilitate localized detachment mechanisms, which can dominate material removal under elevated load and weaken the expected benefit of Zn addition.

4. Conclusions

In this study, copper matrix hybrid composites containing a constant graphene content (1 wt.%) and varying zinc additions (0–15 wt.%) were successfully fabricated via mechanical alloying and spark plasma sintering. The results demonstrate that:
(1)
Zn addition improved densification and hardness up to 10 wt.%, with the Z10 sample exhibiting the highest relative density and maximum hardness, indicating an optimum reinforcement level.
(2)
The corrosion resistance was maximized at 10 wt.% Zn, as evidenced by the most noble corrosion potential and the lowest corrosion current density, mainly due to reduced porosity and improved microstructural homogeneity.
(3)
Tribological performance was significantly enhanced by the combined action of graphene and Zn, and the Z10 sample showed the lowest wear rate and the most stable friction behavior under different applied loads.
(4)
Although electrical conductivity gradually decreased with increasing Zn content due to electron scattering, all composites retained acceptable conductivity, and the Z10 composition provided the best overall balance of mechanical, corrosion, tribological, and electrical performance.

Author Contributions

Conceptualization, S.Ö., Y.A., M.Ç., A.H.K. and E.Ç.; methodology, S.Ö., Y.A., A.H.K., M.Ç. and E.Ç.; investigation, S.Ö., Y.A., A.H.K., M.Ç. and E.Ç.; writing—original draft preparation, S.Ö., Y.A., A.H.K., M.Ç. and E.Ç.; supervision, S.Ö. All authors have read and agreed to the published version of the manuscript.

Funding

This research received no external funding.

Data Availability Statement

The original contributions presented in this study are included in the article. Further inquiries can be directed to the corresponding author.

Conflicts of Interest

The authors declare no conflicts of interest.

References

  1. Sharma, S.K.; Saxena, K.K.; Salem, K.H.; Mohammed, K.A.; Singh, R.; Prakash, C. Effects of Various Fabrication Techniques on the Mechanical Characteristics of Metal Matrix Composites: A Review. Adv. Mater. Process. Technol. 2024, 10, 277–294. [Google Scholar] [CrossRef]
  2. Simões, S. Advances in the Design and Development of Lightweight Metal Matrix Composites: Processing, Properties, and Applications. Metals 2025, 15, 1281. [Google Scholar] [CrossRef]
  3. Patel, S.K.; Shi, L. Recent Advances in Ceramic-Reinforced Aluminum Metal Matrix Composites: A Review. Alloys 2025, 4, 18. [Google Scholar] [CrossRef]
  4. Tunç, S.A.; Çanakçı, A.; Karabacak, A.H.; Çelebi, M.; Türkmen, M. Effect of Different PCA Types on Morphology, Physical, Thermal and Mechanical Properties of AA2024-B4C Composites. Powder Technol. 2024, 434, 119373. [Google Scholar] [CrossRef]
  5. Çanakçı, A.; Çelebi, M. Determination of Nano-Graphene Content for Improved Mechanical and Tribological Performance of Zn-Based Alloy Matrix Hybrid Nanocomposites. J. Alloys Compd. 2024, 1001, 175152. [Google Scholar] [CrossRef]
  6. Rezaei, M.R.; Albooyeh, A.; Shayestefar, M.; Shiraghaei, H. Microstructural and Mechanical Properties of a Novel Al-Based Hybrid Composite Reinforced with Metallic Glass and Ceramic Particles. Mater. Sci. Eng. A 2020, 786, 139440. [Google Scholar] [CrossRef]
  7. Tjong, S.C. Processing and Deformation Characteristics of Metals Reinforced with Ceramic Nanoparticles. In Nanocrystalline Materials; Elsevier: Amsterdam, The Netherlands, 2014; pp. 269–304. [Google Scholar] [CrossRef]
  8. Kang, Z.; Shi, Z.; Lei, Y.; Xie, Q.; Zhang, J. Effect of the Surface Morphology on the Bonding Performance of Metal/Composite Hybrid Structures. Int. J. Adhes. Adhes. 2021, 111, 102944. [Google Scholar] [CrossRef]
  9. Wang, A.; Yang, Y.; Zhang, P.; Liu, X.; Xu, G. Effect of Fiber Volume Fraction on Hybrid Effects of Tensile Properties of Unidirectional Aramid/Carbon Fiber Hybrid Composites. Polym. Compos. 2024, 45, 2050–2062. [Google Scholar] [CrossRef]
  10. Wu, C.; Ma, K.; Wu, J.; Fang, P.; Luo, G.; Chen, F.; Shen, Q.; Zhang, L.; Schoenung, J.M.; Lavernia, E.J. Influence of Particle Size and Spatial Distribution of B4C Reinforcement on the Microstructure and Mechanical Behavior of Precipitation Strengthened Al Alloy Matrix Composites. Mater. Sci. Eng. A 2016, 675, 421–430. [Google Scholar] [CrossRef]
  11. Karabacak, A.H.; Canakci, A.; Özkaya, S.; Tunç, S.A.; Çevik, Z.A.; Yalçın, E.D. The Effects of Different Types and Ratios of Reinforcement, and Machining Processes on the Machinability of Al2024 Alloy Nanocomposites. J. Compos. Mater. 2023, 57, 2811–2827. [Google Scholar] [CrossRef]
  12. Kara, G.I.; Sezek, S.; Aksakal, B. Enhanced Mechanical, Tribological and Corrosion Properties of Graphite and Carbon Nanotube-Reinforced Copper-Based Hybrid Composites. J. Compos. Mater. 2024, 58, 2915–2935. [Google Scholar] [CrossRef]
  13. Cantürk, S.B.; Kováčik, J. Review of Recent Development in Copper/Carbon Composites Prepared by Infiltration Technique. Energies 2022, 15, 5227. [Google Scholar] [CrossRef]
  14. Fouda, A.; Ahmadian, H.; Nureldeen, W.; Ghandourah, E.; Najjar, I.M.R.; Elattar, H.F.; Fathy, A.; Elmahdy, M. A Critical Review of Copper-Graphene Nanocomposites: From Processing To Tribological Applications. Int. J. Precis. Eng. Manuf. 2026, 27, 1301–1333. [Google Scholar] [CrossRef]
  15. Çelebi, M.; Karabacak, A.H.; Özkaya, S.; Çelik, E.; Sekban, D.M.; Çanakçı, A.; Yanar, H. Effect of B4C Amount on Microstructural and Mechanical Properties of Cu/h-BN/B4C Metal Matrix Composites Fabricated via Spark Plasma Sintering. Metals 2025, 15, 1283. [Google Scholar] [CrossRef]
  16. Zhang, H.; Yang, D.; Song, X.; Wu, Z.; Guo, C.; Qin, K.; Wang, D.; Wang, P.; Nagaumi, H. Designing Wear-Resistant High-Zinc Aluminium Alloys with High Strength and Ductility. Commun. Mater. 2025, 6, 62. [Google Scholar] [CrossRef]
  17. Pola, A.; Tocci, M.; Goodwin, F.E. Review of Microstructures and Properties of Zinc Alloys. Metals 2020, 10, 253. [Google Scholar] [CrossRef]
  18. Wei, P.; Wang, X.; Jing, G.; Li, F.; Bai, P.; Tian, Y. Research Progress on Current-Carrying Friction with High Stability and Excellent Tribological Behavior. Lubricants 2024, 12, 349. [Google Scholar] [CrossRef]
  19. Wakchaure, M.B.; Menezes, P.L. Advances in the Tribological Performance of Graphene Oxide and Its Composites. Materials 2025, 18, 3587. [Google Scholar] [CrossRef]
  20. Li, X.Y.; Zhang, Z.H.; Cheng, X.W.; Huo, G.J.; Zhang, S.Z.; Song, Q. The Development and Application of Spark Plasma Sintering Technique in Advanced Metal Structure Materials: A Review. Powder Metall. Met. Ceram. 2021, 60, 410–438. [Google Scholar] [CrossRef]
  21. Tokita, M. Progress of Spark Plasma Sintering (SPS) Method, Systems, Ceramics Applications and Industrialization. Ceramics 2021, 4, 160–198. [Google Scholar] [CrossRef]
  22. Chaskis, S.; Maritsa, S.; Stavroulakis, P.; Papadopoulou, S.; Goodall, R.; Papaefthymiou, S. Compositional Design and Thermal Processing of a Novel Lead-Free Cu–Zn–Al–Sn Medium Entropy Brass Alloy. Metals 2024, 14, 620. [Google Scholar] [CrossRef]
  23. Shahriyari, F.; Shaeri, M.H.; Dashti, A.; Zarei, Z.; Noghani, M.T.; Cho, J.H.; Djavanroodi, F. Evolution of Mechanical Properties, Microstructure and Texture and of Various Brass Alloys Processed by Multi-Directional Forging. Mater. Sci. Eng. A 2022, 831, 142149. [Google Scholar] [CrossRef]
  24. Jasper, S.; Subash, R.; Muthuneelakandan, K.; Vijayakumar, D.; Jhansi Ida, S. The Mechanical Properties of Brass Alloys: A Review. Eng. Proc. 2025, 93, 11. [Google Scholar]
  25. Hidalgo-Manrique, P.; Lei, X.; Xu, R.; Zhou, M.; Kinloch, I.A.; Young, R.J. Copper/Graphene Composites: A Review. J. Mater. Sci. 2019, 54, 12236–12289. [Google Scholar] [CrossRef]
  26. Xing, C.; Zhang, T.; Wang, M.; Shi, Z.; Wu, Y.; Sheng, J.; Wang, L.; Fei, W. In-Situ Synthesis Nitrogen-Doped Graphene/Cu Composites with Enhanced Mechanical and Electrical Properties. Compos. Part A Appl. Sci. Manuf. 2025, 198, 109137. [Google Scholar] [CrossRef]
  27. ASTM G133-22; Test Method for Linearly Reciprocating Ball-on-Flat Sliding Wear. ASTM International: West Conshohocken, PA, USA, 2022. [CrossRef]
  28. Mardiansyah, D.; Badloe, T.; Triyana, K.; Mehmood, M.Q.; Raeis-Hosseini, N.; Lee, Y.; Sabarman, H.; Kim, K.; Rho, J. Effect of Temperature on the Oxidation of Cu Nanowires and Development of an Easy to Produce, Oxidation-Resistant Transparent Conducting Electrode Using a PEDOT:PSS Coating. Sci. Rep. 2018, 8, 10639. [Google Scholar] [CrossRef]
  29. Basnet, P.; Samanta, D.; Inakhunbi Chanu, T.; Mukherjee, J.; Chatterjee, S. Assessment of Synthesis Approaches for Tuning the Photocatalytic Property of ZnO Nanoparticles. SN Appl. Sci. 2019, 1, 633. [Google Scholar] [CrossRef]
  30. Özdemir, R.; Karahan, İ.H.; Karabulut, O. A Study on the Electrodeposited Cu-Zn Alloy Thin Films. Metall. Mater. Trans. A 2016, 47, 5609–5617. [Google Scholar] [CrossRef]
  31. Song, H.; Mai, J.; Zhang, Z.; Gu, A.; Mai, Y.; Chang, Y. A High Strength and High Electrical Conductivity Copper Based Composite Enhanced by Graphene and Al2O3 Nanoparticles. Mater. Sci. Eng. A 2024, 899, 146432. [Google Scholar] [CrossRef]
  32. Zhang, X.; Lei, Q.; Li, X.; Li, Q.; Meng, X. Microstructure and Properties of High-Strength and High-Conductivity Cu-3Cr/Graphene Composites. Mater. Today Commun. 2024, 40, 110031. [Google Scholar] [CrossRef]
  33. Geng, Y.; Zhang, X.; Zheng, Y.; Zhao, L.; Li, Z.; Li, X.; Qi, R.; Wang, Z.; Sha, G.; Zhang, D.; et al. High Strength and Plasticity in Disordered Multilayer Graphene Reinforced Copper Composites. Nat. Commun. 2025, 16, 6804. [Google Scholar] [CrossRef] [PubMed]
  34. Mutlu, A. Investigation of Mechanical Properties of Copper-Graphene Composites in Terms of Production Methods and Additive Ratios: A Review. Sigma J. Eng. Nat. Sci. 2024, 42, 600–613. [Google Scholar] [CrossRef]
  35. Zhang, X.; Liu, Y.; Zhang, Y.; Zhou, M.; Geng, Y.; Song, X.; Xiong, D.B. Deformation Behavior and Microstructure Evolution of Graphene/Copper Laminated Composites. Mater. Sci. Eng. A 2024, 911, 146936. [Google Scholar] [CrossRef]
  36. Dudina, D.V.; Bokhonov, B.B.; Olevsky, E.A. Fabrication of Porous Materials by Spark Plasma Sintering: A Review. Materials 2019, 12, 541. [Google Scholar] [CrossRef]
  37. Demirtas, M.; Yanar, H.; Purcek, G. Optimization of RT Superplasticity of UFG Zn-22Al Alloy by Applying ECAP at Different Temperatures and Phase Regions. IOP Conf. Ser. Mater. Sci. Eng. 2017, 194, 012033. [Google Scholar] [CrossRef]
  38. Demirtas, M.; Atli, K.C.; Yanar, H.; Purcek, G. Effect of Grain Refinement and Phase Composition on Room Temperature Superplasticity and Damping Capacity of Dual-Phase Zn–Al Alloys. J. Mater. Res. 2018, 33, 1032–1045. [Google Scholar] [CrossRef]
  39. Li, Z.; Hu, B.; Yao, F.; Jiang, Z.; Zhang, J.; Zhang, Q.; Han, J.; Zhou, L.; Sun, F.; Zeng, X.; et al. Anomalous Increase in Thermal Conductivity of Mg Solid Solutions by Co-Doping with Two Solute Elements. Acta Mater. 2025, 285, 120708. [Google Scholar] [CrossRef]
  40. Monchoux, J.-P.; Couret, A.; Durand, L.; Voisin, T.; Trzaska, Z.; Thomas, M. Elaboration of Metallic Materials by SPS: Processing, Microstructures, Properties, and Shaping. Metals 2021, 11, 322. [Google Scholar] [CrossRef]
  41. Janotti, A.; Van De Walle, C.G. Fundamentals of Zinc Oxide as a Semiconductor. Rep. Prog. Phys. 2009, 72, 126501. [Google Scholar] [CrossRef]
  42. Serres, A.; Fournier, L.; Frégonèse, M.; Auzoux, Q.; Leboulch, D. The Effect of Iodine Content and Specimen Orientation on Stress Corrosion Crack Growth Rate in Zircaloy-4. Corros. Sci. 2010, 52, 2001–2009. [Google Scholar] [CrossRef]
  43. Qiu, H.-J.; Peng, L.; Li, X.; Xu, H.T.; Wang, Y. Using Corrosion to Fabricate Various Nanoporous Metal Structures. Corros. Sci. 2015, 92, 16–31. [Google Scholar] [CrossRef]
  44. Çalıgülü, U.; Kaçmış, M.V.; Karabacak, A.H.; Çanakçı, A.; Özkaya, S. Investigation of Corrosion Resistance and Impact Performance Properties of Al2O3/SiC-Doped Aluminium-Based Composites. Bull. Mater. Sci. 2023, 46, 156. [Google Scholar] [CrossRef]
  45. Wang, D.; Bai, Z. Mechanical Property of Paper Honeycomb Structure under Dynamic Compression. Mater. Des. 2015, 77, 59–64. [Google Scholar] [CrossRef]
  46. He, G.; Lu, S.; Xu, W.; Ye, P.; Liu, G.; Wang, H.; Dai, T. Stable Superhydrophobic Zn/ZnO Surfaces Fabricated via Electrodeposition on Tin Substrate for Self-Cleaning Behavior and Switchable Wettability. J. Alloys Compd. 2018, 747, 772–782. [Google Scholar] [CrossRef]
  47. Yanar, H.; Ayar, H.H.; Demirtas, M.; Purcek, G. Effect of Resin Content on Tribological Behavior of Brake Pad Composite Material. Ind. Lubr. Tribol. 2018, 72, 195–202. [Google Scholar] [CrossRef]
  48. Ghafuri, F.; Ahmadian, M.; Emadi, R.; Zakeri, M. Effects of SPS Parameters on the Densification and Mechanical Properties of TiB2-SiC Composite. Ceram. Int. 2019, 45, 10550–10557. [Google Scholar] [CrossRef]
  49. Surya Rajan, B.; Hariharasakthisudhan, P.; Asrar Ahmed, K.; Tamilarasan, T.R.; Sathickbasha, K. Tailoring Tribological Performance of Brake Friction Composites Using Copper Coated and Annealed Steel Fiber Reinforcements. Polym. Compos. 2026; Online. [Google Scholar] [CrossRef]
  50. Alidokht, S.A.; Munagala, V.N.V.; Chromik, R.R. Role of Third Bodies in Friction and Wear of Cold-Sprayed Ti and Ti–TiC Composite Coatings. Tribol. Lett. 2017, 65, 114. [Google Scholar] [CrossRef]
  51. Huynh, K.K.; Pham, S.T.; Tieu, K.A.; Wan, S. Tribocatalysis Induced Carbon-Based Tribofilms—An Emerging Tribological Approach for Sustainable Lubrications. Lubricants 2023, 11, 327. [Google Scholar] [CrossRef]
  52. Hu, J.; Zhang, Y.; Yang, G.; Gao, C.; Song, N.; Zhang, S.; Zhang, P. In-Situ Formed Carbon Based Composite Tribo-Film with Ultra-High Load Bearing Capacity. Tribol. Int. 2020, 152, 106577. [Google Scholar] [CrossRef]
  53. Alazemi, A.A.; Dysart, A.D.; Shaffer, S.J.; Pol, V.G.; Stacke, L.E.; Sadeghi, F. Novel Tertiary Dry Solid Lubricant on Steel Surfaces Reduces Significant Friction and Wear under High Load Conditions. Carbon 2017, 123, 7–17. [Google Scholar] [CrossRef]
  54. Vyavhare, K.; Timmons, R.B.; Erdemir, A.; Edwards, B.L.; Aswath, P.B. Tribochemistry of Fluorinated ZnO Nanoparticles and ZDDP Lubricated Interface and Implications for Enhanced Anti-Wear Performance at Boundary Lubricated Contacts. Wear 2021, 474–475, 203717. [Google Scholar] [CrossRef]
  55. Wang, T.; He, L.; Zhang, J.; Liu, X.; Tong, L. Effects of ZnO Morphology on Tribological Behaviors of Polyarylene Ether Nitrile Composites. Compos. Struct. 2025, 354, 118810. [Google Scholar] [CrossRef]
  56. Yalçın, E.D.; Çanakçı, A.; Çuvalcı, H.; Varol, T.V.; Karabacak, A.H. The Effect of Boron Nitride (h-BN) and Silicon Carbide (SiC) on the Microstructure and Wear Behavior of ZA40/SiC/h-BN Hybrid Composites Processed by Hot Pressing. Kov. Mater.-Met. Mater. 2023, 61, 257–266. [Google Scholar] [CrossRef]
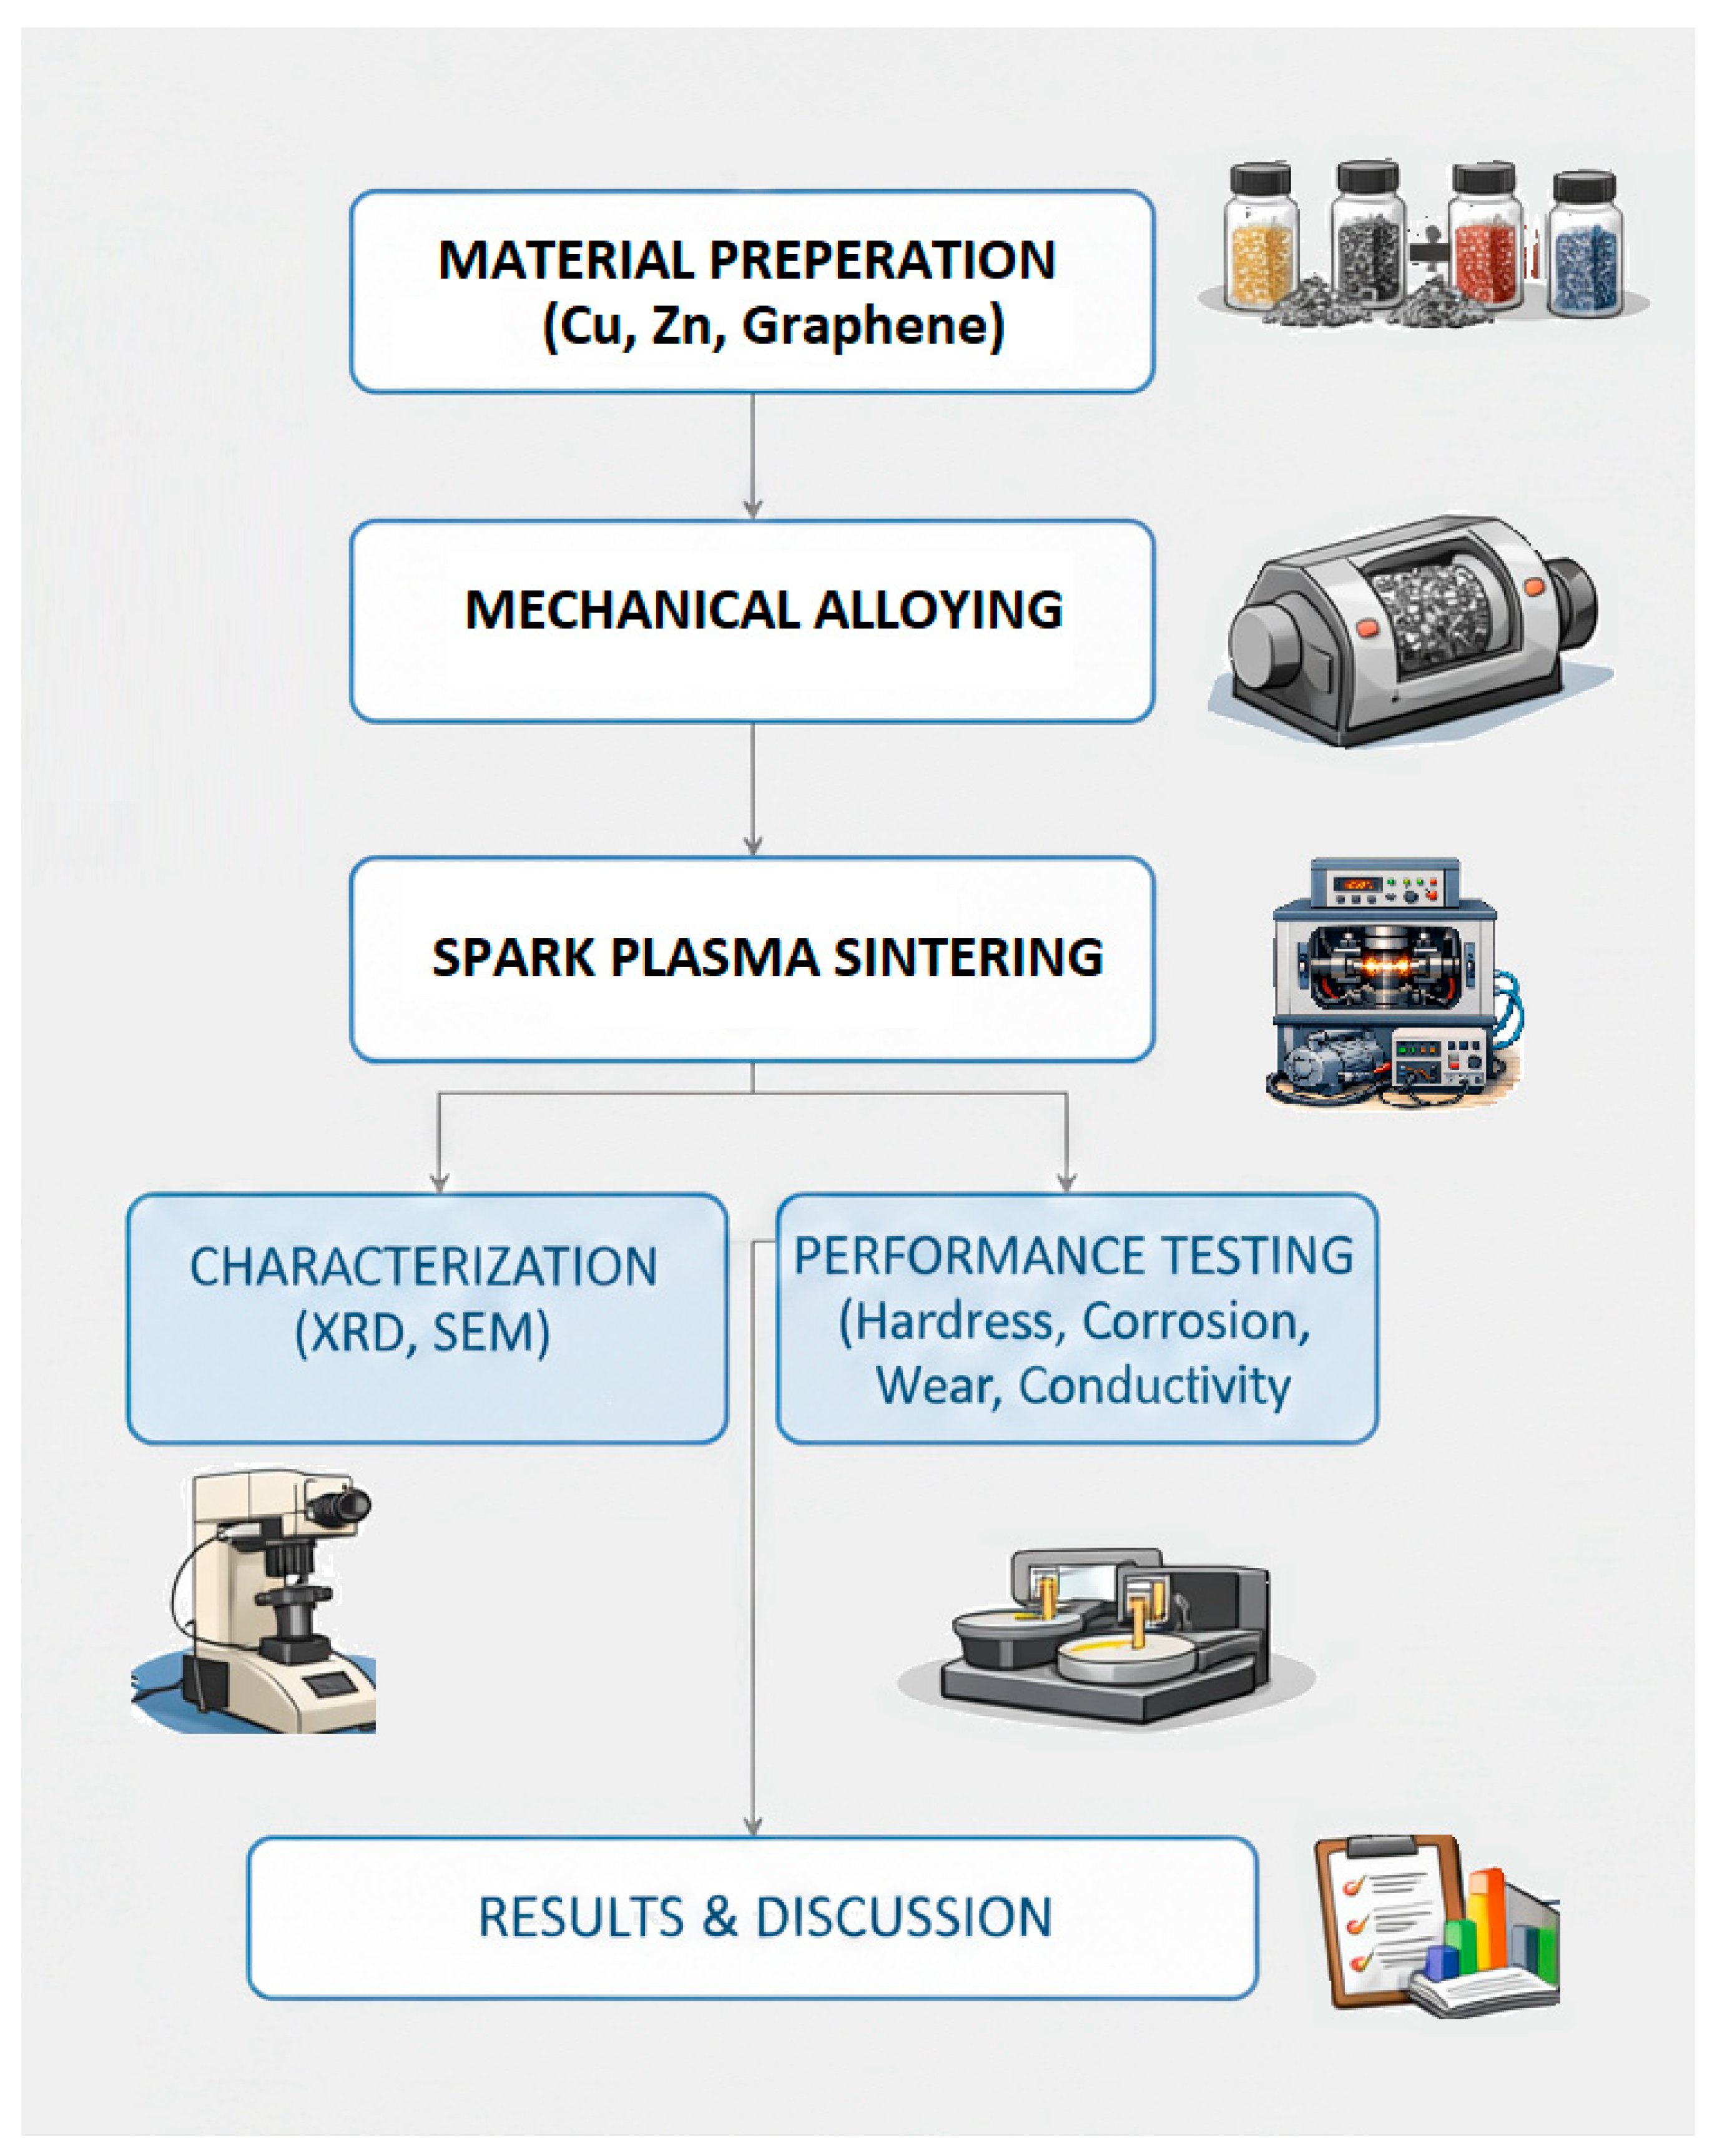
Figure 1. Flow chart of experimental study.
Crystals 16 00208 g001
Figure 2. Microstructure of samples (a) Z0, (b) Z5 (c) Z10 and (d) Z15.
Crystals 16 00208 g002
Figure 3. Elemental mapping and EDS analysis of Z15 sample.
Crystals 16 00208 g003
Figure 4. XRD patterns of Z0, Z5, Z10 and Z15 hybrid composites.
Crystals 16 00208 g004
Figure 5. Hardness values changing with Zinc content.
Crystals 16 00208 g005
Figure 6. Relative density values changing with zinc content.
Crystals 16 00208 g006
Figure 7. Electrical conductivity changing with Zinc content.
Crystals 16 00208 g007
Figure 8. Potentiodynamic polarization curves of the copper matrix composites produced in a 3.5 wt% NaCl solution.
Crystals 16 00208 g008
Figure 9. Specific wear rates of fabricated composite samples as a function of applied load and Zn reinforcement content.
Crystals 16 00208 g009
Figure 10. Distance–coefficient of friction (COF) plots of the produced samples under applied loads of (a) 2 N and (b) 10 N.
Crystals 16 00208 g010
Figure 11. Worn surface of fabricated samples under the wear load of 2 N: (a) Z0, (b) Z5, (c) Z10 and (d) Z15.
Crystals 16 00208 g011
Figure 12. Worn surface of fabricated samples under the wear load of 10 N: (a) Z0, (b) Z5, (c) Z10 and (d) Z15.
Crystals 16 00208 g012
Table 1. The sample codes and milling parameters.
Sample CodeMilling Time (h)Graphene
(wt.%)
Zinc
(wt.%)
Milling Speed (rpm)Ball-to-Powder Weight Ratio
Z021040010:1
Z521540010:1
Z10211040010:1
Z15211540010:1
Table 2. Electrochemical values of samples.
SamplesEcorr [mV]Icorr [µA·cm−2]Corrosion Rate [mpy]
Z0−26819.6017.42
Z5−23113.3011.02
Z10−2142.251.879
Z15−28016.3013.80
Disclaimer/Publisher’s Note: The statements, opinions and data contained in all publications are solely those of the individual author(s) and contributor(s) and not of MDPI and/or the editor(s). MDPI and/or the editor(s) disclaim responsibility for any injury to people or property resulting from any ideas, methods, instructions or products referred to in the content.