Article

The Influence of Short-Type Heaters and Their Positions on the Oxygen Concentration in the Growth of 300 mm Single Crystal Silicon by the Czochralski Method


1
GRINM National Engineering Research Center for Integrated Circuit Key Materials, Beijing 100088, China
2
General Research Institute for Nonferrous Metals, Beijing 100088, China
3
GRINM Semiconductor Materials Co., Ltd., Beijing 100088, China
4
Shandong GRINM RS Semiconductor Materials Co., Ltd., Dezhou 253084, China
*
Author to whom correspondence should be addressed.
Crystals 2026, 16(1), 45; https://doi.org/10.3390/cryst16010045
Submission received: 10 December 2025 / Revised: 2 January 2026 / Accepted: 5 January 2026 / Published: 8 January 2026
(This article belongs to the Section Crystal Engineering)

Abstract

The inevitable introduction of oxygen into Czochralski-method-grown single crystal silicon, facilitated by the use of quartz crucibles, can result in the failure of chips and devices. Both the size and position of the heater exert a significant influence on the oxygen concentration within the Czochralski-method-grown silicon. In this study, a novel short-type heater was designed and evaluated for its effect on melt temperature and oxygen diffusion during crystal growth. The silicon melt temperatures and oxygen diffusion coefficients in an MCZ furnace for several heater settings were simulated, and the results were implemented in experiments. From the examination of the growth process through computation, the heater and its positional adjustments were determined to be effective modulators of oxygen concentration during crystal growth, which was consequently reduced to below 4 ppma (ASTM F121-83). Finally, the simulations were validated experimentally, limitations in production were discussed, and possible improvements were outlined.

1. Introduction

Single crystal silicon is a crucial raw material in the modern integrated circuit industry, essential for sensor and chip production [1,2]. The Czochralski (CZ) method, the primary technique for silicon crystal growth, primarily incorporates oxygen atoms from the quartz crucible due to the growth apparatus. Approximately 99% [3] of these atoms will evaporate from the melt free surface, exiting in the form of SiO with argon gas. A minor portion of oxygen atoms infiltrates the crystal through the crystal–melt interface during the crystal elevation process, with an effective oxygen segregation coefficient in silicon of about 1.25 [4]. While an optimal oxygen level can enhance silicon wafer strength and reduce heavy metal content during device manufacturing by absorbing impurities, the oxygen concentration in single crystal silicon significantly impacts the electrical and mechanical properties of the silicon wafers. Excessive oxygen concentration can result in defects [5,6] and quality issues in silicon wafers. The suggestion that low-oxygen Magnetic Czochralski (MCZ) silicon could be substituted for Float Zone (FZ) silicon in IGBT device fabrication [7,8,9] has made controlling oxygen concentration in single crystal silicon a recent focal point among researchers.
Controlling oxygen concentration in CZ and MCZ Si crystals has been performed by manipulating interacting factors such as crystal and crucible rotation [10], furnace pressure and argon flow rate [11], thermal field design [12,13,14], and the type [15], position [16], and intensity [16,17] of the magnetic field. Recent work shows that optimizing heater geometry—for example, adjusting a heater’s height [18], crucible depth, and the heating power distribution—also reduces oxygen incorporation. These heater modifications alter the surface temperature gradient, change melt flow patterns, and modify evaporation kinetics, which collectively lower the oxygen uptake [13,19,20].
The geometric parameters of the heater strongly influence the oxygen content of single crystal silicon [19,21]. Motivated by this relationship, others have developed a multi-stage heater and varied heating modes across growth stages to control silicon oxygen concentration effectively [20]. Based on those approaches, the present study introduces a new short heater with an increased length gradient and compares its performance to that of a conventional heater, whose lengths are generally between 300 and 450 mm. How the new heater’s geometry and placement affect oxygen concentration throughout the crystal growth process is also examined. The aim of this work is to clarify how the heater’s dimensions and spatial distribution modify melt convection, oxygen sources, and oxygen transport during single crystal silicon growth, and thereby to provide theoretical guidance for controlling oxygen concentration during this process.

2. Mathematical Model and Method

This study combines numerical simulations and growth experiments to examine how heater settings affect oxygen distribution during single crystal silicon growth and to investigate the mechanisms of oxygen transport. To improve simulation accuracy, boundary conditions were refined to match the calculated thermal field with the actual growth condition. Calculations were performed at selected crystal positions (CP) and consist of the total length of the crown and body, by which the growth stages were referenced. For each variation in the models, CP = 450 mm and CP = 1000 mm were analyzed; these paired cases serve as before-and-after growth comparisons and validate one another.
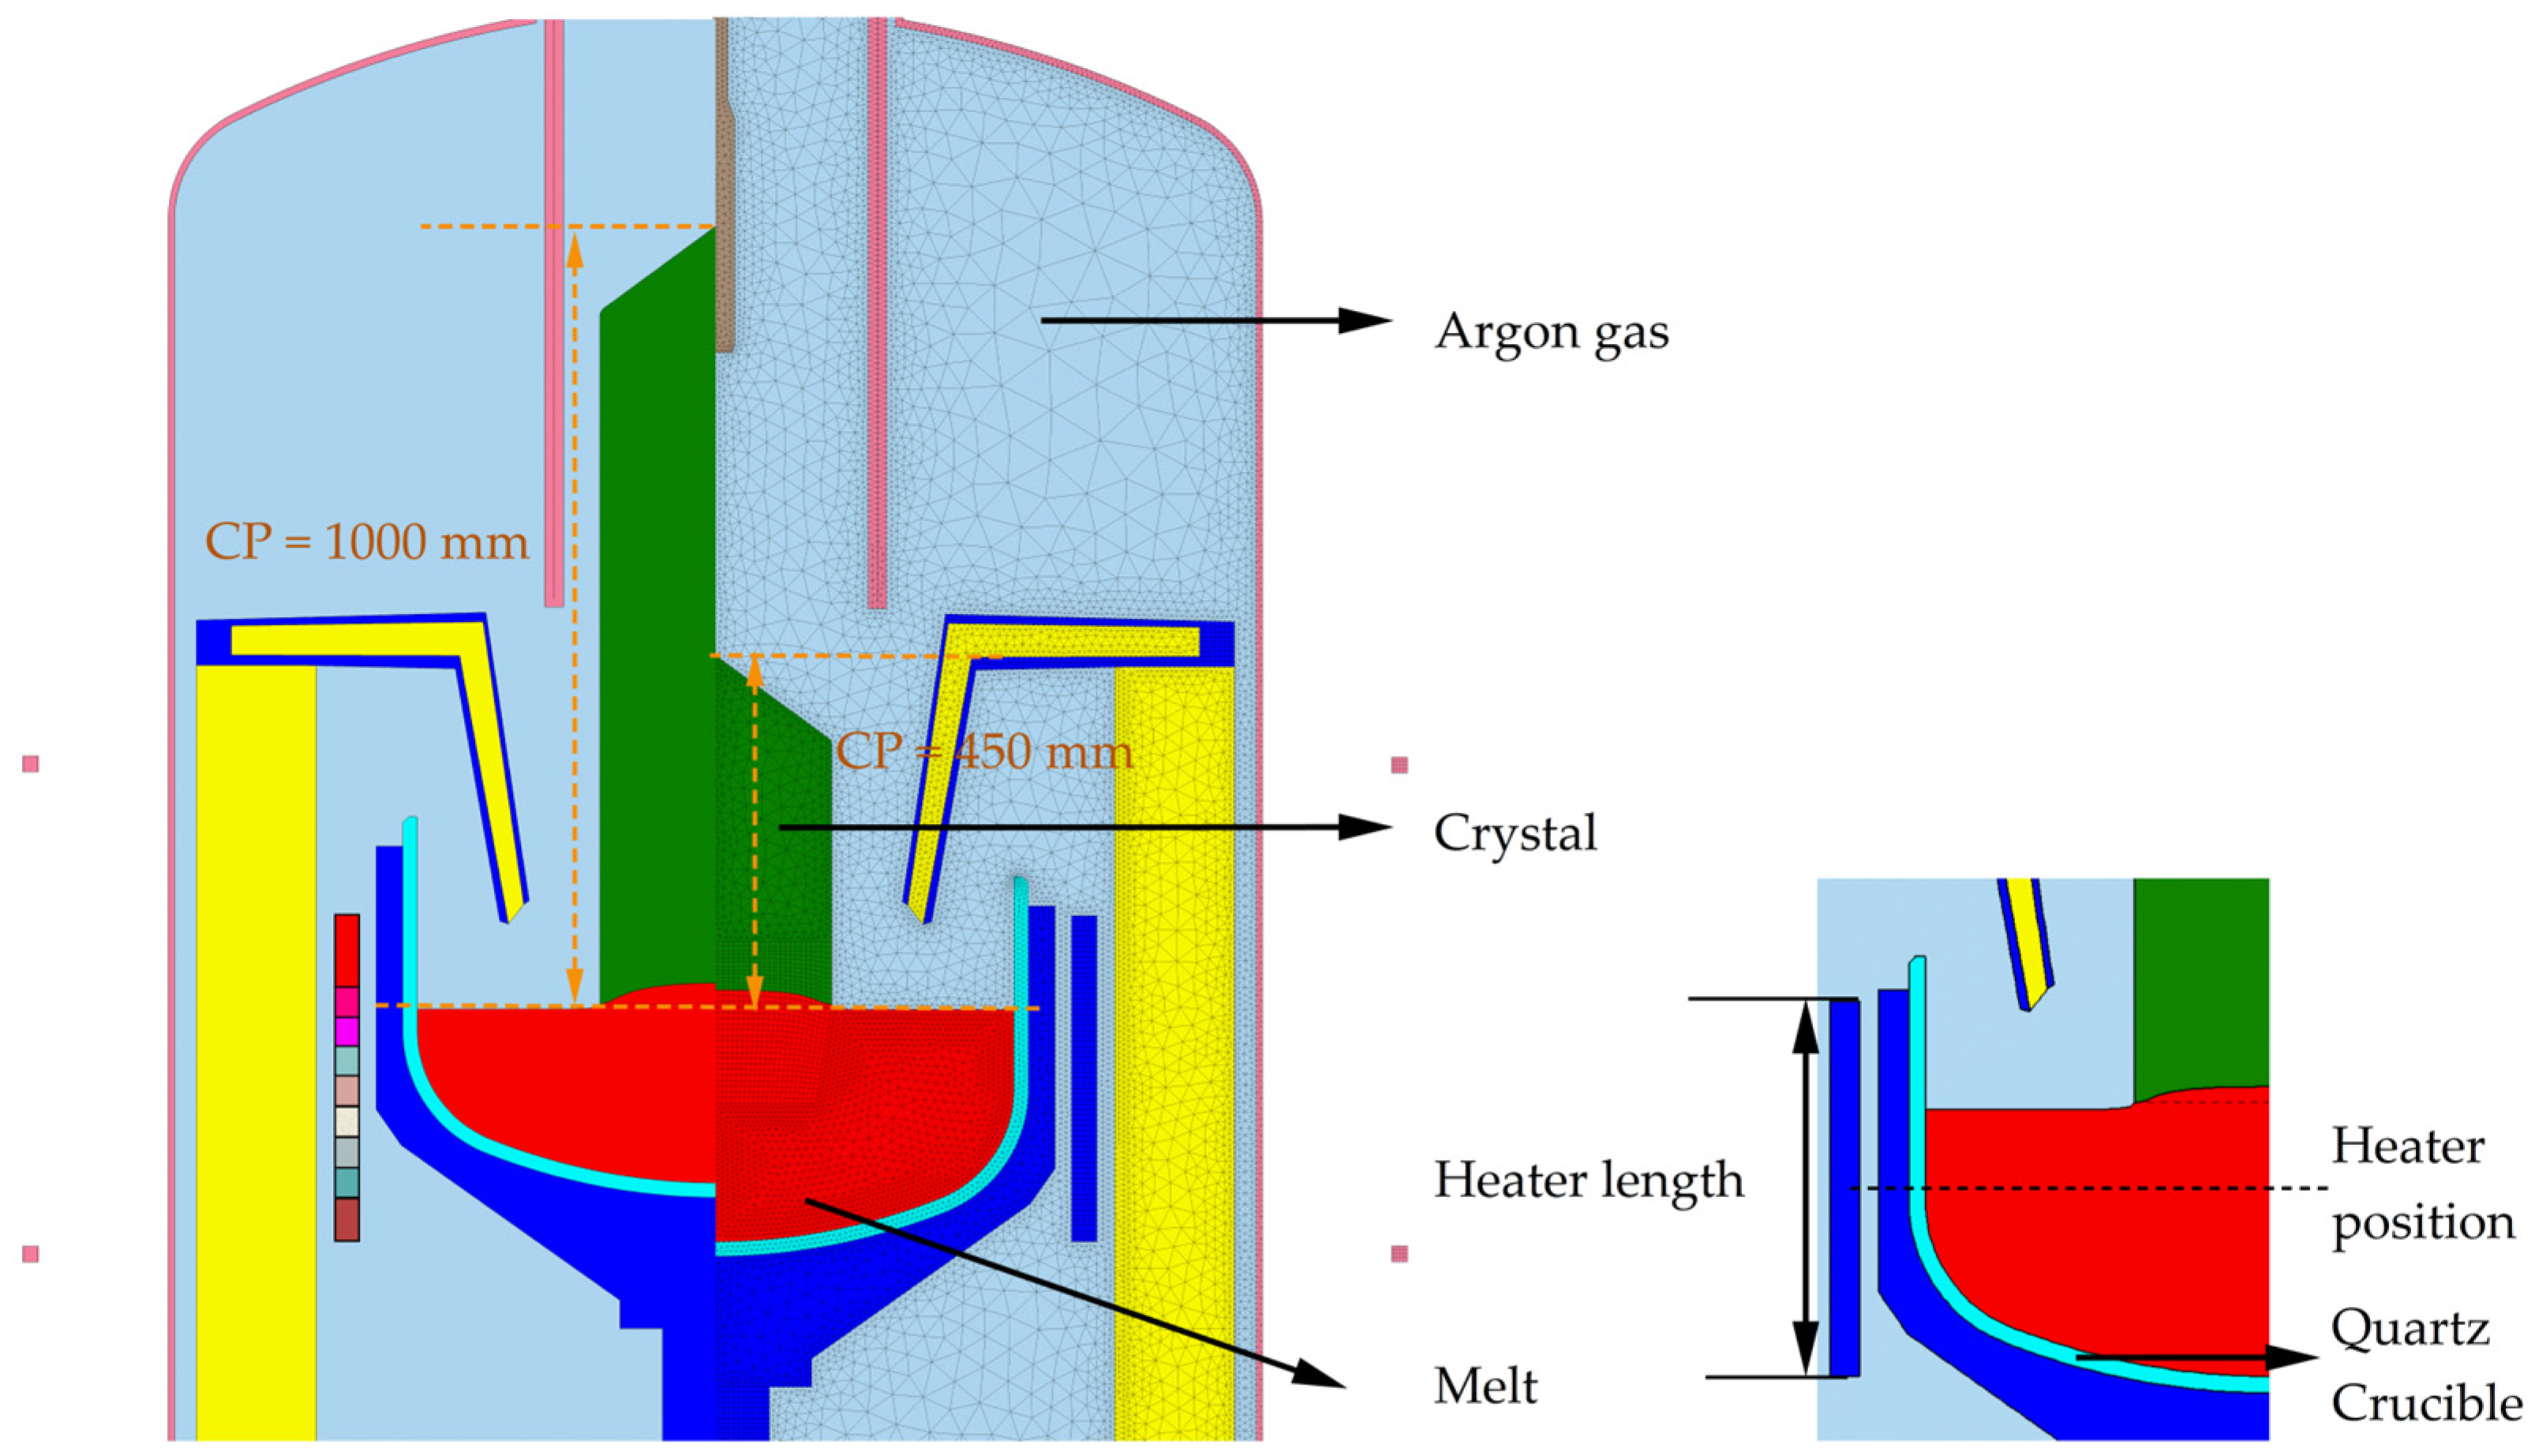
Numerical simulations were carried out using STR Company’s CGSim 24.1 crystal growth software. Using its basic module, a two-dimensional axisymmetric model was built, and coupled heat- and mass-transfer problems were solved for the crystal growth process. The simulation consisted of three main steps. First, a growth assembly model was constructed to reflect the actual furnace type used for silicon single crystal growth and the specified boundary conditions for each region. Second, the geometry was defined, and materials were assigned, followed by the automated generation of the computational mesh within the software. The resulting model and mesh are shown in Figure 1. The overall figure presents two models: on the left, the diagram for the CP = 1000 mm case, and on the right, the schematic for the CP = 450 mm case. Here, CP denotes the vertical distance from the dividing point between the neck and shoulder—located at the top of the schematic, towards the triple point of crystal growth—which consist of both the shoulder and the body sections. The inset in Figure 1 illustrates the variations in the length and position of the heater. The heater measures 420 mm, corresponding to the length used in the CP = 450 mm case. In contrast, the newly designed heater is 80 mm long, represented in the main figure by a red grid for clearer differentiation. The lengths of the heaters are sequentially arranged, with each block added from the bottom to complete the experimental design. The thickness of the heater is 32 mm, and its coordinate in the upper left corner is (494, 1088) when the bottom position of the central axis is defined as the coordinate origin. The parameters for the heater’s position are detailed in the inset, using the center of the heater as the coordinate reference, denoted as Y = n mm, to indicate the effects of changes in heater position. In the subsequent text, adjustments to the heater position will be described as moving up and down from the initial reference value of Y = 1048 mm. The model represents 300 mm of single crystal silicon grown under a magnetic field. In the simulations, the crystal pulling speed was varied between 30 and 80 mm/h, the furnace pressure was fixed at 20 Torr, and the crucible diameter was 32 inches. To capture the turbulent flow in the melt and the gas, one has to solve the Reynolds-averaged Navier–Stokes equations (RANS) [22,23] and the one-equation turbulence model [24].
After crystal growth, the silicon wafers were processed. The surface oxide layer was removed by etching, and then the interstitial oxygen concentration in different wafer regions was measured with a Fourier transform infrared spectrometer (Nicolet iS50 FTIR Spectrometer from Thermo Fisher Scientific Inc., Waltham, MA, USA). These measured values were compared with the simulated results (ASTM F121-83, all values hereafter referenced to the same SEMI standard).
Taking into account the established two-dimensional axisymmetric model and assuming a quasi-steady growth process, the formulas related to heat and mass transfer during this growth process are as follows:
ρ i u i = 0
u i ρ i u i = ρ i + τ i + ρ i ρ i , 0 g
ρ i C ρ i u i T i = k i T i
ρ i u i C j = D j C j
where ρ , ρ O , C p , u , T , k , p , τ , g , C , D are density, reference density, specific heat capacity, velocity vector, temperature, thermal conductivity, pressure, stress tensor, gravity acceleration, material concentration, and diffusion coefficient, respectively. In the concentration, the subscript i represent argon and silicon melt, respectively. The subscript j is oxygen or SiO, where oxygen and SiO represent oxygen in the melt and silicon oxide [25] in argon, respectively.
The oxygen atoms released from the crucible into the silicon melt mainly exist in two places. First, at the solid–liquid interface of the silicon, the oxygen element enters the crystal through the segregation effect:
k e f f = k 0 k 0 + 1     k 0 exp v δ D O
k e f f C l = C s
where v is the growth rate, δ is the boundary layer thickness, k e f f is the effective segregation coefficient, and C l and C s are the oxygen concentrations in the melt and crystal, respectively.
In addition, on the free surface, oxygen is released into argon as SiO. The conservation relationship between the oxygen concentration in the melt and SiO in argon is as follows:
ρ D O m 0 C 0 n = ρ D S i O m S i O C S i O n
Among them, m 0 and m S i O are the molar masses of oxygen and silicon monoxide, respectively.

3. Results and Discussion

3.1. The Effect of Heater Length

Based on prior studies of the heater configuration [13,19], the heater’s topmost position is fixed, while its length is varied from the initial short 80 mm to a maximum of 460 mm in steps: 80 mm, 160 mm, 200 mm, 240 mm, 280 mm, 360 mm, 420 mm, and 460 mm. The crystal is located at CP = 450 mm. Figure 2 presents simulations of the oxygen concentration, oxygen diffusion coefficient, temperature distribution, and velocity vectors in the silicon melt. Oxygen impurities that accumulate on the crucible wall are either transported to the free surface of the melt for evaporation, which constitutes the majority of the process, or are transferred to the solid–liquid interface, where they can enter the crystal via convection and diffusion. The transport pathway and the rate of oxygen transport within the melt are characterized by the oxygen diffusion coefficient. As heater length increases, the crucible receives greater thermal radiation, which expands the high-temperature region along the crucible side wall and accelerates silica dissolution into the melt. Consequently, the oxygen concentration in the silicon melt rises, and the medium-concentration oxygen region expands, as shown on the left in Figure 2. Concurrently, low-oxygen zones at the solid–liquid interface and the free surface contract and eventually disappear. The oxygen concentration and temperature distributions at CP = 1000 mm resemble those at CP = 450 mm.
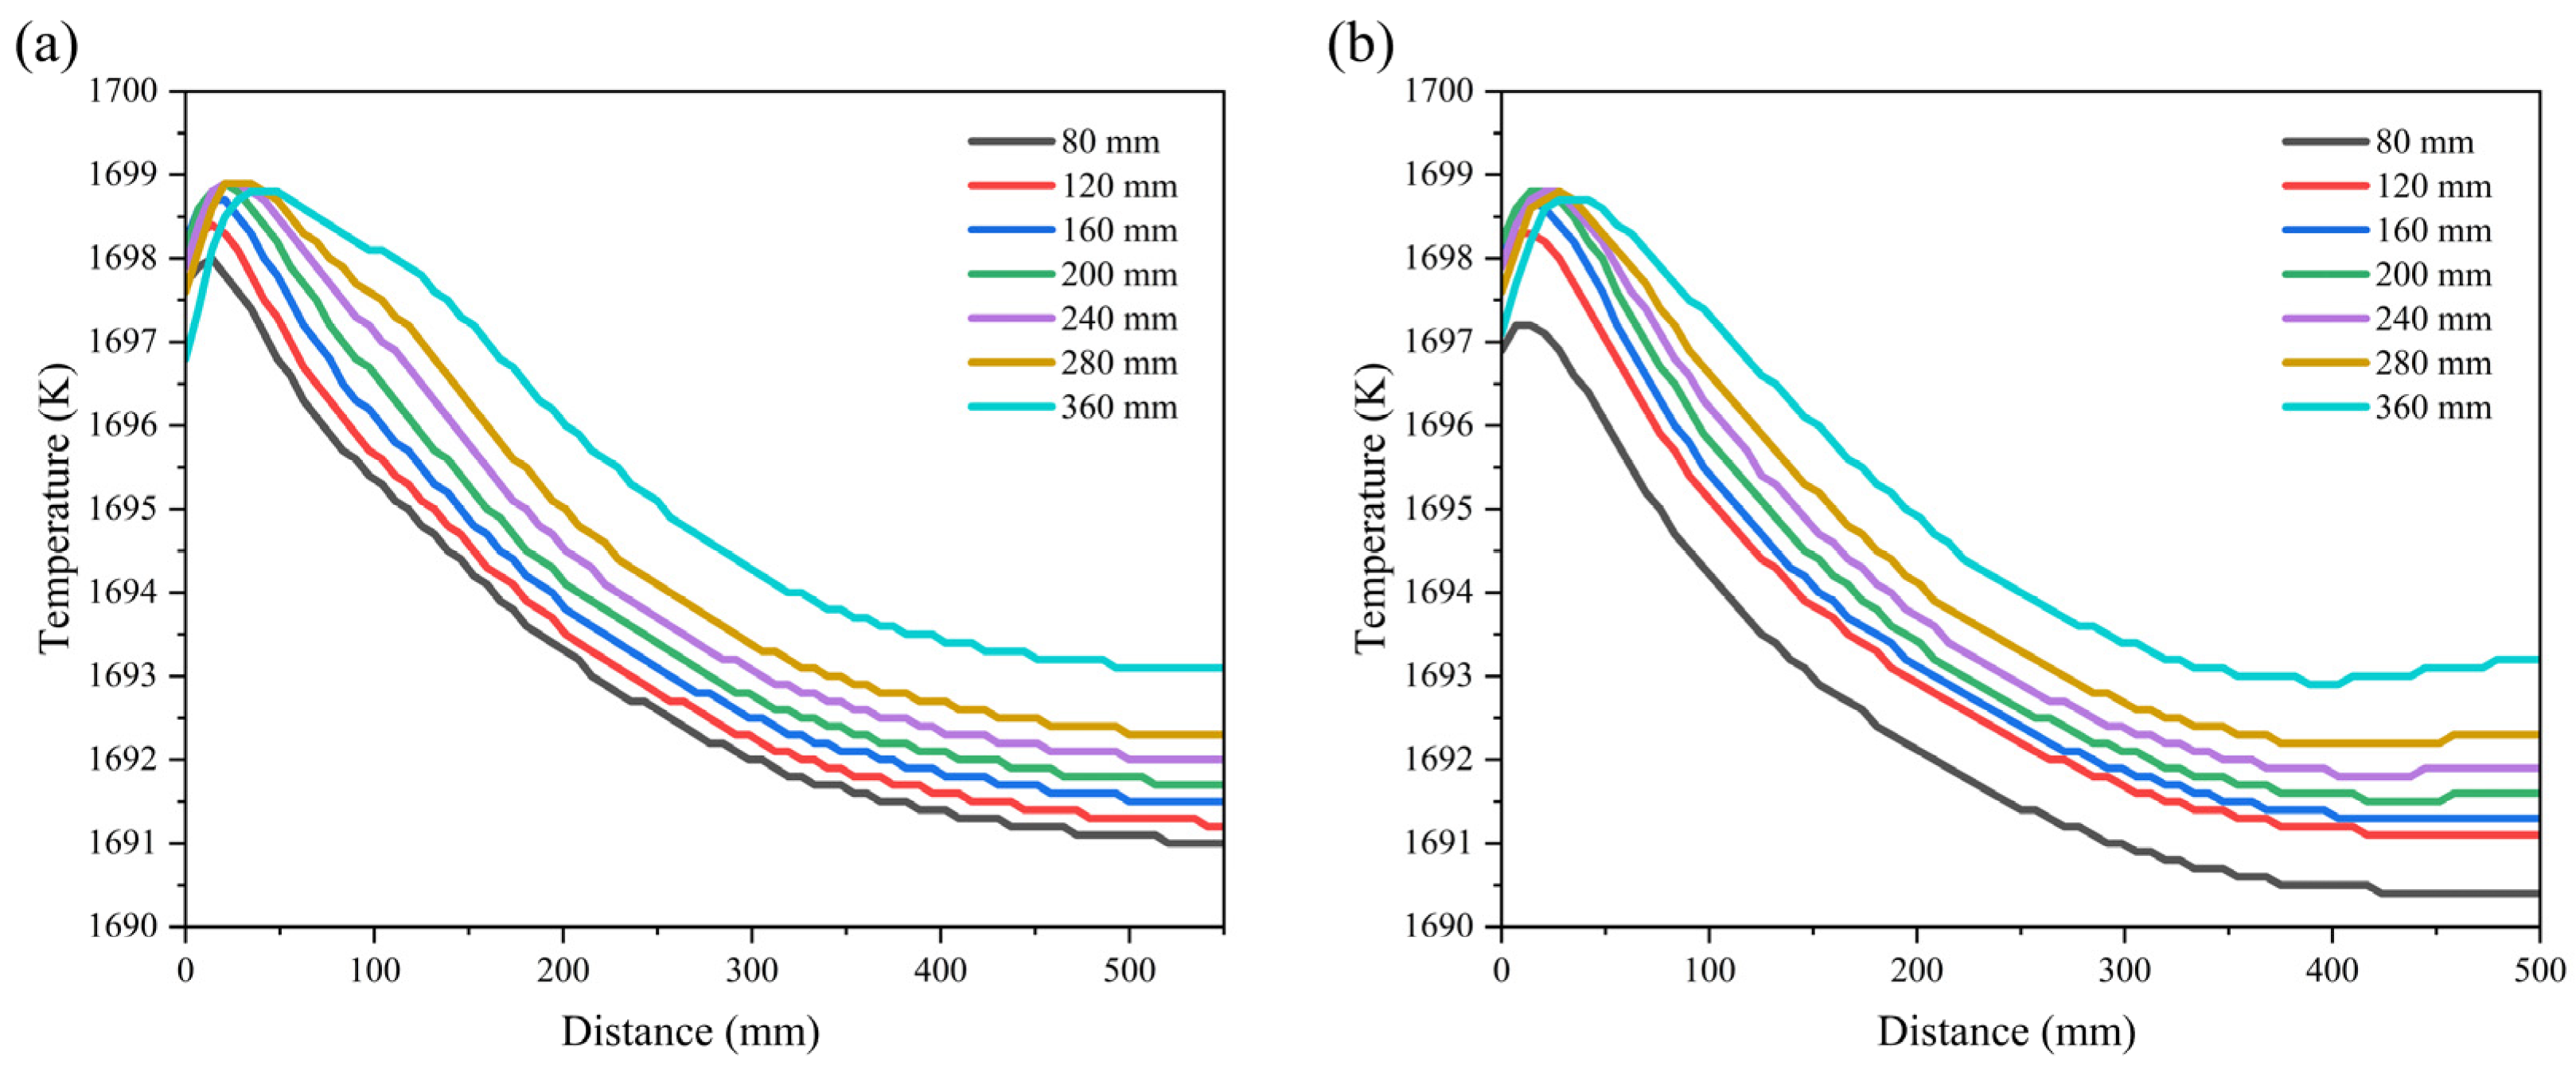
Marking the contact point between the crucible and the silicon melt free surface as the distance origin, the temperature is traced along the crucible wall from that origin to the crucible’s lowest point to obtain the wall temperature distribution shown in Figure 3. The simulation results are compared for CP = 450 mm and CP = 1000 mm. As the heater length increases, the crucible’s high-temperature zone expands, overall wall temperatures rise, and the maximum temperature shifts downward. This downward shift directly reflects the lower placement of the heater and is accompanied by a widening of the region above 1698 K. Analysis indicates that the longer heater and the expanded high-temperature zone jointly affect the silicon melt, leading to an increase in internal oxygen concentration. Both CP = 450 mm and CP = 1000 mm exhibit the same trend in these changes.
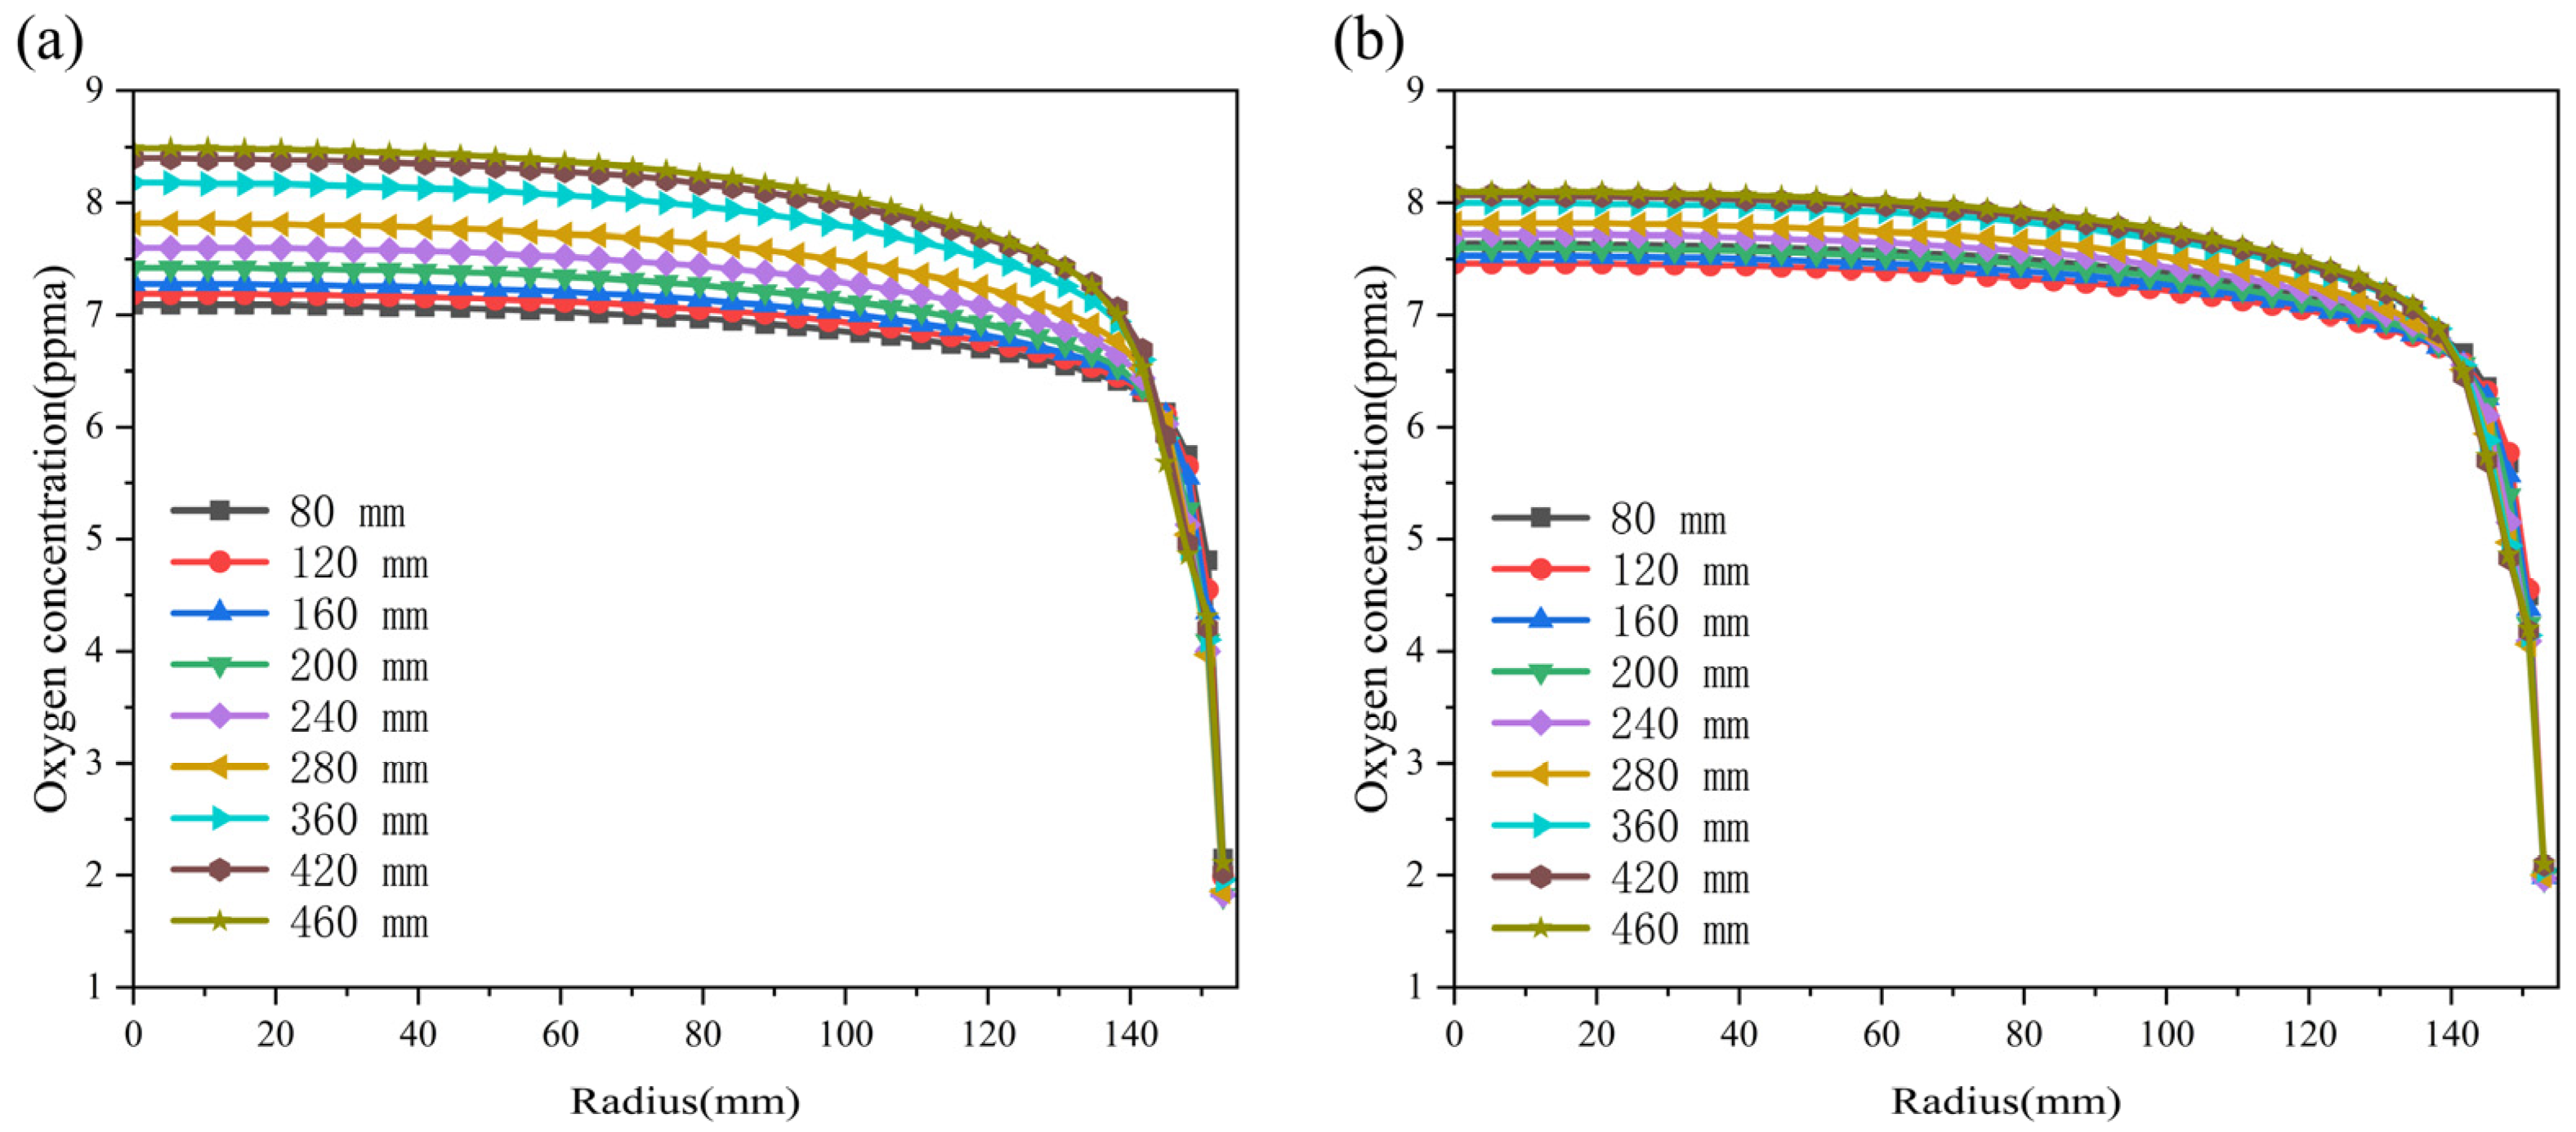
This study quantifies the effect of heater geometry on oxygen content in single crystal silicon by reporting the oxygen concentration at its solid–liquid interface and melt. Figure 4 shows how the interfacial oxygen concentration changes with heater length during crystal growth. At CP = 450 mm, replacing an 80 mm heater with a 460 mm heater raises the interfacial oxygen concentration from 7.09 ppma to 8.49 ppma, an increase of about 19.7%. At CP = 1000 mm, the interfacial oxygen concentration follows a similar qualitative trend with heater length, but the magnitude of the change is smaller. This reduced sensitivity arises because, in the later stages of growth, the crucible rises and the melt depth decreases; these changes weaken the overall scouring of the silicon melt and shrink the low-temperature region, which raises the temperature and increases oxygen solubility. Simultaneously, the buoyancy–thermocapillary vortex contracts, flow velocity rises, and the rate of oxygen transport increases, producing the observed net effect on interfacial oxygen concentration.
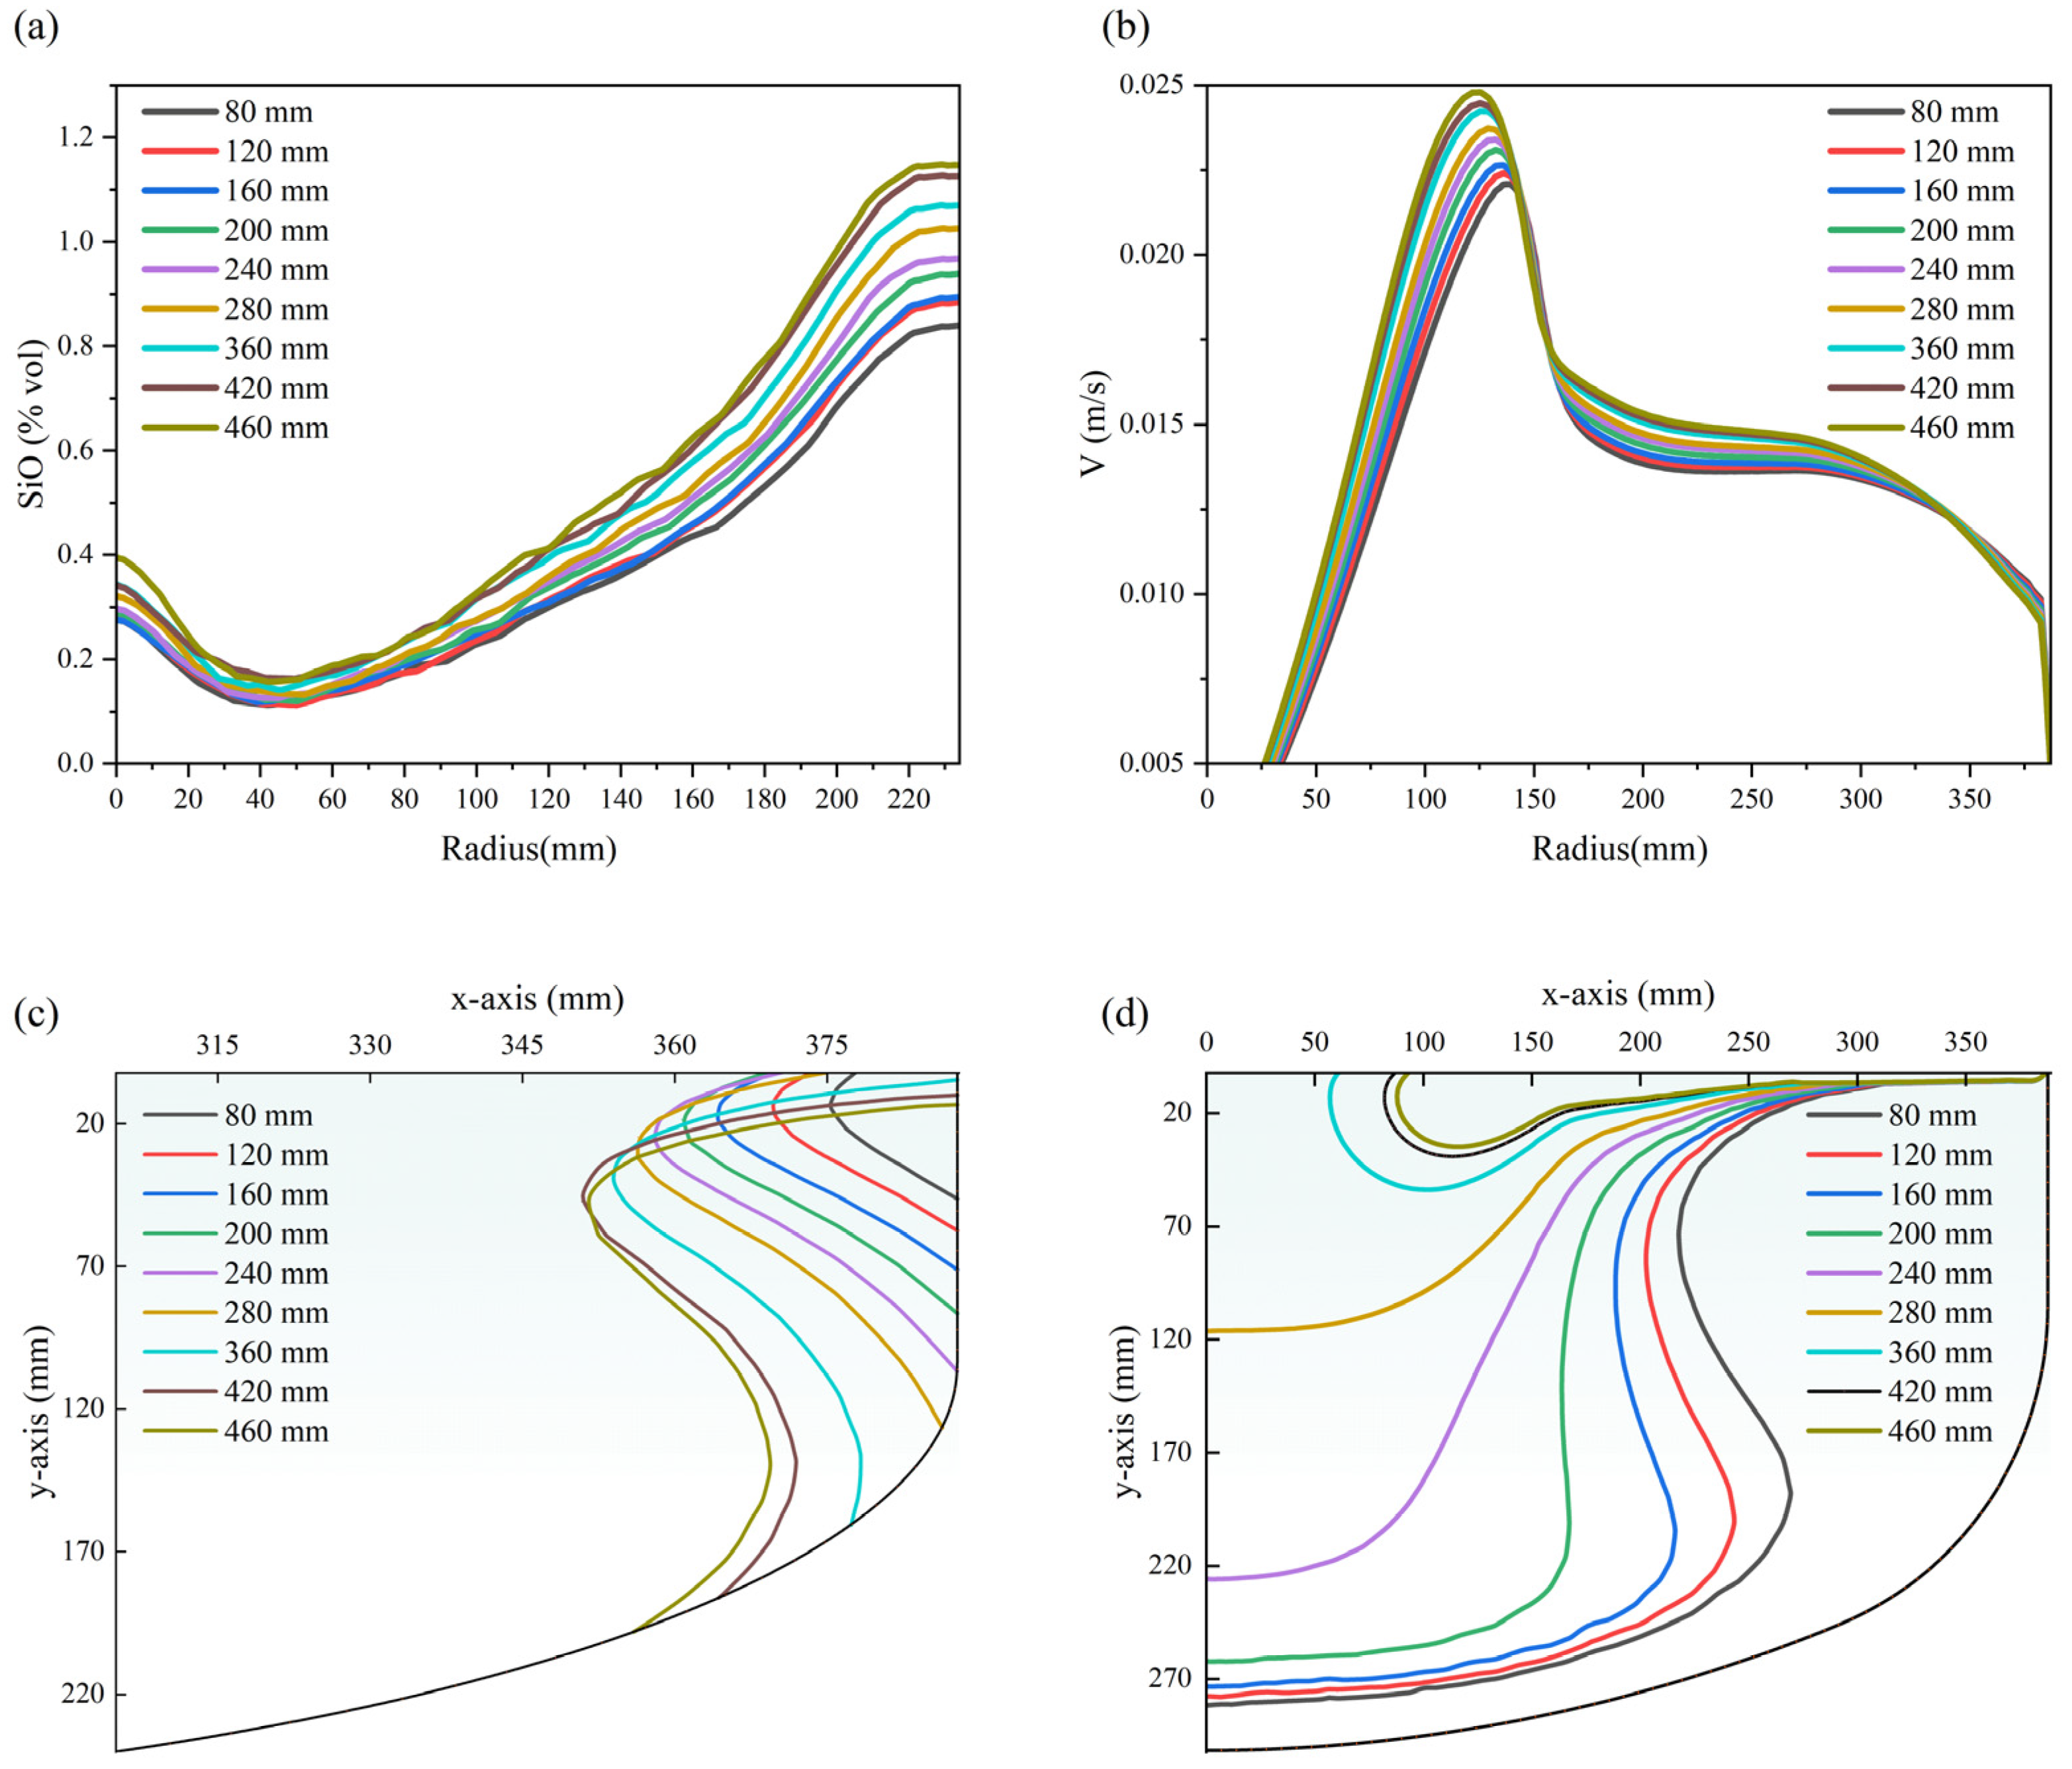
When the process conditions and crystal position are held constant, and only the heater length is varied, the crucible’s vortex structure remains largely unchanged. Two vortex types persist: Taylor–Proudman vortices [26] beneath the crystal and a buoyancy–thermocapillary vortex, with the latter dominant; vortex sizes show only minor variation. Horizontal probes were placed 10 mm above and 10 mm below the melt free surface. The upper probe monitored SiO volatilization (Figure 5a), and the lower probe measured melt flow rate (Figure 5b).
Figure 5c shows a distinct high-temperature region in the melt (T ≥ 1697 K) located between the isotherm and the crucible wall. The temperature of the crucible wall can be considered an approximation of the maximum temperature of the melt within the crucible. Based on the crucible temperature distribution curve presented in Figure 3, the highest integer consistently observed across all cases, specifically, 1697 K, is designated as the threshold for the high-temperature region (only in this study). As the heater length increases, this 1697 K isotherm shifts downward from both the top and bottom of the crucible, so the high-temperature region descends and expands inward into the melt. That expansion steepens the melt temperature gradient, which increases the density contrast and, in turn, raises the flow speed of both the Taylor–Proudman vortex and the buoyancy–thermocapillary vortex. Figure 5b confirms that overall flow rate increases with heater length, with the Taylor–Proudman vortex accelerating faster than the buoyancy–thermocapillary vortex; the two vortices overlap at their junction. The faster flows also accelerate oxygen transport in the silicon melt. Figure 5a shows that an increased melt flow rate expands the velocity difference between the free melt surface and the argon gas, which raises the shear stress at the interface and promotes SiO evaporation from the free melt surface. Figure 5d plots the 8 ppma oxygen isoconcentration contour, which reveals a growing high-oxygen region whose shape mirrors the high-temperature zone. During heater growth, two opposing effects act on oxygen concentration. The high-temperature region expands, which increases oxygen solubility and melt flow rate; together, these effects accelerate oxygen diffusion and tend to raise oxygen concentration. In contrast, stronger melt flow intensifies shear at the melt–argon interface and enhances SiO evaporation, which tends to lower oxygen concentration. In simulated conditions, however, the first effect dominates: oxygen concentration in the high-temperature zone increases substantially, while the rise in SiO emissions remains much smaller.

3.2. The Influence of Heater Position

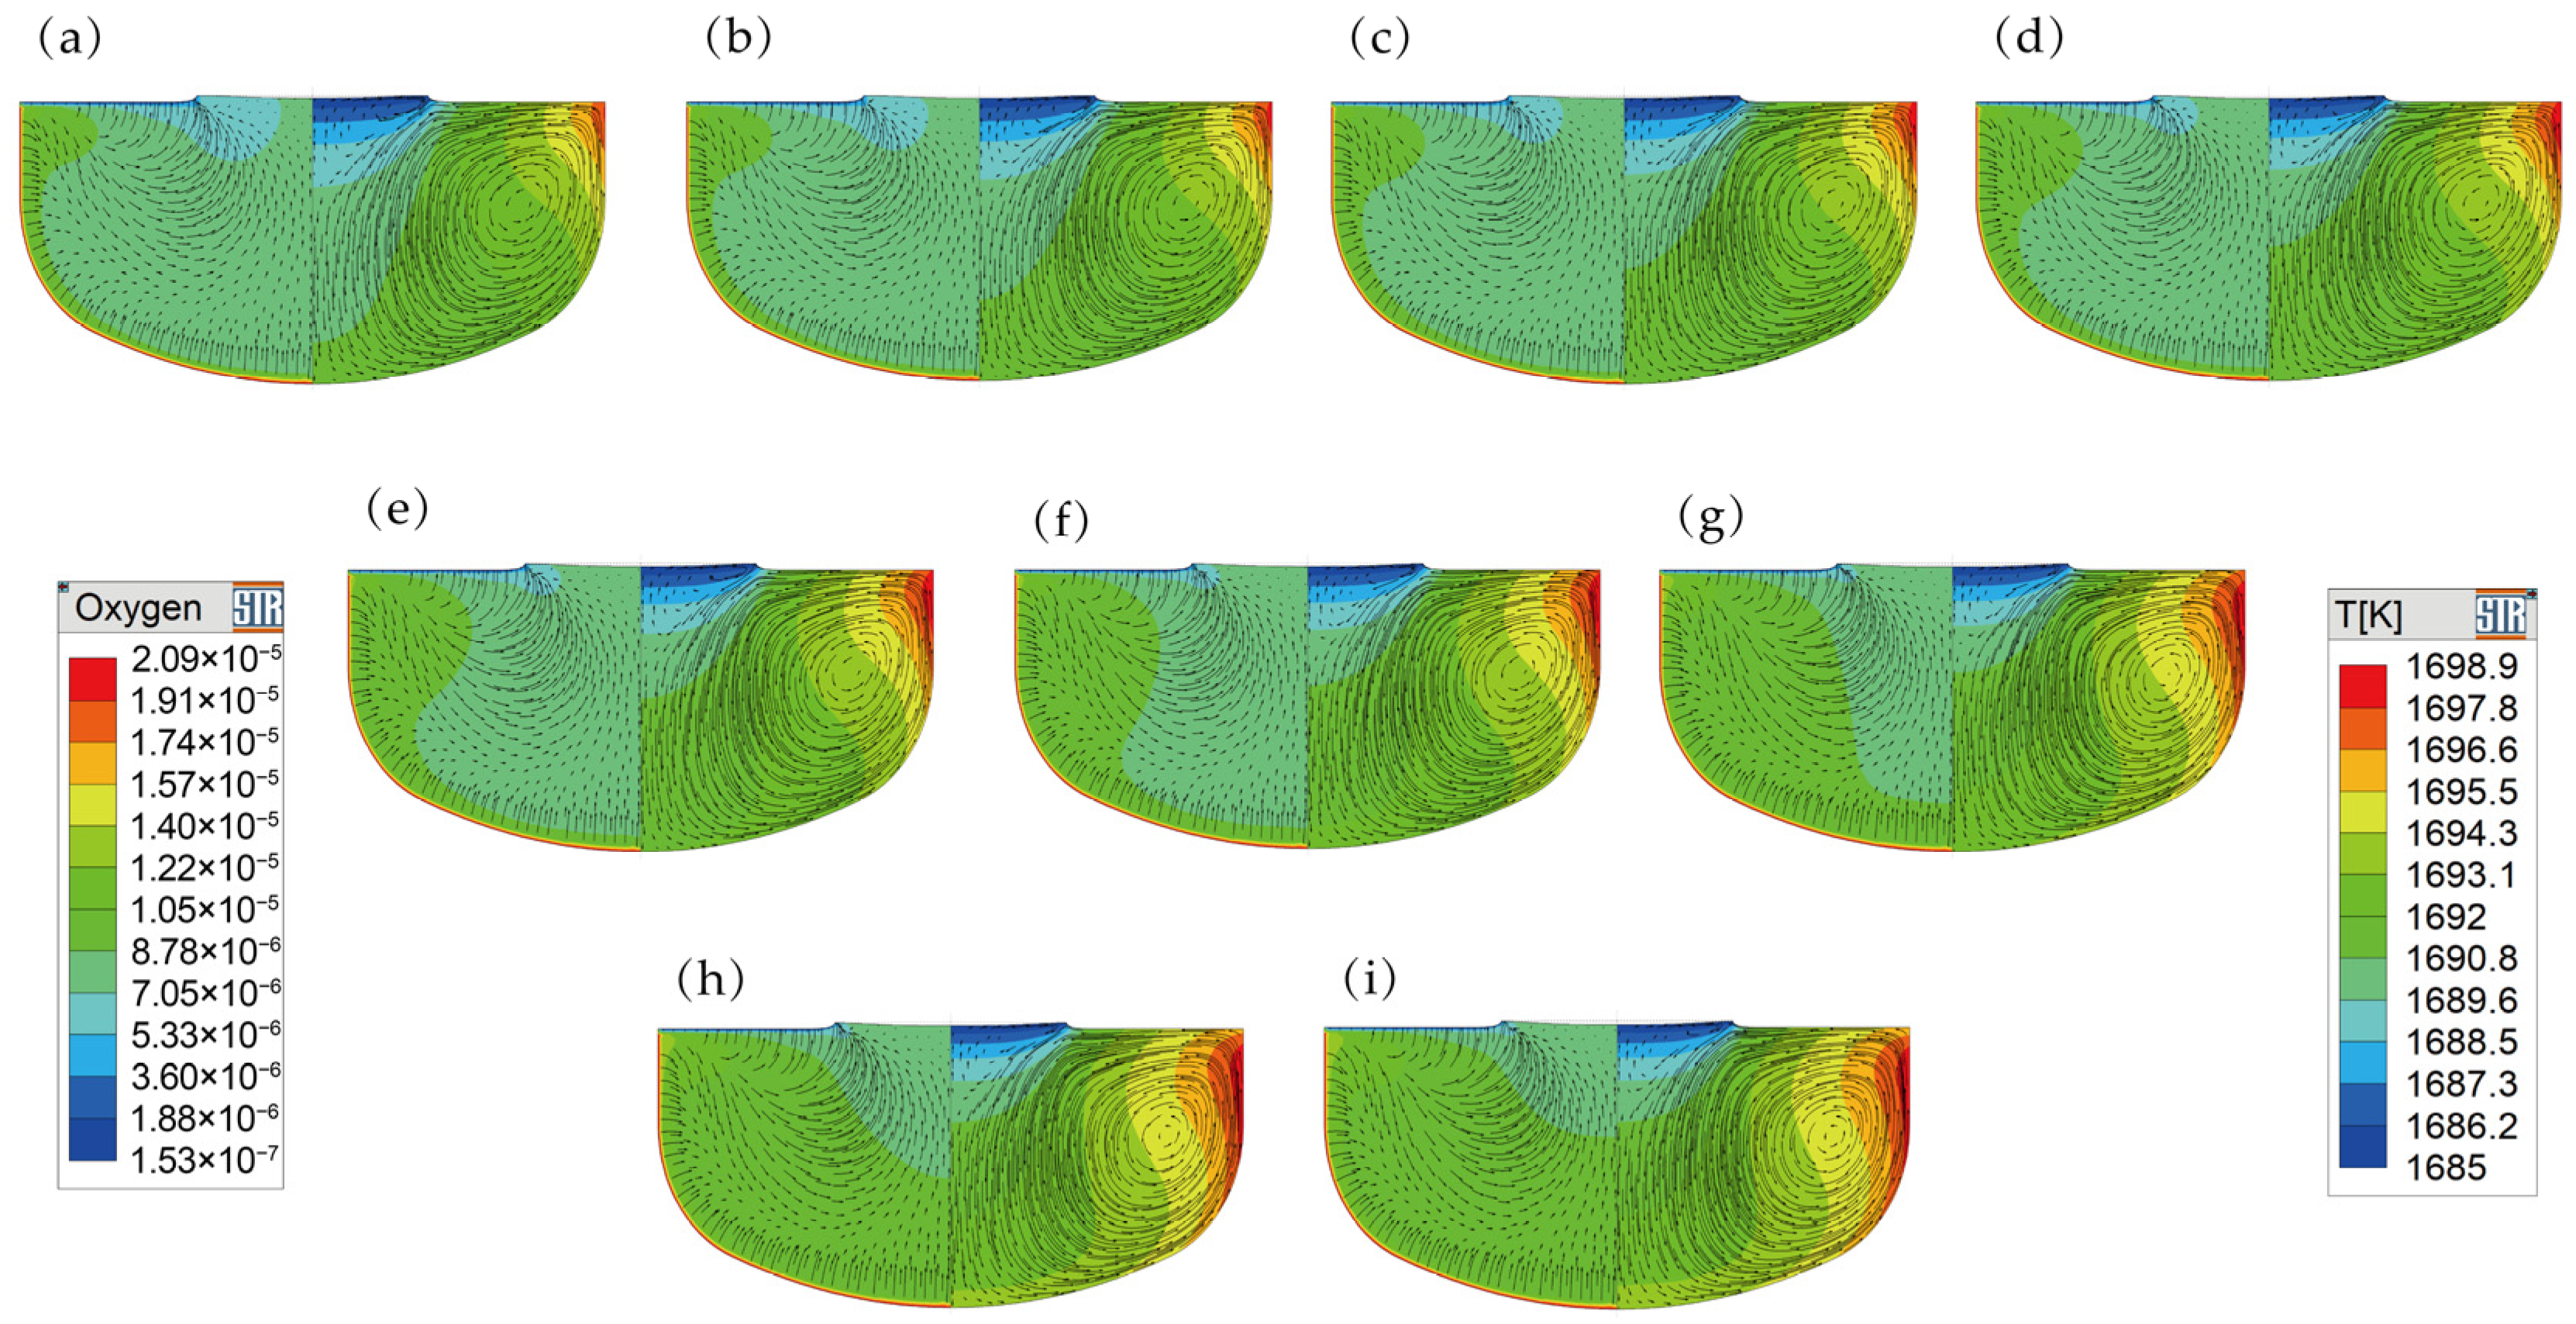
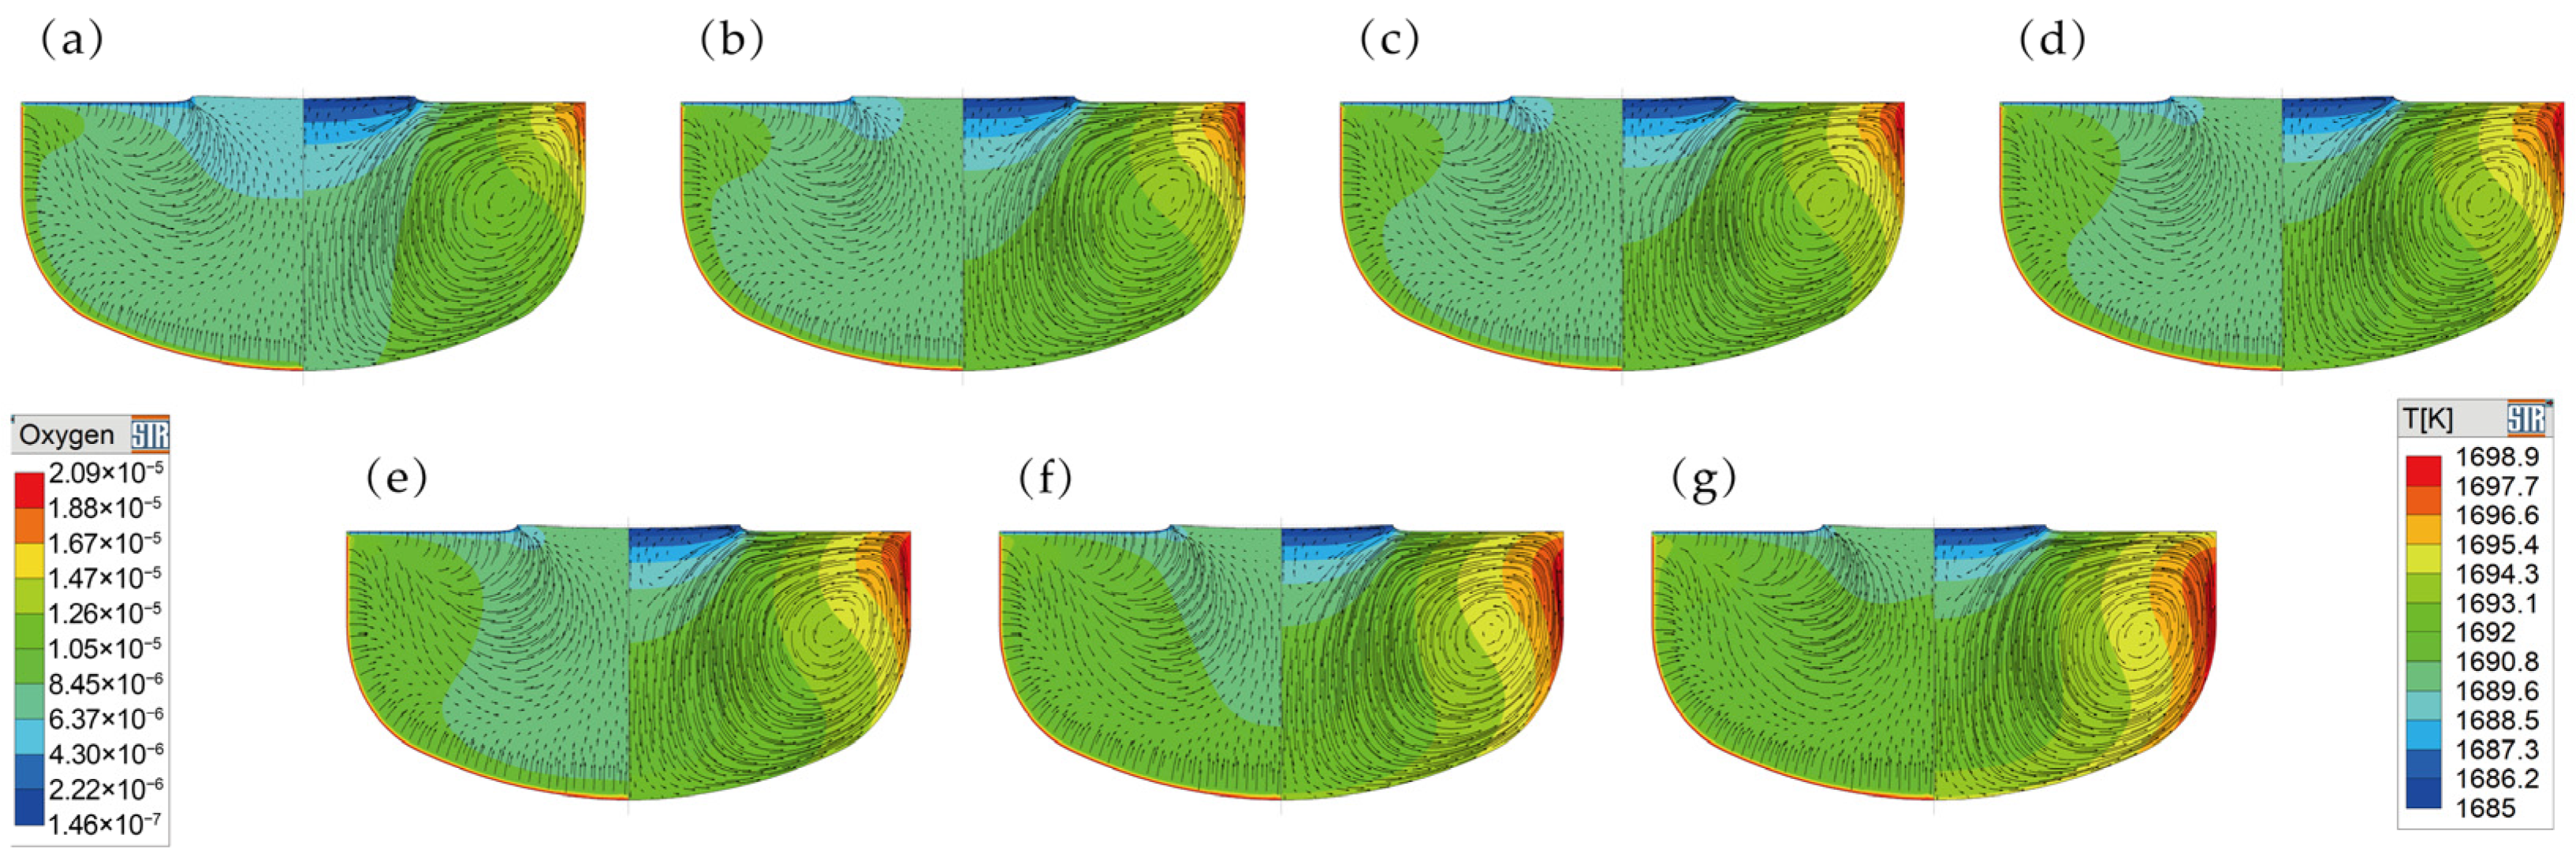
An examination of how shifting the short heater alters oxygen concentration under the optimized operating conditions was also conducted. Figure 6 presents the fluid flow, temperature distribution, and oxygen transport at the crystal position CP = 450 mm. The heater was evaluated at seven axial offsets h: +60 mm, 0 mm, −20 mm, −40 mm, −60 mm, −120 mm, and −180 mm. During growth, the heater remains fixed while the crucible is translated upward to maintain a constant melt level position. As in Section 3.1, the melt flow is dominated by two vortical structures: a Taylor–Proudman vortex beneath the crystal and a combined buoyancy–thermocapillary vortex.
Because other process parameters remain constant, the dominant factors driving the vortices are unchanged, and the melt convection patterns are similar. Rising crucible wall temperature and expansion of the high-temperature zone increase oxygen release from the crucible wall, which accelerates quartz dissolution and strengthens the silicon melt erosion of the crucible. The stretched high-temperature region also raises the oxygen diffusion coefficient and overall transfer efficiency. The vector distribution diagram of the oxygen transport rate illustrates that the maximum diffusion rate progressively extends toward the center of the melt. Additionally, regions with elevated oxygen concentration in the melt diffuse from the crucible’s edge to the solid–liquid interface. Figure 6 shows that as the heater descends, the oxygen isoconcentration contours shift toward the melt center and penetrate the silicon single crystal solid–liquid interface within the Taylor–Proudman vortex. Figure 6 further indicates that when the heater position changes from positive to negative, the heater’s heating zone expands downward, and the oxygen concentration correspondingly increases.
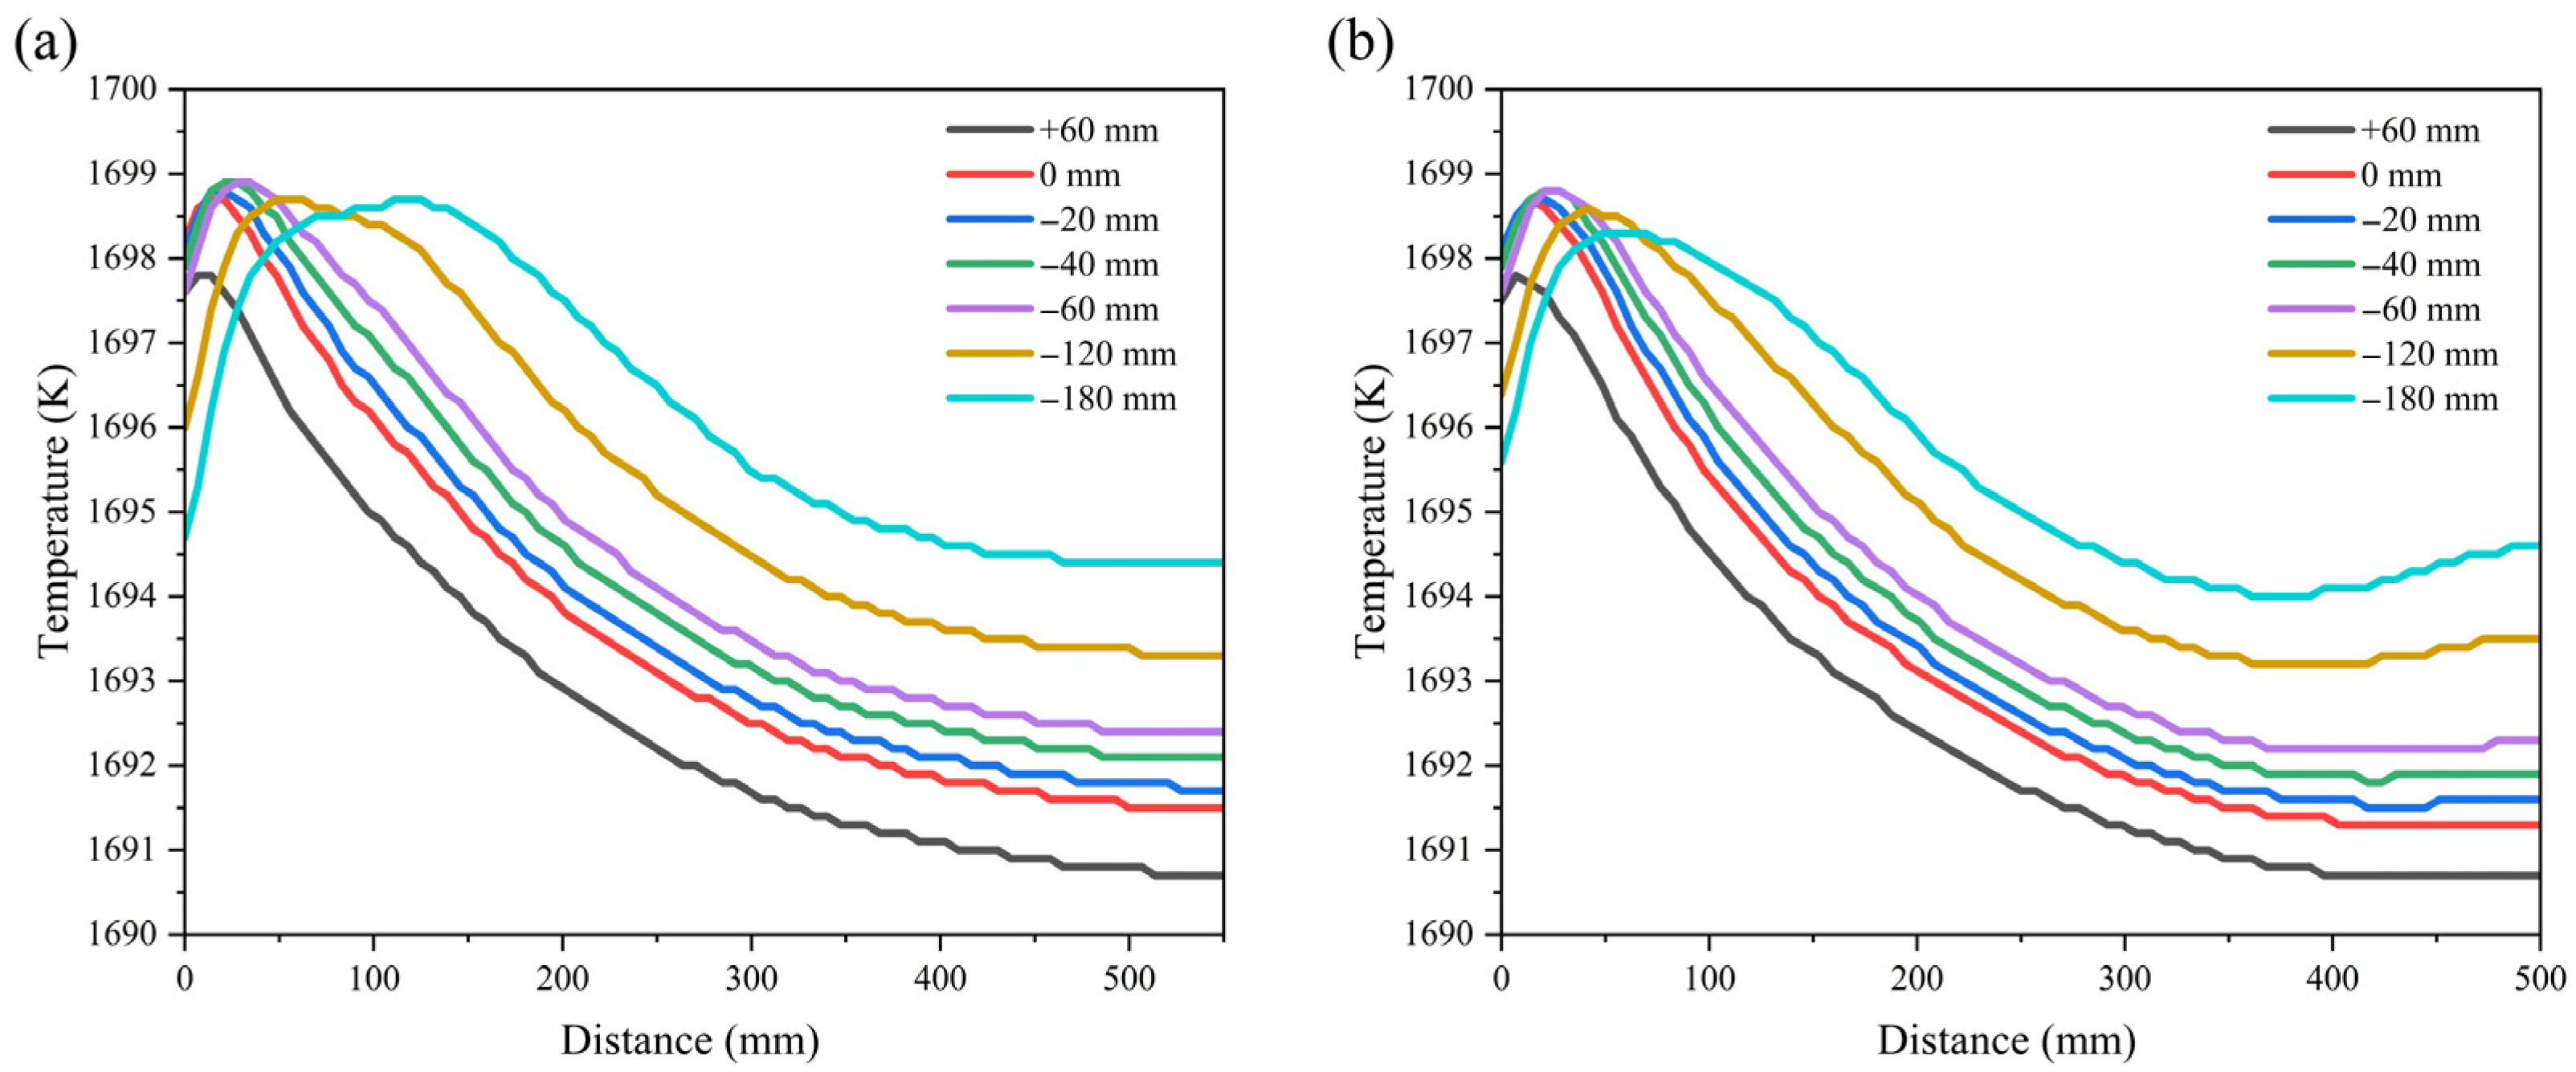
Figure 7 shows the inner–wall temperature distribution of the quartz crucible for CP = 450 mm and CP = 1000 mm. As the heater position moves downward, the peak temperature remains nearly unchanged, but the region exceeding 1698 K expands substantially. This expansion largely explains the changes in oxygen concentration and diffusion coefficient reported in Figure 6. In an analogous way to Section 3.1, the expanded high-temperature region has a greater effect than the increased heater length. The CP = 1000 mm result further corroborates the alteration of these temperature zones.
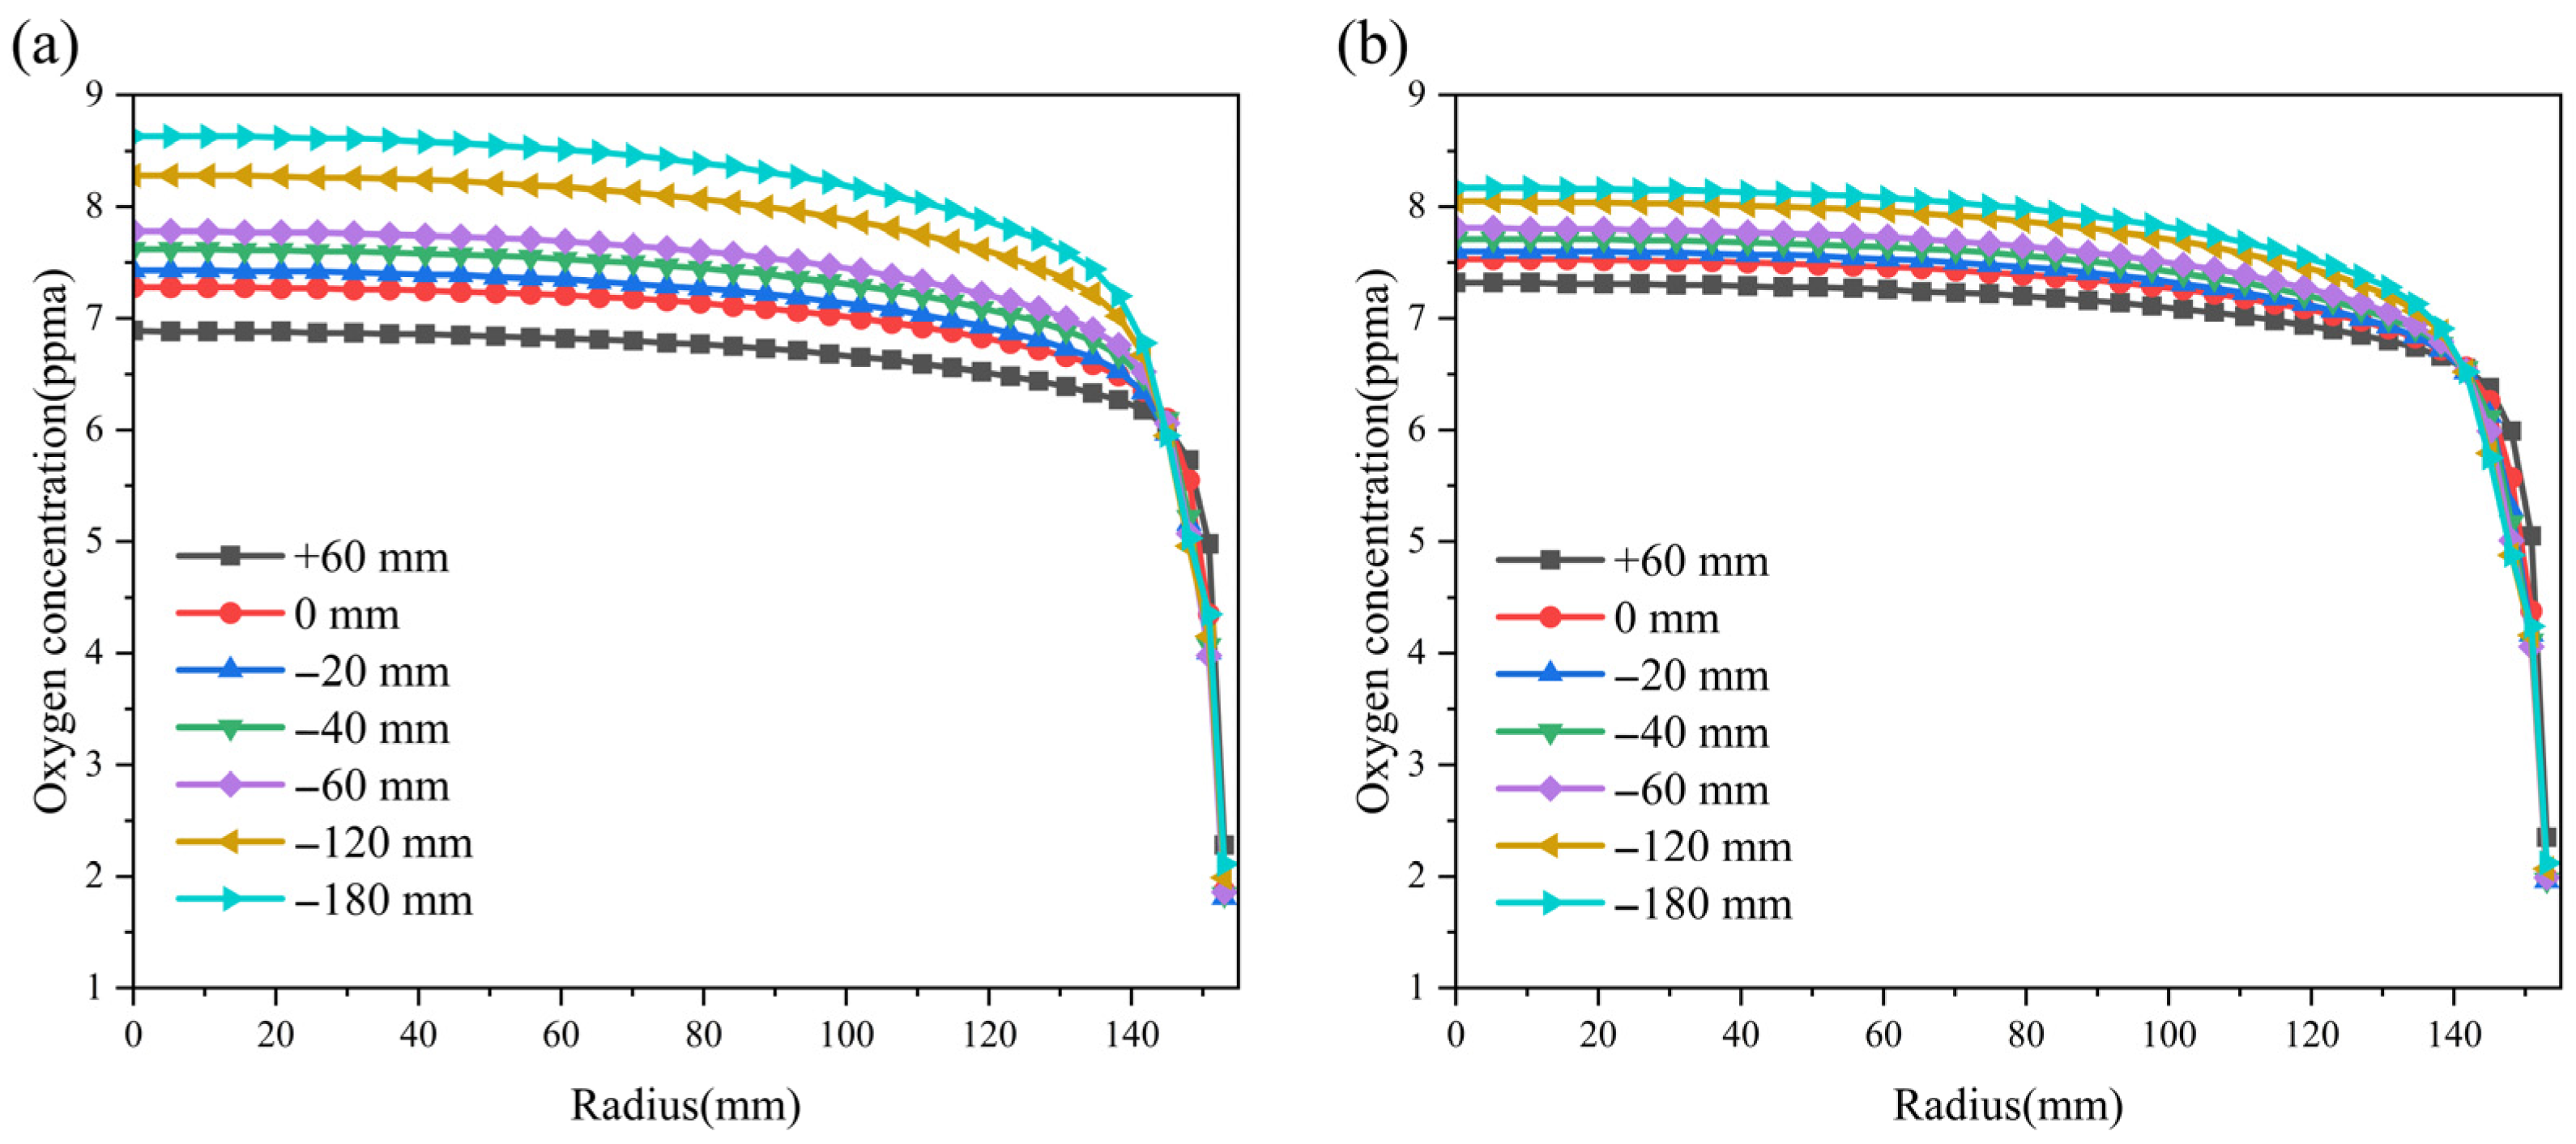
Figure 8a shows that when the crystal position is 450 mm, using a −180 mm heater raises the oxygen concentration at the center of the silicon crystal’s solid–liquid interface from 6.89 ppma to 8.63 ppm, a 25.3% increase relative to the +60 mm heater. Figure 8b shows that at CP = 1000 mm, the oxygen concentration follows the same qualitative trend as at CP = 450 mm, but the rate of increase is reduced.
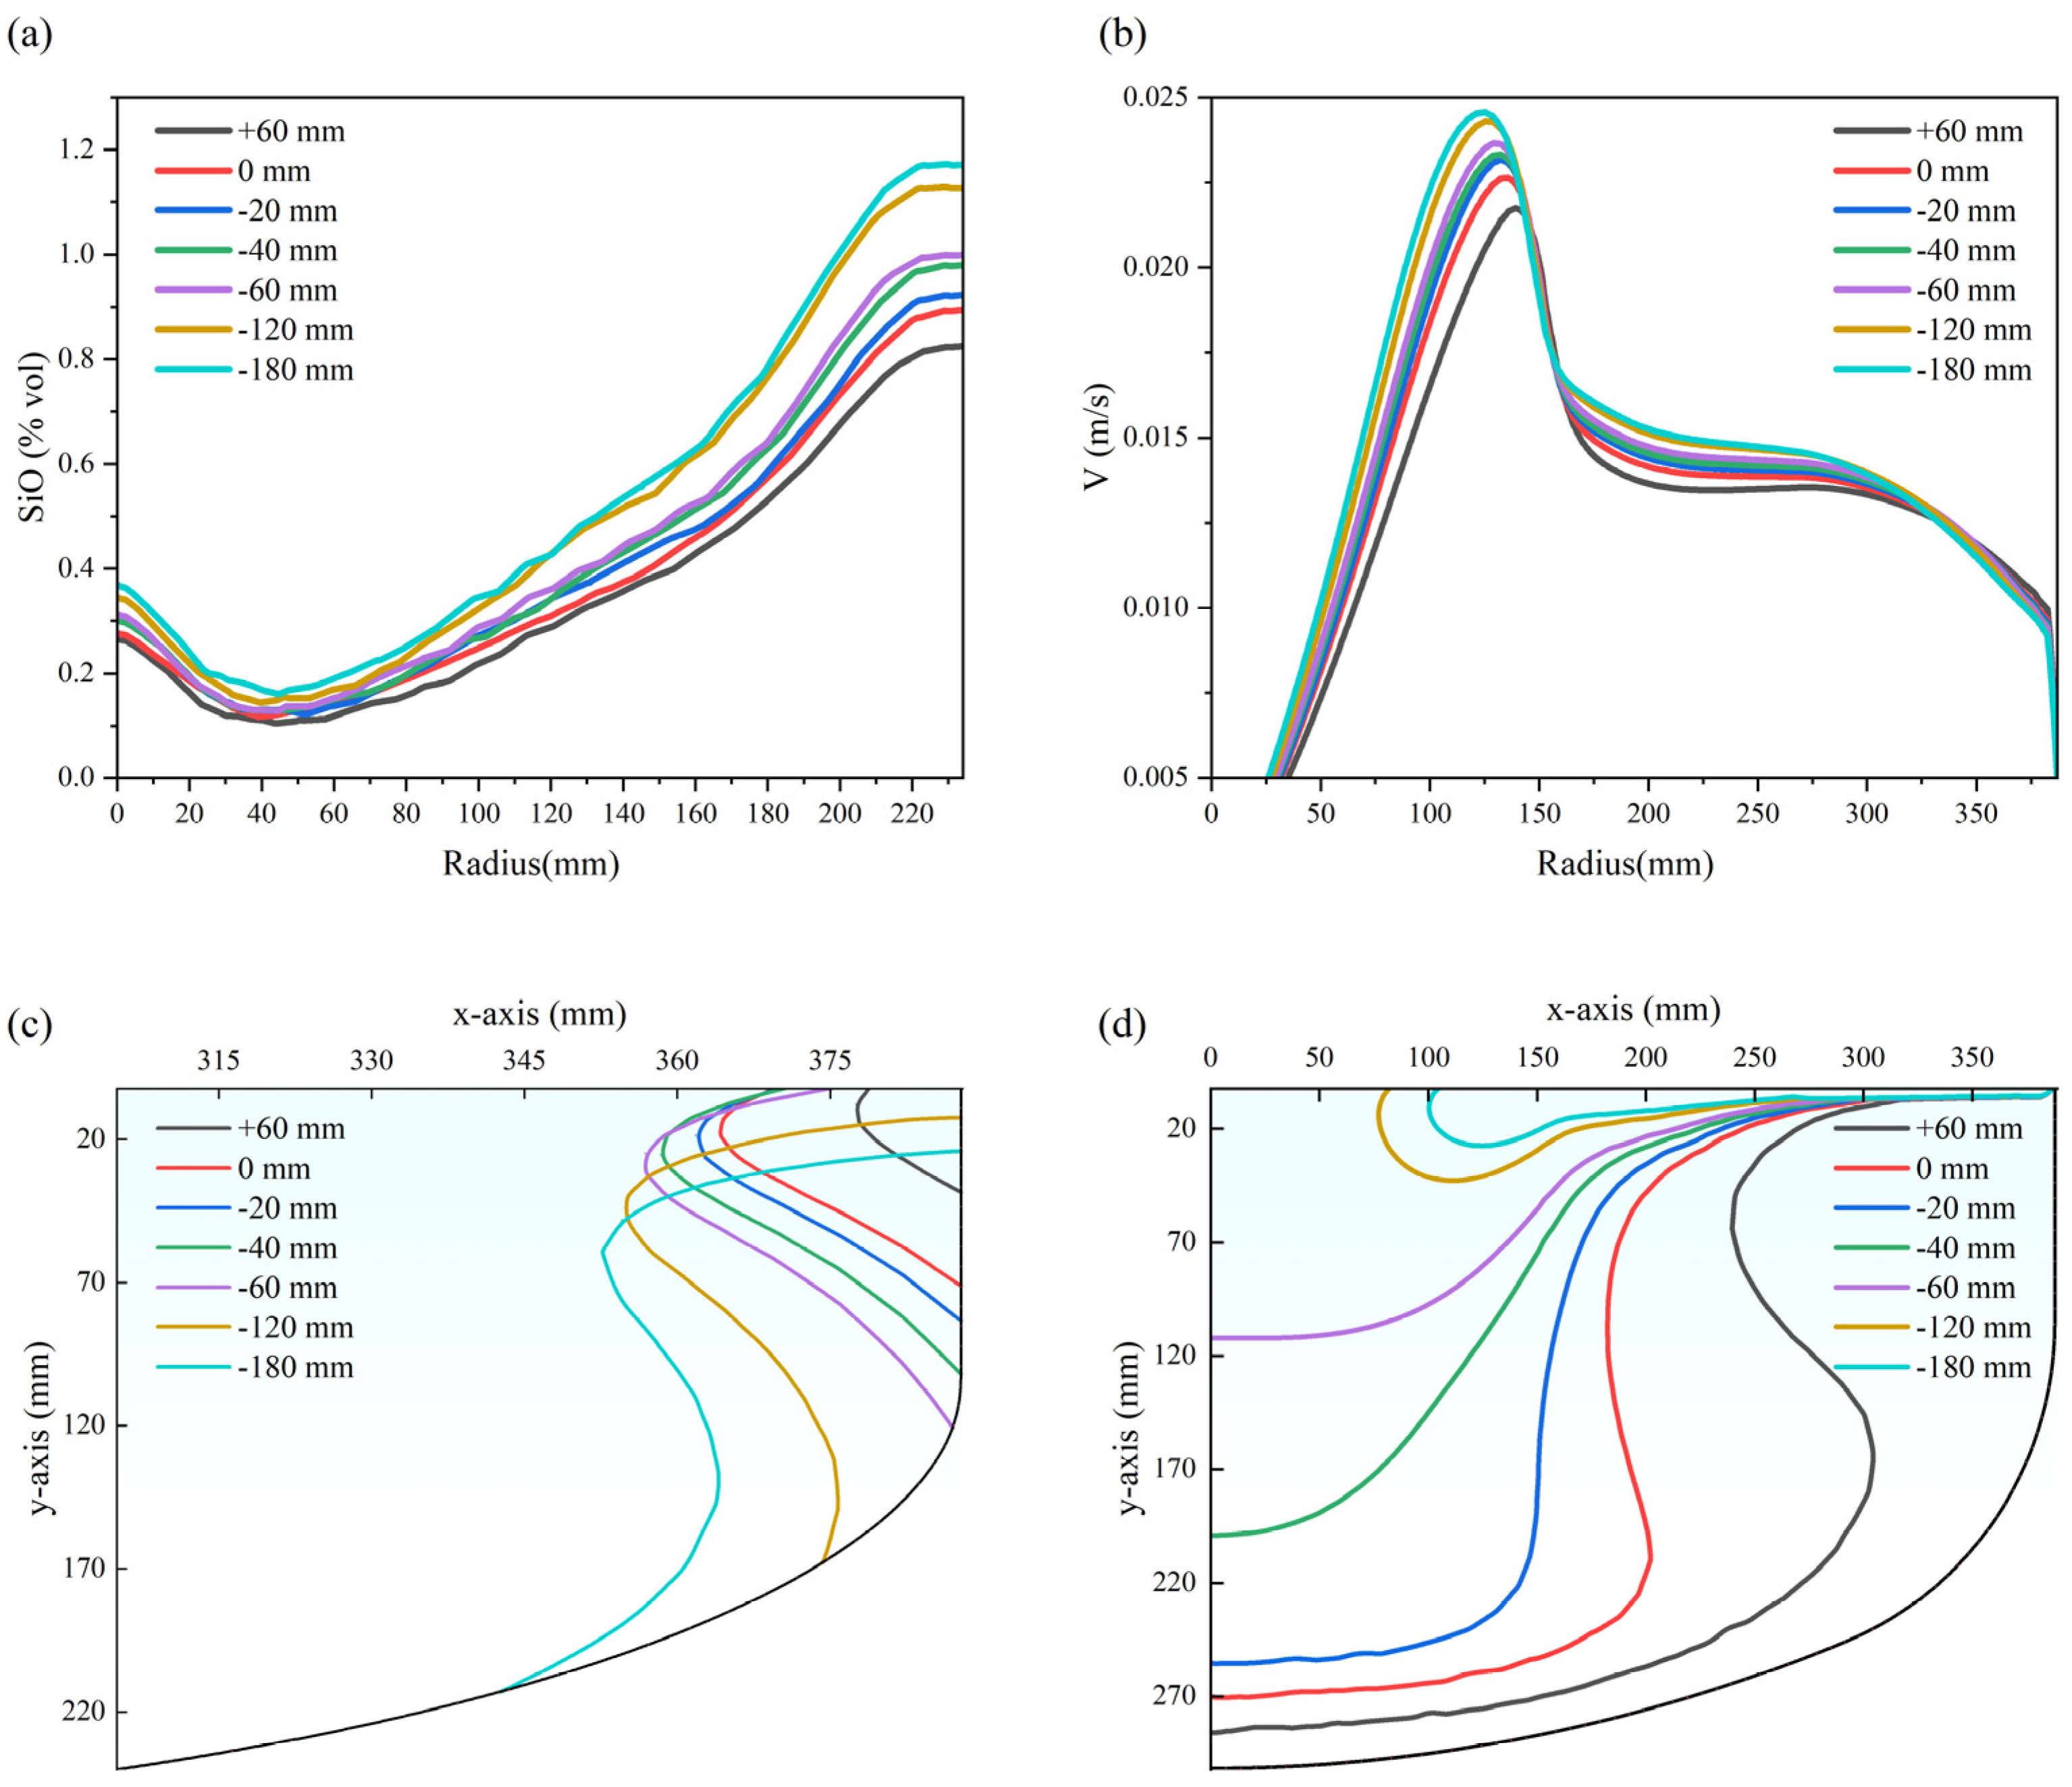
When only the heater position is varied, while the process conditions, heater length, and crystal position remain fixed, the overall melt flow pattern changes insignificantly. To probe local behavior, horizontal probes are used to take measurements 10 mm above and 10 mm below the melt free surface. The upper probe characterizes SiO volatilization (Figure 9a), and the lower probe measures melt flow rate (Figure 9b). We also delineated the high-temperature region in the melt—defined by the T ≥ 1697 K contour and the crucible wall—as shown in Figure 9c. The high-temperature zone generated by adjusting the position of the heater is larger than that generated by shortening the heater. This observation is evident when comparing Figure 9c with Figure 5c. As the heater descends, that high-temperature region shifts downward, expands, and penetrates further into the melt; concurrently, the melt flow rate increases, as verified in Figure 9b. Figure 5d similarly depicts the evolution of the 8 ppma oxygen isoconcentration contour. The trend for heater positions from −180 to +60 mirrors the pattern observed when the heater length is progressively shortened in Section 3.1. In practical crystal growth, these two adjustments can produce complementary effects, which is useful when one parameter is constrained and cannot be altered. However, a change in heater settings that alters oxygen concentration does not imply a directly proportional effect on defect formation in the crystal. If future work demands tighter defect control, targeted studies on how heater-induced oxygen variations influence specific defects will be required.

3.3. Comparison Between Experiments and Simulations

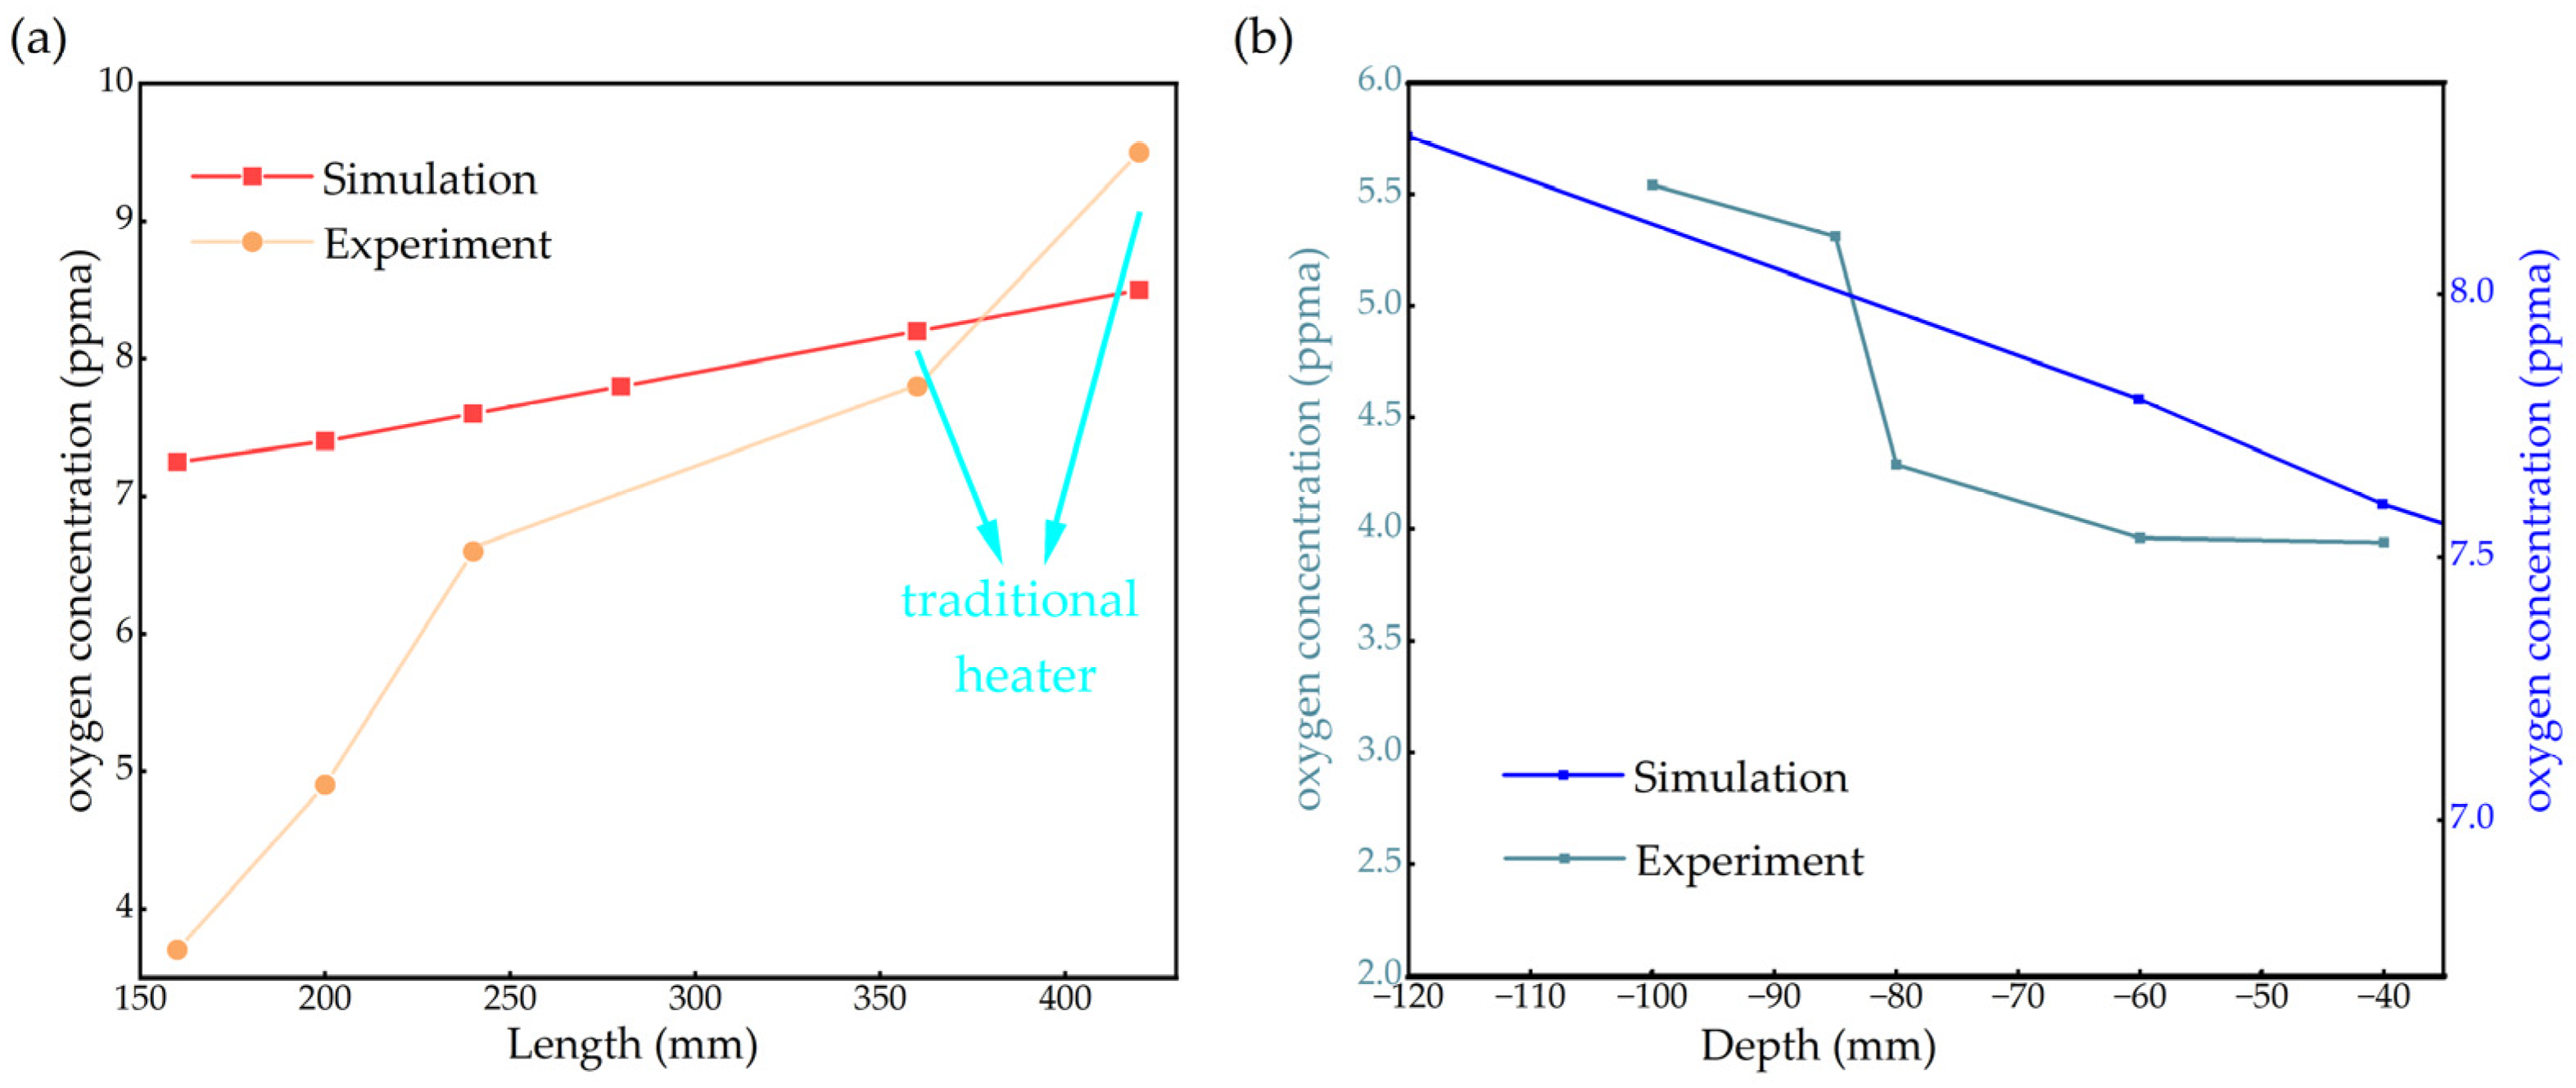
Multiple experiments are conducted with the new short heater, varying its length and vertical position within the simulated gradient range. Figure 10 shows that oxygen concentration declines as the heater is shortened and moved upward; the lowest concentration measured in production falls below 4 ppma. In contrast to the oxygen concentration of 9.5/7.5 ppma observed during crystal growth using traditional heaters, the newly designed heater in this experiment has demonstrated a significantly improved capability for oxygen control. These experimental results closely follow the simulation trends and therefore match our model. Measured oxygen concentrations are slightly lower than the simulated values, which likely reflects idealizations in the software model. Crystal growth is a non-equilibrium process, and the model does not account for partial condensation of oxygen that occurs in practice, a factor that raises oxygen levels on the high side.

4. Conclusions

This study developed a novel short heater and used combined simulation and experimental methods to evaluate its effects on silicon melt temperature and on the oxygen diffusion coefficient in a single crystal furnace. The simulations model these thermal and mass-transport parameters across different heater settings, and experiments verify how the heater’s geometric parameters influence oxygen concentration within single crystal silicon. During heater shortening, two processes act simultaneously. First, the high-temperature region contracts, lowering dissolved oxygen and reducing melt flow rate; this decrease in flow suppresses oxygen diffusion. Second, the reduced melt flow lessens shear stress at the melt-argon interface and thereby inhibits SiO gas evaporation. Overall, the dominant effect is the reduced oxygen concentration within the high-temperature zone. When the heater length is fixed, raising the heater reduces oxygen concentration at the single crystal silicon. Experimental results closely matched the simulations, and the measured oxygen concentration fell below 4 ppma. The simulation predictions were confirmed experimentally. In production, however, heater length and position cannot be altered arbitrarily and must match the established thermal field. The heater’s maximum allowable elevation further constrains positional adjustments, posing a practical limitation that warrants future investigation.

Author Contributions

Conceptualization, Y.L.; methodology, Y.Z.; software, Y.Z. and Z.S.; validation, R.Q. and Y.L.; formal analysis, D.D.; investigation, R.Q. and Z.S.; resources, G.Z.; data curation, Y.Z.; writing—original draft preparation, Y.Z.; writing—review and editing, Y.Z. and D.D.; visualization, D.D.; supervision, G.Z.; project administration, G.Z.; funding acquisition, G.Z. All authors have read and agreed to the published version of the manuscript. All authors have reviewed and approved the final version for final publication.

Funding

This research received no external funding.

Data Availability Statement

The original contributions presented in this study are included in the article. Further inquiries can be directed to the corresponding author.

Conflicts of Interest

Author Yang Li, Yunyun Zhu, Deng Deng, Ruifeng Qin, and Guohu Zhang were employed by the company GRINM Semiconductor Materials Co., Ltd. Zhiyuan Shan was employed by the company Shandong GRINM RS Semiconductor Materials Co., Ltd. The remaining authors declare that the research was conducted in the absence of any commercial or financial relationships that could be construed as a potential conflict of interest.

Abbreviations

The following abbreviations are used in this manuscript:
MCZMagnetic Czochralski
FZFloat Zone
CZCzochralski
CPCrystal Position
RANSReynolds-averaged Navier–Stokes equations

References

  1. Shubham, K.; Gupta, A. Integrated Circuit Fabrication; Taylor & Francis Group: Oxford, UK, 2021. [Google Scholar]
  2. Kao, I.; Chung, C. Wafer Manufacturing Shaping of Single Crystal Silicon Wafers; Wiley: Hoboken, NJ, USA, 2021. [Google Scholar]
  3. Zulehner, W.; Huber, D. Czochralski-Grown Silicon; Springer: Berlin/Heidelberg, Germany; pp. 1–143.
  4. Yatsurugi, Y.; Akiyama, N.; Endo, Y.; Nozaki, T. Concentration, Solubility, and Equilibrium Distribution Coefficient of Nitrogen and Oxygen in Semiconductor Silicon. J. Electrochem. Soc. Solid-State Sci. Technol. 1973, 120, 975–979. [Google Scholar] [CrossRef]
  5. Käshammer, P.; Sinno, T. Interactions of twin boundaries with intrinsic point defects and carbon in silicon. J. Appl. Phys. 2013, 114, 083505. [Google Scholar] [CrossRef]
  6. Maji, R.; Luppi, E.; Capron, N.; Degoli, E. Ab initio study of oxygen segregation in silicon grain boundaries: The role of strain and vacancies. Acta Mater. 2021, 204, 116477. [Google Scholar] [CrossRef]
  7. Schulze, H.J.; Öfner, H.; Niedernostheide, F.-J.; Laven, J.G.; Felsl, H.P.; Voss, S.; Schwagmann, A.; Jelinek, M.; Ganagona, N.; Susiti, A.; et al. Use of 300 mm magnetic Czochralski wafers for the fabrication of IGBTs. In Proceedings of the 2016 28th International Symposium on Power Semiconductor Devices and ICs (ISPSD), Prague, Czech Republic, 12–16 June 2016; pp. 355–358. [Google Scholar]
  8. Iwamuro, N.; Laska, T. IGBT History, State-of-the-Art, and Future Prospects. IEEE Trans. Electron Devices 2017, 64, 741–752. [Google Scholar] [CrossRef]
  9. Kajiwara, K.; Harada, K.; Torigoe, K.; Hourai, M. Oxygen Precipitation Properties of Nitrogen-Doped Czochralski Silicon Single Crystals with Low Oxygen Concentration. Phys. Status Solidi (A) 2019, 216, 1900272. [Google Scholar] [CrossRef]
  10. Dezfoli, A.R.A.; Adabavazeh, Z. Adjustment of oxygen transport phenomena for Czochralski silicon crystal growth. Heliyon 2024, 10, e29346. [Google Scholar] [CrossRef]
  11. Zhang, W.; Gao, D.; Wang, S.; An, Y.; Wu, H.; Lin, H.; Hou, L. Simulation of oxygen and carbon impurity transport during magnetically controlled Czochralski silicon growth. AIP Adv. 2025, 15, 015103. [Google Scholar] [CrossRef]
  12. Liu, P.; Hu, Z.; Yang, Y.; Li, H.; Li, X.; Sun, Z.; Guo, J.; Yang, D.; Yu, X. Reduction of oxygen concentration in 300 mm diameter n-type Czochralski silicon crystal growth by optimized heating zone with dual side-heaters. CrystEngComm 2024, 26, 3920–3928. [Google Scholar] [CrossRef]
  13. Zhao, L.; Li, T.; Huang, Z.; Zhou, X.; Kang, J.; Ma, W.; Li, S.; Lv, G.; Ren, Y. Effect of heater structure on oxygen concentration in large diameter n-type Czochralski silicon study using numerical simulation. Appl. Therm. Eng. 2024, 257, 124334. [Google Scholar] [CrossRef]
  14. Zhong, Z.; Li, J.; Qi, C.; Li, D.; Li, Z.; Liu, L. Effect of water-cooled jacket emissivity on the melt-crystal interface and oxygen in the Czochralski silicon crystal growth. J. Cryst. Growth 2025, 667, 128282. [Google Scholar] [CrossRef]
  15. Zhao, B.; Zheng, J.; Li, M.; Ma, T. Numerical simulation and design of superconducting cusp magnet for 400 mm Magnetic-field-applied Czochralski (MCZ) single crystal silicon growth. Phys. C Supercond. Appl. 2025, 634, 1354721. [Google Scholar]
  16. Zou, Q.; Sheng, W.; Chen, W.; Rui, Y.; Ni, H.; Ma, Y.; Wang, Z.; Luo, X.; Huang, L. Effect of horizontal magnetic field position on oxygen distribution in CZ silicon crystal growth. Vacuum 2024, 225, 113271. [Google Scholar] [CrossRef]
  17. Cen, X.; Guo, S. Three-Dimensional Simulation of Melt Convection and Oxygen Transport in CZ-Si Crystal Growth with Cusp Magnetic Fields. Crystals 2023, 13, 1436. [Google Scholar]
  18. Xiao, Z.; Wan, X.; Ma, W.; Yang, S. Effects of Heater and Insulation Ring Designs on Oxygen Content of Large-Diameter Silicon Grown by Czochralski Method. Silicon 2025, 17, 1747–1756. [Google Scholar] [CrossRef]
  19. Zhou, B.; Chen, W.; Li, Z.; Yue, R.; Liu, G.; Huang, X. Reduction of oxygen concentration by heater design during Czochralski Si growth. J. Cryst. Growth 2018, 483, 164–168. [Google Scholar] [CrossRef]
  20. Dezfoli, A.; Ansari, A.R. Engineering Insights into Heater Design for Oxygen Reduction in CZ Silicon Growth. Case Stud. Therm. Eng. 2024, 65, 105596. [Google Scholar] [CrossRef]
  21. Kang, J.; Tan, M.; Huang, Z.; Li, T.; Zhou, X.; Lv, G.; Yang, X.; Ma, W. Effect of gap design of a double-layer heater on melt flow behavior in a single-crystal furnace. J. Appl. Crystallogr. 2025, 58, 832–844. [Google Scholar]
  22. Kondratyev, A.; Demina, S.; Smirnov, A.; Kalaev, V.; Ratnieks, G.; Kadinski, L.; Sattler, A. 3D unsteady and steady modeling of heat and mass transfer during Cz Si crystal growth with a horizontal magnetic field. Int. J. Heat Mass Transf. 2021, 178, 121604. [Google Scholar] [CrossRef]
  23. Borisov, D.; Artemyev, V.; Kalaev, V.; Smirnov, A.; Kuliev, A.; Zobel, F.; Kunert, R.; Turan, R.; Aydin, O.; Kabacelik, I. Advanced approach for oxygen transport and crystallization front calculation in Cz silicon crystal growth. J. Cryst. Growth 2022, 583, 126493. [Google Scholar] [CrossRef]
  24. Spalart, P.R.; Allmaras, S.R. A One-Equation Turbulence Model for Aerodynamic Flows. Rech. Aérosp. 1994, 1, 5–21. [Google Scholar]
  25. Smirnov, A.D.; Kalaev, V.V. Development of oxygen transport model in Czochralski growth of silicon crystals. J. Cryst. Growth 2008, 310, 2970–2976. [Google Scholar] [CrossRef]
  26. Teng, Y.-Y.; Chen, J.-C.; Lu, C.-W.; Huang, C.-C.; Wun, W.-T.; Chen, H.-I.; Chen, C.-Y.; Lan, W.-C. Numerical Simulation of the Effect of Heater Position on the Oxygen Concentration in the CZ Silicon Crystal Growth Process. Int. J. Photoenergy 2012, 2012, 1–6. [Google Scholar] [CrossRef]
Figure 1. CP = 1000 mm and CP = 450 mm single crystal silicon growth model and grid division situation (main image); heater length and position sampling schematic diagram (small image).
Crystals 16 00045 g001
Figure 2. When the crystal position is located at CP = 450 mm, the oxygen concentration and oxygen diffusion flux (left), as do the temperature and convection of the silicon melt in the quartz crucible during the operation of the heater with different lengths (right): (a) 80 mm, (b) 120 mm, (c) 160 mm, (d) 200 mm, (e) 240 mm, (f) 280 mm, (g) 360 mm, (h) 420 mm, (i) 460 mm.
Crystals 16 00045 g002
Figure 3. Relationship between the surface temperature of the quartz crucible and the length of the heater (a) CP = 450 mm and (b) CP = 1000 mm.
Crystals 16 00045 g003
Figure 4. At crystal growth positions (a) 450 mm and (b) 1000 mm, the oxygen concentration at the solid–liquid interface of single crystal silicon during growth varies with the length of the heater.
Crystals 16 00045 g004
Figure 5. At the CP = 450 mm position, (a) the change in SiO gas concentration 10 mm above the free surface of the silicon melt in the crucible, (b) the change in melt flow rate 10 mm below the free surface, (c) the change in the 1697 K isothermal line, (d) the change in the 8 ppma oxygen isoconcentration line changing with the length of the heater.
Crystals 16 00045 g005
Figure 6. The oxygen concentration and oxygen diffusion flux (left), temperature and convection (right) of the silicon melt in the quartz crucible when the crystal position is located at 450 mm and the heater is at different positions: (a) + 60 mm, (b) 0 mm, (c) −20 mm, (d) −40 mm, (e) −60 mm, (f) −120 mm, (g) −180 mm, respectively.
Crystals 16 00045 g006
Figure 7. Relationship between the surface temperature of the quartz crucible and the position of the heater (a) CP = 450 mm and (b) CP = 1000 mm.
Crystals 16 00045 g007
Figure 8. The crystal growth positions are 450 mm (a) and 1000 mm (b), respectively, and the oxygen concentration at the solid–liquid interface of single crystal silicon growth varies with different heater positions.
Crystals 16 00045 g008
Figure 9. At the CP = 450 mm position, (a) the change in SiO gas concentration 10 mm above the free surface of the silicon melt in the crucible, (b) the change in melt flow rate 10 mm below the free surface, (c) the change in the 1697 K isothermal line, (d) the change in the 8 ppma oxygen isoconcentration line changing with the heater position.
Crystals 16 00045 g009
Figure 10. Oxygen concentration curves in experiments and simulations, (a) for different heater lengths, (b) for different heater positions.
Crystals 16 00045 g010
Disclaimer/Publisher’s Note: The statements, opinions and data contained in all publications are solely those of the individual author(s) and contributor(s) and not of MDPI and/or the editor(s). MDPI and/or the editor(s) disclaim responsibility for any injury to people or property resulting from any ideas, methods, instructions or products referred to in the content.