Article

Colorimetric Properties and Classification of “Tang yu”

1
Institute of Nature & Culture, China University of Geosciences, Beijing 100083, China
2
School of Gemmology, China University of Geosciences, Beijing 100083, China
3
Asian Institute of Gemological Sciences (China), Shenzhen 518019, China
*
Author to whom correspondence should be addressed.
Crystals 2025, 15(9), 817; https://doi.org/10.3390/cryst15090817
Submission received: 23 August 2025 / Revised: 14 September 2025 / Accepted: 16 September 2025 / Published: 18 September 2025
(This article belongs to the Collection Topic Collection: Mineralogical Crystallography)

Abstract

This study quantitatively analyses how light sources, polishing methods, and backgrounds affect the color of “Tang yu”. Twenty-four samples were tested with three different light sources (D50, A, D65), two polishing methods, and nine Munsell neutral gray backgrounds. Testing 24 samples revealed that main coloring elements exhibit low concentrations with no linear relationship to color intensity. Light sources selectively alter chromaticity: D65 maintains color balance (recommended for grading), while A enhances red tones. Polishing methods significantly impact color perception, with glassy polishing markedly increasing Lightness (L*↑11.41%) and Chroma (C*↑42.11%) while shifting hues toward red-yellow. Background luminance (γb) critically influences color results: Lightness L* and Chroma C* increase via distinct power functions as γb rises, though Hue angle () remains stable. Sample color can be predicted through γb based equations, with Munsell N9 background proving optimal for grading. Cluster and discriminant analyses effectively classified colors into three distinct groups, establishing a foundation for a reliable grading system.

1. Introduction

Nephrite, revered as the foremost of China’s Four Great Famous Jades, boasts a venerable history spanning over eight millennia and serves as a pivotal vessel for the jade culture of the Chinese nation [1]. Nephrite is mainly made up of minerals from the tremolite-actinolite solid solution series within the amphibole group, with tremolite being its dominant component. This unique mineral structure imparts the nephrite its characteristically fine texture and a soft, greasy luster. In terms of coloration, nephrite displays a rich spectrum of hues, categorized chiefly into “Bai yu”, “Qing yu”, “Qingbai yu”, “Bi yu”, “Huang yu”, “Mo yu”, “Cui qing yu” and “Tang yu” [2,3]. Renowned for its exceptional toughness and considerable hardness, nephrite was extensively utilized in early human civilization not only for crafting tools and weaponry but also, owing to its subtly lustrous and refined texture, became imbued with profound cultural significance. Gradually, it evolved into a vital medium embodying moral ideal, social hierarchy, and symbols of authority. This dual nature—practical utility intertwined with cultural symbolism—has cemented nephrite’s irreplaceable position as the cornerstone of jade culture, both in China and globally. In 1990, a joint archaeological team from the Henan Provincial Institute of Cultural Relics and Archaeology and the Sanmenxia City Cultural Relics Task Force excavated 378 nephrite artefacts from Tomb M2009 at the Guo State Cemetery—a high-status aristocratic burial site dating to the Western Zhou dynasty (c. 1046–771 BCE) [4]. Nephrites are found worldwide, including in Canada [5], Xinjiang province of China [6,7,8], Russia [9], New Zealand [10,11,12,13], Taiwan province of China [14], Korea [15,16,17], Poland [18,19], and the United States [20]. Currently, there is no unified consensus on the genetic types of the nephrite primary deposits. Scholars typically propose different classification schemes based on the geological occurrence of nephrite, the source of the mineralization materials, and the mineralization mechanisms.
Regarding the coloration of “Tang yu”, Wang Shiqi et al. [21] propose that the sugar color from ferric oxide (Fe2O3)-rich solutions permeating along micro-fractures and intergranular boundaries within the nephrite matrix under surface oxidation conditions, representing a secondary coloration mechanism. Liu Yicen et al. [22] investigated the differential coloration mechanisms between “Huang yu” and “Tang yu” in tremolite jade. Their research demonstrates that the coloration characteristic of “Tang yu” is generated through a combination of Fe3+’s term transitions (6A14E(D) and 6A14T2(D)) and the Jahn-Teller distortion effects of Mn3+. Han Wen [23] conducted a study on the coloring mechanism of “Tang yu”. The results showed that there is a positive link is observed with the Fe content in its chemical composition hue of “Tang yu”. The deeper the color, the higher the Fe content. Fe is distributed in the form of independent iron-bearing minerals between the tremolite particles and micro-cracks. Therefore, it is widely accepted that the coloring element for “Tang yu” is a secondary color, with Fe being the primary coloring element; however, the specific form in which Fe exists still needs to be determined. Therefore, previous authors’ research on “Tang yu” mainly focused on the coloring elements and causes of coloring, without conducting quantitative analysis of the color or studying other factors that affect the color of this material.
The visual color appearance of minerals is the result of the combined effect of multiple factors, including their selective absorption of light at specific wavelengths, chemical composition, sample thickness and optical path length (based on the Beer-Lambert law), different illumination [24], different background condition [25], and Visual perception [26]. For example, under different light sources, garnet can shift from red to green. By jewelry quality evaluation requirements, the national standard GB/T 20146-2006 [27], and the need for uniform lighting, We selected three illumination sources—D65 (6500 K), D50 (5003 K), and A (2856 K)—to investigate their influence on the color appearance of ‘Tang yu’. Munsell N1 to N9 color charts were used as backgrounds to examine the effects of the surrounding environment.
The application of colorimetry in gemology has grown significantly in recent years. Studies employing these methods have explored the color genesis of various gemstones, including jadeite [28], garnet [29], and sapphire [30]. In contrast, factors affecting nephrite’s color have received much less attention. In this paper, we discuss the coloring mechanism of “Tang yu” and examine the effects of light source, background, and polishing process on color perception. Additionally, we establish a color evaluation system for “Tang yu” using cluster analysis.

2. Materials and Methods

2.1. Materials

We selected 24 “Tang yu” samples, each measuring 8×10 mm in elliptical convex shape and 5 mm in thickness, with variations in hue, lightness, and chroma. The color ranges from light yellow to dark brown, transparency from semi-transparent to opaque, and specific gravity from 1.92 to 2.98. The samples are labelled sequentially as QM-1, QM-2, QM-3, …, QM-23, QM-24. All samples underwent two types of polishing treatments. Figure 1 displays the samples.

2.2. Methods

2.2.1. UV-Vis Spectroscopy

At the Gem Identification Laboratory of the Gemological Institute, China University of Geosciences (Beijing), the light absorption spectra were measured at room temperature using a UV-3600 UV-Vis-NIR spectrophotometer (Shimadzu, Tokyo, Japan), within the wavelength range of 300 to 800 nm. The specular reflection method was employed. The scan speed was set to medium, with a time constant of 0.1 s. The light source wavelength is converted at 300 nm, while the detector and grating wavelengths are both converted at 850 nm, with the S/R inverted.

2.2.2. X-Ray Fluorescence

The chemical composition of “Tang yu” was analyzed using an energy dispersive X-ray fluorescence spectrometer (EDXRF) model EDX-7000 (Shimadzu, Tokyo, Japan), at the Gem Identification Laboratory of the Gemological Institute, China University of Geosciences (Beijing). The basic principle of the experiment is that high-speed electrons emitted from the cathode strike the anode, generating X-rays. The energy differences required for electron transitions in different elements are distinct, allowing for the identification of characteristic elements. The conditions are as follows: Vacuum, 1000 µA, a 1 mm collimator, duration 60 s.

2.2.3. CIE1976 L*a*b* Uniform Color Space System

The CIE 1976 L*a*b* color space is extensively utilized for the quantitative analysis and measurement of color, and has been endorsed by the International Commission on Illumination (CIE). The color model consisting of the chromatic parameters a*, b*, and lightness L*. The lightness L* Illustrates the brightness of the color, with a range of (0–100), symbolizes from white to black. The color parameter a* signifies the degree of redness and—a* signifies the degree of greenness. The color parameter +b* represents yellowness and—b* represents blueness.
C*ab represents the chroma value of the color, while the hue angle ab represents the angle of rotation counterclockwise from the +a* axis, used to indicate the color type. The chroma C*ab and hue angle ab can be calculated by a* and b* according to Formulas (1) and (2).
C a b * = a * 2 + b * 2 1 / 2
h ° a b = a r c t a n b * a *
The method employed to calculate the color difference of ‘Tang yu’ samples is the CIE DE2000 (ΔE00), which offers improved visual uniformity in comparison to the CIE LAB (ΔEab*)) formula. The expression for this is as follows:
E 00 = L k L S L 2 + C k C S C 2 + H k H S H 2 + R T C k C S C 2 H k H S H 1 / 2
In this equation, ΔL, ΔC, and ΔH denote the differences in brightness, chroma, and hue angle, respectively, between two sets of color data. The RT function is employed to minimize the interdependence between hue angle and chroma in the blue region. KL, KC, and KH are calibration parameters designed for environmental conditions, corresponding to the CIE DE2000 (1:1:1) [31] and CIE DE2000 (2:1:1) [32]. The correction factors that designed to address the visual uniformity limitations inherent in the CIE L*a*b* formula are SL, SC, and SH. Due to its superior sensitivity in assessing color differences, CIE DE2000 (1:1:1) was utilized in this study.

2.2.4. Colorimetric Analysis

The color parameters of 24 “Tang yu” samples were measured using the X-Rite SP62 handheld spectrophotometer (X-Rite, Grand Rapids, MI, USA) at the Gem Identification Laboratory of the Gemological Institute, China University of Geosciences (Beijing). Under the D65 light source, measurements were taken at centrally located, clear and uniform regions of each sample, using a 4 mm diameter. The testing conditions were in reflection mode with a 2° viewing angle. The measurement range was 400–700 nm, excluding specular reflection. The final color measurements are obtained by averaging the results of three tests. The Munsell neutral gray scale is a fan chart of gray tones, with values spanning from 0.5 to 9.5 in quarter-step intervals. It is commonly employed for the calibration of instruments, conducting imaging evaluations, or serving as a reference standard. In this study, we used nine gray Munsell neutral values (glossy variants), designated as N1, N2, N3, N4, N5, N6, N7, N8, N9, as the test background. Their luminance factors (γb) are 1.210%, 3.126%, 6.555%, 12.000%, 19.770%, 30.050%, 43.060%, 59.100%, and 78.660%, respectively. This experiment used a standard light box equipped with light sources having different correlated color temperatures (CCT) and spectral power distributions. Three standard light sources were selected for the study: A light source (CCT 2856 K), D65 light source (CCT 6504 K), and D50 light source (CCT 5003 K), each with distinct spectral characteristics.
K-means clustering is an iterative algorithm used for cluster analysis, where the number of clusters (k) is predefined. The process involves initially dividing the dataset into k groups, selecting k random objects as initial cluster centers, and then calculating the distance between each data point and each cluster center. Each point is assigned to the closest cluster center. Fisher discriminant analysis, a linear method based on variance analysis, is a commonly employed technique for discriminant analysis.

3. Results and Discussion

3.1. Chemical Analysis

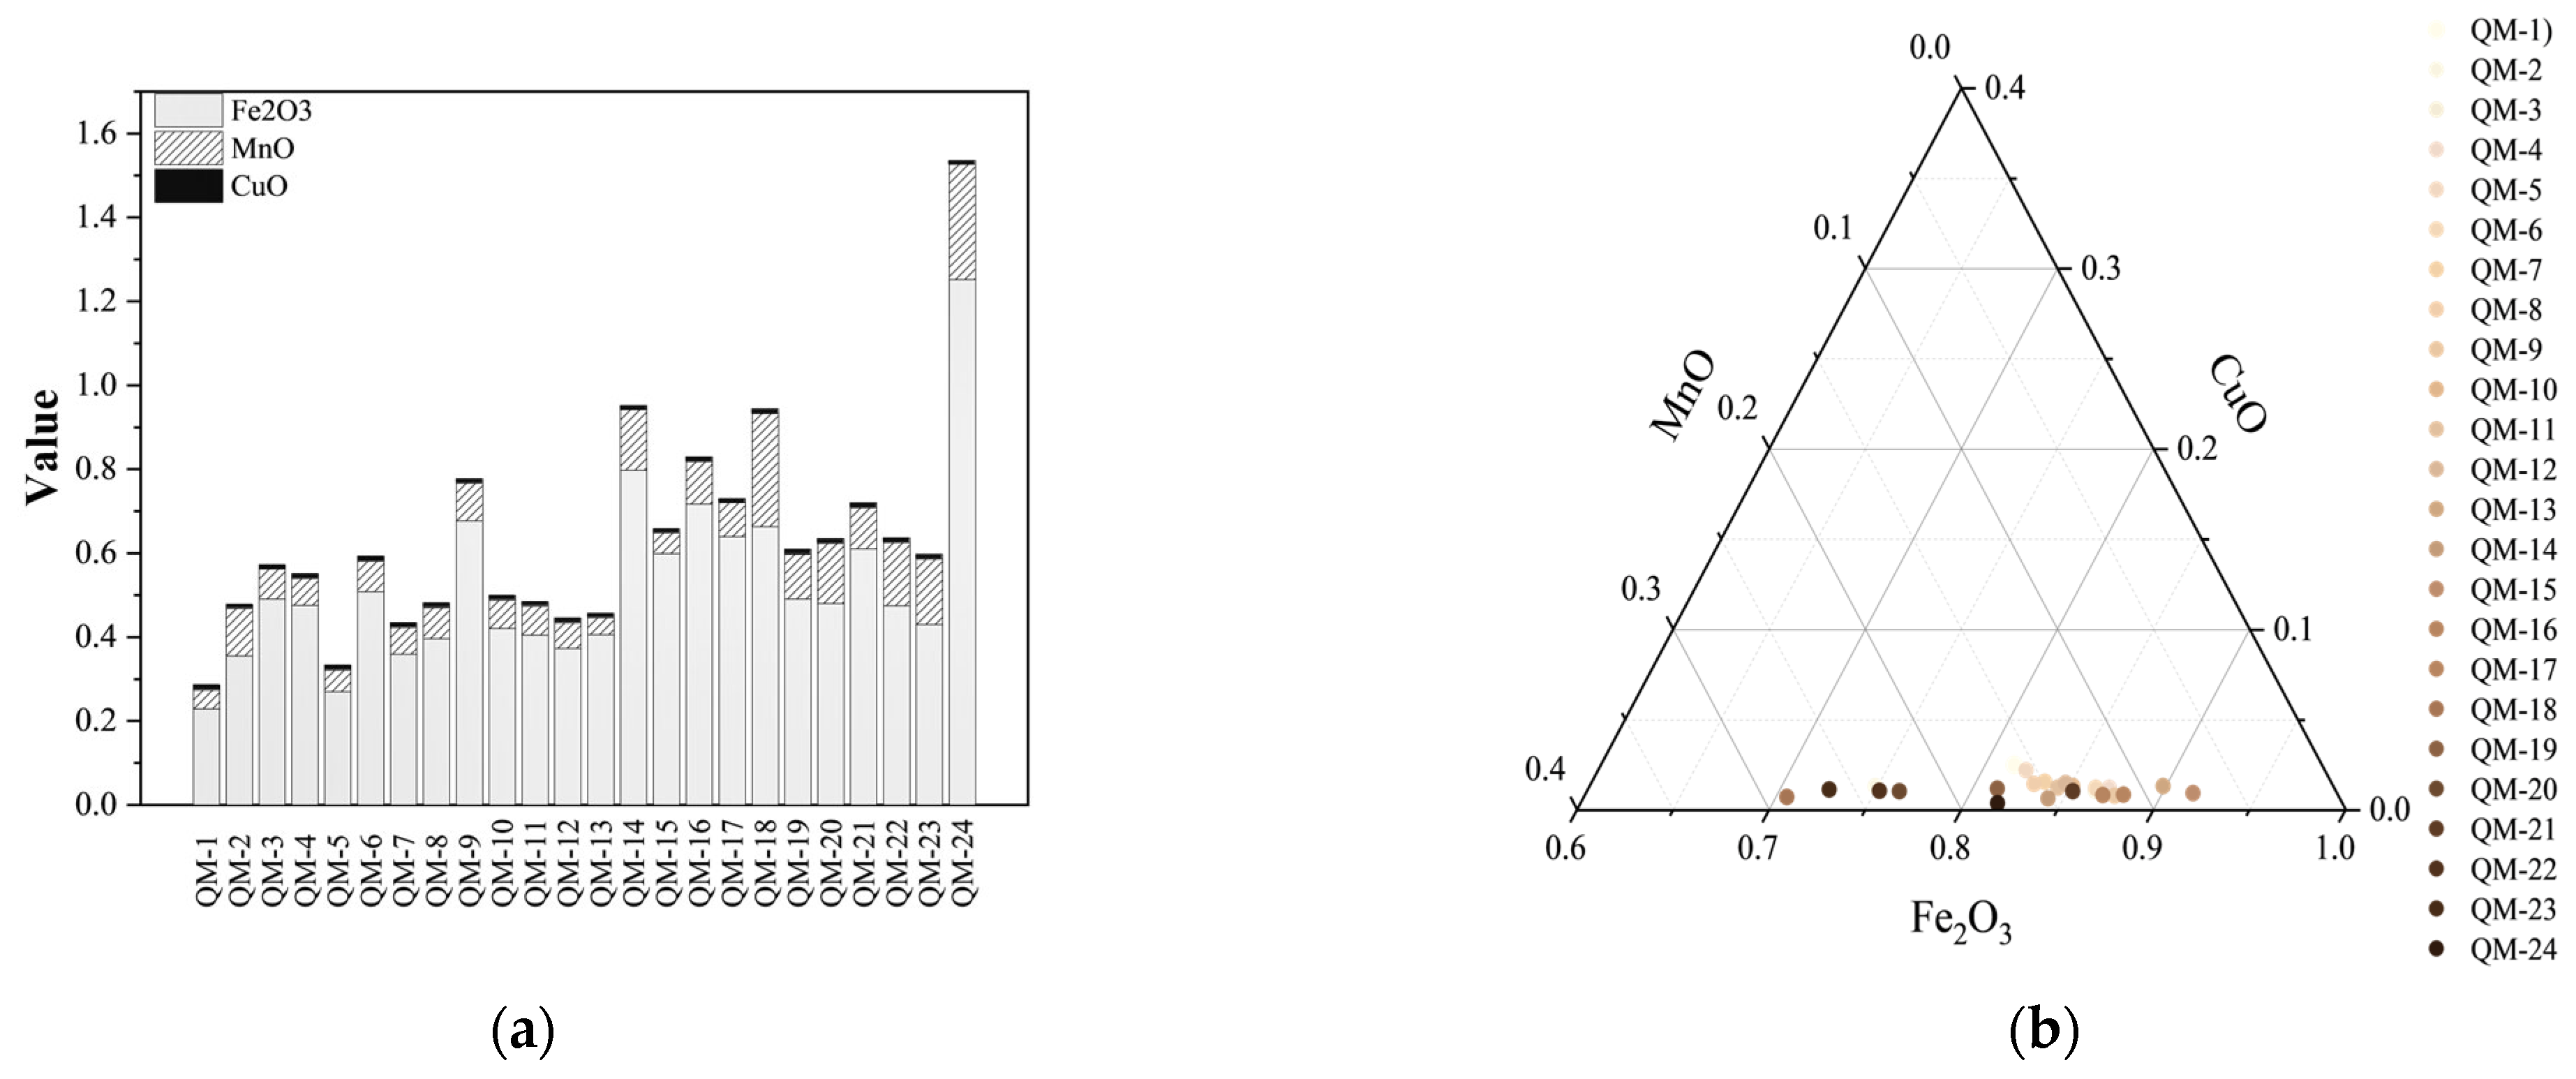
Energy dispersive X-ray fluorescence (ED-XRF) was used to analyze each of the 24 “Tang yu” samples, which exhibited obvious color differences in a sugar-colored gradient series. The composition for each sample was determined based on a single analysis point. The results of the test are presented in Table 1, which indicate that the chemical composition of the sample matches the theoretical chemical structure of tremolite, Ca2Mg5[Si4O11]2(OH)2. The main components are SiO2, MgO, CaO, with a mass ratio of MgO:CaO:SiO2 reaching 1:0.6246:2.3762, and the atomic ratio of Ca:Mg reaching 1:2.227 [33]. The secondary components include CuO, MnO, Fe2O3, etc. The chromogenic elements Fe and Mn, which typically impart coloration to “Tang yu”, are present in relatively low concentrations. Analysis of Fe2O3, MnO, and CuO content reveals a general trend: as Fe and Mn concentrations increase, the “Tang yu” coloration intensifies (Figure 2). However, the relationship between these elemental abundances and color depth is not strictly linear. Key observations include: Samples with similar hues show significant compositional variation (e.g., QM-13 vs. QM-14). Specimens with comparable Fe content exhibit divergent coloration (e.g., QM-3 vs. QM-19). Some deeper-colored samples have lower Fe/Mn levels than lighter ones (e.g., QM-14 vs. QM-23). This non-linear correlation aligns with prior studies. The non-linear relationship between Fe/Mn concentrations and color intensity may be attributed to: (1) Isomorphous Substitution Effect: Fe2+ often substitutes for Mg2+ in an isomorphous manner [34]; (2) Physical Morphology Influence: The aggregation state and particle size distribution of iron oxides/hydroxides significantly modulate coloration [35]; (3) Multivalent Synergy: Coexistence of Fe2+/Fe3+ and Mn2+/Mn3+ redox pairs [34] creates variable color manifestations depending on their relative concentration ratios; (4) Crystal Defect Effects: Identical iron oxides may display different colorations due to variations in dopant concentrations and defect types within the crystal structure [35], explaining hue disparities among chemically similar samples; (5) Oxide Type Differences: In different samples, iron may exist in various oxide forms, such as hematite (Fe2O3), goethite (α-FeOOH), etc. Variations in the type and relative content of these oxides can lead to color diversity [34].

3.2. UV-Vis-NIR Spectroscopy

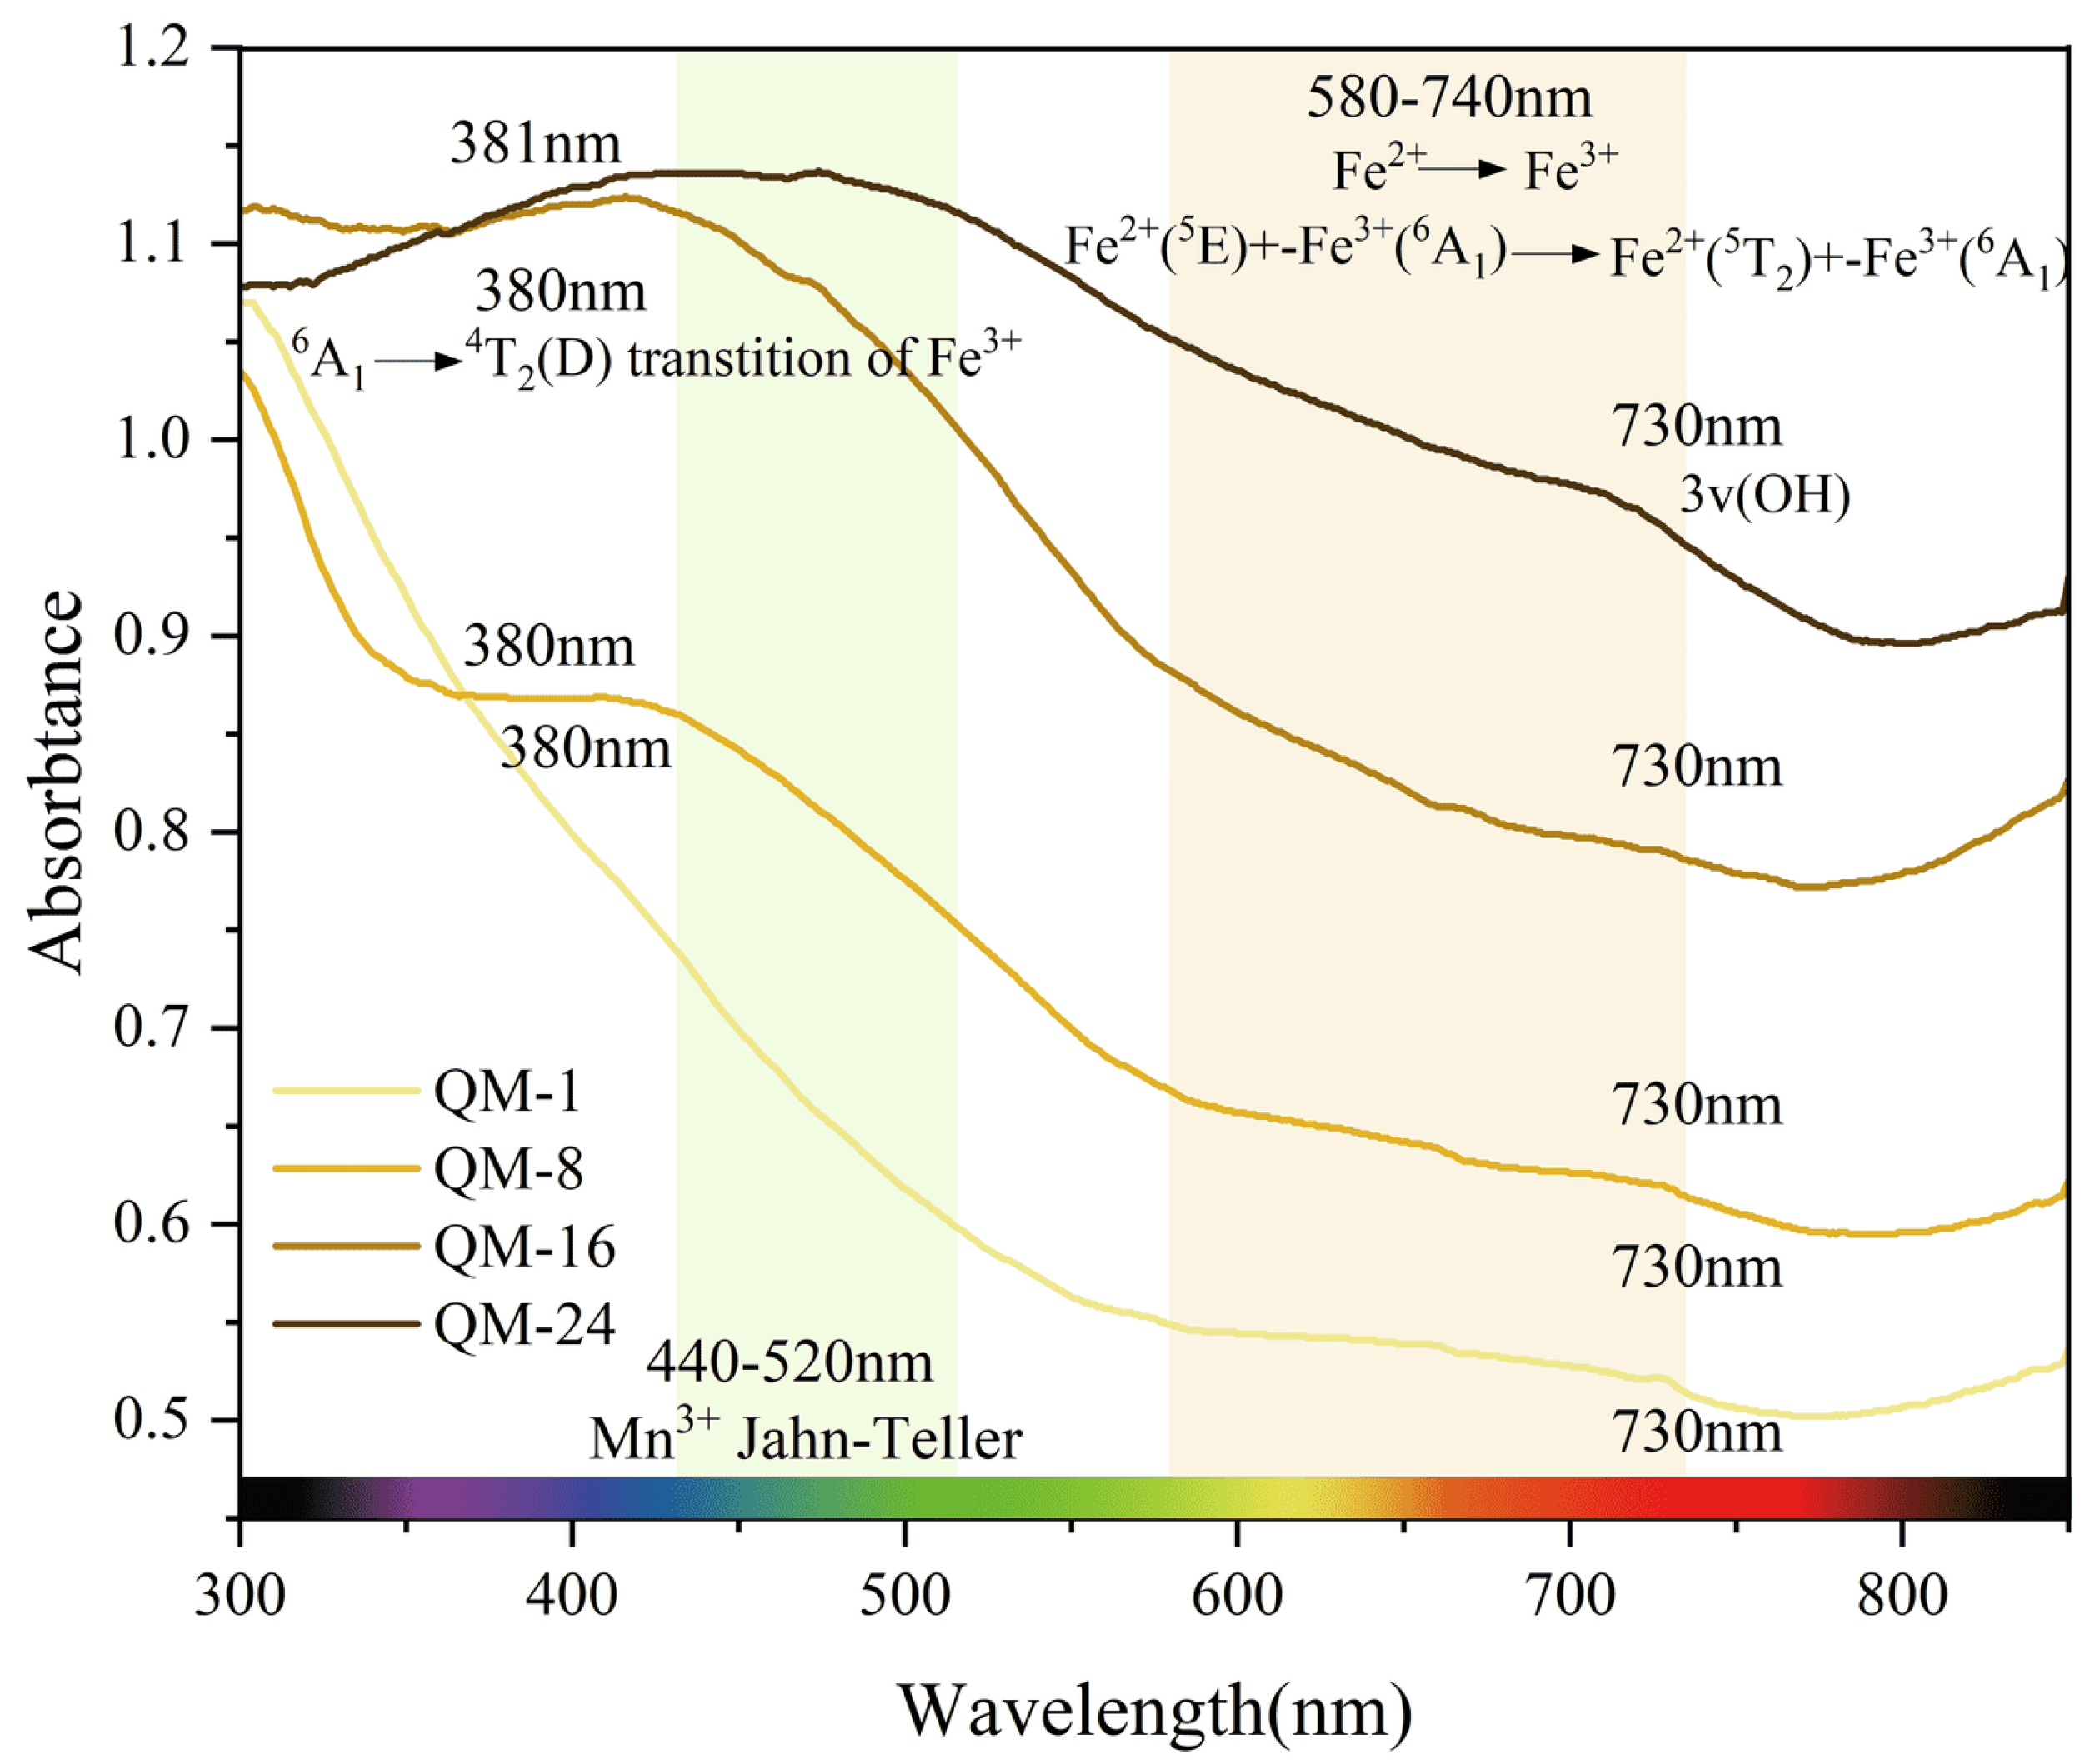
The UV-Vis-NIR spectra of the samples were recorded within the 300–800 nm wavelength range (Figure 3).
A broad absorption band begins at 412 nm, with absorbance positively correlated with sample color intensity. Characteristic peaks appear at 380 nm (violet), 440–520 nm (blue green), 580–740 nm (red), and 730 nm (near-infrared). The sugar-like appearance is a result of specific spectral properties: strong yellow-green absorption, paired with red-orange reflection and moderate blue-violet absorption.
Based on the above analysis, the coloration of “Tang yu” is likely attributed to the presence of Fe and Mn. The light absorption caused by these transition metal ions is the fundamental reason for its distinctive color.
According to crystal field theory, Fe3+ and Mn2+ share the same d-electron configuration (3d5). The ground state term of Fe3+ has a spin multiplicity of 6, while all excited-state terms have a multiplicity of 4. Due to the spin-selection rule, only low-intensity absorption bands are permitted.
The absorption peak at 380 nm in the blue-violet region can be attributed to the 6A14T2(D) electronic transition [36,37].
Mn3+ has a 3d4 electron configuration in its d-orbital. Since the 3d4 configuration in an octahedral field can induce a strong Jahn-Teller effect, the coordination polyhedron becomes distorted, resulting in a distorted coordination polyhedron and the appearance of absorption bands between 440 and 520 nm [22,38,39,40]. Therefore, UV-Vis spectroscopy suggests that Mn3 may also influence the coloration of “Tang yu”.
The absorption band observed in the range of 580–740 nm is commonly ascribed to the Fe2+ → Fe3+ charge transfer [41]. However, some scholars contend that this band results from the combined influence of Fe2+ (5T2) + Fe3+ (6A1) → Fe2+ (5E) + Fe3+ (6A1), as proposed by Taran et al. (2005) [42] and Sargolzaei & Ataee (2011) [43]. Liu Yicen (2021) [22], Wang Jiawei (2018) [44] and Yuan xinqiang (2003) [45] argue that the creation of this absorption band can be attributed to the interplay of both mechanisms, a perspective that is also supported by the findings of this study.
Additionally, Wilkins et al. (2003) propose that the relatively weak sharp peak at 730 nm can be assigned to the third harmonic vibration of hydroxyl groups [10].
Table 2 shows the UV-Vis absorption peaks present in the samples and their corresponding assignments.

3.3. Color Quantification

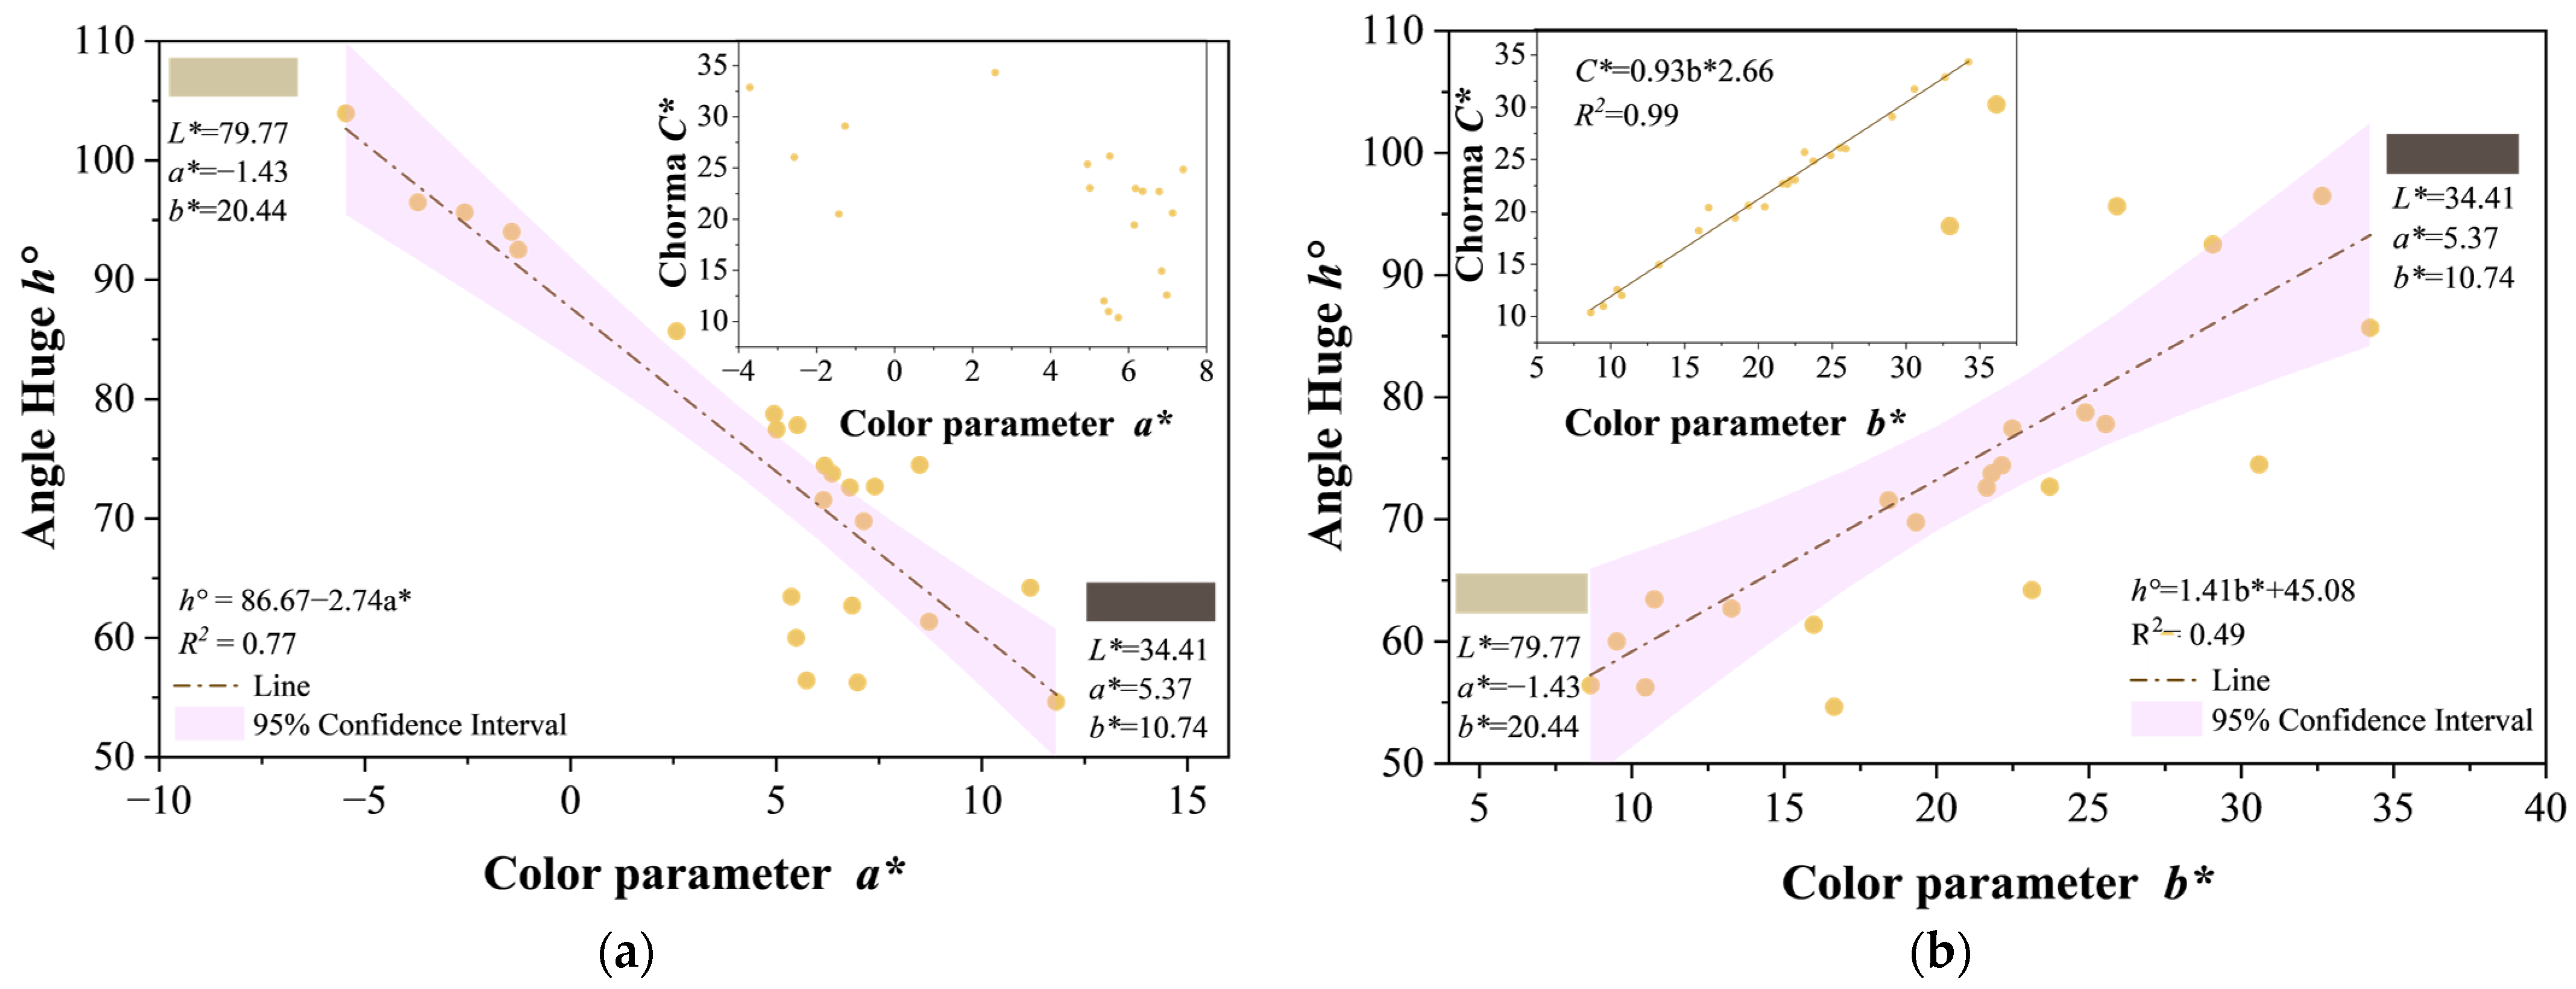
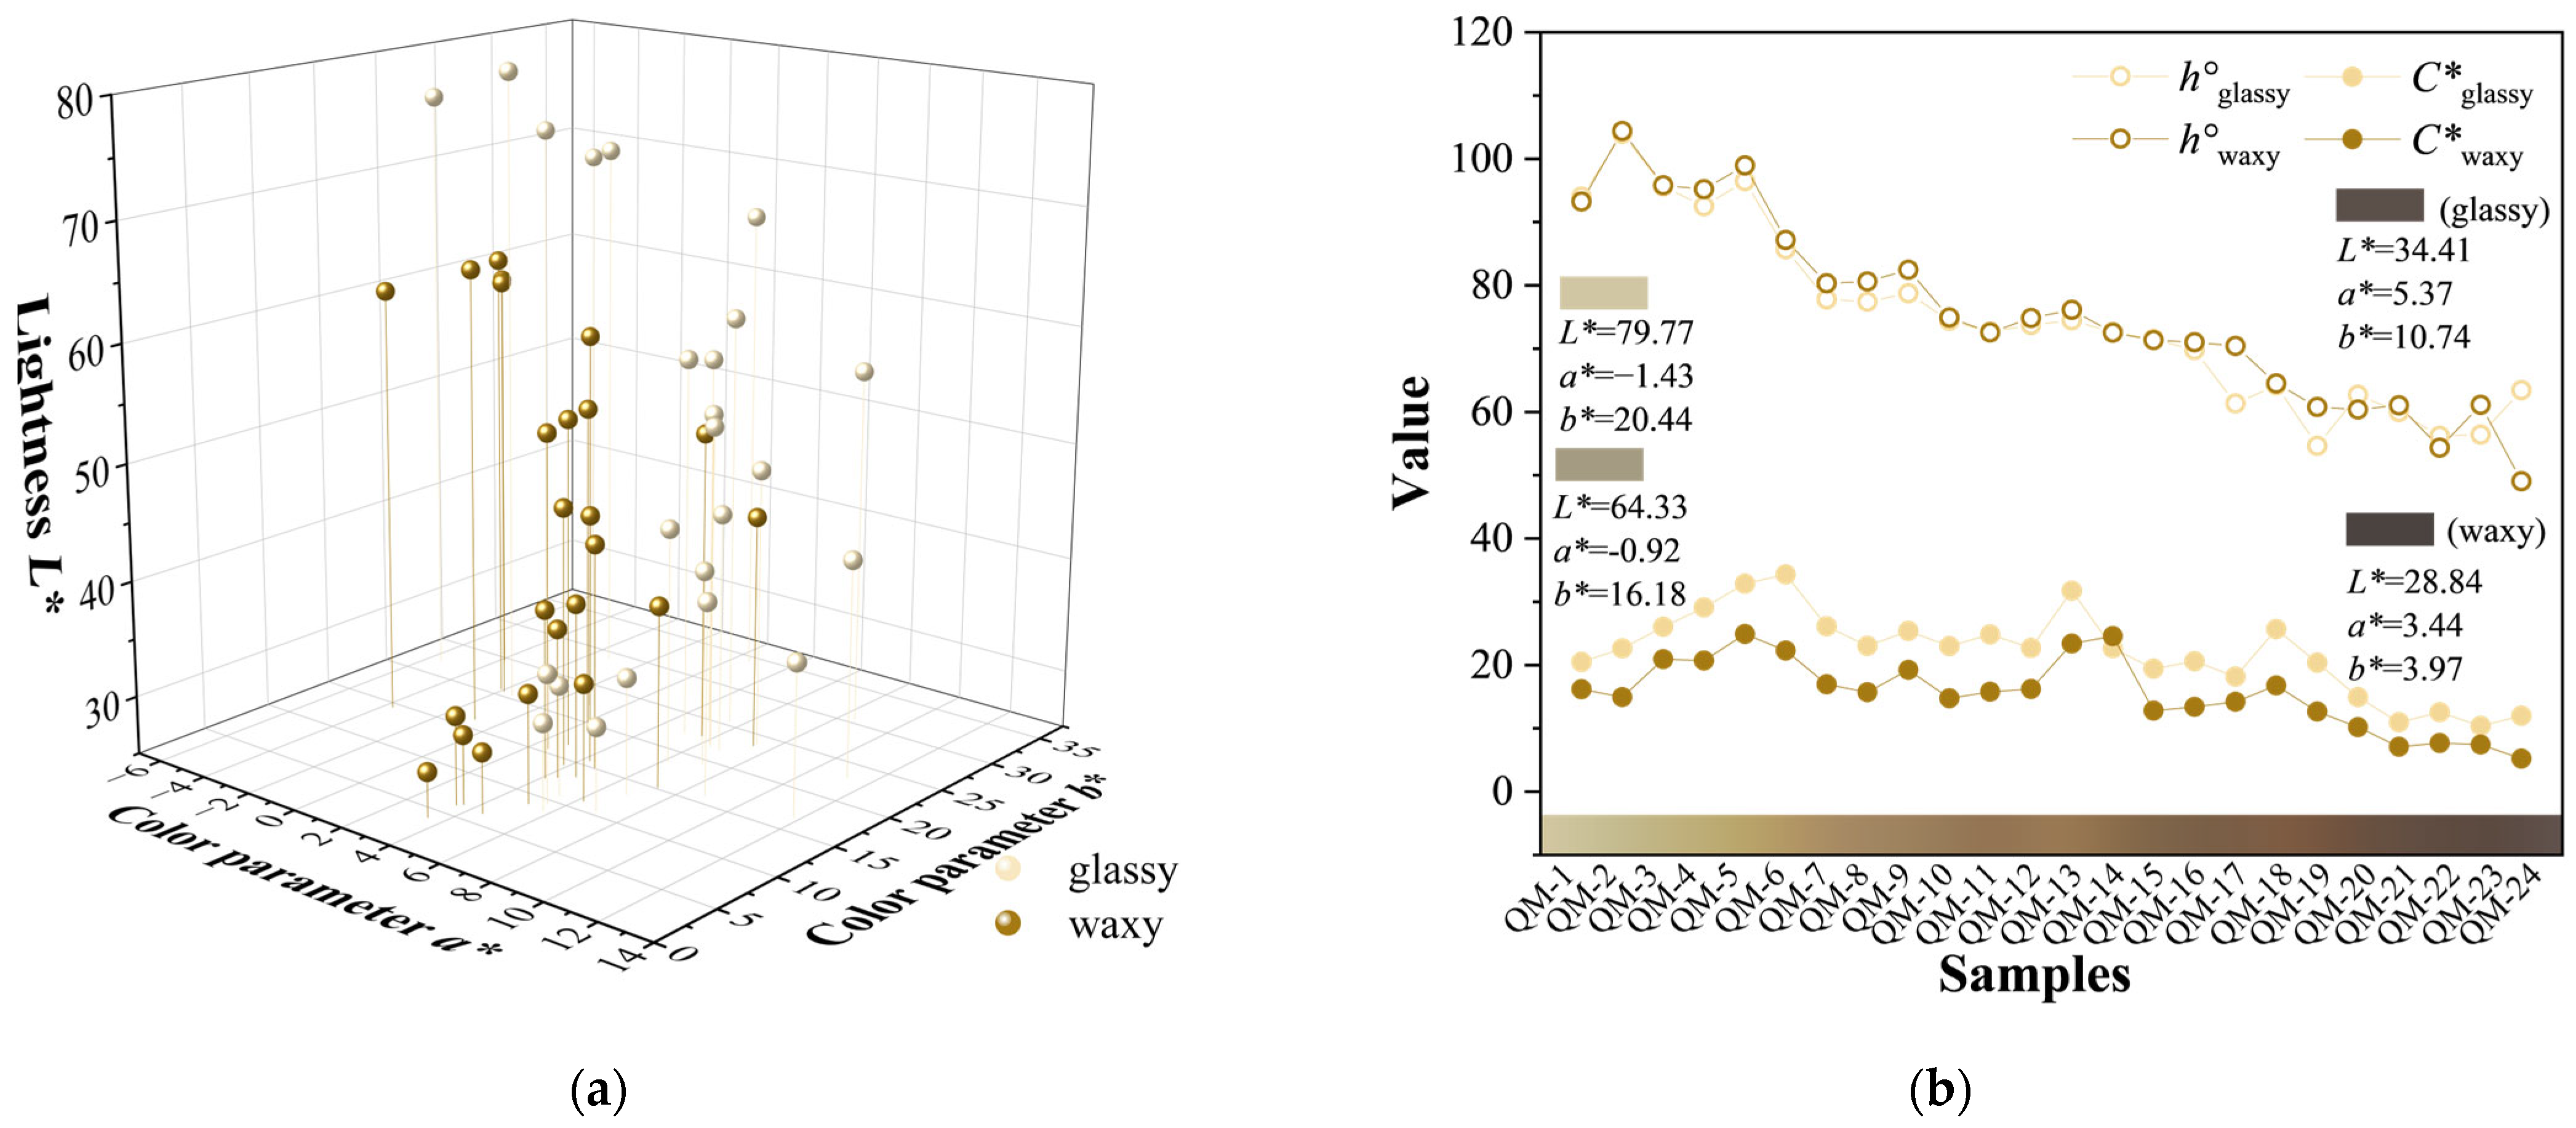
Under D65 illumination and Munsell N9 background, the 24 samples exhibited color parameters ranging as follows: L* ∈ (32.13–79.77), a* ∈ (−5.46–11.81), b* ∈ (8.65–34.23), C* ∈ (10.38–34.33), and ∈ (54.64–103.96), with their color appearance consistent with these measurements as shown in the 3D color space visualization in Figure 4a. Analysis of the color parameters (Figure 4) revealed a strong linear correlation (R2 = 0.99) between C* and b* parameter, indicating that C* increases proportionally with b* while showing no significant relationship with a*, thus demonstrating that C* is primarily determined by the b* value. The determination coefficient (R2) reflects how well the regression line fits the observed data, with values close to 1 indicating a strong match. Meanwhile, Pearson’s correlation coefficient (r) assesses the degree of linear dependence, with absolute values near 1 indicating a robust linear relationship. Notably, the correlation between C* and b* was significantly stronger than between hue angle and b*, confirming b*’s dominant influence on chroma C* over hue angle . Within the CIE 1976 L*a*b* color space, the +b* axis corresponds to the yellow region, confirming that the C* of “Tang yu” is principally governed by yellow tones. Furthermore, the poorer fit between and b* (R2 = 0.49) compared to and a* (R2 = 0.77) indicates that a* exerts greater influence on hue angle than b* does.

3.3.1. Effect of Various Light Sources on Color Perception

Correlated color temperature (CCT) and relative spectral power distribution (RSPD) are key characteristics that vary across different light sources. A range of standard illuminants exists, such as D75 (7500 K), D65 (6504 K), D50 (5003 K), A (2856 K), F12 (3000 K), F11 (4000 K) and F2 (4230 K). Frequently found in home and store lighting, the A light source is defined as an incandescent bulb whose output is primarily concentrated in the yellow and red wavelengths. D50 and D65 are standard illuminants designed to replicate the spectral properties of natural daylight. The D50 finds its primary application in the photography and printing sectors. D65 is defined by its characteristic representation of Northern Hemisphere daylight, making it a universal benchmark for color assessment in numerous fields [46].
This study investigates the influence of D50, A, and D65 light sources on the color of “Tang yu” under the Munsell N9 neutral background. An analysis of the color parameters was performed on a set of 24 “Tang yu” samples. Statistical analysis of the color parameters was performed via one-way ANOVA, the results of which are presented in Table 3. We use the p-value to determine the statistical significance of an effect. We consider a result statistically significant if the p-value is less than 0.05 (p < 0.05).
The results of the analysis of variance (ANOVA) provide evidence of a statistically significant difference in the a* value (red-green axis) of “Tang yu” under different light sources (p = 0.00237). Notably, the showed a marginally significant trend among different groups (p = 0.08942). Although this result did not reach the traditional significance level (p < 0.05), which means a definite conclusion cannot be drawn, it may suggest a potential pattern or trend. This marginal significance may stem from statistical power limitations due to the current sample size (i.e., type II error). Therefore, the role of the hue angle warrants further exploration in subsequent studies with larger sample sizes. No statistically significant differences were found for other parameters (L*, b*, C*) (p > 0.05). This suggests that the spectral power distribution (SPD) of the light source selectively affects the perceived redness of “Tang yu”, with minimal impact on the L*, yellow-blue parameter b*, and the C*.
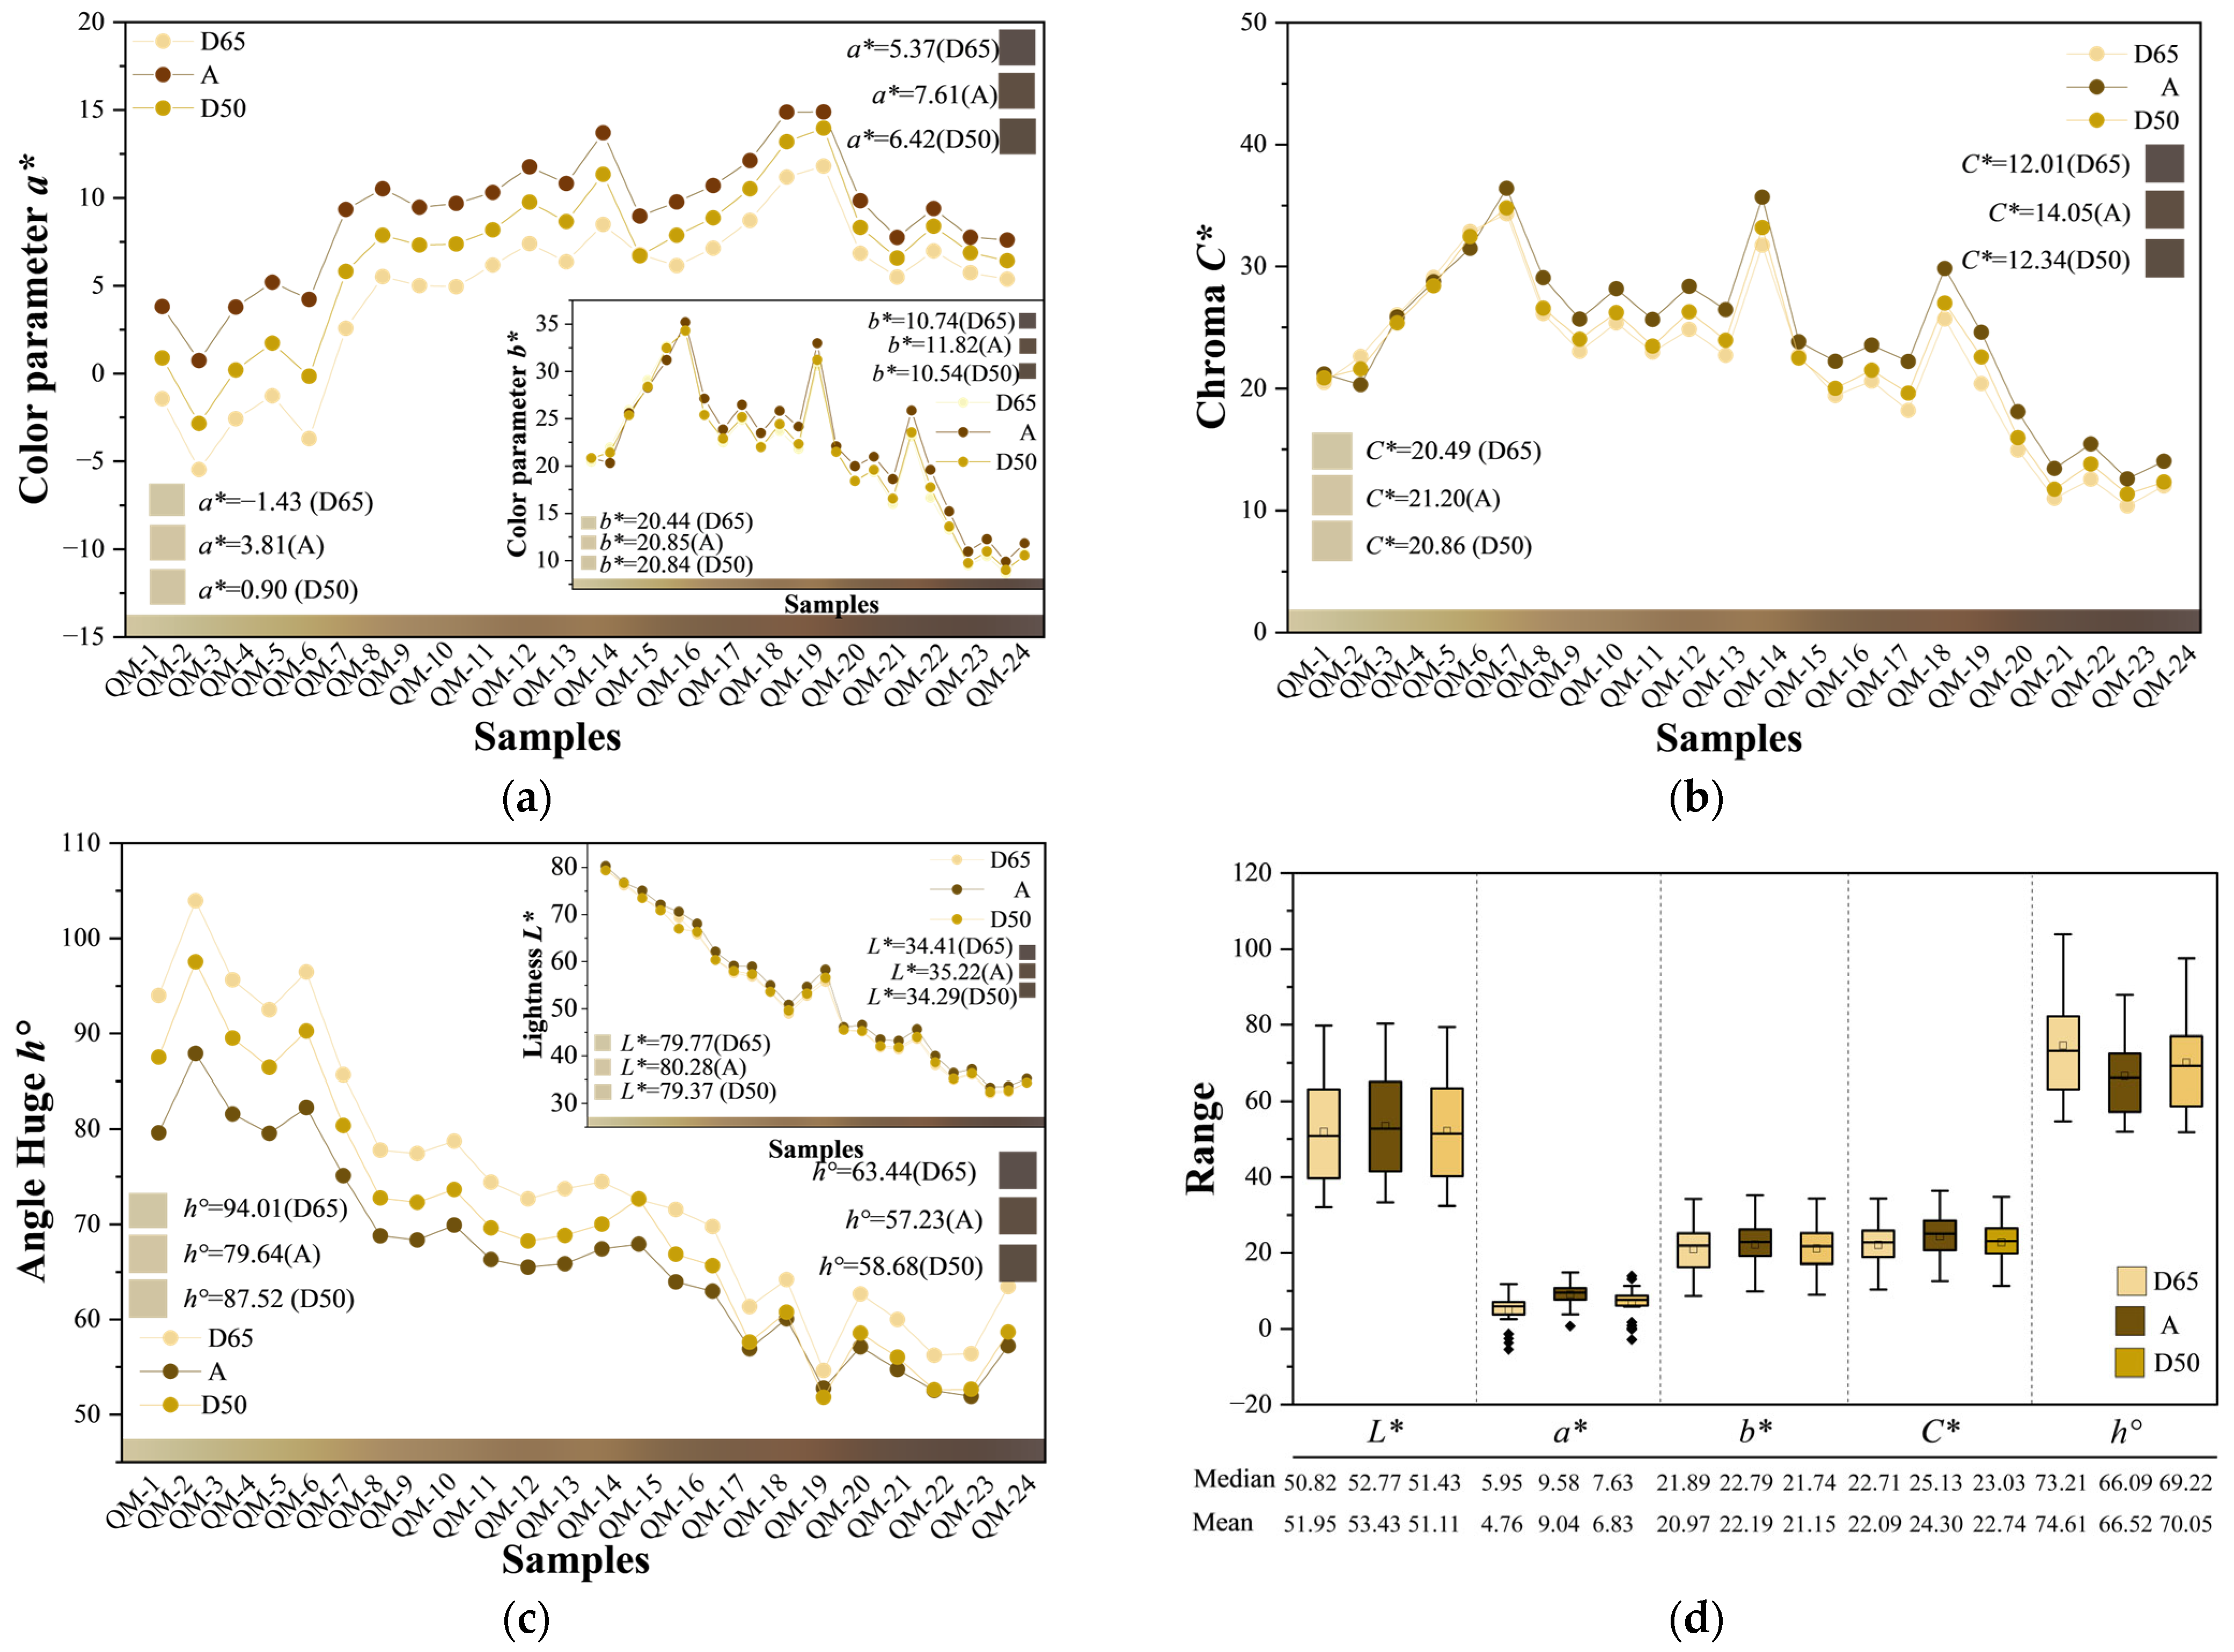
Figure 5 illustrates the comparison of color parameters under the D65, D50, and A light sources. The color temperatures and spectral energy distributions vary across light sources, influencing their color rendering index and performance. This leads to the production of different colors when illuminating gemstones. Depending on the light source’s color temperature, the perceived brightness of the sample varies. The radiometric brightness of the light source is positively correlated with its color temperature. The light flux reflected and received by the sample is positively correlated with the L* value, leading to higher visual brightness. Even when illuminated by a high-color-temperature light source, the reflected and transmitted luminous flux of the “Tangyu” sample remains very low, primarily due to its inherently low transparency; as a result, the increase in light intensity is quite limited (Figure 5c). Thus, the L* value of “Tang Yu” shows little variation when the light source is switched from D65 to D50 and A.
The spectral power distribution of the D65 light source is predominantly concentrated in the blue-green region (400–550 nm), while it is relatively low in the red-yellow region (550–700 nm). The D50 source has a slightly higher proportion of red-yellow light compared to D65, but blue-green light still occupies a certain proportion. The A light source has a strong bias toward the red-yellow region (600–700 nm), with very little blue-green light. Since the hue of the sample lies between yellow and red tones, the color parameters of the sample are negative to positive for a* and positive for b*. When the light source switches from D65 to D50 and A, the a* color parameter increases sequentially, and the green density decreases, as shown in Figure 5a. Furthermore, when lighted source by D65, the a* value of the sample reached its minimum. when lighted source by D50 and A, which contain more yellow components, the b* value of the lighter sample did not show significant changes, while the b* value of the darker sample decreased noticeably, falling below the measurement results obtained under the D65 light source, which has fewer yellow components.
Figure 5b shows that the changes in C* follow a trend similar to that of b*. In lighter samples, the light source does not have a significant impact, while in darker samples, the highest C* value is observed when illuminated by the A source, and the lowest C* value is measured under D65 illumination. The D50 light source results in C* values that fall between the two. This is because the D65 light source tends toward blue-green light. Therefore, when blue-green light is combined with the yellow-red tones of samples, the yellow-red tones are weakened, and C* decreases. At the same time, lighter-toned “Tang yu” is more susceptible to light source effects due to its thinner color, and the secondary reflection of light is enhanced after it penetrates. Under the A light source, the red tones are more pronounced. Darker-toned “Tang yu” has a richer color, and the variation caused by different light sources is partially obscured, so the differences may be smaller.
The blue-green light of the D65 illumination may cause the of “Tang yu” to shift slightly toward yellow green, resulting in a slight increase in the . However, since “Tang yu” mainly reflects red-yellow light, the overall hue remains yellow red. The strong red light from the A light source causes the hue to shift toward pure red, reducing the hue angle , with a more noticeable effect on lighter “Tang yu”. The D50 light source causes the hue changes to fall between the two. As the sample color deepens, the effects of the three light sources on the become smaller, as shown in Figure 5c.
In summary, the effect of illumination conditions on the chromatic properties of “Tang yu” is selective: the A light source significantly enhances redness (a*↑) and reduces the hue angle (↓), especially affecting lighter samples; the D65 light source, on the other hand, it maintains color balance and avoids the color perception bias induced by the red-light enhancement of illuminant A (Figure 5d). For darker samples, due to saturation of light absorption, the impact of the light source on the parameters is minimal. It is recommended to prioritize the use of the D65 light source for color grading assessments to ensure accuracy, while the A and D50 light sources can be used in commercial displays to enhance the red-yellow tones.

3.3.2. Effect of Various Polishing Methods on Color Perception

Under the D65 light source, color parameter measurements of 24 “Tang yu” samples were conducted on a standard neutral Munsell N9 backgrounds, with the aid of an X-Rite SP62 handheld spectrophotometer. Two polishing processes were evaluated: glassy polish (diamond polishing paste 6000 grit) and waxy polish (diamond polishing paste 800 grit). The results show that the two polishing processes, glassy polish and waxy polish have a significant impact on the color, as shown in Figure 6. Compared to the traditional waxy polish process, the glassy polish process demonstrated a marked superiority in improving the sample’s brightness L* and chroma C*, with an average increase of 11.41% in brightness L* and 42.11% in chroma C*. At the same time, the glassy polish process also slightly outperformed in enhancing the a* (red-green) and b* (yellow-blue) color values, with average increases of 54.92% and 45.85%, respectively. Importantly, both polishing processes had minimal effect on the , which represents the fundamental attribute of color and a core element of visual perception, thus maintaining the stability of the “Tang yu”’s original tone.
Meanwhile, the color difference ΔE00 between the two polishing methods was determined using Formula (3), after which the resulting CIE DE2000-based ΔE00 values were subjected to further analysis.
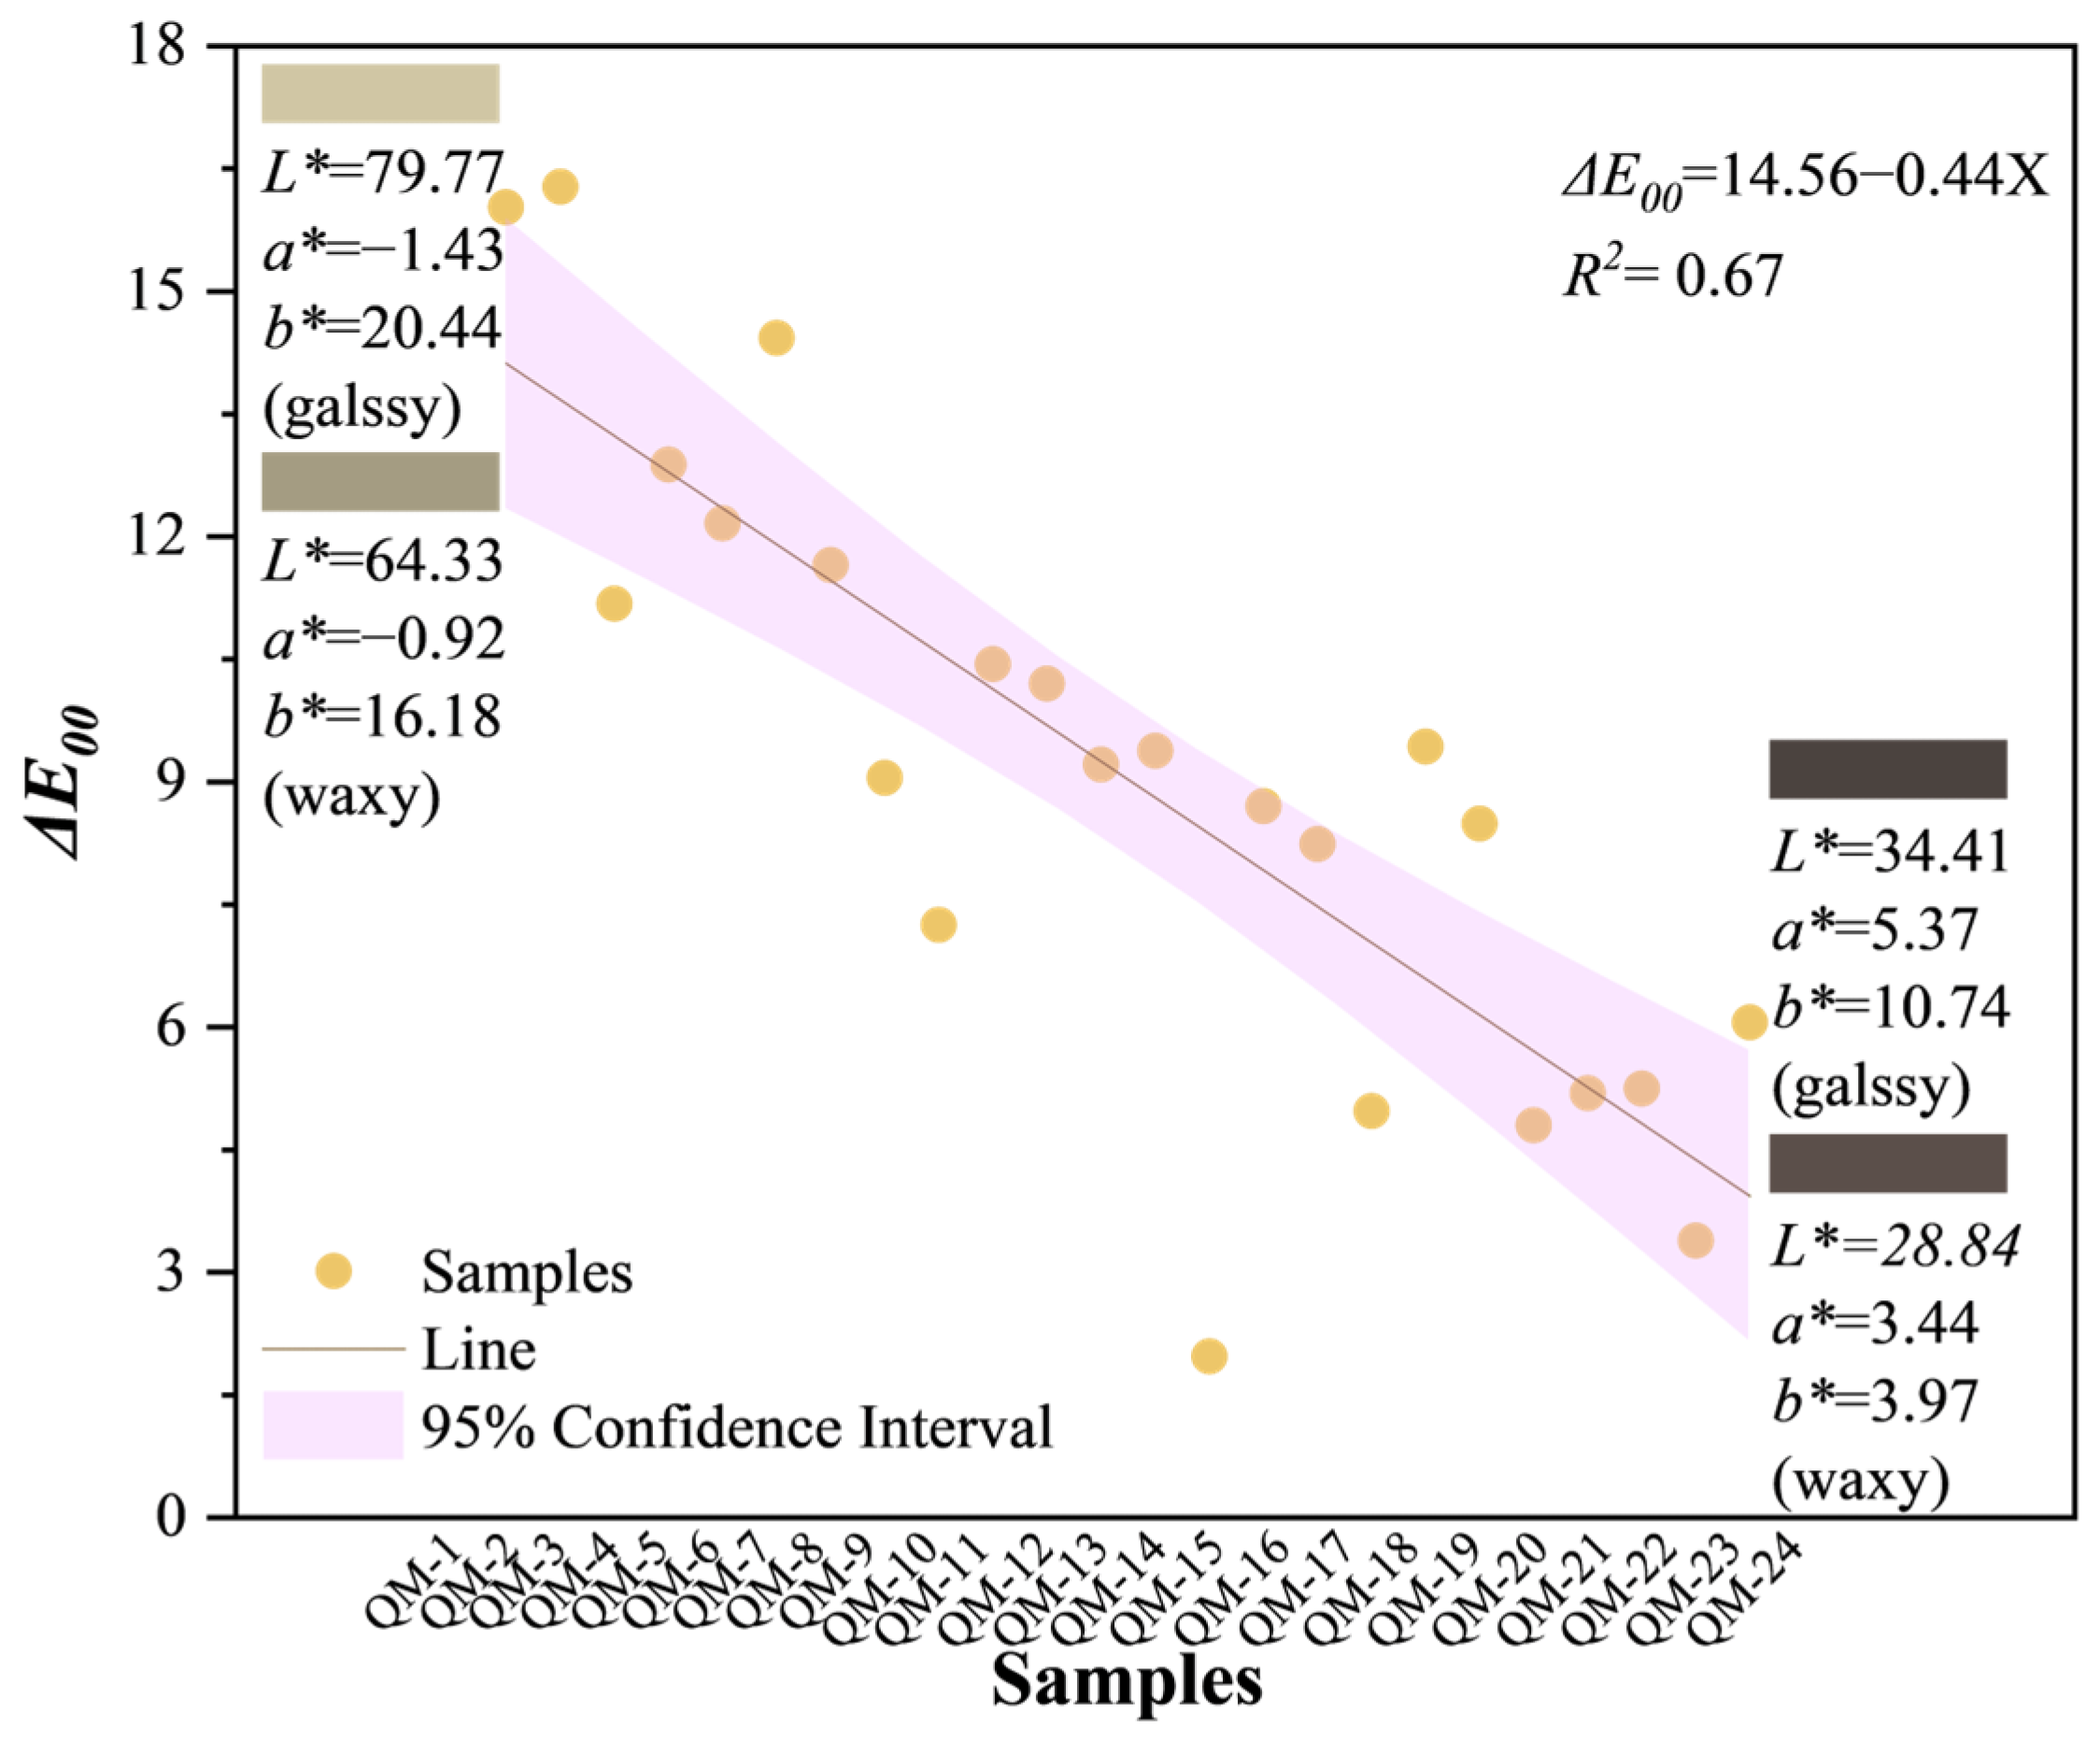
The ΔE00 results indicate that the sensitivity of CIE DE2000 color difference (ΔE00) to color variation decreases as the sample’s base color darkens (Figure 7). ΔE00 value greater than 3 indicates a color difference that is visibly discernible to an observer (Table 4). Data analysis revealed that 95.83% of the samples exhibited ΔE00 values exceeding this threshold, further confirming that the impact of different polishing techniques (glassy polishing vs. Waxy polishing) on “Tang yu”’s color is not only statistically significant but also visually perceptible. This finding provides crucial color stability references for selecting appropriate polishing techniques in gemstone processing.

3.3.3. Effect of Various the Backgrounds on Color Perception

Due to the luster and transparency of “Tang yu”, even a neutral background with different gray shadows can cause significant differences in the color appearance of “Tang yu”. Therefore, the color parameters of 24 “Tang yu” samples were acquired with an X-Rite SP62 handheld spectrophotometer under D65 illumination across all nine Munsell neutral backgrounds (N1 to N9). Table 5 presents the color transition of the samples, along with the average color parameters of “Tang yu” against nine Munsell neutral backgrounds and the corresponding color differences among these backgrounds.
The Munsell neutral value gray scales, often referred to as a Munsell gray scale or neutral color chart, are presented in a fan deck format. The lightness value L*b correlates with the luminance factor γb through a power function, as described by the following equation:
L b * = 116 γ b 1 / 3 16
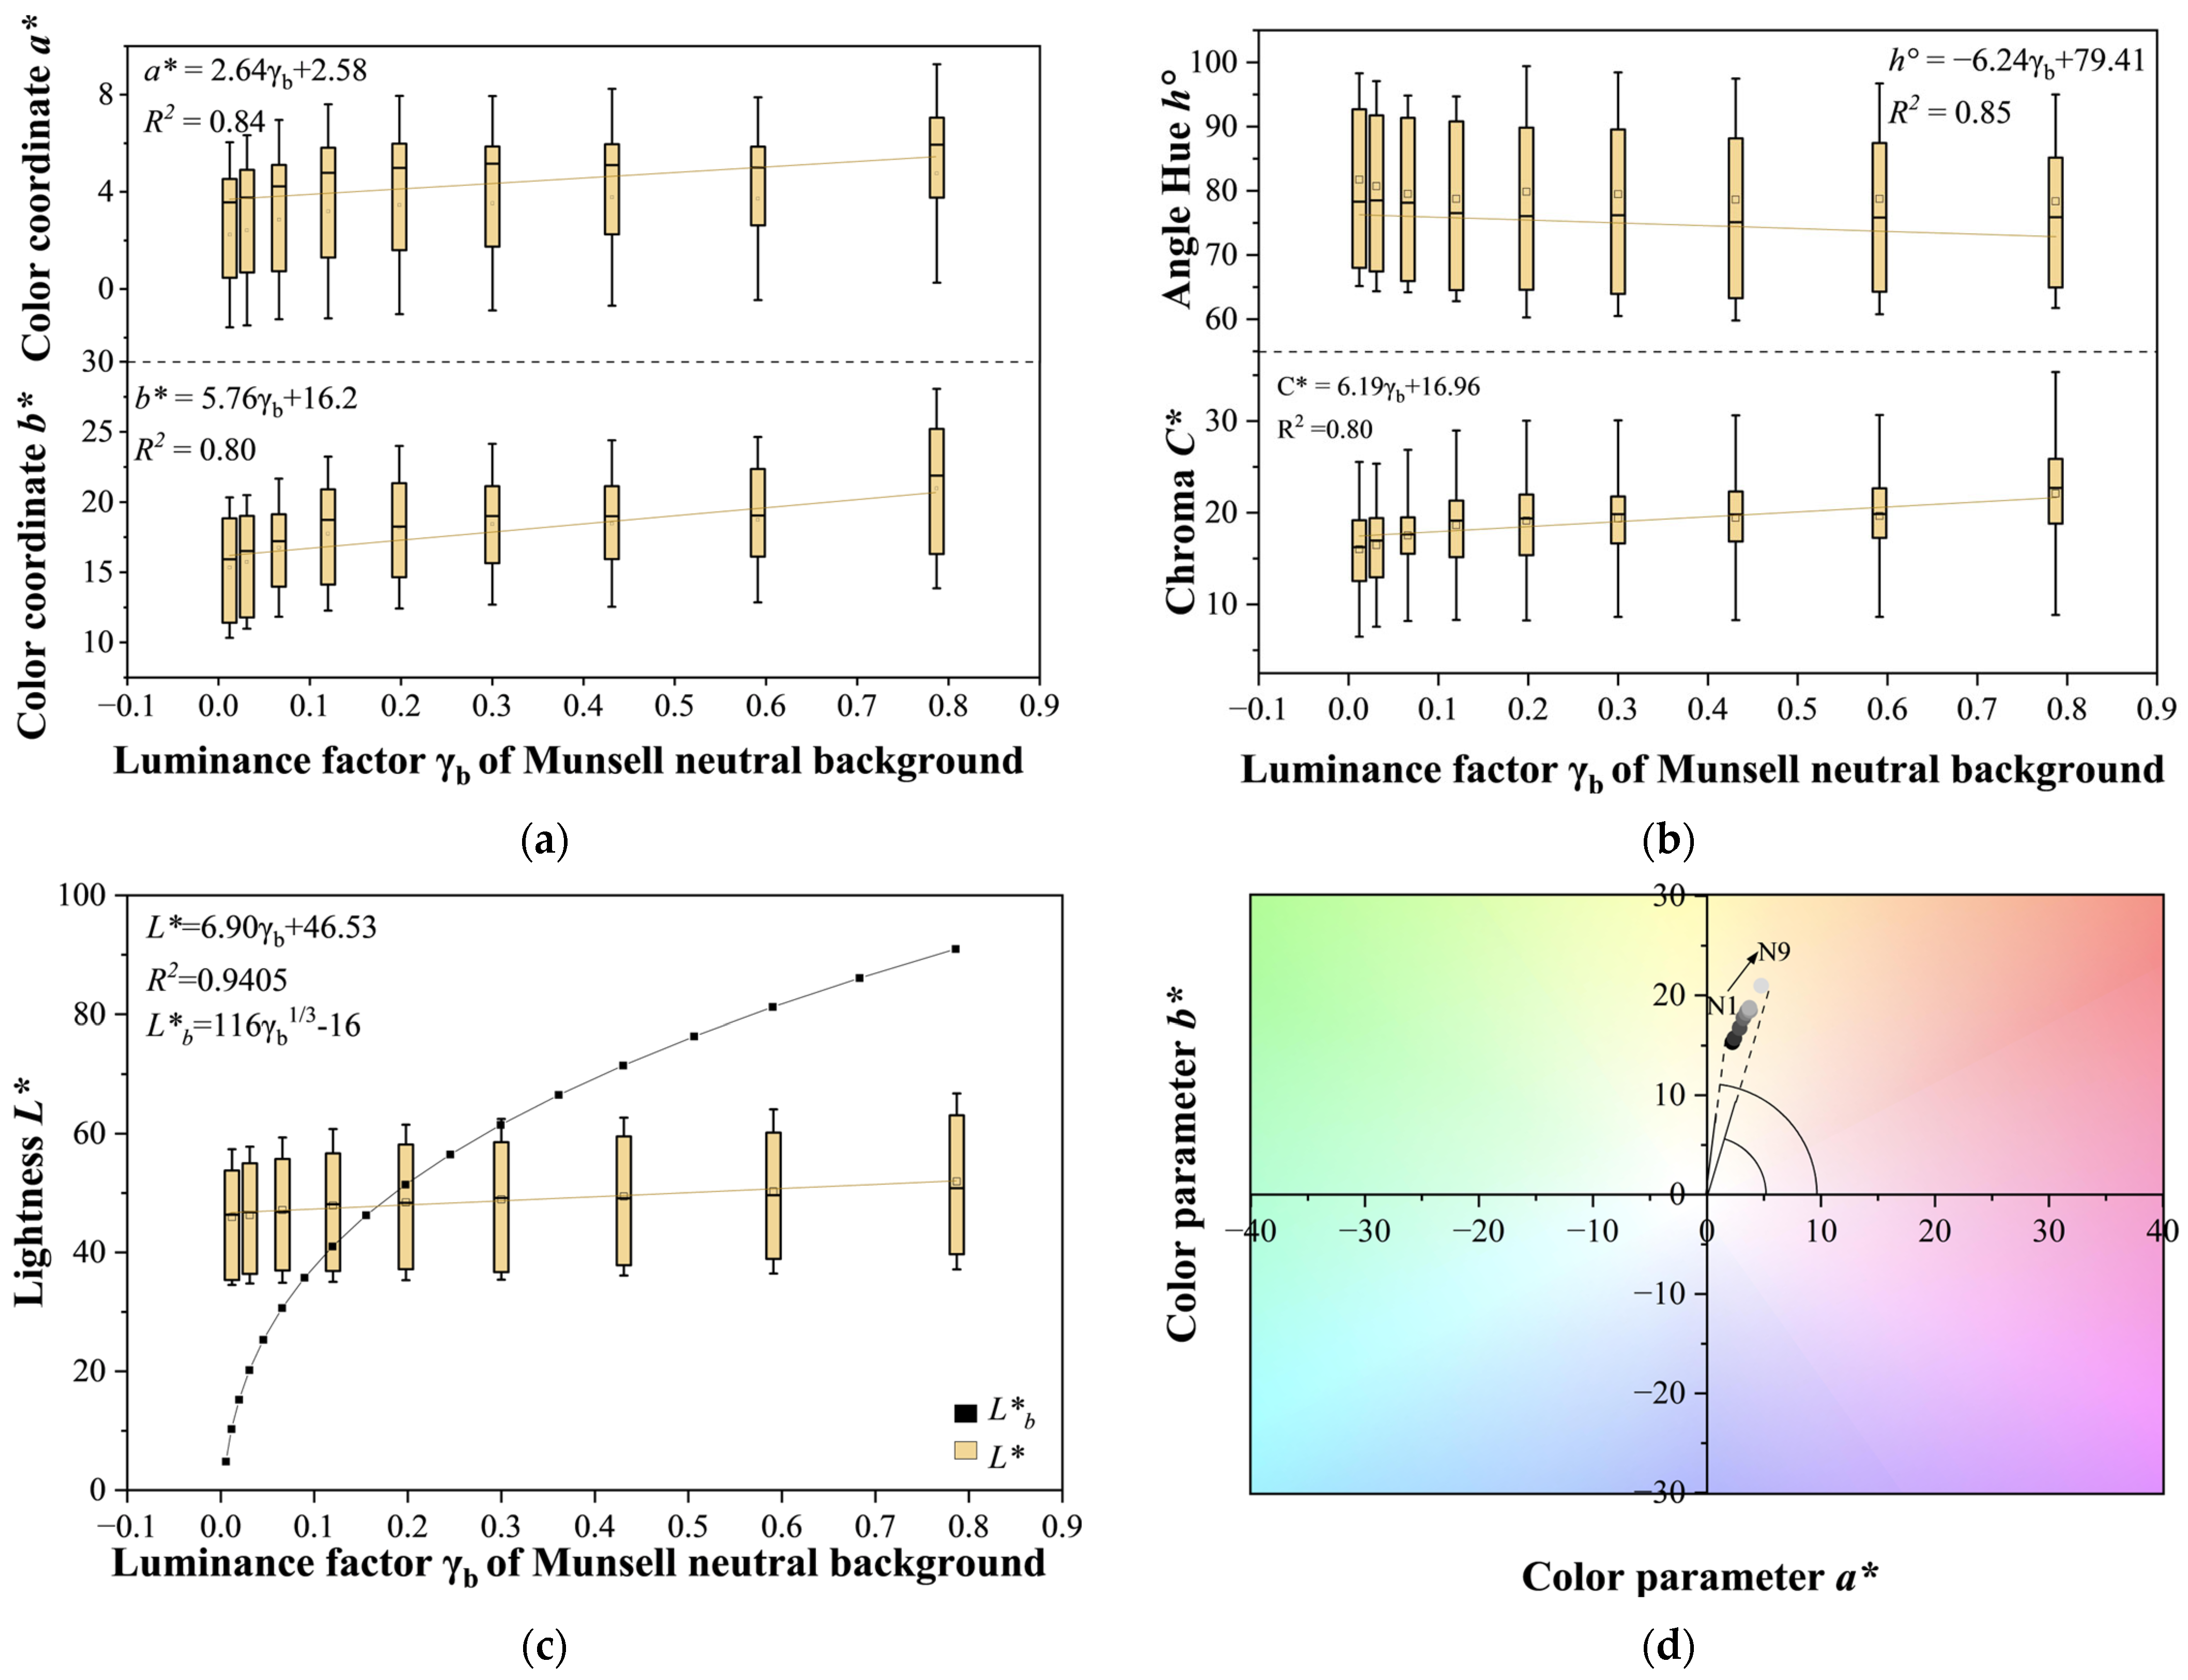
Color mixing operates through two distinct processes: additive and subtractive effects. The first technique utilizes beams of light with distinct spectral power distributions. By projecting and superimposing these colored beams, a new color is produced. An increase in intensity leads to a corresponding rise in the brightness of the blended color. The second technique produces color through the stacking of colored filters [47]. Thus, the superimposition of gemstones upon a substrate gives rise to the phenomenon of subtractive color mixing. As illustrated in Figure 8c, sample brightness rises with higher background illumination levels. We performed a fit between the sample brightness and the Munsell neutral background’s luminance factor. This analysis yielded the following functional relationship for γb as a function of sample lightness L*:
L * = 6.90 γ b + 46.53 ( R 2 = 0.94 )
The variation in brightness of the “Tang yu” samples across various grayscale backgrounds can be attributed to their inherent transparency. The light reflected or transmitted by a sample increases with its background brightness. An increase in background brightness thus produces a corresponding increase in sample brightness. Figure 8b documents how the sample’s C* and values shift in response to varying background conditions. Variations in C* and were observed with increasing background brightness, where chroma C* elevated and hue angle reduced. These variations were modeled as a function of the Munsell background lightness factor (γb), resulting in the following correlation:
C * = 6.19 γ b + 16.96 ( R 2 = 0.80 )
h ° = 6.24 γ b + 79.41 R 2 = 0.85
The influence of achromatic backgrounds on the chroma of “Tang yu” differs from the brightness interaction; it does not obey the subtractive mixing principle. This discrepancy occurs because neutral backgrounds possess no chroma to participate in such mixing. A marked linear relationship between C* and the chromaticity coordinates (a*, b*) is demonstrated in Figure 8d. According to the CIE 1976 L*a*b* uniform color space, positive values on the b* and a* axes denote yellowness and redness. Consequently, the colorimetric data suggest that the chroma of the “Tang yu” samples is principally governed by these two spectral components. Due to the maximum brightness of the yellow hue, the sample’s a* and b* values rise as the background becomes brighter, as illustrated in Figure 8a. Simultaneously, data in Figure 8d reveal a more pronounced rise in the b* coordinate compared to the growth of a*; Consequently, This leads to a chromatic movement the yellow axis (+b*) and a corresponding decline in the hue angle .
Based on the above, the “Tang yu” samples show a rise in both lightness L* and chroma C* but a fall in hue angle with increasing brightness of the Munsell neutral backdrop. Moreover, the Munsell N9 background also provides a superior contrast for the “Tang yu” samples, significantly enhancing the discernibility of their individual colors. These findings indicate that the Munsell N9 chart achieves higher color classification accuracy for “Tang yu”, owing to its more effective background, and is therefore recommended.

3.4. Color Grading of “Tang yu”

Clustering is an exploratory data analysis technique aimed at revealing the underlying group structure within a dataset. Its core lies in grouping data objects with common characteristics into the same cluster, thus achieving a natural grouping of the data. This technique can uncover hidden patterns and inherent relationships in the data. The standard K-means algorithm identifies optimal cluster centers by minimizing the total variance within clusters, effectively reducing the distance from each point to its closest centroid [48]. The application of K-means clustering combined with Fisher discriminant analysis has been used to investigate the color properties of colored gemstones, including jadeite [49].
Analysis utilized an SPSS (29.0.1.0)-based K-means clustering approach to group the 24 samples according to their position in the CIE 1976 L*a*b* color space, defined by the variables L*, a*, and b*. To ensure objectivity and universality, color clustering was performed on the samples under the D65 standard light source, using a Munsell N9 neutral background. When the number of centroids (k) in the K-means clustering algorithm was set to 3, This three-cluster solution proved to be effective, demonstrating a high level of statistical significance (Sig. < 0.01). The color difference between the three groups was sufficiently large for the human eye to perceive, exceeding the minimum color tolerance threshold [50]. The cases distributed across the categories as follows: 6, 11, and 7. The results of the clustering analysis and the color centroids of “Tang yu” are presented in Table 6 and Table 7, respectively. Fisher discriminant analysis was used to test the clustering, which achieved 100% accuracy, confirming the validity and feasibility of the classification scheme and yielding the corresponding discriminant function:
F 1 = 3.150 L * 0.689 a * + 0.622 b * 124.703
F 2 = 1.948 L * + 2.414 a * 0.387 b * 44.826
F 3 = 2.571 L * + 1.735 a * 0.038 b * 77.836
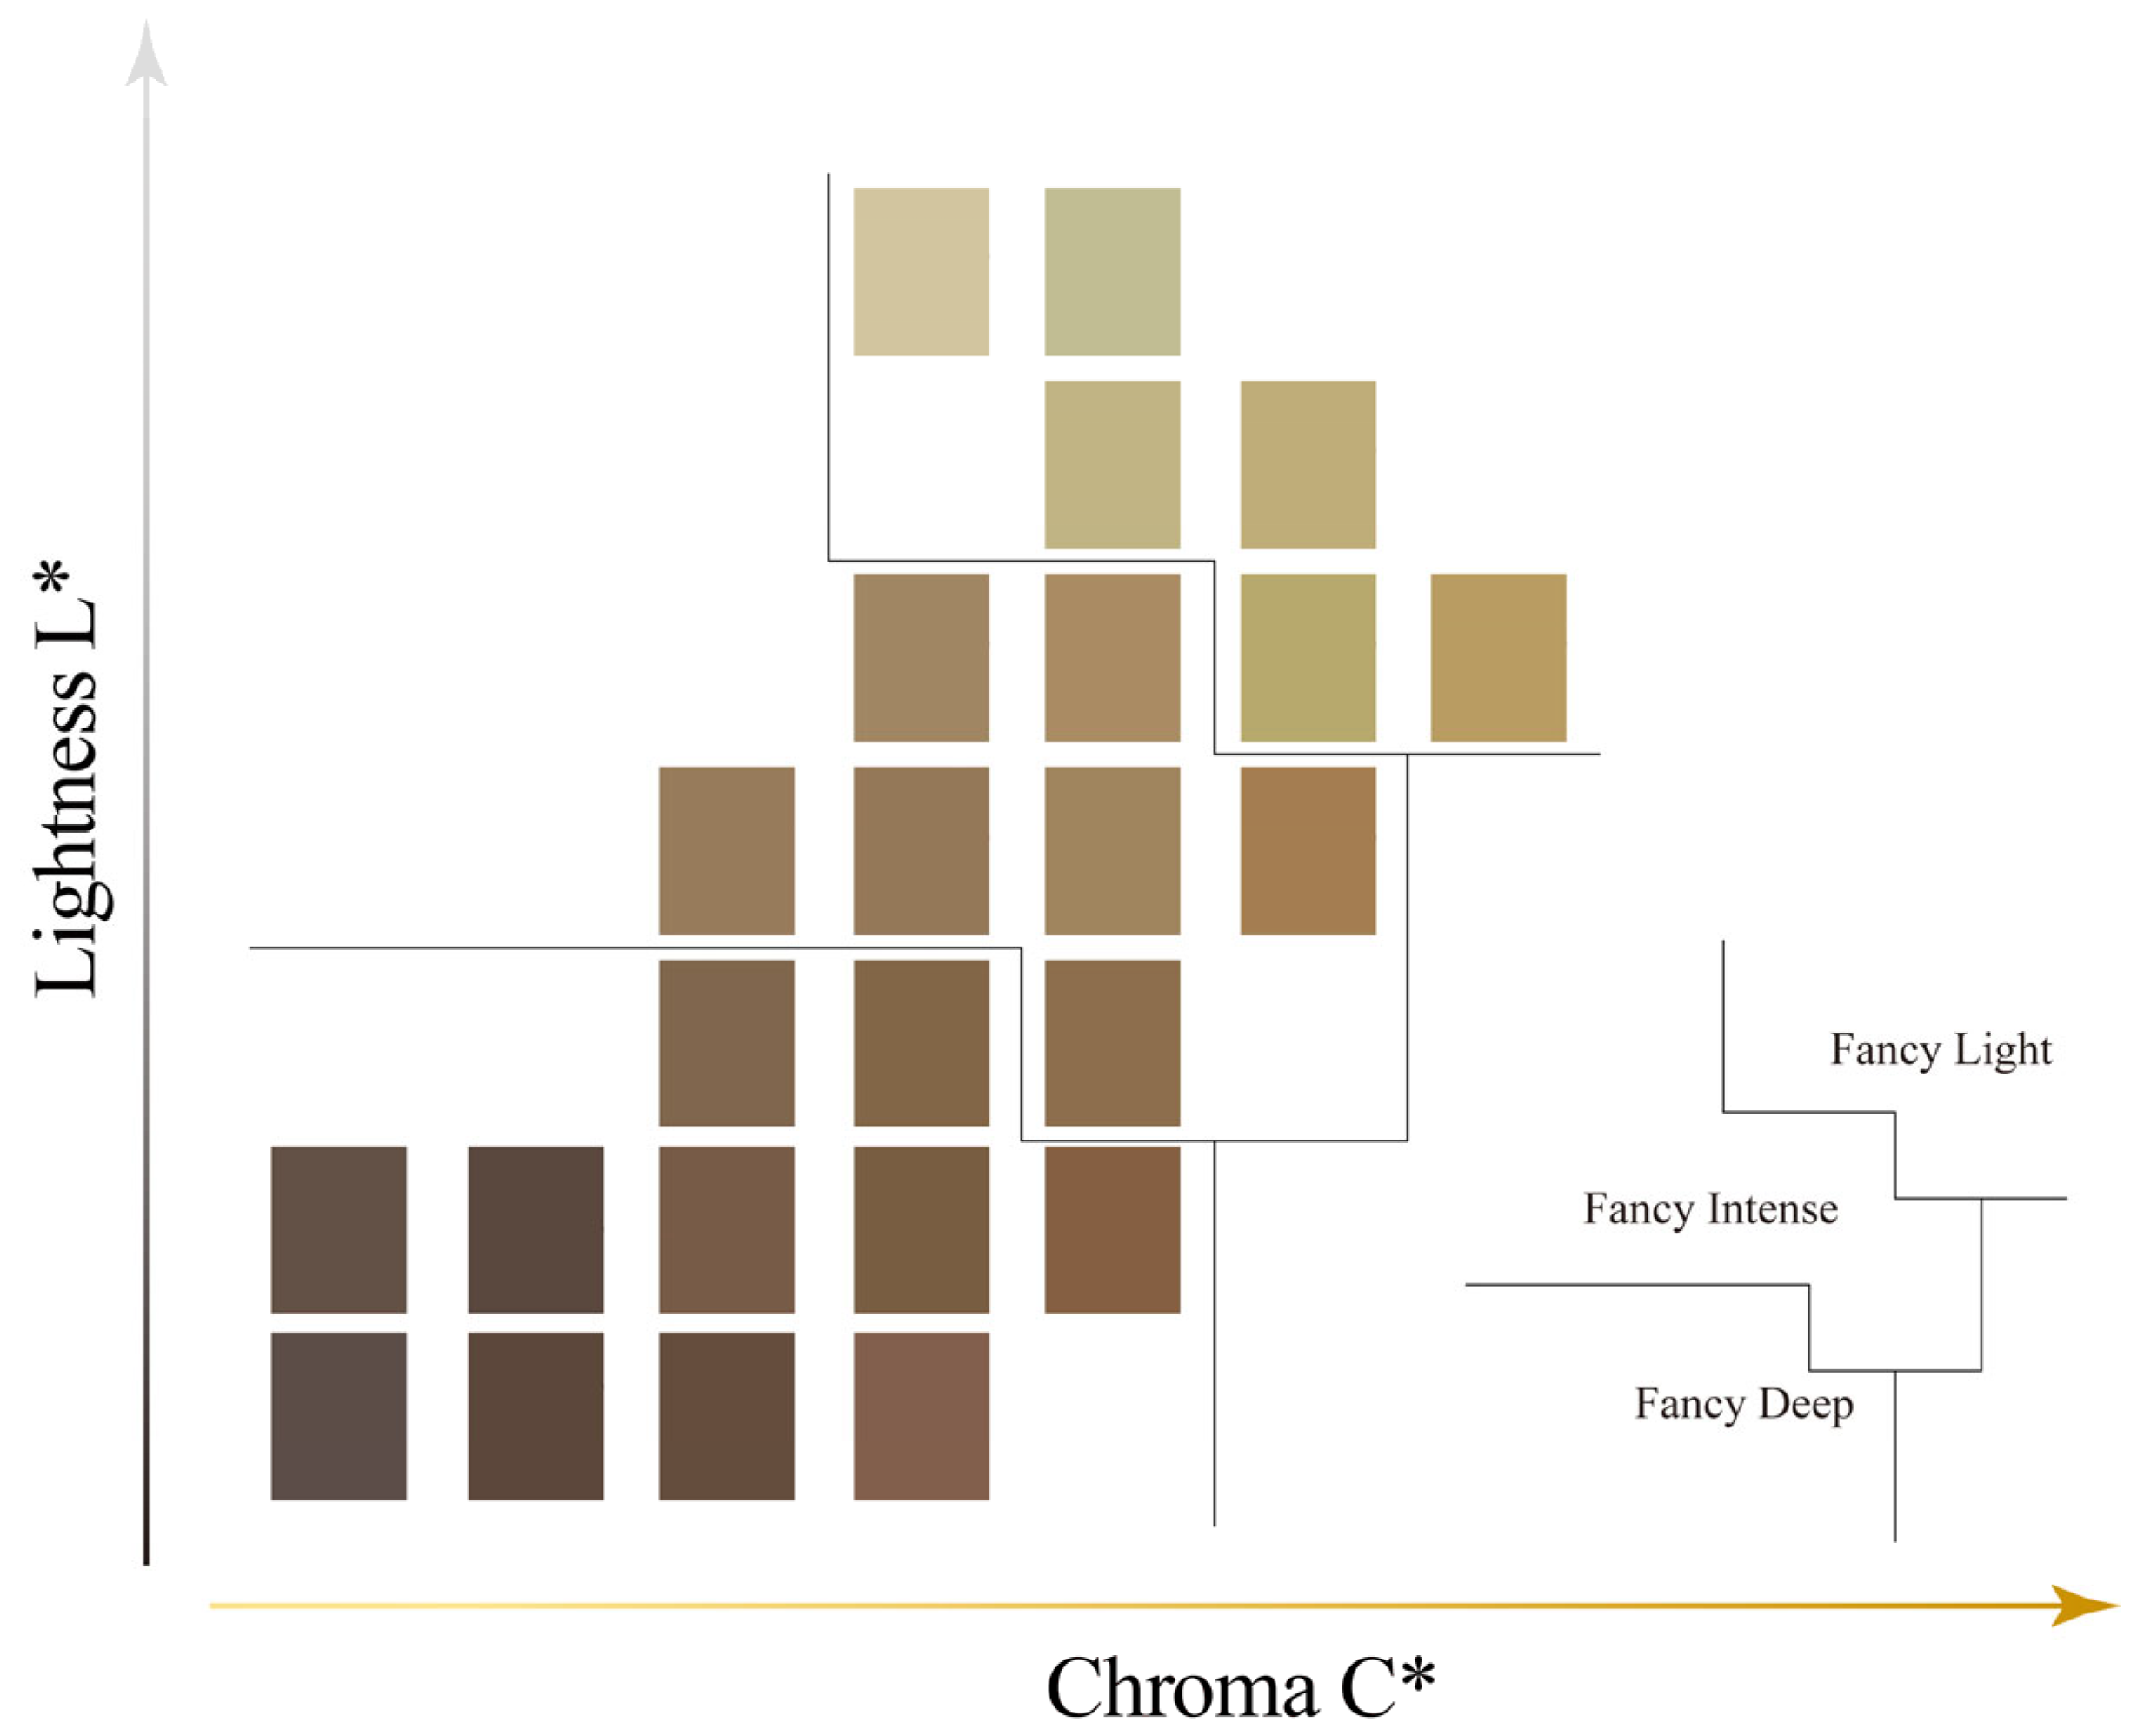
In accordance with the colored diamond grading standard established by the Gemological Institute of America (GIA) and the National Standard of China’s GB/T 23885-2009 [51] “Jadeite Grading”, “Tang yu” samples with Angle hues ranging from (55°, 104°) are classified into three categories: (1) Fancy light, (2) Fancy Intense, and (3) Fancy deep. To more clearly illustrate the grouping results, the distribution of the groups based on chroma and brightness as parameter values is shown in Figure 9.

4. Conclusions

This research indicates that the color of “Tang yu” is influenced not only by its chemical composition but also by several external factors. The elements responsible for the coloration of “Tang yu” have low concentrations, and their content does not exhibit a linear relationship with the color intensity.
To ensure the objectivity of color grading, we recommend using the spectrally balanced D65 standard light source as the primary evaluation condition. In commercial display settings, the D50 and A light sources better highlight the visual appeal of “Tang yu”, with the A light source intensifying the red-yellow tone characteristics of the samples.
Polishing treatment significantly alters the color performance of the samples, with such differences being perceptible to the naked eye. Specifically, the bright polishing technique effectively enhances the sample’s brightness (with an average increase of 11.4% in the L* value) and color saturation (with an average increase of 42.1% in the C* value), while also causing the “Tang yu”’s color to shift towards the red-yellow hue.
When the “Tang yu” is placed against a Munsell neutral gray background, its brightness L* and chroma C* parameters obey a power law with respect to the background luminance factor (γb), albeit at different rates. As the background luminance factor γb increases, the sample’s color parameter a* and b* also increase. It is noteworthy that changes in background brightness have minimal effect on the hue angle (). A high-brightness background at N9 level can optimize the color grading effect, and a color parameter prediction model based on the relationship between the brightness factor and the background luminance factor γb has been established.
Through the integrated application of clustering and discriminant techniques, the coloration of “Tang yu” can be consistently categorized into three distinct characteristic groups: Fancy Light, Fancy Intense, and Fancy Deep. This classification method provides key technical support for the development of a scientific color grading system for “Tang yu”.

Author Contributions

Conceptualization, K.L., J.T. and Y.G.; methodology, K.L., J.T. and Y.G.; software K.L. and J.T.; validation, K.L., J.T. and Y.G.; formal analysis, K.L. and J.T.; investigation, K.L., J.T. and Y.G.; resources, K.L., J.T. and Y.G.; data curation, K.L.; writing—original draft preparation, K.L. and J.T.; writing—review and editing, K.L. and J.T.; visualization, K.L. and J.T.; supervision, Y.G.; project administration, Y.G.; funding acquisition, Y.G. All authors have read and agreed to the published version of the manuscript.

Funding

This study was supported by the National Science and Technology Infrastructure—The National Infrastructure of Mineral, Rock and Fossil Resources for Science and Technology (http://www.nimrf.net.cn), as well as by the Program of Data Integration and Standardization in Geological Science and Technology from MOST, China, and Construction of a Self-Media Popular Science Platform for the National Mineral, Rock and Fossil Resources Database (Grant No. NCSTI-RMF20250110).

Data Availability Statement

No new data were created or analyzed in this study. Data sharing is not applicable to this article.

Acknowledgments

The authors thank the Lab of Gemmology, School of Gemmology, China University of Geosciences, Beijing, for support.

Conflicts of Interest

The authors declare no conflicts of interest.

Abbreviations

The following abbreviations are used in this manuscript:
L*Lightness
a*Color parameter a*
b*Color parameter b*
C*Chroma C*
Hue angle
γbLuminance factor γb

References

  1. Wang, R. Review on the mechanism of whitening of excavated ancient nephrite jade artifacts in China. Sci. Conserv. Archaeol. 2017, 29, 88–100. [Google Scholar]
  2. Yu, H.Y.; Ruan, Q.F.; Sun, Y.; Li, D.S. Micro-morphology and Mineral Composition of Different Color Qinghai Nephrites. Rock Miner. Anal. 2018, 37, 626–636. [Google Scholar]
  3. Zhang, X.H.; Feng, Y.H.; Zhang, Y.; Maituohuti, A. Analysis of Yelow-Green Hetian Jade in Qiemo—Ruoqiang Area, Xinjiang and Characterization. Rock Miner. Anal. 2022, 41, 586–597. [Google Scholar]
  4. Bao, Y.; Ye, X.H.; Xin, J.M.; Zhang, J.H.; Yuan, J.; Zheng, J.M.; Zhu, Q.W. Scientific Analysis and Related Issues of the Jade Artifacts Unearthed from the Tomb of Guo Zhong. Cult. Relics 2023, 4, 72–85. [Google Scholar]
  5. Jiang, B.H.; Bai, F.; Zhao, J.K. Mineralogical and geochemical characteristics of green nephrite from Kutcho, northern British Columbia, Canada. Lithos 2021, 388, 106030. [Google Scholar] [CrossRef]
  6. Fu, X.F.; Gan, F.X.; Ma, B.; Gu, D.H. Structural and nondestructive componential analysis on several nephrite from different provenances. Acta Petrol. Sin. 2007, 23, 1197–1202. [Google Scholar]
  7. Zhang, Y.W.; Liu, Y.; LIU, T.T.; Zari, M.; Liu, Y.Q. Vibrational Spectra of Hetian Nephrite from Xinjiang. Spectrosc. Spectr. Anal. 2012, 32, 398–401. [Google Scholar]
  8. Liu, Y.; Deng, J.; Shi, G.H.; Yui, T.F.; Zhang, G.B.; Abuduwayiti, M.; Yang, L.Q.; Sun, X. Geochemistry and petrology of nephrite from Alamas, Xinjiang, NW China. J. Asian Earth Sci. 2011, 42, 440–451. [Google Scholar] [CrossRef]
  9. Wang, J.X.; Shi, G.H. Comparative study on the origin and characteristics of Chinese (Manas) and Russian (East Sayan) green nephrites. Minerals 2021, 11, 1434. [Google Scholar] [CrossRef]
  10. Wilkins, C.J.; Tennant, W.C.; Williamson, B.E.; McCammon, C.A. Spectroscopic and related evidence on the coloring and constitution of New Zealand jade. Am. Mineral. 2003, 88, 1336–1344. [Google Scholar] [CrossRef]
  11. Adams, C.J.; Beck, R.J.; Campbell, H.J. Characterisation and origin of New Zealand nephrite jade using its strontium isotopic signature. Lithos 2007, 97, 307–322. [Google Scholar] [CrossRef]
  12. Grapes, R.H.; Yun, S.T. Geochemistry of a New Zealand nephrite weathering rind. N. Z. J. Geol. Geophys. 2010, 53, 413–426. [Google Scholar] [CrossRef]
  13. Cooper, A.F. Origin and evolution of nephrites, diopsidites and giant diopside crystals from the contact zones of the Pounamu Ultramafics, Westland, New Zealand. N. Z. J. Geol. Geophys. 2023, 66, 88–101. [Google Scholar] [CrossRef]
  14. Hemantha Kumar, G.N.; Parthasarathy, G.; Chakradhar, R.P.S.; Lakshmana Rao, J.; Ratnakaram, Y.C. Temperature dependence on the electron paramagnetic resonance spectra of natural jasper from Taroko Gorge (Taiwan). Phys. Chem. Miner. 2010, 37, 201–208. [Google Scholar] [CrossRef]
  15. Li, N.; Bai, F.; Peng, Q.; Liu, M.S. Geochemical characteristics of nephrite from Chuncheon, South Korea: Implications for geographic origin determination of nephrite from dolomite-related deposits. Crystals 2023, 13, 1468. [Google Scholar] [CrossRef]
  16. Feng, Y.H.; He, X.M.; Jing, Y.T. A new model for the formation of nephrite deposits: A case study of the Chuncheon nephrite deposit, South Korea. Ore Geol. Rev. 2022, 141, 104655. [Google Scholar] [CrossRef]
  17. Yui, T.F.; Kwon, S.T. Origin of a dolomite-related jade deposit at Chuncheon, Korea. Econ. Geol. 2002, 97, 593–601. [Google Scholar] [CrossRef]
  18. Gil, G.; Bagiński, B.; Gunia, P.; Madej, S.; Sachanbiński, M.; Jokubauskas, P.; Belka, Z. Comparative Fe and Sr isotope study of nephrite deposits hosted in dolomitic marbles and serpentinites from the Sudetes, SW Poland: Implications for Fe-As-Au-bearing skarn formation and post-obduction evolution of the oceanic lithosphere. Ore Geol. Rev. 2020, 118, 103335. [Google Scholar] [CrossRef]
  19. Siqin, B.; Qian, R.; Zhuo, S.J.; Gan, F.X.; Dong, M.; Hua, Y.F. Glow discharge mass spectrometry studies on nephrite minerals formed by different metallogenic mechanisms and geological environments. Int. J. Mass Spectrom. 2012, 309, 206–211. [Google Scholar] [CrossRef]
  20. Jutras, J.P.; Williams, B.; Williams, C.; Ream, L. Nephrite Jade from the Sky Zone, Wyoming, USA: Characteristics and Primary Hydrothermal Origin. J. Gemmol. 2024, 39, 36–53. [Google Scholar] [CrossRef]
  21. Wang, S.Q.; Duan, T.Y.; Zheng, Z.Z. Mineralogical and petrological characteristics of Xiuyan nephrite and its minerogenetic model. Acta Petrol. Mineral. 2002, 21, 79–90. [Google Scholar]
  22. Liu, Y.C.; Zhou, Z.Y.; Yang, X.Y.; Chen, Y.Y.; Ruan, W.D.; Zhang, L.M. Study on difference of color genesis between yellow and brown tremolite jade. Acta Petrol. Mineral. 2021, 40, 1189–1196. [Google Scholar]
  23. Han, W.; Hong, H.L.; Wu, Y.; Yin, K. Color Genesis of Brown Jade from Hetian Nephrite. Spectrosc. Spectr. Anal. 2013, 33, 1446–1450. [Google Scholar]
  24. Liu, Y.; Shigley, J.; Fritsch, E.; Hemphill, S. The “alexandrite effect” in gemstones. Color Res. Appl. 1994, 19, 186–191. [Google Scholar] [CrossRef]
  25. Tang, J.; Guo, Y.; Xu, C. Metameric effects on peridot by changing background color. J. Opt. Soc. Am. A Opt. Image Sci. Vis. 2019, 36, 2030–2039. [Google Scholar] [CrossRef] [PubMed]
  26. Li, C.J.; Li, Z.Q.; Wang, Z.F.; Xu, Y.; Luo, M.R.; Cui, G.H.; Manuel, M.; Brill, M.H.; Michael, P. Comprehensive color solutions: CAM16, CAT16, and CAM16-UCS. Color Res. Appl. 2017, 42, 703–718. [Google Scholar] [CrossRef]
  27. GB/T 20146-2006; CIE Standard Illuminants for Colorimetry. General Administration of Quality Supervision, Inspection and Quarantine of the People’s Republic of China & National Standardization Administration: Beijing, China, 2006.
  28. Guo, Y.; Wang, H.; Li, X.; Dong, S.R. Metamerism Appreciation of Jadeite-Jade Green under the Standard Light Sources D 65, A and CWF. Acta Geol. Sin. 2016, 90, 2097–2103. [Google Scholar] [CrossRef]
  29. Sun, Z.; Palke, A.C.; Renfro, N. Vanadium- and Chromium-Bearing Pink Pyrope Garnet: Characterization and Quantitative Colorimetric Analysis. Gems Gemol. 2016, 51, 348–369. [Google Scholar] [CrossRef]
  30. Han, J.Y.; Guo, Y.; Liu, S.T. Environmental issues on color quality evaluation of blue sapphire based on gemdialogueTM color comparison charts. Ekoloji Derg. 2018, 27, 1365–1376. [Google Scholar]
  31. Mangine, H.; Jakes, K.; Noel, C. A preliminary comparison of CIE color differences to textile color acceptability using average observers. Color Res. Appl. 2005, 30, 288–294. [Google Scholar] [CrossRef]
  32. Perez, M.D.M.; Ghinea, R.; Herrera, L.J.; Ionescu, A.M.; Pomares, H.; Pulgar, R.; Paravina, R.D. Dental ceramics: A CIEDE2000 acceptability thresholds for lightness, chroma and hue differences. J. Dent. 2011, 39, e37–e44. [Google Scholar] [CrossRef] [PubMed]
  33. Zhang, Y. Mineralogical Study on Nephrite from No. 7 Deposit, QieMo, Xinjiang. Master’s Thesis, China University of Geosciences, Beijing, China, 2019. [Google Scholar]
  34. Gao, K. Study on the Metallogenic Mechanism of Tashisayi Nephrite from Xinjiang. Ph.D. Thesis, China University of Geosciences, Beijing China, 2018. [Google Scholar]
  35. Torrent, J.; Barrón, V. Diffuse reflectance spectroscopy of inron oxides. Encycl. Surf. Colloid Sci. 2002, 1, 1438–1446. [Google Scholar]
  36. Ding, J.; Xue, Q.F. Ultraviolet-Visible Absorption Spectra Representation of Yellow Sapphire from Shandong Province in China. Superhard Mater. Eng. 2005, 2, 57–60. [Google Scholar]
  37. Li, X.X. The color causes and spectroscopy characteristics of sapphire from Shandong ChangLe. J. Grad. Sun Yat-Sen Univ. (Nat. Sci. Med.) 2015, 36, 60–73. [Google Scholar]
  38. Pan, Z.L. Reference Collection for Teaching Crystallography and Mineralogy, 1st ed.; Higher Education Press: Beijing, China, 1982; pp. 48–49. [Google Scholar]
  39. Dai, J.; Sun, C.M.; Xie, Y.S.; Zhou, R.B. Spectroscopy and Coloration Mechanism for Myanmar Jadeite Jade. Acta Geol. Sichuan 2007, 27, 296–300. [Google Scholar]
  40. Wang, C.B.; Yuan, X.Q.; Lei, T.; Zheng, Y.L. Gemmological Characteristic of “Anthophylite Jade” from Xinjiang, China. J. Gems Gemmol. 2018, 20, 37–45. [Google Scholar]
  41. Yu, H.Y. Coloring and Metallogenic Mechanisms of Different Colors in Qinghai Nephrite. Ph.D. Thesis, Nanjing University, Nanjing, China, 2016. [Google Scholar]
  42. Taran, M.N.; Monika, K.M.; Langer, K. Electronic absorption spectroscopy of natural (Fe2+, Fe3+)-bearing spinels of spinel s.s.-hercynite and gahnite-hercynite solid solutions at different temperatures and high-pressures. Phys. Chem. Miner. 2005, 32, 175–188. [Google Scholar] [CrossRef]
  43. Sargolzaei, M.; Samaneh Ataee, S. First principles study on spin and orbital magnetism of 3d transition metal monatomic nanowires (Mn, Fe and Co). J. Phys. Condens. Matter 2011, 23, 125301. [Google Scholar] [CrossRef]
  44. Wang, J.W.; Wang, Y.Q.; Feng, Q.; Wu, X.Y.; Chen, J.X. Analysis and Identification of Cobalt Latice Difused Vietnam Spinel by Using UV-Vis-NIR Spectroscopy. J. East China Univ. Sci. Technol. (Nat. Sci. Ed.) 2018, 44, 839–844. [Google Scholar]
  45. Yuan, X.Q.; Qi, L.J.; Du, G.P.; Chen, X.Y. UV-VIS-NIR Spectrum of Jadeite Jade from Burma. J. Gems Gemmol. 2003, 5, 11–16. [Google Scholar]
  46. Lam, Y.M.; Xin, J.H. Evaluation of the quality of different D65 simulators for visual assessment. Color Res. Appl. 2002, 27, 243–251. [Google Scholar] [CrossRef]
  47. Simonot, L.; Hébert, M. Between additive and subtractive color mixings: Intermediate mixing models. J. Opt. Soc. Am. A 2013, 31, 58–66. [Google Scholar] [CrossRef] [PubMed]
  48. Coates, A.; Ng, A.Y. Learning feature representations with k-means. In Neural Networks: Tricks of the Trade, 2nd ed.; Montavon, G., Orr, G.B., Müller, K.R., Eds.; Lecture Notes in Computer Science 7700; Springer: Berlin/Heidelberg, Germany, 2012; ISBN 978-3-642-35288-1. [Google Scholar]
  49. Guo, Y.; Zong, X.; Qi, M. Feasibility Study on Quality Evaluation of Jadeite-Jade Color Green Based on GemDialogue Color Chip. Multimed. Tools Appl. 2019, 78, 841–856. [Google Scholar] [CrossRef]
  50. Liu, H.X.; Wu, B.; Liu, Y.; Huang, M.; Xu, Y.F. A Discussion on Printing Color Difference Tolerance by CIEDE2000 Color Difference Formula. Appl. Mech. Mater. 2012, 262, 96–99. [Google Scholar] [CrossRef]
  51. GB/T 23885-2009; Jadeite Grading. General Administration of Quality Supervision, Inspection and Quarantine of the People’s Republic of China &National Standardization Administration: Beijing, China, 2009.
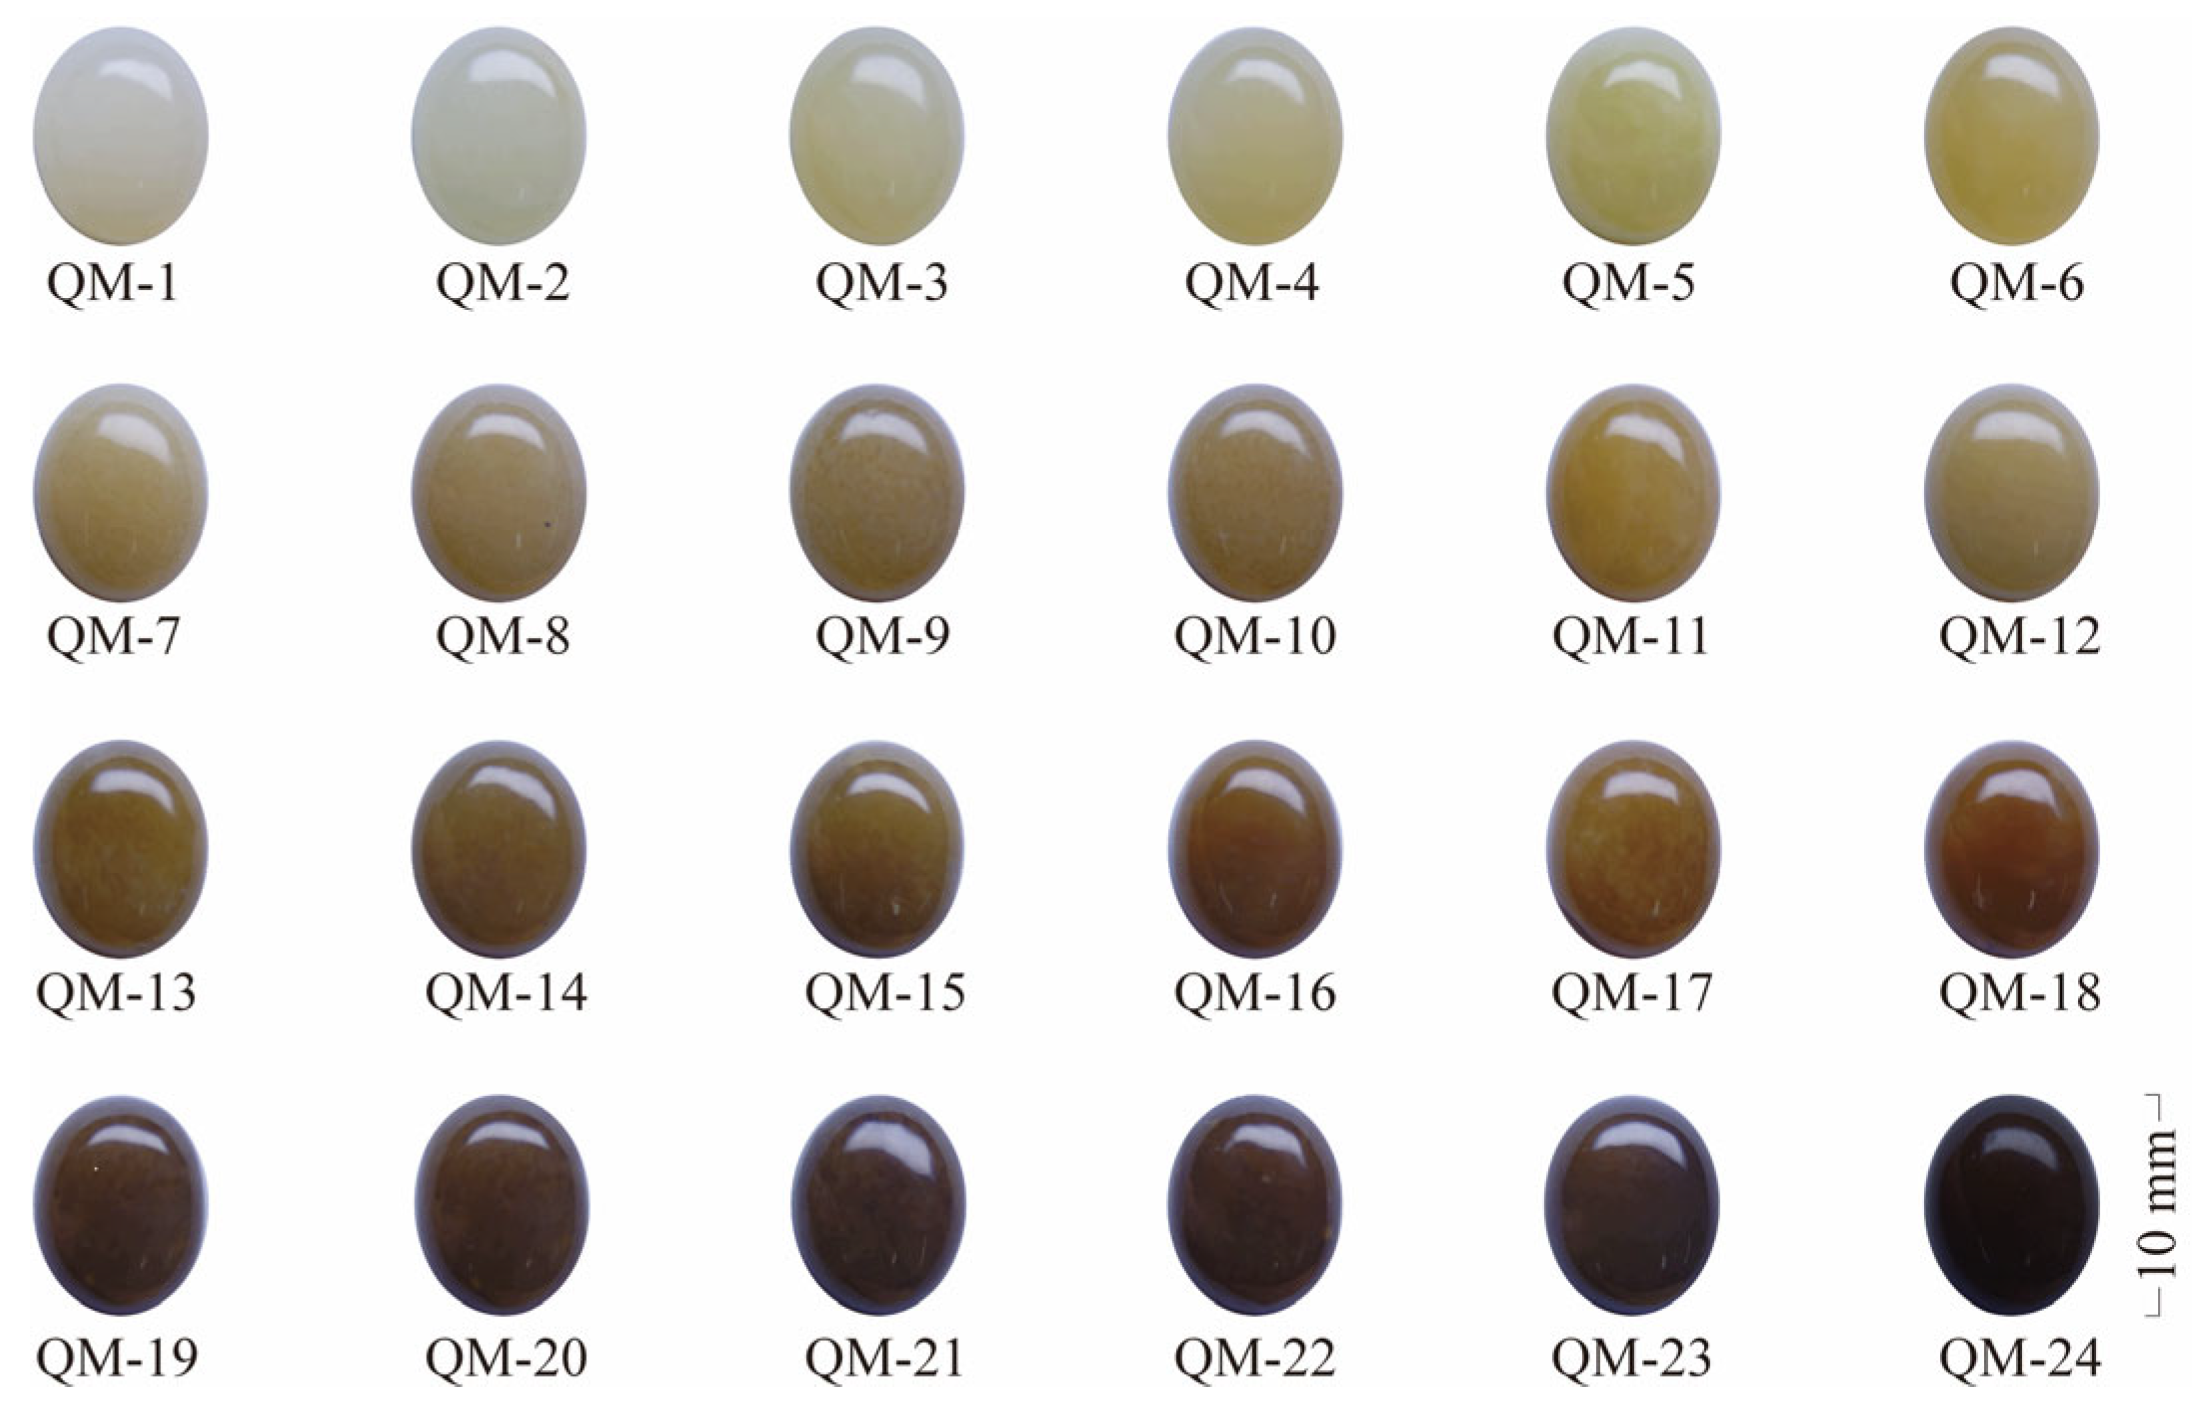
Figure 1. Samples of “Tang yu”.
Crystals 15 00817 g001
Figure 2. (a) Percentages of Fe2O3, MnO, and CuO for the investigated “Tang yu”. (b) Normalized concentrations of Fe2O3, MnO, and CuO for the investigated “Tang yu”.
Crystals 15 00817 g002
Figure 3. UV-Vis-NIR spectra of investigated “Tang yu”.
Crystals 15 00817 g003
Figure 4. (a) The relation between the a* and the C*, the ; (b) the relation between the b* and the C*, the .
Crystals 15 00817 g004
Figure 5. (a) Variation of a* and b* chromaticity parameters across three different light sources; (b) Variation of C* across three different light sources; (c) Variation in L* and across three different light sources; (d) Box plots of the L*, the color parameter a* and b*, the C* and .
Crystals 15 00817 g005
Figure 6. (a) Distribution in the CIE 1976 L*a*b* color space of the samples processed with two polishing methods; (b) Comparison of the corresponding C* and values between the two poshing methods.
Crystals 15 00817 g006
Figure 7. ΔE00 between two polishing methods.
Crystals 15 00817 g007
Figure 8. Variations in the Munsell neutral background under a D65 light source caused changes in the samples’ perceived color. (a) a box diagram of the a*, b* and the γb. (b) a box diagram of the C* (and the ) and the γb; (c) a box diagram of the L* of the samples (and lightness of the background) and the γb; (d) The relationship between a* and b* under different backgrounds.
Crystals 15 00817 g008
Figure 9. The color clustering of “Tang yu” according to L* and C*. The coordinate axis range of this figure is non-uniform scale, aiming to optimize the visualization effect to highlight the classification boundaries.
Crystals 15 00817 g009
Table 1. EDXRF chemical compositions of investigated “Tang yu” (wt%).
SampleSiO2 MgOCaOFe2O3K2OMnOCuONiO ZnOTotal
QM-157.82 25.80 15.90 0.23 0.19 0.05 0.01 0.01 0.00 100.00
QM-260.95 24.09 14.32 0.36 0.08 0.11 0.01 0.00 0.08 100.00
QM-358.69 25.21 15.42 0.49 0.10 0.07 0.01 0.01 0.01 100.00
QM-459.50 24.36 15.46 0.48 0.12 0.06 0.01 0.00 0.01 100.00
QM-559.30 25.09 15.15 0.27 0.11 0.05 0.01 0.00 0.01 100.00
QM-658.73 24.82 15.74 0.51 0.10 0.07 0.01 0.01 0.01 100.00
QM-759.57 24.75 15.11 0.36 0.11 0.06 0.01 0.00 0.02 100.00
QM-860.94 23.49 14.93 0.40 0.13 0.07 0.01 0.01 0.03 100.00
QM-958.85 25.92 13.92 0.68 0.49 0.09 0.01 0.00 0.04 100.00
QM-1057.96 25.16 16.24 0.42 0.11 0.07 0.01 0.00 0.07 100.04
QM-1157.81 26.45 15.10 0.41 0.12 0.07 0.01 0.01 0.03 100.00
QM-1258.36 26.16 14.88 0.37 0.13 0.06 0.01 0.00 0.02 100.00
QM-1358.51 24.29 16.74 0.41 0.00 0.04 0.01 0.00 0.00 100.00
QM-1457.91 25.01 15.97 0.80 0.14 0.14 0.01 0.00 0.03 100.00
QM-1558.65 24.71 15.97 0.60 0.00 0.05 0.01 0.00 0.01 100.00
QM-1659.33 24.69 14.97 0.72 0.16 0.10 0.01 0.00 0.03 100.00
QM-1759.79 24.12 15.24 0.64 0.11 0.08 0.01 0.00 0.01 100.00
QM-1859.21 23.48 16.19 0.66 0.12 0.27 0.01 0.00 0.06 100.00
QM-1958.01 26.13 15.15 0.49 0.08 0.11 0.01 0.00 0.02 100.00
QM-2057.50 25.56 16.04 0.48 0.22 0.14 0.01 0.01 0.04 100.00
QM-2159.71 23.70 15.86 0.61 0.00 0.10 0.01 0.00 0.01 100.00
QM-2258.95 24.00 16.17 0.48 0.21 0.15 0.01 0.00 0.04 100.00
QM-2359.20 24.42 15.77 0.43 0.00 0.16 0.01 0.00 0.02 100.00
QM-2459.10 23.77 15.44 1.25 0.09 0.28 0.01 0.00 0.06 100.00
Table 2. Optical absorption peaks (nm) of the investigated “Tang yu”.
Wavelength (nm)Assignment
380The 6A14T2(D) transition of Fe3+
440–520The Jahn-Teller effect of Mn3+
580–740Fe2+—Fe3+ charge transfer
Fe2+(5T2) + Fe3+(6A1) → Fe2+ (5E) +Fe3+(6A1)
7303v(OH)
Table 3. The ANOVA results of the color parameters of samples.
Color ParametersdfMean SquareFp
L*231.48530.072730.92992
a*2220.126366.605620.00237
b*220.950090.216580.80581
C*261.50630.726070.48746
2788.65032.500920.08942
Table 4. The color parameter and ΔE00 of the samples under different methods.
SamplesColor Parameter (Glassy)Simulated ColorColor Parameter (Waxy)Simulated Color∆E00
L*a*b*L*a*b*
QM-1 79.77 −1.43 20.44 Crystals 15 00817 i00164.33 −0.92 16.18 Crystals 15 00817 i00216.03
QM-2 76.18 −5.46 21.97 Crystals 15 00817 i00361.84 −3.71 14.47 Crystals 15 00817 i00416.28
QM-3 73.42 −2.57 25.92 Crystals 15 00817 i00563.47 −2.12 20.85 Crystals 15 00817 i00611.18
QM-4 71.42 −1.27 29.07 Crystals 15 00817 i00761.69 −1.88 20.65 Crystals 15 00817 i00812.88
QM-5 69.31 −3.71 32.66 Crystals 15 00817 i00960.19 −3.87 24.62 Crystals 15 00817 i01012.16
QM-665.79 2.58 34.23 Crystals 15 00817 i01157.87 1.10 22.26 Crystals 15 00817 i01214.43
QM-7 60.36 5.52 25.55 Crystals 15 00817 i01353.24 2.84 16.72 Crystals 15 00817 i01411.65
QM-857.56 5.01 22.49 Crystals 15 00817 i01552.34 2.56 15.52 Crystals 15 00817 i0169.05
QM-9 56.82 4.95 24.89 Crystals 15 00817 i01753.22 2.52 19.09 Crystals 15 00817 i0187.25
QM-10 53.56 6.18 22.15 Crystals 15 00817 i01947.13 3.84 14.26 Crystals 15 00817 i02010.44
QM-11 48.91 7.40 23.72 Crystals 15 00817 i02144.25 4.73 15.06 Crystals 15 00817 i02210.20
QM-12 52.72 6.36 21.81 Crystals 15 00817 i02346.18 4.24 15.68 Crystals 15 00817 i0249.21
QM-13 55.72 8.49 30.59 Crystals 15 00817 i02551.47 5.61 22.73 Crystals 15 00817 i0269.38
QM-14 45.55 6.79 21.65 Crystals 15 00817 i02745.00 7.38 23.45 Crystals 15 00817 i0281.97
QM-15 45.12 6.15 18.43 Crystals 15 00817 i02939.45 4.10 12.16 Crystals 15 00817 i0308.70
QM-16 41.76 7.13 19.33 Crystals 15 00817 i03137.77 4.36 12.67 Crystals 15 00817 i0328.24
QM-17 41.39 8.72 15.97 Crystals 15 00817 i03339.85 4.76 13.40 Crystals 15 00817 i0344.97
QM-18 43.60 11.18 23.13 Crystals 15 00817 i03540.46 7.23 15.16 Crystals 15 00817 i0369.43
QM-19 38.03 11.81 16.64 Crystals 15 00817 i03734.96 6.19 11.07 Crystals 15 00817 i0388.49
QM-20 34.96 6.85 13.27 Crystals 15 00817 i03934.31 5.04 8.87 Crystals 15 00817 i0404.80
QM-21 36.00 5.49 9.51 Crystals 15 00817 i04132.54 3.44 6.22 Crystals 15 00817 i0425.19
QM-22 32.13 6.98 10.45 Crystals 15 00817 i04330.18 4.49 6.26 Crystals 15 00817 i0445.25
QM-23 32.42 5.74 8.65 Crystals 15 00817 i04530.91 3.59 6.51 Crystals 15 00817 i0463.39
QM-24 34.41 5.37 5.37 Crystals 15 00817 i04728.84 3.44 3.97 Crystals 15 00817 i0486.06
Table 5. Color parameter of “Tang yu” in Munsell neutral background.
Background N1N2N3N4N5N6N7N8N9
γb 0.01210.031260.065550.120000.197700.300500.430600.591000.78660
L*b 10.6320.5630.7641.2251.5861.7071.6081.3591.08
Photos Crystals 15 00817 i049
Color parameterL*45.96 46.29 47.14 47.92 48.42 48.95 49.41 50.26 51.95
a*2.23 2.41 2.86 3.20 3.46 3.53 3.78 3.72 4.76
b*15.33 15.74 16.75 17.75 18.21 18.43 18.47 18.75 20.97
∆E00N1---------
N20.56 --------
N31.95 1.39 -------
N43.26 2.71 1.31 ------
N53.98 3.43 2.03 0.73 -----
N64.50 3.95 2.56 1.28 0.58 ----
N74.92 4.37 2.99 1.75 1.07 0.53 ---
N85.69 5.15 3.80 2.60 1.94 1.36 0.90 --
N98.66 8.11 6.73 5.44 4.72 4.17 3.74 3.02 -
Table 6. Cluster analysis results of “Tang yu”.
Color Parameter ClusteringErrorF p
Mean Square DfMean Square Df
L*2289.805221.82721104.908<0.001
a*184.66024.5522140.565<0.001
b*345.726222.3352115.479<0.001
Table 7. The Cluster color center of “Tang yu”.
Cluster
Center
Quantity L*
Lightness
a*
Color Parameter
b*
Color Parameter
Simulated Color
Group 1672.65−1.9827.38Crystals 15 00817 i050
Group 21138.677.4715.25Crystals 15 00817 i051
Group 3755.096.2724.46Crystals 15 00817 i052
Disclaimer/Publisher’s Note: The statements, opinions and data contained in all publications are solely those of the individual author(s) and contributor(s) and not of MDPI and/or the editor(s). MDPI and/or the editor(s) disclaim responsibility for any injury to people or property resulting from any ideas, methods, instructions or products referred to in the content.